- 1State Key Laboratory of Offshore Natural Gas Hydrates, CNOOC Research Institute, Beijing, China
- 2College of Geosciences and Technology, Southwest Petroleum University, Chengdu, China
Introduction: The quantitative distribution of grain size of sediments could imply the hydrodynamic conditions as well as terrestrial material composition; and thus, it is indicative of sea-level fluctuations, regional sources and climate changes. The environmentally sensitive components extracted from grain size data serve as excellent indicators of the sedimentary environment and monsoon intensity.
Material and methods: The drilling data from the shelf margin of the northwestern Qiongdongnan Basin provide an excellent opportunity for studying hydrodynamics and climate change in the Quaternary South China Sea (SCS). The 49 obtained samples of Quaternary sediments are primarily composed of clay and silt, with a low sand content. The environmentally sensitive components are extracted from the sediment samples, based on multiple attempts including grain size-standard deviation, the end-member modelling analysis and the principal component factor analysis methods.
Results: The increased grain size as supplemented by ratios of rolling movement on the sediment probability accumulation curves indicate enhanced hydrodynamic conditions in the Quaternary northwestern SCS. The alternative indicators of the Quaternary East Asian monsoon are obtained after a comprehensive comparative analysis. The changes in the content of the grain size components of 5.21-6.72 μm and 27.4-35.3 μm are used as the proxy indicators for the Quaternary East Asian summer and winter monsoon of the NW-SCS, respectively. It is likely indicated that the East Asian winter monsoon remarkably strengthened since 1.3 Ma but reached its maximum intensity around 0.8 Ma. During this period, the magnitude of both climatic temperature and sea-level fluctuations are significant, thus, the coarse-grained component increased at falling or low sea-level stages.
Discussion: The grain size characteristics of the Quaternary shelf margin sediments are indicative of hydrodynamic conditions, source-sink systems and environmental monsoon climate changes in the northwestern SCS.
1 Introduction
Sediments deposited in different environments are characterized by their unique grain size parameters as well as assemblage properties. The grain-size parameters of sediment samples and the pattern of change are integrated responses to the regional source-sediment transporting pattern, hydrodynamic conditions, and regional paleoclimate changes (Sun et al., 2003; Zheng et al., 2008; Hao et al., 2023). Grain size analysis methods are mainly subdivided into two categories, one is the traditional grain size analysis method centered on sieve analysis, and the other is laser grain size analysis based on computer technology (Chen et al., 2002). The latter has been widely applied for palaeoclimate and palaeoenvironmental reconstruction.
The East Asian monsoon is an important component of the climate system (Ding et al., 2017), and changes in the East Asian monsoon influence precipitation in the SCS and its neighboring areas. It affects the components and content of river sediment input. Climatic conditions are drier and colder during periods of sea level drop, which is generally accompanied by enhancement of the East Asian winter monsoon (Zhang, 2015). In the northwestern SCS, proxy indicators to establish periodic evolution of the East Asian monsoon include clay minerals (Tuo, 2008; Liu et al., 2017), sporopollen (Luo et al., 2012), planktonic foraminifera (Su et al., 2021), grain size (Wan et al., 2006; Boulay et al., 2007; Chen et al., 2007; Yang et al., 2008), and major and trace elements (Qu and Huang, 2019). Previous studies have confirmed that changes in fine- and coarse-grained fractions in deep-water sediments can indicate changes in the intensity of the East Asian summer and winter monsoon, respectively (Wan et al., 2006; Boulay et al., 2007). Xiang et al. (2005) concluded that changes in the components and average grain sizes of sediments are indicative of changes in the strength of the East Asian winter monsoon. Sensitive grain-size fractions of sediment samples from various parts of the SCS indicate that specific grain size compositions can be indirectly linked to the evolution of the East Asian monsoon (Boulay et al., 2006; Chen et al., 2007; Zheng et al., 2008). However, previous studies have mainly focused on deep-sea sedimentation-related paleontology, magnetic mineralogy, grain size and other indicators. The shelf edge, as a sensitive zone in the transition between shallow and deep water, is actually lacking in related studies. Thus, studies focus on the relationship between shelf and shelf-edge depositional regimes and changes in monsoon intensity are in need, looking for alternative indicators to indicate changes in Asian monsoon and depositional environments.
In this paper, based on the grain size data of Quaternary sediments on the shelf margin of the northwestern SCS, quantitative parameters of the grain size are statistically analyzed. And then, the environmentally sensitive factors are extracted by using the grain size-standard deviation, the end-member modelling analysis, and the principal component factor methods, respectively. At last, the distribution of the grain size and hydrodynamic conditions in the shelf edge area of the northwestern SCS are discussed, for establishing the alternative indexes for the Quaternary monsoon evolution of the SCS.
2 Geological setting
The study area is located in the northwestern shelf margin of the SCS (Figure 1). The SCS is a major depositional area for fluvial materials from the East Asian continent and an ideal location for recording East Asian monsoon information (Wan et al., 2007a). The combined effects of runoff, littoral currents, and ocean currents have led to complex depositional dynamical conditions on the northwestern shelf and shelf-margin of the SCS. The diversity of sources also leads to the complexity of sediment distribution (Zhao et al., 2016). The Red River and Vietnam drainages and Hainan Island coastal river systems are considered to be the main sediment sources in the northwestern SCS, with possible contributions of material from the Pearl River and Taiwan Islands (Zhao et al., 2016). The SCS is a marginal sea in the western Pacific region that is strongly influenced by the East Asian monsoon climate. A well-developed surface and deep-sea current system were active in the Quaternary SCS, making it an ideal marine area for studying the evolution of the East Asian monsoons (Liu et al., 2016).
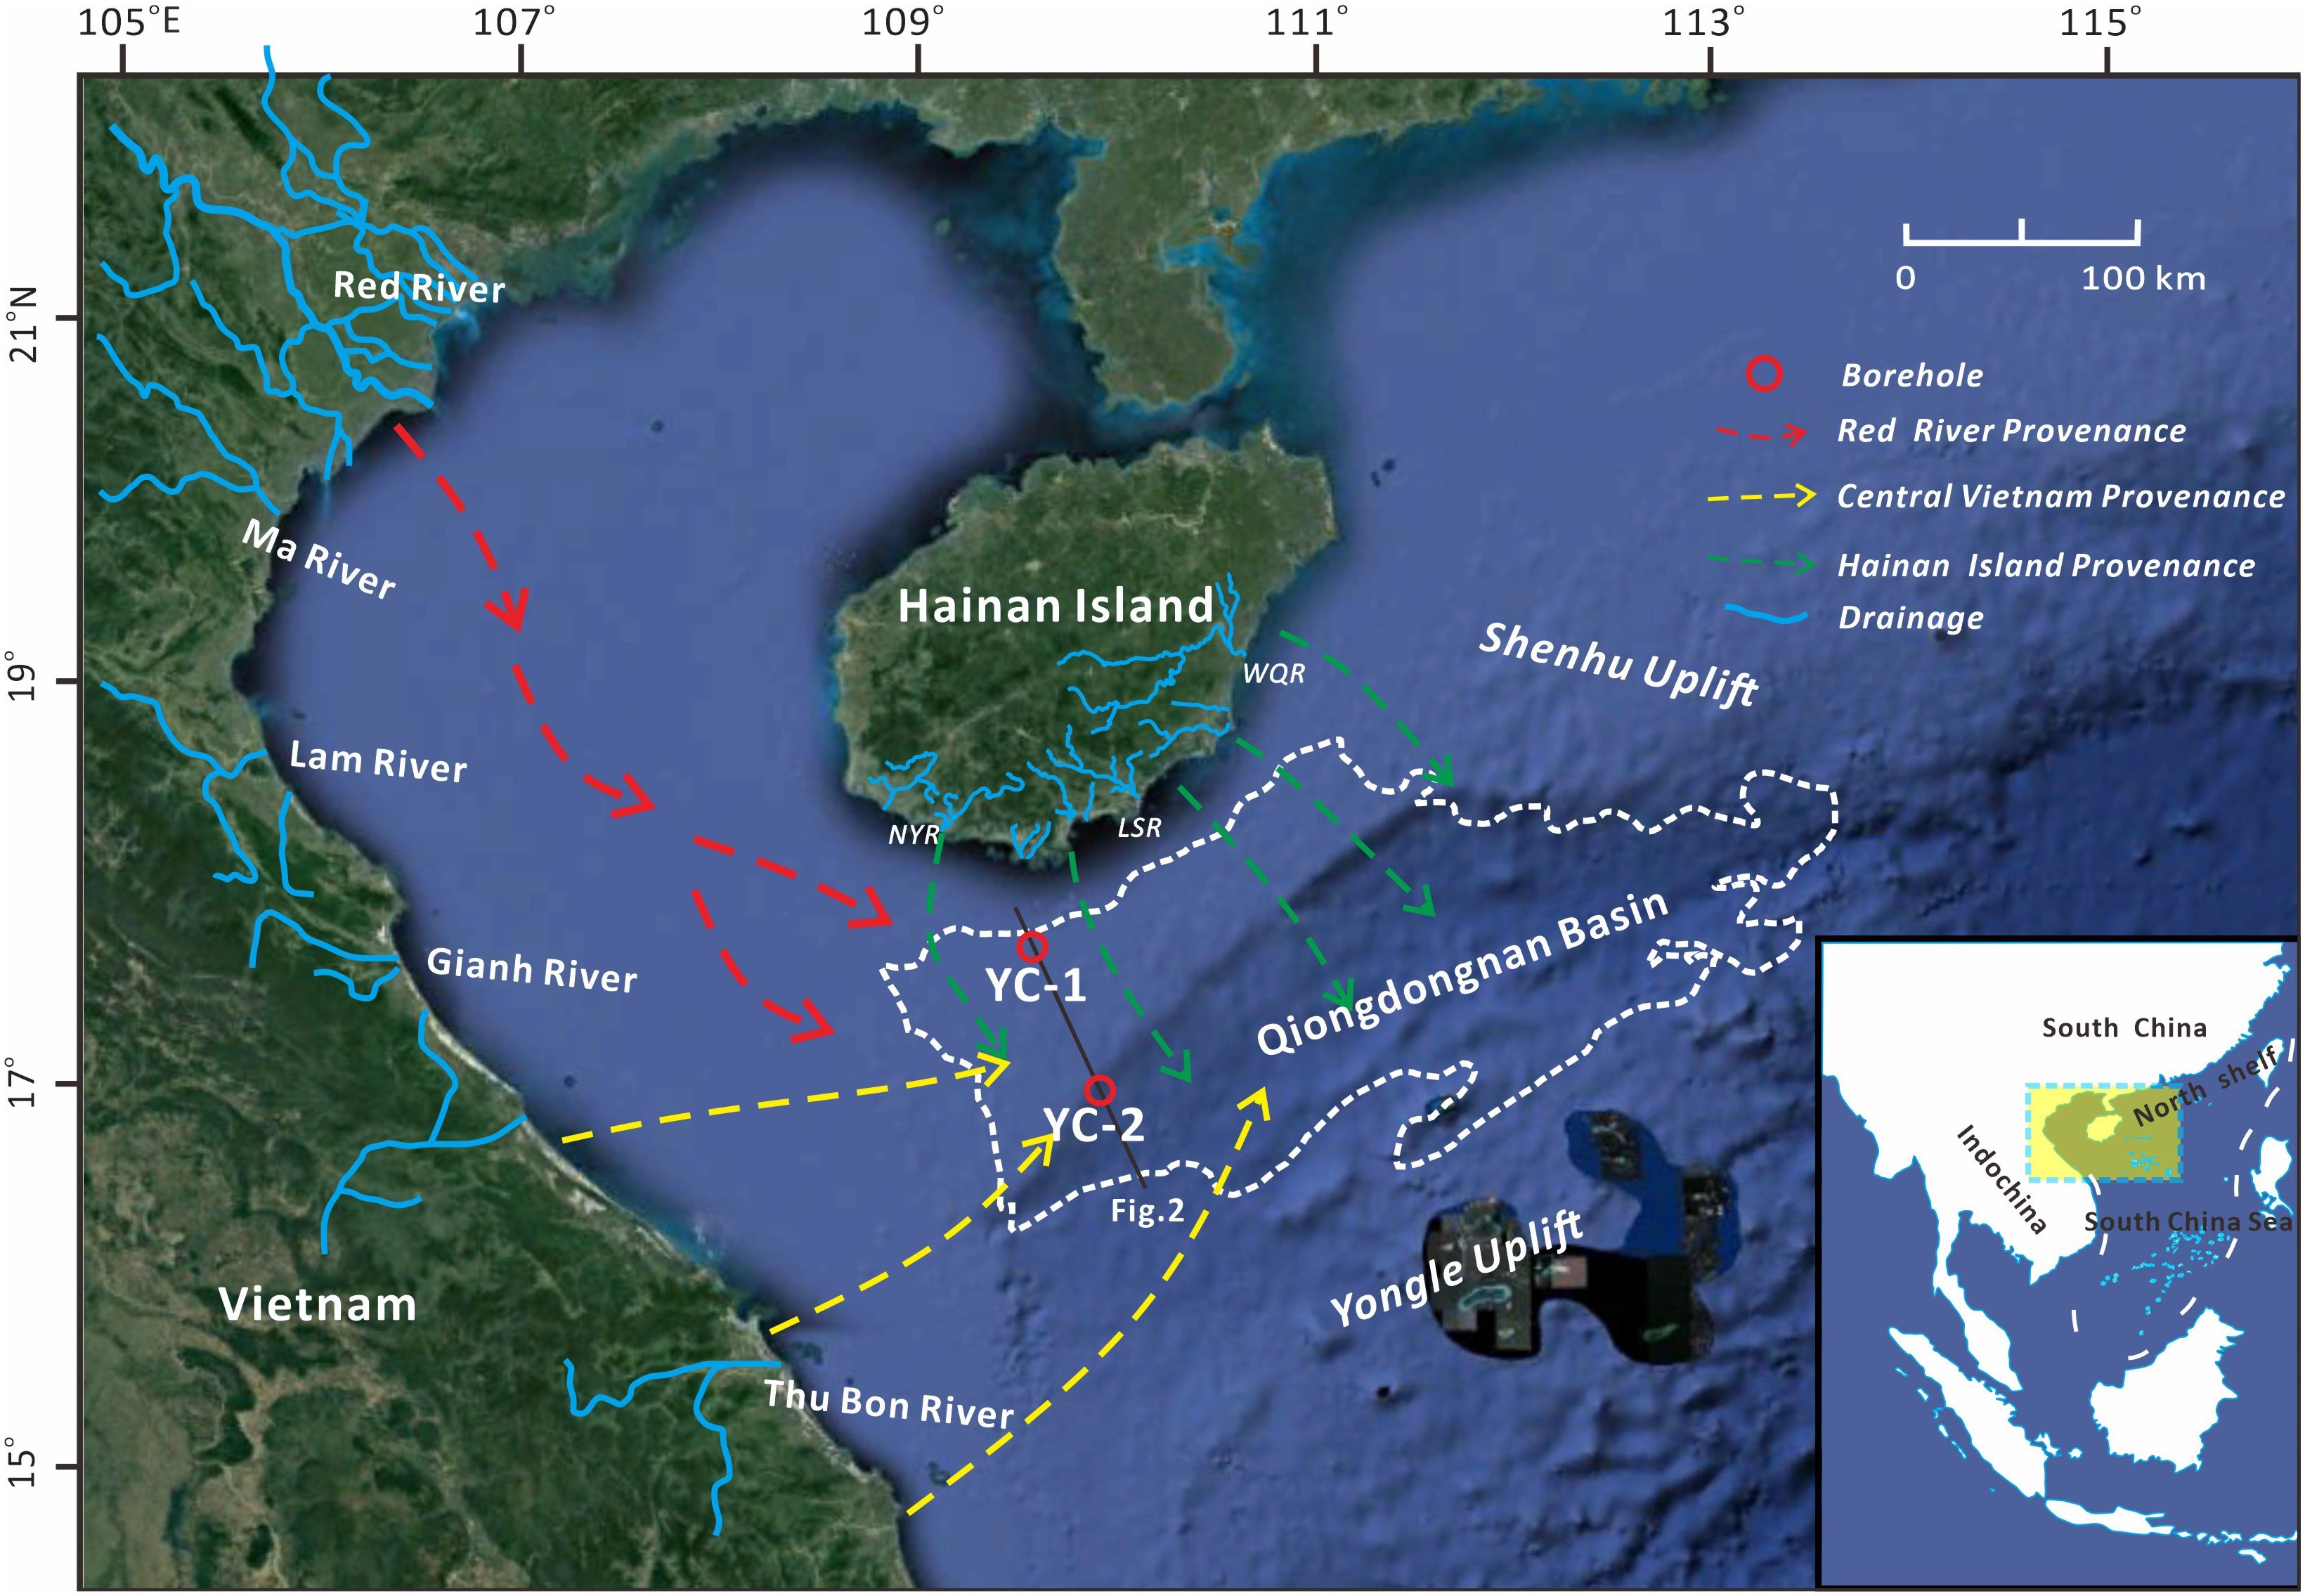
Figure 1. Geographic location map of the YC 2 well, the source supply and sampling well location in the northwestern South China Sea (modified from Ma et al., 2022). NYR, Ningyuan River; LSR, llingshui River; WQR, Wanquan River.
The northwestern SCS shelf and shelf margin area consists of mega-thick Pliocene (lower Yinggehai Formation) and Quaternary (upper Yinggehai Formation and Ledong Formation) sediments. The Yinggehai Formation is subdivided into upper and the lower units, namely U5 and U4, respectively (Figure 2). The lithology is mainly composed of grey-green to grey mudstone, interbedded with thin layers of siltstone (Li et al., 2024). The Ledong Formation can be subdivided into three units, namely U3, U2 and U1 from bottom to top, respectively (Figure 2). The lithology is mainly composed of light grey to green-grey claystone, siltstone, and fine sandstone. Abundant bioclastic debris are extensively observed within the unconsolidated sediments. In this study, we adopt the stratigraphic age framework established by our predecessors based on the Milankovitch Cyclothymic results in the Pleistocene YC1 well of Li et al. (2024). In this paper, the upper (U1: present-0.8 Ma), middle (U2: 0.8-1.3 Ma), and lower (U3: 1.3-1.8 Ma) units of the Ledong Formation in YC2 well are defined by the well-seismic calibration with the YC1 well. Similarly, the upper (U4) and lower (U5) units of the Yinggehai Formation are 1.8-2.6 Ma and 2.6-5.5 Ma, respectively. The detailed depth ranges of U5-U1 in well YC2 are presented in Figure 2.

Figure 2. (A) The Quaternary age framework and lithology of the YC 2 well in the northwestern South China Sea; (B) seismic section and stratigraphic unit (modified from Li et al., 2024).
3 Materials and methods
3.1 Sample sources and processing methods
The samples were pretreated to remove the organic matter, bioclastic, and calcium cement, before grain size measurement. Beckman Coulter LS 13 320 laser diffraction particle size analyzer (measuring range 0.017~2 000 µm, resolution 0.1 Φ) was used for grain size measurement, and 20% of the samples were taken to repeat the test, and the error of repeat test was ≤1%.
The rock chip samples were taken from the YC2 well (Figure 1) located in the shelf-margin of the Qiongdongnan Basin, the northwestern SCS, and collected from the core house of CNOOC-Zhanjiang Branch. The sampling interval is from the upper Yinggehai Formation and Ledong Formation, with a total of 49 sediment samples collected with a sampling interval of 15-20 m. The predominant lithology is argillaceous siltstone, with some silty mudstone and a small amount of fine sandstone.
From bottom to top, the U4 and U3 units are dominated by silty mudstone, interbedded with thin layers of fine-grained sandstone and muddy medium-grained sandstone. The U2 unit is dominated by silty mudstone; while the U1 unit is dominated by mudstone with some conglomerates. The samples were processed using standard grain size analysis methods (Hao et al., 2023; Zheng et al., 2008), and the grain diameters were measured with a laser grain size analyzer, after which the Folk and Ward formulae (Folk and Ward, 1957) were chosen for the calculation of the relevant grain size parameters.
3.2 Methods for extracting environmentally sensitive components
3.2.1 Grain size-standard deviation method
The grain size-standard deviation method is a mathematically centered calculation of the standard deviation values of the contents of different grain size fractions. It is usually considered that one or more grain sizes with larger standard deviation values constitute the environmental sensitivity factors (Chen et al., 2013). The larger the standard deviation value of the grain size corresponding to the sensitivity factor, the more complex and drastic the changes in the depositional environment are indicative for the specialized grain size levels (Cheng et al., 2018).
3.2.2 End member modelling analysis
In this paper, the Matlab software-based AnalySize program developed by Paterson and Heslop (2015) was selected. This program provides a non-parametric EMA and four parametric EMA methods. The criteria for determining the number of end-elements are generally a combination of parameters such as R2 (indicating the degree of correlation between the original grain size data set and the end-elements), EM R2 (indicating the degree of correlation between individual end-elements, with larger values indicating a higher degree of overlap between end-elements), and θ (the angle of deviation of the end-elements from the sample grain size curve in the shape fit). Provided that the fit is good and there is no overfitting, a small number of end elements are chosen (Liu et al., 2021).
3.2.3 Principal component factor analysis
Principal Component Factor Analysis (PCA) is a method of correlation analysis for different grain size fractions, where highly correlated grain size components are integrated into a single factor. Each factor is then analyzed and its contribution to the grain size is calculated by SPSS software. Generally, the factor with the largest contribution is defined as the main control factor, and the range of grain sizes corresponding to this factor is the environmentally sensitive component (Chen et al., 2013).
4 Results
4.1 Characterization of sediment grain size
4.1.1 Characterization of grain size parameters
The median grain size of unit U1 is mainly between 11.5 and 16.3 μm, with an average value of 13.29 μm; the average grain size is mainly between 11.3 and 14.9 μm (6.07-6.46 φ), with an average value of about 12.5 μm. The average value of the graphic standard deviation is up to about 1.56. The graphic skewness SK value is generally between 0.03 and 0.2, with an average value of about 0.08; all of these values show positive skewness. The kurtosis KG ranged from 0.89 to 0.94, with an average of about 0.91 (Figure 3).
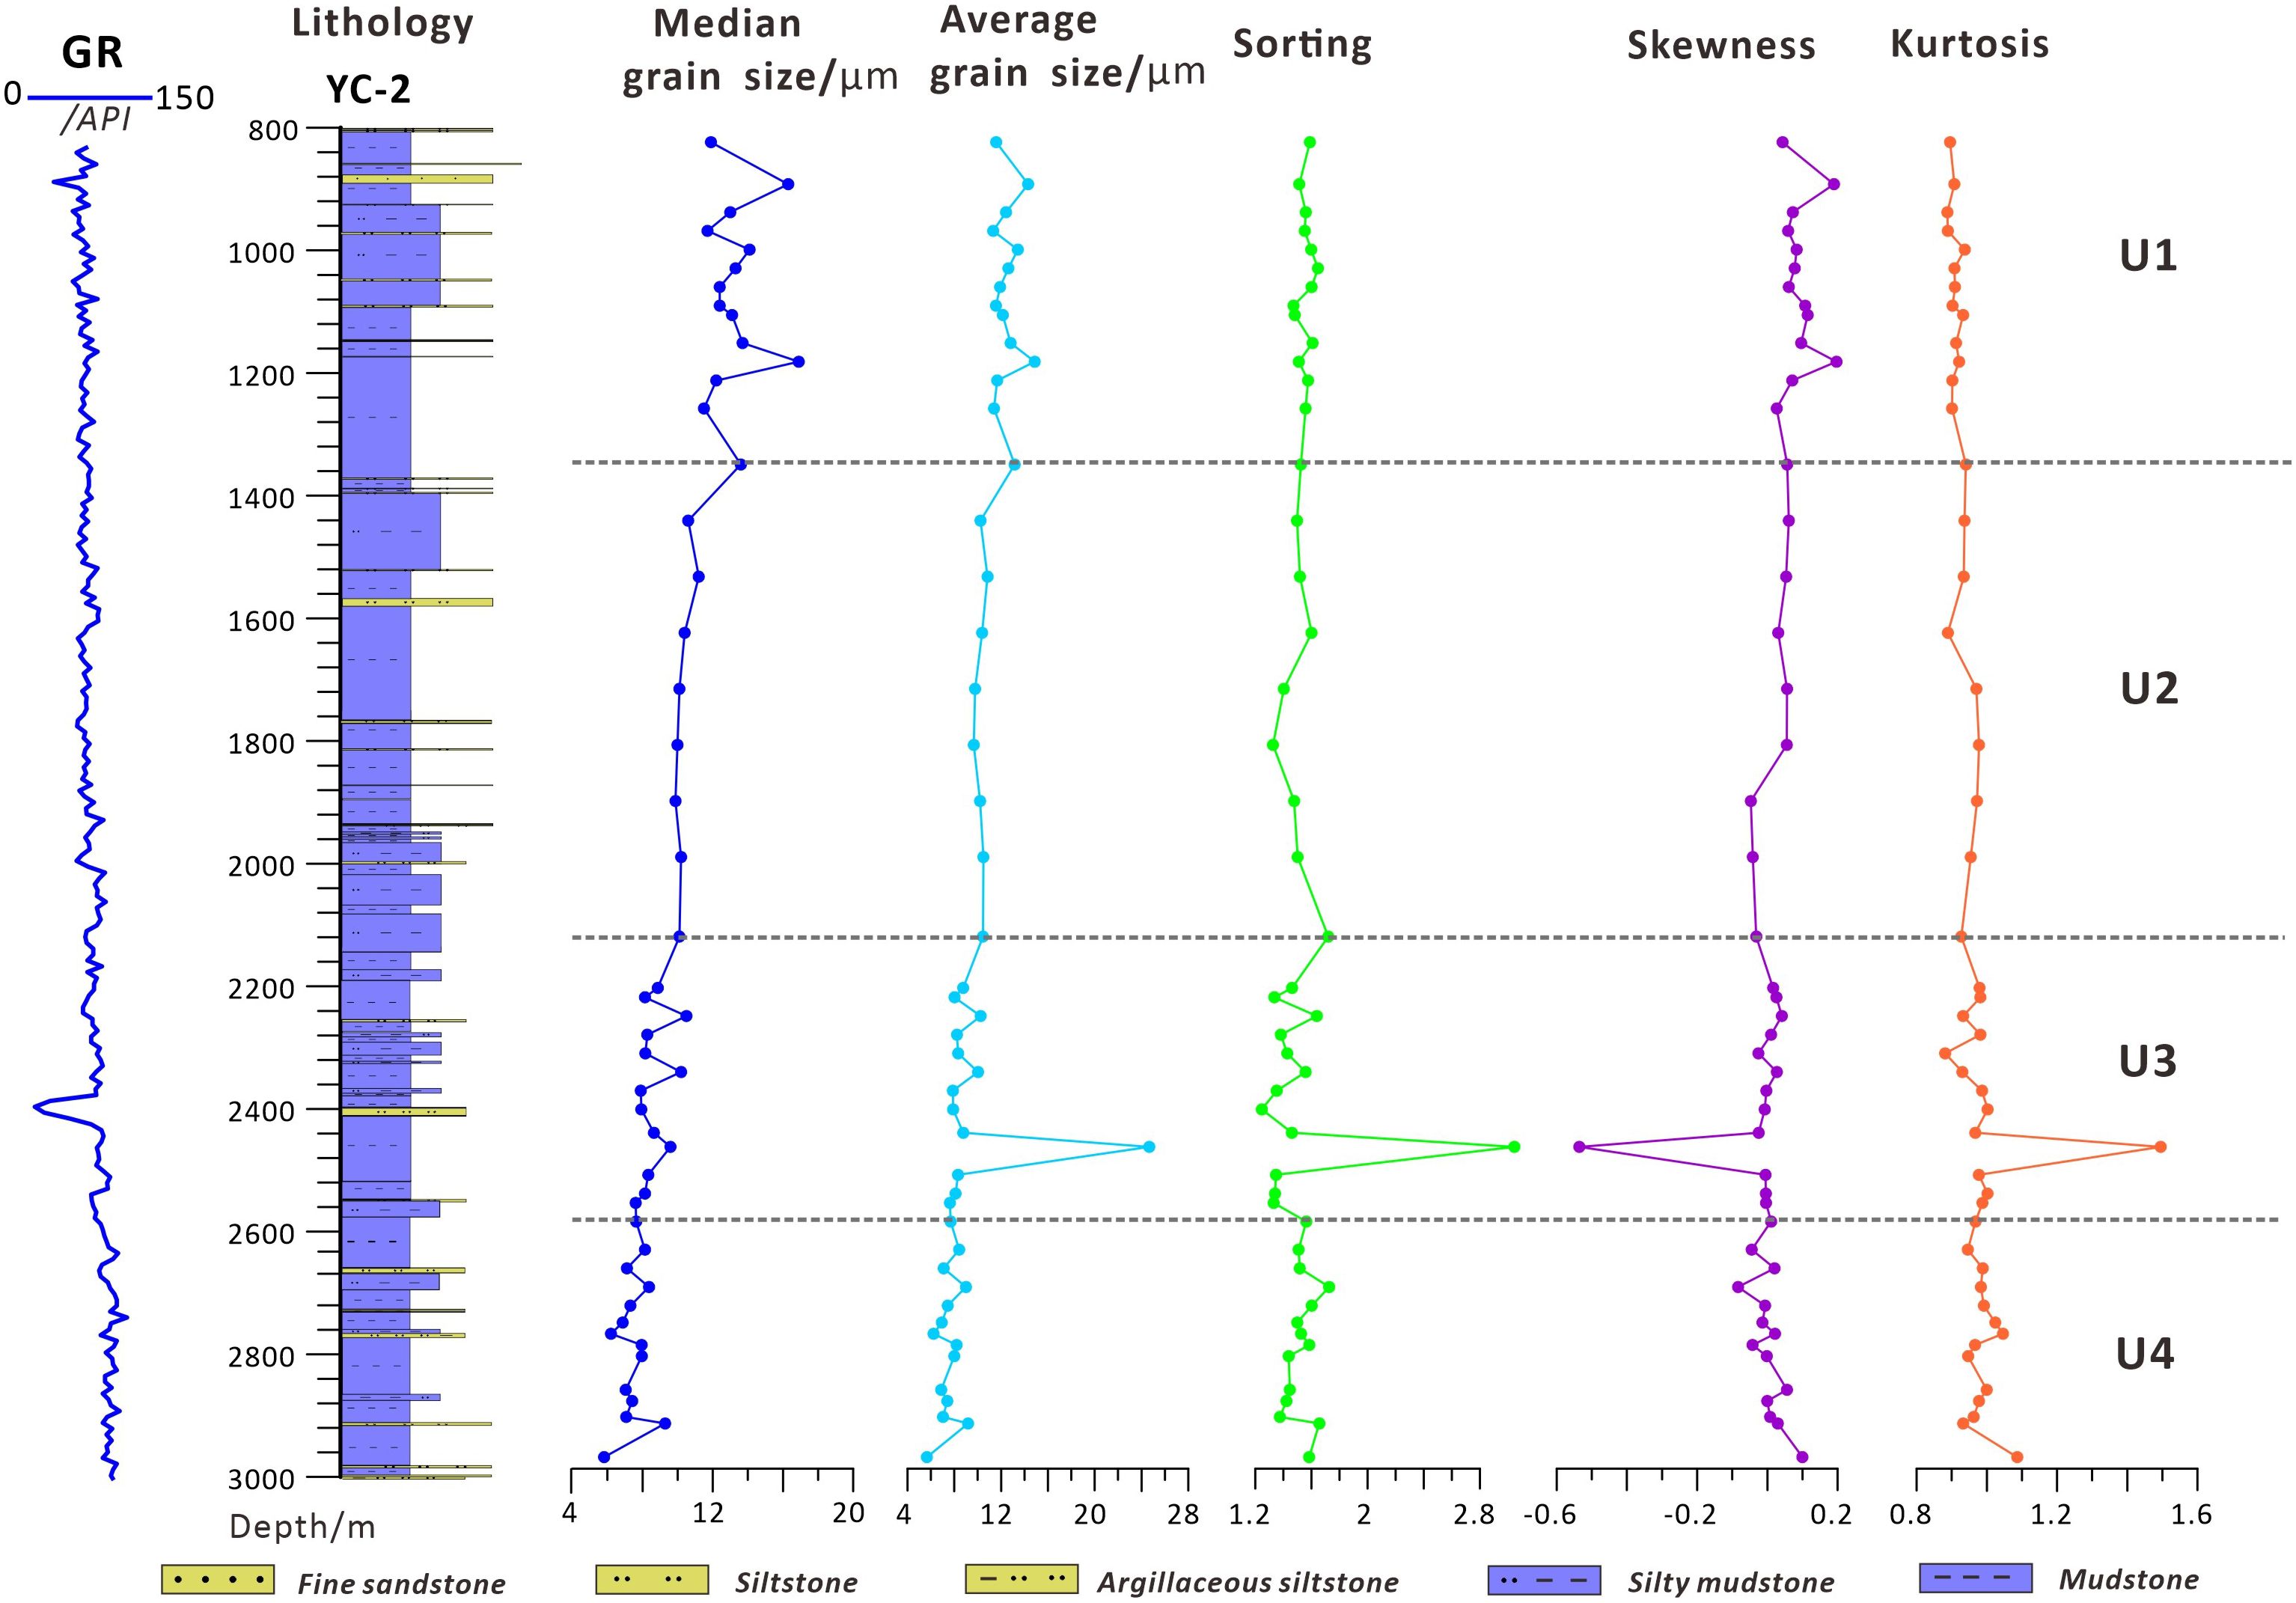
Figure 3. Characteristic grain size profiles of Quaternary sediments from YC 2 well in northwestern South China Sea.
The average grain size of unit U2 is mainly between 9.27 and 10.84 μm (6.53-6.69 φ), with an average of about 10.25 μm. The average value of the graphic standard deviation is about 1.51. The graphic skewness SK values ranged from -0.05 to 0.06, with a mean value of about 0.02; they are mostly positively skewed. The graphic Kurtosis KG ranged from 0.89 to 0.98, with a mean value of about 0.95 (Figure 3).
The average grain size of unit U3 is mainly in the range of 7.62~24.66 μm (5.34~7.04 φ), with an average value of about 9.61 μm. The average value of the graphic standard deviation is about 1.53 φ. The graphic skewness SK values ranged from -0.54 to 0.04, with a mean value of about -0.03 but mostly show positive skewness. The graphic kurtosis KG ranged from 0.93 to 1.5, with a mean value of about 1.0 (Figure 3).
The average grain size of unit U4 section is mainly between 5.66 and 9.0 μm (6.8-7.47 φ), with an average value of about 7.49 μm. The average value of the graphic standard deviation is about 1.53 φ. The graphic skewness SK value is between -0.04 and 0.1, showing a normal distribution. The graphic kurtosis KG is between 0.93 and 1.09, with an average value of about 0.99 (Figure 3).
The sediments in well YC2 are mainly fine silt with less clay and sand content. The average grain size of sediments increases upwards, the content of silt increases, the overall change of sorting coefficients is not significant, and the sorting become better from Unit U4 to U1. There are some positive and some negative graphic skewnesses in Unit U4, but most of the sections of Units U1, U2, and U3 show positive skewness, which indicates that the grain sizes of the sediments in Units U1, U2, and U3 have become coarser than those in Unit U4. The overall kurtosis in sections from U4 to U1 is relatively flat, and the hydrodynamic conditions would have been low to moderate (Figure 3).
4.1.2 Grain size frequency curve characteristics
Units U1 to U4 show overall unimodal curves, most of which are normally distributed (Figure 4). The frequency curves of Unit U1 show unimodal distributions, with peaks mainly in the range of 5.5-6.5 φ (medium silt). The frequency curves of Unit U2 show unimodal peaks, with peaks centered in the range of 6.5-7.5 φ (fine to very fine silt, Figure 4).
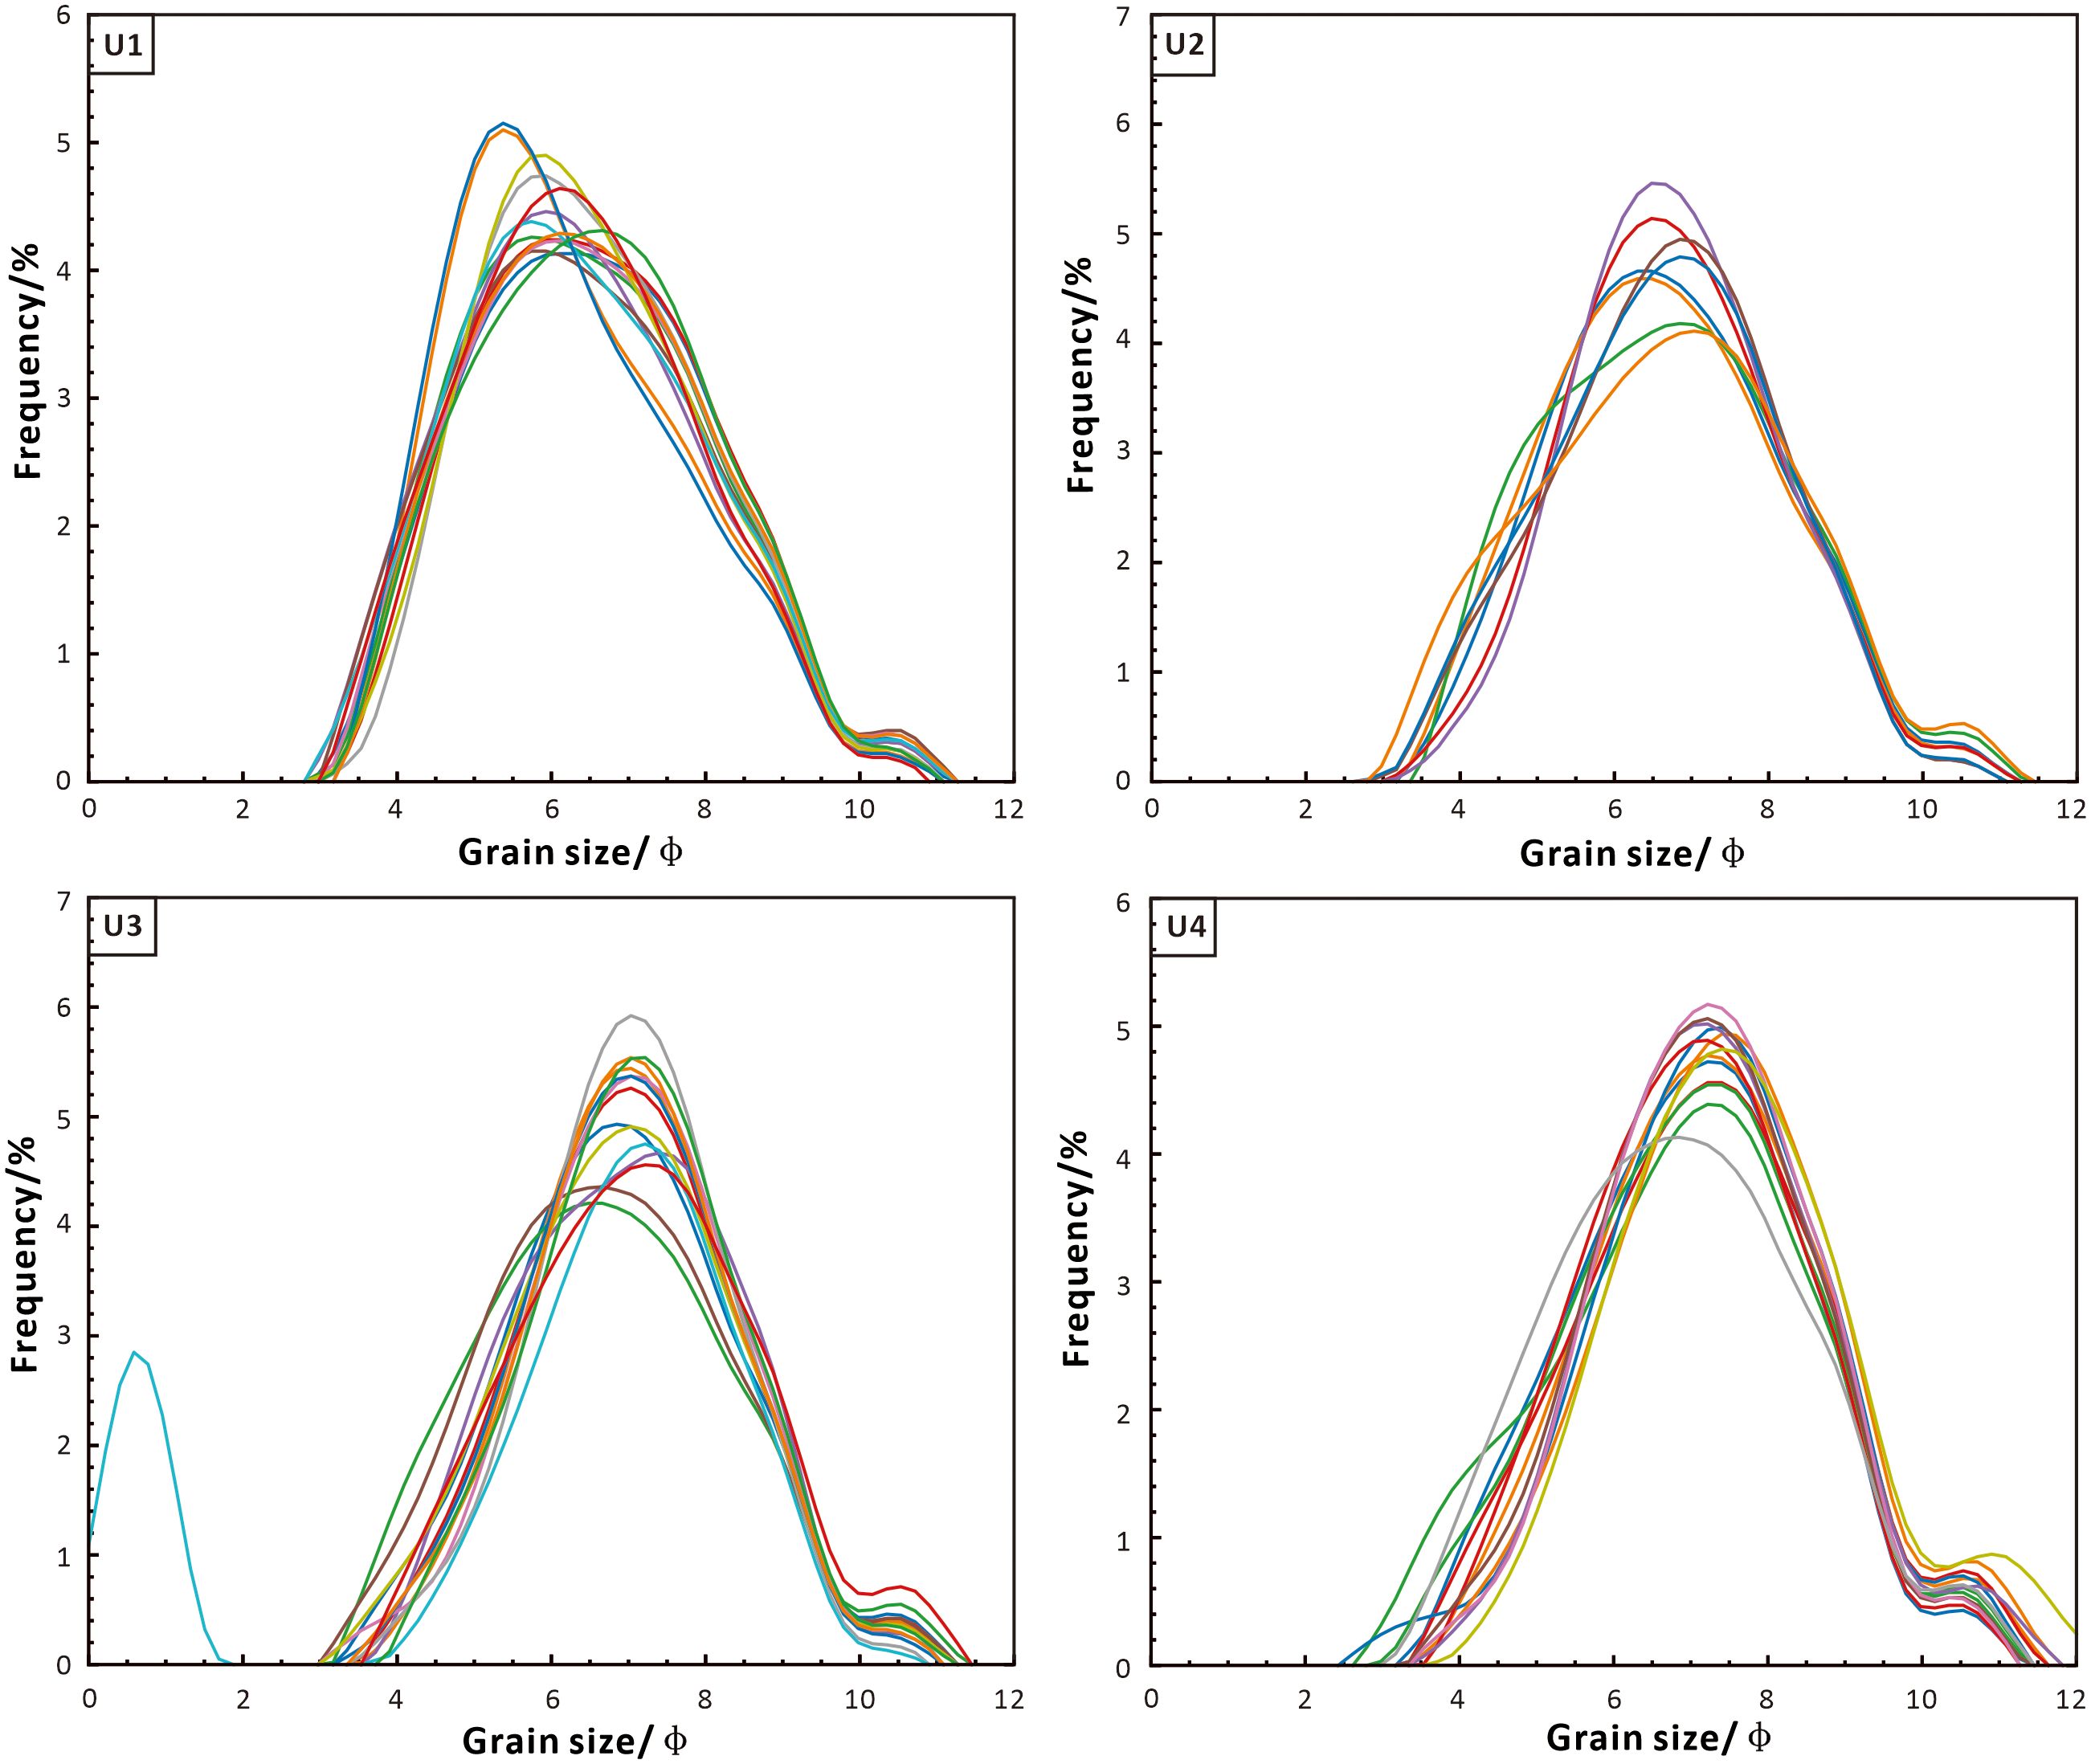
Figure 4. Grain size frequency profiles of Quaternary sediment samples from well YC 2 in the northwestern South China Sea.
Most unit U3 sediment samples show unimodal peaks, with peaks centered in the vicinity of 6.5-7.5 φ (Figure 4). One sample is bimodal, with peaks centered in the vicinity of 0.5 φ (coarse sand) and 7.5 φ. The frequency curves of Unit U4 are dominated by single peaks, with peaks occurring in the interval of 7-8 φ (very fine silt; Figure 4).
From Units U4 to U1, the average grain size increases, and the complexity of the depositional environment increases, but the overall depositional environment is relatively stable, and the hydrodynamic conditions are relatively homogeneous.
4.1.3 Probability cumulative curve characteristics
The overall probability cumulative curves of YC2 sediments are similar, showing rolling-saltating-suspension depositional mechanisms; U4-U3 show three sections, but U1 shows four sections. For units U2-U4 the slopes of the curves of the rolling and suspension fractions are larger, and the slope of the curve of the saltating fraction is smaller than that of the other two fractions, but the content of the saltating fraction is the largest (Figure 5).
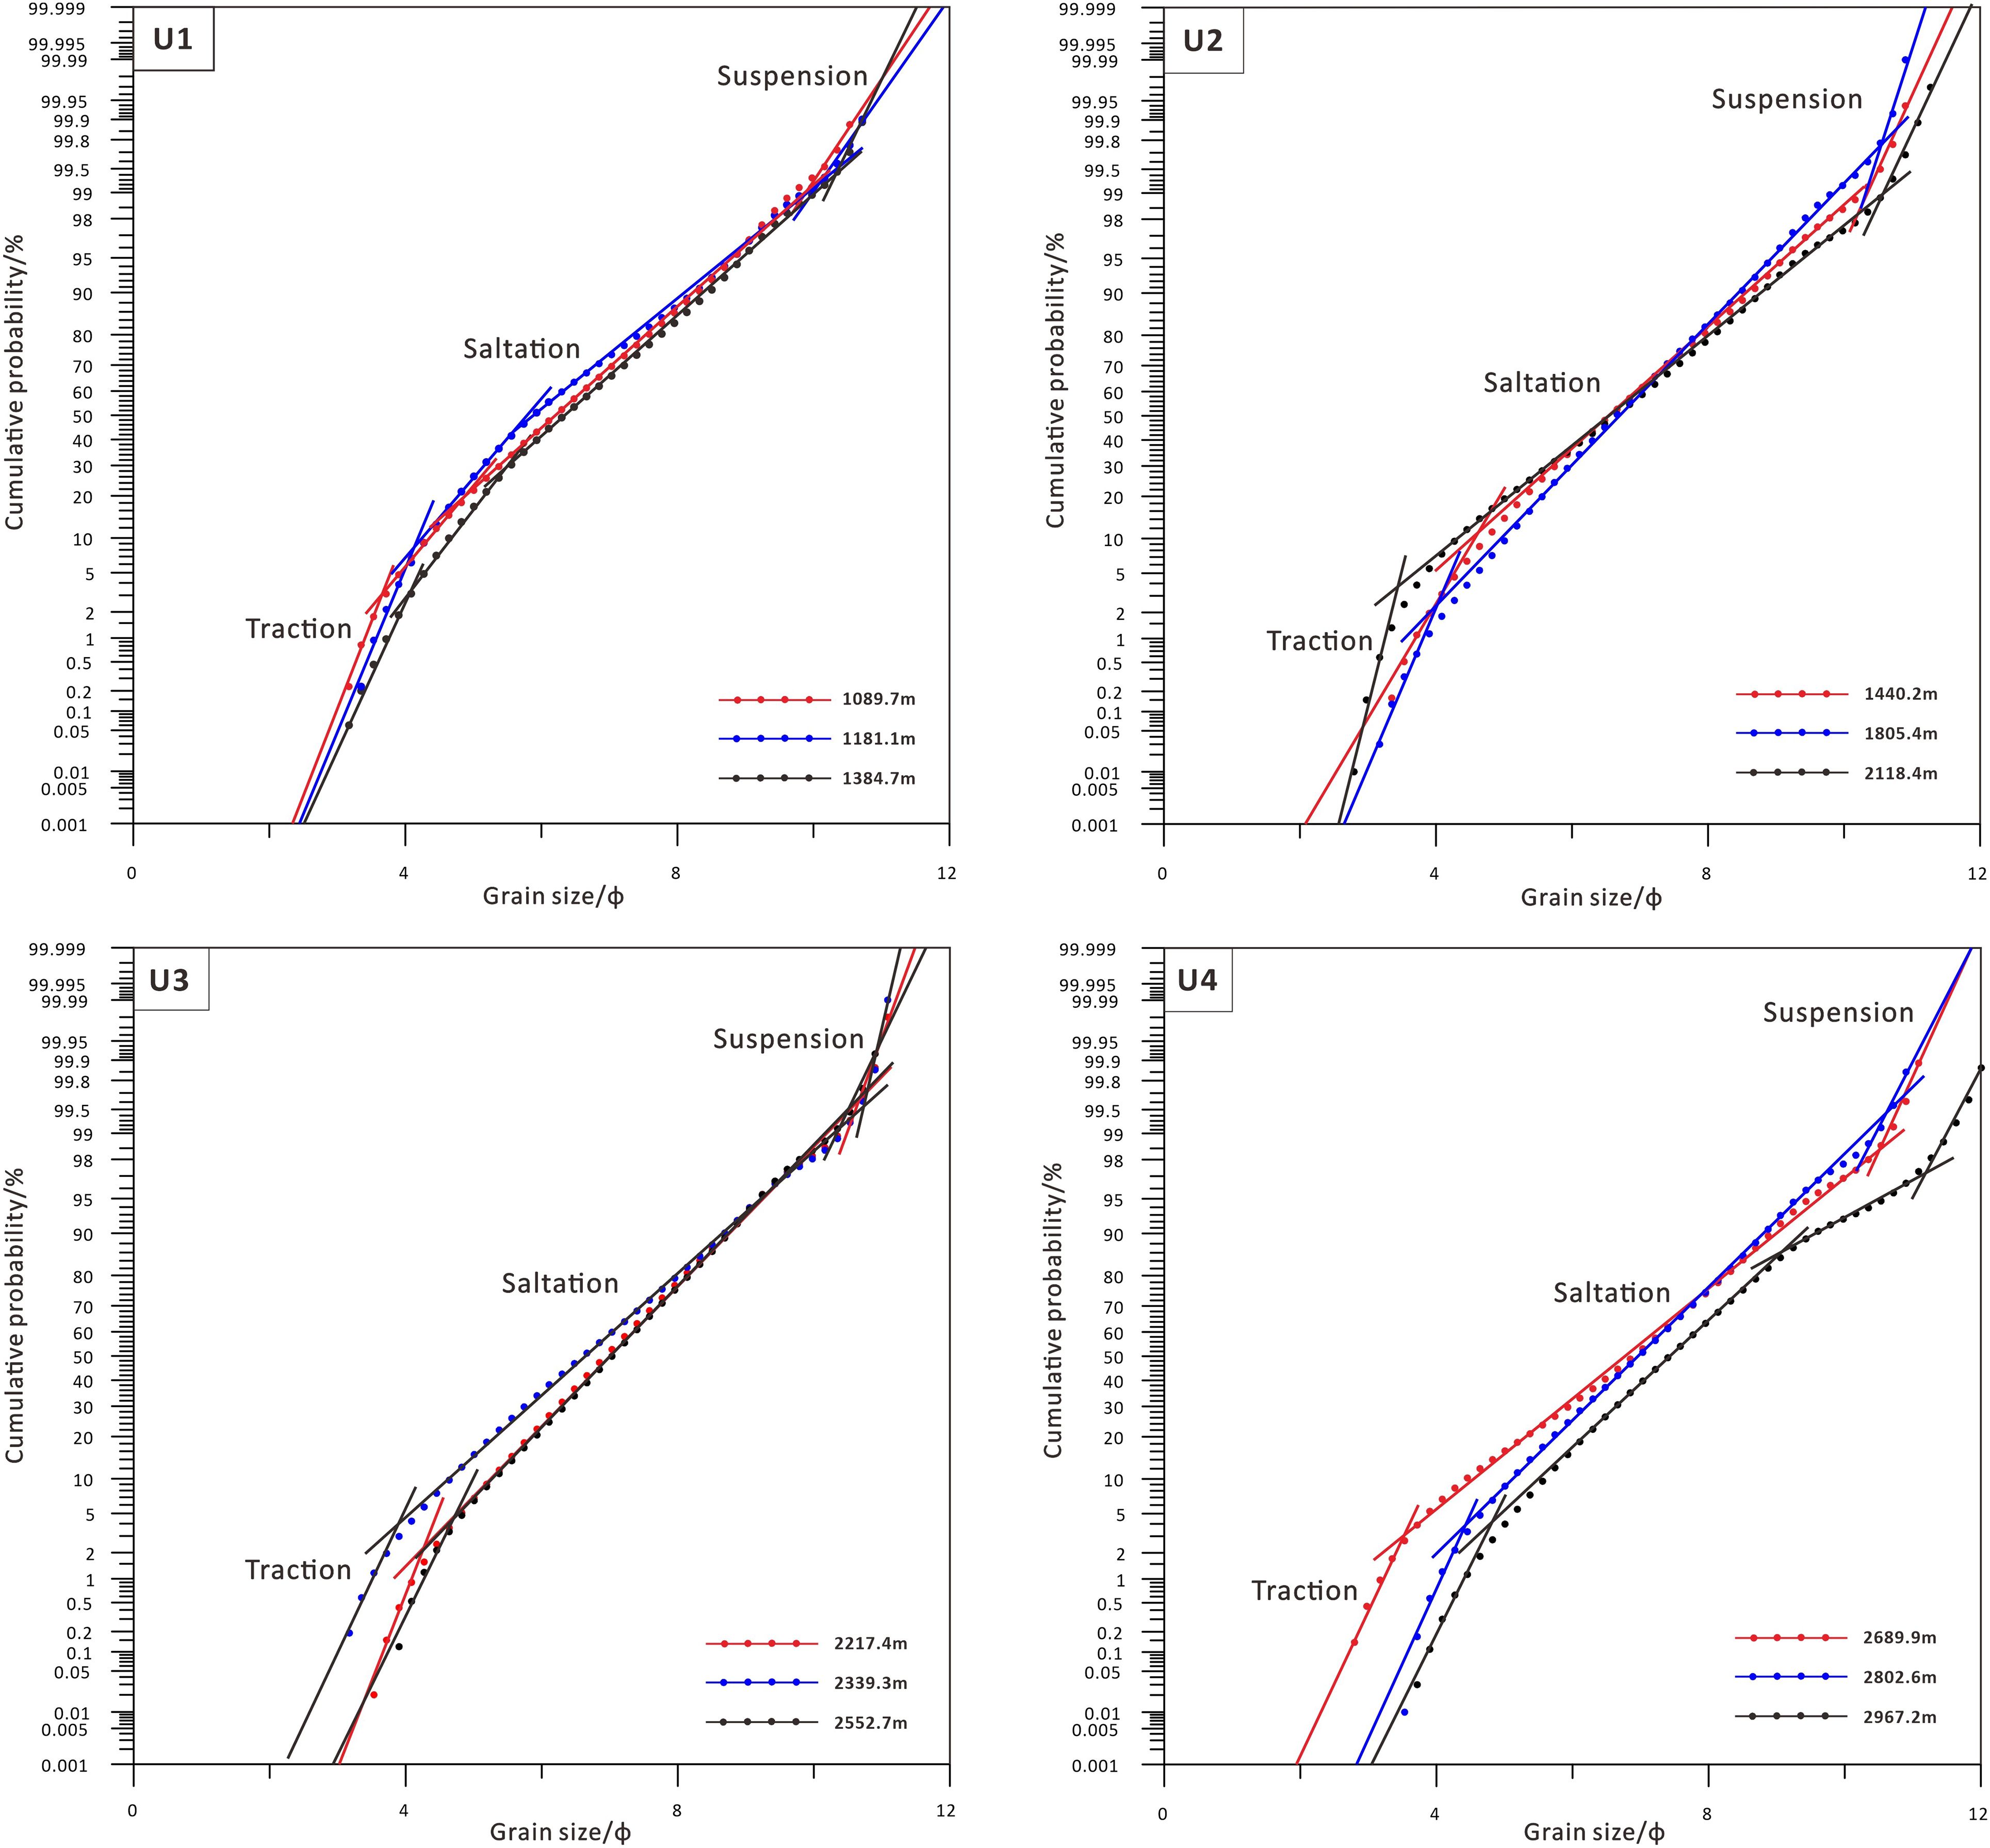
Figure 5. Probability accumulation curves of grain size of Quaternary sediment samples from YC 2 well in northwestern South China Sea.
The probability accumulation curves of the three samples selected in Unit U1 show a four-fold pattern, with overall slopes greater than 50°. The slopes of the corresponding curves for the rolling and suspension components are larger, with better sorting. The saltating component consists of two subgroups, with relatively smaller slopes, and the coarse cutoff points of the saltating components are in the vicinity of 4 φ, with the content of the rolling component in the range of 5~10% (Figure 5). The samples selected from Units U2-U3 all show three sections, and the curve patterns are relatively similar. The coarse intercepts of the saltating components in Unit U2 are between 3 and 4 φ, and the content of the rolling component is between 3 and 12%, with better sorting of the rolling and suspended components (Figure 5). The slopes of the rolling and suspended components of the three sediment samples in Unit U3 are relatively large, and the coarse intercepts of the saltating fractions are around 4 φ, with the content of the rolling component being around 5% (Figure 5). Samples from Unit U4 show a three-sections pattern, but one sample shows a four-sections pattern, with the content of the rolling component accounting for about 5-10% of the sample (Figure 5). The rolling component has the largest percentage of content, and the sorting is relatively poor compared to the other two components. The coarse cutoff point of the saltating component is between 3 and 5 φ, and the content of the rolling component is around 5%.
4.2 Environmentally sensitive components
4.2.1 Grain size - standard deviation method
The overall grain size-standard deviation curves of Units U1-U4 show a pattern of 4-peak distributions, which appear at 0.594 μm, 5.21 μm, 31.1 μm, and 666 μm, respectively (Figure 6). Each peak had its corresponding environmentally sensitive grain size range, which consist of 0.46-0.767 μm (A0 component), 4.03-6.72 μm (A1 component), 27.4-35.3 μm (A2 component), and 586-756 μm (A3 component), respectively (Figure 6). The largest standard deviation value was found for the A2 component, followed by A1 and A3, and the smallest standard deviation value was found for the A0 component. This reflects the drastic changes in the percent content of the A2 component with time and deposition environment. In addition, the 11.2-14.5 μm and 163-310 μm grain size ranges have less content and lower standard deviation values, which are not suitable to be extracted as environmentally sensitive fractions (Figure 6).
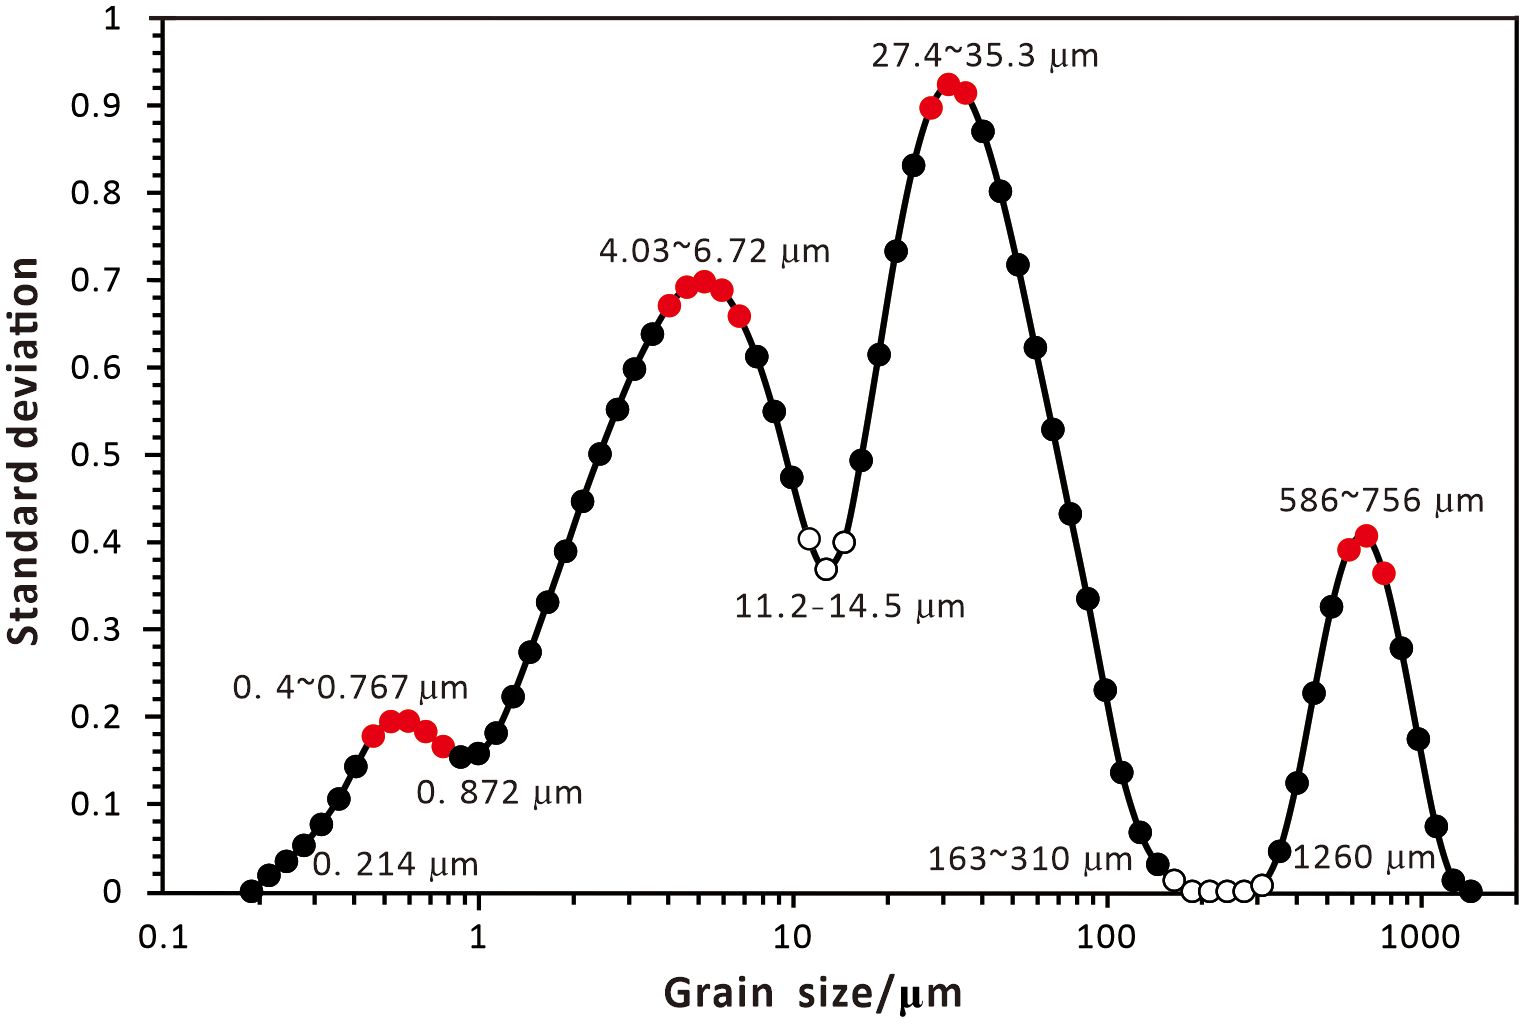
Figure 6. Grain size-standard deviation curve of Quaternary sediment samples from YC 2 well in northwestern South China Sea.
4.2.2 End-member modelling analysis method
The end-member modelling analysis model was used to calculate the sediment grain size data, which was decomposed into two to four end-elements (EM) according to the Weibull function. The values of each fitting parameter are shown in Table 1. Compared with the other two end-elements, the EMR2 value of end-element number (n=3) is smaller; its R2 value is higher than 0.98, with an angular deviation < 5°. This indicates the fitting effect is the best (Figures 7A, B). A significant change point is observed when the number of end-elements in the model is 3. The extremely slight change in R2 and θ for end-element numbers between 3 and 10 indicates that the 3-end-element model meets the criterion of a minimum number of end-elements with high R2 values. The associated R2 value is as high as 98.66%, indicating that the three-end-element model is able to reconstruct 98.66% of the variance in the grain size distribution (Figure 7A).
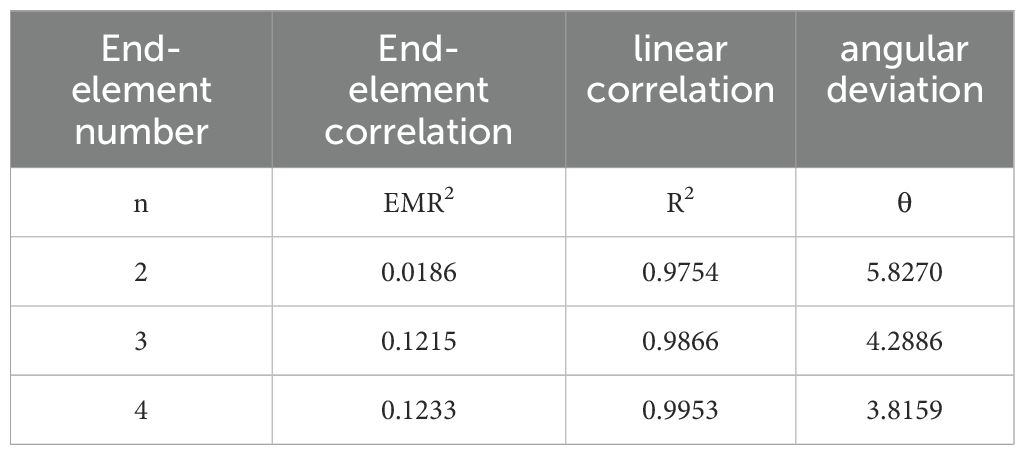
Table 1. Fitting parameters for grain-size end-member analysis of sediment samples from well YC2 in northwestern SCS.
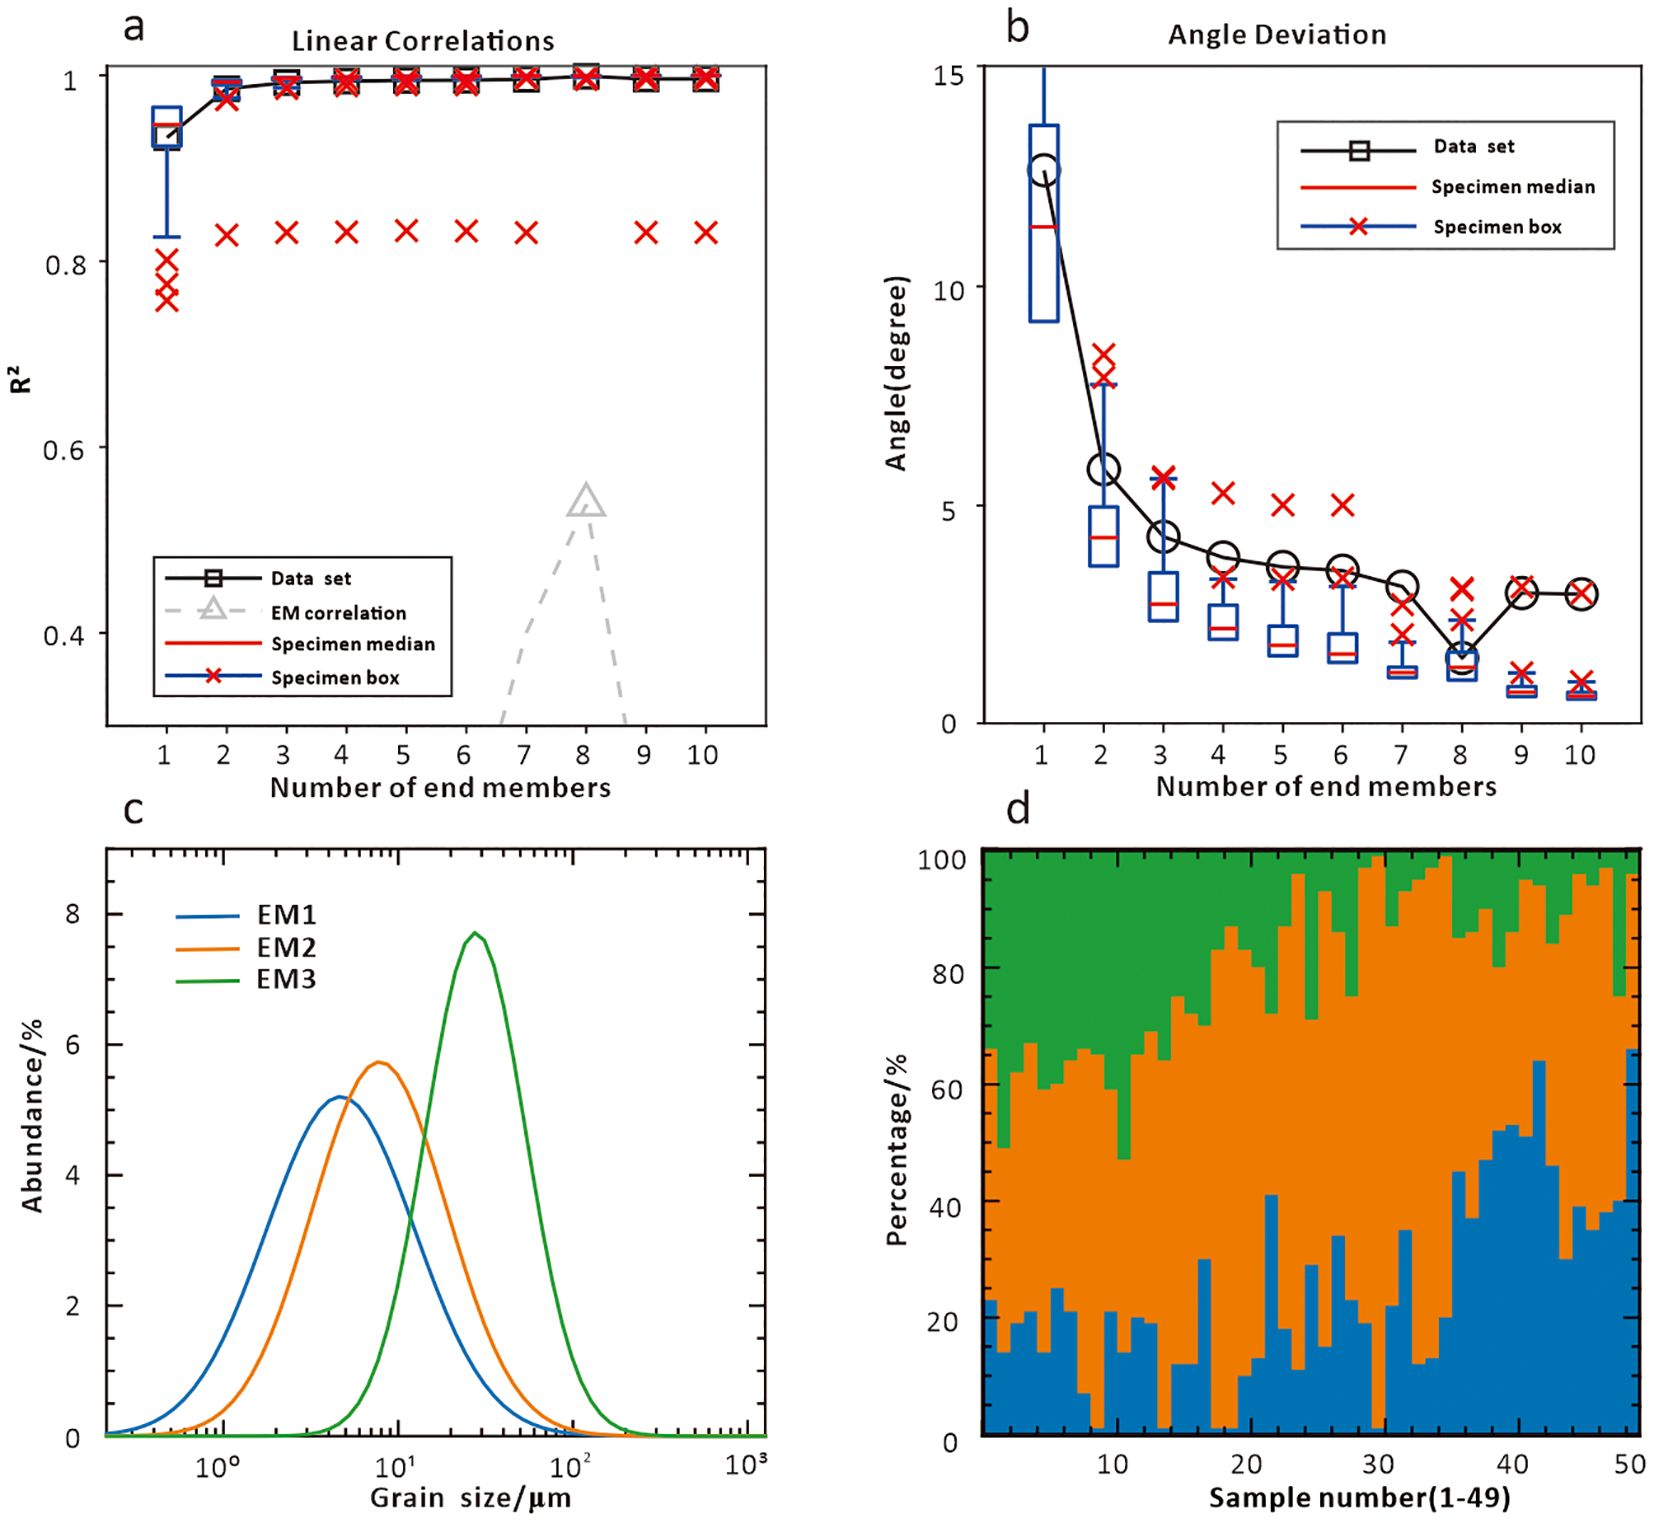
Figure 7. Results of end-member modelling analysis of Quaternary sediment samples from the YC 2 well in the northwestern South China Sea. (A) linear correlation of end-element divisions; (B) angular deviation; (C) simulation results of end-element fractions; (D) EM1-EM4 grain content distribution.
The grain size frequency distribution curves of the three extracted end elements are all single-peaked, and their overall curve patterns are close to normal distributions. The EM1 to EM3 plurality of grain sizes are 4.58 μm (7.77 φ), 7.64 μm (7.03 φ), and 27.4 μm (5.19 φ), which are classified as very fine or medium silt, and the grain sizes of EM1 to EM3 gradually increased vertically upwards (Figures 7C, D). The main grain sizes of EM1-EM3 range from 2.42 to 8.68 μm, 5.21 to 12.7 μm, and 18.7 to 40.1 μm, respectively. The grain size content of EM1 ranged from 0.01 to 66.52% with an average content of 25.01%. The grain size content of EM2 ranged from 28.16 to 99.98 with an average content of 55.06%. The grain size content of EM3 ranged from 0.01 to 53.2% with an average content of 19.92% (Figure 7D).
4.2.3 Principal component analysis
The principal components of 49 sediment samples are analyzed, and three principal control factors F1, F2 and F3 were obtained. The contribution rates of the three principal control factors are 46.878%, 34.894% and 8.752%, respectively, which can explain more than 90% of the information in the original matrix (Figure 8). These three principal control factors basically control the characteristics of the whole sediment samples in terms of grain size variation (Table 2).
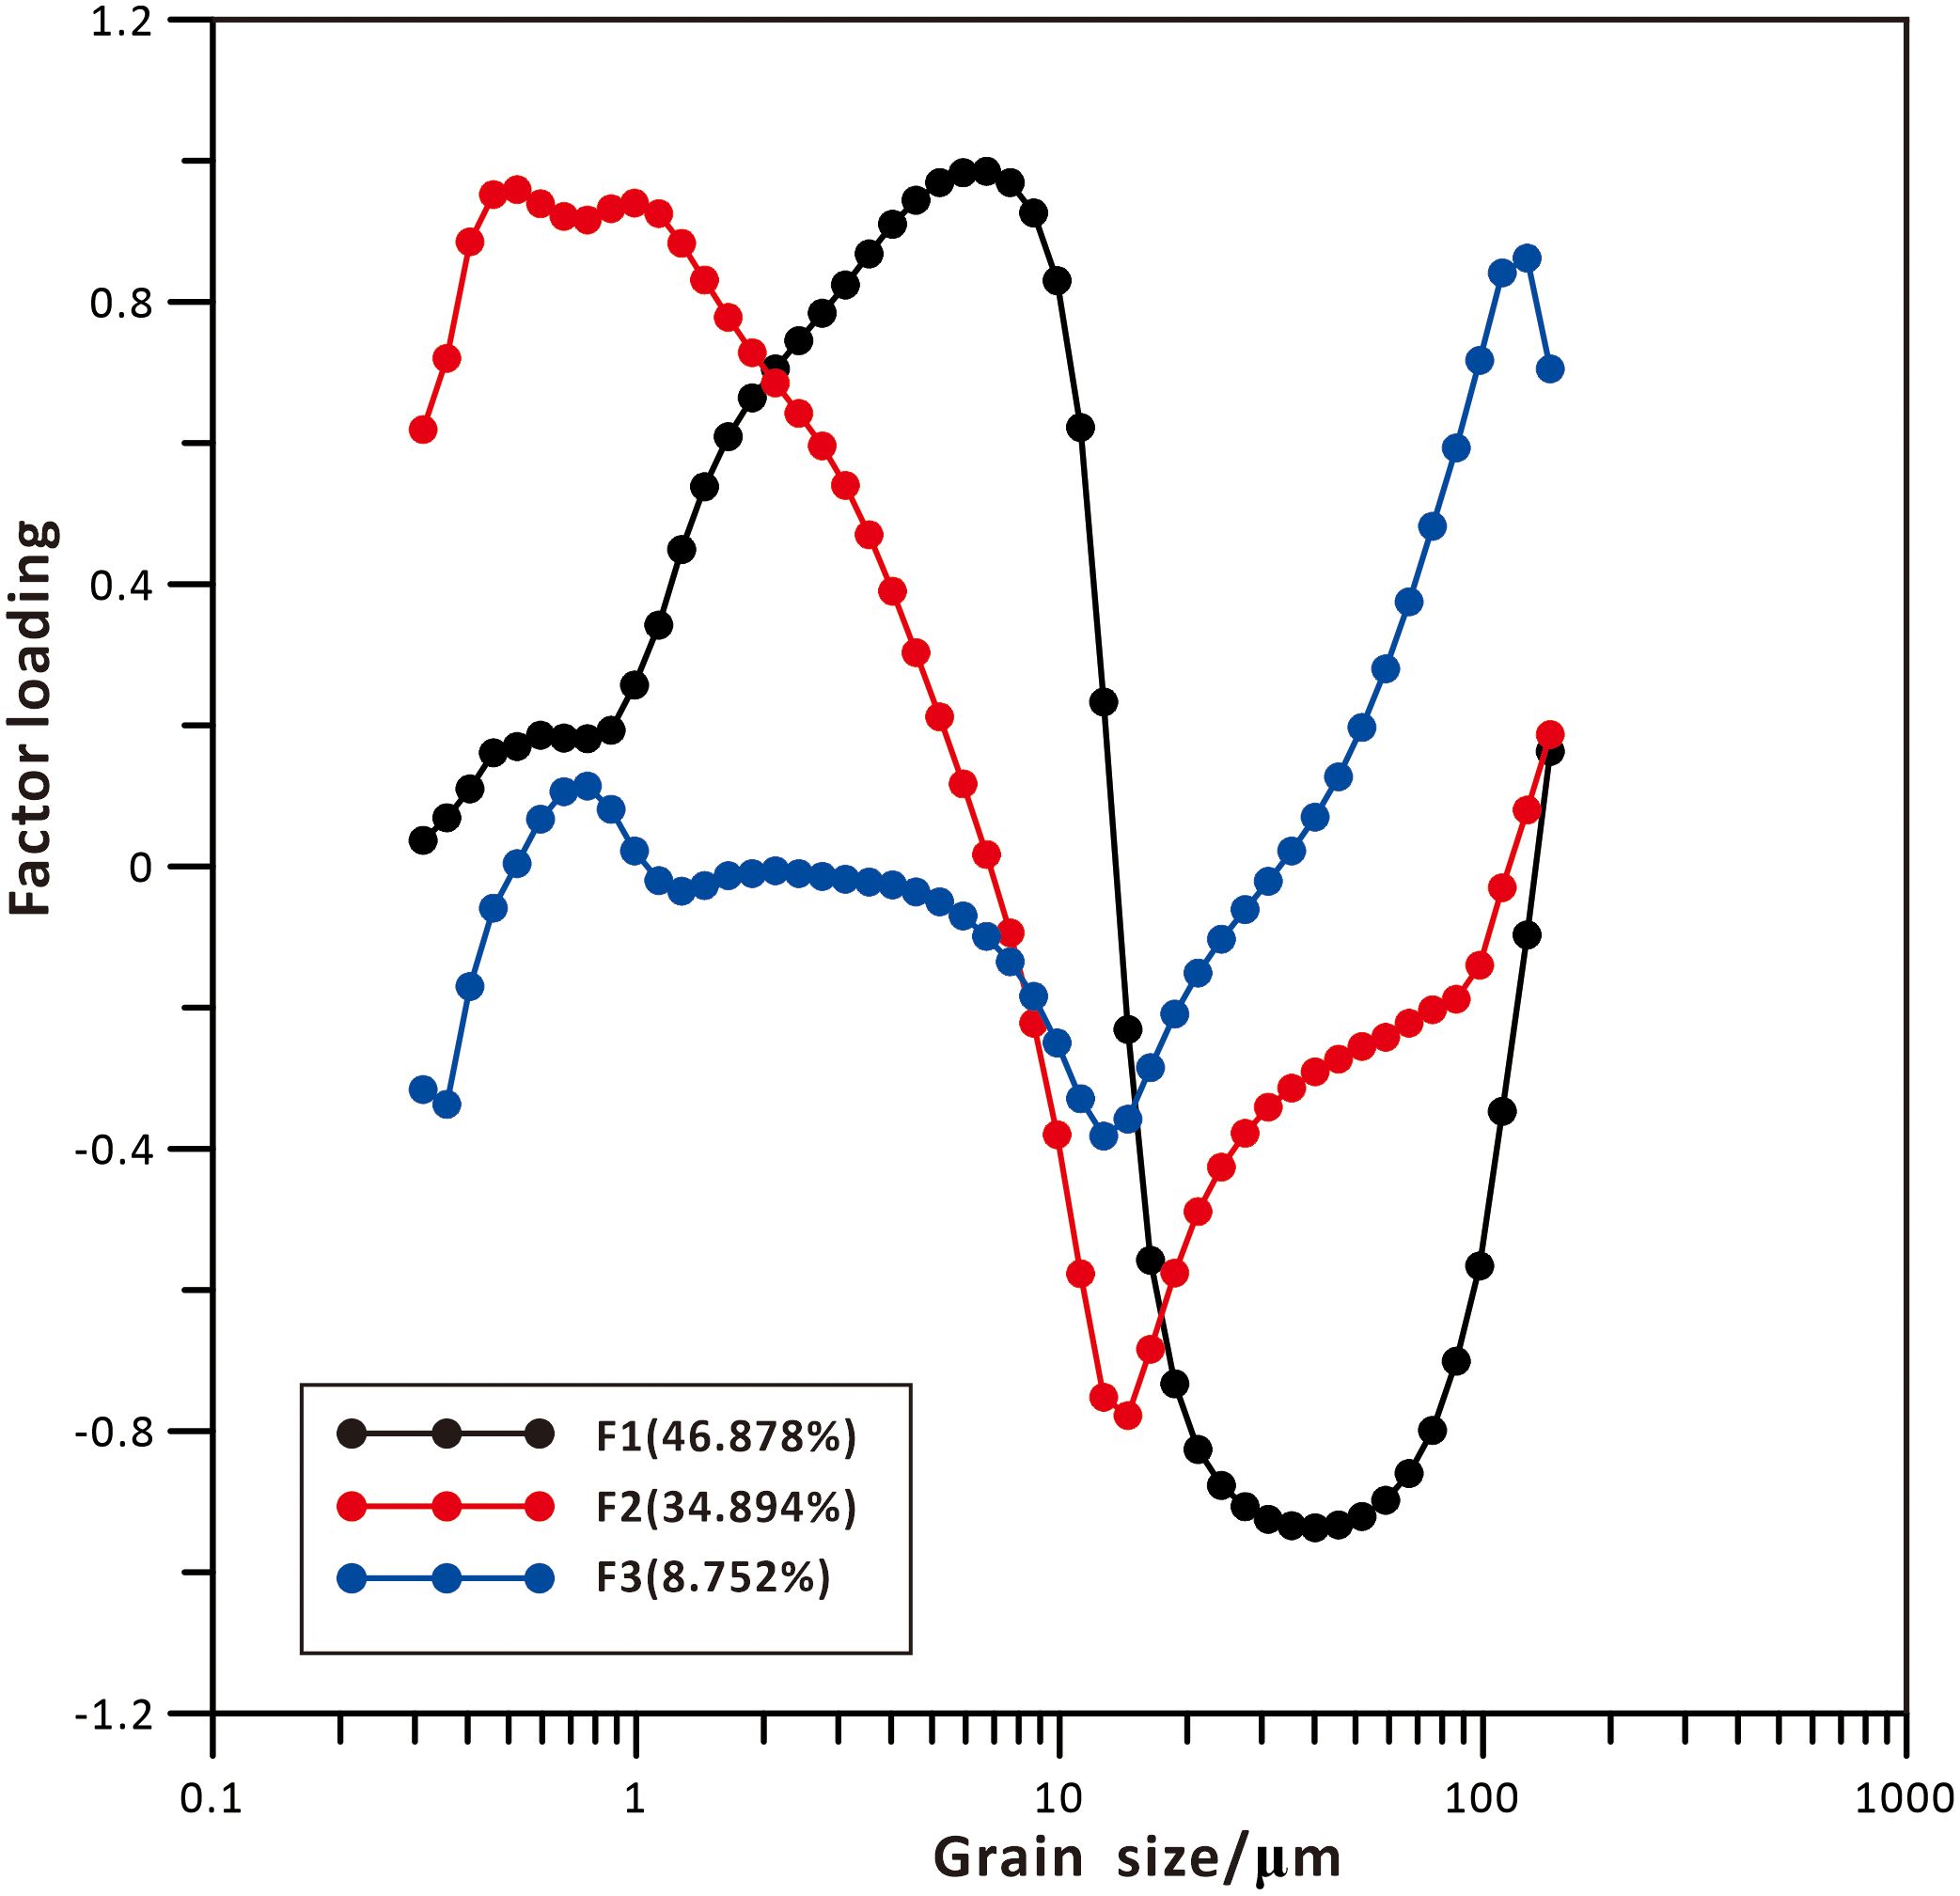
Figure 8. Principal component factor loadings of Quaternary sediment samples from well YC 2 in the northwestern South China Sea.
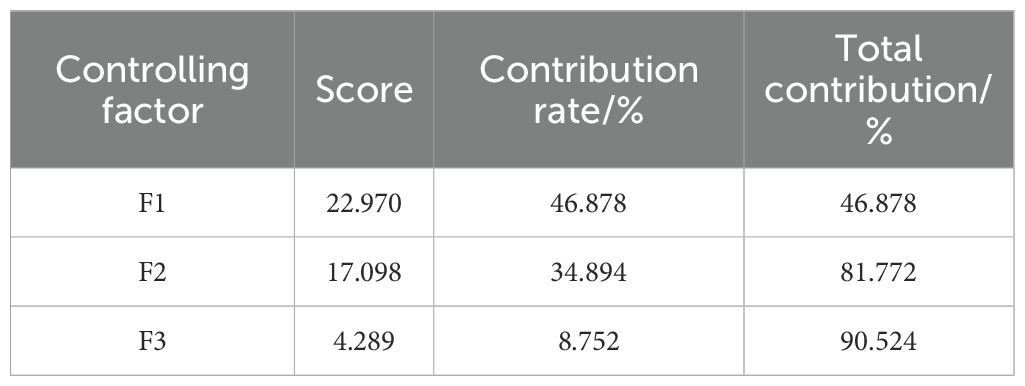
Table 2. Cumulative contribution of main control factors of grain size of Quaternary sediment samples from YC 2 well, northwestern SCS.
The grain size principal component F1 can explain 46.878% of the variance contribution, with a broad positive correlation peak at 6.72 μm, a narrower negative correlation peak at 40.1 μm with lower undulation, and its highly correlated sensitive grain-size fractions are 1.65-11.2 μm and 18.7-86.4 μm (Figure 8). The grain size principal component F2 can explain 34.894% of the variance contribution, with a narrower positive correlation peak at 0.991 μm, a narrow negative correlation peak at 14.5 μm, and its highly correlated sensitive grain-size fractions are 0.314-2.42 μm and 12.7~16.4 μm (Figure 8). The grain size principal component F3 explains 8.752% of the variance contribution, with a narrow positive correlation peak at 127 μm, with which it is highly correlated with the sensitive component grain sizes ranging from 98.1 to 144 μm. The sensitive grain size of F3 in sediment sample content contained less and varied less, which was not discussed in this study (Figure 8).
5 Discussion
5.1 Implications of grain size parameters for depositional hydrodynamics
In the frequency distribution curve, the peak distribution range of a sediment grain size is approximately positively correlated with the sedimentary hydrodynamic conditions, while the number of peaks is closely related to the complexity of the depositional environment (Zhang, 2015). The results of sedimentary dynamics research show that the contents of various genesis components can differ depending on factors such as transport mode and transport distance. In general, the frequency curves of single-causal components are single-peaked distributions, and the frequency curves of multiple-causal components are multi-peaked distributions (Sun et al., 2018). The sediment source in well YC2 is mainly the input from the Red River, that is transported into the SCS by the surface circulation influenced by the monsoon (Chen et al., 2019; Zhao et al., 2019; Li et al., 2024). The vertical evolution of various grain size metrics in the YC2 well in the northwestern SCS could provide information for additional depositional hydrodynamics.
The sediments in U4 are mainly dominated by fine silt with good sorting coefficients (Figure 3). The frequency curves are unimodal focused on the interval of 7~8 φ (Figure 4). It is suggested that the sediments in U4 were influenced by relatively stable dynamic conditions during deposition. Additionally, the probability cumulative curves show a three-fold pattern, with a relatively high content of saltating grains (Figure 5). It indicates an extensive influence of alternating fluvial and wave currents with a relatively strong hydrodynamic condition (Visher, 1969).
The sediments in U3 are similar to U4, and are mainly dominated by fine silt, with an average grain size value of 8.56 μm (Figure 3). The sorting factor is about 1.53; it indicates that the sediments in U3 are well sorted. The frequency curves are also unimodal with the peak appearing between 6.5 and 7.5 φ, but one sample is bimodal (Figure 4-U3). The probability accumulation curves exhibit a three-fold characteristic, with a junction between rolling and saltating grain transporting at near 4 φ (Figure 5). It indicates that the depositional environment was relatively complex, and the hydrodynamic conditions are strong.
The sediments in U2 are dominated by fine silt, with an increased content of coarser silt compared with those in U3 and U4 (Figure 3). The average value of the sorting coefficients is about 1.51, indicating good sorting. The frequency curves are unimodal (Figure 4), with the peak values concentrated in the interval of 6.5~7.5 φ, indicating that the depositional process may only be affected by a single transporting force. The sediments in U1 show a decrease in clay content but an increase in fine sand content, thus, the sediment grain size has coarsened (Figures 3 and 4). The grain size frequency curves are unimodal with the peak values concentrated between 5.5 and 6.5 φ (Figure 4). The probability accumulation curves of the three samples are four-segmented, and the overall slope is basically above 50° (Figure 5). Among them, the rolling and levitation components have larger slopes and better sorting. The saltating component contains two sub-sets with the coarse intercepts of the rolling and saltating components near 4 φ, and the content of the rolling component is between 5 and 10%. Consequently, this indicates that the U1 has the most complex depositional environment, with the coarsest grain size of sediments implying a more enhanced and complicated hydrodynamic condition.
In summary, the sediments in units U4-U1 are mainly dominated by fine silt. The overall sorting is better, and the frequency curves are mostly unimodal curves (Figures 4, 5), indicating that the depositional process may be affected by one prominent hydrodynamic force. The probability accumulation curves of U4-U3 are mostly three-segmented, while U1 is four-segmented. The grain sizes of the rolling-saltating intercepts of U4-U1 become coarser and the content of saltating fractions increases; this indicates that the depositional environment became more complicated, and the hydrodynamic conditions appears to be enhanced (Liu et al., 2016; Li et al., 2024). The latter may be related to the influence of regional circulation (Fang et al., 1998; Xia et al., 2001; Liu et al., 2016). The rapid rises and falls of sea level and the enhancement of circulation controlled by the monsoon increased the total amount of sediment transported and imported, and the grain size increased upwards (Miller et al., 2005; Clift et al., 2008; Li et al., 2024).
5.2 Environmental sensitivity factors extracted by comparative methods
Three environmentally sensitive components (EM1-EM3) were extracted by the end meta-fraction analysis method (EMMA) where the main grain size ranges were 2.42-8.68 μm (EM1), 5.21-12.7 μm (EM2) and 18.7-40.1 μm (EM3), respectively (Figure 9A). Four environmentally sensitive fractions were extracted from YC2 well sediments by the grain size-standard deviation (STD) method, which were 0.46-0.767 μm (A0 fraction), 4.03-6.72 μm (A1 fraction), 27.4-35.3 μm (A2 fraction), and 586-756 μm (A3 fraction, Figure 9B). In addition, four environmentally sensitive components were extracted by principal component factor analysis (PCA), corresponding to grain sizes of 1.65-11.2 μm (F1-1), 18.7-86.4 μm (F1-2), 0.314-2.42 μm (F2-1), 12.7-16.4 μm (F2-2) and 98.1-144 μm (F3), respectively (Figure 9C). Comparison of the environmentally sensitive grain sizes extracted by the three methods revealed that the A1 component (4.03~6.72 μm) extracted by the grain size-standard deviation method, the EM1 (2.42~8.68 μm) and EM2 (5.21~12.7 μm) extracted by the end-member modelling analysis method, and the F1-1 (1.65~11.2 μm) extracted by the principal component factor analysis. These metrics of the grain size showed a consistent trend with depth. In addition, the main control factor F1-2 (18.7~86.4 μm) extracted by principal component factor analysis contains the corresponding grain size ranges of component A2 (27.4~35.3 μm) extracted by the grain size-standard deviation method and EM3 (18.7~40.1 μm) extracted by the end-member modelling analysis method (Figure 9).
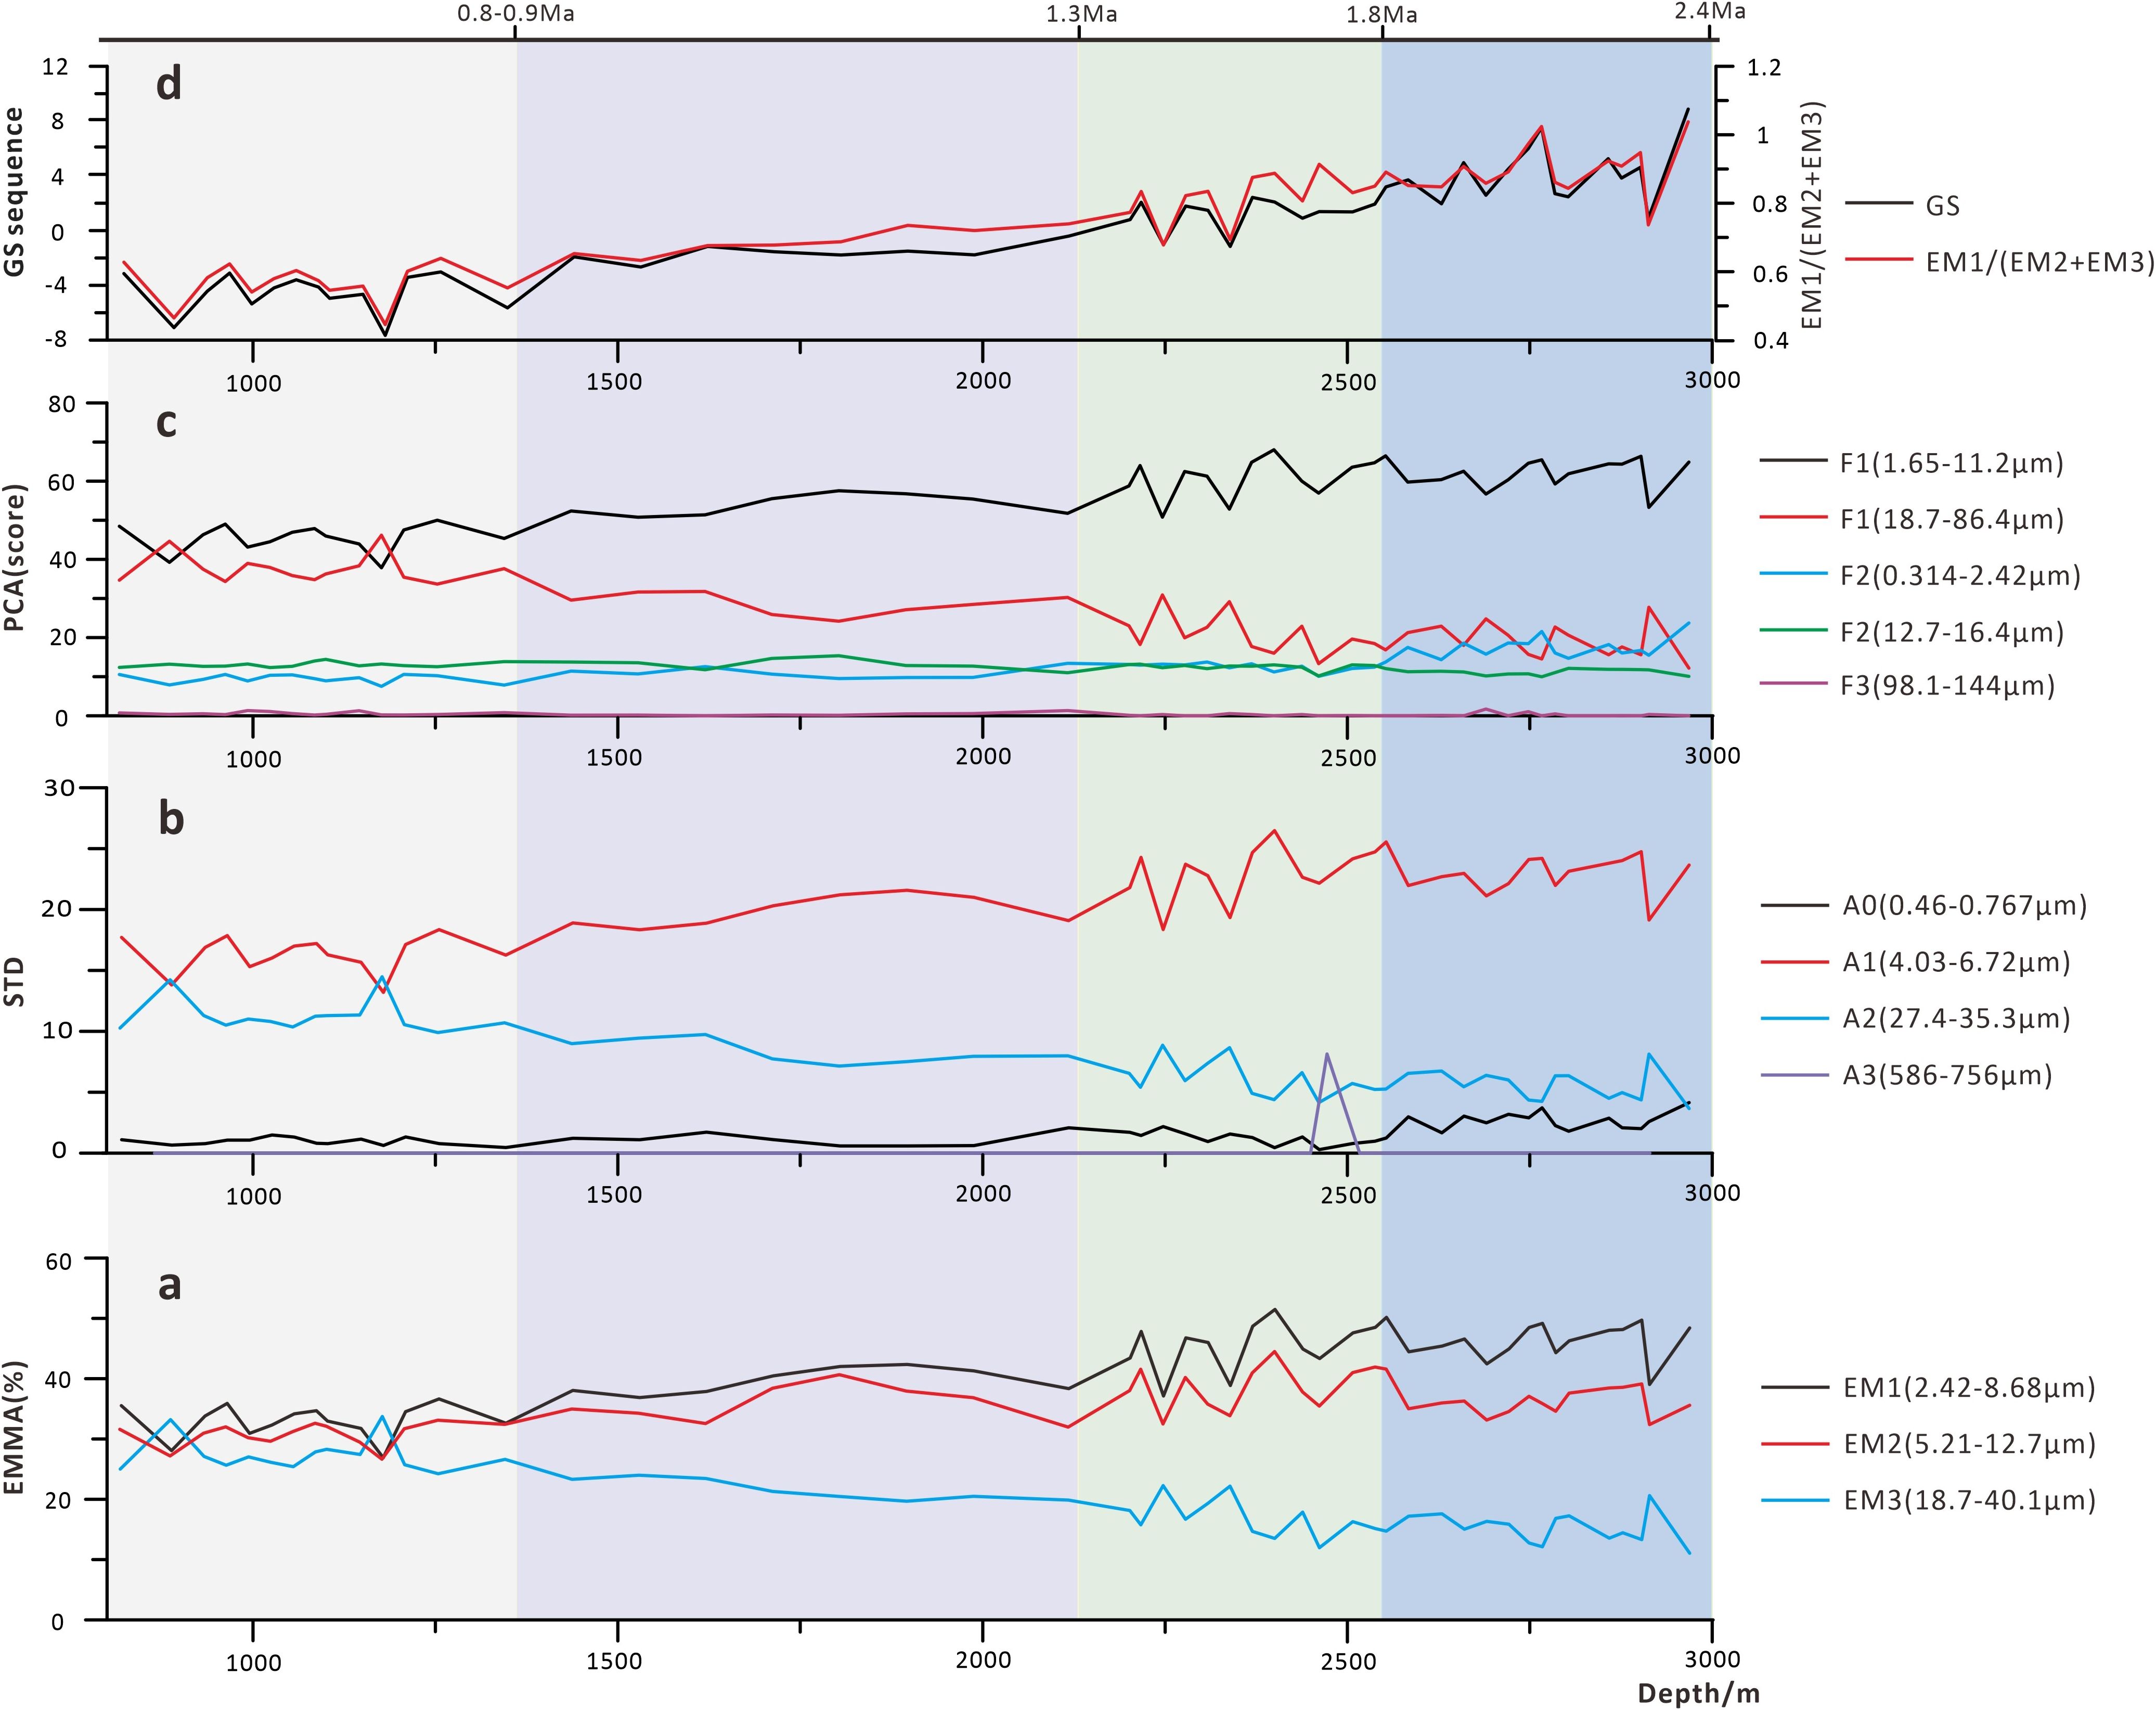
Figure 9. (A-D) Graphs of environmentally sensitive grain size fractions extracted by different methods from YC2 well since 2.6 Ma in the northwestern South China Sea; a-End -member modelling analysis (EMMA); b-Grain size-standard deviation (STD); c-Principal component factor analysis (PCA); d-GS sequence and EM1/(EM2+EM3) indicator.
The above integrated methods coevally indicate that there are obvious differences among the three methods in the process of grain size parameter selection and calculation. However, some of the sensitive grain sizes extracted by them show good compatibility, and the metrics of these grain sizes show the same trends with depth change (Figure 9). In contrast, the relationship between the main control factors F2 and F3 extracted by the principal component factor analysis method and the A0 and A3 components extracted by the grain size-standard deviation method were not well reflected, which was due to the low content of the corresponding grain sizes represented by these sensitive components (Figures 3, 4 and 9). The change of the grain size content within this range of grain sizes was not obvious, and it is not appropriate to discuss these components.
The trends of the fine-grained environmentally sensitive components extracted by the three methods of grain size-standard deviation method, end-member modelling analysis and principal component analysis are basically the same with depth. The range of the included grain sizes is also highly overlapped, which can reflect the general trend of the summer monsoon in East Asia, among which 5.21-6.72 μm is the common range of grain sizes shown by the three methods. Therefore, the 5.21~6.72 μm component can be used as a proxy indicator for the East Asian summer wind/monsoon (Figure 9; Table 3). Similarly, for the East Asian winter monsoon, the trends of the coarse-grained silt environmentally sensitive components extracted by the three methods with depth are also basically the same. The three grain size ranges are also highly overlapped, and have similar trends with the winter monsoon recorded by the Lingtai Loess and the wind-dust accumulation in the northern SCS (Sun et al., 2010). Therefore, the grain size content change of 27.4~35.3 μm silt at the intersection of the three can be used as a proxy indicator of the Quaternary East Asian winter monsoon in the northwestern SCS (Figure 9; Table 3).
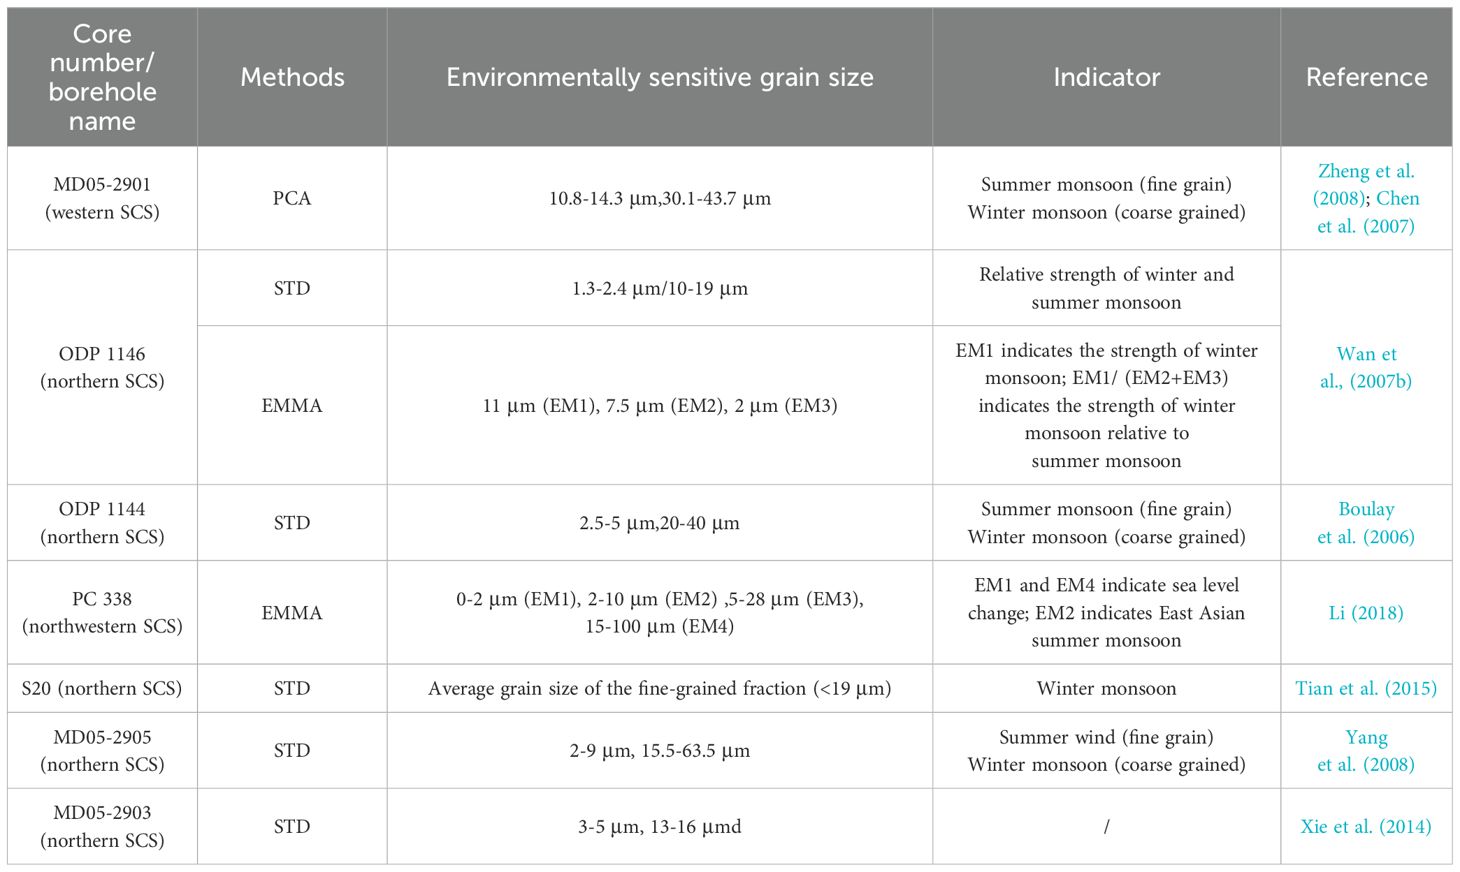
Table 3. Summary of sediment grain size metrics used for East Asian monsoon climate studies in the SCS.
Comparing the research results on sensitive grain size in different study area, it can be seen that the range of sensitive fractions extracted by the grain size-standard deviation method mainly relies on estimation. Moreover, this method focuses on the overall size of the grains, and may neglect the variability of the individual grains (Wan et al., 2007b, 2010). Grain size-standard deviation (STD) is a method to visualize the degree of dispersion in the volume percent content of different grain sizes (Shen et al., 2015; Teng et al., 2018). Differences in grain size content are reflected by the size of the standard deviation and reveal changes in the associated hydrodynamic strength and depositional environment. However, the method extracts a single sensitive component and lacks an effective method for determining the number of end-member components, which may lead to ignoring inter-individual differences. In contrast, the end-member modelling analysis method (EMMA) is able to extract the sensitive grain size with actual depositional significance, consider all sediment samples comprehensively, and accurately judge the amount of end-member modelling (Dietze et al., 2012; Yu et al., 2016). In addition, Principal Component Factor Analysis (PCA) accurately identifies the correlation between different grain size components and is more statistically significant (Hao et al., 2023).
5.3 Interpretation of sensitive components and their environmental significance
To determine the grain-size-sensitive components of SCS sediments and the monsoon evolution, a large number of studies have been done by previous researchers, and it is summarized that the fine-grained components in the range of 0-15 μm are usually considered as a valid indicator of the East Asian summer monsoon (Boulay et al., 2007; Li, 2018; Yang et al., 2008; Zheng et al., 2008) whereas the 16-63.5 μm range can generally indicate the East Asian winter wind intensity (Zheng et al., 2008; Boulay et al., 2006; Yang et al., 2007, 2008) (Table 3). However, there are some differences in the range of sensitive grain sizes extracted from different study areas.
Sediment sources in the SCS region are mainly influenced by the East Asian monsoon. An enhanced summer monsoon leads to increased precipitation and riverine input of fine-grained components, while an enhanced winter monsoon is often accompanied by relatively dry and cold climatic conditions, when more coarse-grained silt and dusty materials are transported to the northwestern SCS (Yang et al., 2008). Therefore, the changes in the contents of fine- and coarse-grained silt components can be used as proxy indicators for the evolution of summer and winter monsoon in East Asia, respectively. Previous researchers have done a lot of studies on the size-sensitive components of SCS sediments and the evolution of the East Asian monsoon (Figure 10; Clift, 2006; Sun et al., 2010; Wan et al., 2010), and concluded that the fine-grained components in the range of 0-15 μm are usually considered to be valid indicators of the East Asian summer monsoon, and the coarse-grained material in the range of 15.5-63.5 μm can generally be used as a valid indicator of the East Asian winter monsoon.
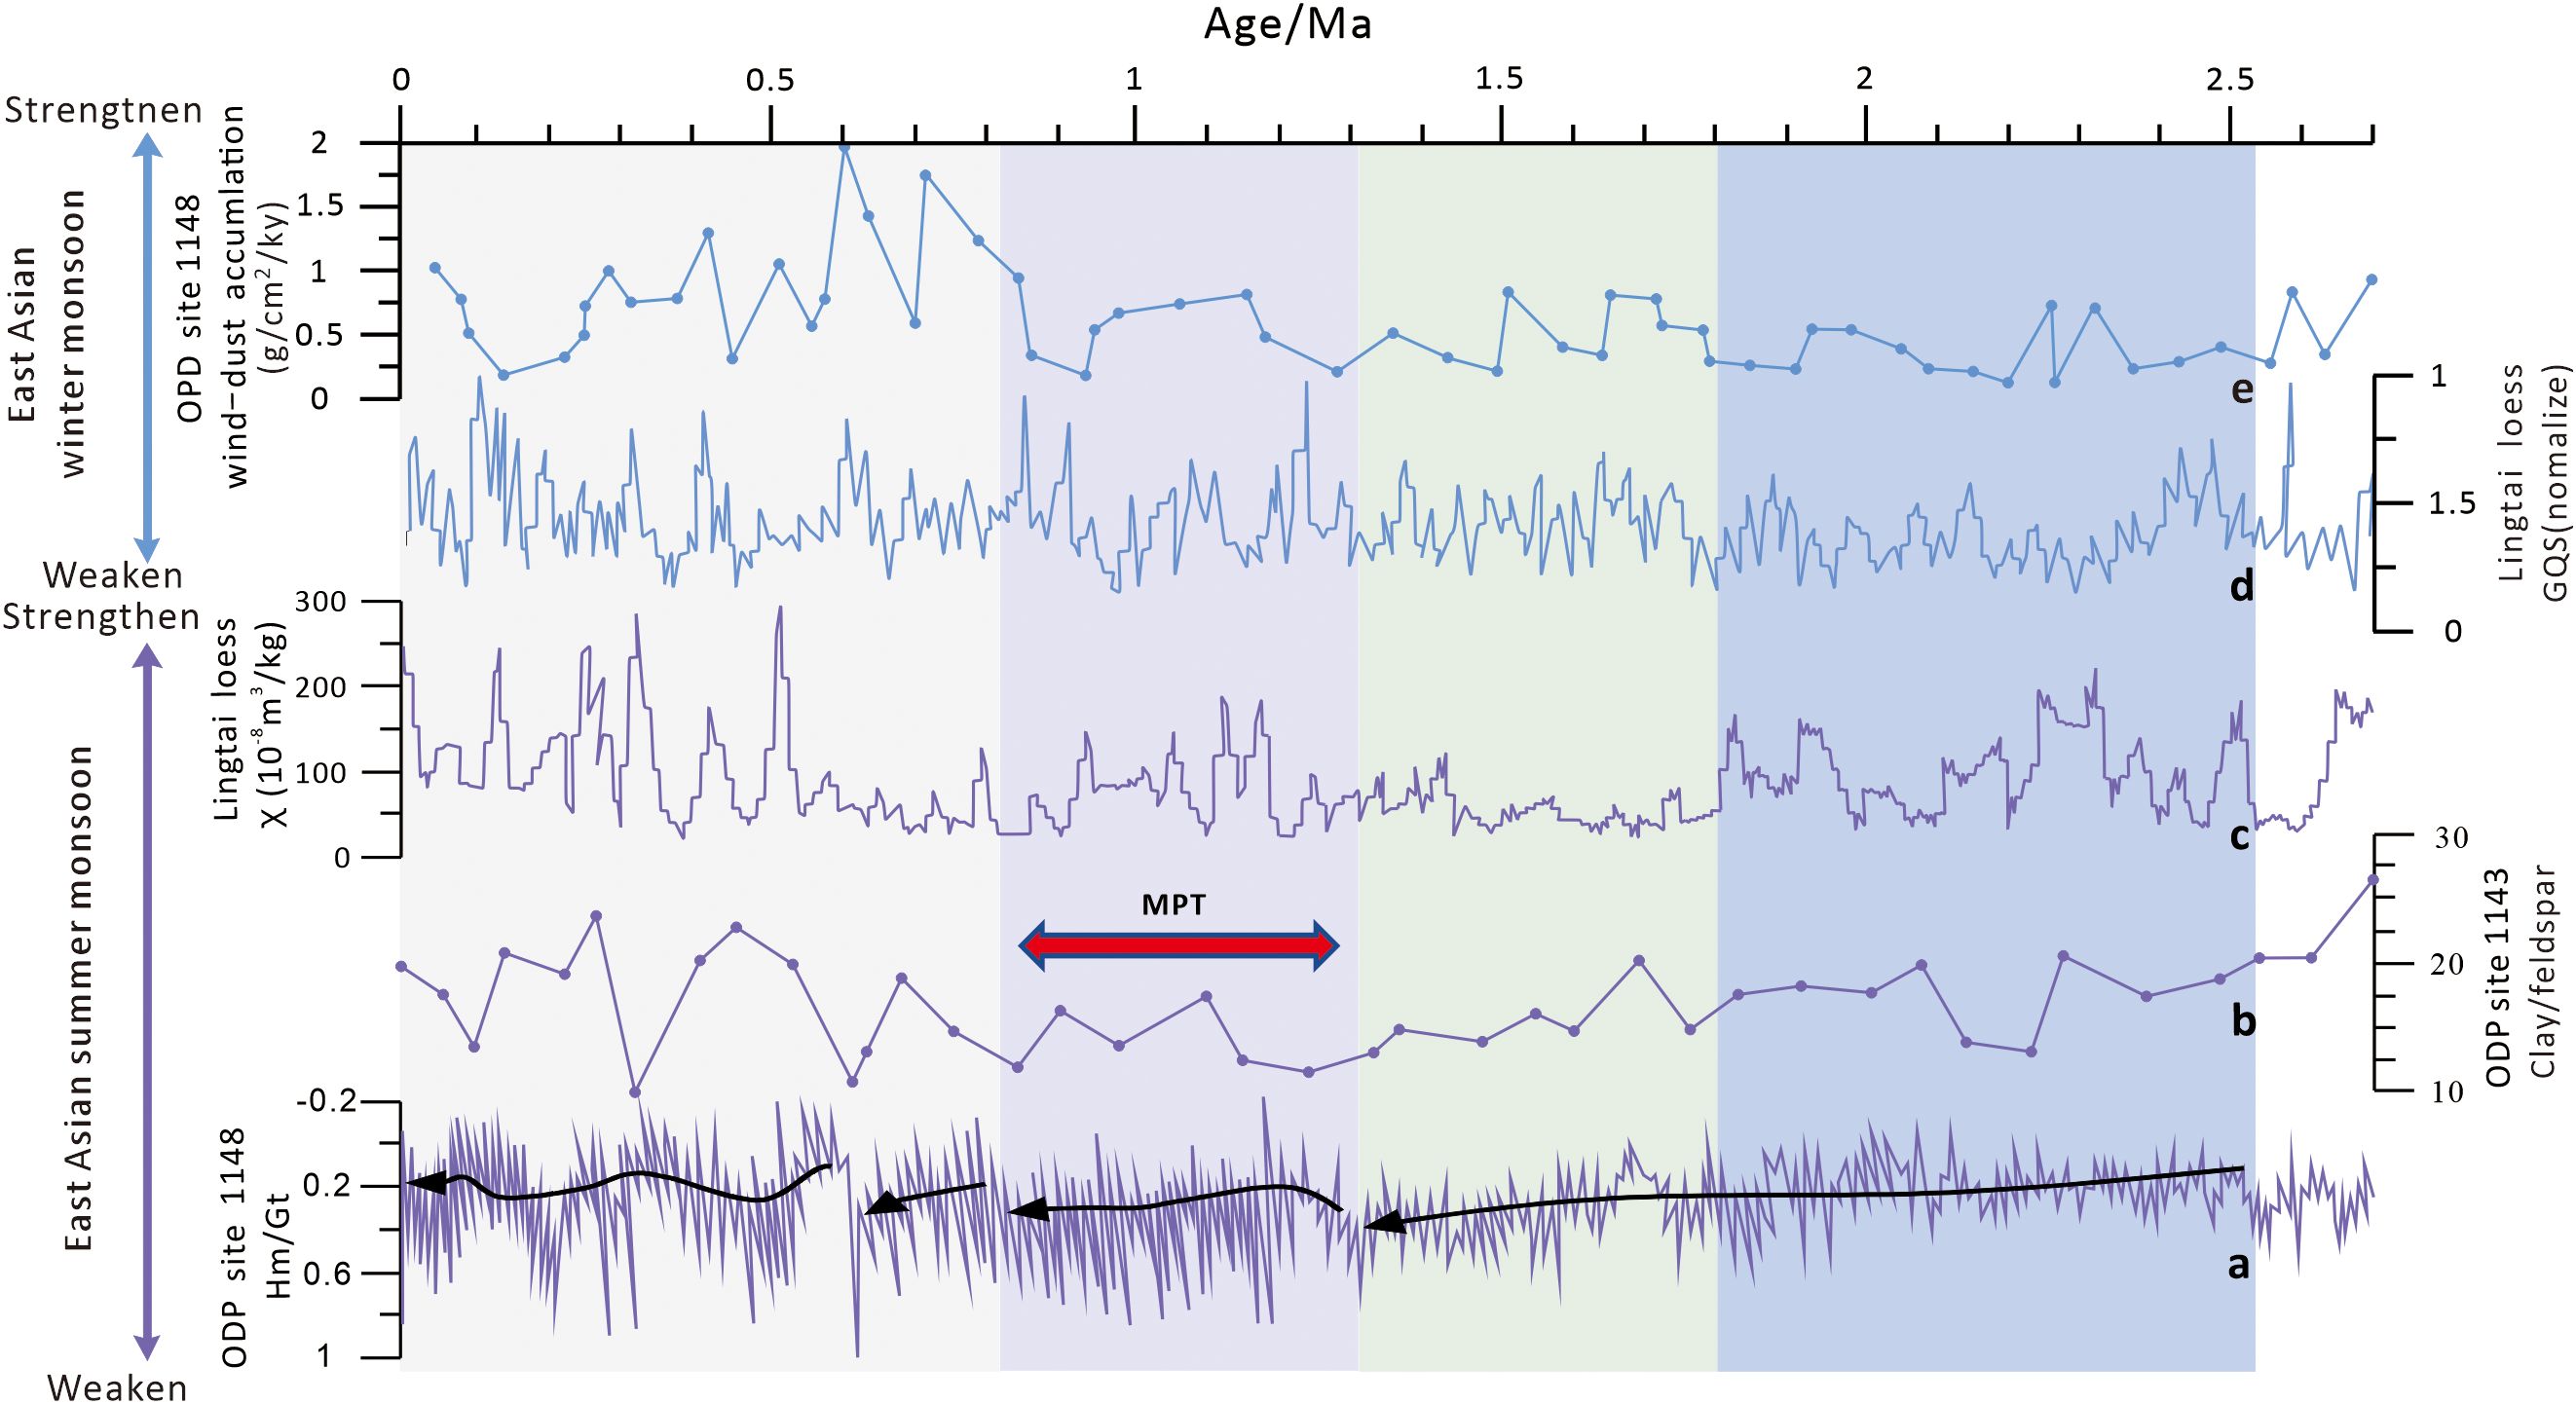
Figure 10. (A-E) Evolution of proxy indicators for the East Asian monsoon in the South China Sea. a- Hm/Gt (hematite/acicularite) record from ODP1148 core in the northern South China Sea (Clift, 2006); b-Clay/feldspar record from ODP1143 core in the southwestern South China Sea (Wan et al., 2007b); c-Magnetization rate (χ) of Lingtai Loess from the Loess Plateau (LTP); d-Quartz Grain Size (QGS) record from the Loess Plateau (Sun et al., 2010); e-wind-dust accumulation rate of ODP1148 core in the northern South China Sea (Wan et al., 2007b). MPT, Middle- Pleistocene Climate Transition.
In this study, EM1-EM3 are end-member modelling with actual physical significance, and most of the previous interpretations of the land-sourced detritus in the northwestern SCS are the combined results of river transport (summer monsoon) and wind-dust transport (winter monsoon). The fine-grained fraction is generally interpreted as river mud, the intermediate fraction as river silt, and the coarser silt fraction as wind dust (Wang et al., 1999; Wan et al., 2006). Therefore, EM1 and EM2 obtained from this telogenetic analysis are interpreted as riverine input mud and silt; the grain size of EM3 is close to that of the wind dust fraction in the northwestern SCS (Boulay et al., 2007; Li, 2018; Wan et al., 2007b). However, only a very small fraction of the wind dust material would be deposited in the northwestern SCS (Boulay et al., 2007; Wan et al., 2007b). It is hypothesized that EM3 is a relatively distant source of land-sourced debris or a mixed component of wind-dust transported.
In order to better explore the influence of sediment grain size content changes on understanding the East Asian monsoon history, the three principal control factors F1-F3 extracted by principal component factor analysis were combined to form a new grain size metric (GS). The sum of F1-F3 and their squared loadings was calculated with the following equation:
In addition, EM1/(EM2+EM3) was used to represent the percentage of fine-grained material extracted by the end-member component analysis method in the overall sediment. In order to explore the role of these two metrics in indicating the East Asian monsoon, some alternative metrics for the East Asian monsoon were selected and plotted with reference to previous studies on the East Asian monsoon climate (Figure 10; Wan et al., 2006; Clift, 2006; Wan et al., 2007a, 2007b; Sun et al., 2010).
The GS series can represent the intensity of the East Asian monsoon (Yi et al., 2012). When the East Asian summer wind is strengthened, precipitation increases, river action is enhanced, more fine-grained materials are carried by the river into the sedimentation area, and the GS value increases. When the East Asian winter wind is strengthened, rainfall decreases, wind and dust action is enhanced, more coarse-grained silt is carried into the sedimentation area, and the GS value decreases (Hao et al., 2023).
The GS sequence shows the same trends as the EM1/(EM2+EM3) curves. During U4 (>1.8 Ma period), both the GS series and EM1/(EM2+EM3) show a trend of increasing and then decreasing, indicating that the hydrodynamic strength of this period is first enhanced and then weakened. This is consistent with the trend of the fine-grained component content, reflecting that the East Asian summer monsoon are also enhanced and then weakened during this period. This change is consistent with the East Asian winter monsoon climate recorded in the Lingtai Loess on the Loess Plateau (Sun et al., 2010). During U3 (1.3~1.8 Ma period), both GS series and EM1/(EM2+EM3) are further decreased, indicating that the hydrodynamic component weakened during this period, while the winter monsoon strengthened. During U2 (0.8~1.3 Ma period), both the GS series and EM1/(EM2+EM3) gradually decrease, but the overall change is smaller, which indicates that the hydrodynamic conditions weakened and the winter monsoon enhanced (Clift, 2006; Wan et al., 2007a; Clift et al., 2014). During the 0.8~0.9 Ma period, the slope of the GS series and EM1/(EM2+EM3) curves becomes larger, and the winter monsoon is further enhanced and the summer monsoon is weakened. This is related to an increase in the intensity of the global glacial-interglacial cycle and the sea level rise after the Middle Pleistocene climate transition (Clark et al., 2006; Elderfield et al., 2012; Barker et al., 2021). This trend of change is consistent with the trend of the winter monsoon recorded by the Lingtai Loess and wind-dust accumulation in the northern SCS, and summer monsoon recorded by the clay/feldspar in the southwestern SCS and Hm/G (hematite/acicularite) in the northern SCS (Clift, 2006; Wan et al., 2007a).
During U1 (<0.8 Ma period), temperature fluctuations in the northwestern SCS increased in amplitude and the deposition rate of land-sourced detritus was progressively elevated (Jin and Jian, 2008; Tuo, 2008). During this period, the winter monsoon intensified, the climatic conditions were dry and cold (Clark et al., 2006), resulting in an increase of coarse-grained silt in the sediments (Figures 3 and 4). The GS series and EM1/(EM2+EM3) showed a minimum near 0.6 Ma, when the intensity of the winter monsoon in East Asia reached its maximum (Figures 9D and 10). This phenomenon has a similar trend to the winter monsoon recorded by the Lingtai Loess and the wind-dust accumulation in the northern part of the South China Sea (Wan et al., 2006, 2007b).
6 Conclusions
In this paper, based on the 49 sets of Quaternary sedimentary grain size data obtained from YC2 well on the northwestern shelf edge of the SCS, we statistically analyzed the characteristics of the quantitative parameters of the grain size, analyzed the hydrodynamic characteristics and sedimentary evolution, and extracted the environmentally sensitive components of the sediment samples by using the grain size-standard deviation methods. The following insights were obtained:
1. The Quaternary sediments in YC2 well in the northwestern SCS are mainly dominated by silts and the grain size is gradually coarsened upwards, which indicates that the depositional process may be affected by a single but enhanced hydrodynamic factor. The coarser sediments observed in U1 imply a possible influence by the monsoon-influenced surface circulation, being transported by the South China Sea Warm Current.
2. Four environmentally sensitive grain-size components were extracted by the grain-size-standard deviation methods. The end-member modelling analysis method: 2.42-8.68 μm (EM1), 5.21-12.7 μm (EM2), and 18.7-40.1 μm (EM3). All three end-elements can be applied to the extraction of environmentally sensitive components in the northwestern SCS. The end-elements can be interpreted for well YC2 as follows: EM1 and EM2 are interpreted as fine-grained sediments, such as mud and silt, imported by the river; and the grain size of EM3 is closer to that of the wind-dust fractions from the northwestern part of the SCS.
3. The trends of grain size sequences and EM1/(EM2+EM3) with depth can reflect the trends of East Asian summer monsoon. In this study, we consider the content change of 5.21-6.72 μm grain size components as a proxy for the Quaternary East Asian summer monsoon in the northwestern SCS, and that the content change of 27.4-35.3 μm grains as a proxy for the Quaternary East Asian winter monsoon in the northwestern SCS.
4. In the northwestern SCS shelf and shelf edge area, the East Asian summer monsoon weakened continuously from 1.3 to 0.8 Ma, but weakened considerably at 0.9 Ma. This is presumed to be related to the Middle Pleistocene climate transition. The East Asian winter monsoon shows the opposite trend of evolution, from 1.3 Ma to the present.
Data availability statement
The original contributions presented in the study are included in the article/supplementary material. Further inquiries can be directed to the corresponding authors.
Author contributions
JWG: Writing – original draft. QPL: Funding acquisition, Writing – review & editing. XMZ: Conceptualization, Writing – review & editing. WXP: Investigation, Methodology, Writing – review & editing. QF: Resources, Validation, Writing – review & editing. XC: Formal analysis, Investigation, Software, Writing – review & editing. XZ: Software, Supervision, Validation, Writing – review & editing.
Funding
The author(s) declare that financial support was received for the research, authorship, and/or publication of this article. This study was supported by Open Fund Project of National Key Laboratory of Natural Gas Hydrates in 2022 (2022-KFJJ-SHW), Natural Science Foundation of Sichuan – Sichuan Science and Technology Program (No. 2023NSFSC0810), Open Fund of State Key Laboratory of Oil and Gas Reservoir Geology and Exploitation (Southwest Petroleum University; PLN2022-41).
Acknowledgments
We appreciate editorial help from Li Xubiao and Brian G. Jones. We are also grateful to the Guangdong Provincial Laboratory of Southern Marine Science and Engineering (Zhanjiang) for allowing us to publish this article and for providing the samples.
Conflict of interest
The authors declare that the research was conducted in the absence of any commercial or financial relationships that could be construed as a potential conflict of interest.
Publisher’s note
All claims expressed in this article are solely those of the authors and do not necessarily represent those of their affiliated organizations, or those of the publisher, the editors and the reviewers. Any product that may be evaluated in this article, or claim that may be made by its manufacturer, is not guaranteed or endorsed by the publisher.
References
Barker S., Zhang X., Jonkers L., Lordsmith S., Conn S., Knorr G. (2021). Strengthening Atlantic inflow across the Mid-Pleistocene Transition. Paleoceanogr. Paleoclimatol. 36, 1–23, e2020PA004200. doi: 10.1029/2020PA004200
Boulay S., Colin C., Trentesaux A., Clain. S., Liu Z., Lauer-Leredde C. (2007). Sedimentary responses to the Pleistocene climatic variations recorded in the South China Sea. Quaternary Res. 68, 162–172. doi: 10.1016/j.yqres.2007.03.004
Boulay S., Colin C., Trentesaux A., Pluquet F., Bertaux J., Blamart D., et al. (2006). Mineralogy and sedimentology of Pleistocene sediment in the South China Sea (ODP Site 1144). Proc. Ocean Drilling Program Sci. Results 184, 1–21.
Chen G., Zheng H., Li J., Xie X., Mei X. (2007). Controlling dynamics of grain size composition of terrigenous sediments in the western South China Sea and its reflection on East Asian monsoon evolution. Chin. Sci. Bull. 52, 2768–2776.
Chen Q., Liu D., Chen Y., Shen X., Jiang J., Li X., et al. (2013). Comparative analysis of grade- standard deviation method and factors analysis method for environmental sensitive factor analysis. Earth Environ. 41, 319–325.
Chen S., Steel R., Wang H., Zhao R., Olariu C. (2019). Clinoform growth and sediment flux into late Cenozoic Qiongdongnan shelf margin, South China Sea. Basin Res. 32, 302–319. doi: 10.1111/bre.12400
Chen X., Feng X., Liu D., Zhuang Z., Wu Z., Zhao M. (2002). Correlation comparison between laser method and pipette-sieve method of grain size. J. Ocean Univ. Qingdao 32, 608–614.
Cheng L., Song Y., Li Y., Zhang Z. (2018). Preliminary application of grain size end member model for dust source tracing of Xinjiang loess and paleoclimate reconstruction. Acta Sedimentologica Sin. 36, 1148–1156.
Clark P. U., Archer D., Pollard D., Blum J. D., Rial J. A., Brovkin V., et al. (2006). The middle Pleistocene transition: characteristics, mechanisms, and implications for long-term changes in atmospheric pCO2. Quaternary Sci. Rev. 25, 3150–3184. doi: 10.1016/j.quascirev.2006.07.008
Clift P. D. (2006). Controls on the erosion of Cenozoic Asia and the flux of clastic sediment to the ocean. Earth Planetary Sci. Lett. 241, 571–580. doi: 10.1016/j.epsl.2005.11.028
Clift P. D., Hodges K. V., Heslop D., Hannigan R., Long H. V., Calves G. (2008). Correlation of Himalayan exhumation rates and Asian monsoon intensity. Nat. Geosci. 1, 875–880. doi: 10.1038/ngeo351
Clift P. D., Wan S., Blusztajn J. (2014). Reconstructing chemical weathering, physical erosion and monsoon intensity since 25 Ma in the northern South China Sea: a review of competing proxies. Earth Sci. Rev. 130, 86–102. doi: 10.1016/j.earscirev.2014.01.002
Dietze E., Hartmann K., Diekmann B., IJmker J., Lehmkuh F., Opitz S., et al. (2012). An end-member algorithm for deciphering modern detrital processes from lake sediments of Lake Donggi Cona, NE Tibetan Plateau, China. Sedimentary Geol. 243-244, 169–180. doi: 10.1016/j.sedgeo.2011.09.014
Ding D., Li G., Xu J., Ding D., Li Q., Wang L., et al. (2017). Evolution of the Asian monsoon during the holocene. Earth Sci. Front. 24, 114–123.
Elderfield H., Ferretti P., Greaves M., Crowhurst S., McCave I. N., Hodell D., et al. (2012). Evolution of ocean temperature and ice volume through the mid-Pleistocene climate transition. Science 337, 704–709. doi: 10.1126/science.1221294
Fang G., Fang W., Fang Y., Wang K. (1998). A survey of studies on the South China Sea upper ocean circulation. Acta Oceanogr. Taiwan 37, 1–16.
Folk R. L., Ward W. C. (1957). Brazos river bar: A study in the significance of grain size parameters. J. Sedimentary Res. 27, 3–26. doi: 10.1306/74D70646-2B21-11D7-8648000102C1865D
Hao R., Yang Y., Zhu L., Zhu Y., Yuan X. (2023). Application of environmentally sensitive factors in Bay sedimentary environments. Acta Sedimentologica Sin. 41, 763–777.
Jin H., Jian Z. (2008). Comparision of climate changes between northern and southern South China Sea during the Mid-Pleistocene Climate Transition period. Quaternary Sci. 28, 381–390.
Li M. (2018). Paleoclimate and paleoenvironment evolutions in the northwestern South China Sea over the past 36 kyr BP and the forcing mechanisms. Beijing, China: University of Chinese Academy of Sciences, 55–66.
Li X., Ge J., Zhao X., Qi K., Jones B. G., Fang X. (2024). Geochemistry of Quaternary sediments in the northwestern South China Sea: Sediment provenance and mid-Pleistocene transition. Mar. Geol. 477, 107371. doi: 10.1016/j.margeo.2024.107371
Liu M., Li X., Han Z., Chen Y., Wang Y., Yuan X. (2021). Parametric end-member analysis of the grain size distribution of the Xiashu loess and its provenance tracing. J. Earth Environ. 12, 510–525.
Liu Z., Zhao Y., Colin C., Stattegger K., Wiesner M. G., Huh C., et al. (2016). Source-to-sink transport processes of fluvial sediments in the South China Sea. Earth Sci. Rev. 153, 238–273. doi: 10.1016/j.earscirev.2015.08.005
Liu Z., Zhao Y., Wang Y., Chen Q. (2017). Clay mineralogical proxy of the East Asian monsoon evolution during the Quaternary in the South China Sea. Quaternary Sci. 37, 921–933.
Luo Y. L., Sun X. J. (2012). Vegetation evolution in palynological records of deep-sea sediments in the northern South China Sea during 3.15-0.67 Ma and its response to global changes. Chinese Science Bulletin. 57, 2882-2891.
Ma C., Ge J.W., Zhao X.M., Liao J., Yao Z., Zhu J.T, et al. (2022). Quaternary Qiongdongnan Basin in South China Sea: Shelf-edge trajectory migration and deep-water depositional models. Earth Science Frontiers. 29, 55–72.
Miller K. G., Kominz M. A., Browning J. V., Wright J. D., Mountain G. S., Katz M. E., et al. (2005). The Phanerozoic record of global sea-level change. Science 310, 1293–1298. doi: 10.1126/science.1116412
Paterson G. A., Heslop D. (2015). New methods for unmixing sediment grain size data. Geochem. Geophy. Geosystems 16, 4494–4506. doi: 10.1002/2015GC006070
Qu H., Huang B. (2019). Paleoclimate change reflected by element ratios of terrigenous sediments from deep sea oxygen isotope MIS6 to MIS5 at MD12-3432 station in northern South China Sea. Earth Sci. Front. 26, 236–242.
Shen X., Chu Z., Wang Y., Li Y., Miao A., Liang W. (2015). Sensitive grain size and its environmental significance of modern mud patches in southern and northern parts of the Yellow Sea. Acta Sedimentologica Sin. 33, 124–133.
Su K., Gao M., Hu Z., Wang N., Huang B. (2021). Reconstruction of upper water structure in the northern South China Sea since 400ka based on planktonic foraminiferal assemblages and its response to the East Asian monsoon. Quaternary Sci. 41, 1607–1618.
Sun Y., An Z., Clemens S. C., Bloemendal J., Vandenberghe J. (2010). Seven million years of wind and precipitation variability on the Chinese Loess Plateau. Earth Planetary Sci. Lett. 297, 525–535. doi: 10.1016/j.epsl.2010.07.004
Sun Y., Gao S., Li J. (2003). Preliminary analysis of environmentally sensitive grain size components in marginal Marine terrigenous materials. Chin. Sci. Bull. 48, 83–86.
Sun H., Zang S., Sun D., Zhang K., Sun L. (2018). Grain-size characteristics and their environmental significance of Hulun Lake sediments. Scientia Geographica Sin. 38, 1570–1578.
Teng S., Feng X., Tian D., Jiang B., Wang X., Jiang J. (2018). Sensitive grain size components and their environmental singnificance of sediment in the Shandong Peninsula. Periodical Ocean Univ. China 48, 71–81.
Tian X., Xu F.J., Xu W., Liu X.L. (2015). 4400-yr East Asian monsoon record from sediments in the continental shelf of the northern South China Sea. Marine Sciences. 39, 62-68.
Tuo S. (2008). High-resolution sedimentological records and paleoclimate studies of the Middle Pleistocene climate transition in the northern South China Sea. Shanghai, China: Tongji University, 41–46.
Visher G. S. (1969). Grain size distributions and depositional processes. J. Sedimentary Res. 39, 1074–1106.
Wan S., Tian J., Steinke S., Li A., Li T. (2010). Evolution and variability of the east Asian summer monsoon during the Pliocene evidence from clay mineral records of the south china sea. Palaeogeography Palaeoclimatology Palaeoecology. 293, 237–247. doi: 10.1016/j.palaeo.2010.05.025
Wan S., Li A., Clift P. D., Jiang H. (2006). Development of the East Asian summer monsoon: Evidence from the sediment record in the South China Sea since 8.5 Ma. Palaeogeogr. Palaeoclimatol. Palaeoecol. 241, 139–159. doi: 10.1016/j.palaeo.2006.06.013
Wan S., Li A., Clift P. D., Stuut J. B. W. (2007a). Development of the East Asian monsoon: Mineralogical and sedimentologic records in the northern South China Sea since 20 Ma. Palaeogeogr. Palaeoclimatol. Palaeoecol. 254, 561–582. doi: 10.1016/j.palaeo.2007.07.009
Wan S., Li A., Jan-Berend W., Stuut J. B., Xu F. (2007b). Grain size of ODP1146 station in the northern South China Sea reveals the evolution of East Asian monsoon since last 20Ma. Sci. China Earth Sci. 37, 761–770.
Wang L., Sarnthein M., Erlenkeuser H., Grimalt J., Grootes P., Heilig S., et al. (1999). East Asian monsoon climate during the Late Pleistocene: high-resolution sediment records from the South China Sea. Mar. Geol. 156, 245–284. doi: 10.1016/S0025-3227(98)00182-0
Xia H., Li X., Shi M. (2001). Three-D numerical simulation of wind-driven current and density current in the Beibu Gulf. Acta Oceanol. Sin. 20, 455–472.
Xiang R., Yang Z., Huo Z., Satio Y., Fan D., Xiao S., et al. (2005). Paleoenvironmental implications of grain-size component variations in the mud area southwest off Cheju Island, ECS. Earth Science-Journal China Univ. Geosci. 30, 582–588.
Xie X., Zheng H.B., Qiao P.J (2014). Millennial climate changes since MIS 3 revealed by element records in deep-sea sediments from northern South China Sea. Chinese Science Bulletin. 59, 776–784. doi: 10.1007/s11434-014-0117-9
Yang W., Zheng H., Wang K., Xie X., Chen G., Mei X. (2007). Sedimentary characteristics of terrigenous clast of site MD05-2905 in the northeastern part of South China Sea after 36 ka and evolution of East Asian monsoon. Adv. Earth Sci. 22, 1012–1018.
Yang W., Zheng H., Xie X., Zhou B., Cheng X. (2008). East Asian summer monsoon maximum records in northern South China Sea during the early Holocene. Quaternary Sci. 28, 425–430.
Yi L., Yu H., Ortiz J. D., Xu X., Chen S., Ge J., et al. (2012). Late Quaternary linkage of sedimentary records to three astronomical rhythms and the Asian monsoon, inferred from a coastal borehole in the south Bohai Sea, China. Palaeogeogr. Palaeoclimatol. Palaeoecol. 329, 101–117. doi: 10.1016/j.palaeo.2012.02.020
Yu S., Colman S. M., Li L. (2016). BEMMA: A hierarchical Bayesian end- member modeling analysis of sediment grain size distributions. Math. Geosci. 48, 723–741. doi: 10.1007/s11004-015-9611-0
Zhang B. (2015). Grain size distribution and sedimentary environment evolution in northern South China Sea slope since Pleistocene. Qingdao, China: Ocean University of China, 17–54.
Zhao R., Chen S., Olariu C., Steel R., Zhang J., Wang H. (2019). A model for oblique accretion on the South China Sea margin; Red River (Song Hong) sediment transport into Qiongdongnan Basin since Upper Miocene. Mar. Geol. 416, 106001. doi: 10.1016/j.margeo.2019.106001
Zhao L., Peng X., Zhong H., Cai G., Li B., Li S., et al. (2016). Characteristics of grain size distribution of surface sediments and depositional environments in the northern shelf region of the South China Sea. Mar. Geol. Quaternary Geol. 30, 111–122.
Keywords: grain size characterization, environmentally sensitive components, depositional environments, Quaternary, Northwestern South China Sea
Citation: Ge J, Li Q, Zhao X, Pang W, Fan Q, Cheng X and Zhang X (2024) Grain size of Quaternary sediments in the continental shelf-margin: implications for paleo-environment in the Northwestern South China Sea. Front. Mar. Sci. 11:1489786. doi: 10.3389/fmars.2024.1489786
Received: 01 September 2024; Accepted: 30 October 2024;
Published: 22 November 2024.
Edited by:
Ce Wang, Sun Yat-sen University, ChinaReviewed by:
Pengfei Ma, Tongji University, ChinaKunwen Luo, Sun Yat-sen University, Zhuhai Campus, China
Copyright © 2024 Ge, Li, Zhao, Pang, Fan, Cheng and Zhang. This is an open-access article distributed under the terms of the Creative Commons Attribution License (CC BY). The use, distribution or reproduction in other forums is permitted, provided the original author(s) and the copyright owner(s) are credited and that the original publication in this journal is cited, in accordance with accepted academic practice. No use, distribution or reproduction is permitted which does not comply with these terms.
*Correspondence: Jiawang Ge, Z2p3ZGRuQDE2My5jb20=; Xiaoming Zhao, emh4aW05OEAxNjMuY29t
 Jiawang Ge
 Qingping Li1
 Xiaoming Zhao