- 1State Key Laboratory of Estuarine and Coastal Research, School of Marine Sciences, and Institute of Eco-Chongming, East China Normal University, Shanghai, China
- 2School of Mathematical Sciences, East China Normal University, Shanghai, China
- 3School of Geography and Ocean Science, Nanjing University, Nanjing, China
Light is essential for phytoplankton photosynthesis and many other biogeochemical processes in the aquatic system. However, light regimes vary greatly in the estuaries and coasts due to the optical complexity of the Case-2 waters. In this study, observed vertical profiles of photosynthetically active radiation (PAR; 400-700 nm) in a highly turbid mega estuary, the Changjiang (Yangtze River) Estuary, are used to quantify the effects of sedimentary and biogeochemical components on PAR attenuation in the water column and associated ecological impacts. The in-situ data suggest suspended sediment plays the most crucial role in light diffuse attenuation coefficient (Kd) distribution, followed by salinity (i.e., an index for colored dissolved organic matter) and phytoplankton chlorophyll-a. A new parameterization of Kd, based on suspended sediment, chlorophyll-a concentration, and salinity, is fitted using multiple linear regression. The previous and new Kd parameterizations are further applied to a coupled hydrodynamics-sediment-ecosystem model to simulate spring phytoplankton blooms. Comparative model runs reveal that the new Kd parameterization resulted in a better representation of the spring bloom patterns in magnitude, horizontal distribution, and vertical thickness of the high chlorophyll-a band offshore the turbidity maximum zone during the spring bloom. In summary, accurate representations of underwater light fields in the optically complex Case-2 water are critical in understanding biophysical processes that control planktonic ecosystem dynamics in the estuaries and coastal seas.
1 Introduction
Light is essential for plant photosynthesis in the aquatic ecosystem. It is a key limiting factor for primary productivity and affects phytoplankton species composition (Jones and Gowen, 1990; Van Duin et al., 2001). Quantifying underwater light distribution is a prerequisite for understanding the function of aquatic ecosystems and remote sensing applications. The effective spectral component of solar radiation used by plant photosynthesis is photosynthetically active radiation (PAR), with wavelengths of 400-700 nm (Kirk, 2010). PAR attenuates with water depth due to the absorption and scattering of light in the medium (Kirk, 2010). There has been a long history of marine optics (e.g., Jones and Wills, 1956; Paulson and Simpson, 1977; Cloern, 1987), but in general, exponential decay is followed in optically homogeneous water bodies according to the Beer-Lambert Law (Kirk, 2010). The vertical attenuation coefficient for downward irradiance of PAR at a given depth in the euphotic zone can be regarded as the sum of a set of partial attenuation coefficients due to multiple constituents in the natural water, such as suspended sediment, phytoplankton chlorophyll-a, colored dissolved organic matter (CDOM) and other materials (Xu et al., 2005). The relative contribution of those constituents to diffuse attenuation varies substantially among regions, especially in estuarine and coastal waters (e.g., Williamson et al., 1996; Kirk, 2010; Christian and Sheng, 2003; Golubkov and Golubkov, 2023).
The Changjiang (Yangtze River) is one of the largest rivers in the world and discharges tremendous amounts of freshwater and organic and inorganic matter into the East Asian marginal seas (Milliman and Farnsworth, 2011). As freshwater flows into the sea, it forms river plumes due to its significant density and momentum differences compared to adjacent seawater. In summer, the river plume or Changjiang diluted water (CDW) forms a bulge and expands in two directions at the same time: a major branch expands to the northeast direction in the form of the surface-advected plume, and a secondary branch runs southward along the coast (Beardsley et al., 1985). CDW mainly flows southward along the coast in winter, forming a narrow and long dilution zone, a typical bottom-trapped plume (Yankovsky and Chapman, 1997; Wu and Wu, 2018). In addition, a turbidity maximum zone (TMZ) exists in the Changjiang Estuary and strongly attenuates underwater light (Wu et al., 2012). Offshore the TMZ, suitable light and nutrient conditions allow phytoplankton to proliferate, form phytoplankton blooms, and sometimes harmful algal blooms (HABs) occur (Figure 1A; Wang et al., 2019a, Wang et al., 2023; Li et al., 2021; Xu et al., 2024). The ecosystem dynamics are intrinsically related to physical processes, which strongly fluctuate over multiple time scales. Besides the seasonal shift of CDW plume structures, materials transported with the plume also varied fortnightly or even daily due to tide forcings or solar radiation cycles (Desmit et al., 2005; Lucas, 2010; Lucas et al., 2006). For instance, the form and coverage area of TMZ varies with spring-neap tides (Du et al., 2022), therefore modulating underwater light conditions. A recent study suggested that resolving submesoscale vertical advection could increase summertime primary productivity by approximately 40% due to enhanced vertical nutrient resupply in this configuration (Meng et al., 2020). Other studies suggested that tidal variations of light availability significantly regulated the horizontal chlorophyll-a maximum (Wang et al., 2023; Xu et al., 2024). Despite the importance of light availability for coastal planktonic ecosystems, previous observation and modeling studies often utilized relatively simple underwater light parameterization (Zhao and Guo, 2011; Wang et al., 2019b; Ge et al., 2020; Li et al., 2021). Other studies derived diffuse attenuation coefficients for downwelling irradiance from the ocean color satellite product as a turbidity index (Meng et al., 2020). Moreover, light parameterization and relevant coefficients derived from other coastal systems may not directly apply to the Changjiang Estuary. The light distribution uncertainty may lead to errors in modeling phytoplankton primary production and standing stock in the optically complex Case-2 waters.
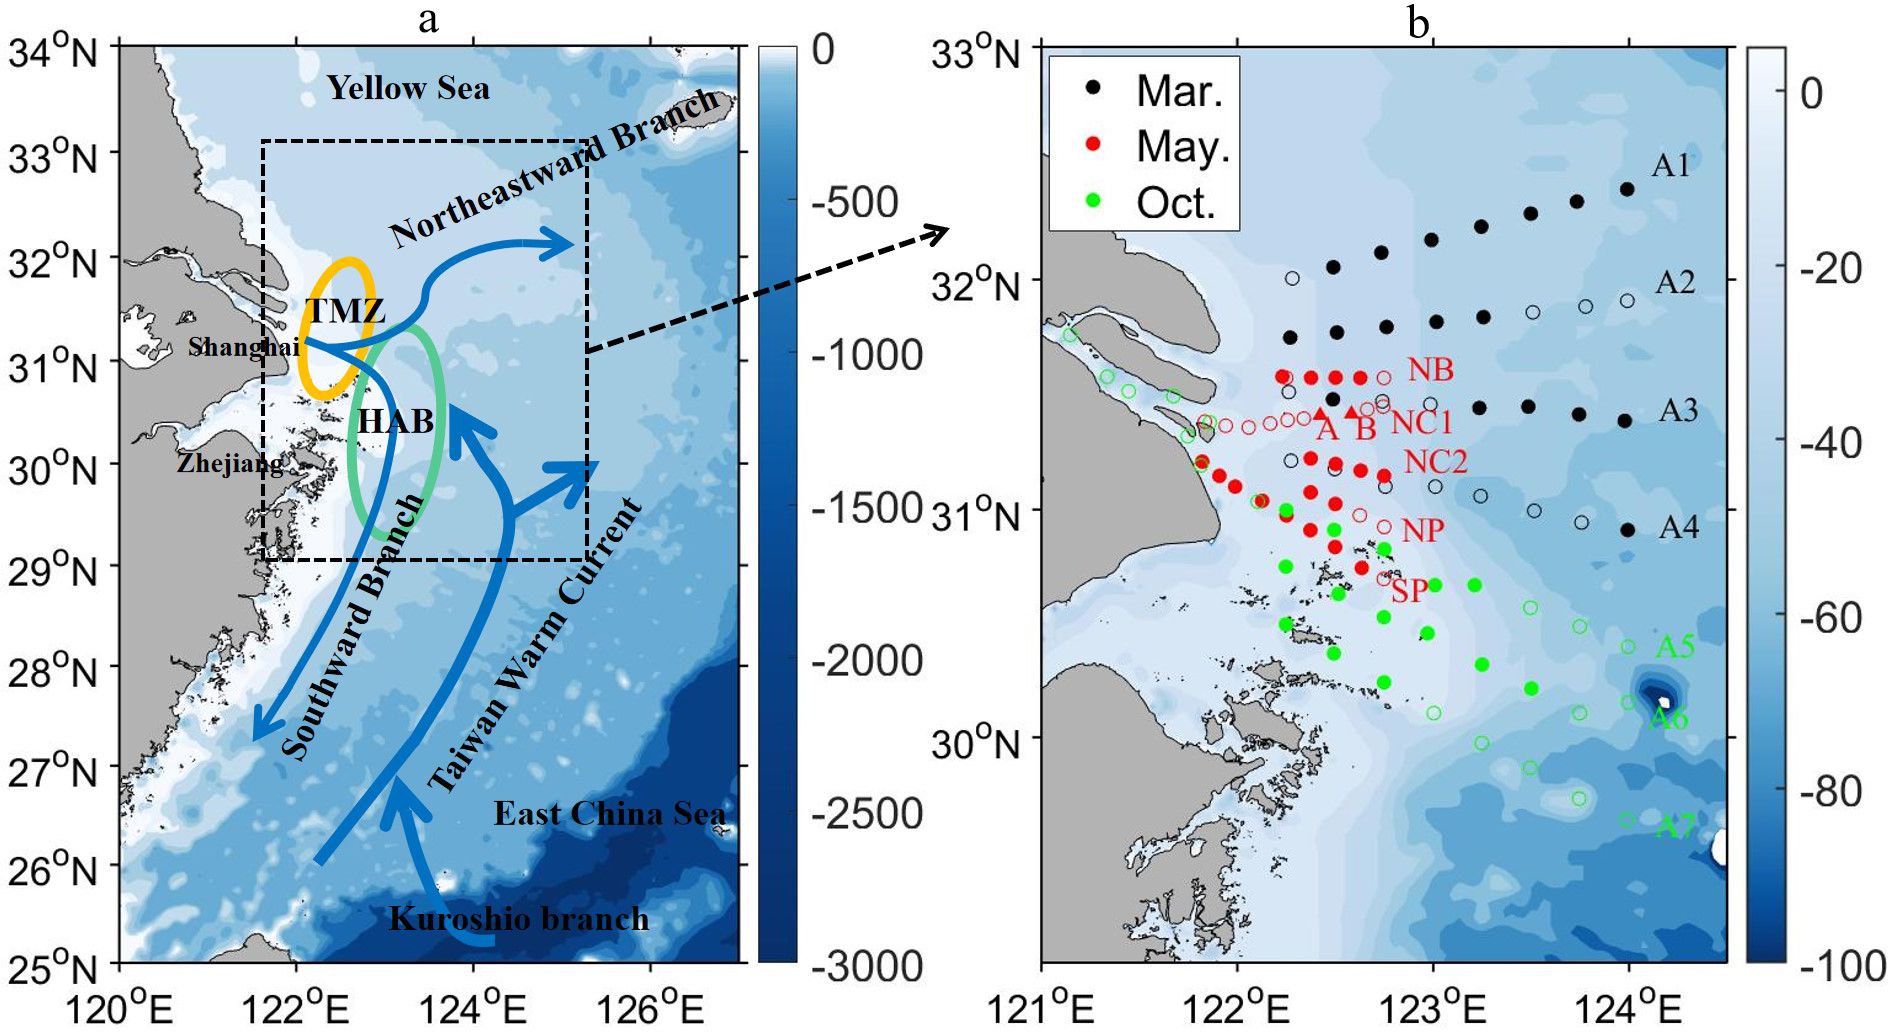
Figure 1. (A) Geographical location of Changjiang Estuary and adjacent shelf seas: the blue arrows represent major shelf circulation, the green circle represents the harmful algal bloom (HAB) region, and the orange circle represents the location of the turbidity maximum zone (TMZ); (B) Sampling stations of three cruises in 2021: the black, red and green dots indicate winter (March), spring (May), and fall (October) cruises, respectively. Solid and hollow dots represent daytime and nighttime observations. The background colors illustrate bathymetry.
To fill such a research gap, this study explores the relationships between water mass characteristics and light attenuation variations by analyzing in situ data across three seasons in the Changjiang Estuary. Furthermore, a new parameterization of light attenuation coefficient (Kd) that links spatially varying PAR attenuation with three major light-attenuating components (i.e., suspended sediment, phytoplankton chlorophyll-a, and CDOM) is derived from observations and validated against an independent data set. Last, the newly proposed light attenuation formula is applied to a 3-D hydrodynamics-sediment-ecosystem model to simulate spring phytoplankton blooms. Comparative modeling results using the new versus previous parameterization are analyzed. The sensitivity of planktonic ecosystems to light distribution in the estuaries and coasts is discussed.
2 Materials and methods
2.1 Field observations and laboratory analysis
The in-situ data analyzed in this study were obtained from three research cruises in 2021: March and October cruises through the “Shiptime Sharing Project” of the National Natural Science Foundation of China (Cruise number: NORC2021-03) and a May cruise funded by the Shanghai Municipal Education Commission (Figure 1B). At each station, an RBRmaestro3 multi-channel logger (RBR, Canada) was cast down from the ocean surface to 1-2 m above the seafloor. This profiling instrument vertically measured conductivity (salinity), temperature, pressure (depth), PAR (Licor Quantum LI-192SA), turbidity (Seapoint STM-S), and chlorophyll-a fluorescence (Turner Cyclops chlorophyll) at a sampling rate of 16 Hz. The PAR sensor applies a cosine correction according to Lambert’s Law, which provides accurate measurements of visible light (400–700 nm) on a plane from almost all directions up to 82° incident angle. During the May cruise, two fixed stations (A and B in Figure 1B) were deployed on May 13-15 and May 17-18, and each conducted 27 consecutive hourly measurements to capture tidal variations. Because light levels were low during nighttime, only daytime profiles were used for attenuation-related analysis (solid dots in Figure 1B). During the cruises, seawater samples were collected at multiple layers in the water column. The water samples were immediately filtered through 6 µm membranes, which were dried later in the laboratory to measure the mass of filtered sediment and calculate suspended sediment concentration (unit: g m-3).
2.2 Derivation of diffuse attenuation coefficients
The diffuse attenuation coefficients of PAR were calculated using in-situ profiles. We selected raw RBR profiles in the daytime (solid dots in Figure 1B) and conducted the following pre-processing procedures: removing outliers, low-pass filtering, and 1 m averaging and binning. The euphotic layer was defined as the upper water column with PAR(z) > 1.0 µMol/m2/s and PAR(z)/PAR0 > 1%, where PAR0 is the surface layer PAR (0-1 m average).
Assume that observed PAR profiles follow an exponential decay and optical properties in a small water column are homogeneous, Kd(PAR) for each 1 m water layer within the euphotic layer can be calculated using PAR values of the two neighboring layers:
where Kd(PAR) is the diffuse attenuation coefficient (unit: m-1), n represents the water layer number, and Δz is the depth difference between two neighboring water layers.
Sensor-output turbidity (unit: NTU) was linearly fitted to total suspended sediment (TSS; unit: g m-3) based on 70 water samples collected in the May cruise (R2 = 0.74; p< 0.01):
Because diffuse attenuation coefficients can be decomposed into a sum of contributions of individual light-scattering and/or absorbing constituents of the water, observed Kd(PAR) was fitted to one or a combination of multiple variables including total suspended sediment (TSS), phytoplankton concentration (chl-a; unit: mg m-3), and CDOM (salinity as a surrogate; unit: psu) based on linear or multilinear regressions. The relationships are listed below.
where kw is seawater-induced PAR attenuation coefficient (0.08 m-1; Kirk, 2010); kTSS is sediment-induced attenuation coefficient (i.e., particle scattering); k1 represents residual attenuation due to constituents other than water and sediment.
where kchla is the phytoplankton-induced PAR attenuation coefficient (i.e., absorption and shading); k2 represents residual attenuation due to constituents other than water, sediment, and phytoplankton.
In the coastal regions of freshwater influence, CDOM, which mainly originates from terrestrial sources, has a negative correlation with salinity in the Changjiang Estuary (Guo et al., 2007; Gao et al., 2012) and other coastal systems (e.g., Kowalczuk et al., 2003; Xu et al., 2005; Palacios et al., 2009; Golubkov and Golubkov, 2023). Therefore, salinity was used as a surrogate for CDOM in the multi-linear regression, similar to Xu et al. (2005):
where kb and ksal are salinity-related PAR attenuation coefficients (i.e., CDOM absorption); k3 represents residual attenuation due to constituents not represented in Equation 5.
Last, the profiles collected at two fixed stations in the May cruise (A and B in Figure 1B) were used as independent data to validate the above PAR attenuation relationships.
2.3 Coupled hydrodynamics-sediment-ecosystem model
The coupled hydrodynamics-sediment-ecosystem model is based on the Estuarine, Coastal, and Ocean Model semi-implicit (ECOM-si), which was initiated by Blumberg and Mellor (1987) and was further developed by researchers at the East China Normal University (Wu et al., 2011; 2014). The horizontal advection and vertical mixing processes utilized a 3rd-order HSIMT-TVD scheme (Wu and Zhu, 2010) and Mellor-Yamada Level-2.5 turbulent closure scheme (Mellor and Yamada, 1982), respectively. A suspended sediment transport model and an N2P2ZD (i.e., two types of nutrients, two phytoplankton groups, one zooplankton group, and one detritus) intermediate-complexity ecosystem model were coupled into the ECOM-si framework. The basic processes associated with the phytoplankton source to sink term were light- and nutrient-limited photosynthetic growth, phytoplankton respiration, mortality, and zooplankton grazing, following the transfer efficiency of the Redfield ratio. Model details of hydrography, hydrodynamics, sediment transport, and planktonic ecosystem module refer to Wu et al. (2011; 2014) and Wang et al. (2019b; 2023). Here, we only elaborate on light attenuation parameterization, which directly affects the efficiency of photosynthetic growth in the ecosystem model.
The model utilized ECMWF’s ERA-5 product to construct air-sea boundary conditions. A constant fraction (0.43) of incoming shortwave radiation is assumed to be PAR (W m-2). Light availability at depth (z) is calculated as:
where Kd is parameterized based on the total attenuation due to seawater and other light-attenuating constituents within the water (Equation 5). The spatial and temporal variability of light attenuation coefficients, influenced by hydrodynamics, sediment distribution and bio-optic, is explicitly modeled and represented by changing suspended sediment and chlorophyll-a concentrations, as well as salinity.
The curvilinear model mesh covers the East China Sea, Yellow Sea, Bohai Sea, southern East/Japan Sea, and a portion of the western Pacific Ocean (Figure 2A). The model was successfully applied in hydrodynamic and planktonic variations over multiple time scales in the Changjiang River Estuary. For example, the river plume and frontal dynamics of the Changjiang Estuary were well resolved using a high horizontal resolution of 0.5-1.0 km (Figure 2B; Wu et al., 2011; Wu and Wu, 2018). The model also captured seasonally varying suspended sediment and chlorophyll-a patterns (Wang et al., 2019b, Wang et al., 2023; Xu et al., 2024).
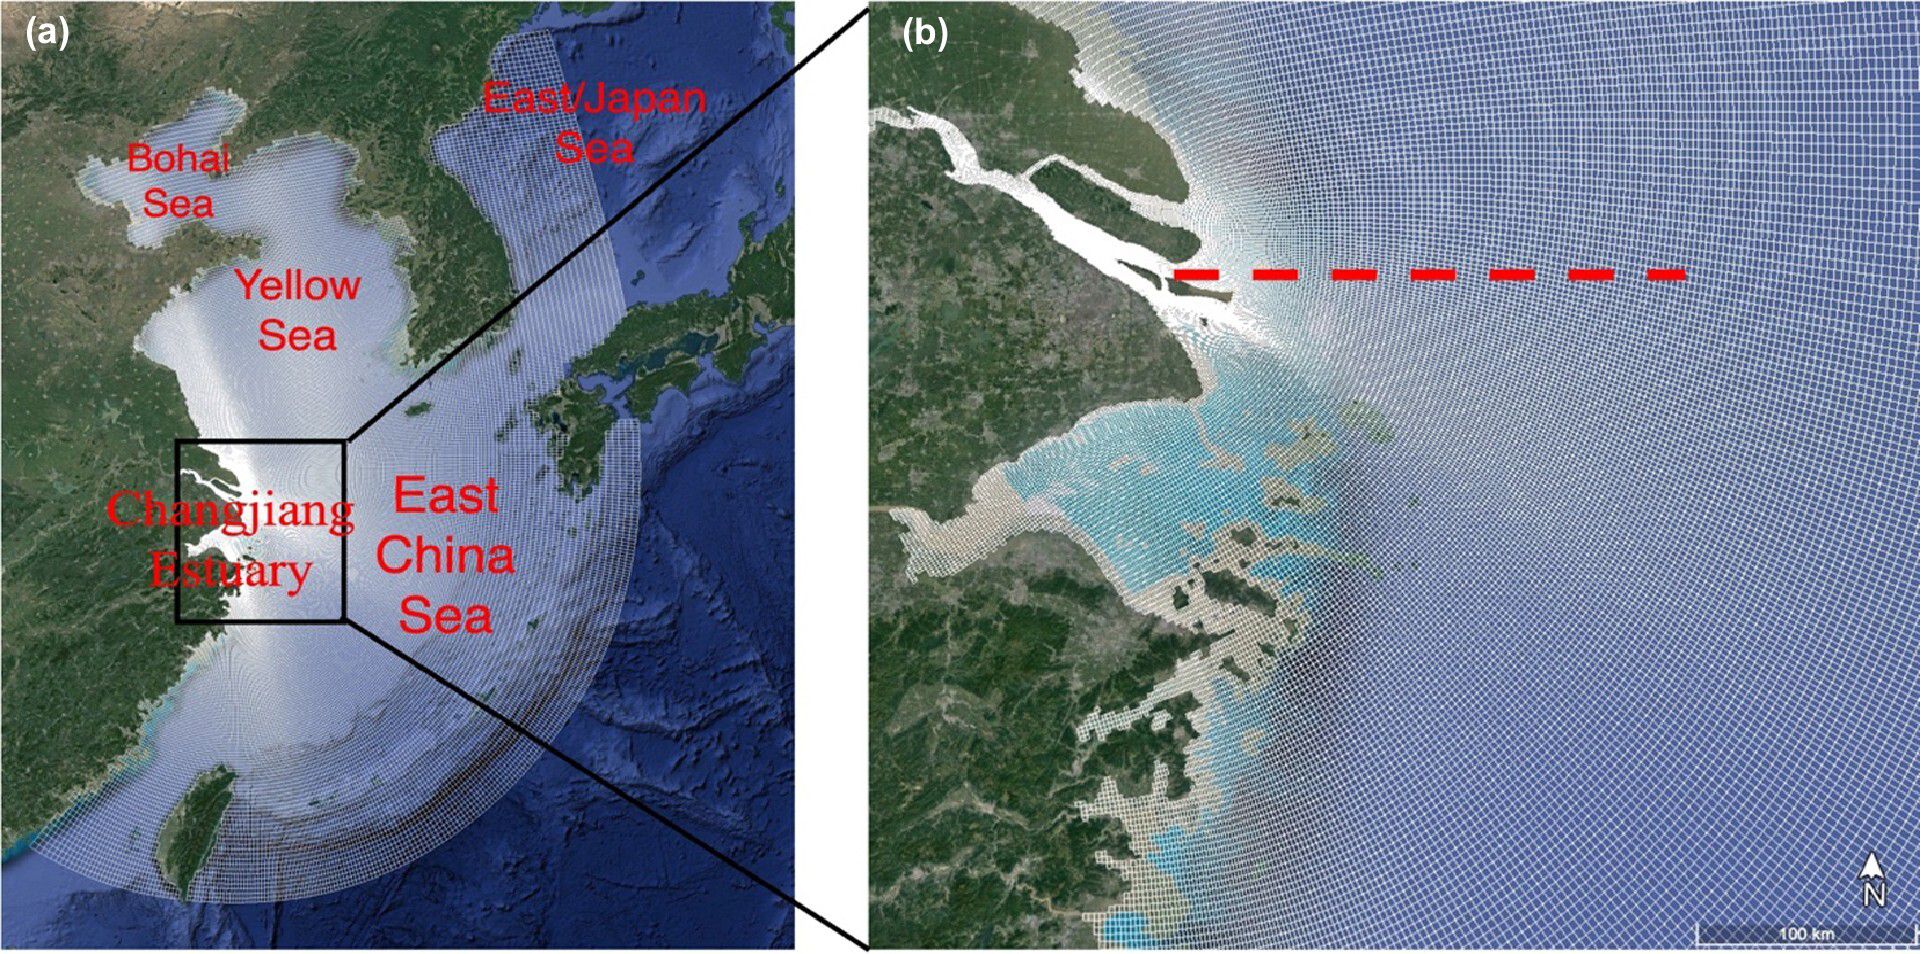
Figure 2. (A) Domain and computational mesh of the coupled hydrodynamics-sediment-ecosystem model (white curves); the black box contains core regions of Changjiang Estuary where model results are plotted. (B) Zoom-in view of Changjiang Estuary and adjacent shelf seas; the red dashed line is a representative transect for which model results are plotted. The background image is output from Google Earth Pro.
To illustrate the advantage of observation-guided light parameterization in coastal ecosystem modeling, we designed parallel runs using new versus previous light parameterization. All model conditions and settings were identical except for the light attenuation formula and coefficients. Our analyses focused on the spring phytoplankton bloom in May 2021, when extensive field data were collected. The newly developed light parameterization run was treated as a control run. We used hourly mean model results to quantify surface area, total volume, and mean thickness (H) of the high chlorophyll-a water masses in the Changjiang Estuary domain (Figure 2A black box), defined as model grids with chlorophyll-a concentrations greater than 5.0 μg L-1.
Model sensitivity experiments were designed to evaluate the effects of different combinations of suspended sediment, phytoplankton chlorophyll-a, and CDOM on modeled light and phytoplankton distributions. Six sets of parallel experiments were conducted by considering light attenuation due to (a) suspended sediment only, (b) phytoplankton chlorophyll-a only, (c) CDOM only, (d) suspended sediment and chlorophyll-a, (e) suspended sediment and CDOM, and (f) chlorophyll-a and CDOM.
3 Results
3.1 Observed seasonal variations of water mass characteristics
The estuarine environments have great seasonal variability, which responds to varying atmospheric, riverine, and oceanic conditions. We chose overlapping cross-shore transects in March and May to demonstrate the distinctive seasonality of water mass characteristics (Figure 3). The monthly mean river discharge measured at Datong Station was 19,783 ± 2,915 m3 s-1 in March and the discharge doubled (41,674 ± 10,876 m3 s-1) in May 2021. As a result, the upper water column was fresher in May than in March (Figures 3A, B). Low salinity water of 5 psu or less was present within 20 m isobath in May (Figure 3B), which stratified the water column due to increased buoyance input of river freshwater (Figure 3D). Water turbidity was much higher in March than in May, likely due to enhanced wave stirring and sediment resuspension in the wintertime (Figures 3E, F). In May, spring phytoplankton bloom was evident as high chlorophyll-a concentrations of 5.0 μg L-1 or more were observed in the upper 10 m water column and offshore 20 m isobath (Figure 3H).
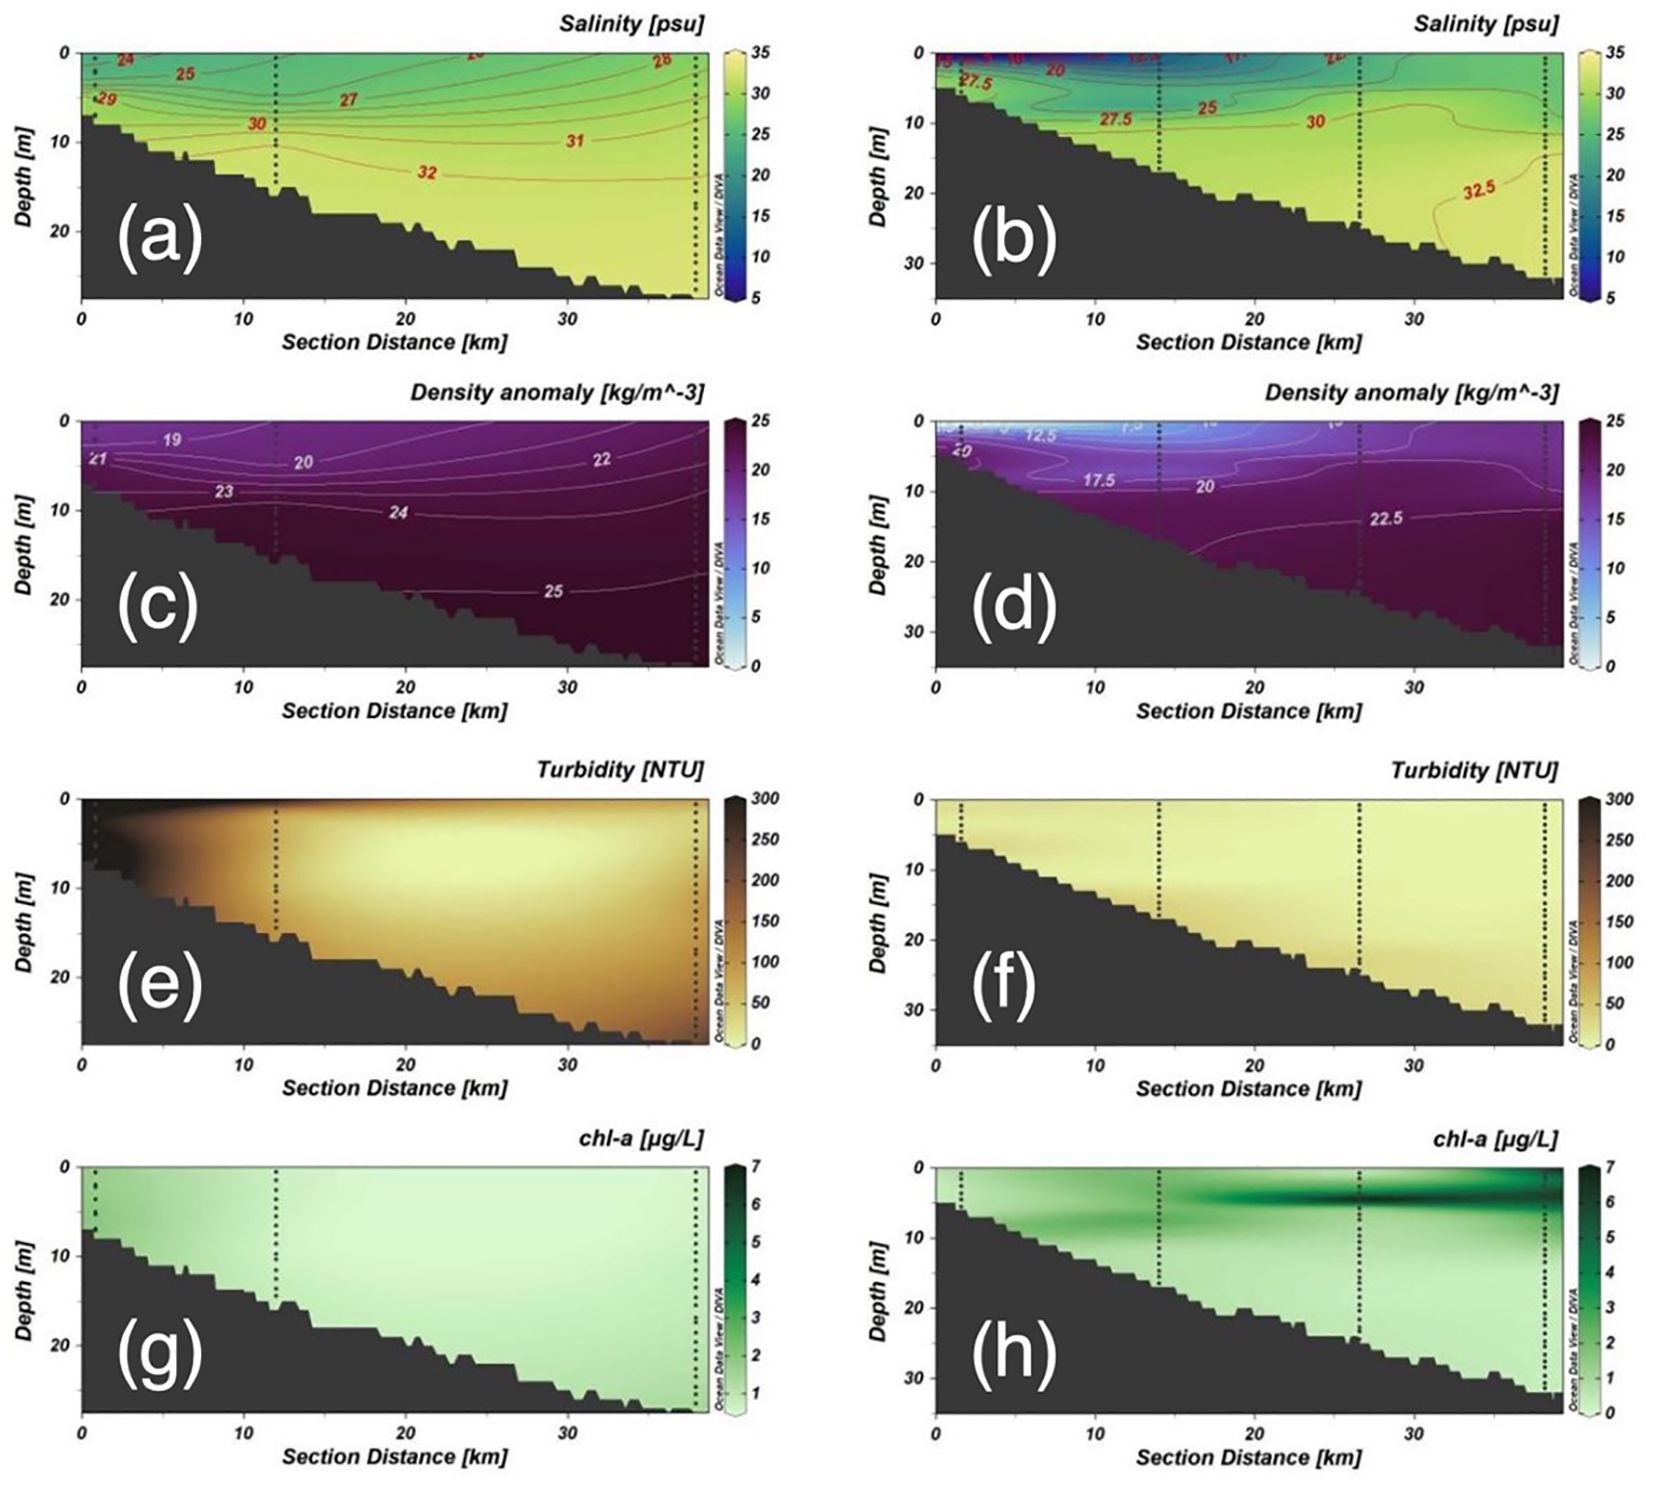
Figure 3. Cross-shore transects of in-situ observations in March (A, C, E, G) versus May (B, D, F, H): (A, B) salinity, (C, D) density anomaly; (E, F) turbidity, and (G, H) chlorophyll-a concentration. The vertical dashed lines indicate sampling station locations.
3.2 Parameterization of Kd based on observations
The diffuse attenuation coefficient Kd was linearly fitted to variables representative of light-absorbing and/or scattering constituents in the seawater. Suspended sediment was the most important one in light attenuation, as a single variable can explain nearly 80% of the total variance of Kd (Figure 4A). Adding phytoplankton chlorophyll-a as the second explanatory variable in the linear regression slightly increased the fitness (R2 = 0.82; Figure 4B). The best fit was achieved by using all three variables in the multi-linear regression, which together explained 87% of the total variance of Kd (Figure 4C). This best-fit relationship was further validated against measurements from two fixed stations during the May 2021 cruise and showed reasonably well data fitness (R2 = 0.81; Figure 4D).
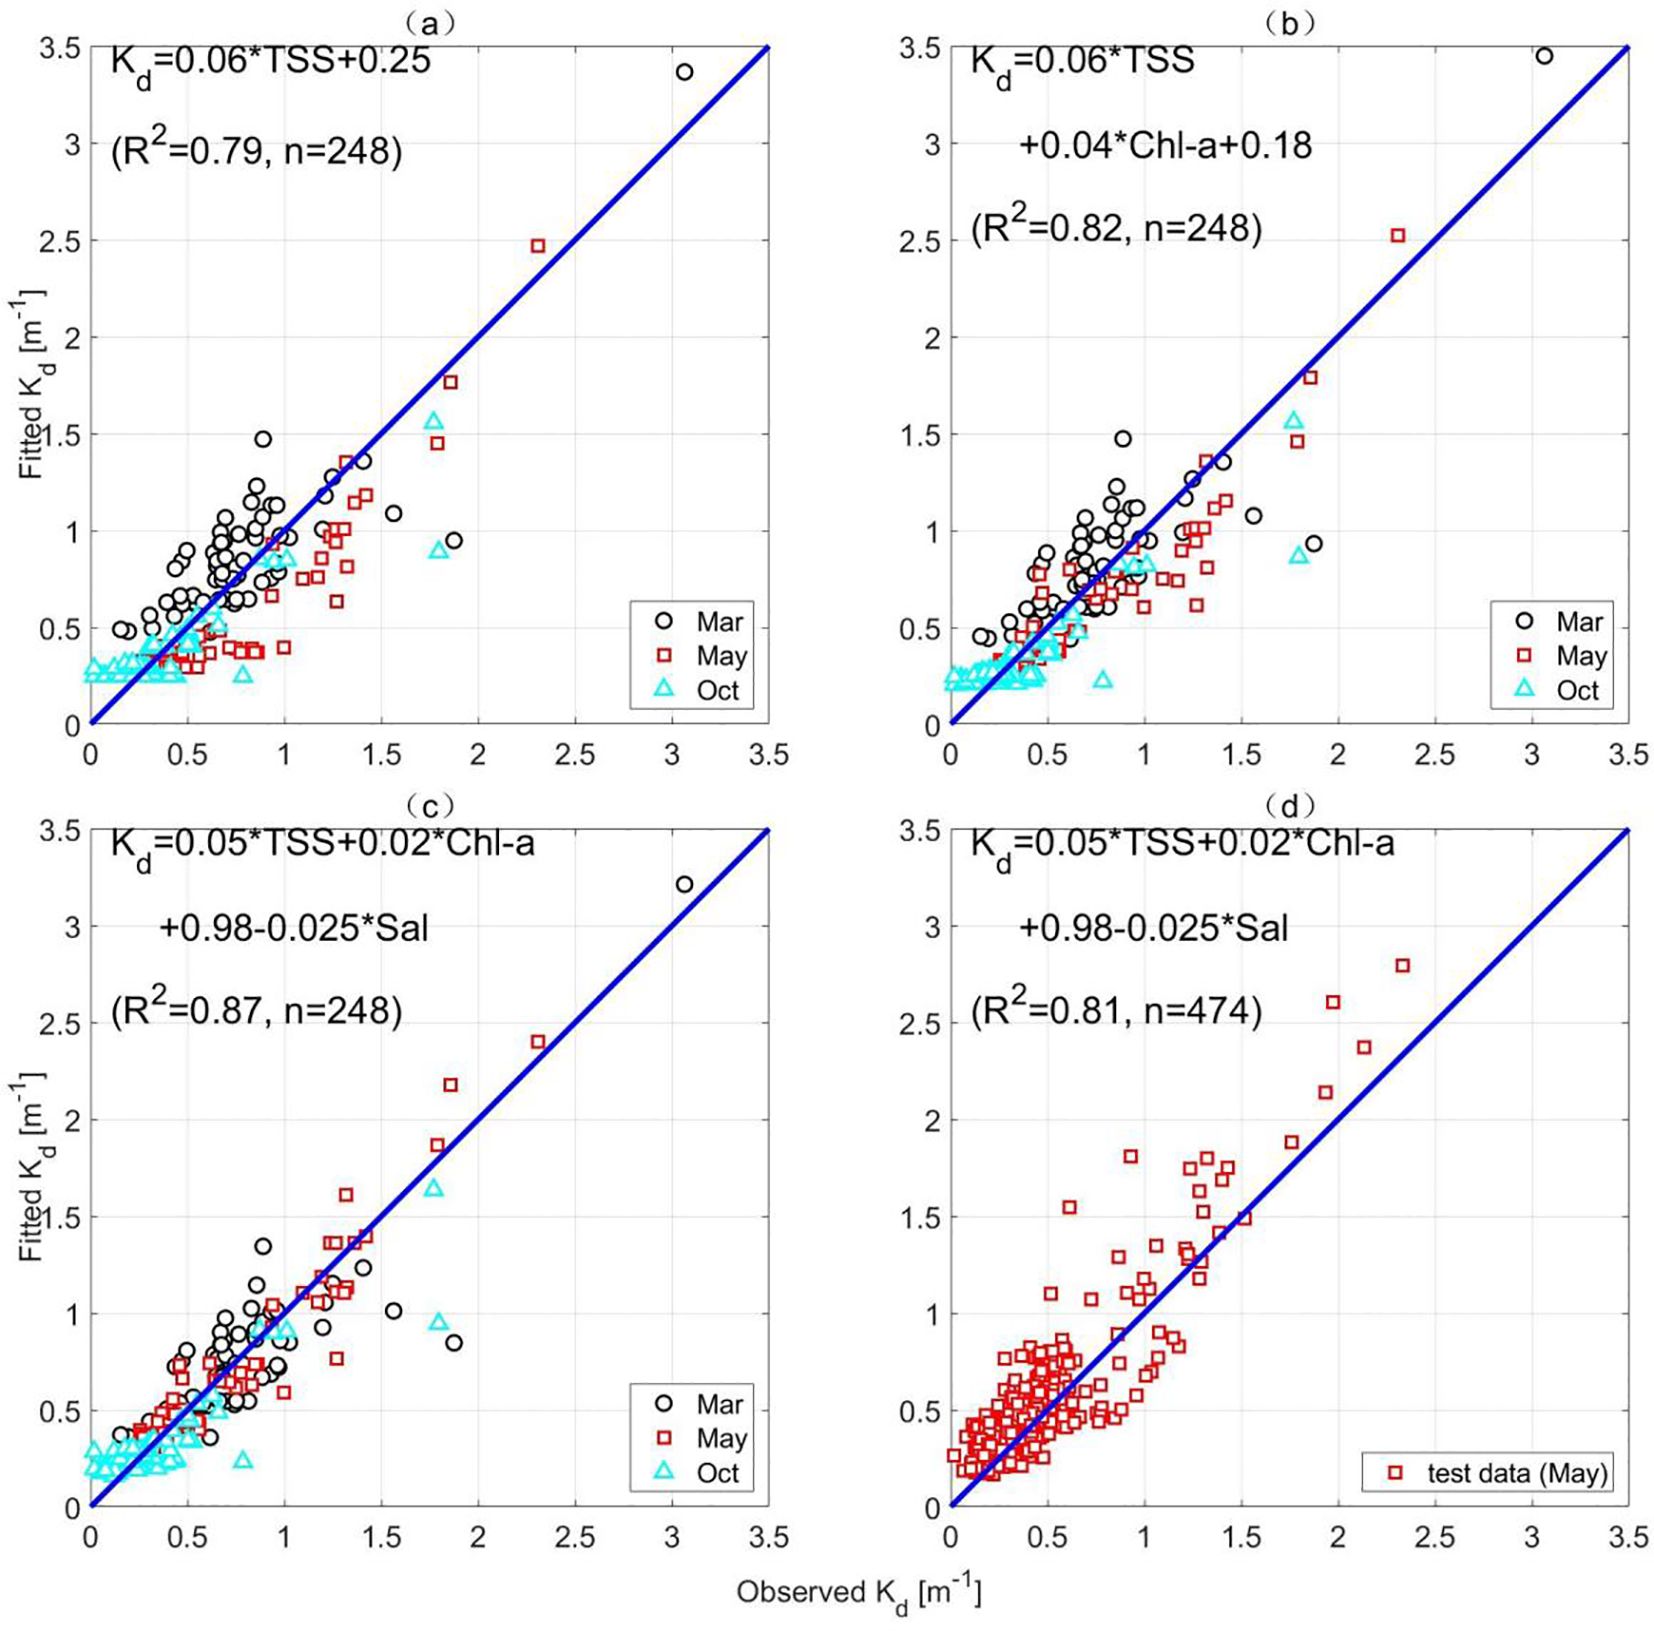
Figure 4. Diffuse attenuation coefficients of PAR, Kd(PAR), fitted to in-situ profiles: (A) Kd relationship with suspended sediment, (B) Kd relationship with suspended sediment and phytoplankton chl-a, (C) Kd relationship with suspended sediment, phytoplankton chl-a, and salinity (CDOM), and (D) validation of the best-fit relationship against an independent data set. The ranges of those variables are 0< TSS< 60.4 g m-3, 0< chl-a< 14.5 μg L-1, and 0< Sal< 33 psu.
To compare the relative importance of each light-attenuating constituent, their coefficients were normalized using a dimensionless method that converted those constituent values to 0-1 before multi-linear regression (see last column of Table 1). Again, suspended sediment is the most important constituent in light attenuation, and its normalized coefficient is 1-2 orders of magnitude higher than that of other constituents. CDOM is the second important variable in light attenuation, followed by chlorophyll-a and seawater.
3.3 Validation of modeled chlorophyll-a distributions
Due to extended periods of cloud cover in mid-May 2021, we used a relatively clear Geostationary Ocean Color Imager (GOCI-II) snapshot taken at 14:15 (Beijing time) on May 15th to validate model results (Figure 5C). The satellite-retrieved image illustrates a narrow band of high chlorophyll-a northeast-southwest-oriented along the coast. Although model results of both parameterizations show consistent patterns of high chlorophyll-a regions, the new parameterization (Figure 5A) demonstrates even higher chlorophyll-a values (up to 10 μg L-1) than the previous one (Figure 5B). The patterns of extremely high chlorophyll-a (>10 μg L-1) were also evident in the GOCI-II image (Figure 5C). As a comparison, the high- chlorophyll-a band using previous light parameterization is slighted wider and broader (Figure 5B).
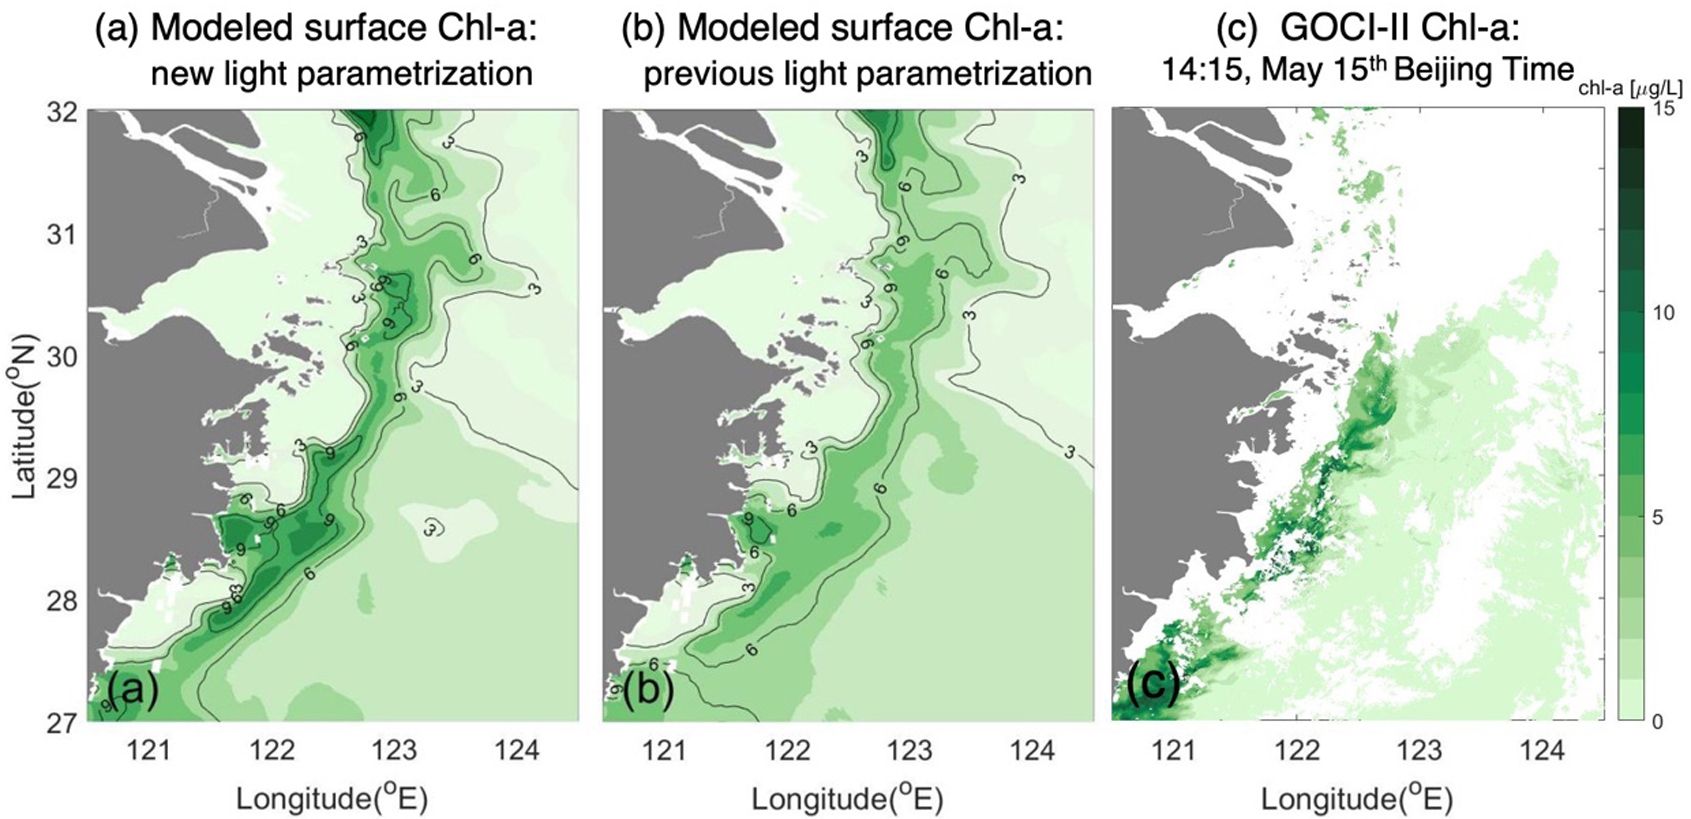
Figure 5. Modeled versus satellite-retrieved surface chlorophyll-a concentrations. (A, B) are modeled surface chlorophyll-a using new and previous light parameterization, respectively; (C) GOCI-II surface chlorophyll-a at 14:15, May 15th (Beijing Time).
3.4 Model results of spring bloom: new versus previous light parameterization
Different light attenuation parameterizations (see Table 1) resulted in different Kd distributions in May 2021. Because suspended sediment carried heavier weight in the new parameterization than the previous one, Kd values in the nearshore waters were larger, corresponding to relatively higher suspended sediment concentrations in the TMZ than offshore regions (red dashed contours in Figure 6). Kd values became much smaller outside TMZ, typically less than 1.0 m-1 (Figure 6). Those results indicated that light penetration was inhibited by suspended sediment within the TMZ, especially in the case of new light parameterization. Comparing Kd distributions of two light parameterizations, the previous one might have underestimated light attenuation and hence overestimated underwater light intensities for phytoplankton photosynthesis.
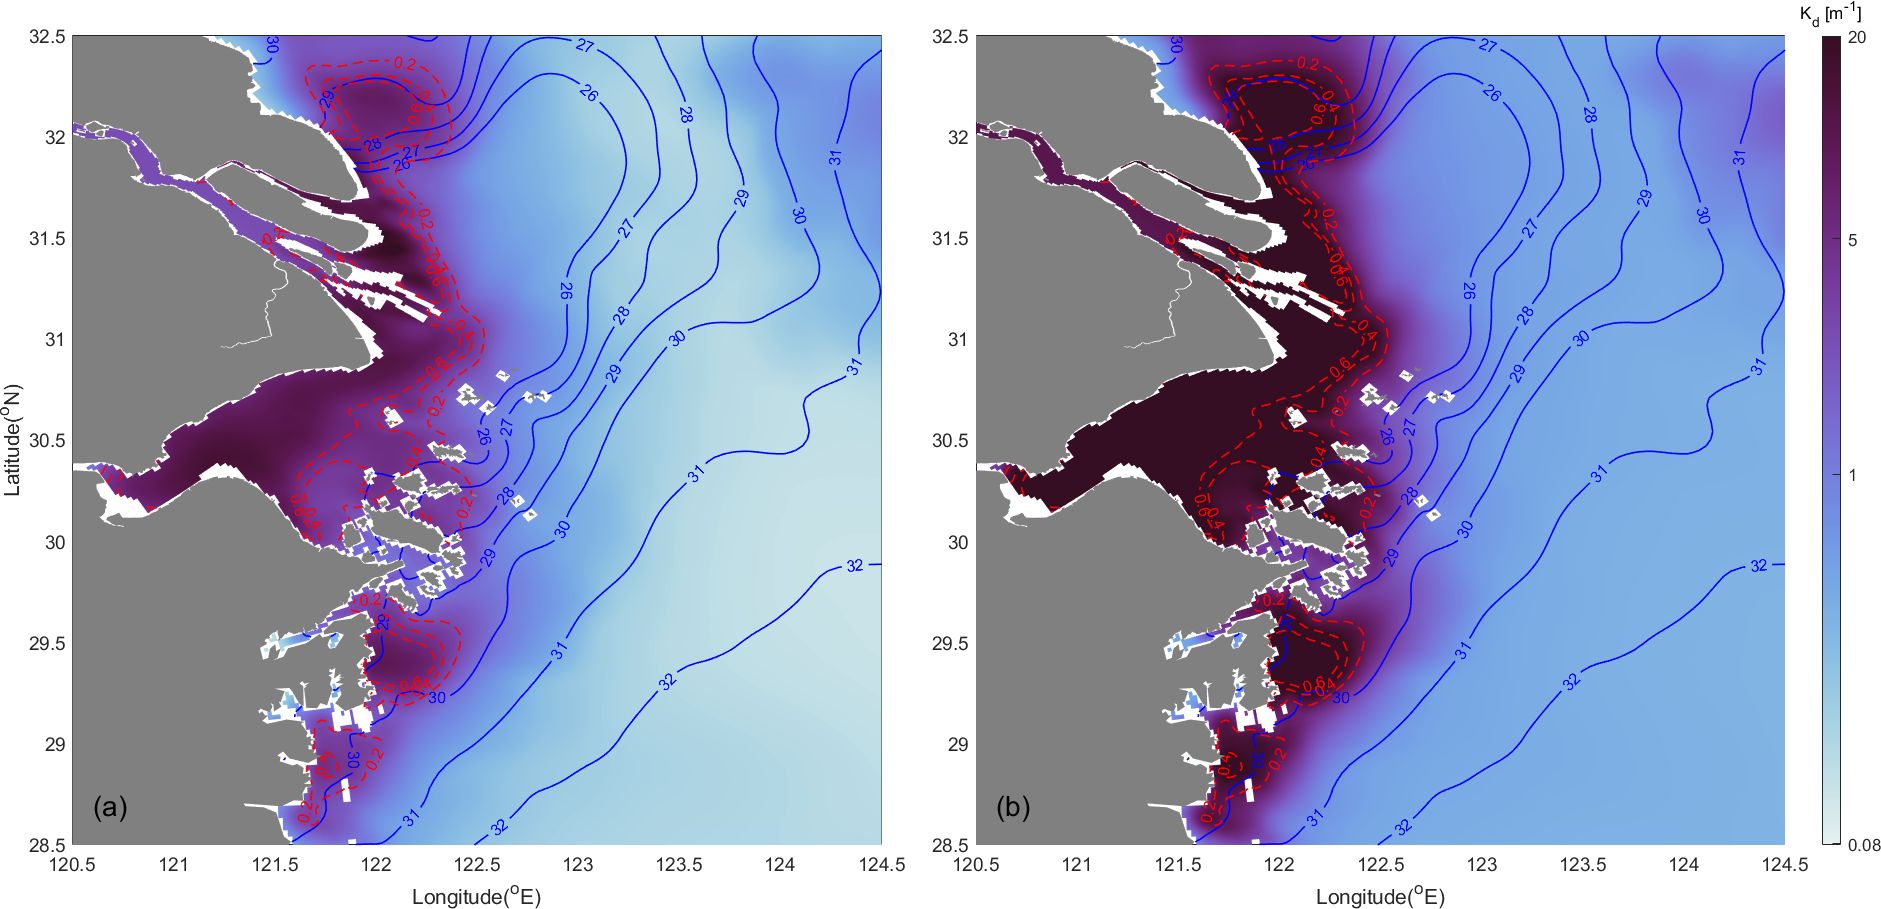
Figure 6. Distribution of modeled monthly mean light attenuation coefficient Kd at the sea surface using (A) previous parameterization and (B) new parameterization of this study. The red dashed and blue solid lines represent the contours of suspended sediment (g m-3) and salinity (psu).
The spring phytoplankton blooms in May 2021 were closely related to sedimentary and hydrographic processes that jointly control light and nutrient availability for phytoplankton photosynthesis (Figure 7A). High suspended sediment concentrations were confined within the nearshore TMZ (red contours in Figure 7A). Turbid waters strongly attenuated underwater light and formed a light-limiting zone for phytoplankton photosynthesis. The high chlorophyll-a band was just located offshore TMZ, where both light and nutrients were sufficient to sustain phytoplankton growth. The northern center of the high chlorophyll-a band corresponded to 26 psu isohaline or river plume regions. The southern center was parallel to 31 psu isohaline offshore Zhejiang Province, where riverine sources were less influential. Comparing model results of two light parameterizations, the previous light parameterization underestimated chlorophyll-a concentrations in the high chlorophyll-a band but had a general overestimation in other regions (Figure 7B).
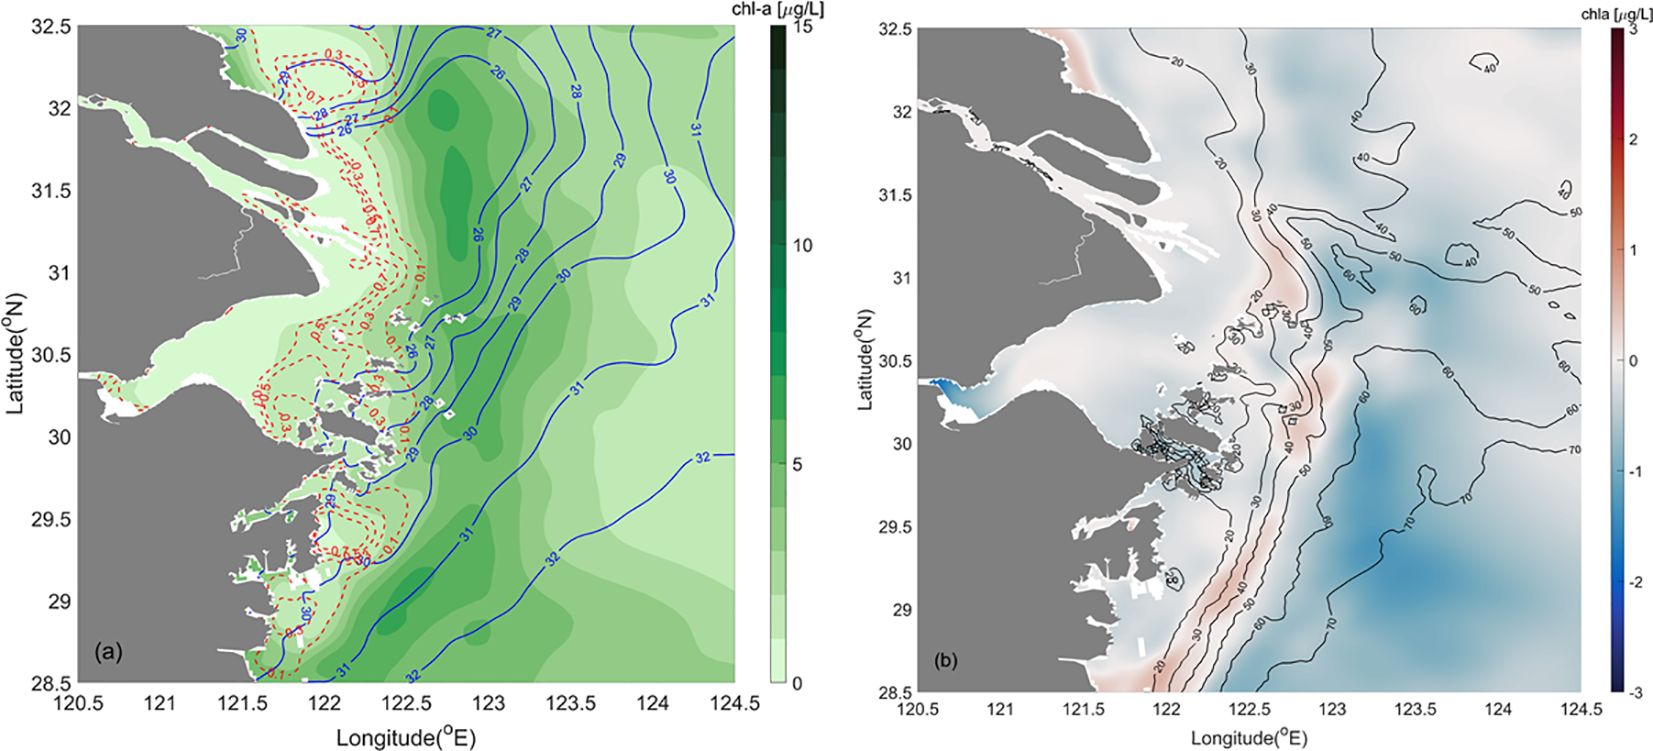
Figure 7. (A) Monthly mean (May 2021) model results in the sea surface. The green background color represents chlorophyll-a, and the red dashed and blue solid contours illustrate suspended sediment concentration and salinity, respectively. (B) Differences in modeled chlorophyll-a between new and previous light parameterizations. The color represents the differences, and the black contours are isobaths.
Light parameterization affects not only the horizontal distribution of the high chlorophyll-a band but also its vertical patterns. Chlorophyll-a concentrations observed along the NC-1 transect were plotted to compare with the model results (Figure 8). Overall, our model captured high chlorophyll-a patterns reasonably well. Both model and observations indicated that phytoplankton bloom was within the 0-15 m vertical range and centered at the 40 m isobath. The chlorophyll-a concentrations significantly decreased in the nearshore regions shallower than 15 m because of strong light limitation imposed by high suspended sediment concentrations. New parameterization led to slightly better phytoplankton biomass results than the previous one, as the chlorophyll-a patch had slightly higher values and deeper distributions.
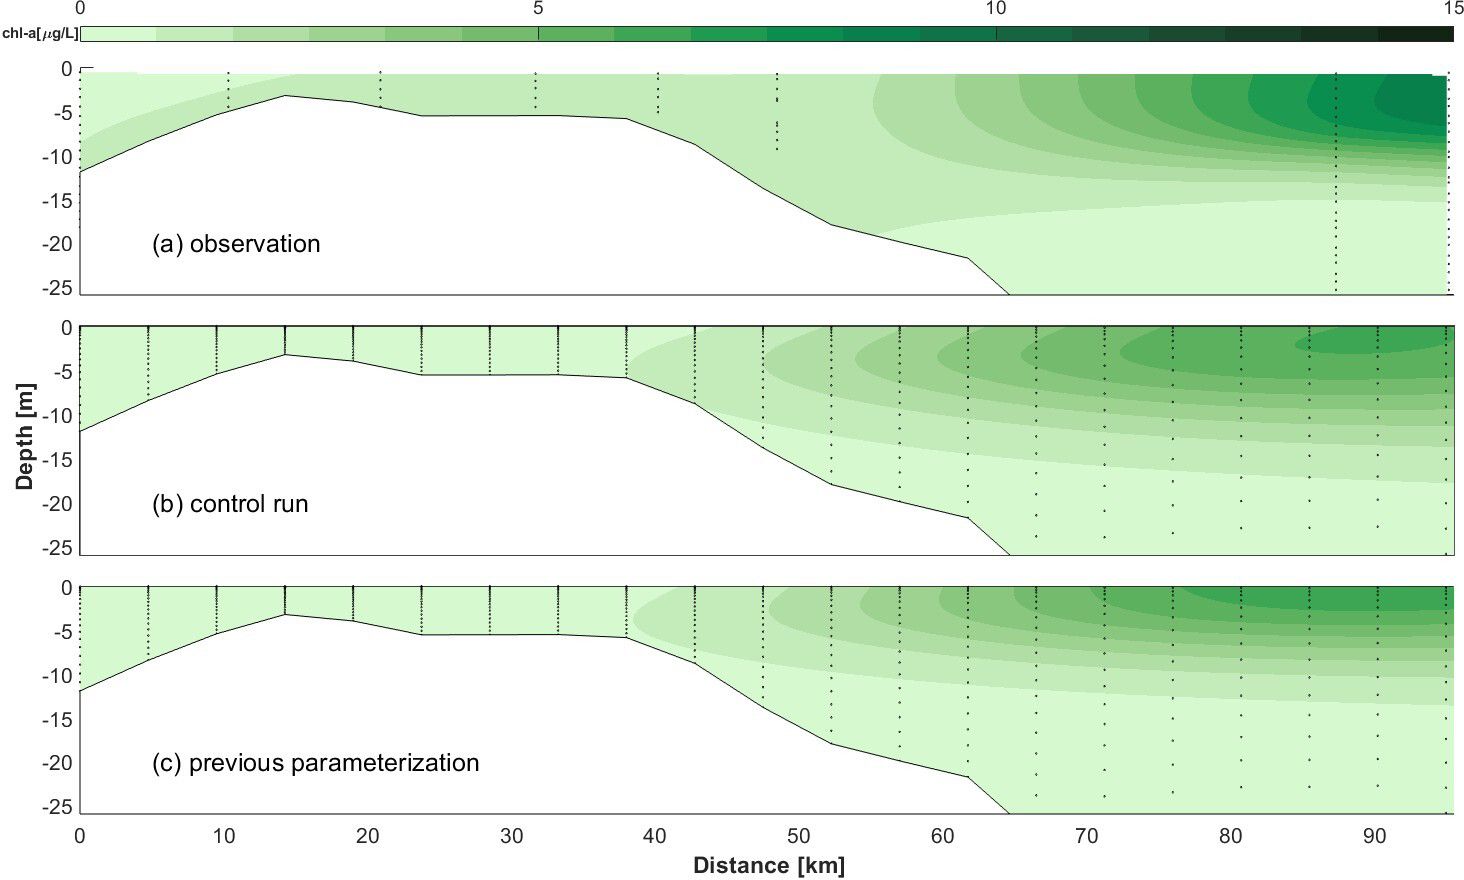
Figure 8. Observed versus modeled Transect NC-1 chlorophyll-a concentrations. (A) demonstrates observed chlorophyll-a concentrations of 8 vertical profiles. (B, C) are modeled chlorophyll-a along the same transect using new and previous light parameterization. The location of NC-1 is shown in Figure 1B.
We quantified the surface area, total volume, and mean thickness of the high chlorophyll-a water masses using the previous and new Kd parameterization (Figure 9). Although both runs had identical initial conditions, their time evolutions over May differed, especially in the growing phase. High chlorophyll-a water masses expanded faster in the new parameterization than the previous. The peak volume of nearly m3 in the control run tripled the previous parameterization. The thickness also steadily rose in the first five days and peaked at approximately 15.0 m on May 5 (Figure 9C). The thickness did not show a clear increasing trend in the run of previous light parameterization.
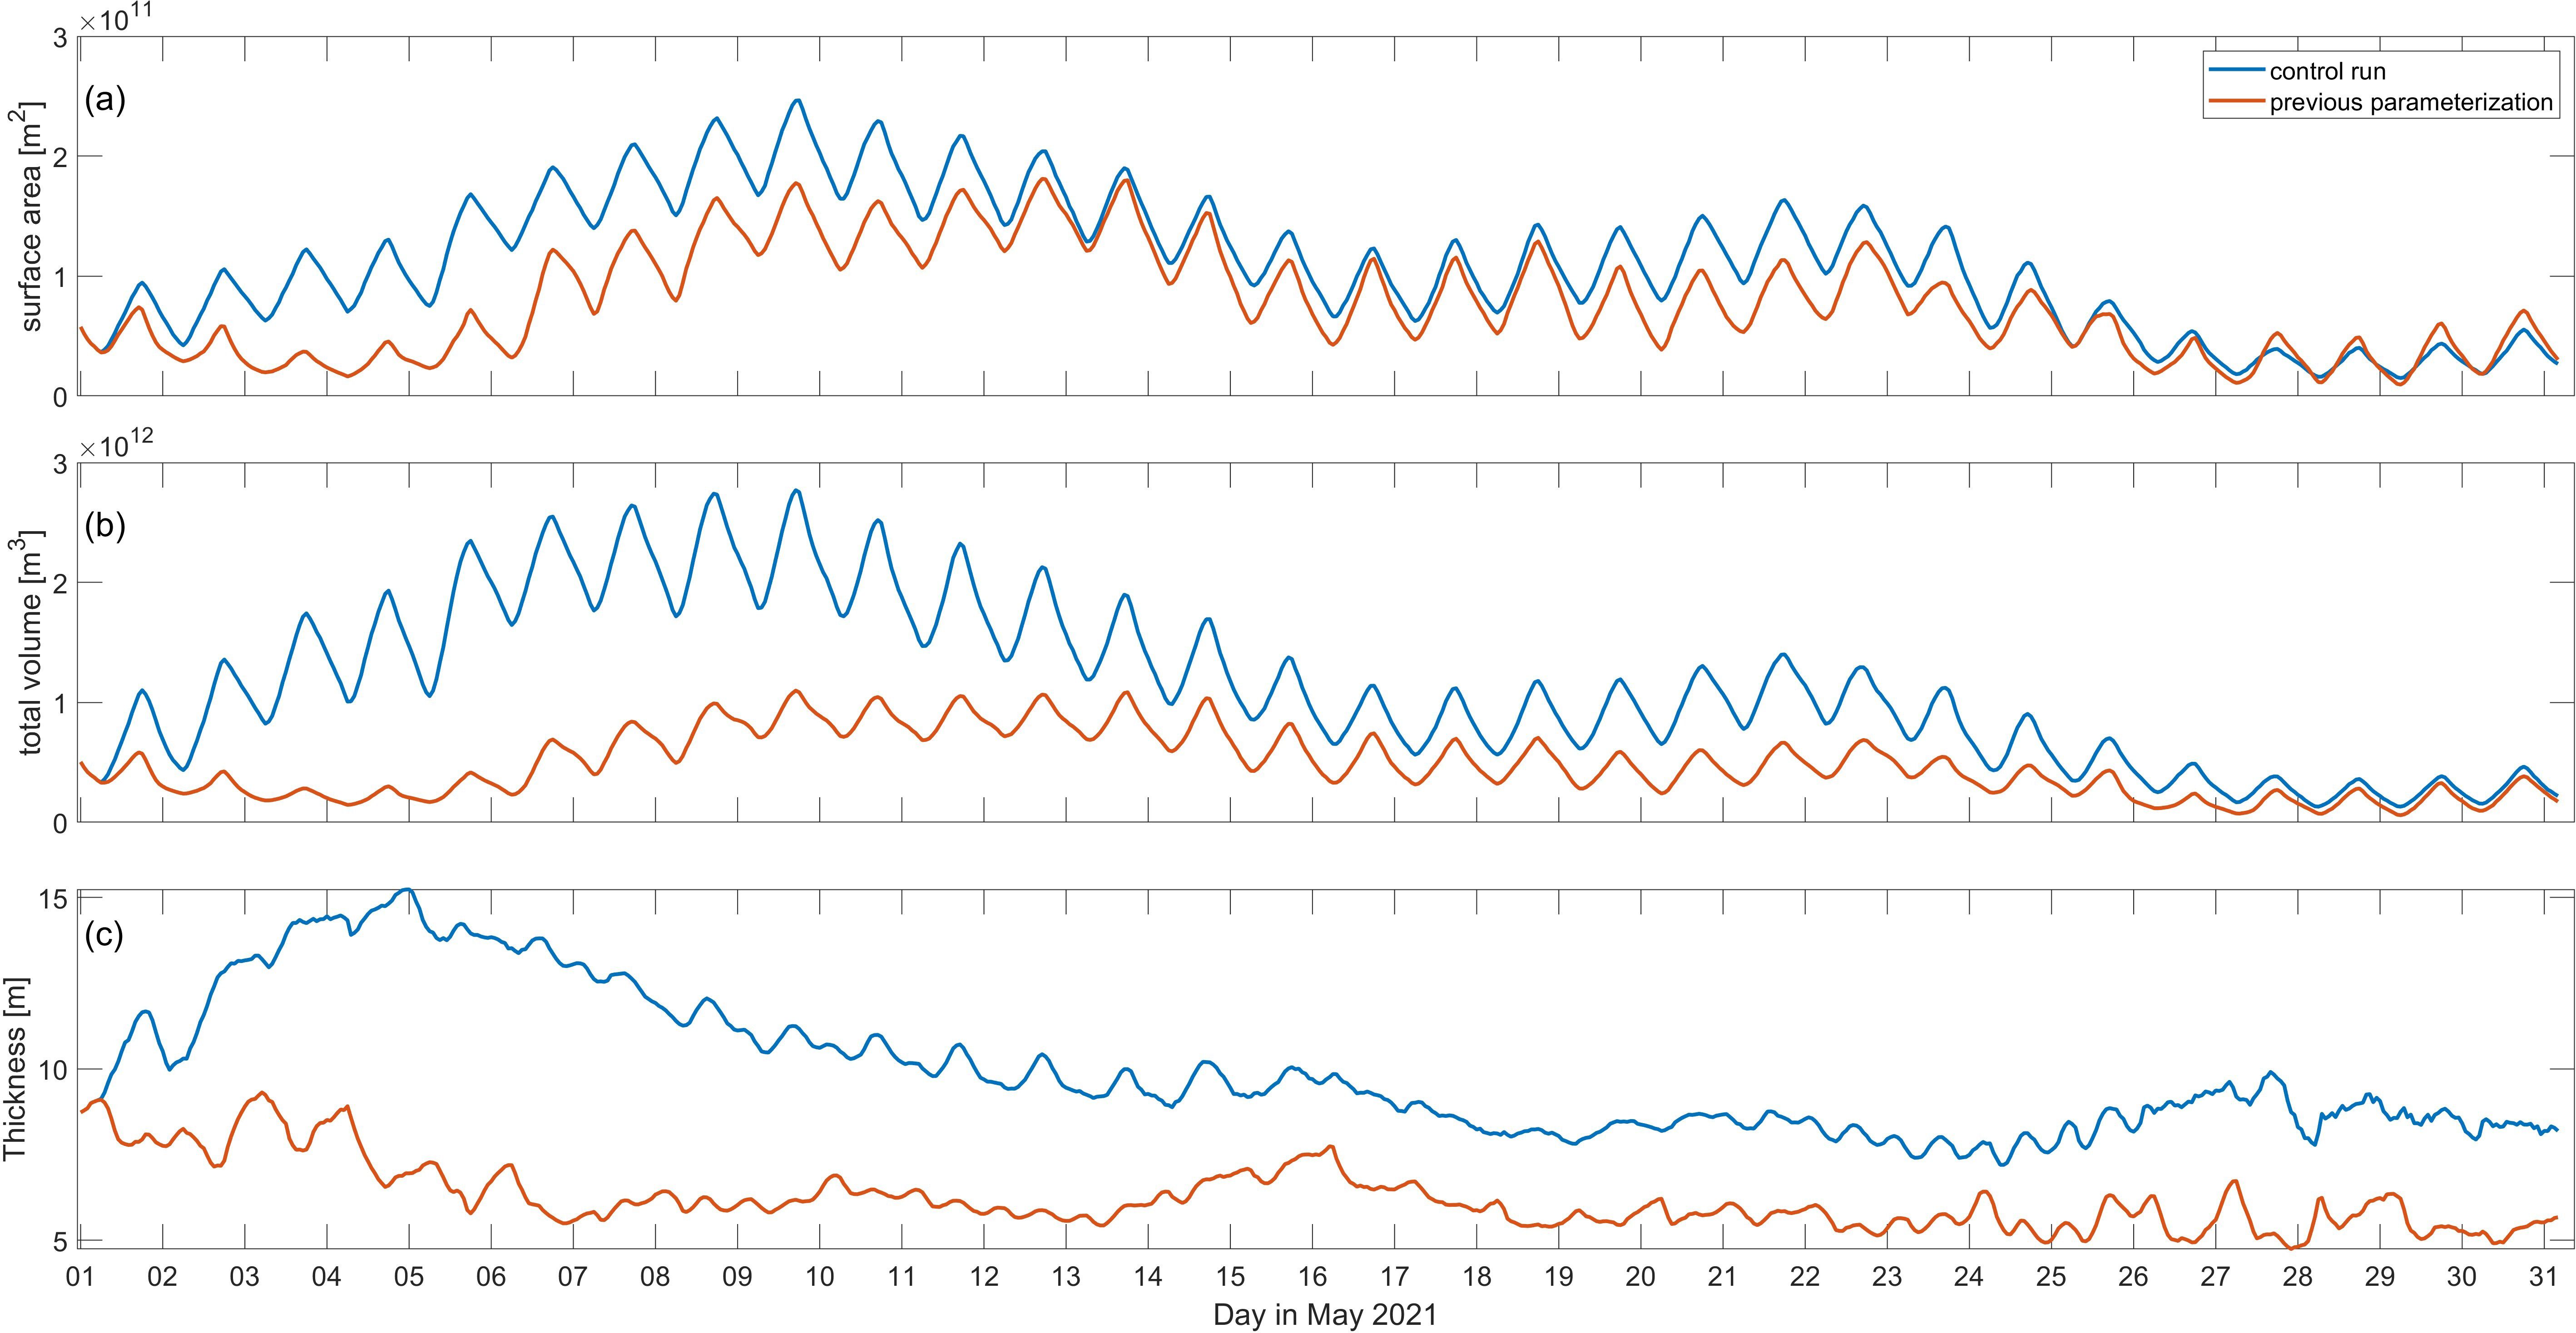
Figure 9. Hourly time series of surface area (A), total volume (B), and thickness (C) of high chlorophyll-a (≥ 5μg L-1) water masses using new (control run) and previous light parameterizations.
4 Discussion
4.1 Sensitivity of planktonic ecosystem to light parameterization
The Changjiang Estuary is subject to complex hydrodynamic and sedimentological processes, such as strong tidal mixing, river plume, and turbidity maxima, which undoubtedly affect light availability, nutrient transport and resupply, and phytoplankton growth (Wang et al., 2019a, Wang et al., 2023; Ge et al., 2020; Li et al., 2021). Our study demonstrated that modeling chlorophyll-a patterns in the Changjiang Estuary requires accurate underwater light distribution, which constrains light limitation for phytoplankton photosynthesis in the coastal ecosystem. Irradiance in the photosynthetic waveband (400-700 nm) diminishes in an approximately exponential manner (Kirk, 2010); therefore, most marine ecosystem models utilize empirical functions that formulate PAR with water depth and Kd. Our in-situ data and modeling results suggested that Kd varies by more than 2 orders of magnitude due to its dependency on light scattering and/or absorbing constituents of the water (Figures 4, 6B). We further explore how sensitive chlorophyll-a distributions respond to each one or two of the three variables in the light attenuation parameterization (i.e., suspended sediment, chlorophyll-a, and CDOM; see Equation 5) and designed six parallel sets of model sensitivity experiments (Figure 10). The seawater-induced and residual attenuation terms are retained in all experiments as background attenuation.
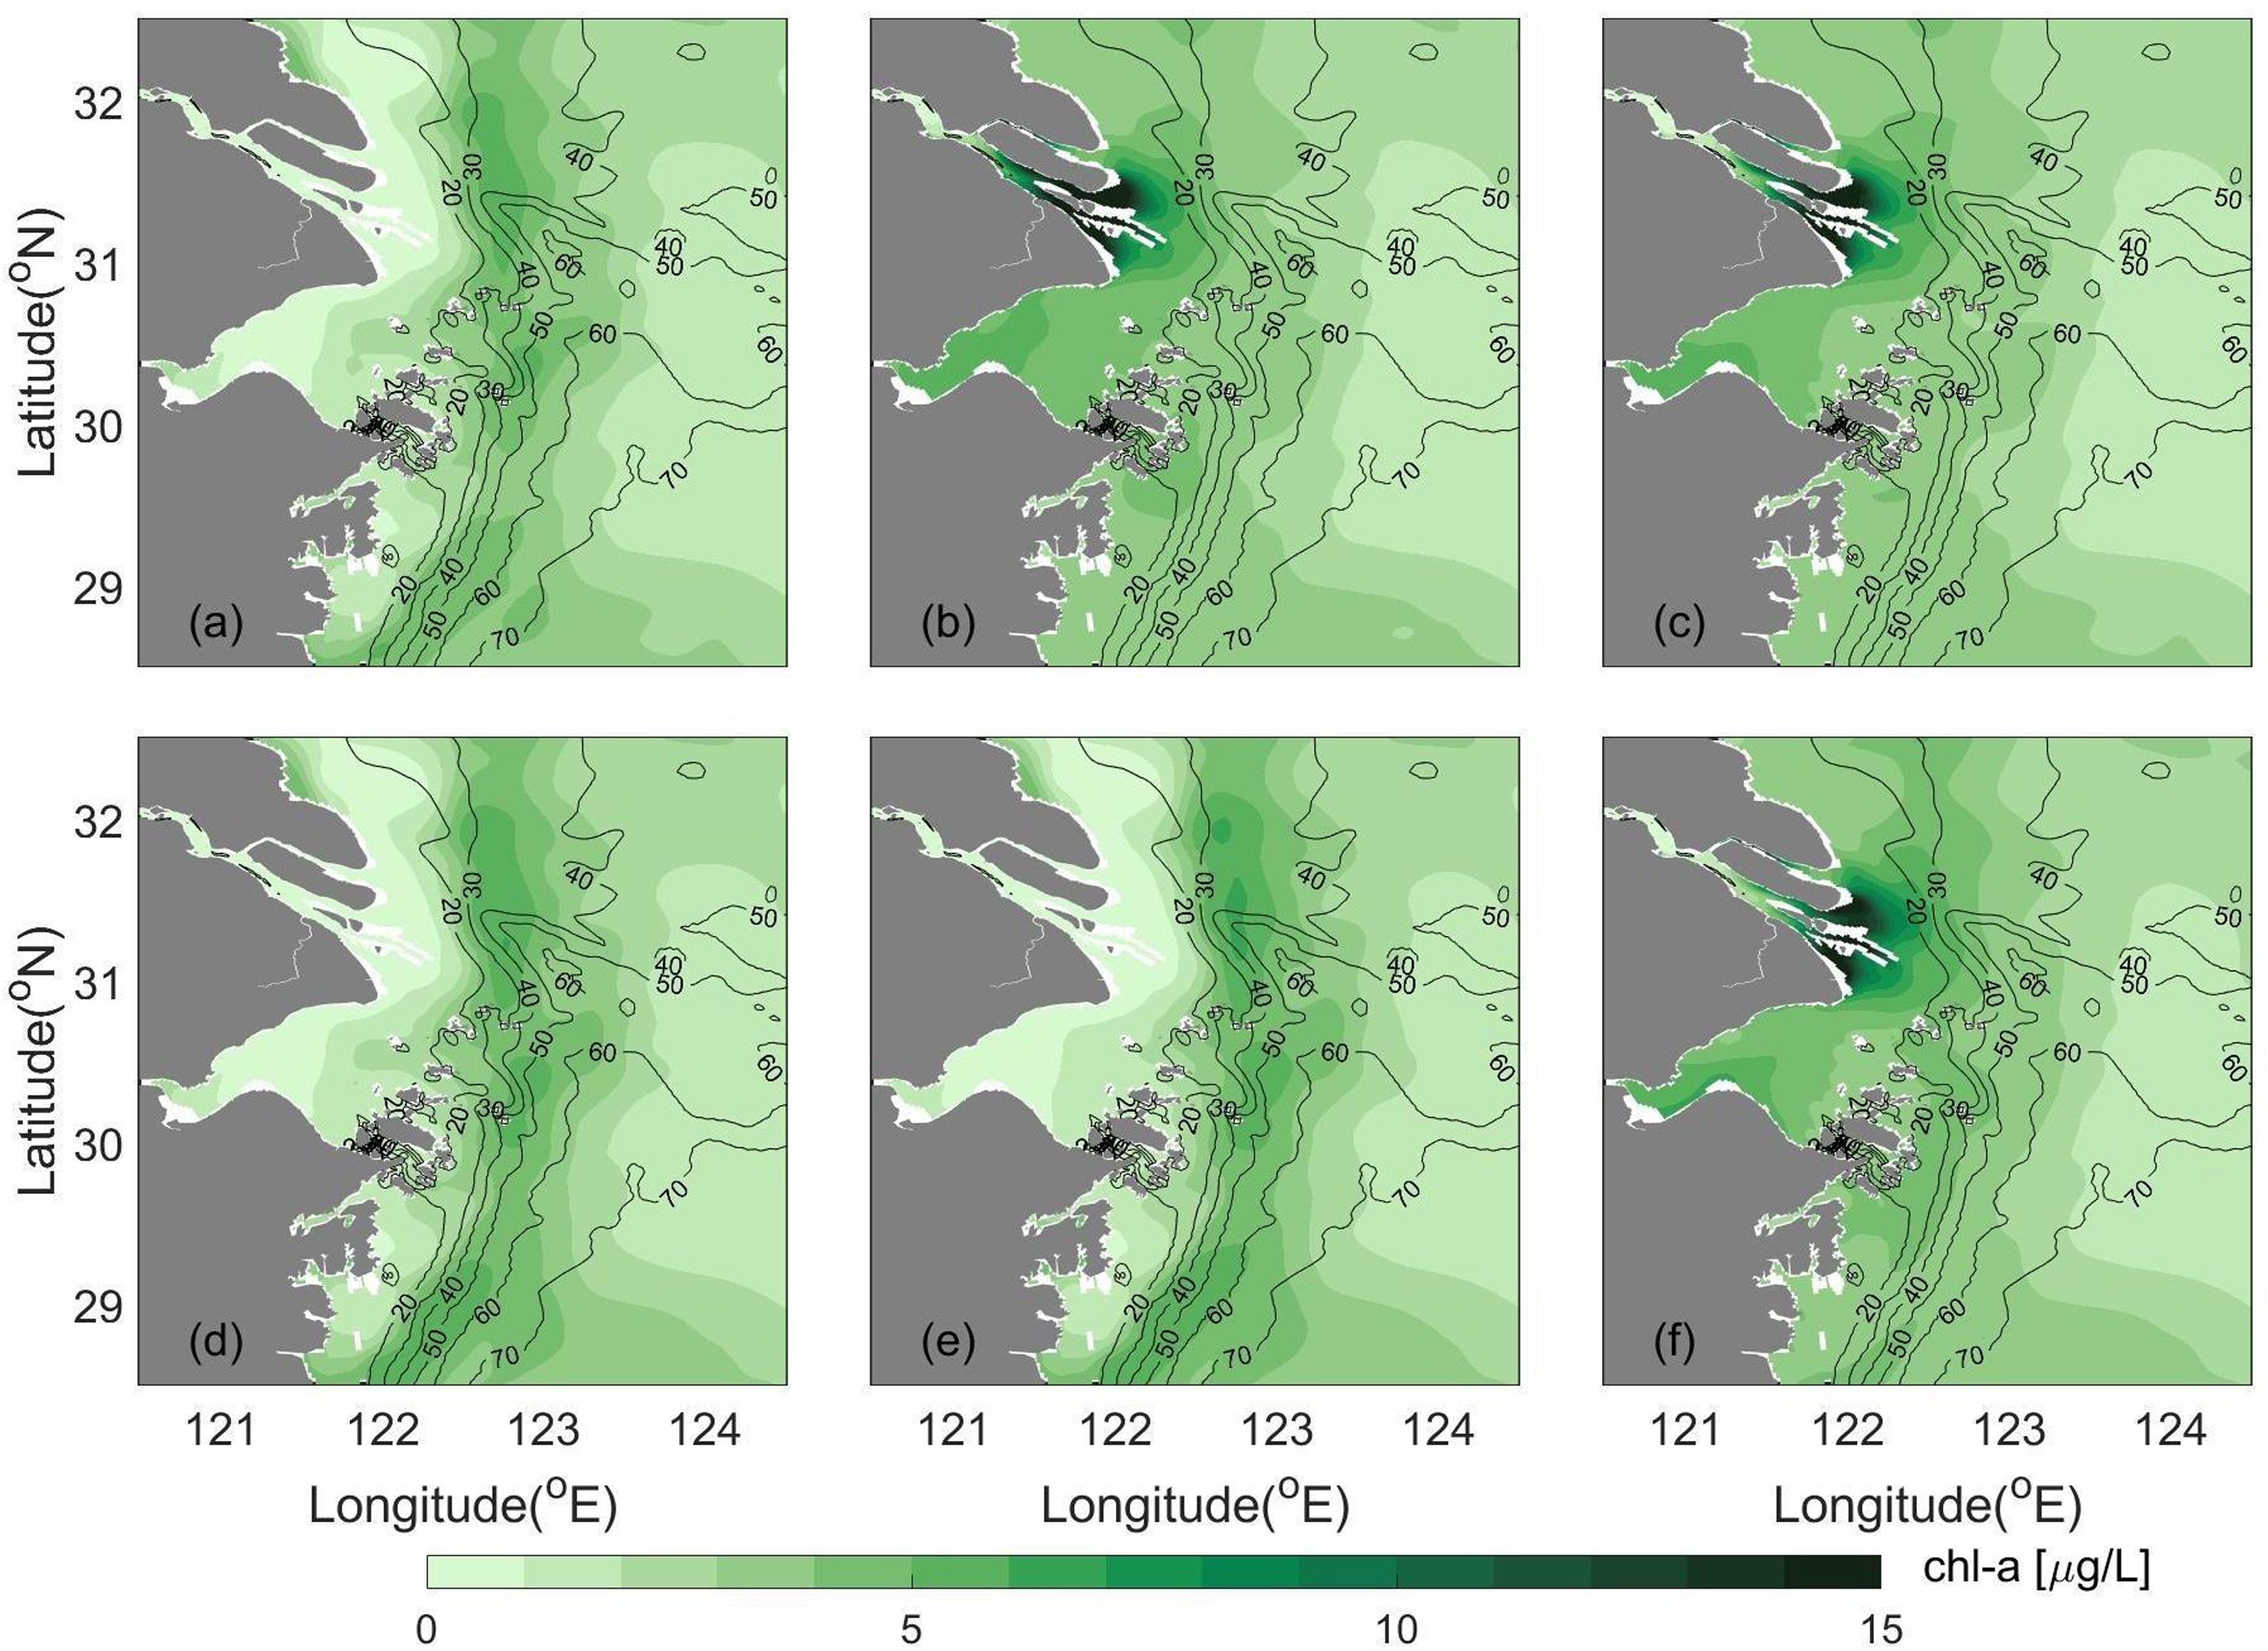
Figure 10. May-averaged distributions of surface chlorophyll-a concentrations in the sensitivity experiments by considering (A) suspended sediment, (B) chlorophyll-a, (C) CDOM, (D) suspended sediment and chlorophyll-a, (E) suspended sediment and CDOM, and (F) chlorophyll-a and CDOM; the solid black lines illustrate isobaths.
In Experiment (a), when only the contribution of suspended sediment is considered, the distribution of the high chlorophyll-a concentration is similar to the control run (Figure 7A). This result reaffirms that suspended sediment is the most crucial factor in attenuating PAR in the Changjiang Estuary and controlling the spatial patterns of the high chlorophyll-a band. In Experiment (d) or (e), when the combined effects of suspended sediment and chlorophyll-a or suspended sediment and CDOM are considered, the distribution of the high chlorophyll-a band is closer to that of the control run than in Experiment (a).
In Experiments (b), (c), or (f), when one or two light-attenuating components except suspended sediment are considered, high chlorophyll-a values shift to the locations within the estuary and further nearshore. This is due to the relatively weaker light attenuation effects of either phytoplankton or CDOM than those of suspended sediment. In those cases, phytoplankton bloom would occur within the eutrophic estuary. Consequently, nutrients are heavily consumed by phytoplankton growth within the estuary, which leads to reduced amounts of nutrients transported to the outer sea areas.
The above model sensitivity experiments indicate that spatial distribution and suspended sediment concentrations largely determine underwater PAR distributions, while CDOM and chlorophyll-a modulate light distribution in localized areas. Consequently, light distribution controls the inner boundary of the high chlorophyll-a band. The high chlorophyll-a zone was associated with suitable light conditions, sufficient nutrients, and a relatively stable euphotic zone (Figure 11). A previous study divided the Changjiang Estuary and its neighboring seas into four characteristic zones based on limiting factors of phytoplankton growth (Pu et al., 2001): (1) light limitation in the turbidity maximum zone, (2) phosphate limitation in the CDW extension zone, (3) phosphate limitation in the Taiwan-Warm-Current-influenced zone, and (4) light limitation in the Yellow-Sea-Coastal-Current-influenced zone. Wang et al. (2019a, b) and Li et al. (2021) examined physical-biological controls of dual fronts on the spatial patterns of chlorophyll-a concentrations in and off the Changjiang Estuary. They determined that high chlorophyll-a regions reside in the intermediate zone between the turbidity and salinity fronts. Recent studies suggested that phytoplankton distribution can vary with spring-neap tides or in even shorter time scales due to tide-modulated light and nutrient limitations (Wang et al., 2023; Xu et al., 2024). Our results support the conceptual and mechanistic understandings of phytoplankton blooms of the Changjiang Estuary while highlighting the values and needs of accurate formulation of diffuse attenuation coefficient Kd and underwater light distributions based on in situ data.
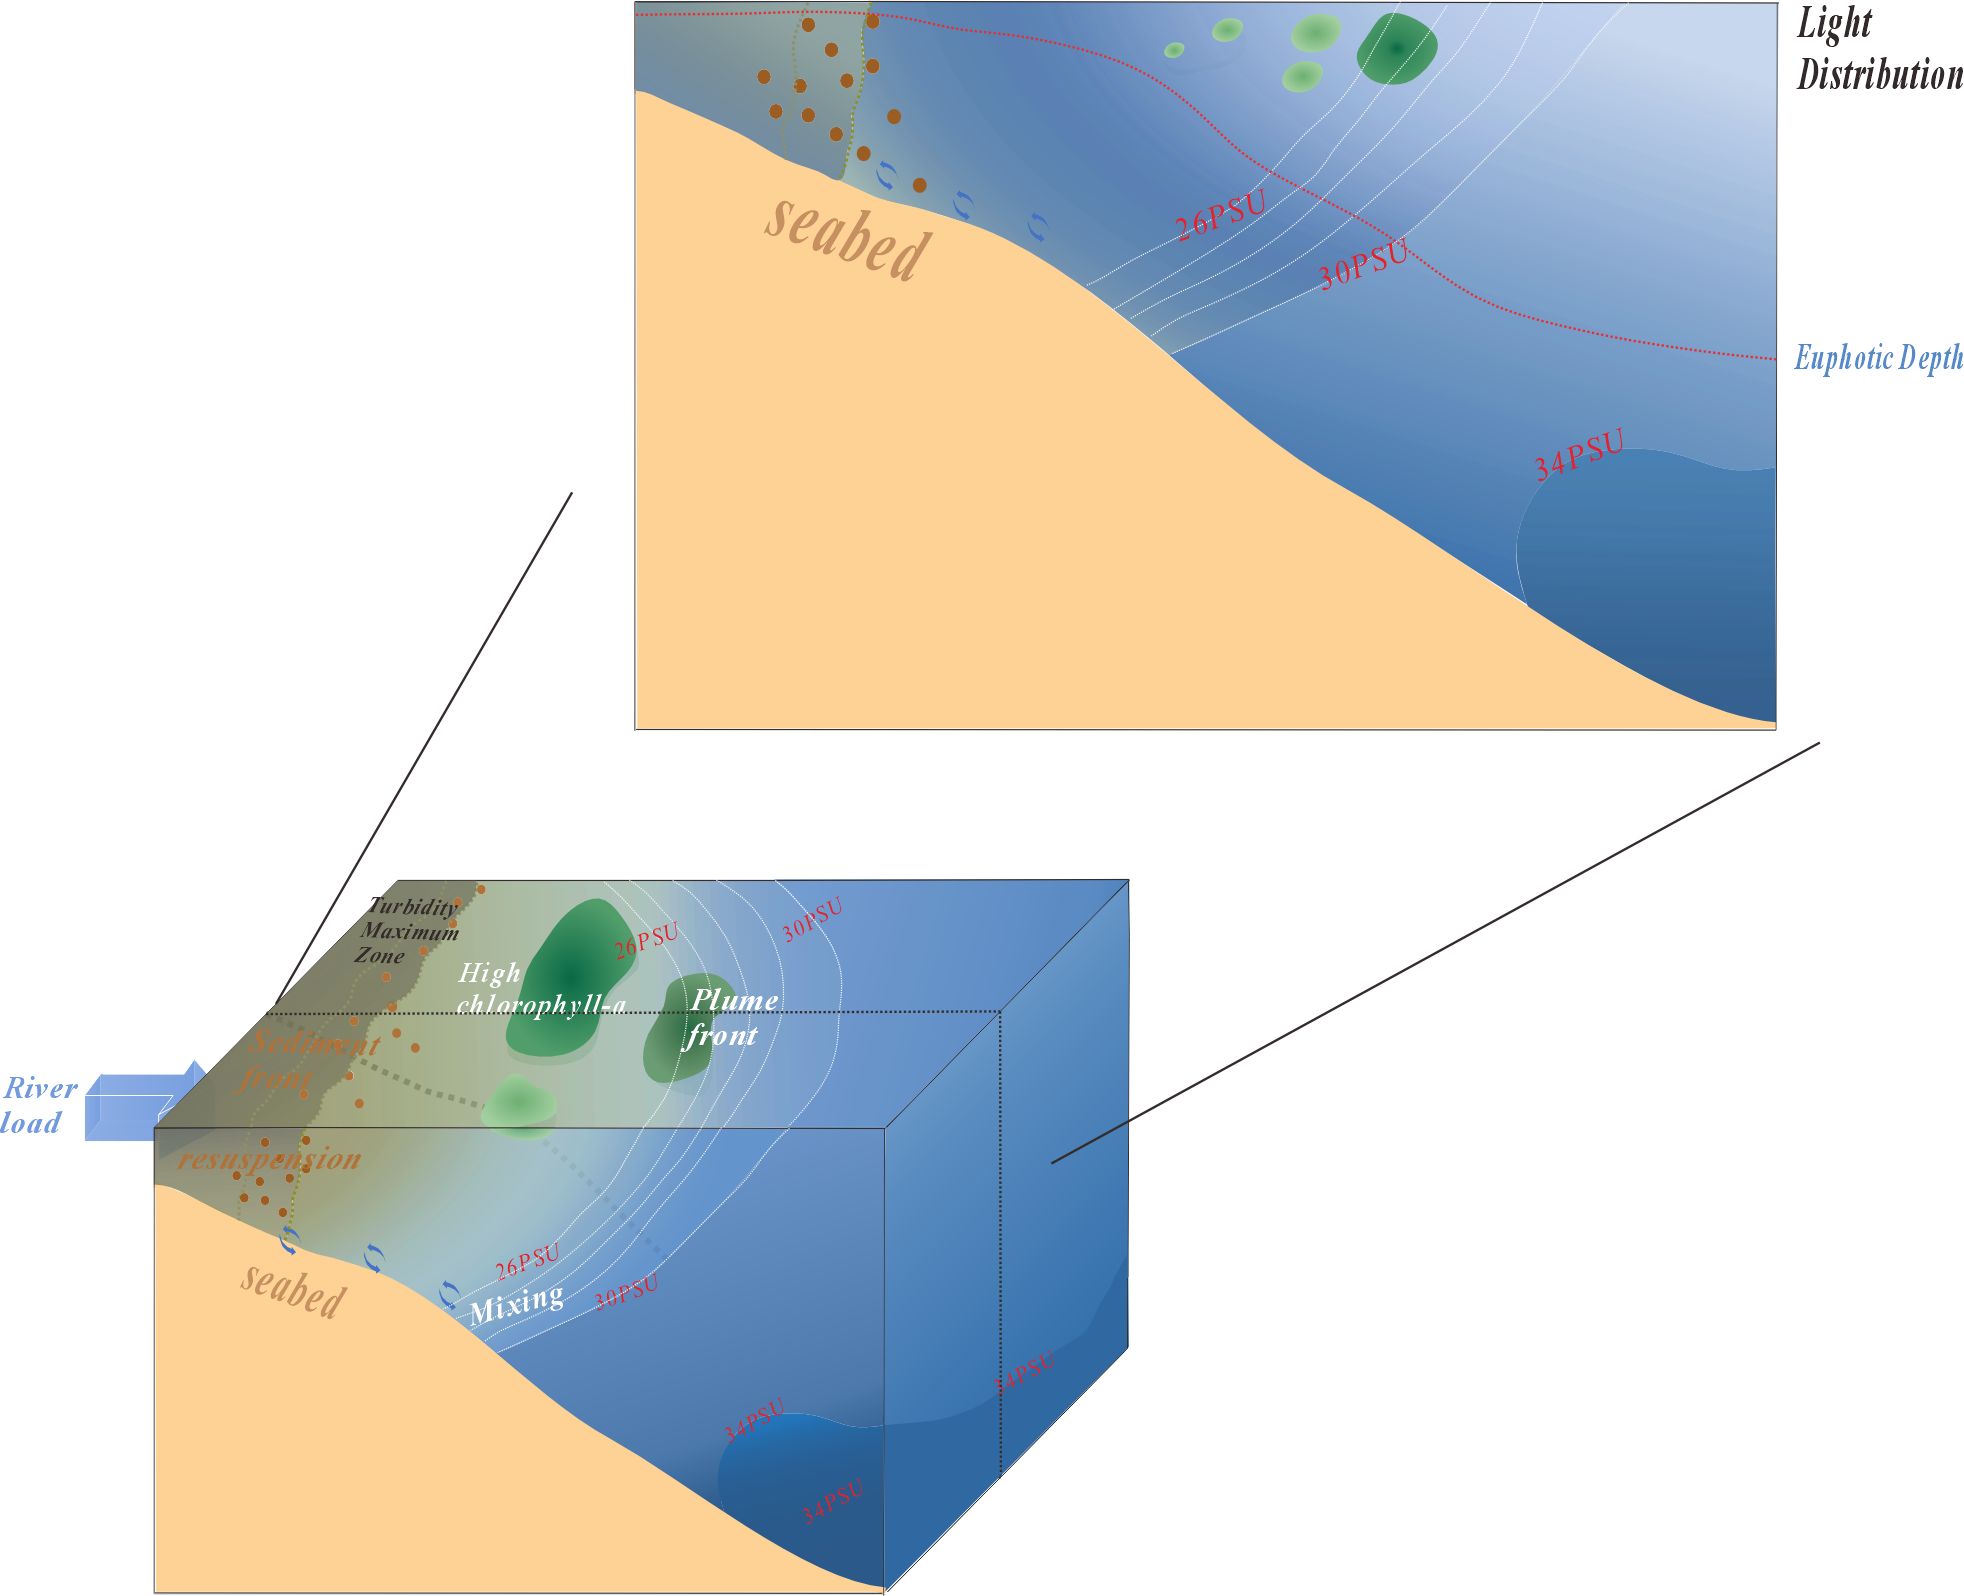
Figure 11. Conceptual diagram of cross-shore light distribution patterns associated with river plume, sediment resuspension, phytoplankton bloom, and frontal processes in the Changjiang Estuary.
4.2 Light attenuation in estuaries and coasts
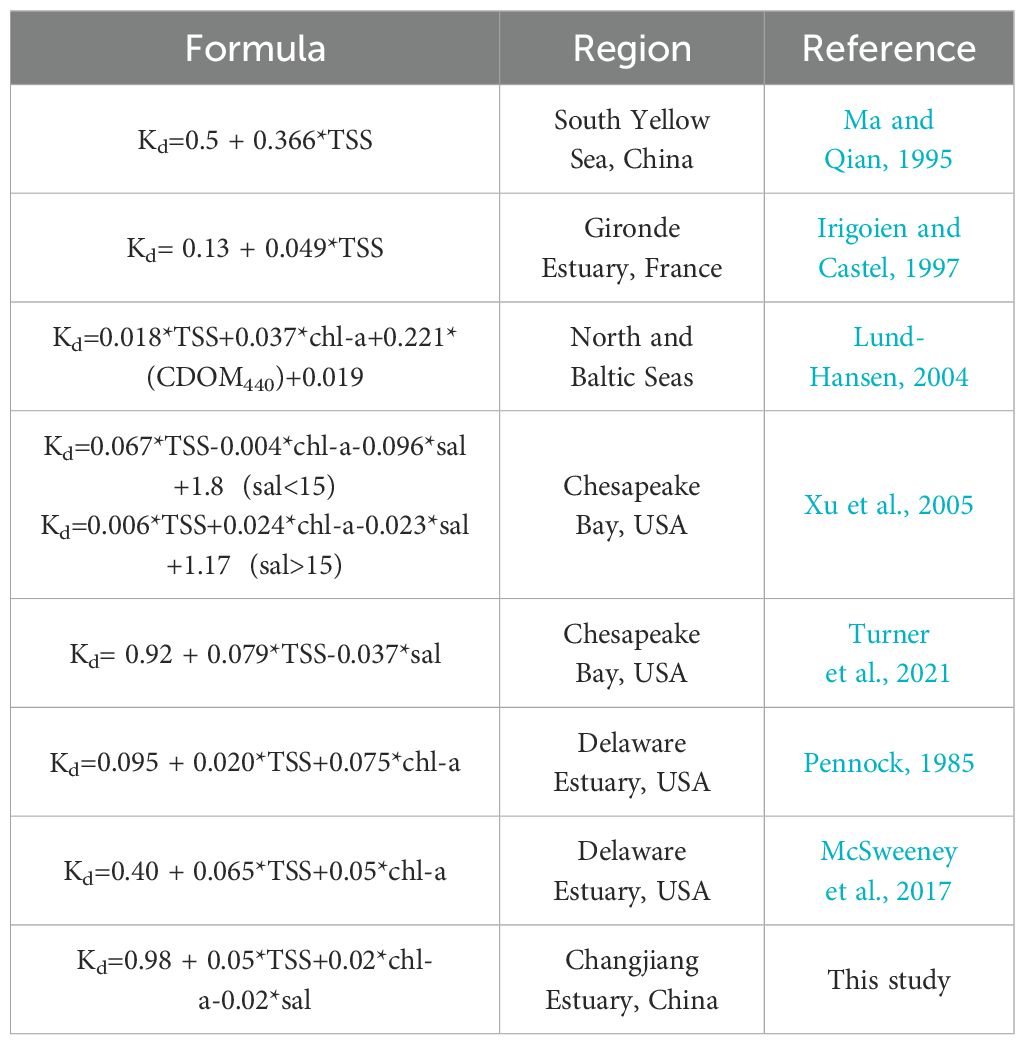
The optics and ecosystem of estuaries and coasts have been extensively studied for a long time (Kirk, 2010). By reviewing the literature, it can be seen that Kd parameterization and coefficients vary considerably among different geographical regions (Table 2). The light attenuation of various water bodies reflects, to some extent, the hydrographic and bio-optical characteristics of the study region. Almost all studies agreed that suspended sediment is the most crucial factor in light attenuation in addition to seawater itself. The light attenuation coefficient Kd has been used as an index to classify water masses in the South Yellow Sea (Ma and Qian, 1995). In Gironde Estuary (France), although suspended sediment was the only environmental variable in the Kd formula, its coefficient was nearly one order of magnitude lower than that of the Yellow Sea (Irigoien and Castel, 1997). In the North and Baltic Seas, the components contributing to light attenuation were suspended sediment, chlorophyll-a, CODM, and seawater, according to their descending contributions (Lund-Hansen, 2004). For Chesapeake Bay, salinity was a surrogate for CDOM in the light attenuation parameterization, and a piecewise function was constructed based on salinity ranges (Xu et al., 2005). A more recent study developed a Kd relationship using suspended sediment and salinity (Turner et al., 2021). In the Delaware Estuary, earlier and later studies utilized suspended sediment and chlorophyll-a to reconstruct Kd, but their coefficients differed several times (Pennock, 1985; McSweeney et al., 2017). Our best fit Kd parameterization for the Changjiang Estuary takes into account four major light-attenuating constituents, including suspended sediment, CDOM, chlorophyll-a, and seawater (Equation 5 and Table 1). This relationship has been constructed using data across three seasons and validated against independent data sets (Figure 4). For future research, we recommend using this observation-guided relationship for underwater light calculation in the marine ecological models of the Changjiang Estuary. Our future studies will combine optical measurements of absorbing and scattering materials, ocean color remote sensing, and coupled numerical models to gain mechanistic understandings of hydrodynamics, sediment transport, bio-optics, and phytoplankton growth across multiple spatiotemporal scales and to further explore the coupling between sediment dynamics, light and nutrient availability, and phytoplankton responses.
4.3 Limitations and implications
Despite the robustness of the newly developed light attenuation parameterizations for the Changjiang Estuary, they were based on limited ship-based observations conducted during normal conditions. Additionally, to avoid the extreme values, the parameterizations were confined to the usual ranges of those aquatic constituents in the euphotic zone (0< TSS< 60.4 g m-3, 0< chl-a< 14.5 μg L-1, and 0< Sal< 33 psu). Nevertheless, during extreme events like storms or floods, suspended sediment concentrations might be much higher than in normal conditions. In those cases, the relationships between Kd(PAR) and light-attenuating constituents could become non-linear, and relevant coefficients may have to be tuned accordingly (Kirk, 2010).
Also, present light attenuation due to phytoplankton simply used chlorophyll-a concentration, a typical index for total phytoplankton biomass. Indeed, other biological components such as zooplankton and detritus, may also affect light availability. Moreover, the present study did not consider phytoplankton species composition and variation, especially in coastal regions where dominant algal species may change with seasons due to species competition. It is reported that there are seasonal successions of diatoms versus dinoflagellates (Tang et al., 2006). These species differ in light scattering and absorbing characteristics largely due to their morphological and physiological differences. The species-specific light attenuation remains unclear and needs further field investigations and laboratory experiments. Moreover, chlorophyll-a concentrations become extremely high and certain phytoplankton species dominate in severe HAB events, more process-based studies and datasets are needed to examine interacting hydrological, bio-optical, and physiological conditions during HABs (Glibert et al., 2022).
Given the physical, sedimentological, biogeochemical, and ecological complexity of Changjiang Estuary and adjacent seas (Zhou et al., 2020), our newly developed light attenuation parameterization is a step further than former simplified parameterizations. It allows the relevant studies to progress on more elaborate interactions of biophysical processes acting on multiple spatiotemporal scales, especially in such a highly dynamic estuary. It improves our understanding of phytoplankton bloom dynamics and relevant environmental conditions in highly turbid estuaries and also provides a scientific basis for the environmental authorities in coastal prediction, hazard mitigation, and resource management.
Data availability statement
The raw data supporting the conclusions of this article will be made available by contacting the corresponding author upon reasonable request.
Author contributions
QL: Writing – original draft, Writing – review & editing, Formal Analysis, Investigation, Conceptualization, Funding acquisition, Project administration, Supervision. ZF: Formal Analysis, Investigation, Project administration, Supervision, Writing – original draft, Writing – review & editing, Data curation, Methodology, Resources, Visualization. YW: Formal Analysis, Investigation, Methodology, Supervision, Writing – review & editing, Validation, Writing – original draft. XW: Data curation, Formal Analysis, Visualization, Writing – review & editing. ZB: Data curation, Formal Analysis, Visualization, Writing – review & editing. FZ: Formal Analysis, Investigation, Methodology, Supervision, Writing – review & editing. FC: Formal Analysis, Investigation, Methodology, Writing – review & editing. HW: Funding acquisition, Investigation, Project administration, Resources, Supervision, Writing – review & editing. YW: Supervision, Writing – review & editing, Funding acquisition, Resources.
Funding
The author(s) declare that financial support was received for the research, authorship, and/or publication of this article. This study is funded by the Innovation Program of the Shanghai Municipal Education Commission (2021-01-07-00-08-E00102), the National Science Foundation of China (42106162, 42476161, and 42006151), Science and Technology Commission of Shanghai Municipality (21JC1402500 and 23ZR1420300), Shanghai Pujiang Program (20PJ403100), and International Joint Laboratory of Estuarine and Coastal Research, Shanghai (21230750600).
Acknowledgments
S. Zhou and M. Xu helped with numerical model runs and two reviewers provided constructive review feedback. Data and samples were collected onboard R/V “Runjiang 1” and “Zheyuke 2” implementing the open research cruise NORC2021-03 supported by NSFC Shiptime Sharing Project (project number: 42049903). We thank the crew and scientific members who participated in the field observations.
Conflict of interest
The authors declare that the research was conducted in the absence of any commercial or financial relationships that could be construed as a potential conflict of interest.
Publisher’s note
All claims expressed in this article are solely those of the authors and do not necessarily represent those of their affiliated organizations, or those of the publisher, the editors and the reviewers. Any product that may be evaluated in this article, or claim that may be made by its manufacturer, is not guaranteed or endorsed by the publisher.
References
Beardsley R. C., Limeburner R., Yu H., Cannon G. A. (1985). Discharge of the changjiang (Yangtze river) into the east China sea. Continental Shelf Res. 4, 57–76. doi: 10.1016/0278-4343(85)90022-6
Blumberg A. F., Mellor G. L. (1987). “A description of a three-dimensional coastal ocean circulation model,” in Three-Dimensional Coastal Ocean Models. Ed. Heaps N. S. (Washington: American Geophysical Union), 1–16. doi: 10.1029/CO004p0001
Christian D., Sheng Y. P. (2003). Relative influence of various water quality parameters on light attenuation in India River Lagoon. Estuarine Coast. Shelf Sci. 57, 961–971. doi: 10.1016/s0272-7714(03)00002-7
Cloern J. E. (1987). Turbidity as a control on phytoplankton biomass and productivity in estuaries. Continental Shelf Res. 7, 1367–1381. doi: 10.1016/0278-4343(87)90042-2
Desmit X., Vanderborght J. P., Regnier P., Wollast R. (2005). Control of phytoplankton production by physical forcing in a strongly tidal, well-mixed estuary. Biogeosciences 2, 205–218. doi: 10.5194/bg-2-205-2005
Du Y., Zhang J., Wei Z., Yin W., Wu H., Yuan Y., et al. (2022). Spatio-temporal variability of suspended sediment fronts (SSFs) on the inner shelf of the east China sea: the contribution of multiple factors. J. Geophysical Research: Oceans 127, e2021JC018392. doi: 10.1029/2021jc018392
Gao L., Li D., Zhang Y. (2012). Nutrients and particulate organic matter discharged by the Changjiang (Yangtze River): Seasonal variations and temporal trends. J. Geophysical Research: Biogeosciences 117, 1–16. doi: 10.1029/2012jg001952
Ge J., Torres R., Chen C., Liu J., Xu Y., Bellerby R., et al. (2020). Influence of suspended sediment front on nutrients and phytoplankton dynamics off the Changjiang Estuary: A FVCOM-ERSEM coupled model experiment. J. Mar. Syst. 204, 103292. doi: 10.1016/j.jmarsys.2019.103292
Glibert P. M., Cai W. J., Hall E. R., Li M., Main K. L., Ross K. A., et al. (2022). Stressing over the complexities of multiple stressors in marine and estuarine systems. Ocean-Land-Atmosphere Res. 1, 97872258. doi: 10.34133/2022/9787258
Golubkov M., Golubkov S. (2023). Photosynthetically active radiation, attenuation coefficient, depth of the euphotic zone, and water turbidity in the Neva estuary: relationship with environmental factors. Estuaries Coasts 46, 630–644. doi: 10.1007/s12237-022-01164-9
Guo W., Stedmon C. A., Han Y., Wu F., Yu X., Hu M. (2007). The conservative and non–conservative behavior of chromophoric dissolved organic matter in Chinese estuarine waters. Mar. Chem. 107, 357–366. doi: 10.1016/j.marchem.2007.03.006
Irigoien X., Castel J. (1997). Light limitation and distribution of chlorophyll pigments in a highly turbid estuary: the Gironde (SW France). Estuarine Coast. Shelf Sci. 44, 507–517. doi: 10.1006/ecss.1996.0132
Jones D., Wills M. S. (1956). The attenuation of light in sea and estuarine waters in relation to the concentration of suspended solid matter. J. Mar. Biol. Assoc. United Kingdom 35, 431–444. doi: 10.1017/s0025315400010250
Jones K. J., Gowen R. J. (1990). Influence of stratification and irradiance regime on summer phytoplankton composition in coastal and shelf seas of the British Isles. Estuarine Coast. Shelf Sci. 30, 557–567. doi: 10.1016/0272-7714(90)90092-6
Kirk J. T. O. (2010). Light and Photosynthesis in Aquatic Ecosystems. 3rd Edition (United Kingdom: Cambridge University Press). doi: 10.1017/CBO9781139168212
Kowalczuk P., Cooper W. J., Whitehead R. F., Durako M. J., Sheldon W. (2003). Characterization of CDOM in an organic-rich river and surrounding coastal ocean in the South Atlantic Bight. Aquat. Sci. 65, 384–401. doi: 10.1007/s00027-003-0678-1
Li W., Ge J., Ding P., Ma J., Glibert P. M., Liu D. (2021). Effects of dual fronts on the spatial pattern of chlorophyll-a concentrations in and off the Changjiang river estuary. Estuaries Coasts 44, 1408–1418. doi: 10.1007/s12237-020-00893-z
Lucas L. V. (2010). Implications of estuarine transport for water quality. Contemp. Issues Estuar. Phys. 10, 273–307. doi: 10.1017/CBO9780511676567.011
Lucas L. V., Sereno D. M., Burau J. R., Schraga T. S., Lopez C. B., Stacey M. T., et al. (2006). Intradaily variability of water quality in a shallow tidal lagoon: mechanisms and implications. Estuaries Coasts 29, 711–730. doi: 10.1007/bf02786523
Lund-Hansen L. C. (2004). Diffuse attenuation coefficents Kd(PAR) at the estuarine North Sea-Baltic Sea transition: time series, partitioning, absorption, and scattering. Estuarine Coast. Shelf Sci. 61, 251–259. doi: 10.1016/j.ecss.2004.05.004
Ma S., Qian Z. (1995). The water masses and the suspended matter distributions of the south Yellow Sea and its optic characteristic. Oceanologia Limnologia Sin. S1, 8–15. doi: 10.3321/j.issn:0029-814X.1995.z1.002
McSweeney J. M., Chant R. J., Wilkin J. L., Sommerfield C. K. (2017). Suspended-sediment impacts on light-limited productivity in the delaware estuary. Estuaries Coasts 40, 977–993. doi: 10.1007/s12237-016-0200-3
Mellor G., Yamada T. (1982). Development of a turbulence closure model for geophysical fluid problems. Rev. Geophysics 20, 851–875. doi: 10.1029/rg020i004p00851
Meng Q., Xuan J., Zhang W., Zhou F., Hao Q., Zhao Q., et al. (2020). Impact of submesoscale vertical advection on primary productivity in the southern East China Sea. J. Geophysical Research: Biogeosciences 125, e2019JG005540. doi: 10.1029/2019jg005540
Milliman J. D., Farnsworth K. L. (2011). River Discharge to the Coastal Ocean: A Global Synthesis (New York: Cambridge University Press).
Palacios S. L., Peterson T. D., Kudela R. M. (2009). Development of synthetic salinity from remote sensing for the Columbia River plume. J. Geophysical Research: Oceans 114, C00B05. doi: 10.1029/2008jc004895
Paulson C. A., Simpson J. J. (1977). Irradiance measurements in the upper ocean. J. Phys. Oceanography 7, 952–956. doi: 10.1175/1520-0485(1977)007<0952:imituo>2.0.co;2
Pennock J. R. (1985). Chlorophyll distributions in the Delaware Estuary: regulation by light-limitation. Estuarine Coast. Shelf Sci. 21, 711–725. doi: 10.1016/0272-7714(85)90068-x
Pu X., Wu Y., Zhang Y. (2001). Nutrient limitation of phytoplankton in the Changjiang Estuary II. Condition of nutrient limitation in spring. HaiYangXueBao 23, 57–65. doi: 10.3321/j.issn:0253-4193.2001.03.007
Tang D. L., Di B. P., Wei G., Ni I. H., Wang S. (2006). Spatial, seasonal and species variations of harmful algal blooms in the South Yellow Sea and East China Sea. Hydrobiologia 568, 245–253. doi: 10.1007/s10750-006-0108-1
Turner J. S., St-Laurent P., Friedrichs M. A., Friedrichs C. T. (2021). Effects of reduced shoreline erosion on Chesapeake Bay water clarity. Sci. Total Environ. 769, 145157. doi: 10.1016/j.scitotenv.2021.145157
Van Duin E. H. S., Blom G., Los F. J., Maffione R., Zimmerman R., Cerco C. F., et al. (2001). Modeling underwater light climate in relation to sedimentation, resuspension, water quality and autotrophic growth. Hydrobiologia 444, 25–42. doi: 10.1023/A:1017512614680
Wang Y., Wu H., Gao L., Shen F., Liang X. S. (2019a). Spatial distribution and physical controls of the spring algal blooming off the Changjiang river estuary. Estuaries Coasts 42, 1066–1083. doi: 10.1007/s12237-019-00545-x
Wang Y., Wu H., Lin J., Zhu J., Zhang W., Li C. (2019b). Phytoplankton blooms off a high turbidity estuary: A case study in the Changjiang river estuary. J. Geophysical Research: Oceans 124, 8036–8059. doi: 10.1029/2019jc015343
Wang Y., Xu M., Feng Z., Zhang F., Cao F., Wu H. (2023). Tidal variability of phytoplankton distribution in the highly turbid Changjiang river estuary: mechanisms and implications. J. Geophysical Research: Oceans 128, 1–24. doi: 10.1029/2023jc020090
Williamson C. E., Stemberger R. S., Morris D. P., Frost T. M., Paulsen S. G. (1996). Ultraviolet radiation in North American lakes: Attenuation estimates from DOC measurements and implications for plankton communities. Limnology Oceanography 41, 1024–1034. doi: 10.4319/lo.1996.41.5.1024
Wu H., Zhu J. (2010). Advection scheme with 3rd high-order spatial interpolation at the middle temporal level and its application to saltwater intrusion in the Changjiang Estuary. Ocean Model. 33, 33–51. doi: 10.1016/j.ocemod.2009.12.001
Wu H., Shen J., Zhu J., Zhang J., Li L. (2014). Characteristics of the Changjiang plume and its extension along the Jiangsu Coast. Continental Shelf Res. 76, 108–123. doi: 10.1016/j.csr.2014.01.007
Wu H., Zhu J., Shen J., Wang H. (2011). Tidal modulation on the Changjiang River plume in summer. J. Geophysical Research: Oceans 2011 116, 1–21. doi: 10.1029/2011jc007209
Wu J., Liu J. T., Wang X. (2012). Sediment trapping of turbidity maxima in the Changjiang Estuary. Mar. Geology 303, 14–25. doi: 10.1016/j.margeo.2012.02.011
Wu T., Wu H. (2018). Tidal mixing sustains a bottom-trapped river plume and buoyant coastal current on an energetic continental shelf. J. Geophysical Research: Oceans 123, 8026–8051. doi: 10.1029/2018jc014105
Xu J., Hood R. R., Chao S. Y. (2005). A simple empirical optical model for simulating light attenuation variability in a partially mixed estuary. Estuaries 28, 572–580. doi: 10.1007/bf02696068
Xu M., Wang Y., Feng Z., Wu H. (2024). Rapid variations of phytoplankton blooms and their dynamics off the Changjiang River Estuary. Front. Mar. Sci. 11, 1–21. doi: 10.3389/fmars.2024.1345940
Yankovsky A. E., Chapman D. C. (1997). A simple theory for the fate of buoyant coastal discharges. J. Phys. Oceanography 27, 1386–1401. doi: 10.1175/1520-0485(1997)027<1386:astftf>2.0.co;2
Zhao L., Guo X. (2011). Influence of cross-shelf water transport on nutrients and phytoplankton in the East China Sea: a model study. Ocean Sci. 7, 27–43. doi: 10.5194/os-7-27-2011
Keywords: light attenuation, photosynthetically active radiation, river plume, suspended sediment concentration, spring phytoplankton bloom, Changjiang estuary
Citation: Lin Q, Feng Z, Wang Y, Wang X, Bian Z, Zhang F, Cao F, Wu H and Wang YP (2024) Light attenuation parameterization in a highly turbid mega estuary and its impact on the coastal planktonic ecosystem. Front. Mar. Sci. 11:1486261. doi: 10.3389/fmars.2024.1486261
Received: 25 August 2024; Accepted: 08 October 2024;
Published: 28 October 2024.
Edited by:
Wupeng Xiao, Xiamen University, ChinaCopyright © 2024 Lin, Feng, Wang, Wang, Bian, Zhang, Cao, Wu and Wang. This is an open-access article distributed under the terms of the Creative Commons Attribution License (CC BY). The use, distribution or reproduction in other forums is permitted, provided the original author(s) and the copyright owner(s) are credited and that the original publication in this journal is cited, in accordance with accepted academic practice. No use, distribution or reproduction is permitted which does not comply with these terms.
*Correspondence: Zhixuan Feng, enhmZW5nQHNrbGVjLmVjbnUuZWR1LmNu
 Qiyinan Lin
 Zhixuan Feng
 Yihe Wang
 Xue Wang
 Zhaoxuan Bian
 Fan Zhang
 Fang Cao
 Hui Wu
 Ya Ping Wang
