 Xiao Zhang
 Chunchang Zhang
 Xiao Chen4
- 1School of Ocean, Yantai University, Yantai, China
- 2Merchant Marine College, Shanghai Maritime University, Shanghai, China
- 3National Engineering Research Center for Special Equipment and Power Systems of Ships and Marine Engineering, Shanghai, China
- 4College of Information Engineering, Shanghai Maritime University, Shanghai, China
- 5College of Ocean Science and Engineering, Shanghai Maritime University, Shanghai, China
The Huanghe Estuary, which is characterized by dynamic hydrological and ecological processes, is highly susceptible to marine oil spills due to dense maritime traffic and extensive industrial activities. This study evaluated the vulnerability of estuarine wetlands in the Huanghe Estuary to oil spill stress using the Pressure-Situation-Sensitivity-Recovery (PSSR) framework. By employing the Geographic Information System (GIS) and the Analytic Hierarchy Process (AHP), this study categorized the vulnerability index (0–1) into five classes: Very Low (0–0.098), Low (0.098–0.125), Medium (0.125-0.192), High (0.192–0.224), and Very High (0.224–1). The results indicate that the ships indicator has the highest weight, followed by oil rigs. In contrast, the number of chemical splash-proof suits and tugboats have the lowest weights. Wetland vulnerability under oil spill stress exhibited significant spatial variation, with higher vulnerability observed in areas closer to the coastline, such as the eastern part of Kenli County, the northern part of Wudi County, and the northern part of Hekou District. This study underscores the need for targeted measures and enhanced monitoring to mitigate the risks of large oil spills and protect the ecological integrity of the Huanghe Estuary. The findings presented herein provide critical information that will help policymakers and environmental managers implement effective conservation strategies and risk mitigation efforts in this ecologically sensitive and economically important region.
1 Introduction
Coastal wetlands are prominent elements of coastal landscapes that rank among the planet’s most crucial ecosystems in terms of biodiversity. These systems are essential to preserving global biodiversity in coastal regions because of their abundant productivity, which supports food chains, as well as their role in providing habitats for various plant and animal species (Ayyam et al., 2019). Among coastal wetland systems, estuarine wetlands possess a particularly unique ecological value. Estuarine wetlands are unique ecosystems located in transitional zones between the ocean and land that are characterized by rich biodiversity and landscape diversity. These wetlands support a diverse range of plants, benthic organisms, plankton, and birds while providing important habitats for many rare and endangered species. Moreover, wetlands can effectively reduce the damage caused by storm surges (Costanza et al., 2021; Narayan et al., 2017).
However, estuarine wetlands ecosystems are under increasing threat from anthropogenic activities, particularly oils spills (Pezeshki and DeLaune, 2015). Indeed, oil spills can be devastating, causing immediate and long-term harm to coastal ecosystems (Barron et al., 2020). The effects of oil spills on estuarine wetlands include smothering benthic habitats, toxic effects on coastal organisms, and disruption of ecological functions of coastal ecosystems (Mendelssohn et al., 2012). The risk of oil spills to estuarine wetlands usually originates from the ocean, where underwater oil pipelines, drilling platforms, transport vessels, and coastal oil storage tanks in ports are all potential sources of spills (Wang et al., 2023).
Therefore, assessing the vulnerability of estuarine wetlands to oil spills is crucial to developing effective conservation strategies and mitigating potential damage (Nelson et al., 2015). Although significant progress has been made in the field of assessing the vulnerability of coastal wetlands, including the impacts of various disastrous events such as climate change, sea-level rise, cyclones, and oil spills (Hidalgo-Corrotea et al., 2023; Cui et al., 2015; Thorne et al., 2018; Zhang et al., 2019; Balogun et al., 2020), as well as in the use of geospatial technologies and ecological modeling to evaluate factors such as plant and animal sensitivity, tidal patterns, and sediment composition (Nelson et al., 2015; Rodrigues et al., 2023), many studies have overlooked the spatial differentiation of vulnerability. This neglect has led to a limited understanding of how wetlands respond to oil spill stress across different geographic locations and environmental conditions. For example, while many studies have explored the roles of wetland vegetation density and hydrodynamic conditions in mitigating oil contamination (Michel and Rutherford, 2014), few have addressed how these factors vary spatially and affect the distribution of vulnerability. Scientifically identifying the spatial distribution of vulnerability helps determine which areas are most susceptible to oil spills, which assists decision-makers in prioritizing the protection of these high-risk areas (Marignani et al., 2017). Identification of vulnerable areas also facilitates optimization of the allocation of emergency resources, such as protective equipment and cleanup personnel (Alem et al., 2021). Moreover, it supports the formulation of appropriate regulations on shipping and oil extraction at the policy level. Accordingly, it is particularly important to assess the vulnerability of estuarine wetlands under the stress of oil spills.
The Huanghe (Yellow River) Estuary in China is the largest, most well-preserved, and youngest wetland ecosystem in a warm temperate zone in the world (Chang et al., 2022). The wetlands of the Huanghe Estuary comprise one of the most dynamic zones of land-sea interaction in China and represent an extremely fragile and sensitive ecosystem that plays a crucial role in protecting wetland biodiversity and purifying water (Xia et al., 2020; Yan et al., 2023). However, the estuary faces the Bohai Sea, which is frequently affected areas by oil spills (Guo et al., 2019); therefore, wetlands in the estuary are at serious risk of oil spill pollution. As a result, it is essential to assess the vulnerability of the Huanghe Estuary to oil spills to facilitate future wetland protection.
Vulnerability assessment has been extensively studied, and various models and assessment systems have been developed around the world, including the Pressure-State-Response (PSR) framework (Men and Liu, 2018), the Vulnerability Scoping Diagram (VSD) framework (Polsky et al., 2007), and the Drivers-Pressures-State-Impact-Responses (DPSIR) framework (Gari et al., 2015). Although numerous studies have utilized these frameworks to construct indicator systems for assessing vulnerability under oil spill stress (Wang et al., 2023; Yang et al., 2021; Zhang and Xue, 2013), we believe that the existing models have limitations within the specific context of the present study.
For example, the VSD model traditionally addresses vulnerability through the dimensions of exposure, sensitivity, and adaptability. However, we argue that this approach may not fully capture the dynamic interactions between the ecosystem state and external pressures. The present study aimed to address this gap by employing the Pressure-Situation-Sensitivity-Recovery (PSSR) model, a novel evaluation system that retains the organizational structure of the VSD while introducing a more nuanced decomposition of vulnerability into the following four dimensions: pressure, situation, sensitivity, and recovery. This approach enables a more comprehensive assessment by considering not only inherent vulnerabilities, but also the current state of the ecosystem and its response to stressors. By combining pressure, situation, sensitivity and recovery, the PSSR model enables the systematic assessment of wetland vulnerability under various environmental pressures, providing effective management decision-making support (Zhang et al., 2017).
The AHP is a decision-making analysis method that is particularly suitable for handling complex multi-criteria decision problems. The AHP breaks down complex problems into multiple levels, allowing for comparisons and evaluations at each level to ultimately determine the priority of the alternatives (Saaty, 1980). This method is widely employed in environmental assessments, as it systematically integrates subjective judgments with objective data, ensuring the reliability of the results through consistency checks. In this study, AHP was utilized to assign weights to the indicators within the PSSR framework, ensuring that the influence of each indicator on the vulnerability assessment was reasonably reflected.
Thus, this study employed the PSSR framework, the AHP, and the Geographic Information System (GIS) to construct a vulnerability assessment indicator system for the wetlands in the Huanghe Estuary under oil spill stress. The objectives of this study were to (1) systematically evaluate wetland vulnerability under the pressure of marine oil spills; (2) analyze spatial disparities in wetland vulnerability; (3) determine the relative influences of different indicators within the PSSR framework; and (4) provide insights and recommendations for policymakers and environmental managers to strengthen monitoring and mitigation strategies, thereby enhancing the ecological resilience of the Huanghe Estuary against oil spill risks.
2 Data and methods
2.1 Study area
The study area is located at 118°33′–119°20′E longitude and 37°35′–38°12′N latitude. The estuary coverage area is generally considered to include Wudi County, Zhanhua County, the Dongying district, Guangrao County, the Hekou district, Kenli County, Lijin County, and Shouguang (Figure 1). The estuarine wetland data used in this study were derived from remote sensing (Zhang et al., 2020, 2019). As shown in Figure 1, most of the estuarine wetlands in the Huanghe Delta are located in the eastern and southern parts of Kenli County, the eastern part of the Dongying district, the northern part of the Hekou district, and the northern part of Wudi County.

Figure 1. The estuarine wetlands along the coastal zone of the Huanghe Delta located in Shandong Province of China.
The offshore areas of the Huanghe Delta generally experience irregular semidiurnal tides (Liu et al., 2022) that are mainly influenced by the tidal wave system of the Bohai Sea. The Huanghe River is considered a weak tidal estuary, with an average high tide interval of 10–11 hours. In the neap-spring tidal cycle, there is a significant difference between the average tidal range of spring and neap tides. The average spring tide range is between 1.06 and 1.78 meters, while the average neap tide range is between 0.46 and 0.78 meters. The average duration of the flood tide is 6 hours and 30 minutes, and the average duration of the ebb tide is 9 hours and 24 minutes. During high tides, the wetlands experience extensive inundation, which facilitates the spread of oil spills into more sensitive ecological areas, while low tides may trap oil in exposed mudflats, increasing the persistence of oil in the ecosystem. The wetland area used in this study refers to the region that is submerged during high tide.
The study region experiences distinct seasonal changes, with summer characterized by higher temperatures and stronger winds (Mikhailov et al., 2018), which may accelerate the spread and evaporation of oil, while lower temperatures and reduced wind activity during winter can slow the movement of oil, potentially prolonging its presence in the environment. Additionally, the delta’s coastal variables, such as the rate of sediment deposition and the distribution of coastal vegetation such as Phragmites and Suaeda salsa, may influence the behavior of oil in the ecosystem. The high sedimentation rate in the wetlands may lead to the burial of oil in sediments, further complicating clean-up efforts and hindering ecological recovery.
2.2 Assessment framework and indices
The PSSR model allows for a more detailed and accurate assessment of vulnerability, facilitating better-informed decision-making for environmental management and conservation. In the model, a larger positive indicator indicates greater vulnerability, whereas a larger negative indicator reflects lower vulnerability.
1. “Pressure” refers to the degree of adverse impacts on the Huanghe Estuary due to oil spill stress, with the distribution range of oil spill sources being the main pressure faced by the wetlands. The Bohai Sea contains a high concentration of various risk sources, significantly elevating the likelihood of oil spill exposure in the coastal wetlands of the Huanghe Estuary. The five indices representing these oil spill risk sources consist of oil reservoirs on land, oil transmission lines, oil rigs, ships, and shipping lanes. Therefore, these are positive indicators.
2. “Situation” is determined by the static geographical environment of the Huanghe Estuary itself, such as the distance from the shoreline and the water depth at high tide. To be specific, with greater distance from the coast, the likelihood of marine oil spills reaching wetlands decreases, making the wetlands less vulnerable; as the water depth increases, the capacity for exchange becomes greater, resulting in reduced vulnerability to oil spills. Therefore, the situation indicators are all negative indicators.
3. “Sensitivity” refers to the degree to which the wetlands in the Huanghe Estuary respond to oil spill disturbances, which is determined by the dynamic environmental characteristics of the area surrounding the delta wetlands. The dispersion of spilled oil is influenced by the interactions between wind, waves, and currents (Abascal et al., 2010). Greater wind speeds facilitate the spread of oil spills, leading to reduced sensitivity. As the wave height and water flow velocity increase, the oil spill is more likely to be dispersed, resulting in decreased sensitivity. Therefore, the indicators of sensitivity are all negative indicators.
4. “Recovery” refers to the effective measures taken by humans to mitigate the impact of oil spill disasters and the ability to recover from them. Maritime management authorities are equipped with corresponding emergency facilities for oil spill incidents. In this study, the number of these facilities was used to represent adaptability, where the greater the number of facilities, the higher the adaptability and the lower the vulnerability. Therefore, the recovery indicators are negative indicators.
Overall, based on comprehensive consideration of the timeliness and accessibility of available data, a total of 19 evaluation indicators were selected to establish the evaluation indicator framework for wetlands in the Huanghe Estuary under oil spill stress (Table 1).

Table 1. Indicators used in the pressure-situation-sensitivity-recovery framework.
2.3 Research methods
2.3.1 Weight determination
Once the index system was established, the next crucial step in the vulnerability assessment was determining the index weights. Existing studies generally categorize weighting methods into two main types: objective and subjective (Ustinovichius, 2007). Objective methods assign weights to indicators based on statistical data, thereby minimizing personal bias. In contrast, subjective methods, such as the AHP, rely on expert judgment and experience. Although objective methods are often regarded as more credible due to their data-driven nature, the AHP is widely utilized to incorporate structured and transparent expert knowledge into the weighting process. In this study, AHP was employed not to eliminate subjectivity but to systematically integrate expert judgment in a manner that ensured consistency and reduced arbitrary bias. AHP mainly includes the following steps:
(1) Problem decomposition. This step decomposes the complex problem into a multi-level hierarchical structure that typically includes a goal layer, criteria layer, and indicator layer. The goal layer represents the ultimate objective of the decision, the criteria layer represents the standards or criteria for achieving the objective, and the indicator layer represents the options being considered.
(2) Constructing the judgment matrix. In this step, pairwise comparisons of elements are conducted and used to construct a judgment matrix. The elements in the judgment matrix indicate the relative importance of each pair of elements concerning a specific criterion. A scale of 1-9 is commonly used to rate relative importance.
(3) Calculating eigenvectors and weights. In this step, the eigenvector of the judgment matrix is calculated to obtain the relative weights of the elements, which is represented by .
(4) Consistency Check. In this step, a consistency check of the judgment matrix is performed to ensure the reasonableness and consistency of the judgments. If the consistency ratio (CR) is less than 0.1, the judgment matrix is considered to have satisfactory consistency. The CR is defined by the following equation:
The consistency Index (CI) is defined as:
where is the largest Eigen value derived from the comparison matrix and n is the number of criteria.
The Random Index (RI) refers to a randomly generated reciprocal matrix from the 9 point scale. This value can be determined by referring to the RI table (Table 2) (Saaty, 1987).

Table 2. The number of criteria (n) and random index (RI) values.
(5) Comprehensive evaluation: In this step, the comprehensive evaluation value of each alternative relative to the overall goal is determined based on the weights of each level and the alternatives are ranked.
2.3.2 GIS-based vulnerability assessment model
In this study, all the indicator data are discrete and vary widely. Therefore, the inverse distance weighting interpolation method is used to interpolate the discrete data into spatially continuous data, facilitating subsequent vulnerability assessment using geographic information system weighting methods. In addition, all the interpolated data is converted into spatial raster data using GIS methods to facilitate subsequent spatial weighting. Subsequently, positive indicators are normalized via Equation 3, while negative indicators are normalized via Equation 4.
where represents the normalized score of the i-th positive indicator, represents the normalized score of the i-th negative indicator, x represents the true values of the spatial distribution, Min is the minimum value of each indicator, and Max is the maximum value of each indicator.
The vulnerability index is calculated based on the indicator weights determined by AHP, and the vulnerability index is calculated using the following formula:
In the formula, VI represents vulnerability index, with a value range of [0, 1], and is the weight of the i-th indicator.
The quantile method is a statistical technique used to divide a dataset into intervals based on the data distribution, often yielding equal-sized groups. This method is commonly employed in data analysis to categorize data points and make comparisons (Lodder and Hieftje, 1988). This study used the quantile method in the GIS to classify the VI into five grades: Very Low, Low, High, and Very High (Table 3). The vulnerability of different spatial regions was then identified based on the classification results.
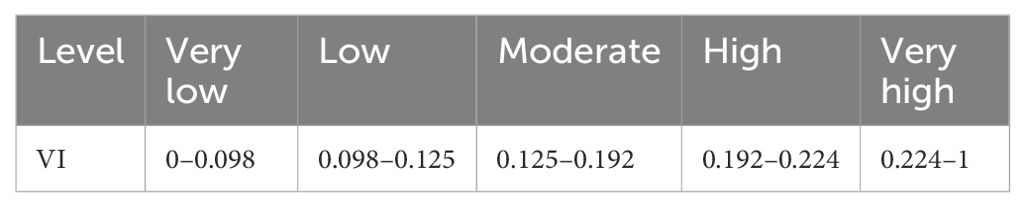
Table 3. Categorization of the vulnerability index (VI) into five levels using the quantile method in the GIS program.
3 Results and discussion
3.1 Weight distribution based on AHP
The pressure indicator was found to be the greatest influencer of vulnerability, with ships being the highest-weighted factor within this category, followed by oil rigs. In contrast, the situation indicator had the lowest impact, with the number of chemical splash proof suits and tugboats having the smallest weights among all indicators. Weight allocation details are summarized in Table 4.
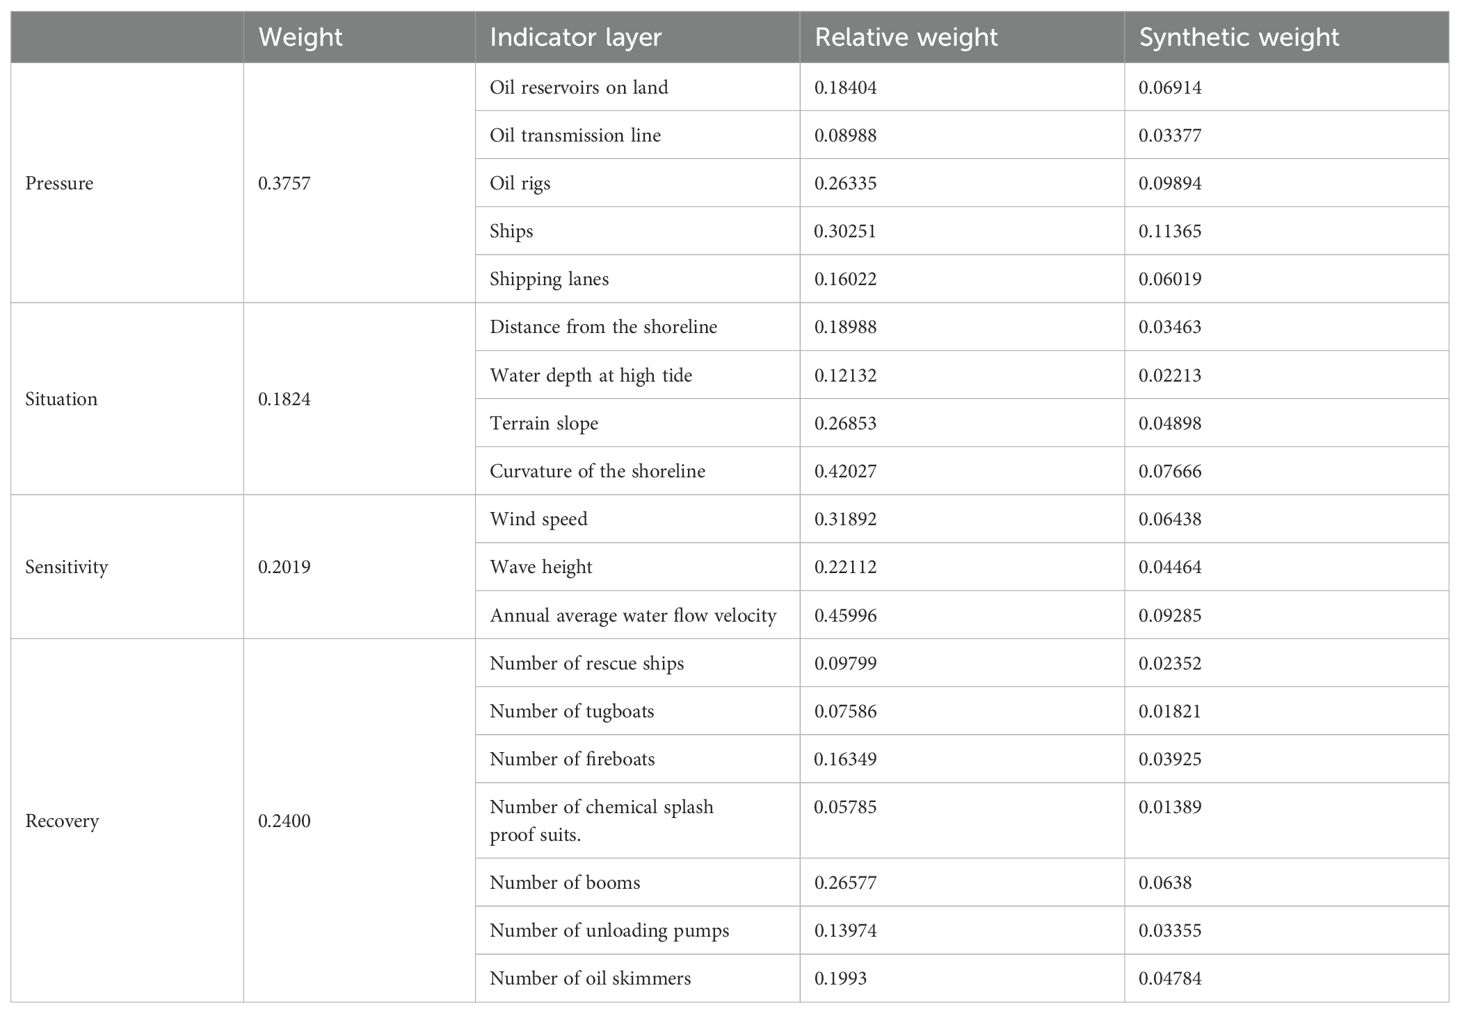
Table 4. Weight allocation of each indicator.
The results of the weight calculation based on AHP provided significant insights into the factors affecting vulnerability in maritime environments. According to the results, the higher weights assigned to pressure indicators such as ships and oil rigs reflect a preventive focus. Addressing the vulnerabilities associated with these indicators can prevent large-scale incidents from occurring, thereby reducing overall vulnerability. However, situation indicators are more reactive, coming into play once an incident has occurred. While important for immediate response and containment, their role in overall vulnerability reduction is less pronounced than preventive measures associated with pressure indicators. The advantage of AHP lies in quantifying qualitative judgments to integrate qualitative factors into quantitative analysis and thereby enhance the evaluation. However, AHP also has several limitations (Munier et al., 2021). For example, it assumes that the indicators are independent of each other, but in this study the indicators often had mutual influences and interactive effects (such as the coordination between different rescue capabilities). Therefore, in future studies this method must be employed appropriately, according to specific situations, while supplementing its shortcomings with additional means and methods to enhance the reliability of decisions made based on the method.
This study adopted several typical indicators used in previous research and achieved reasonable results. For example, sources of oil spills that can harm estuarine wetlands primarily consist of oil reservoirs on land, oil transmission lines, oil rigs, ships, and shipping lanes, while the capability of estuarine wetlands to respond to the threat of oil spills mainly relies on the number of available rescue ships, tugboats, fireboats, chemical splash-proof suits, booms, unloading pumps, and oil skimmers (Wang et al., 2018). The present study adopted these indicators for the evaluation of pressure and recovery. Wind speed and wave height were the primary influencers of the spread of oil spills in wetland waters (Abascal et al., 2010). Specifically, a higher wind speed was associated with an easier spread of oil, while larger waves indicate that it is less likely for oil to accumulate after a spill. Therefore, in areas with high wind speeds and wave heights, the vulnerability of wetlands under the stress of oil spills is lower. The principles for selecting other indicators were similar and are not elaborated on here. In summary, we successfully constructed an assessment system for evaluation of the vulnerability of estuarine wetlands under oil spill stress through the PSSR framework. However, it is important to note that there were certain limitations. Specifically, data availability and the scale of analysis may have affected the accuracy of the findings. Future studies should focus on long-term monitoring, incorporating higher resolution data, and expanding the range of indicators to include social and economic factors.
3.2 Spatial variations of pressure, situation, sensitivity and recovery
We developed spatial differentiation maps for the wetlands illustrating the pressure, situation, sensitivity, and recovery using a spatial weighted analysis based on the relative weights of each indicator. As shown in Figure 2A, most of the wetlands were found to be under high pressure due to oil spills, particularly in the northern regions. Only the wetlands in the southeastern part of Kenli County exhibited low or relatively low pressure.
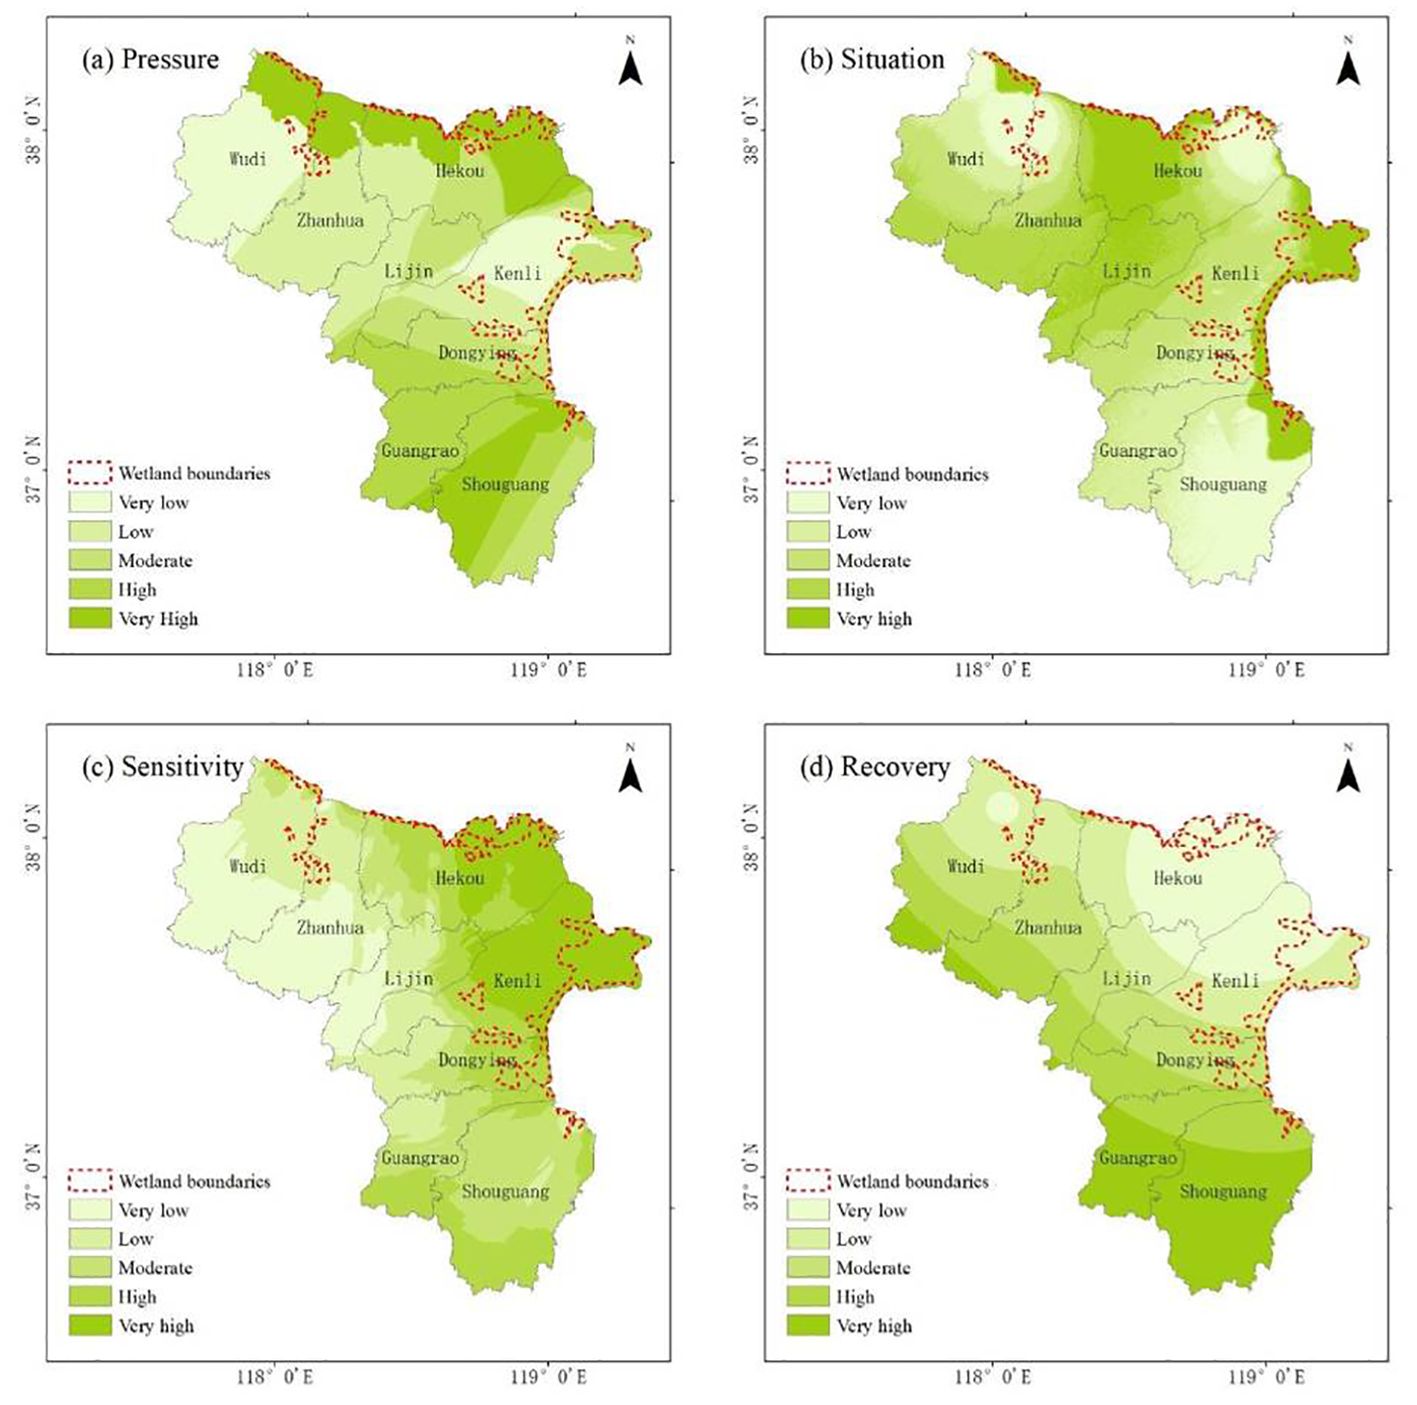
Figure 2. Spatial variation of the integrated (A) pressure, (B) situation, (C) sensitivity, and (D) recovery of the Huanghe Estuary coastal wetlands.
With the exception of wetlands in the northern estuary area and the scattered wetlands in the central region of Wudi County (Figure 2B), the situation values for the wetlands were generally very high or high. As shown in Figure 2C, with the exception of wetlands in Wudi County, the sensitivity of wetlands was generally high. As shown in Figure 2D, most of the estuarine wetlands were in areas with very low and low recovery capacity. The recovery capacity of wetlands in the northern part of Wudi County was found to be low, while that of wetlands in the eastern part of Dongying District was found to be in the moderate range.
3.3 Spatial variation of vulnerability
As shown in Figure 3, the vulnerability of wetlands located at different locations in the Huanghe Estuary under oil spill stress differed significantly. Wetlands in the northern part of Wudi County were highly vulnerable, while the scattered wetlands in the central parts of Wudi and Zhanhua counties showed low vulnerability. Wetlands in the northern coastal area exhibited high vulnerability. In Kenli District, coastal wetlands were found to be highly vulnerable, while those in inland areas showed low vulnerability. In the Dongying district, the vulnerability of wetlands was very high and high. The small patches of wetlands in Shouguang District also exhibited very high and high vulnerability under oil spill stress.
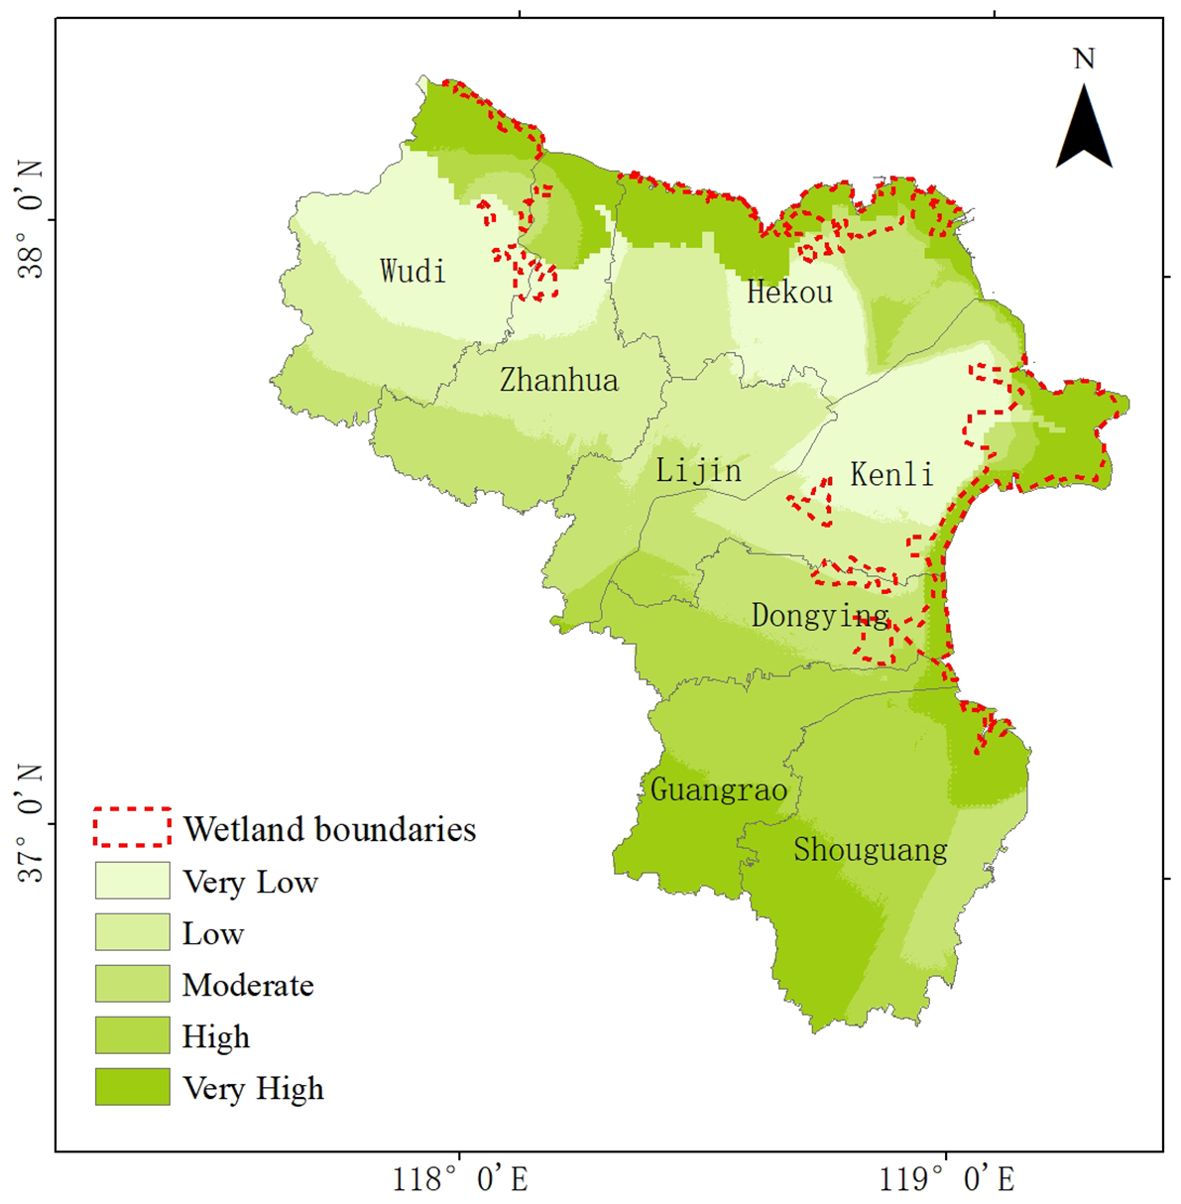
Figure 3. Spatial variation of the integrated vulnerability of the Huanghe Estuary coastal wetlands.
This study revealed significant spatial variations in the vulnerability of wetlands in the Huanghe Estuary under oil spill stress that were driven largely by differences in geographical location and environmental characteristics. Specifically, wetlands closer to the coastline, such as those in the northern parts of Wudi County and the coastal areas of the estuary, exhibited higher vulnerability due to their direct exposure to marine pollution sources. In contrast, scattered wetlands located further inland, particularly in the central regions of Wudi and Zhanhua counties, demonstrated lower vulnerability, likely due to natural barriers and distance from pollutant sources.
The environmental characteristics of these regions play a crucial role in determining the resilience of wetlands (Rezaie et al., 2020). It is also important to note that the deployment of oil spill response facilities significantly enhances the recovery process for affected wetlands (Lindstedt-Siva, 1977), thereby reducing their vulnerability. This is because such facilities enable rapid containment and cleanup, minimizing the duration and severity of exposure to contaminants. These facilities also provide specialized equipment and trained personnel, ensuring efficient restoration efforts. By preventing the spread of oil and facilitating swift remediation, response facilities help protect sensitive ecosystems, promote faster ecological recovery, and ultimately decrease the overall vulnerability of wetlands to environmental disturbances. Therefore, enhancing the ability to recover is an important way to effectively reduce the vulnerability of wetlands to oil spill stress.
3.4 Current risks posed by oil spills to estuarine wetlands in China
Currently, China still faces a severe oil spill situation (Zhu et al., 2022). Statistical analysis revealed that the number of spills and the volume of oil spilled exhibited a clear trend from 2009 to 2022 (Figure 4). It is clear from Figure 4A that although the overall number of leaks has decreased steadily since peaking around the year 2009, the occurrence of leaks over 50 tons has remained relatively stable, with no significant changes over time. As shown in Figure 4B, the leaked volumes over 50 tons demonstrated more variability over the years, with no distinct long-term trend. Although the overall frequency and volume of oil spills showed a declining trend, there was no clear decreasing trend in either the frequency or the volume of large spills exceeding 50 tons. These major incidents are precisely the events that pose the greatest threat to estuarine wetlands and therefore require special attention. As shown in Figure 4, the harm caused to estuarine wetlands by oil spills cannot be significantly reduced in the short term.
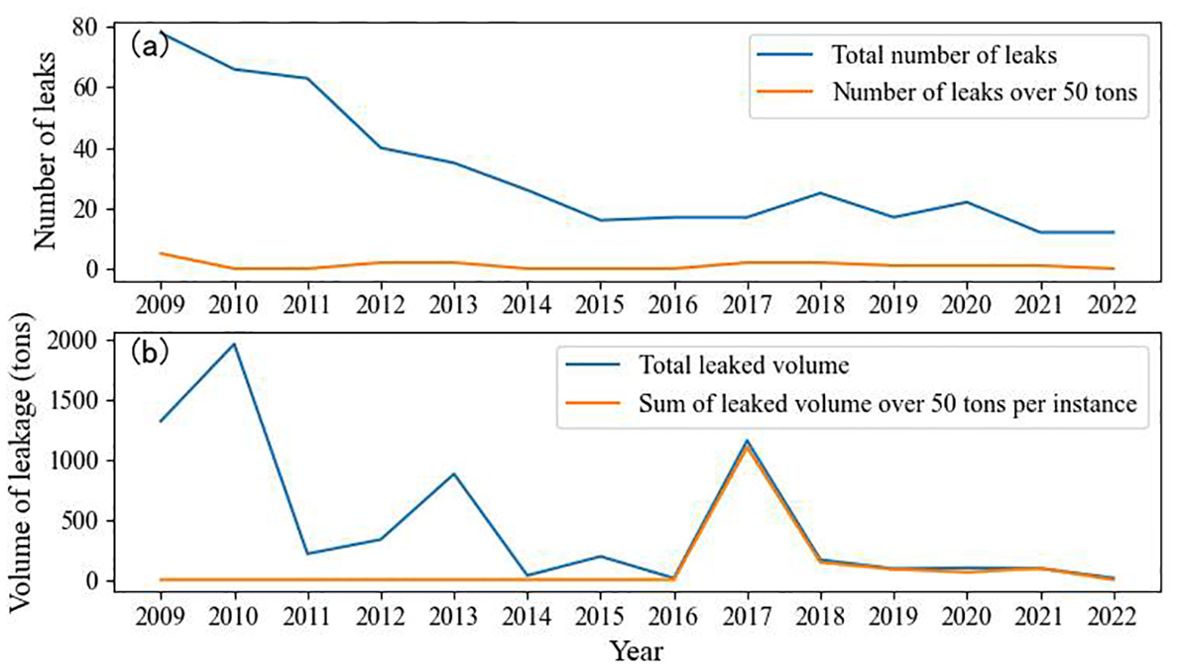
Figure 4. Trends in (A) the number of leaks and (B) volume of leakage in the study area from 2009 to 2022 for all leaks and leaks of over 50 tons per instance.
Targeted management strategies are essential to address these challenges. Improvements can be made in four dimensions: pressure, situation, sensitivity, and recovery. For pressure, environmental regulations, technological standards, and protective measures should be strengthened to reduce the direct impact of oil spills on the wetlands. For situation, establishing a comprehensive environmental monitoring network, conducting dynamic risk assessments, and strengthening regional cooperation can improve overall response capabilities. Sensitivity can be improved by implementing zonal management to protect highly sensitive areas, conducting ecological restoration projects to increase ecosystem resilience, and enhancing scientific research to understand the responses of different plants and animals to oil pollution. For recovery, establishing an efficient emergency response mechanism to quickly clean up oil spills and conducting long-term monitoring to assess recovery effectiveness and adjust measures accordingly are crucial. These improvements can effectively reduce the occurrence of oil spill incidents and enhance wetland ecosystem recovery capacity, thereby protecting this vital ecological resource.
4 Conclusion
Using the PSSR framework, this study provided a comprehensive evaluation of the vulnerability of estuarine wetlands in the Huanghe Estuary to oil spill stress. The results indicate that among all selected indicators, the ships indicator has the highest weight, followed by oil rigs. In contrast, the indicators of the number of chemical splash-proof suits and tugboats have the lowest weights. Vulnerability exhibited significant spatial variation, with areas closer to the coastline showing greater vulnerability to oil spills.
This study proposes a feasible PSSR model for assessing the vulnerability of estuarine wetlands under oil spill stress that can serve as a reference for similar research in other estuarine areas. One major benefit of the PSSR framework is its ability to integrate diverse indicators into a structured evaluation. However, its reliance on the availability of high-quality data is a limitation. In this study, some indicators—particularly indicators related to response capabilities, such as the availability of chemical splash-proof suits and tugboats—were found to have minimal influence. Future research should explore additional or alternative indicators, such as the ecological restoration capacity and the effectiveness of mitigation strategies, to enhance the comprehensiveness of the model.
The use of the AHP method enabled the systematic comparison of indicators. However, its inherent subjectivity remains a drawback. To address this, future work could incorporate more objective weighting techniques, such as machine-learning algorithms, to reduce subjectivity and enhance the robustness of the model. In addition, further studies should aim to fill gaps in data availability, particularly regarding the long-term ecological impacts of oil spills, to refine vulnerability assessments in estuarine wetlands.
Data availability statement
The raw data supporting the conclusions of this article will be made available by the authors, without undue reservation.
Author contributions
XZ: Conceptualization, Investigation, Writing – original draft. CZ: Writing – review & editing. XC: Writing – review & editing. PS: Writing – review & editing.
Funding
The author(s) declare that financial support was received for the research, authorship, and/or publication of this article. This research was funded by the National Key R&D Program of China (2022YFB4301403).
Conflict of interest
The authors declare that the research was conducted in the absence of any commercial or financial relationships that could be construed as a potential conflict of interest.
Publisher’s note
All claims expressed in this article are solely those of the authors and do not necessarily represent those of their affiliated organizations, or those of the publisher, the editors and the reviewers. Any product that may be evaluated in this article, or claim that may be made by its manufacturer, is not guaranteed or endorsed by the publisher.
References
Abascal A. J., Castanedo S., Medina R., Liste M. (2010). Analysis of the reliability of a statistical oil spill response model. Mar. pollut. Bull. 60, 2099–2110. doi: 10.1016/j.marpolbul.2010.07.008
Alem D., Bonilla-Londono H. F., Barbosa-Povoa A. P., Relvas S., Ferreira D., Moreno A. (2021). Building disaster preparedness and response capacity in humanitarian supply chains using the Social Vulnerability Index. Eur. J. Operational Res. 292, 250–275. doi: 10.1016/j.ejor.2020.10.016
Ayyam V., Palanivel S., Chandrakasan S., Ayyam V., Palanivel S., Chandrakasan S. (2019). “Coastal wetlands: status and strategies for development,” in Coastal Ecosystems of the Tropics-Adaptive Management (Singapore: Springer), 107–135.
Balogun A. L., Yekeen S. T., Pradhan B., Althuwaynee O. F. (2020). Spatio-temporal analysis of oil spill impact and recovery pattern of coastal vegetation and wetland using multispectral satellite landsat 8-OLI imagery and machine learning models. Remote Sens. 12, 1225. doi: 10.3390/rs12071225
Barron M. G., Vivian D. N., Heintz R. A., Yim U. H. (2020). Long-term ecological impacts from oil spills: comparison of Exxon Valdez, Hebei Spirit, and Deepwater Horizon. Environ. Sci. Technol. 54, 6456–6467. doi: 10.1021/acs.est.9b05020
Chang D., Wang Z., Ning X., Li Z., Zhang L., Liu X. (2022). Vegetation changes in Yellow River Delta wetlands from 2018 to 2020 using PIE-Engine and short time series Sentinel-2 images. Front. Mar. Sci. 9, 977050. doi: 10.3389/fmars.2022.977050
Costanza R., Anderson S. J., Sutton P., Mulder K., Mulder O., Kubiszewski I., et al. (2021). The global value of coastal wetlands for storm protection. Global Environ. Change 70, 102328. doi: 10.1016/j.gloenvcha.2021.102328
Cui L., Ge Z., Yuan L., Zhang L. (2015). Vulnerability assessment of the coastal wetlands in the Yangtze Estuary, China to sea-level rise. Estuarine Coast. Shelf Sci. 156, 42–51. doi: 10.1016/j.ecss.2014.06.015
Gari S. R., Newton A., Icely J. D. (2015). A review of the application and evolution of the DPSIR framework with an emphasis on coastal social-ecological systems. Ocean Coast. Manage. 103, 63–77. doi: 10.1016/j.ocecoaman.2014.11.013
Guo W., Zhang S., Wu G. (2019). Quantitative oil spill risk from offshore fields in the Bohai Sea, China. Sci. total Environ. 688, 494–504. doi: 10.1016/j.scitotenv.2019.06.226
Hidalgo-Corrotea C., Alaniz A. J., Vergara P. M., Moreira-Arce D., Carvajal M. A., Pacheco-Cancino P., et al. (2023). High vulnerability of coastal wetlands in Chile at multiple scales derived from climate change, urbanization, and exotic forest plantations. Sci. Total Environ. 903, 166130. doi: 10.1016/j.scitotenv.2023.166130
Lindstedt-Siva J. (1977). “Oil spill response planning for biologically sensitive areas,” in International Oil Spill Conference, vol. 1977. (Los Angeles, California, USA: American Petroleum Institute), 111–114.
Liu S., Goff J. A., Gao S., Feng A., Wang Y. P., Jia J., et al. (2022). The impact of gravity-driven sedimentation on reshaping the huanghe (Yellow river) delta front. J. Geophysical Research: Earth Surface 127, e2022JF006717. doi: 10.1029/2022JF006717
Liu X., Meng R., Xing Q., Lou M., Chao H., Bing L. (2015). Assessing oil spill risk in the Chinese bohai Sea: A case study for both ship and platform related oil spills. Ocean Coast. Manage. 108, 140–146. doi: 10.1016/j.ocecoaman.2014.08.016
Lodder R. A., Hieftje G. M. (1988). Quantile analysis: a method for characterizing data distributions. Appl. Spectrosc. 42, 1512–1520. doi: 10.1366/0003702884429724
Marignani M., Bruschi D., Garcia D. A., Frondoni R., Carli E., Pinna M. S., et al. (2017). Identification and prioritization of areas with high environmental risk in Mediterranean coastal areas: A flexible approach. Sci. Total Environ. 590, 566–578. doi: 10.1016/j.scitotenv.2017.02.221
Men B., Liu H. (2018). Water resource system vulnerability assessment of the Heihe River Basin based on pressure-state-response (PSR) model under the changing environment. Water Sci. Technology: Water Supply 18, 1956–1967. doi: 10.2166/ws.2018.017
Mendelssohn I. A., Andersen G. L., Baltz D. M., Caffey R. H., Carman K. R., Fleeger J. W., et al. (2012). Oil impacts on coastal wetlands: implications for the Mississippi River Delta ecosystem after the Deepwater Horizon oil spill. BioScience 62, 562–574. doi: 10.1525/bio.2012.62.6.7
Michel J., Rutherford N. (2014). Impacts, recovery rates, and treatment options for spilled oil in marshes. Mar. pollut. Bull. 82, 19–25. doi: 10.1016/j.marpolbul.2014.03.030
Mikhailov V. N., Kravtsova V. I., Inyushin A. N., Mikhailova M. V. (2018). Variations of trends in delta development under the effect of external natural and anthropogenic factors: case study of the modern Huang He mouth. Water Resour. 45, 466–478. doi: 10.1134/S0097807818040164
Munier N., Hontoria E., Munier N., Hontoria E. (2021). Shortcomings of the AHP Method. Uses and Limitations of the AHP Method: A Non-Mathematical and Rational Analysis. (Cham, Switzerland: Springer), 41–90.
Narayan S., Beck M. W., Wilson P., Thomas C. J., Guerrero A., Shepard C. C., et al. (2017). The value of coastal wetlands for flood damage reduction in the northeastern USA. Sci. Rep. 7, 1–12. doi: 10.1038/s41598-017-09269-z
Nelson J. R., Grubesic T. H., Sim L., Rose K., Graham J. (2015). Approach for assessing coastal vulnerability to oil spills for prevention and readiness using GIS and the Blowout and Spill Occurrence Model. Ocean Coast. Manage. 112, 1–11. doi: 10.1016/j.ocecoaman.2015.04.014
Pezeshki S. R., DeLaune R. D. (2015). United States Gulf of Mexico coastal marsh vegetation responses and sensitivities to oil spill: a review. Environments 2, 586–607. doi: 10.3390/environments2040586
Polsky C., Neff R., Yarnal B. (2007). Building comparable global change vulnerability assessments: The vulnerability scoping diagram. Global Environ. Change 17, 472–485. doi: 10.1016/j.gloenvcha.2007.01.005
Rezaie A. M., Loerzel J., Ferreira C. M. (2020). Valuing natural habitats for enhancing coastal resilience: Wetlands reduce property damage from storm surge and sea level rise. PloS One 15, e0226275. doi: 10.1371/journal.pone.0226275
Rodrigues F. H., de Andrade Kolya A., Veiga V. M., Dos Santos S. F., Wieczorek A., dos Santos Corrêa C. V., et al. (2023). Oil spill environmental sensitivity mapping of Rio de Janeiro, Brazil. Mar. pollut. Bull. 197, 115682. doi: 10.1016/j.marpolbul.2023.115682
Saaty R. W. (1987). The analytic hierarchy process—what it is and how it is used. Math. Model. 9, 161–176. doi: 10.1016/0270-0255(87)90473-8
Saaty T. L. (1980). The Analytic Hierarchy Process: Planning, Priority Setting, Resources Allocation ((Decision Making Series)); Mcgraw-Hill, New York, USA.
Thorne K., MacDonald G., Guntenspergen G., Ambrose R., Buffington K., Dugger B., et al. (2018). US Pacific coastal wetland resilience and vulnerability to sea-level rise. Sci. Adv. 4, eaao3270. doi: 10.1126/sciadv.aao3270
Ustinovichius L. (2007). Methods of determining objective, subjective and integrated weights of attributes. Int. J. Manage. decision making 8, 540–554. doi: 10.1504/IJMDM.2007.013417
Wang Y., Du P., Liu B., Wu X. (2023). Geographic information system-based comprehensive oil spill risk assessment in China’s Bohai Sea. Front. Mar. Sci. 10, 1141962. doi: 10.3389/fmars.2023.1141962
Wang Y., Zhang C., Feng L., Tang C., Yu X., Zheng X., et al. (2018). Determination of refuge places for oil tankers in emergencies in the Chinese Bohai Sea. Mar. Policy 90, 95–104. doi: 10.1016/j.marpol.2018.01.002
Xia H., Liu L., Bai J., Kong W., Lin K., Guo F. (2020). Wetland ecosystem service dynamics in the Yellow River estuary under natural and anthropogenic stress in the past 35 years. Wetlands 40, 2741–2754. doi: 10.1007/s13157-020-01368-4
Yan J., Zhu J., Zhao S., Su F. (2023). Coastal wetland degradation and ecosystem service value change in the Yellow River Delta, China. Global Ecol. Conserv. 44, e02501. doi: 10.1016/j.gecco.2023.e02501
Yang W., Zhang Z., Sun T., Liu H., Shao D. (2021). Marine ecological and environmental health assessment using the pressure-state-response framework at different spatial scales, China. Ecol. Indic. 121, 106965. doi: 10.1016/j.ecolind.2020.106965
Zhang C., Durgan S. D., Lagomasino D. (2019). Modeling risk of mangroves to tropical cyclones: A case study of Hurricane Irma. Estuarine Coast. Shelf Sci. 224, 108–116. doi: 10.1016/j.ecss.2019.04.052
Zhang X., Liu L., Chen X., Xie S., Gao Y. (2019). Fine land-cover mapping in China using landsat datacube and an operational SPECLib-based approach. Remote Sens. 11, 1056. doi: 10.3390/rs11091056
Zhang X., Liu L., Wu C., Chen X., Gao Y., Xie S., et al. (2020). Development of a global 30 m impervious surface map using multisource and multitemporal remote sensing datasets with the Google Earth Engine platform. Earth System Sci. Data 12, 1625–1648. doi: 10.5194/essd-12-1625-2020
Zhang X., Wang L., Fu X., Li H., Xu C. (2017). Ecological vulnerability assessment based on PSSR in Yellow River Delta. J. Cleaner Production 167, 1106–1111. doi: 10.1016/j.jclepro.2017.04.106
Zhang X., Xue X. (2013). Analysis of marine environmental problems in a rapidly urbanising coastal area using the DPSIR framework: a case study in Xiamen, China. J. Environ. Plann. Manage. 56, 720–742. doi: 10.1080/09640568.2012.698985
Keywords: susceptibility analysis, PSSR framework, GIS, AHP, risk mitigation
Citation: Zhang X, Zhang C, Chen X and Su P (2024) Evaluation of the vulnerability of Huanghe estuary coastal wetlands to marine oil spill stress. Front. Mar. Sci. 11:1481868. doi: 10.3389/fmars.2024.1481868
Received: 16 August 2024; Accepted: 23 September 2024;
Published: 10 October 2024.
Edited by:
Abida Farooqi, Quaid-i-Azam University, PakistanReviewed by:
Claudio Fabian Szlafsztein, Federal University of Pará, BrazilNuanchan Singkran, Mahidol University, Thailand
Copyright © 2024 Zhang, Zhang, Chen and Su. This is an open-access article distributed under the terms of the Creative Commons Attribution License (CC BY). The use, distribution or reproduction in other forums is permitted, provided the original author(s) and the copyright owner(s) are credited and that the original publication in this journal is cited, in accordance with accepted academic practice. No use, distribution or reproduction is permitted which does not comply with these terms.
*Correspondence: Xiao Zhang, enh4bWx6aEAxNjMuY29t