- 1Department of Maritime Police and Production System/Institute of Marine Industry, Gyeongsang National University, Tongyeong, Republic of Korea
- 2School of Earth and Environmental Sciences/Research Institute of Oceanography, Seoul National University, Seoul, Republic of Korea
- 3Advanced Infrastructure Operations Center, Korea Institute of Ocean Science and Technology, Busan, Republic of Korea
- 4Department of Ocean Science, University of Science and Technology, Daejeon, Republic of Korea
- 5Office of the Vice President, Korea Institute of Ocean Science and Technology, Busan, Republic of Korea
Sound scattering layers (SSLs) are vital components of marine ecosystems, yet their morphometric and distributional characteristics remain understudied. This study investigates the SSL core in the southwestern Indian Ocean using a 38 kHz echosounder, focusing on its attributes across latitudinal gradients (20–4°S, 65°E) and three depth layers: epipelagic (0–100 m), intermediate (100–300 m), and mesopelagic (300–600 m). Our findings reveal the highest average acoustic values in the epipelagic layer (–72.9 dB), followed by the mesopelagic layer (–77.8 dB) and the intermediate layer (–82.5 dB). The SSL core was more prominent in northern latitudes (NLS) and showed greater depth variability in southern latitudes (SLS), with vertical profile peaks at 42.2 m and 431.1 m. In the NLS, the SSL core was longer (18,358 m > 6,788 m), thicker (13.8 m > 11.7 m), and more concentrated (aggregation index: 0.0053 m−1 > 0.004 m−1), as well as more dispersed from the center (inertia: 269.9 m² > 112.7 m²). Notably, depth and acoustic fluctuations were more pronounced over circadian cycles in the SLS than in the NLS. Multiple regression analysis revealed that oceanographic factors influencing acoustic values varied by depth, highlighting the complex interactions within SSL ecosystems. These insights enhance our understanding of SSL dynamics and their implications for long-term monitoring and climate influence assessment.
1 Introduction
The Indian Ocean, covering approximately 20% of the global ocean area, is a unique and important marine environment that remains poorly understood than the Pacific and Atlantic Oceans. Its distinctive geographical setting, with a northern boundary in the tropics, contributes to a monsoon climate characterized by seasonally reversing winds and substantial summer rainfall, setting it apart from other major oceans. As the warmest of the major oceans, with an average equatorial temperature of around 28°C, the Indian Ocean’s shape—bounded to the north by Asia—plays a crucial role in its hydrology and climate interactions. Distinct oceanographic and climatic features in the Indian Ocean influence the distribution and abundance of marine life, including large predatory species such as yellowfin tuna, bigeye tuna, swordfish, and mesopelagic organisms. Marine fauna are distributed across various biogeochemical provinces under different environmental conditions, including sea surface temperature (SST), chlorophyll-a (Chl-a) concentration, salinity, water column stratification, and thermocline depth (Turner, 1984; Bakun et al., 1998; Bertrand et al., 2002; Potier et al., 2007, 2008, 2014; Reygondeau et al., 2012). Recent studies show that rising ocean temperatures adversely affect marine ecosystems, with phytoplankton—the base of the marine food web—declining by up to 20% over the past 60 years (Roxy et al., 2016; Smitha et al., 2023; Wang et al., 2023).
In the southwestern Indian Ocean, an open-ocean upwelling referred to as Seychelles-Chagos Thermocline Ridge (SCTR) or Thermocline Ridge of the Indian Ocean (Yokoi et al., 2008; Hermes and Reason, 2009; Jayakumar et al., 2011), influences ecosystem-biogeochemical variability and climate phenomena such as the Indian Ocean Dipole (IOD), El Niño Southern Oscillation, and Madden-Julian Oscillation (Baquero-Bernal et al., 2002; Li et al., 2014; Burns and Subrahmanyam, 2016; D’Addezio and Subrahmanyam, 2018). This upwelling region, located from 2°S to 15°S, is driven by mean westerly winds and their associated curl, contrasting with the easterly and southeasterly winds of the Pacific and Atlantic Oceans (Schott and McCreary, 2001; Schott et al., 2009; Wang and McPhaden, 2017). It is characterized by a thin mixed layer and a shallow thermocline depth, often represented by the 20°C isotherm depth (D20), which indicates subsurface upwelling strength (Xie et al., 2002; Schott et al., 2009; Lee et al., 2022). Biogeochemical cycles in this upwelling region affect upper ocean nutrients and marine organisms, such as micronekton, phytoplankton, and tuna species that forage in phytoplankton habitats (Xie et al., 2002; Lan et al., 2013; Kumar et al., 2014; Marsac, 2017; George et al., 2018). Dome-like features resulting from open-ocean upwelling have significant ecological implications, including nutrient enrichment, enhanced biological productivity, biodiversity hotspots, carbon sequestration, oceanic oxygen supply, and climate regulation. These features bring nutrient-rich waters from deeper layers to the surface, facilitating phytoplankton growth in the euphotic layer due to essential nutrients such as nitrogen, phosphorus, and iron, thereby supporting the entire marine food web. Upwelled nutrients fuel phytoplankton blooms that support zooplankton and other marine organisms, creating a productivity cascade that benefits fisheries and ecosystems (Filipe, 1997; Dai et al., 2016; Décima et al., 2016; Ndour et al., 2018).
Marine fauna in the open ocean exhibit complex structures influenced by spatial and temporal scales, with variability driven by factors such as temperature, currents, predator density, and food availability. A significant portion of this biomass is concentrated in sound scattering layers (SSLs), first observed in echosounders in the mid-20th century. SSLs consist of diverse species, including myctophids, stomiiform fish, squid, shrimp, and gelatinous zooplankton, complicating biomass estimation using acoustic data alone (Kloser et al., 2009; Peña et al., 2014; Klevjer et al., 2016; Knutsen et al., 2017; Proud et al., 2017; Annasawmy et al., 2018; Kang et al., 2024). Multifrequency acoustic backscatter data provide valuable ecological insights, revealing that biogeographic patterns and hydrographic features influence SSL structure (Kang et al., 2024). SSLs often undertake diel vertical migrations (DVM), moving from the mesopelagic zone (200–1000 m) to near-surface waters at night to avoid visual predators and forage (Ariza et al., 2016; Proud et al., 2017; Gjøsæter et al., 2020; Kang et al., 2021). These vertical migrators play crucial roles in marine food webs and biogeochemical cycles, linking surface primary production to higher trophic levels and contributing to the downward flux of nutrients and organic matter (Danckwerts et al., 2014; Jaquemet et al., 2014; Sato and Benoit-Bird, 2017; Kang et al., 2021). Recent studies suggest that the global biomass of mesopelagic fish might be significantly underestimated, highlighting the need for better data on biomass distribution and migration dynamics for global Earth system models (Irigoien et al., 2014). Factors such as light intensity, salinity, oxygen concentration, temperature, moon phase, oceanographic and bathymetric features, and productivity affect SSL behavior and distribution, underscoring the complexity and ecological significance of these layers in the open ocean (Davison et al., 2015; Klevjer et al., 2016; Aksnes et al., 2017; Proud et al., 2017; Langbehn et al., 2019; Annasawmy et al., 2020; Bernal et al., 2020; Boswell et al., 2020).
Vertical and horizontal SSL distributions under various oceanographic conditions have been investigated to explore the factors driving DVM and to examine species composition through net sampling (Kloser et al., 2009; Peña et al., 2014; Klevjer et al., 2016; Knutsen et al., 2017; Kang et al., 2024). It is well established that SSLs are vertically thin and horizontally extensive, ranging from tens to hundreds of meters vertically and extending horizontally for tens to thousands of kilometers (Simmonds and MacLennan, 2005; Lee et al., 2013; Kang et al., 2021). In fisheries acoustics, biological aggregations, such as schools, shoals, and swarms, have been quantitatively defined, and several standard protocols and methods for their identification and description are well documented (Barange, 1994; Coetzee, 2000; Reid, 2000). However, defining SSL boundaries remains challenging due to their extensive horizontal spread, complicating the extraction of their morphological characteristics. A significant knowledge gap exists in defining SSL cores and identifying their morphological features and distributional dynamics. Investigating the core regions of SSLs in the southwestern Indian Ocean, where unique ocean environmental conditions such as the SCTR exist, and understanding how these characteristics relate to oceanographic parameters, are crucial research areas. This study aimed to address these gaps and explore variations in the distribution of SSL cores across different latitudes in the southwestern Indian Ocean.
2 Materials and methods
2.1 Field investigation
Acoustic data were collected in the southwest Indian Ocean using a Simrad EK80 scientific echosounder operating at 18, 38, 70, 120, 200, and 333 kHz aboard the R/V Isabu (5,894 tons). Six transducers were positioned 6 meters below the sea surface, and this 6-meter draft was applied to all depth-related results. The cruise departed from Port Louis, Mauritius, on May 15, 2023, with acoustic data recorded up to 4°S latitude by May 31, 2023. The echosounder produced no data until the cruise track shifted toward the Maldives, resulting in usable acoustic data from 20°S to 4°S latitude along 65°E longitude (Figure 1). The echosounder was calibrated on February 4, 2020, following standard procedures near Geoje Island (34°52.6830’N, 128°48.3219’E). To account for the shift in calibration values over time, backscattering values from an uncalibrated echosounder were compared to those from a calibrated sounder using linear regression. Consequently, the values from the two echosounders are proportional (Demer et al., 2015). Calibration generally influences key acoustic parameters, including Target Strength (TS, dB re m²), Volume Backscatter Strength (Sv, dB re m²/m³), and the beam pattern. Specifically, parameters related to Sv may be affected when detecting the SSL.
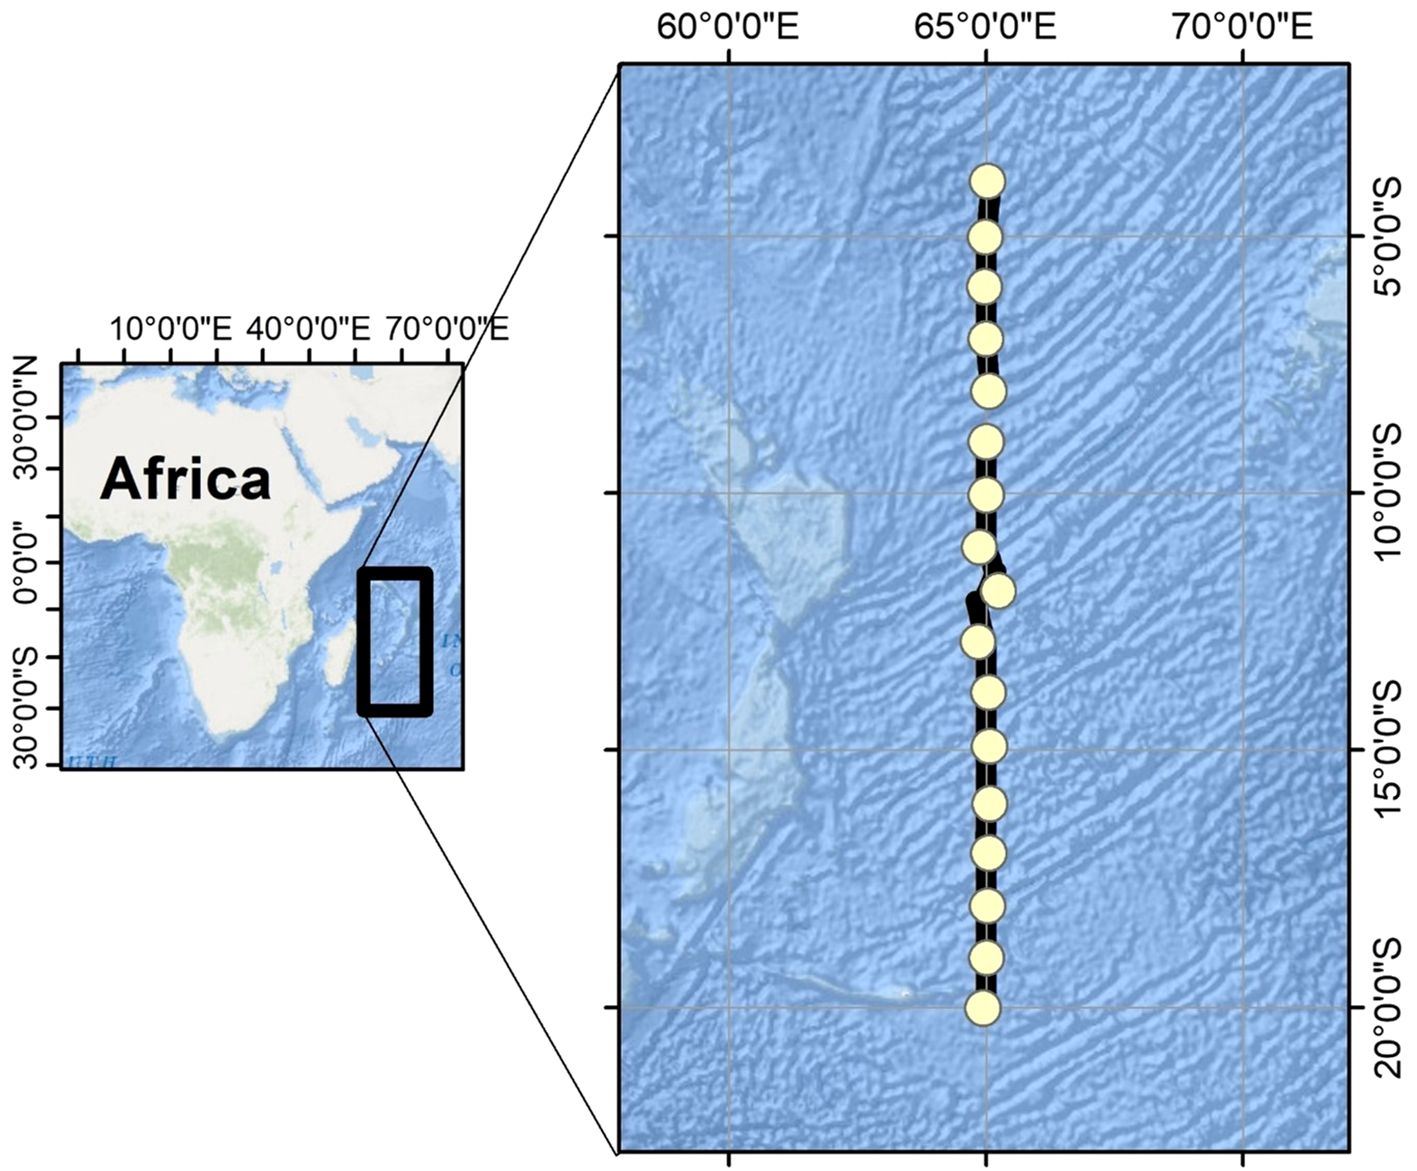
Figure 1. Study area (20–4°S, 65°E) of southwest Indian Ocean. Yellow circles denote CTD stations located at intervals of every 1 degree.
This study utilized the 38 kHz frequency to characterize the SSLs. The frequency’s major and minor beam angles were 6.84° and 6.79°, respectively, with a maximum transmitted power of 2000 W and a pulse duration of 1.024 ms. The ping rate was approximately 0.17 Hz, and a global positioning system ensured accurate data positioning. The study area was divided into two sections along the 12°S latitude: the Northern Latitude Section (NLS) north of 12°S and the Southern Latitude Section (SLS) south of 12°S.
A calibrated conductivity-temperature-depth (CTD) probe (SBE 911plus, Sea-Bird Electronics, USA) was used to obtain vertical oceanographic parameters, including water potential temperature and practical salinity. Additionally, vertical profiles of dissolved oxygen (DO) and fluorescence were measured during the CTD casts. Sixteen vertical CTD profiles were collected at one-degree intervals from 20°S to 4°S along 65°E, except at 8°S. Water temperature and salinity data were quality-controlled using standard CTD data processing methods. DO was calibrated using Winkler titration (Kang and Kim, 2023), and fluorescence was calibrated using extracted chlorophyll-a sampling (Jeffrey and Humphrey, 1975). Oceanographic parameters were derived using the Gibbs SeaWater Oceanographic Toolbox of TEOS-10 (McDougall and Barker, 2011) and averaged over 5-meter vertical intervals.
2.2 Acoustic data analysis
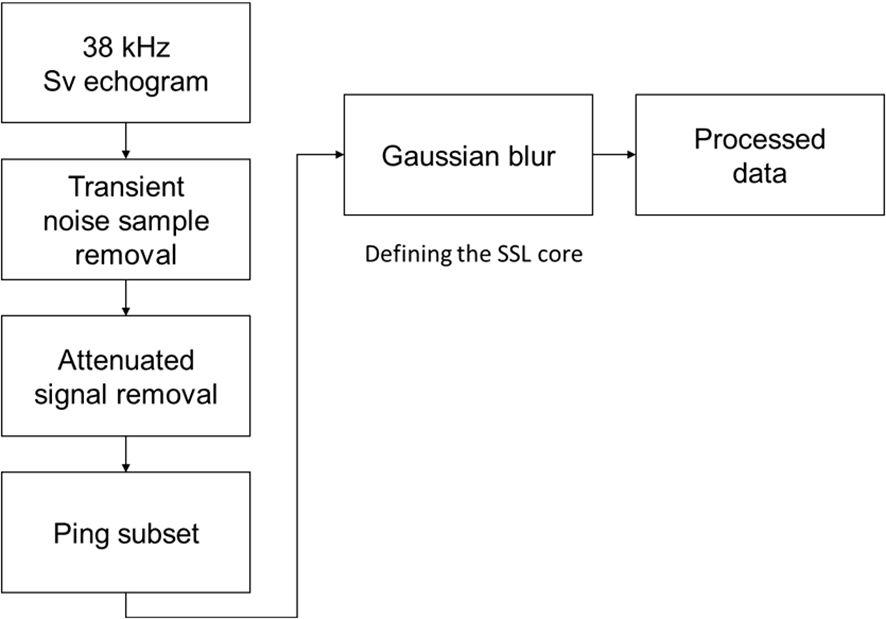
Acoustic data were analyzed using Echoview (version 14, Echoview Software Pty., Ltd.). Of the six frequencies available, only the 38 kHz frequency was utilized. Frequencies above 38 kHz are insufficient to penetrate the mesopelagic zone effectively due to absorption. The 38 kHz frequency was selected due to its widespread use in studies on SSLs across various seas globally, in contrast to 18 kHz (Kaltenberg et al., 2007; Norheim et al., 2016; Aksnes et al., 2017; Proud et al., 2018; Escobar-Flores et al., 2020; Gao et al., 2023). Furthermore, 38 kHz is advantageous for comparative studies with existing research and is a standard frequency commonly employed in fisheries acoustics. The data analysis workflow is depicted in Figure 2. To generate a clean 38 kHz echogram, algorithms for transient noise sample removal and attenuated signal removal were applied, eliminating spike-like noise and signals affected by air bubble interference (Ryan et al., 2015; Echoview, 2024). The cleaned 38 kHz echogram was then exported to the Echoview data file format (evd), and the evd file was added as a raw data file in Echoview, expediting the data processing. The transient noise sample removal algorithm targets sample values significantly higher than neighboring samples, adjusting them to mitigate noise sources like wave-hull collisions, which often appear as prolonged spikes on echograms. The attenuated signal removal algorithm identifies and corrects pings with weakened signals compared to nearby pings, typically due to air bubbles within the water column beneath the transducer. Off-track pings were excluded using a ping subset operator. During the expedition, a mooring system was installed at 8°S and 65°E. Pings associated with this system were removed, resulting in a nearly straight cruise line from 20°S to 4°S, except the area around 8°S and 65°E.
To define the SSL cores, a Gaussian blur algorithm was applied to the clean Sv echogram. A minimum threshold of −65 dB was set to isolate acoustic signals corresponding to the SSL core. The threshold can be adjusted depending on the target species. For stronger acoustic signals, such as those produced by schools of fish, a threshold range of −65 to −60 dB is commonly used. This threshold was also employed to detect the SSL core in the present study (Diner, 2001; D’Elia et al., 2009; Rolf et al., 2009). The Gaussian blur, acting as an image-blurring filter, uses a normal distribution to compute data values within a sliding window of dimensions X × Y (in this study, five samples in rows and five pings in columns). The standard deviation, σ, determines the intensity of the blur, and the kernel cell values within the 5 × 5 convolution kernel were derived using the equation for a two-dimensional Gaussian distribution.
where u represents the index of the kernel row within the specified sliding window, relative to the center [0,0], v denotes the index of the kernel column within the specified sliding window, relative to the center [0,0], and σ is the standard deviation of the Gaussian distribution (σ = 1).
To extract various SSL metrics, the “school detection” algorithm, incorporating the SHAPES algorithm within Echoview, was applied to the echogram, which had been processed with a Gaussian blur filter (Coetzee, 2000; Echoview, 2024). The parameters employed in the “school detection” algorithm for defining the SSL core are presented in Table 1. This algorithm delineated the boundaries of SSL-like regions, enabling an examination of their morphometric and distributional properties. Some metrics used to describe the SSL core are conceptualized in Figure 3; a detailed description of all metrics is provided in Table 2. Distribution dynamics-related features (inertia and aggregation index) were challenging to represent in the figure. Distribution depth (D) measures the distance from sea level to the center of the SSL core, whereas top altitude (Alttop) measures the distance from the excluded bottom line (600 m) to the top of the SSL core. Length (L) is the measure adjusted to correct for beam width effects, calculated using the formula 2D tan(ϕ/2), where ϕ represents the attack angle. This angle is defined as the angle between the on-axis line and a line extending toward the edge of the SSL core, measured at the initiation of its detection (Diner, 2001). Thickness (T) is the mean thickness of the detected SSL core. The center of mass (CM) is defined as the mean vertical position of the acoustic backscatter, calculated as the average of all sampled depths weighted by their mean volume backscatter strength (MVBS) values. Inertia reflects the distribution of acoustic backscatter around the CM, indicating the spread of MVBS relative to this central position. The aggregation index measures the degree of crowding, with higher values corresponding to areas where acoustic density is significantly greater than in the rest of the distribution. The morphological features (L and T) and distributional dynamics (D, Alttop, MVBS, CM, inertia, and aggregation index) of SSL cores, derived from acoustic data, were used to characterize the SSL cores. The maximum depth of the SSL core was observed to reach up to 600 m. Therefore, subsequent data analysis was focused within this depth range. To describe the metrics of the SSL core, relevant parameters (see Table 2) from each SSL core identified by the “school detection” algorithm as “region-based” were exported in comma-separated values format for further analysis.
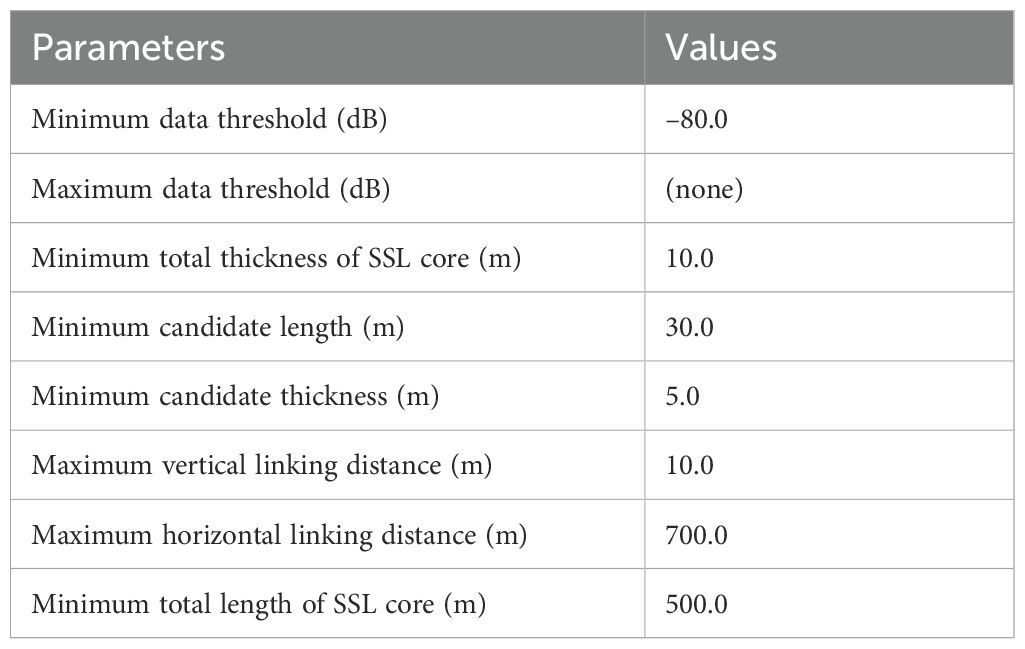
Table 1. Parameter settings for school detection algorithm used to identify core of sound scattering layer (SSL).
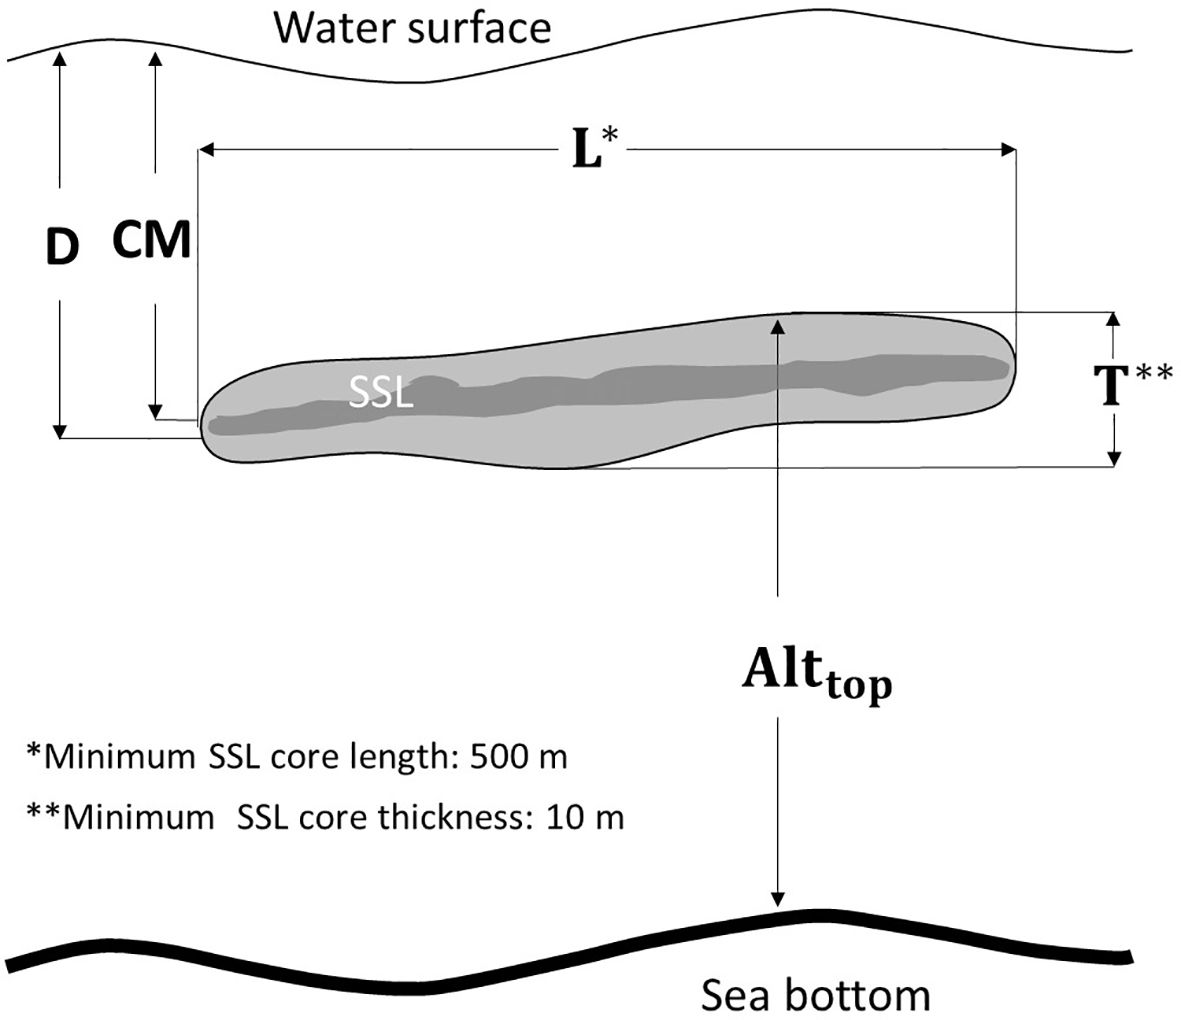
Figure 3. Metrics utilized to describe SSL: D denotes mean depth; L represents mean length; T indicates mean thickness; Alttop refers to mean top altitude; and CM signifies the center of mass. Dark colors within the SSL illustrate regions of elevated MVBS values. To detect core of SSL, parameters are established, including a minimum core length of 500 m and a minimum core thickness of 10 m.
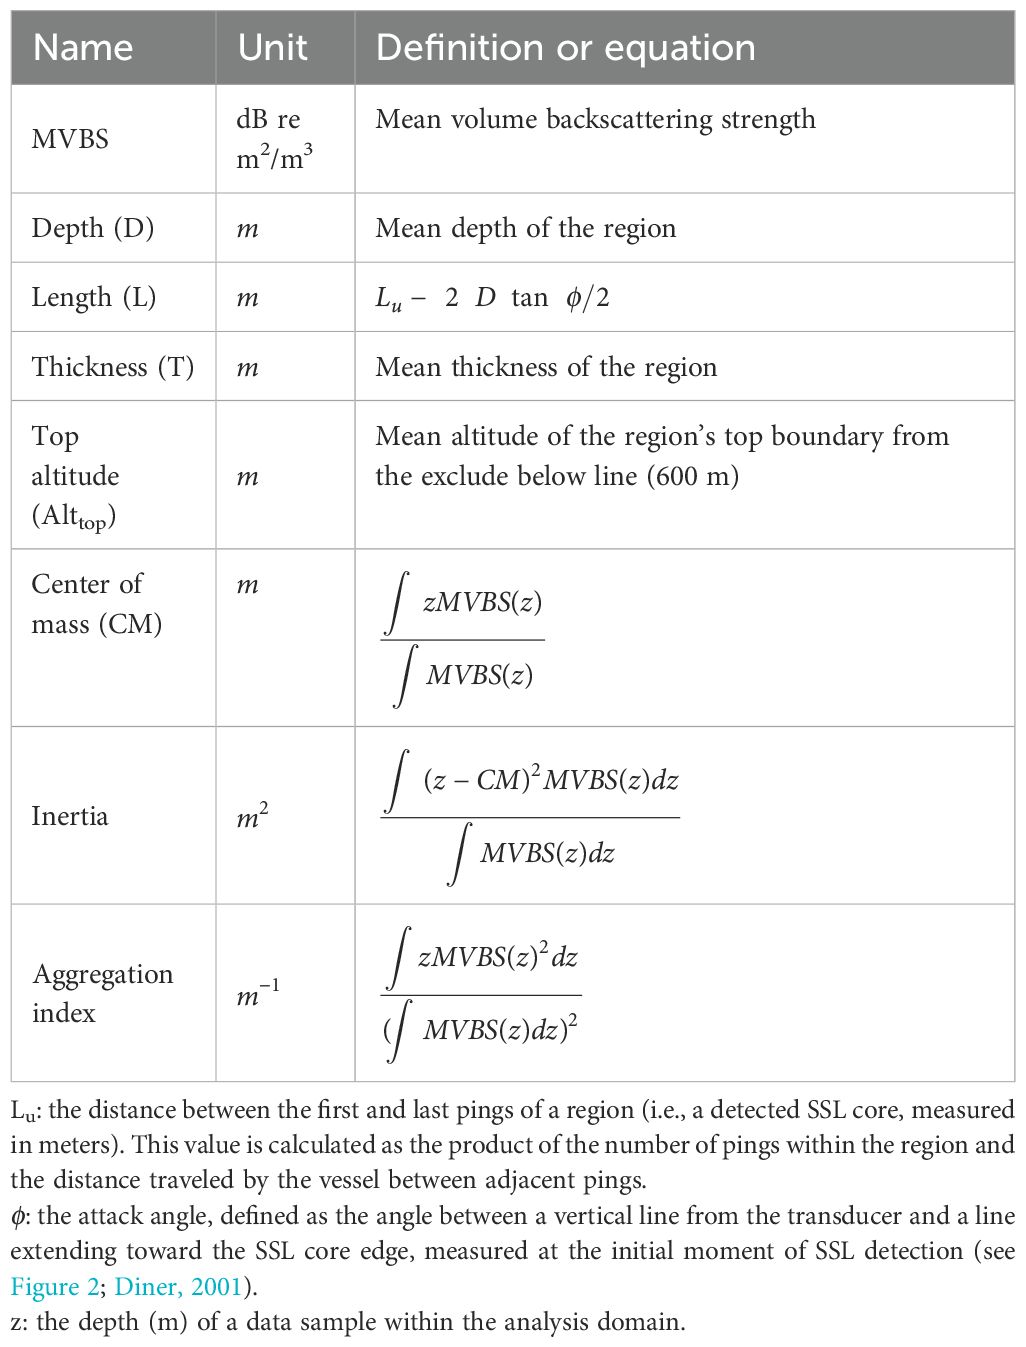
Table 2. Definition or equation for description metrics of SSL cores (see Figure 3).
In this study, SSL cores were categorized by depth layers: the epipelagic layer (EL, 0–100 m), the intermediate layer (IL, 100–300m), and the mesopelagic layer (ML, 300–600 m). To assess the timing and depth of DVM of the SSLs, sunrise and sunset times for the survey area’s latitude were obtained from SunCalc (2023). The moments of echo rise and fall were manually marked on the cleaned echogram. Specifically, the timing and depth of the upward movement (echo rise) were determined from the point where the acoustic signal begins to ascend, while those of the downward movement (echo fall) were identified from the point where the signal starts to descend, typically near 150 m. The echo rise time and depth were specifically determined from the point where the acoustic signal began to rise within the DVM shape, corresponding to the center of the U-curve observed during the day.
To extract and describe oceanic environmental variables at the SSL core locations, data on both environmental variables and MVBS for each SSL core were collected from points where CTD station locations coincided with the predefined SSL core locations. The operators used in this process included “region bitmap” (CTD region, SSL core region), “and,” and “mask” (Echoview, 2024; electronic Supplementary Material, Supplementary Figure S1).
A range of cell sizes (6 nm × 0–100 m (EL), 100–300 m (IL), and 300–600 m (ML)) were utilized to help illustrate the horizontal distribution of SSL cores effectively. For the vertical profiles, a cell size of 3 nm × 5 m was used, with MVBS values presented by dividing them into 1° latitude intervals. The same cell size was also applied in the analysis of SSL depth and MVBS over circadian cycles. The depth and MVBS values were calculated by organizing them into cyclic time intervals.
To statistically analyze the relationship between acoustic values (MVBS) and oceanographic environmental parameters, a cell size of approximately 72 min × 5 m was employed, determined by the locations of each CTD station. The horizontal spacing of the cells was based on the duration of CTD performance, whereas a vertical interval of 5 m was selected to align with the average vertical resolution of the oceanographic parameters. Moreover, to visualize the nautical area scattering coefficient (NASC, m²/nm²), a proxy for biomass, in conjunction with oceanographic features, a cell size of 100 m × 5 m was utilized. The relevant acoustic variables, adhering to “cell-based” criteria, were exported from the cleaned Gaussian-blurred echogram according to the specified cell sizes. During data processing, the acoustic values were converted from decibels to their linear form before averaging.
2.3 Data visualization and statistical analysis
ArcMap (version 10.2.2, ESRI) was used to illustrate the horizontal distribution of the SSL cores. Ocean Data View (ODV, version 5.7.1, AWI) was utilized to visualize oceanographic environmental parameters and the NASC values of SSLs. Multiple linear regression analysis was conducted to explain MVBS values based on oceanographic environmental parameters in each depth layer. The parameters included water temperature, salinity, DO, and fluorescence in the EL and water temperature, salinity, and DO in the IL and ML. Statistical analysis was performed using SPSS software (version 27, IBM).
3 Results
3.1 SSL core echograms and geographical distribution
The original 38 kHz Sv echogram, the Gaussian-blurred echogram used for cell-based analysis, and the identified SSL core from region-based analysis on the Gaussian-blurred echogram are shown in Figure 4. While the DVM was visible, the thickness of the SSLs at mesopelagic depths increased significantly at lower latitudes (NLS more than SLS), where high acoustic values were observed. In the SSL core echogram, except at 16°S, strong acoustic values were detected in the upper 100 m depth (EL). Additionally, high acoustic values were observed around 400 m depth from 13°S to lower latitudes (e.g., NLS). The geographical distribution of the SSL core across different depth layers and the entire water column is displayed in Figure 5. The MVBS averaged over EL (0–100 m), ML (300–600 m), and IL (100–300 m) are –72.9 dB, –77.8 dB, and –82.5 dB, respectively. The absence of data at 8°S should be considered during interpretation. In the EL, high MVBS was observed north of 14°S, while low MVBS were noted between 16°S and 17°S. The IL layer exhibited an overall lower MVBS compared to the other layers. In the ML, high MVBS was observed north of 11°S. Across the entire water column (upper 600 m), high MVBS was observed north of 12°S.
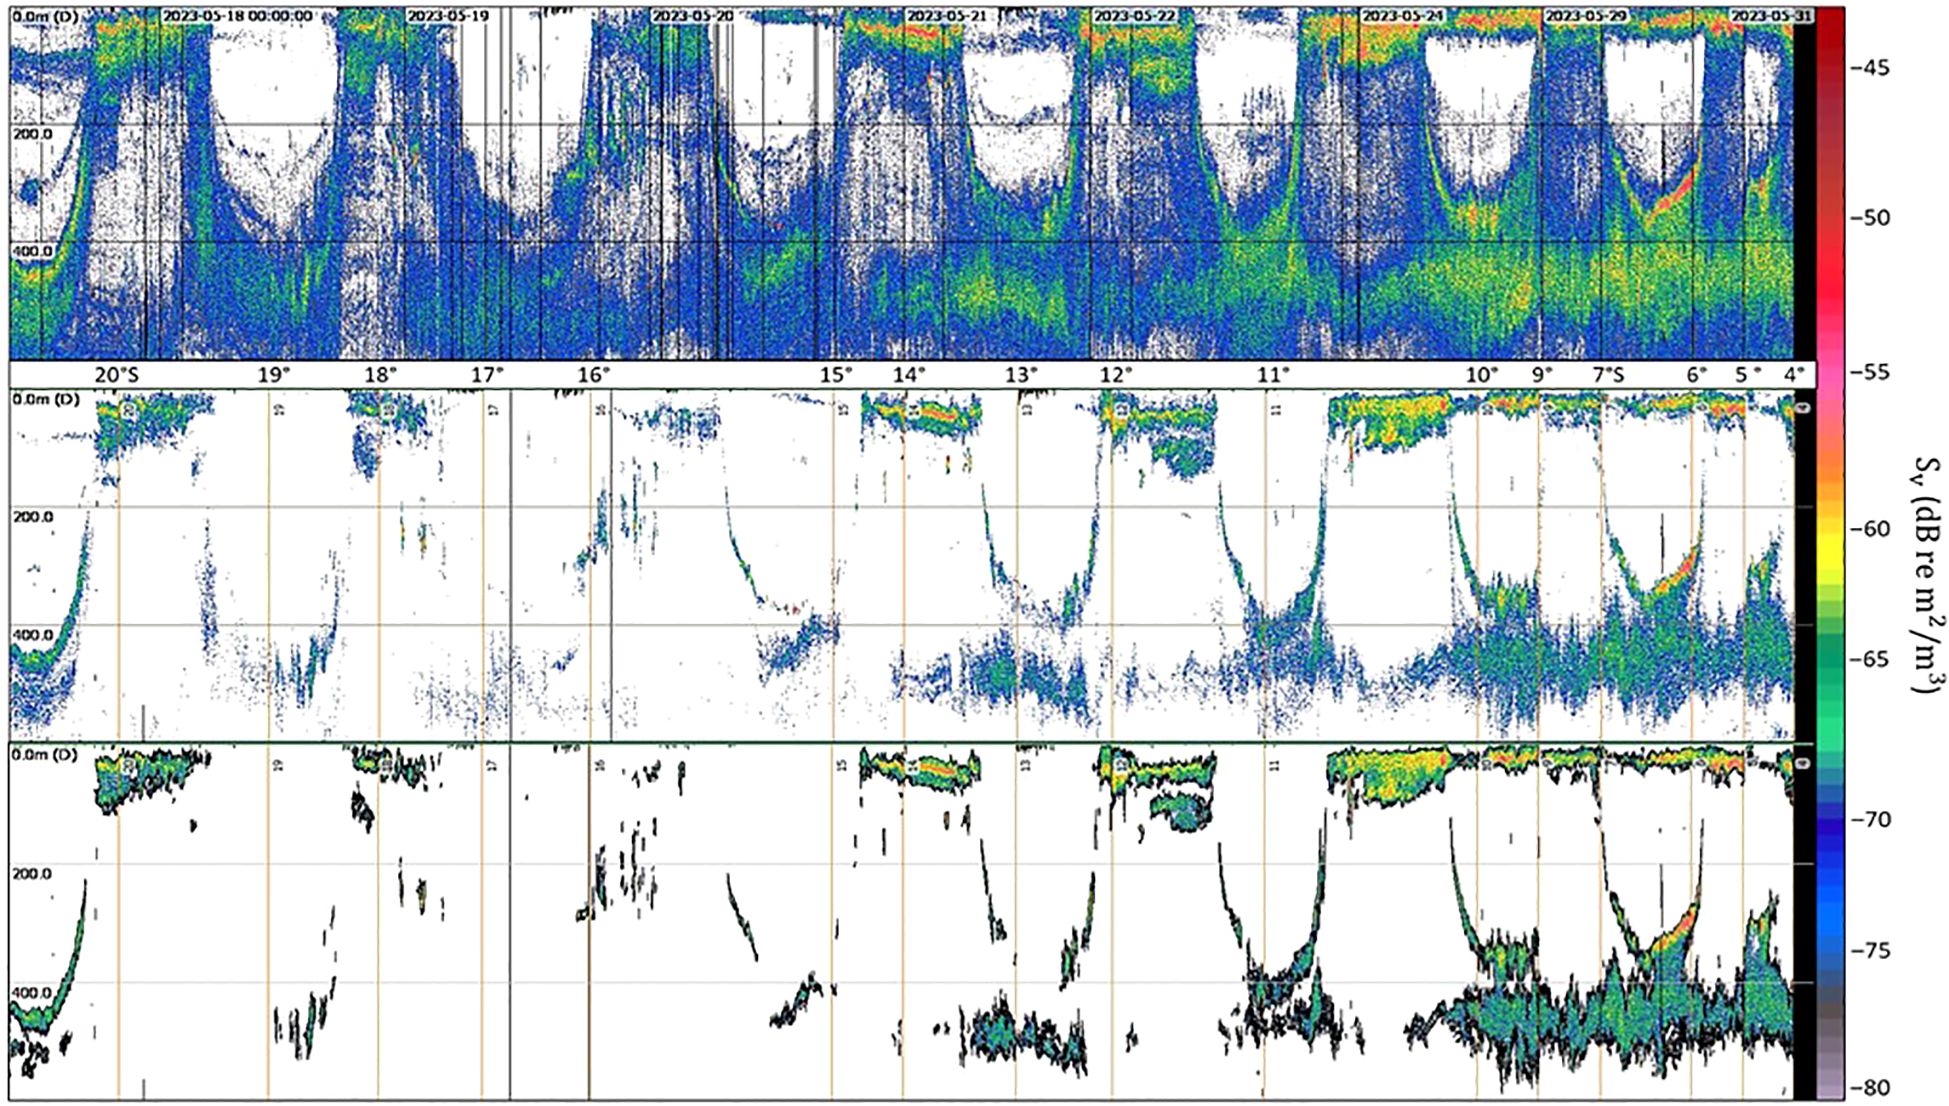
Figure 4. Original 38 kHz Sv (volume backscattering strength) echogram (upper panel), the Gaussian-blurred echogram used for cell-based analysis (middle panel), and the Gaussian-blurred echogram highlighting the identified core of the SSL (lower panel). X-axis represents latitude (or time); y-axis represents depth.
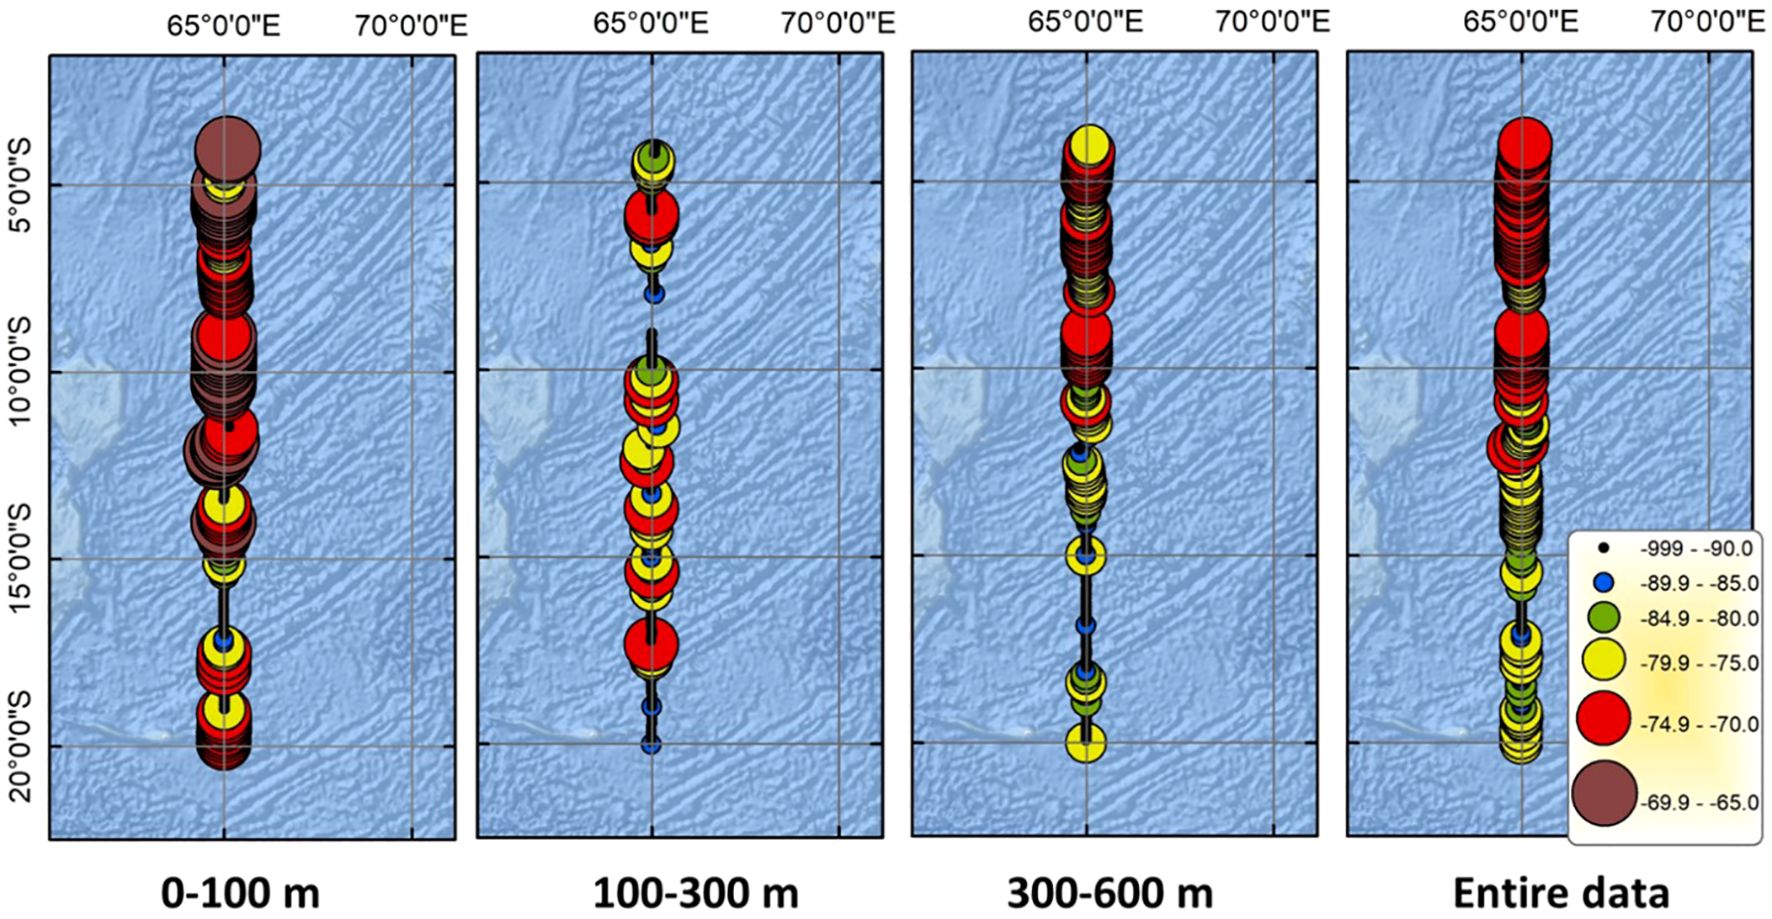
Figure 5. Geographical distribution of SSL based on MVBS averaged over following depth ranges (from left to right): upper 100 m, 100–300 m, 300–600 m, and upper 600 m. The absence of data at 8°S should be considered during the interpretation process.
3.2 Vertical profile of the SSL core across latitude
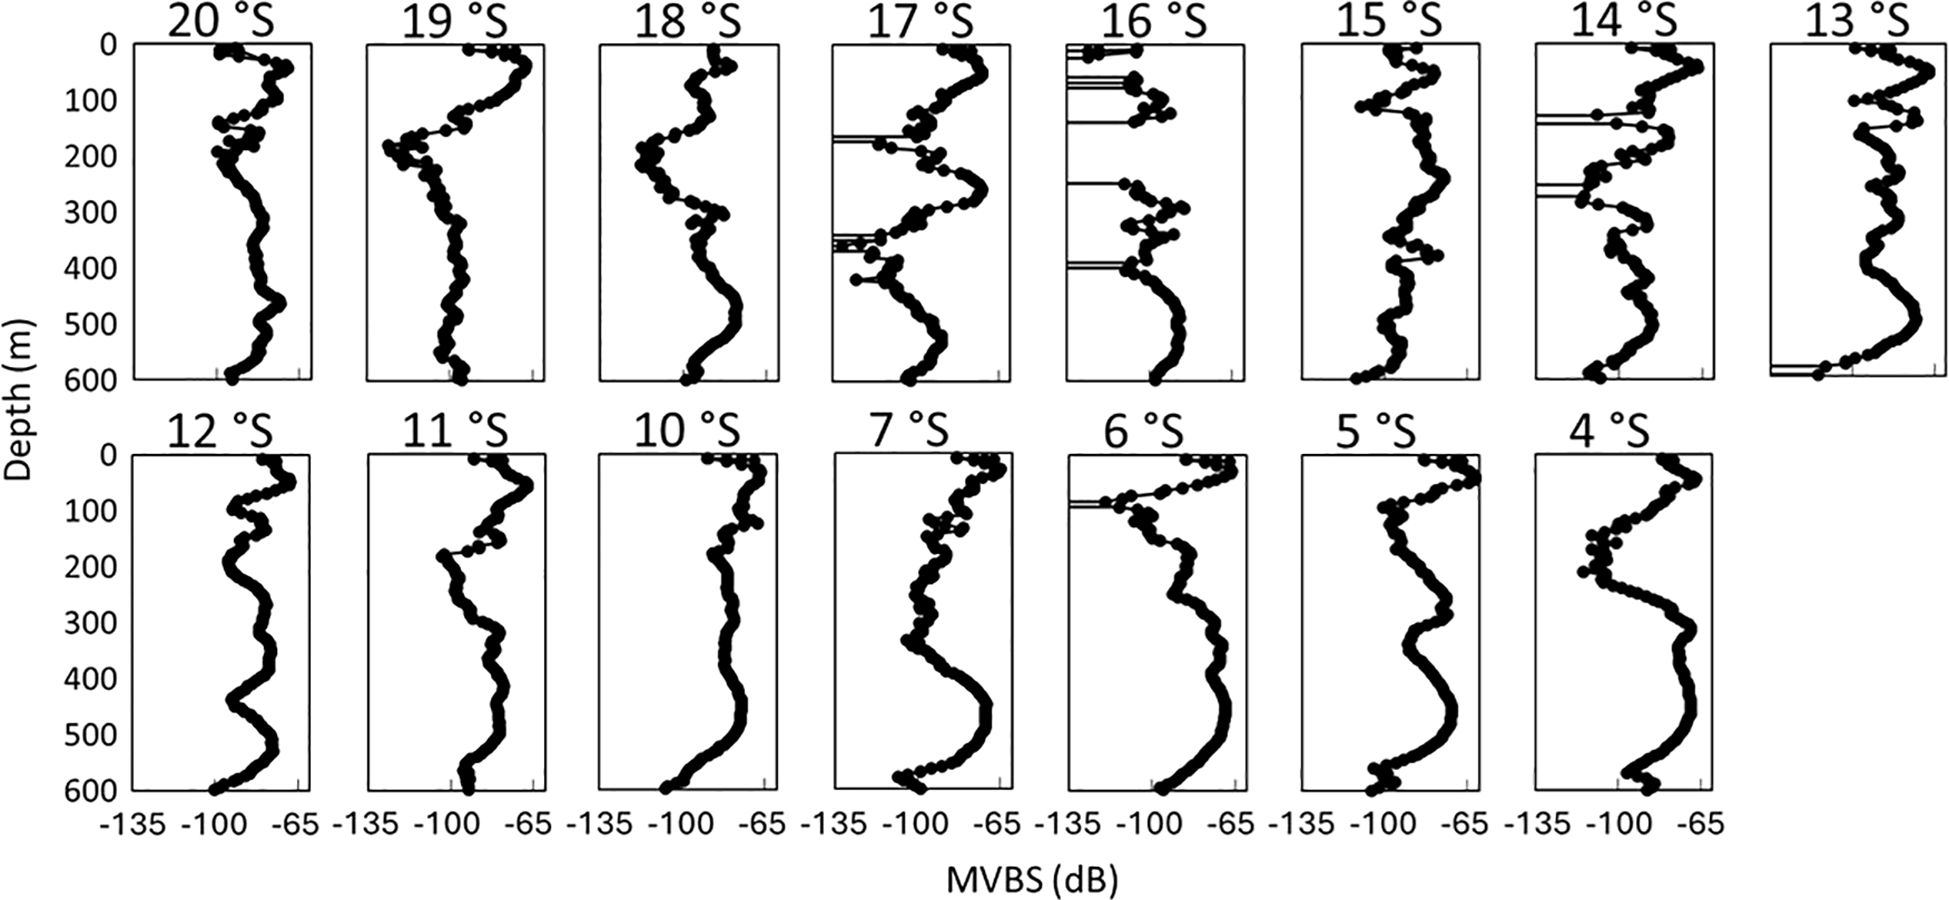
The initial peaks of MVBS were predominantly observed at a shallow depth of 42.2 m (–66.5 dB) across most latitudes. However, at 15°S, the first peak was detected at a depth of 238.5 m (–74.7 dB), while at 16°S and 18°S, it was observed at 293.6 m (–85.3 dB) and 463.5 m (–77.6 dB), respectively. The average depth of the second peak was 433.1 m (–72.7 dB), excluding data from 10°, 13°, 14°, and 18°S in this calculation. Based on the same station data, the average first and second peaks in the SLS were recorded at –68.4 dB at 45.5 m and –75.6 dB at 433.5 m, respectively. In the NLS, these peaks occurred at –65.5 dB at 39.9 m and –71.3 dB at 432.7 m. In the NLS, MVBS values decreased rapidly to approximately 165 m from the near-surface, except at 7°S, where the decline extended to 333.5 m. The SLS displayed greater variability with depth compared to the NLS. Notably, at 14°, 16°, and 17°S, this variability was primarily driven by low MVBS (< –135 dB), suggesting the absence of SSL cores. The lowest recorded MVBS (approximately –131.3 dB) occurred at 358.5 m at 17°S, while the highest (–61.6 dB) was at 43.5 m at 5°S. In general, low MVBS values were prevalent at depths exceeding 500 m and between 100–200 m (Figure 6).
3.3 Depth and MVBS variations of the SSL core over circadian time
The depth of SSL cores in both SLS and NLS exhibited less variation in the ML compared to the EL and IL. In the EL, SSL core depths varied considerably during the daytime in the SLS compared to the NLS. The depth patterns of SSL cores in the IL were similar between the SLS and NLS; however, after sunset, the depths in the SLS were relatively deeper (ranging from 187 to 209 m, then 165 m) than in the NLS (ranging from 149 to 112 m, then 155 m). In the ML, SSL core depths were deeper in the SLS than in the NLS after sunset (Figure 7). Overall, the MVBS of SSL cores showed more consistency in the EL and ML in the NLS than in the SLS, although the IL exhibited significant variation in both regions. In the SLS, the MVBS of SSL cores showed significant differences between day and night, with the MVBS in the EL decreasing at dawn and increasing at dusk. In the IL, the MVBS patterns of SSL cores were relatively similar in both regions, except at 1 pm, when the MVBS increased in the NLS but decreased in the SLS. In the ML, consistent MVBS values (around –73 dB) were observed in the NLS from 5 am to 3 pm, with a slight but insignificant drop afterward. In the SLS, the MVBS during the daytime was higher than during the nighttime in the ML (Figure 8).
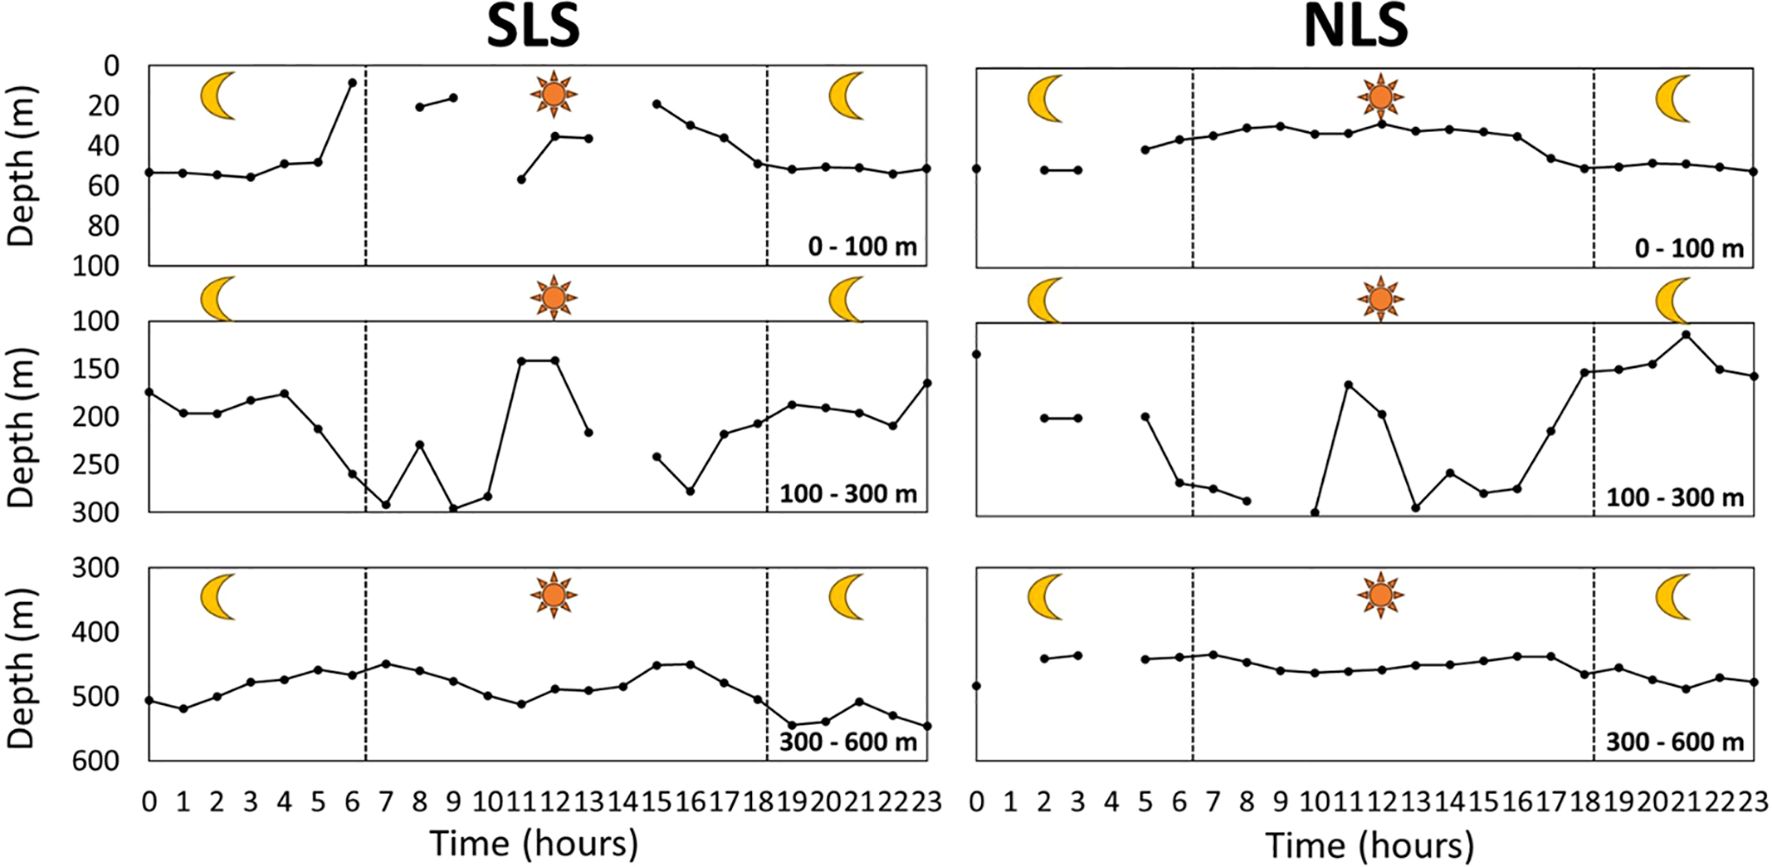
Figure 7. Depth variation of SSL core over circadian time at 0–100 m (EL), 100–300 m (IL), and 300–600 m (ML). SLS indicates the southern latitude section between 13°S and 20°S, while NLS represents the northern latitude section between 4°S and 12°S. Note that depth represents mean depth of each respective layer.
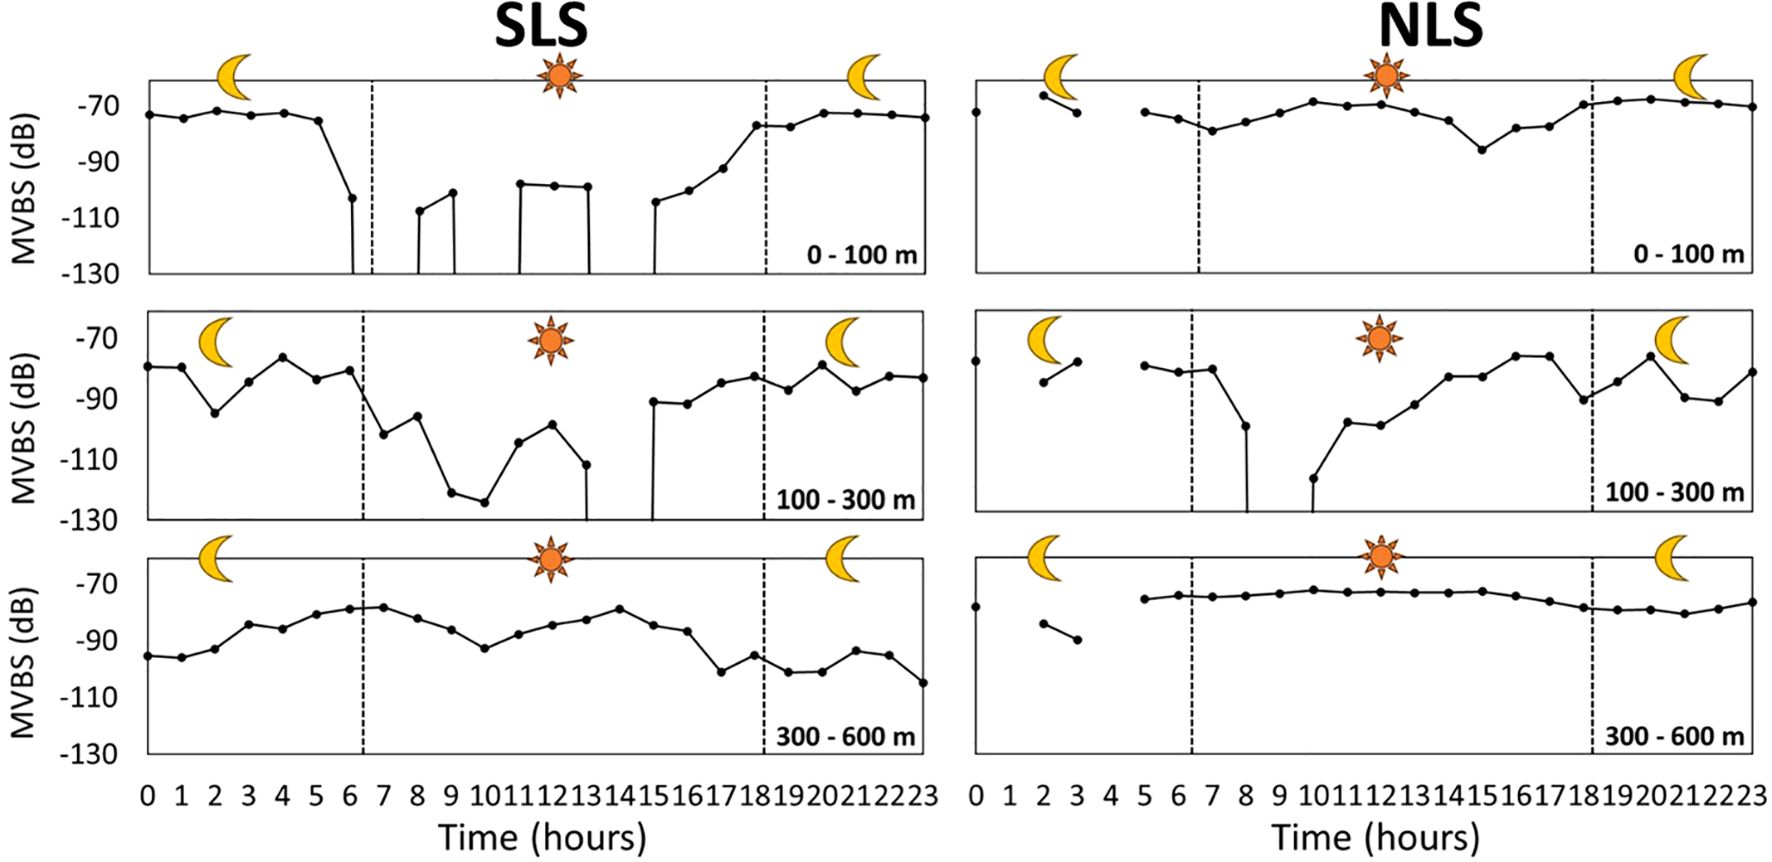
Figure 8. MVBS variation of SSL core over circadian time at 0–100 m (EL), 100–300 m (IL), and 300–600 m (ML). SLS indicates southern latitude section between 13°S and 20°S, while NLS represents the northern latitude section between 4°S and 12°S.
The MVBS values decreased before sunrise and increased before sunset, corresponding to the DVM of organisms forming the SSL, as their downward and upward movements caused fluctuations in these values. This pattern was observed in both EL and IL across the two regions (Figure 7). In EL, the shallower depths observed before sunrise and deeper depths before sunset may indicate that organisms remained within a specific depth layer. The average depth in EL likely reflects the combined effect of some organisms remaining at this depth while others descend around dawn. This suggests that stationary organisms contribute more significantly to the average depth than migrating ones. The consistency in depth and MVBS values within the ML over time indicates the presence of non-migrating organisms inhabiting this range, as previously reported in several studies (Ariza et al., 2016; Dornan et al., 2019; Romero-Romero et al., 2019; Agersted et al., 2021). Notably, the elevated MVBS values in EL at night may be attributed to organisms migrating from ML to IL and then to the EL. The more consistent depth and MVBS values in EL at night, compared to during the day, can be explained by the presence of SSL core organisms that remained in EL throughout the DVM (Figures 7, 8).
3.4 Upward and downward movement times and depths of SSL
The average echo rise time (upward movement) and sunset time for the entire dataset were 15:05 and 17:18 h, respectively, indicating that the echo began to rise 2 h and 13 min before sunset. Although the echo rise time varied with latitude, the difference between the SLS and NLS was not significant. However, the depth at which the echo began to rise differed between the SLS and NLS. The starting depth of the echo rise was significantly deeper in the SLS (331.1 m) than in the NLS (277.4 m), with the echo rising at shallower depths northward. The echo fall time trend closely followed sunrise time, with the echo beginning to fall approximately 17 min before sunrise. The depth at which the echo started to fall decreased as latitude increased, with the echo falling at shallower depths northward (Figure 9).
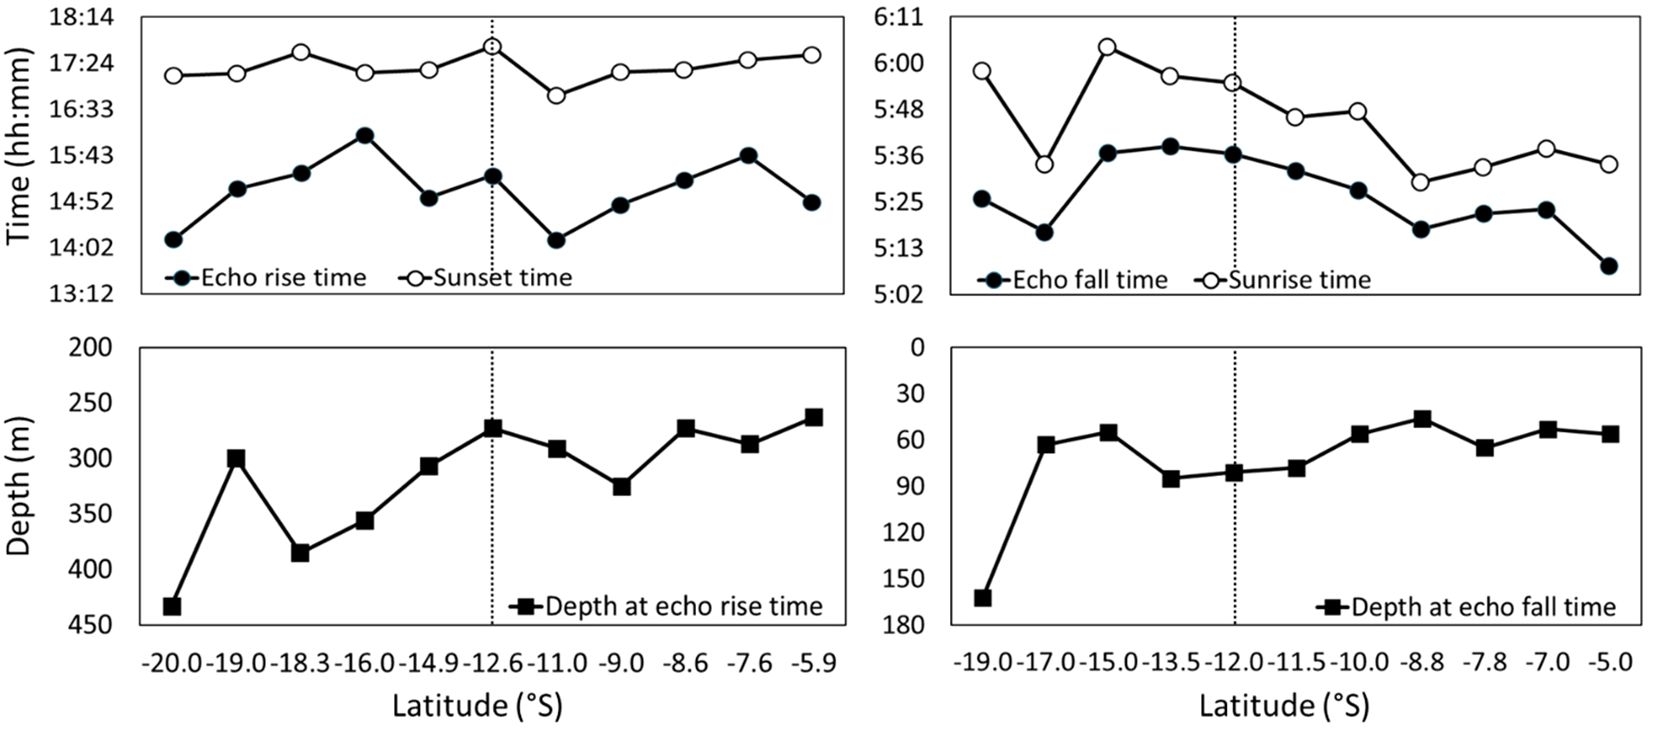
Figure 9. (Left panels) Upward (echo rise) and (right panels) downward (echo fall) movement (upper panels) times and (lower panels) depths of SSL relative to sunrise and sunset.
3.5 Morphometric and distributional dynamics of SSL core
A total of 236 SSL cores were detected, comprising 117 in the SLS and 119 in the NLS. Notably, only two SSL cores were observed at 16°S. Many SSL cores exhibited MVBS values ranging from –73 to –69 dB across latitudes. The largest MVBS range of 13.9 dB was observed at 13°S, whereas the smallest range of 1.4 dB was noted at 5°S. The average MVBS was –70.2 ± 2.3 dB; for SLS, it was –69.9 ± 2.5 dB, and for NLS, it was –70.6 ± 2.2 dB. This suggests that the elevated MVBS at 13°S may have contributed to the slightly higher overall MVBS observed in the SLS compared to the NLS (Figure 10).
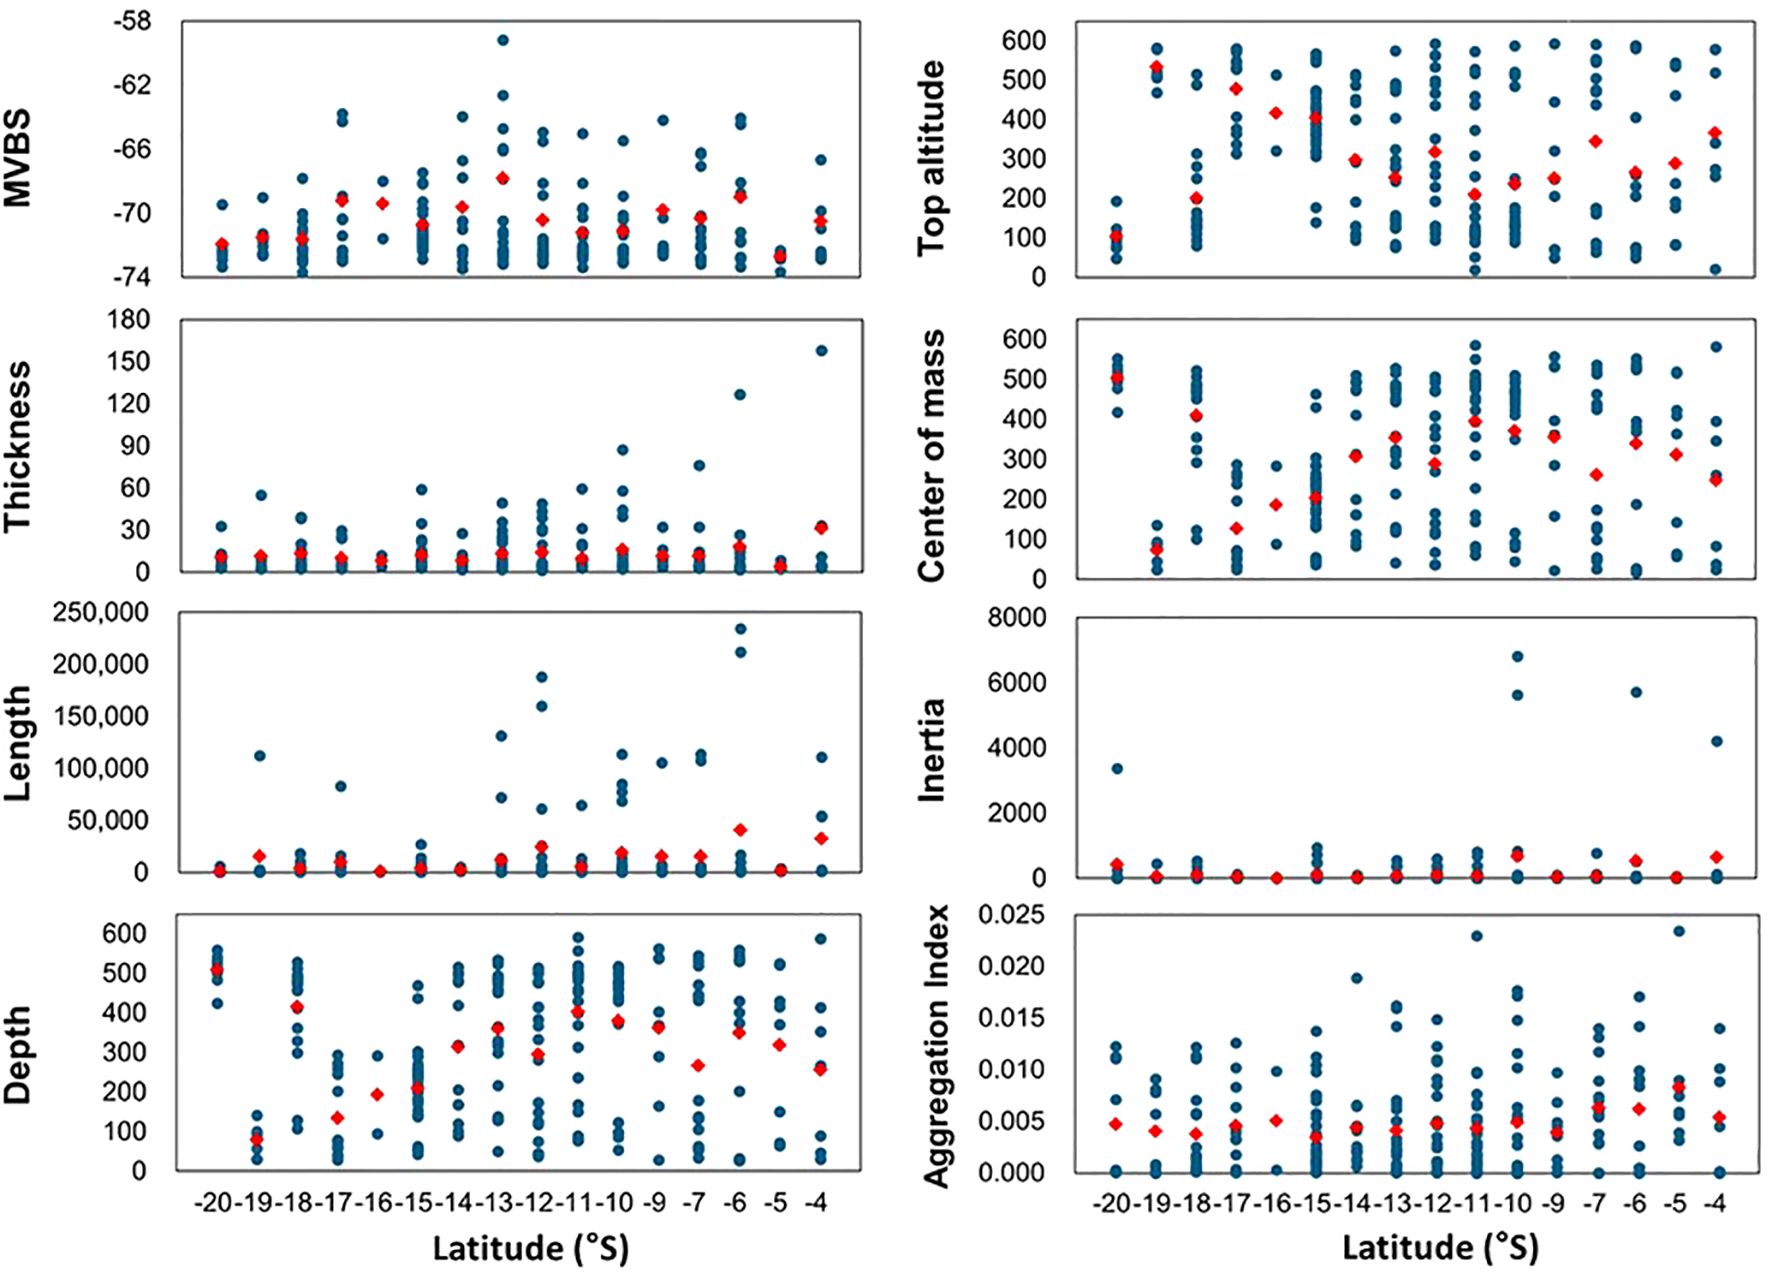
Figure 10. Morphological features (length and thickness) and distributional dynamics (depth, top altitude, MVBS, center of mass, inertia, and aggregation index) of SSL core. Definitions and equations are detailed in Table 2. Blue dots represent identified SSL cores, totaling 236 cores: 117 in the SLS, located south of 12°S, and 119 in the NLS, situated north of 12°S. Red dots indicate average values.
Most SSL cores were less than 60 m thick, with approximately half measuring less than 15 m. The thickness increased from 10°S to 4°S, with the thickest core measuring 158.1 m at 4°S. The overall average thickness was 12.8 ± 17.9 m, 11.7 ± 11.1 m for SLS, and 13.8 ± 22.7 m for NLS. Most SSL cores measured less than 50,000 m in length, except for longer cores observed at 19°, 17°, 13°–6°, and 4°S, with two exceeding 200,000 m at 6°S, and the next longest, approximately 165,000 m, located at 12°S. The average length in the SLS was 6,788 ± 18,625 m, whereas in the NLS, it was 18,358 ± 42,891 m, indicating a notable latitudinal difference. The overall average length was 12,622 ± 33,594 m. The average distribution depth in the SLS was 288.4 ± 170.4 m, while in the NLS, it was 340.7 ± 185.9 m, yielding an overall average distribution depth of 314.8 ± 179.9 m. Except at 19°S, the maximum top altitude exceeded 500 m at all latitudes, indicating proximity to the surface. From 15°S northward, the top altitude varied significantly between 0 and 600 m, demonstrating a wide range of SSL core distribution depths.
The average center of mass (CM) in the SLS was 282.4 ± 170.4 m, while in the NLS, it was 333.7 ± 185.8 m. The overall average CM was 308.3 ± 179.8 m, reflecting a pattern similar to that of the distribution depth. The average inertia in the SLS was 112.7 ± 342.5 m2, whereas in the NLS, it was 269.9 ± 1,028.1 m2, indicating a broader distribution of the SSL core around the CM. The overall inertia was 192.0 ± 771.3 m2. The average aggregation index in the SLS was 0.0040 ± 0.0043 m–1, while in the NLS, it was 0.0053 ± 0.0051 m–1, suggesting a more aggregated distribution of the SSL core. The overall aggregation index was 0.0047 ± 0.0048 m–1.
The morphological and distributional characteristics of the SSL core were as follows: the MVBS of the SSL core was similar between the SLS and NLS, with the mean value being only 0.7 dB higher in the southern SSL core. However, the MVBS values were nearly identical when accounting for their standard deviations. The SSL core in the NLS was larger, distributed at greater depths, and more concentrated while also being more widely dispersed from the central mass compared to the SLS.
3.6 Preferred oceanographic features of SSL core
The region-based SSL core showed the highest MVBS in the following order: EL (mean ± standard deviation: –79.5 ± 12.7 dB) > ML (–85.2 ± 12.1 dB) > IL (–94.2 ± 10.1 dB). Modes were –72.5 dB for EL and ML and –97.5 dB for IL. Temperature parameters were as follows: in EL, temperatures ranged from 17.0 to 29.5°C (mean 25.4°C, standard deviation 3.3°C), with a mode at 27°C, reflecting the tropical region’s SST. In IL, temperatures ranged from 10.8 to 22.6°C (mean 16.7°C, standard deviation 3.3°C), with values evenly distributed. In ML, temperatures ranged from 7.9 to 15.1°C (mean 9.9°C, standard deviation 1.4°C), with 83% of values between 8 and 10°C associated with cold subsurface water upwelled onto the ML. Mean DO concentrations were: EL, 169.9 ± 27.5 μmol/kg (mode 180 μmol/kg); IL, 121.1 ± 33.2 μmol/kg; ML, 127.8 ± 39.5 μmol/kg (mode 90 μmol/kg). DO in ML was primarily between 90 and 120 μmol/kg, indicating significant separation from the atmosphere. The average DO concentrations followed the order: EL > ML > IL. Practical salinity was: EL, 35.0 ± 0.3 PSU; IL, 35.2 ± 0.2 PSU (89% of values between 34.9 and 35.3 PSU); ML, 34.8 ± 0.1 PSU (mode 34.8 PSU, 76% of values between 34.7 and 34.8 PSU).
SSL cores in EL-preferred environments with high temperatures, high DO, and moderate salinity. In IL, SSL cores were found in areas with moderate temperatures, low DO, and high salinity. In ML, SSL cores preferred regions with low temperatures, moderate DO, and moderate salinity (electronic Supplementary Material; Supplementary Figure S2).
3.7 Meridional cross-sections of SSL core and oceanographic environmental parameters
Higher NASC values were observed in the NLS compared to the SLS (18.0 ± 36.9 m2/nm2 > 9.8 ± 25.4 m2/nm2). Specifically, NASC in the upper 100 m (EL) was higher in the NLS. Thick depth layers (300 to 600 m, ML) were noted between 14° and 4°S. NASC near the surface became shallower northward, correlating with the depth of the 20°C isotherm, e.g., SCTR upwelling. High fluorescence near the surface at 10–9°S and 7–5°S, indicating high primary productivity, was associated with high MVBS in shallow water, e.g., Chl-a blooms from nutrient supply to the euphotic layer. SSL cores were not found at latitudes with DO concentrations below 100 μmol/kg. In contrast, higher acoustic values were observed at 300–500 m depth with relatively lower DO concentrations between 10° and 4°S. The SST increased toward the north, reaching a peak of approximately 30°C near 4°S. The D20 shoaled from 12° to 4°S, related to SCTR upwelling. The thermocline, marking the transition between warm upper waters and colder lower waters, rose from 200 m at 20°S to approximately 100 m at 9°S, likely due to upwelling in the NLS region. Salinity was highest, reaching 35.4 PSU, at 100–300 m around 20°S, likely due to saline intermediate water mass influence. The lowest salinity of 34.4 PSU was observed near the surface between 19°S and 12°S. Isohalines of 35.2 and 35.4 PSU, at 100–300 m between 14° and 20°S, shoaled from 8°S to 4°S, possibly due to SCTR upwelling in the NLS, adding more salts to shallower depths. The highest DO levels, ranging from approximately 225 to 250 μmol/kg, were recorded at 200–600 m at 20°S, with fluctuations between 19° and 15°S, reaching as low as 100 μmol/kg. DO levels between 150 and 175 μmol/kg were maintained in the upper 50 m between 12° and 4°S. Relatively low DO levels (75–125 μmol/kg) were observed below 100 m. High subsurface fluorescence levels peaked at approximately 1.00 mg/m³ at 50 m at 6°S, while lower fluorescence was observed at 50–120 m between 20° and 11°S. A distinct oceanographic condition favorable for high NASC, characterized by intermediate salinity (35 PSU), low temperatures (10–12.5°C), and low DO levels (75–100 μmol/kg), exhibited an inverted C-shaped distribution at depths around 100 m and below between 14° and 4°S (Figure 11).
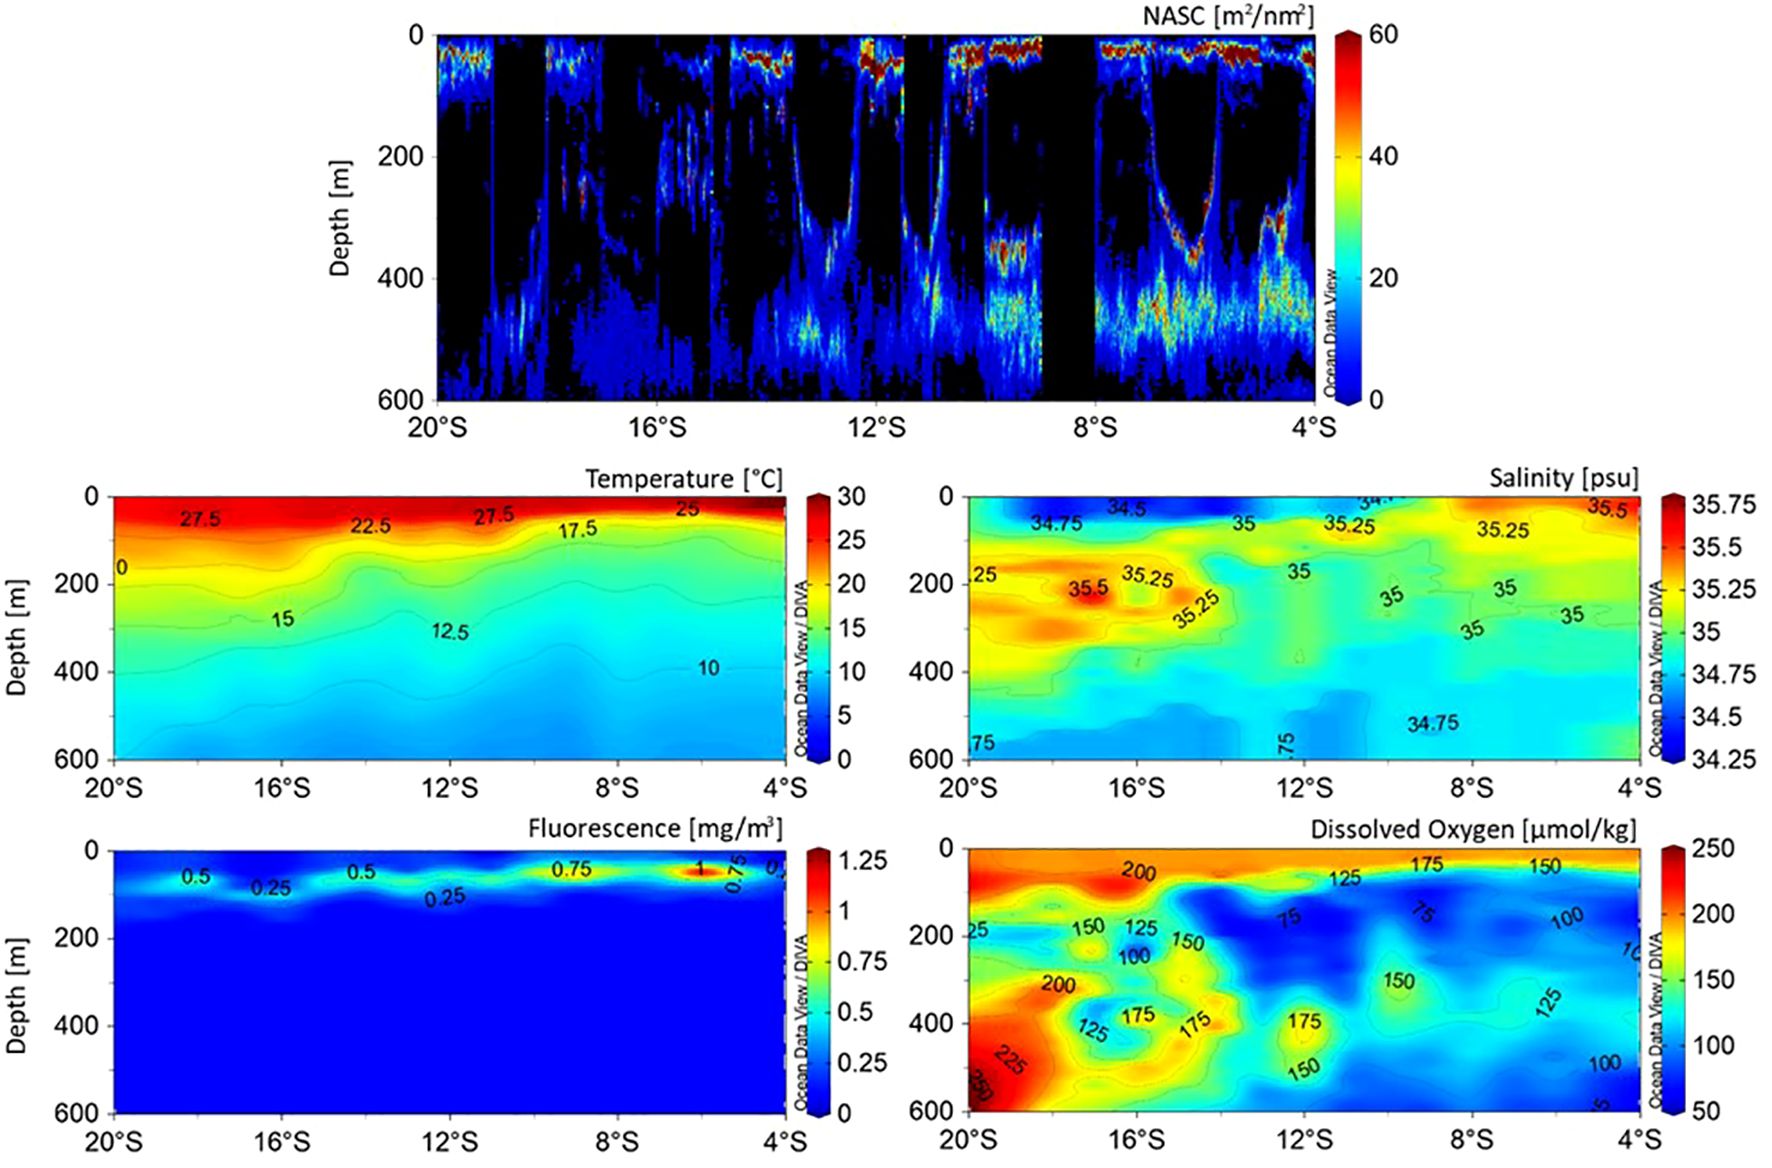
Figure 11. Cross-sectional (meridional) structures of (top) NASC (m²/nm²) proxy for acoustic biomass demonstrating SSL core and oceanographic environmental parameters such as (middle left) temperature, (middle right) salinity, (bottom left) fluorescence, and (bottom right) dissolved oxygen in study area. Note that although all oceanographic environmental parameters were spatially interpolated, SSL core panel was not.
3.8 Multiple regression analysis of MVBS and oceanographic environmental parameters
Multiple linear regressions were used to explain MVBS variations based on oceanographic parameters at each depth layer (Table 3): temperature, salinity, DO, and fluorescence in EL; the first three variables in IL and ML. The models explained 14.2% (EL), 1.7% (IL), and 24.9% (ML) of the MVBS variation. The factors statistically significantly predicted MVBS variations with the following results: F(4, 281) = 10.1, p<.05 (EL); F(3, 605) = 4.4, p<.05 (IL); F(3, 941) = 98.9, p<.05 (ML). In EL, factors influencing MVBS were, in order, temperature (0.35), fluorescence (0.20), salinity (0.18), and DO (0.08). In IL, the order was DO (0.22), salinity (−0.10), and temperature (−0.03). In ML, the influences were temperature (−0.44), DO (−0.18), and salinity (0.09). Yet, DO in the EL and both temperature and DO in the IL, as well as DO in the ML, were not statistically significant. The resulting regression models for EL, IL, and ML are as follows:
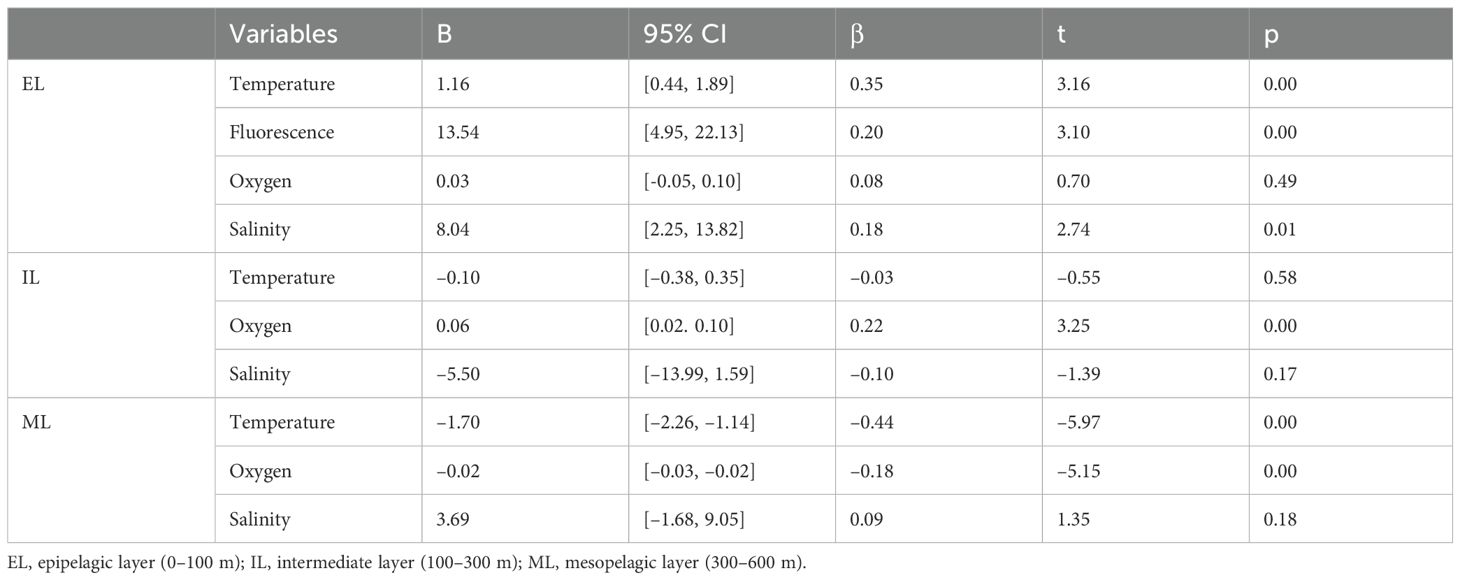
Table 3. Results of multiple regression analysis incorporating mean volume backscattering strength and oceanographic environmental variables.
4 Discussion
4.1 Vertical SSL profiles
Shujie and Xinjun (2024) found that high scattering values in the southwestern Indian Ocean occurred at depths of 0–200 m and approximately 600 m from 2011 to 2015. This is consistent with our study’s findings (Figures 5, 6). However, from 2016 to 2020, they observed an expansion in the depth range of high acoustic scattering, shifting from around 600 m to 400–600 m. Acoustic values and scattering layer characteristics often fluctuate over time and with seasonal variations (Cisewski et al., 2010; Wang et al., 2014; Prihartato et al., 2015; Geoffroy et al., 2019). North of the Sub-Antarctic Front, the MVBS is notably concentrated around 400–600 m, with values ranging from –70 to –60 dB, and less so around 0–200 m with MVBS values below –70 dB (Boersch-Supan et al., 2017). Our study’s findings, showing high scattering values in both the ML and EL (Figures 5, 6), align with these results. The scattering strength in our study ranged from –124 dB to –76 dB in the IL, consistent with Gao et al. (2023), who reported values from –100 dB to –70 dB at 200 m depth in the Central and Western Pacific Ocean (11–19°N, 129–133°E). Unlike Gao et al. (2023), our study observed significant scattering in all three layers, with particularly strong scattering between 0 and 200 m, especially in the ML, specifically within the NLS where the SCTR upwelling is most pronounced.
Surveys across the Pacific, South Indian, and Atlantic Oceans from South Africa to southwestern Australia have consistently shown the highest acoustic values in the EL, with the second peak varying across oceans but consistently observed in the ML (Klevjer et al., 2016). This is in agreement with our findings (Figure 6). In the southwestern Indian Ocean, SSLs were observed in the shallow layer below 200 m (58.66 ± 24.63 m) and the deep layer between 400 and 700 m (589.02 ± 66.33 m). Significant seasonal differences in SSL depth were noted in the shallow layer between summer and winter, but no seasonal variation was found in the deep layer (Shujie and Xinjun, 2024).
Our observations were conducted during the Austral late fall (mid- to late May), avoiding seasonal effects. With the installation of a continuous time-series recording echosounder at the SCTR center (8°S and 65°E) in early June 2024, we expect to investigate seasonal variations in the future. SSL acoustic scattering strengths in polar and adjacent regions tend to be lower compared to other areas (Olivar et al., 2012; Dypvik and Kaartvedt, 2013; Irigoien et al., 2014; Davison et al., 2015; Klevjer et al., 2016; Gjøsæter et al., 2017; Klevjer et al., 2020). Comparing acoustic values among SSLs is challenging due to variations in constituent organisms, survey timing, and oceanographic conditions. However, SSLs in nutrient-rich environments generally exhibit consistently high acoustic values.
4.2 Circadian variations of SSLs
The DVM of SSLs is well established, typically involving a gradual descent at dawn followed by a rapid descent to daytime depths and a reverse pattern during ascent. While the principle remains consistent, temporal morphological patterns of DVM vary across regions and seasons. For instance, the central and western Pacific Ocean showed a significant decrease in average Sv between 6:00 and 7:00 local time, indicating SSL migration from the surface to deeper waters, and a significant increase between 17:00 and 18:00 local time, indicating migration from deeper waters to the surface. Sv was higher at night compared to daytime (Gao et al., 2023). Consistent with these findings, our study also observed higher acoustic values at night compared to daytime (Figure 8).
A global dataset from 1,500 cruises between 1990 and 2010 showed that SSLs typically leave the surface 21–20 min before sunrise and return 17–23 min after sunset, with bulk surface backscatter changes being nearly synchronous with sunrise and sunset (Bianchi and Mislan, 2015). In the southwestern Indian Ocean, SSL upward movement began around 16:20 and ended at 18:31, while downward movement started at 4:38 and ended at 6:52 (Shujie and Xinjun, 2024). Our study observed SSLs migrating from near the surface to deeper depths 17 min before sunrise, with reverse migration occurring 2 h and 13 min before sunset (Figure 9). This timing is consistent with previous studies (Brierley, 2014; Bianchi and Mislan, 2015; Gao et al., 2023; Shujie and Xinjun, 2024), though upward migration before sunset occurred significantly earlier in our study. This discrepancy may be due to differences in measurement methods, as our observation of echo rise times was based on initial increases in acoustic signals.
4.3 Vertical migration and latitudinal depth variability of SSLs
The depth of echo rise and fall became progressively shallower, moving northward. In our study, SSLs were observed to descend and ascend in deeper waters in SLS and shallower waters in the NLS (Figure 9), highlighting their relationship with surrounding oceanographic conditions. Generally, deeper migrations are characterized by earlier departures and later arrivals compared to shallower migrations, with vertical migration velocities peaking in tropical and subtropical regions and decreasing toward the poles. Typically, migration velocities are faster during deeper and downward migrations than during shallower and upward movements (Bianchi and Mislan, 2015).
The original Sv echogram recorded SSLs, including diffuse layers, at depths reaching 800 m. While the diffuse layer was not identified as the core of the SSL, it provides crucial insights into DVM dynamics. Specifically, DVM depths in the NLS reached up to 700 m, whereas in the SLS, they extended to 800 m (see Figures 2 and 5, Kang et al., 2021). Consequently, the SSL, including the diffuse layer, within the mesopelagic layer (300–600 m) in the NLS was observed at depths exceeding 600 m in the SLS.
The factors driving DVM are multifaceted. External factors such as light penetration and intensity, lunar cycles, temperature, oxygen availability, ocean productivity, and various oceanographic and bathymetric features can influence the distribution and behavior of migrating organisms (Davison et al., 2015; Klevjer et al., 2016; Aksnes et al., 2017; Proud et al., 2017; Langbehn et al., 2019; Annasawmy et al., 2020; Bernal et al., 2020; Boswell et al., 2020). Internal factors, including age, body size, energetic state, and various behavioral and physiological traits, also play critical roles in shaping migration behavior (Ringelberg, 1995; Yasuma et al., 2010). Of these factors, light availability is one of the most influential external drivers of DVM. The migration patterns of marine organisms are tightly correlated with changes in light intensity, with animals typically moving between surface and deeper waters at dawn and dusk in response to the availability of light. NLS is presumed to be characterized by higher upwelling and reduced water transparency, whereas the SLS experiences higher light penetration. This may explain the observed differences in DVM depths between these regions, with deeper migrations occurring in the SLS. Numerous studies have demonstrated the significant role light plays in determining the vertical position of the SSL.
SSLs along a circumglobal transect through the Pacific, South Indian, and Atlantic Oceans were consistently found at light intensity levels between 350 to 800 m (Aksnes et al., 2017). The study found that the weighted mean depth of SSLs increased linearly with the reciprocal of the light attenuation coefficient, underscoring the importance of light in shaping their vertical distribution. In the northwestern Pacific Ocean, the SSL was observed at depths greater than the depth corresponding to 0.01% of surface light intensity (Song et al., 2022). Mesopelagic fish, adapted to low-light environments and operating at smaller spatial scales, may exploit “light comfort zones—areas where light levels are optimal for foraging while minimizing predation risk from visually hunting piscivores (Scheuerell and Schindler, 2003). At higher latitudes, the timing of this anti-predation window may shift in response to the extended daylight hours during spring and summer. Excessive light during these periods may prevent vertically migrating fish from ascending into surface waters for feeding due to increased predation risk (Kaartvedt et al., 2008). The deeper nighttime distributions of organisms at higher latitudes are attributed to the brighter nights caused by increased incoming light during summer. As nocturnal light levels rise, the amplitude of DVM decreases by several hundred meters. As latitude increases, the depth of the SSL also increases progressively (Norheim et al., 2016; Langbehn et al., 2019). A study conducted north of Svalbard, between 79.8°N and 81.4°N during January and August of 2016 and January of 2017, revealed that SSLs were distributed around 500 m during summer and 250 m during winter, demonstrating the pivotal role light plays in DVM (Geoffroy et al., 2019). Furthermore, in regions with sea ice (e.g., Sofia Deep North and South) and open ocean (5 stations), maximum SSL depths were observed to be deeper under high-light conditions compared to low-light environments. However, at the ice edge (Yermak Plateau), the maximum depths were similar due to highly variable light conditions, with the most intense light lasting only for short periods (Gjøsæter et al., 2017). Although light plays a crucial role in the depth dynamics of SSLs, studies exploring this relationship in the Indian Ocean are limited. We intend to explore this relationship in future research.
4.4 Methodology for the metrics of the SSLs
To date, two significant studies have focused on SSL detection algorithms (Cade and Benoit-Bird, 2014; Proud et al., 2015). Proud et al. (2015) identified SSLs by comparing the MVBS of cells with the background, excluding phantom SSLs (incorrect detections) and those with a minimum duration of less than 60 min. They then classified SSLs using region-based image segmentation processing, from which SSL metrics were derived. In contrast, Cade and Benoit-Bird (2014) developed an automatic scattering layer detection method that eliminates background noise and resamples data using a horizontal median filter. They identified the scattering layer boundary by applying a Gaussian curve to the acoustic values above the threshold. This study aligns with Cade and Benoit-Bird (2014) by eliminating noise interference and defining boundaries using a Gaussian blur algorithm (Figure 2). Additionally, this study advances the field by deriving internal characteristics of SSLs, such as their MVBS, CM, inertia, and aggregation index, along with metrics like length, thickness, and distribution depth. This comprehensive metric structure enhances SSL classification and characterization, which is crucial for understanding their role in oceanic ecosystems and for comparisons across different ecosystems and studies. Furthermore, this approach supports research on the ocean’s mid-trophic structure, providing a global prey field valuable for predator-prey ecologists studying interactions within oceanographic environments. Monitoring SSL structures over extended periods can also reveal climatic influences and their effects on SSL inhabitants (Lehodey et al., 2003; 2010; Bianchi et al., 2013; Handegard et al., 2013).
The Gaussian blur filter offers several advantages: (1) It convolves the image using a Gaussian function, which features a bell-shaped curve that produces a weighted average of neighboring pixels. This process smooths the image, reducing noise and creating a more uniform appearance. (2) The filter uniquely preserves the structural elements of an image while reducing noise, ensuring that edges remain intact. (3) It allows for adjustments to the window size or the standard deviation of the Gaussian function, providing control over the degree of smoothing. By choosing an appropriate window size, the Gaussian filter can effectively retain edge details while minimizing noise. These advantages make the Gaussian blur algorithm widely used for processing fish school images derived from echosounder data (Korneliussen et al., 2009; Patti et al., 2011; Grassian et al., 2023). However, these advantages can also present drawbacks. Excessive smoothing may result in the loss of critical fine details. Features such as sharp edges, which are important for accurate analysis, may become blurred, leading to reduced precision. Additionally, the filter can make areas of the image overly uniform, potentially oversimplifying the representation of the data. In this study, a 5 × 5 convolution kernel and a standard deviation of one for the Gaussian distribution were applied. The horizontal span of 5 pings covered 30.2 m, while the vertical span of 5 data samples covered 0.91 m. The kernel size was relatively small, and the standard deviation used was moderate. The filter operated independently of the SSL core size, and the difference in the MVBS value of the entire SSL core, with and without the filter, was 0.11 dB. Although this difference is minor, caution is advised when applying this filter in image processing based on echosounder data.
4.5 Latitudinal variations of SSLs
Off Baja California, krill SSLs in northern waters were larger and denser compared to the smaller, more dispersed SSLs in the southern waters. The northern upwelling zone presents a different environment from the southern region, influencing SSL morphology and reflecting the relationship between latitudinal changes, oceanographic factors, and organism distribution (Gómez-Gutiérrez et al., 1999). Our findings in the southern hemisphere show a similar pattern: in the NLS, where the SCTR upwelling was pronounced, SSLs demonstrated both a larger (Figure 10) and denser distribution (Figure 5), akin to observations in the northern hemisphere. Although the number of detected SSL cores did not differ significantly, the acoustic biomass was notably higher in the NLS compared to the SLS (Figure 11).
The composition of phytoplankton in the mid-Atlantic Ocean varies significantly across latitudes from 50°N to 50°S, driven by factors such as temperature, stratification, nutrient availability, and light conditions (Barlow et al., 2023). Chakraborty et al. (2020) reported low plankton biomass at low latitudes, transitioning to high biomass between 40°N and 50°N. In the western Indian Ocean, gonostomatid species’ distribution varies with hydrographic characteristics, including the Indian Equatorial Water, Indian Central Water, and their frontal zones. The survey area included lines from 10°N to 45°S along 60°E and from 18°N to 40°S along 65°E, encompassing the current study area. The distribution of gonostomatid fish varied with latitude, aligning with the high acoustic biomass observed in SSLs in this study (Figure 11; Craddock and Haedrich, 1973). An analysis of 35,000 marine species revealed a latitudinal gradient with notable absences of peaks near the equator, showing bimodal richness peaking at mid-latitudes (approximately 25°S to 20°S and 20°N to 25°N) and decreasing toward the equator. Understanding these spatial patterns requires detailed knowledge of species ranges, especially in tropical regions where sampling is limited (Menegotto and Rangel, 2018). This study provides significant data on previously uncharted marine organisms and environments in the tropical western Indian Ocean, offering valuable insights.
4.6 Connection between taxa and backscatter property
In this study, we applied a threshold of −65 dB to derive the morphological and distributional dynamics of SSL cores in waters up to 600 m in depth. However, as we used only a single frequency of 38 kHz, we could not directly identify marine species. Therefore, we discuss the biota and acoustic properties based on published studies that employed multiple frequencies or conducted net sampling. Five acoustic biota groups were categorized in a study region similar to ours using 18 and 38 kHz frequencies (ΔMVBS = MVBS38 – MVBS18; D’Elia et al., 2016): crustacean/small non-swim bladder fish, large non-swim bladder fish, swim bladder fish, and unclassified groups (Kang et al., 2021).
These groups were further examined across three depth layers: epipelagic (0–200 m), upper mesopelagic (200–600 m), and lower mesopelagic (600–1,000 m) layers. In the SCTR, the NASC values for crustaceans, small non-swim bladder fish, and large non-swim bladder fish were recorded in the upper mesopelagic layer, whereas those of other groups were primarily observed in the epipelagic layer. In non-SCTR regions, the acoustic biomass of most groups was predominantly distributed within the epipelagic layer. Throughout the survey, clear DVM was observed at depths of 200–800 m, with more pronounced and shallower DVM in the SCTR (12–3°S) compared to the non-SCTR (27–12°S) (Kang et al., 2021). Additionally, non-migratory scatterers were consistently observed in the upper mesopelagic layer of both regions, suggesting the presence of resident organisms. It is evident that different biota exhibit preferences for varying depths. This indirectly suggests that the organisms residing in the epipelagic and upper mesopelagic layers form the SSL core observed in this study (Figures 6, 8).
In previous net-based studies in the southwest Indian Ocean, Sigmops elongatus was found to be the most abundant species in La Pérouse (Cherel et al., 2020), while in the epipelagic layers of the Indian South Subtropical Gyre, Myctophidae was the dominant family, followed by crustaceans (Annasawmy et al., 2018). Pelagic trawls conducted at seamounts in the western Indian Ocean (La Pérouse, Madagascar Ridge, and Walters Shoal) revealed that Myctophidae, Gonostomatidae, and Sternoptychidae accounted for 80% of the total catch (Annasawmy et al., 2020). Consequently, the biological groups forming the SSL core in this study are likely to include species from the order Myctophiformes and various crustaceans.
4.7 Marine organism habitat conditions
Upwelling zones are unique and vital habitats for marine life. Upwelling generally occurs when strong positive vorticity in surface winds causes cyclonic wind stress to curl, leading to divergence within the surface layer and resulting in upward vertical velocity. In this study, the NLS is part of the largest and most persistent open-ocean upwelling region in the Indian Ocean, known as the SCTR, which is characterized by distinct cyclonic circulation patterns (Vialard et al., 2009; Robinson et al., 2010; Kumar et al., 2014; Marsac, 2017). The SCTR upwelling is crucial for biogeochemical cycles, influencing nutrients in the upper ocean and supporting marine life. The upwelling of deeper, nutrient-rich water in this region fosters plankton and micronekton growth, particularly during the monsoon seasons, leading to biannual phytoplankton blooms and increased biological productivity that benefits tuna species. This study found that the distribution of SSLs was significantly higher in the NLS compared to the SLS regions (Figures 4–6), a phenomenon attributed to the distinctive oceanographic environments created by the SCTR upwelling.
The SCTR upwelling varies with El Niño Southern Oscillation and IOD events (Yokoi et al., 2008). For instance, during the positive IOD phase of 2019, Chl-a concentrations surged off the coast of Java in the eastern Indian Ocean due to intensified upwelling, while SCTR upwelling in the western Indian Ocean was largely suppressed. This Chl-a bloom, driven by strong coastal upwelling, resulted in a significant increase in the abundance of small pelagic fish. Conversely, during the negative IOD phase, the opposite effect was observed (Lumban-Gaol et al., 2021). The IOD phase was neutral during the observation period of this study. Elevated fluorescence levels and increased NASC, a proxy for micronekton biomass, were observed at approximately 100 m depth in the NLS (Figure 11). Fluorescence, which is the emission of visible light when a substance absorbs ultraviolet or blue light (Stelmaszewski, 2012), correlates with chlorophyll concentration. This relationship is significant for the vertical distribution of phytoplankton, the primary producers, and zooplankton, the primary consumers (Briseño-Avena et al., 2020). From June to August, elevated Chl-a concentrations and high primary production were observed near the surface in the SCTR region (Hood et al., 2017). These observations, attributed to upwelling, align with the findings of this study. Additionally, factors such as temperature and DO concentration play pivotal roles in determining zooplankton migration velocity and distribution during DVM (Klevjer et al., 2016; Simoncelli et al., 2019). Salinity in surface layers affects the vertical stability of the water column and, along with temperature, influences plankton distribution (Shikata et al., 2014). The SSLs observed in this study may exhibit both vertical and horizontal variability due to the diverse oceanographic environments across the study area.
During positive IOD phases, weakened upwelling in the SCTR of the western Indian Ocean and intensified upwelling off the coasts of Java and Sumatra in the eastern Indian Ocean drive tuna to migrate eastward in search of more favorable foraging conditions (Robinson et al., 2010; Monllor-Hurtado et al., 2017). The Indian Ocean is renowned for its significant fishing grounds, hosting key species such as tuna, anchovies, mackerel, sardines, and squids. Tuna, in particular, holds crucial commercial importance, constituting approximately 30% of the total catch in the region. This study recorded higher overall acoustic signals in the NLS than in the SLS, with robust acoustic values within SSL cores between latitudes 10°S and 4°S, at depths ranging from 300 to 600 m (Figure 6). Longline fishing data for bigeye tuna from 1952 to 2014 across the Indian Ocean up to 50°S revealed peak catches in tropical regions between 10°N and 15°S. Similarly, purse seine fishing catches were concentrated in the tropical zones of the western Indian Ocean (Wibawa et al., 2017). Analysis from the Indian Ocean Tuna Commission database indicated significantly higher average longline tuna catches from 2000 to 2013 in the NLS compared to the SLS. Reports from 2013 to 2017 highlighted increased tuna catches in the northern and western sectors of the Indian Ocean relative to the southern and eastern regions (Assan et al., 2018). This suggests that tuna prey species were more abundant in the NLS compared to the SLS in this study.
During upwelling events, forage species such as krill and anchovies aggregate into discrete swarms and schools, whereas during upwelling relaxation periods, both species exhibit a more diffuse distribution (Benoit-Bird et al., 2019). In the NLS, SSLs were more extensive than in the SLS, where the MVBS in the EL and ML were more dispersed vertically compared to the more compact formations in the NLS (Figure 10). High aggregation index values (indicating more compact formations) in the NLS were consistent with these observations. Few studies have investigated the spatial and structural characteristics of marine organisms concerning upwelling intensity in the SCTR. Long-term continuous time-series observations are needed in this remote region to examine SSL characteristics concerning upwelling intensity and seasonal variations. Future research will address this topic. In conclusion, studying marine life in the SCTR upwelling zone and nearby waters is crucial for understanding the ecological dynamics that support its rich biodiversity and significant fisheries. This study provides insights into how upwelling influences SSL distribution and metric properties, aiding in the conservation and sustainable management of epi- and mesopelagic organisms and guiding strategies to protect these vital marine ecosystems in the face of climate change.
Data availability statement
All datasets utilized in this study are available upon request from the first author, MK (mk@gnu.ac.kr).
Author contributions
MK: Formal analysis, Funding acquisition, Methodology, Software, Supervision, Validation, Visualization, Writing – original draft, Writing – review & editing. FS: Formal analysis, Software, Visualization, Writing – review & editing. DK: Formal analysis, Software, Visualization, Writing – review & editing. JJ: Formal analysis, Software, Visualization, Writing – review & editing. JK: Formal analysis, Writing – review & editing. SS: Formal analysis, Writing – review & editing. YK: Investigation, Methodology, Visualization, Writing – review & editing. D-JK: Conceptualization, Investigation, Methodology, Supervision, Validation, Writing – review & editing. SN: Methodology, Supervision, Validation, Writing – review & editing.
Funding
The author(s) declare financial support was received for the research, authorship, and/or publication of this article. This research was supported by Korea Institute of Marine Science & Technology Promotion (KIMST) funded by the Ministry of Oceans and Fisheries (20230005). Additionally, it was conducted as part of the project titled “KIOS (Korea Indian Ocean Study): Korea-US Joint Observation Study of the Indian Ocean,” funded by KIMST under the Ministry of Oceans and Fisheries, Korea (20220548, PM63180, Project No. RS-2022-KS221662, PM63990).
Acknowledgments
We extend our gratitude to all crew members and marine research instrument observers of R/V Isabu for their exceptional assistance.
Conflict of interest
The authors declare that this study was conducted without any commercial or financial relationships that could be construed as potential conflicts of interest.
Publisher’s note
All claims expressed in this article are solely those of the authors and do not necessarily represent those of their affiliated organizations, or those of the publisher, the editors and the reviewers. Any product that may be evaluated in this article, or claim that may be made by its manufacturer, is not guaranteed or endorsed by the publisher.
Supplementary material
The Supplementary Material for this article can be found online at: https://www.frontiersin.org/articles/10.3389/fmars.2024.1481531/full#supplementary-material
Supplementary Figure 1 | CTD and SSL core regions are represented as “region bitmap”; two bitmaps are combined using a logical “and” operation. Applying “and” bitmap as a mask on volume backscattering strength (Sv) echogram retains only true (valid) parts of “and” bitmap on echogram.
Supplementary Figure 2 | Histograms of (top to bottom) MVBS and oceanographic environmental parameters (temperature, dissolved oxygen, and salinity) extracted from the location of the SSL core within each distributional depth layer (Epipelagic, Intermediate, and Mesopelagic layers; EL, IL, and ML, respectively).
Abbreviations
SSL (Sound Scattering Layer); CTD (Conductivity-Temperature-Depth); MVBS (Mean Volume Backscattering Strength); Sv (Volume Backscattering Strength); EL (Epipelagic Layer); IL (Intermediate Layer); ML (Mesopelagic Layer); SLS (Southern Latitude Section); NLS (Northern Latitude Section); CM (Center of Mass); NASC (Nautical Area Scattering Coefficient); SCTR (Seychelles-Chagos Thermocline Ridge); IOD (Indian Ocean Dipole).
References
Agersted M. D., Khodabandeloo B., Liu Y., Melle W., Klevjer T. A. (2021). Application of an unsupervised clustering algorithm on in situ broadband acoustic data to identify different mesopelagic target types. ICES J. Mar. Sci. 78, 2907–2921. doi: 10.1098/rspb.2019.0353
Aksnes D. L., Røstad A., Kaartvedt S., Martinez U., Duarte C. M., Irigoien X. (2017). Light penetration structures the deep acoustic scattering layers in the global ocean. Sci. Adv. 3, e1602468. doi: 10.1126/sciadv.1602468
Annasawmy P., Ternon J., Lebourges-Dhaussy A., Roudaut G., Cotel P., Herbette S., et al. (2020). Micronekton distribution as influenced by mesoscale eddies, Madagascar shelf and shallow seamounts in the south-western Indian Ocean: an acoustic approach. Deep Sea Res. II 176, 104812. doi: 10.1016/j.dsr2.2020.104812
Annasawmy P., Ternon J. F., Marsac F., Cherel Y., Behagle N., Roudaut G., et al. (2018). Micronekton diel migration, community composition and trophic position within two biogeochemical provinces of the Southwest Indian Ocean: Insight from acoustics and stable isotopes. Deep Sea Res. I Oceanogr. Res. Pap. 138, 85–97. doi: 10.1016/j.dsr.2018.07.002
Ariza A., Landeira J. M., Escanez A., Wienerroither R., Soto N. A., Rostad A., et al. (2016). Vertical distribution, composition and migratory patterns of acoustic scattering layers in the Canary Islands. J. Mar. Sys. 157, 82–91. doi: 10.1016/j.jmarsys.2016.01.004
Assan C., Lucas J., Lucas V. (2018). Seychelles National Report to the Scientific Committee of the Indian Ocean Tuna Commission 2018 (Victoria: Indian Ocean Tuna Commission).
Bakun A., Roy C., Lluch-Cota S. (1998). Coastal upwelling and other processes regulating ecosystem productivity and fish production in the western Indian Ocean. Env. Sci. Biol., 103–141. Available at: http://www.documentation.ird.fr/hor/fdi:010025378.
Baquero-Bernal A., Latif M., Legutke S. (2002). Notes and correspondence on dipolelike variability of sea surface temperature in the tropical Indian Ocean. J. Clim. 15, 1358–1386. doi: 10.1175/1520-0442(2002)015<1358:ODVOSS>2.0.CO;2
Barange M. (1994). Acoustic identification, classification and structure of biological patchiness on the edge of the Agulhas Bank and its relation to frontal features. South Afr. J. Mar. Sci. 14, 33–347. doi: 10.2989/025776194784286969
Barlow R., Lamont T., Viljoen J., Airs R., Brewin R., Tilstone G., et al. (2023). Latitudinal variability and adaptation of phytoplankton in the Atlantic Ocean. J. Mar. Sys. 239, 103844. doi: 10.1016/j.jmarsys.2022.103844
Benoit-Bird K. J., Waluk C. M., Ryan J. P. (2019). Forage species swarm in response to coastal upwelling. Geophys. Res. Lett. 46, 1537–1546. doi: 10.1029/2018GL081603
Bernal A., Toresen R., Reira R. (2020). Mesopelagic fish composition and diets of three myctophid species with potential incidence of microplastics, across the southern tropical gyre. Deep Sea Res. II 179, 104706. doi: 10.1016/j.dsr2.2019.104706
Bertrand A., Bard F. X., Josse E. (2002). Tuna food habits related to the micronekton distribution in French Polynesia. Mar. Biol. 140, 1023–1037. doi: 10.1007/s00227-001-0776-3
Bianchi D., Mislan K. A. S. (2015). Global patterns of diel vertical migration times and velocities from acoustic data. Limnol. Oceanogr. 61, 353–364. doi: 10.1002/lno.10219
Bianchi D., Stock C., Galbraith E. D., Sarmiento J. L. (2013). Diel Vertical Migration: ecological controls and impacts on the biological pump in a one-dimensional ocean model. Global Biogeochem. Cycles 27, 478–491. doi: 10.1002/gbc.20031
Boersch-Supan P. H., Rogers A. D., Brierley A. S. (2017). The distribution of pelagic sound scattering layers across the southwest Indian Ocean. Deep Sea Res. Part II: Top. Stud. Oceanogr. 136, 108–121. doi: 10.1016/j.dsr2.2015.06.023
Boswell K. M., D’Elia M., Johnston M. W., Mohan J. A., Warren J. D., Wells R. J. D., et al. (2020). Oceanographic structure and light levels drive patterns of sound scattering layers in a low-latitude oceanic system. Front. Mar. Sci. 7. doi: 10.3389/fmars.2020.00051
Briseño-Avena C., Prairie J. C., Franks P. J. S., Jaffe J. S. (2020). Comparing vertical distributions of Chl-a fluorescence, marine snow, and taxon-specific zooplankton in relation to density using high-resolution optical measurements. Front. Mar. Sci. 7. doi: 10.3389/fmars.2020.00602
Burns J. M., Subrahmanyam B. (2016). Variability of the Seychelles-Chagos thermocline ridge dynamics in connection with ENSO and Indian Ocean dipole. IEEE Geosci. Remote Sens. Lett. 13, 2019–2023. doi: 10.1109/LGRS.2016.2621353
Cade D. E., Benoit-Bird K. J. (2014). An automatic and quantitative approach to the detection and tracking of acoustic scattering layers. Limnol. Oceanogr. Methods 12, 742–756. doi: 10.4319/lom.2014.12.742
Chakraborty S., Cadier M., Visser A. W., Bruggeman J., Andersen K. H. (2020). Latitudinal variation in plankton traits and ecosystem function. Global Biogeochem. Cycles 34, e2020GB006564. doi: 10.1029/2020GB006564
Cherel Y., Fontaine C., Richard P., Labat J. P. (2020). Seasonal changes in the trophic ecology of pelagic fishes in subantarctic waters. Mar. Ecol. Progr. Ser. 639, 205–223. doi: 10.3354/meps13266
Cisewski B., Strass V. H., Rhein M., Krägefsky S. (2010). Seasonal variation of diel vertical migration of zooplankton from ADCP backscatter time series data in the Lazarev Sea, Antarctica. Deep Sea Res. Part I: Oceanogr. Res. Pap. 57, 78–94. doi: 10.1016/j.dsr.2009.10.005
Coetzee J. (2000). Use of a shoal analysis and patch estimation system (SHAPES) to characterise sardine schools. Aquat. Living Resour. 13, 1–10. doi: 10.1016/S0990-7440(00)00139-X
Craddock J. E., Haedrich R. L. (1973). The distribution of gonostomatid fishes in the western Indian Ocean. J. Mar. Biol. Assoc. India. 15, 285–292.
D’Addezio J. M., Subrahmanyam B. (2018). Evidence of organized intraseasonal convection linked to ocean dynamics in the Seychelles-Chagos thermocline ridge. Clim. Dyn. 51, 9–10. doi: 10.1007/s00382-018-4087-5
D’Elia M., Gianfaldoni D., Scardi M., Pizzichetta E. (2009). Acoustic characterization of mesopelagic scattering layers in the Mediterranean Sea. Deep Sea Res. Part I: Oceanogr. Res. Pap. 56, 1474–1484. doi: 10.1016/j.dsr.2009.05.008
D’Elia M., Warren J. D., Rodriguez-Pinto I., Sutton T. T., Cook A., Boswell K. M. (2016). Diel variation in the vertical distribution of deep-water scattering layers in the Gulf of Mexico. Deep Sea Res. I Oceanogr. Res. Pap. 115, 91–102. doi: 10.1016/j.dsr.2016.05.014
Dai L., Li C., Yang G., Sun X. (2016). Zooplankton abundance, biovolume and size spectra at western boundary currents in the subtropical North Pacific during winter 2012. J. Mar. Syst. 155, 73–83. doi: 10.1016/j.jmarsys.2015.11.004
Danckwerts D. K., McQuaid C. D., Jaeger A., McGregor G. K., Dwight R., Le Corre M., et al. (2014). Biomass consumption by breeding seabirds in the western Indian Ocean: indirect interactions with fisheries and implications for management. ICES J. Mar. Sci. 71, 1–10. doi: 10.1093/icesjms/fsu093
Davison P., Lara-Lopez A., Koslow J. A. (2015). Mesopelagic fish biomass in the southern California current ecosystem. Deep Sea Res. II 112, 129–142. doi: 10.1016/j.dsr2.2014.10.007
Décima M., Landry M. R., Stukel M. R., Lopez-Lopez L., Krause J. W. (2016). Mesozooplankton biomass and grazing in the Costa Rica Dome: amplifying variability through the plankton food web. J. Plankton Res. 38, 317–330. doi: 10.1093/plankt/fbv091
Demer D. A., Berger L., Bernasconi M., Bethke E., Boswell K., Chu D., et al. (2015). Calibration of acoustic instruments. ICES Coop. Res. Rep. 326, 133. doi: 10.25607/OBP-185
Diner N. (2001). Correction on school geometry and density: approach based on acoustic image simulation. Aquat. Living Resour. 14, 211–222. doi: 10.1016/S0990-7440(01)01121-4
Dornan T., Fielding S., Saunders R. A., Genner M. J. (2019). Swimbladder morphology masks Southern Ocean mesopelagic fish biomass. Proc. R. Soc B. 286, 20190353. doi: 10.1098/rspb.2019.0353
Dypvik E., Kaartvedt S. (2013). Vertical migration and diel feeding periodicity of the skinnycheek lanternfish (Benthosema pterotum) in the Red Sea. Deep Sea Res. I Oceanogr. Res. Pap. 72, 9–16. doi: 10.1016/j.dsr.2012.10.012
Echoview (2024).Help file for echoview. Available online at: https://support.echoview.com/WebHelp/Echoview.htm (accessed June 3, 2024).
Escobar-Flores P., Trevorrow M. V., Mackas D. L. (2020). Observations of diel vertical migration patterns in the Strait of Georgia with emphasis on krill. Progr. Oceanogr. 183, 102276. doi: 10.1016/j.pocean.2020.102276
Filipe V. L. (1997). “The Angola Dome as observed in 1996,” in ICES Council Meeting Papers (ICES, Copenhagen, Denmark). Available at: https://www.ices.dk/sites/pub/CM%20Documents/1997/EE/1997_EE14.pdf (accessed June 3, 2024).
Gao T., Tong J., Xue M., Zhu Z., Qiu Y., Kindong R., et al. (2023). Characterizing the sound-scattering layer and its environmental drivers in the north equatorial current of the central and western Pacific Ocean. J. Mar. Sci. Eng. 11, 1477. doi: 10.3390/jmse11071477
Geoffroy M., Daase M., Cusa M., Darnis G., Graeve M., Hernández N. S., et al. (2019). Mesopelagic sound scattering layers of the high arctic: seasonal variations in biomass, species assemblage, and trophic relationships. Front. Mar. Sci. 6. doi: 10.3389/fmars.2019.00364
George J. V., Nuncio G. M., Anilkumar N., Chacko R., Rajashekhar D. (2018). Seasonal surface chlorophyll a variability in the Seychelles-Chagos Thermocline Ridge. Curr. Sci. 114, 868–878. doi: 10.18520/cs/v114/i04/868-878
Gjøsæter H., Ingvaldsen R., Christiansen J. S. (2020). Acoustic scattering layers reveal a faunal connection across the Fram Strait. Prog. Oceanogr. 185, 102348. doi: 10.1016/j.pocean.2020.102348
Gjøsæter H., Wiebe P. H., Knutsen T., Ingvaldsen R. B. (2017). Evidence of diel vertical migration of mesopelagic sound-scattering organisms in the Arctic. Front. Mar. Sci. 4. doi: 10.3389/fmars.2017.00332
Gómez-Gutiérrez J., González-Chávez G., Robinson C. J., Arenas-Fuentes V. (1999). Latitudinal changes of euphausiid assemblages related to the morphological variability of the sound scattering layer along Baja California, October 1994. Sci. Mar. 63, 79–91. doi: 10.3989/scimar.1999.63n179
Grassian B., Roman C., Warren J. D., Casagrande D. (2023). High-resolution measurements of the epipelagic and mesopelagic ocean by a profiling vehicle equipped with environmental sensors and a broadband echosounder. Limnol. Oceanogr.: Methods 21, 106–125. doi: 10.1002/lom3.10532
Handegard N. O., du Buisson L., Brehmer P., Chalmers S. J., Robertis A., Huse G., et al. (2013). Towards an acoustic-based coupled observation and modelling system for monitoring and predicting ecosystem dynamics of the open ocean. Fish Fish. 14, 605–615. doi: 10.1111/j.1467-2979.2012.00480.x
Hermes J. C., Reason C. J. C. (2009). The sensitivity of the Seychelles-Chagos thermocline ridge to large-scale wind anomalies. ICES J. Mar. Sci. 66, 1455–1466. doi: 10.1093/icesjms/fsp074
Hood R. R., Beckley L. E., Wiggert J. D. (2017). Biogeochemical and ecological impacts of boundary currents in the Indian Ocean. Prog. Oceanogr. 156, 290–325. doi: 10.1016/j.pocean.2017.04.011
Irigoien X., Klevjer T. A., Røstad A., Martinez U., Boyra G., Acuña J. L. (2014). Large mesopelagic fishes biomass and trophic efficiency in the open ocean. Nat. Commun. 5, 3271. doi: 10.1038/ncomms4271
Jaquemet S., Ternon J. F., Kaehler S., Thiebot J. B., Dyer B., Bemanaja E., et al. (2014). Contrasted structuring effects of mesoscale features on the seabird community in the Mozambique Channel. Deep Sea Res. II 100, 200–211. doi: 10.1016/j.dsr2.2013.10.027
Jayakumar A., Vialard J., Lengaigne M., Gnanaseelan C., McCreary J. P., Kumar P. B. (2011). Processes controlling the surface temperature signature of the Madden-Julian Oscillation in the thermocline ridge of the Indian Ocean. Clim. Dyn. 37, 2217–2234. doi: 10.1007/s00382-010-0953-5
Jeffrey S. T., Humphrey G. F. (1975). New spectrophotometric equations for determining chlorophylls a, b, c1 and c2 in higher plants, algae and natural phytoplankton. Biochemie und Physiol. der pflanzen 167, 191–194. doi: 10.1016/S0015-3796(17)30778-3
Kaartvedt S., Torgersen T., Klevjer T. A., Røstad A., Devine J. A. (2008). Behavior of individual mesopelagic fish in acoustic scattering layers of Norwegian fjords. Mar. Ecol. Prog. Ser. 360, 201–209. doi: 10.3354/meps07364
Kaltenberg A. M., Biggs D. C., DiMarco S. F. (2007). Deep scattering layers of the Northern Gulf of Mexico observed with a shipboard 38-kHz acoustic doppler current profiler. Gulf Mex. Sci. 25, 1. doi: 10.18785/goms.2502.01
Kang M., Kang J. H., Kim M., Nam S. H., Choi Y., Kang D. J. (2021). Sound scattering layers within and beyond the Seychelles-Chagos thermocline ridge in the southwest Indian Ocean. Front. Mar. Sci. 8. doi: 10.3389/fmars.2021.769414
Kang D. J., Kim Y. (2023). In-situ calibration of membrane type dissolved oxygen sensor for CTD. The Sea: J. Korean Soc. Oceanogr. 28, 41–50. doi: 10.7850/jkso.2023.28.1.041
Kang M., Oh S., Oh W., Kang D. J., Nam S., Lee K. (2024). Acoustic characterization of fish and macroplankton communities in the Seychelles-Chagos Thermocline Ridge of the southwest Indian Ocean. Deep Sea Res. II 213, 105356. doi: 10.1016/j.dsr2.2023.105356
Klevjer T. A., Irigoien X., Røstad A., Fraile-Nuez E., Benítez-Barrios V. M., Kaartvedt S. (2016). Large scale patterns in vertical distribution and behaviour of mesopelagic scattering layers. Sci. Rep. 6, 19873. doi: 10.1038/srep19873
Klevjer T. A., Melle W., Knutsen T., Aksnes D. L. (2020). Vertical distribution and migration of mesopelagic scatterers in four north Atlantic basins. Deep Sea Res. II Top. Stud. Oceanogr. 180, 104811. doi: 10.1016/j.dsr2.2020.104811
Kloser R. J., Ryan T. E., Young J. W., Lewis M. E. (2009). Acoustic observations of micronekton fish on the scale of an ocean basin: potential and challenges. ICES J. Mar. Sci. 66, 998–1006. doi: 10.1093/icesjms/fsp077
Knutsen T., Wiebe P. H., Gjøsæter H., Ingvaldsen R. B., Lien G. (2017). High latitude epipelagic and mesopelagic scattering layers—A reference for future arctic ecosystem change. Front. Mar. Sci. 4. doi: 10.3389/fmars.2017.00334
Korneliussen R. J., Heggelund Y., Eliassen I. K., Johansen G. O. (2009). Acoustic species identification of schooling fish. ICES J. Mar. Sci. 66, 1111–1118. doi: 10.1093/icesjms/fsp119
Kumar B. P., Vialard J., Lengaigne M., Murty V. S. N., Foltz G. R., Mcphaden M. J., et al. (2014). Processes of interannual mixed layer temperature variability in the thermocline ridge of the Indian Ocean. Clim. Dyn. 43, 2377–2397. Available at: http://drs.nio.org/drs/handle/2264/4660 (accessed June 3, 2024).
Lan K. W., Evans K., Lee M. A. (2013). Effects of climate variability on the distribution and fishing conditions of yellowfin tuna (Thunnus albacares) in the western Indian Ocean. Clim. Change 119, 63–77. doi: 10.1007/s10584-012-0637-8
Langbehn T. J., Aksnes D. L., Kaartvedt S., Fiksen Ø., Jørgensen C. (2019). Light comfort zone in a mesopelagic fish emerges from adaptive behaviour along a latitudinal gradient. Mar. Ecol. Prog. Ser. 623, 161–174. doi: 10.3354/meps13024
Lee D. B., Choi K. H., Ha H. K., Yang E. J., Lee S. H., Lee S., et al. (2013). Mesozooplankton distribution patterns and grazing impacts of copepods and Euphausia crystallorophias in the Amundsen Sea, West Antarctica, during austral summer. Polar Biol. 36, 1215–1230. doi: 10.1007/s00300-013-1314-8
Lee E., Kim C., Na H. (2022). Suppressed upwelling events in the Seychelles–Chagos thermocline ridge of the southwestern tropical Indian Ocean. Ocean Sci. J. 57, 305–313. doi: 10.1007/s12601-022-00075-x
Lehodey P., Chai F., Hampton J. (2003). Modelling climate-related variability of tuna populations from a coupled ocean-biogeochemical-populations dynamics model. Fish. Oceanogr. 12, 483–494. doi: 10.1046/j.1365-2419.2003.00244.x
Lehodey P., Murtugudde R., Senina I. (2010). Bridging the gap from ocean models to population dynamics of large marine predators: a model of mid-trophic functional groups. Progr. Oceanogr. 84, 69–84. doi: 10.1016/j.pocean.2009.09.008
Li Y., Han W., Shinoda T., Wang C., Ravichandran M., Wang J. (2014). Revisiting the wintertime intraseasonal SST variability in the tropical south Indian Ocean: impact of the ocean interannual variation. J. Phys. Oceanogr. 44, 1886–1907. doi: 10.1175/JPO-D-13-0238.1
Lumban-Gaol J., Siswanto E., Mahapatra K., Natih N. M. N., Nurjaya I. W., Hartanto M. T., et al. (2021). Impact of the Strong Downwelling (Upwelling) on Small Pelagic Fish Production during the 2016 (2019) Negative (Positive) Indian Ocean Dipole Events in the Eastern Indian Ocean off Java. Clim 9, 29. doi: 10.3390/cli9020029
Marsac F. (2017). “The Seychelles tuna fishery and climate change,” in Climate Change Impacts on Fisheries and Aquaculture: A Global Analysis, vol. Vol. 2. (Wiley, New York, NY), 523–568. doi: 10.1111/gcb.14858
McDougall T. J., Barker R., Millero P. M. (2011). Getting started with TEOS-10 and the Gibbs Seawater (GSW) Oceanographic Toolbox. p. 28. Available at: https://www.teos-10.org/pubs/Getting_Started.pdf (accessed December 8, 2024).
Menegotto A., Rangel T. F. (2018). Mapping knowledge gaps in marine diversity reveals a latitudinal gradient of missing species richness. Nat. Commun. 9, 4713. doi: 10.1038/s41467-018-07217-7
Monllor-Hurtado A., Pennino M. G., Sanchez-Lizaso J. L. (2017). Shift in tuna catches due to ocean warming. PloS One 12, e0178196. doi: 10.1371/journal.pone.0178196
Ndour I., Berraho A., Fall M., Ettahiri O., Sambe B. (2018). Composition, distribution and abundance of zooplankton and ichthyoplankton along the Senegal-Guinea maritime zone (West Africa). J. Aquat. Res. 44, 109–124. doi: 10.1016/j.ejar.2018.04.001
Norheim E., Godø O. R., Macaulay G. J., Handegard N. O. (2016). Estimating the density of fish within the sound scattering layer of the Northeast Atlantic. ICES J. Mar. Sci. 73, 940–950. doi: 10.1093/icesjms/fsw003
Olivar M. P., Bernal A., Molí B., Peña M., Balbín R., Castellón A., et al. (2012). Vertical distribution, diversity and assemblages of mesopelagic fishes in the western Mediterranean. Deep Sea Res. I. Top. Stud. Oceanogr. 62, 53–69. doi: 10.1016/j.dsr.2011.12.014
Patti B., Bonanno A., D’Elia M., Quinci E., Giacalone G., Fontana I., et al. (2011). Daytime pelagic schooling behaviour and relationships with plankton patch distribution in the Sicily Strait (Mediterranean Sea). Adv. Oceanogr. Limnol. 2, 79–92. doi: 10.1080/19475721.2011.571288
Peña M., Olivar M. P., Balbin R., Lopez-Jurado J. L., Iglesias M., Miquel J. (2014). Acoustic detection of mesopelagic fishes in scattering layers of the Balearic Sea (western Mediterranean). Can. J. Fish. Aquat. Sci. 71, 1186–1197. doi: 10.1139/cjfas-2013-0331
Potier M., Bach P., Ménard F., Marsac F. (2014). Influence of mesoscale features on micronekton and large pelagic fish communities in the Mozambique Channel. Deep Sea Res. II: Top. Stud. Oceanogr. 100, 184–199. doi: 10.1016/j.dsr2.2013.10.026
Potier M., Marsac F., Cherel Y., Lucas V., Sabatié R., Maury O., et al. (2007). Forage fauna in the diet of three large pelagic fishes (lancefish, swordfish and yellowfin tuna) in the western equatorial Indian Ocean. Fish. Res. 83, 60–72. doi: 10.1016/j.fishres.2006.08.020
Potier M., Romanov E., Cherel Y., Sabatié R., Zamorov V., Ménard F. (2008). Spatial distribution of Cubiceps pauciradiatus (Perciformes: nomeidae) in the tropical Indian Ocean and its importance in the diet of large pelagic fishes. Aquat. Living Resour. 21, 123–134. doi: 10.1051/alr:2008026
Prihartato P. K., Aksnes D. L., Kaartvedt S. (2015). Seasonal patterns in the nocturnal distribution and behavior of the mesopelagic fish Maurolicus muelleri at high latitudes. Mar. Ecol. Prog. Ser. 521, 189–200. doi: 10.3354/meps11139
Proud R., Cox M. J., Brierley A. S. (2017). Biogeography of the global ocean’s mesopelagic zone. Curr. Biol. 27, 113–119. doi: 10.1016/j.cub.2016.11.003
Proud R., Cox M. J., Brierley A. S. (2018). Biogeography of the global ocean’s mesopelagic zone. Curr. Biol. 28, 210–215. doi: 10.1016/j.cub.2018.01.078
Proud R., Cox M. J., Wotherspoon S., Brierley A. S. (2015). A method for identifying sound scattering layers and extracting key characteristics. Meth. Ecol. Evol. 6, 1190–1198. doi: 10.1111/2041-210X.12396
Reid D. G. (2000). Report on echo trace classification. ICES Coop. Res. Rep. 238, 1–115. doi: 10.17895/ices.pub.5371
Reygondeau G., Maury O., Beaugrand G., Fromentin J. M., Fonteneau A., Cury P. (2012). Biogeography of tuna and billfish communities. J. Biogeogr. 39, 114–129. doi: 10.1111/j.1365-2699.2011.02582.x
Ringelberg J. (1995). Diel vertical migration of zooplankton in lakes and oceans: Causal explanations and adaptive significances. Aquat. Ecol. 29, 247–281. doi: 10.1007/BF02055407
Robinson J., Guillotreau P., Jiménez-Toribio R., Lantz F., Nadzon L., Dorizo J., et al. (2010). Impacts of climate variability on the tuna economy of Seychelles. Clim. Res. 43, 149–162. doi: 10.3354/cr00890
Rolf S., von Westernhagen H., Thomsen F. (2009). Acoustic scattering of fish and zooplankton in the shallow waters of the North Sea. ICES J. Mar. Sci. 66, 540–552. doi: 10.1093/icesjms/fsp007
Romero-Romero S., Choy C. A., Hannides C. C., Popp B. N., Drazen J. C. (2019). Differences in the trophic ecology of micronekton driven by diel vertical migration. J. Limnol. Oceanogr. 64, 1473–1483. doi: 10.1002/lno.11128
Roxy M. K., Modi A., Murtugudde R., Valsala V., Panickal S., Kumar S. P., et al. (2016). A reduction in marine primary productivity driven by rapid warming over the tropical Indian Ocean. Geophys. Res. Lett. 43, 826–833. doi: 10.1002/2015GL066979
Ryan T. E., Downie R. A., Kloser R. J., Keith G. (2015). Reducing bias due to noise and attenuation in open-ocean echo integration data. ICES J. Mar. Sci. 72, 2482–2493. doi: 10.1093/icesjms/fsv121
Sato M., Benoit-Bird K. J. (2017). Spatial variability of deep scattering layers shapes the Bahamian mesopelagic ecosystem. Mar. Ecol. Prog. Ser. 580, 69–82. doi: 10.3354/meps12295
Scheuerell M. D., Schindler D. E. (2003). Diel vertical migration by juvenile sockeye salmon: empirical evidence for the antipredation window. Ecology 84, 1713–1720. doi: 10.1890/0012-9658(2003)084[1713:DVMBJS]2.0.CO;2
Schott F. A., McCreary J. P. (2001). The monsoon circulation of the Indian Ocean. Prog. Oceanogr. 51, 1–123. doi: 10.1016/S0079-6611(01)00083-0
Schott F. A., Xie S. P., McCreary J. P. (2009). Indian Ocean circulation and climate variability. Rev. Geophys. 47, 1–46. doi: 10.1029/2007RG000245
Shikata T., Sakamoto S., Onitsuka G., Aoki K., Yamaguchi M. (2014). Effects of salinity on diel vertical migration behavior in two red-tide algae, Chattonella antiqua and Karenia mikimotoi. Plankton Benthos Res. 9, 42–50. doi: 10.3800/pbr.9.42
Shujie W., Xinjun C. (2024). Study on the diel vertical migration characteristics of the deep scattering layer in the southwestern Indian Ocean. Haiyang Xuebao 46, 53–63. doi: 10.12284/hyxb2024016
Simoncelli S., Thackeray S. J., Wain D. J. (2019). Effect of temperature on zooplankton vertical migration velocity. Hydrobiol 829, 143–166. doi: 10.1007/s10750-018-3827-1
Smitha A., Sankar S., Satheesan K. (2023). Impact of tropical Indian Ocean warming on the surface phytoplankton biomass at two significant coastal upwelling zones in the Arabian Sea. Dynam. Atmos. Ocean. 103, 101401. doi: 10.1016/j.dynatmoce.2023.101401
Song H., Zeng X., Liu Z., Li M. (2022). Sound scattering layer dynamics: Contributions from zooplankton and micronekton under varying environmental conditions. Deep Sea Res. Part II: Top. Stud. Oceanogr. 199, 104929. doi: 10.1016/j.dsr2.2022.104929
Stelmaszewski A. (2012). Application of fluorescence in studies of marine petroleum pollutants (Poland: Zeszyty naukowe akademii morskiej w gdyni), 76.
SunCalc (2023).Solar data for Indian Ocean 17 May 2023 UTC+4. Available online at: https://www.suncalc.org//-20.0006,65,4/2023.05.17/20:03/1/3 (Accessed May 21, 2024).
Turner J. T. (1984). The feeding ecology of some zooplankters that are important prey items of larval fish. NOAA Tech. Rep. NMFS. 7, 1–28. Available at: http://spo.nwr.noaa.gov/tr7.pdf (accessed June 3, 2024).
Vialard J., Duvel J. P., Mcphaden M. J., Bouruet-Aubertot P., Ward B., Key E., et al. (2009). Cirene: air-sea interactions in the Seychelles-Chagos thermocline ridge region. B. Am. Meteorol. Soc 90, 45–61. doi: 10.1175/2008bams2499.1
Wang Z., DiMarco S. F., Ingle S., Belabbassi L., Al-Kharusi L. H. (2014). Seasonal and annual variability of vertically migrating scattering layers in the northern Arabian Sea. Deep Sea Res. Part I: Oceanogr. Res. Pap. 90, 152–165. doi: 10.1016/j.dsr.2014.05.008
Wang Y., McPhaden M. J. (2017). Seasonal cycle of cross-equatorial flow in the central Indian Ocean. J. Geophys. Res. Oceans. 122, 3817–3827. doi: 10.1002/2016JC012537
Wang Y., Zhang F., Geng Z., Zhang Y., Zhu J., Dai X. (2023). Effects of climate variability on two commercial tuna species abundance in the Indian Ocean. Fish 8, 99. doi: 10.3390/fishes8020099
Wibawa T. A., Lehodey P., Senina I. (2017). Standardization of a geo-referenced fishing data set for the Indian Ocean bigeye tuna, Thunnus obesus, (1952–2014). Earth Syst. Sci. Data. 9, 163–179. doi: 10.5194/essd-9-163-2017
Xie S. P., Annamalai H., Schott F. A., McCreary J. P. Jr. (2002). Structure and mechanism of South Indian Ocean climate variability. J. Clim. 15, 864–878. doi: 10.1175/1520-0442(2002)015<0864:SAMOSI>2.0.CO;2
Yasuma H., Nishimori Y., Kitagawa D., Aoki I., Ishii K. (2010). Acoustic characterization of fish and zooplankton in the Kuroshio Extension region using multi-frequency echosounders. J. Mar. Sys. 83, 142–156. doi: 10.1016/j.jmarsys.2010.05.011
Keywords: sound scattering layer, Southwest Indian Ocean, upwelling, morphometrics, oceanic attributes, Seychelles-Chagos Thermocline Ridge
Citation: Kang M, Simanungkalit F, Kang D, Jung J, Kim J, Song S, Kim Y, Kang D-J and Nam S (2024) Latitudinal influences on sound scattering layer characteristics in the Southwestern Indian Ocean: insights into oceanographic environmental interactions. Front. Mar. Sci. 11:1481531. doi: 10.3389/fmars.2024.1481531
Received: 16 August 2024; Accepted: 28 November 2024;
Published: 23 December 2024.
Edited by:
Patrizio Mariani, Technical University of Denmark, DenmarkReviewed by:
Lohengrin Fernandes, Instituto de Estudos do Mar Almirante Paulo Moreira, BrazilKjetil Gjeitsund Thorvaldsen, Technical University of Denmark, Denmark
Copyright © 2024 Kang, Simanungkalit, Kang, Jung, Kim, Song, Kim, Kang and Nam. This is an open-access article distributed under the terms of the Creative Commons Attribution License (CC BY). The use, distribution or reproduction in other forums is permitted, provided the original author(s) and the copyright owner(s) are credited and that the original publication in this journal is cited, in accordance with accepted academic practice. No use, distribution or reproduction is permitted which does not comply with these terms.
*Correspondence: SungHyun Nam, bmFtc2hAc251LmFjLmty
 Myounghee Kang
 Fredrich Simanungkalit
 Dongha Kang
 Jihoon Jung
 Joohyang Kim2
 Yeseul Kim
 Dong-Jin Kang
 SungHyun Nam