- 1Departamento de Oceanografía Física, Centro de Investigación Científica y de Educación Superior de, Ensenada, Mexico
- 2Departamento de Ecología Marina, Centro de Investigación Científica y de Educación Superior de, Ensenada, Mexico
This study presents oxygen data from the Gulf of Mexico (GoM) deep-water region for the period 2010–2019 collected from six oceanographic cruises and two BioARGO buoys and compares them to historical measurements. These observations link the interannual variability of the oxygen concentrations in the main thermocline waters to the frequency of Loop Current eddy (LCE) detachments. These eddies introduce significant volumes of relatively oxygen-rich waters from the Caribbean into the Gulf’s interior, thereby ventilating the main thermocline waters of the basin. Oxygen concentrations [O2] observed after periods of more than a year without LCE detachments consistently show a significant decrease in [O2] in the GoM thermocline waters. Using the oxygen measurements and altimetry data, we developed a simple box model that reproduces the oxygen variability in the GoM thermocline considering only LCE detachment area and frequency as variables, keeping all other sources of variability constant in the model. Our model successfully reproduces the observed oxygen variability in the main thermocline waters, highlighting the LCE detachment variability as a key process in the ventilation of the GoM mid-depth waters. According to our model, an average detached LCE area of approximately 97,000 km2 per year is needed to maintain oxygen levels in the thermocline waters above 2.6 ml mL L−1 in the upper thermocline and 2.4 ml mL L−1 in the lower thermocline. One further implication of this model is that if the yearly trend of decreasing detachment area of the LCEs continues in future years, oxygen concentrations in the GoM thermocline may continue to fall, potentially leading to unknown consequences for the ecological web structure at these depths.
1 Introduction
1.1 Ventilation of the oceanic thermocline
The ocean’s main thermocline can be defined as a permanently stratified volume below the mixed layer, ventilated by pulses from different sources, and where an important oxygen consumption from organic matter remineralization takes place. One process that ventilates these depths is mixing along isopycnals produced by oceanic circulation (isopycnal mixing), while vertical mixing (diapycnal mixing) and oxygen diffusion play a role that is not easily quantifiable (Oschlies et al., 2018). Deoxygenation of the thermocline occurs when the rate of oxygen consumption becomes higher than the rate of ventilation (Deutsch et al., 2006). A global deoxygenation trend has been linked to a decrease of the oxygen content in subducting water masses, driven mainly by ocean warming, as well as to an increased stratification that reduces the water mass fluxes that ventilate those depths (Falkowski et al., 2011; Portela et al., 2020).
Among the processes that ventilate the thermocline waters of the open ocean, the role of horizontal advection by mesoscale eddies has been observed but not extensively reported because of the limitation of observational methods and the highly variable nature of the mesoscale circulation (Gruber et al., 2010; Levin, 2018). The Gulf of Mexico (GoM) is a semi-enclosed oceanic region heavily influenced by the mesoscale circulation where the effect of mesoscale eddies in the oxygen variability is easier to observe than in larger basins.
1.2 Oxygen in the thermocline of the Gulf of Mexico
The GoM thermocline is clearly identified in the potential temperature and salinity diagram (T–S, Figure 1), as the layer showing a large temperature and salinity change. Above the main thermocline, there are two water masses, the Subtropical Underwater (SUW) identified by a local salinity maximum above 36.5 that characterizes the upper subsurface Caribbean waters, and the Gulf Common Water (GCW), a water mass that originates inside the Gulf as a result of winter cooling and mixing. Below the main thermocline lies the Antarctic Intermediate Water (AAIW) identified by a salinity minimum flowing on top the North Atlantic Deep Water (NADW) (Portela et al., 2018) (Figure 1).
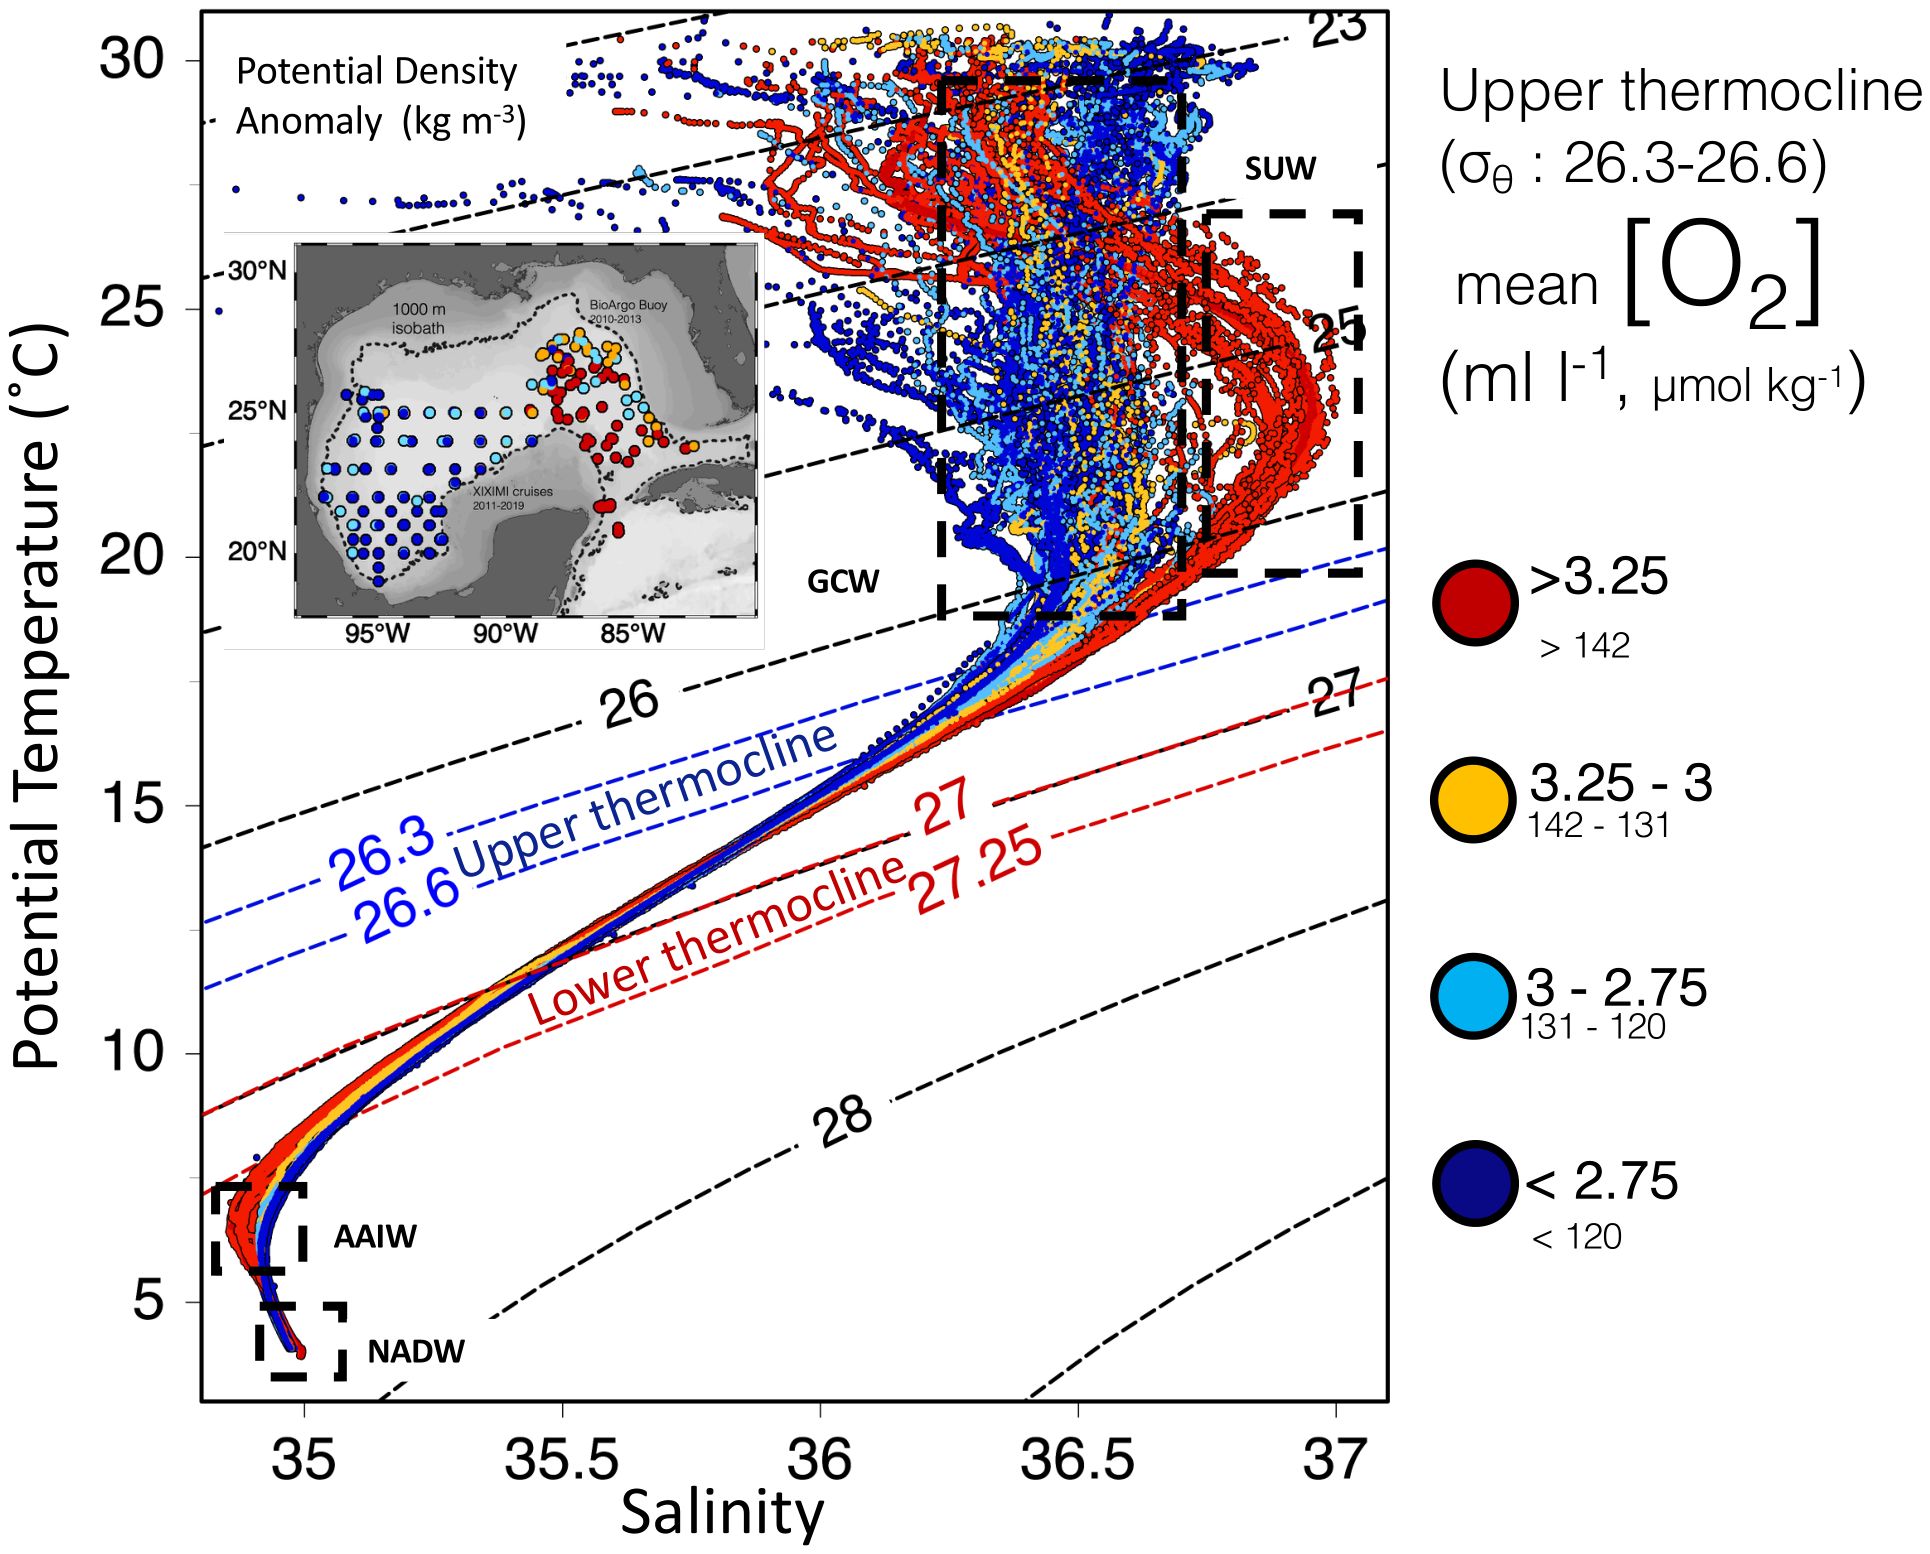
Figure 1. T–S diagram of all XIXIMI stations and BioARGO 1 Buoy with map of locations, color coded according to the upper thermocline oxygen range. Dashed lines indicate isopycnals as potential density anomalies, with emphasis on the upper and lower thermocline as blue and red dashed lines. Black dashed boxes enclose different shallow subsurface water masses.
Oxygen spatial variability in the GoM main thermocline has been of historical interest due to the observed contrast between the eastern and western basin [O2] values (Jochens et al., 2005) (Figure 2, Table 1). This contrast results from the intrusion of the Loop Current (LC), an energetic current that transports Caribbean water through the Yucatan Channel into the Gulf, which either extends and intrudes into the northeastern GoM before exiting through the Florida Straits into the North Atlantic or goes port to port with no intrusion (Maul, 1977; Hurlburt and Thompson, 1980; Sturges et al., 2010; Athié et al., 2020). Sporadically the LC sheds anticyclonic eddies known as Loop Current eddies (LCEs) (Sturges et al., 2010). The detachment frequency of these mesoscale structures is highly variable, occurring every 2 to 18 months (Leben, 2005), showing highly variable sizes with diameters ranging from 200 to 400 km (Elliott, 1982) with clearly recognizable features down to depths of 1,000 m (Meunier et al., 2018). Once detached, these eddies transport their LC-Caribbean waters into the GoM basin and mix with the Gulf’s interior water losing coherence along their way to the GoM western boundary (Meunier et al., 2018, 2020).
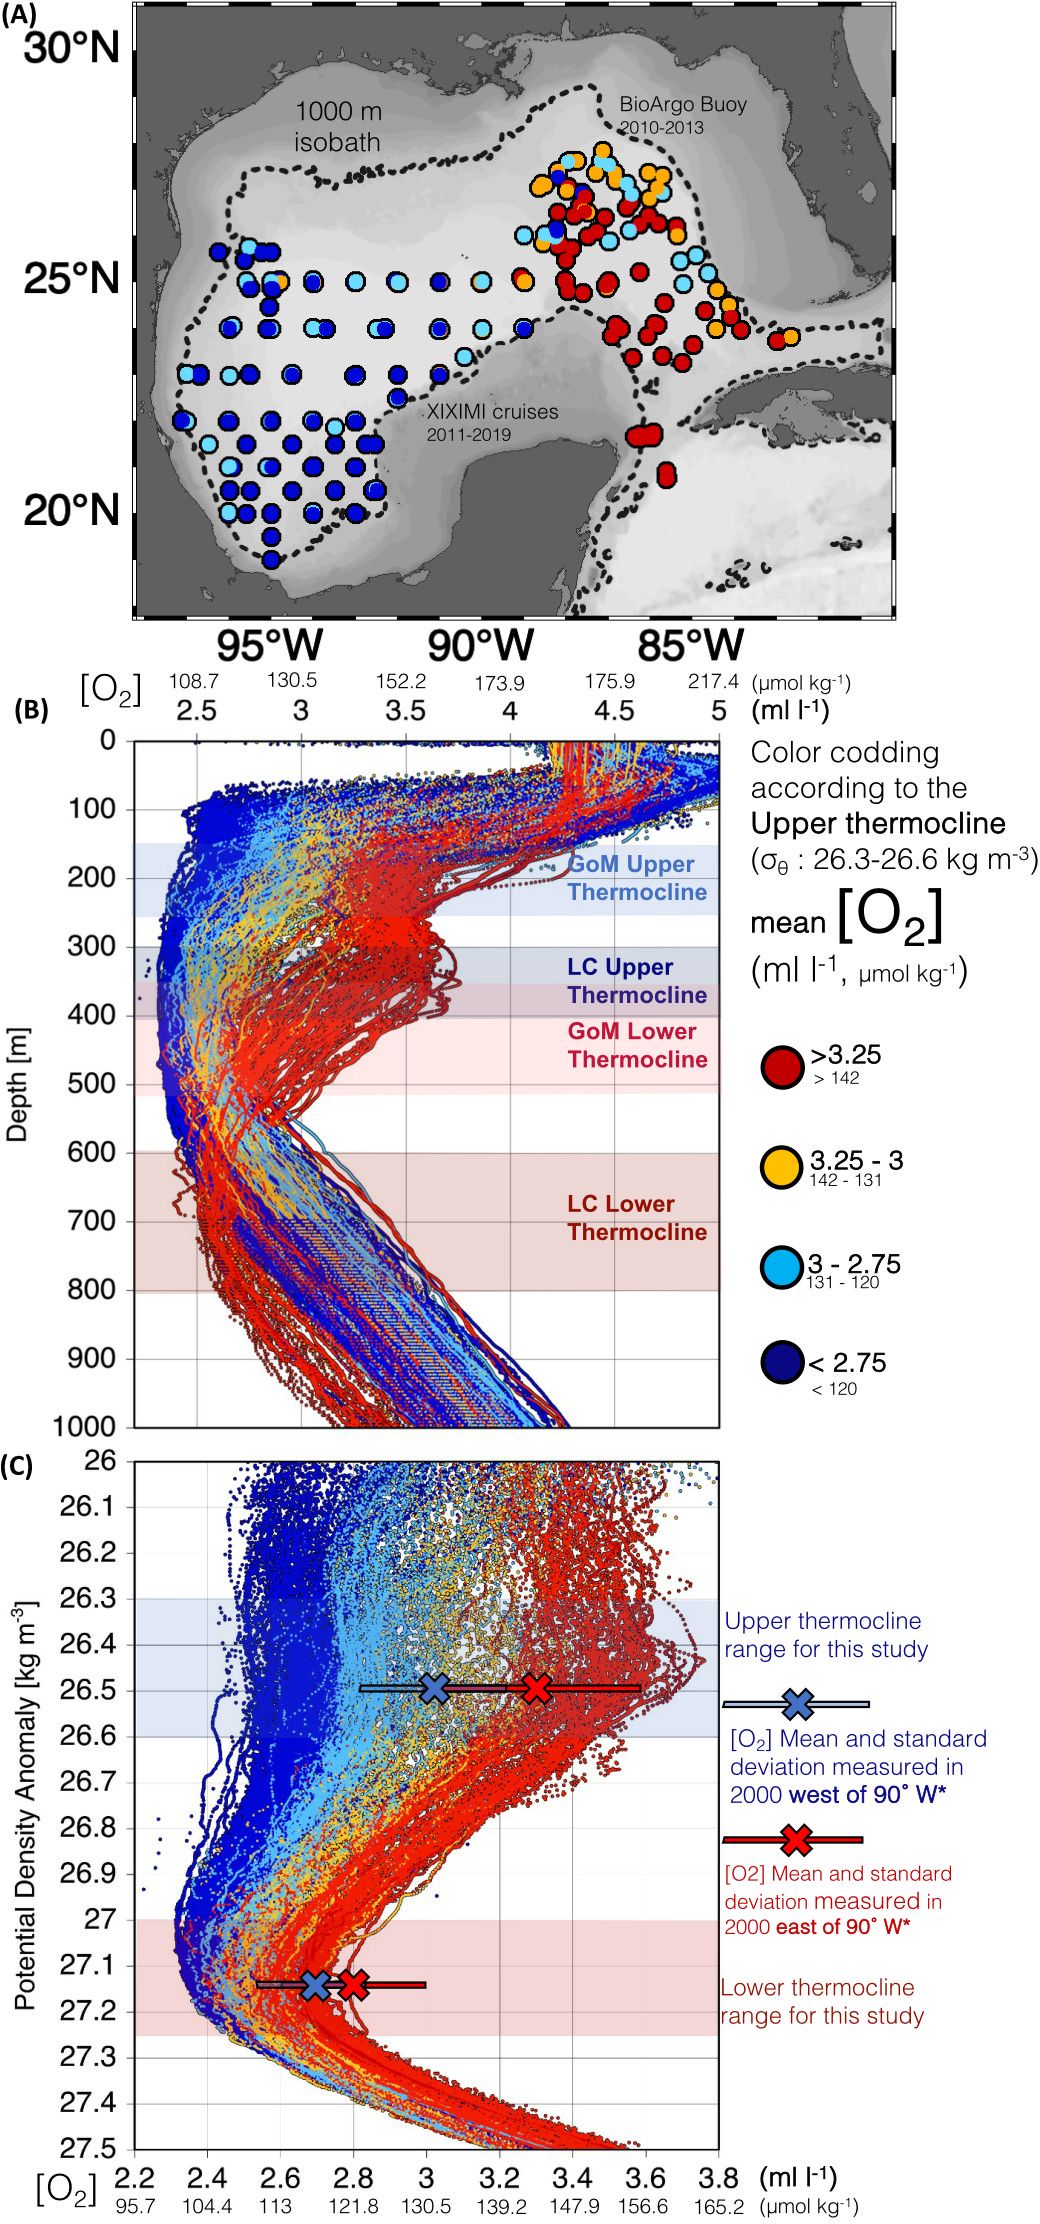
Figure 2. (A) Map of BioARGO 1 profiles and XIXIMI stations during six oceanographic XIXIMI cruises from 2010 to 2019. (B) Depth vs. [O2] profile for all stations. (C) Close-up to the isopycnic range of the thermocline of the potential density vs. [O2] profile for all stations; in symbols, mean and standard deviation values are reported *Jochens and DiMarco (2008).
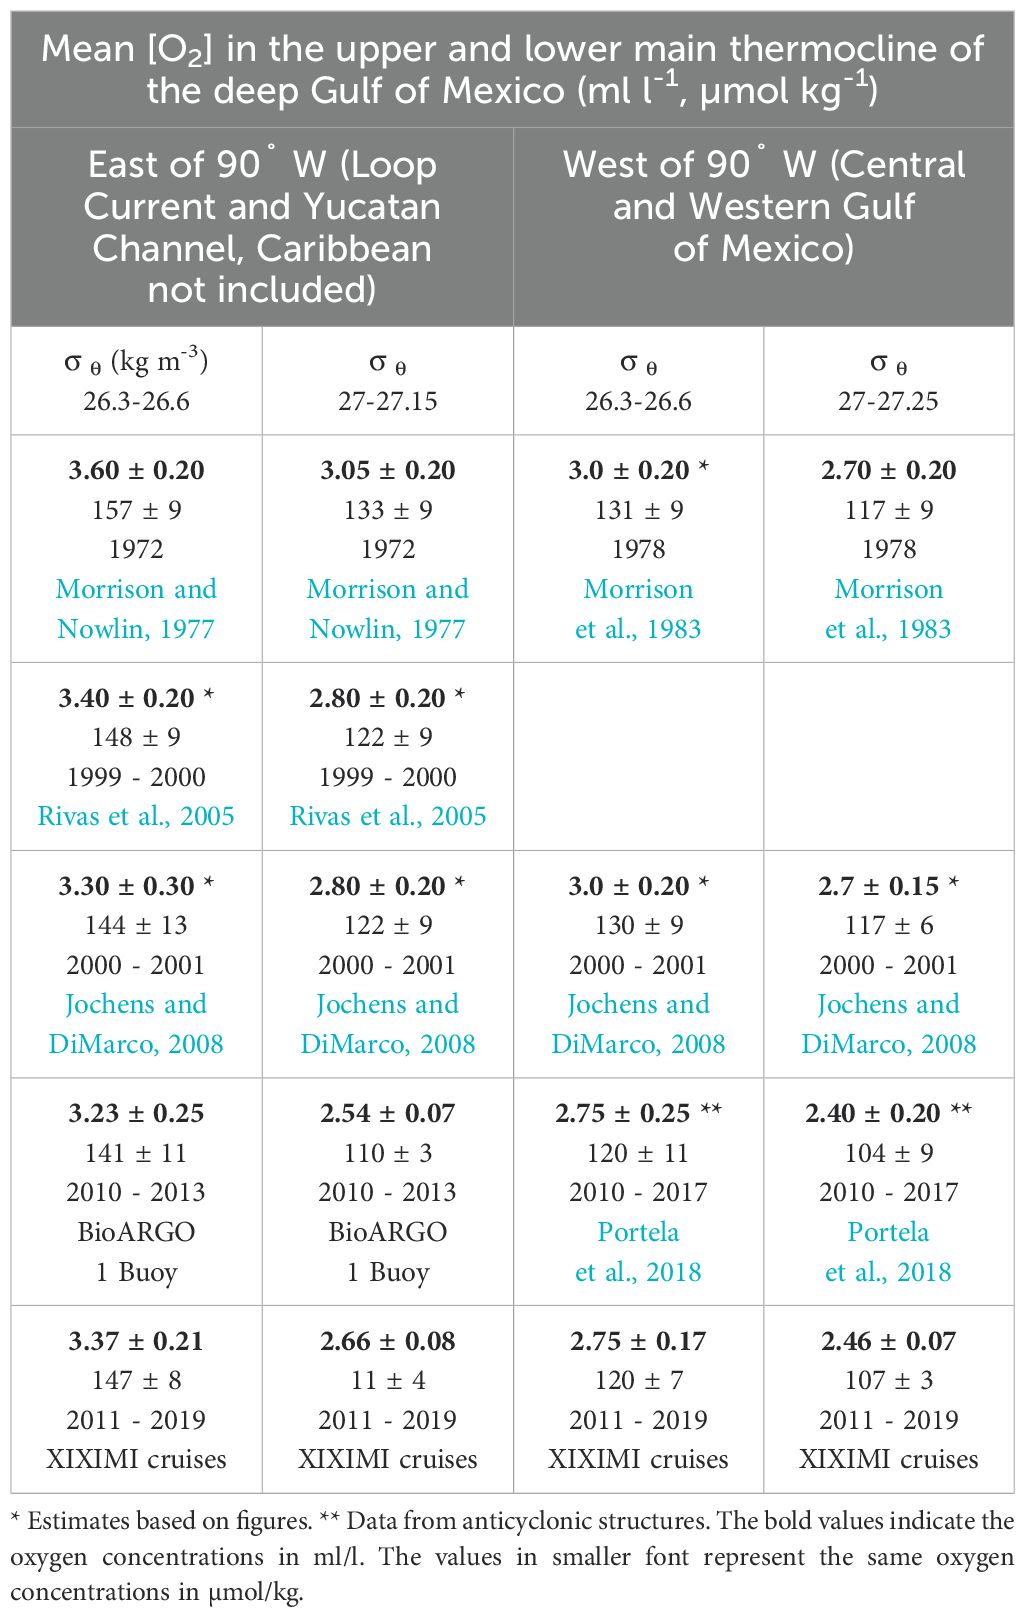
Table 1. Mean oxygen concentrations in the upper and lower thermocline of the Gulf of Mexico east of 90˚ and west of 90˚ reported in previous studies and reported in the present study.
The main thermocline of the LC is filled by two water masses that have been historically identified by their contrasting oxygen content (Morrison and Nowlin, 1977). Its upper boundary is located at a potential density anomaly range of σθ: 26.3 to 26.6 kg m–3: the eighteen-degree water (EDW, also often referred to as 18° Sargasso Sea Water or North Subtropical Mode Water), usually identified by a local [O2] maximum (Figures 1–3). The relatively high [O2] of this water mass results from mixing a nearly uniform temperature over a winter deep mixed layer in the northern Sargasso Sea, where it originates (Kwon and Riser, 2004; Billheimer et al., 2021). In the Caribbean, it was first reported in the eastern Venezuelan Basin with an [O2] of 3.8 ± 0.2 mL L –1 (Kinard et al., 1974) and in the LC in the eastern GoM with oxygen values of 3.6 ± 0.2 ml mL L–1 (Morrison and Nowlin, 1977). The lower boundary of the LC thermocline, centered at σθ: 27 to 27.25 kg m–3, is filled with the Tropical Atlantic Central Water (TACW), identified in the LC with an [O2] minimum of 3.05 ± 0.2 mL L –1 (Morrison and Nowlin, 1977). (In this work, the usual convention of mean ± one standard deviation is used to report all values.)
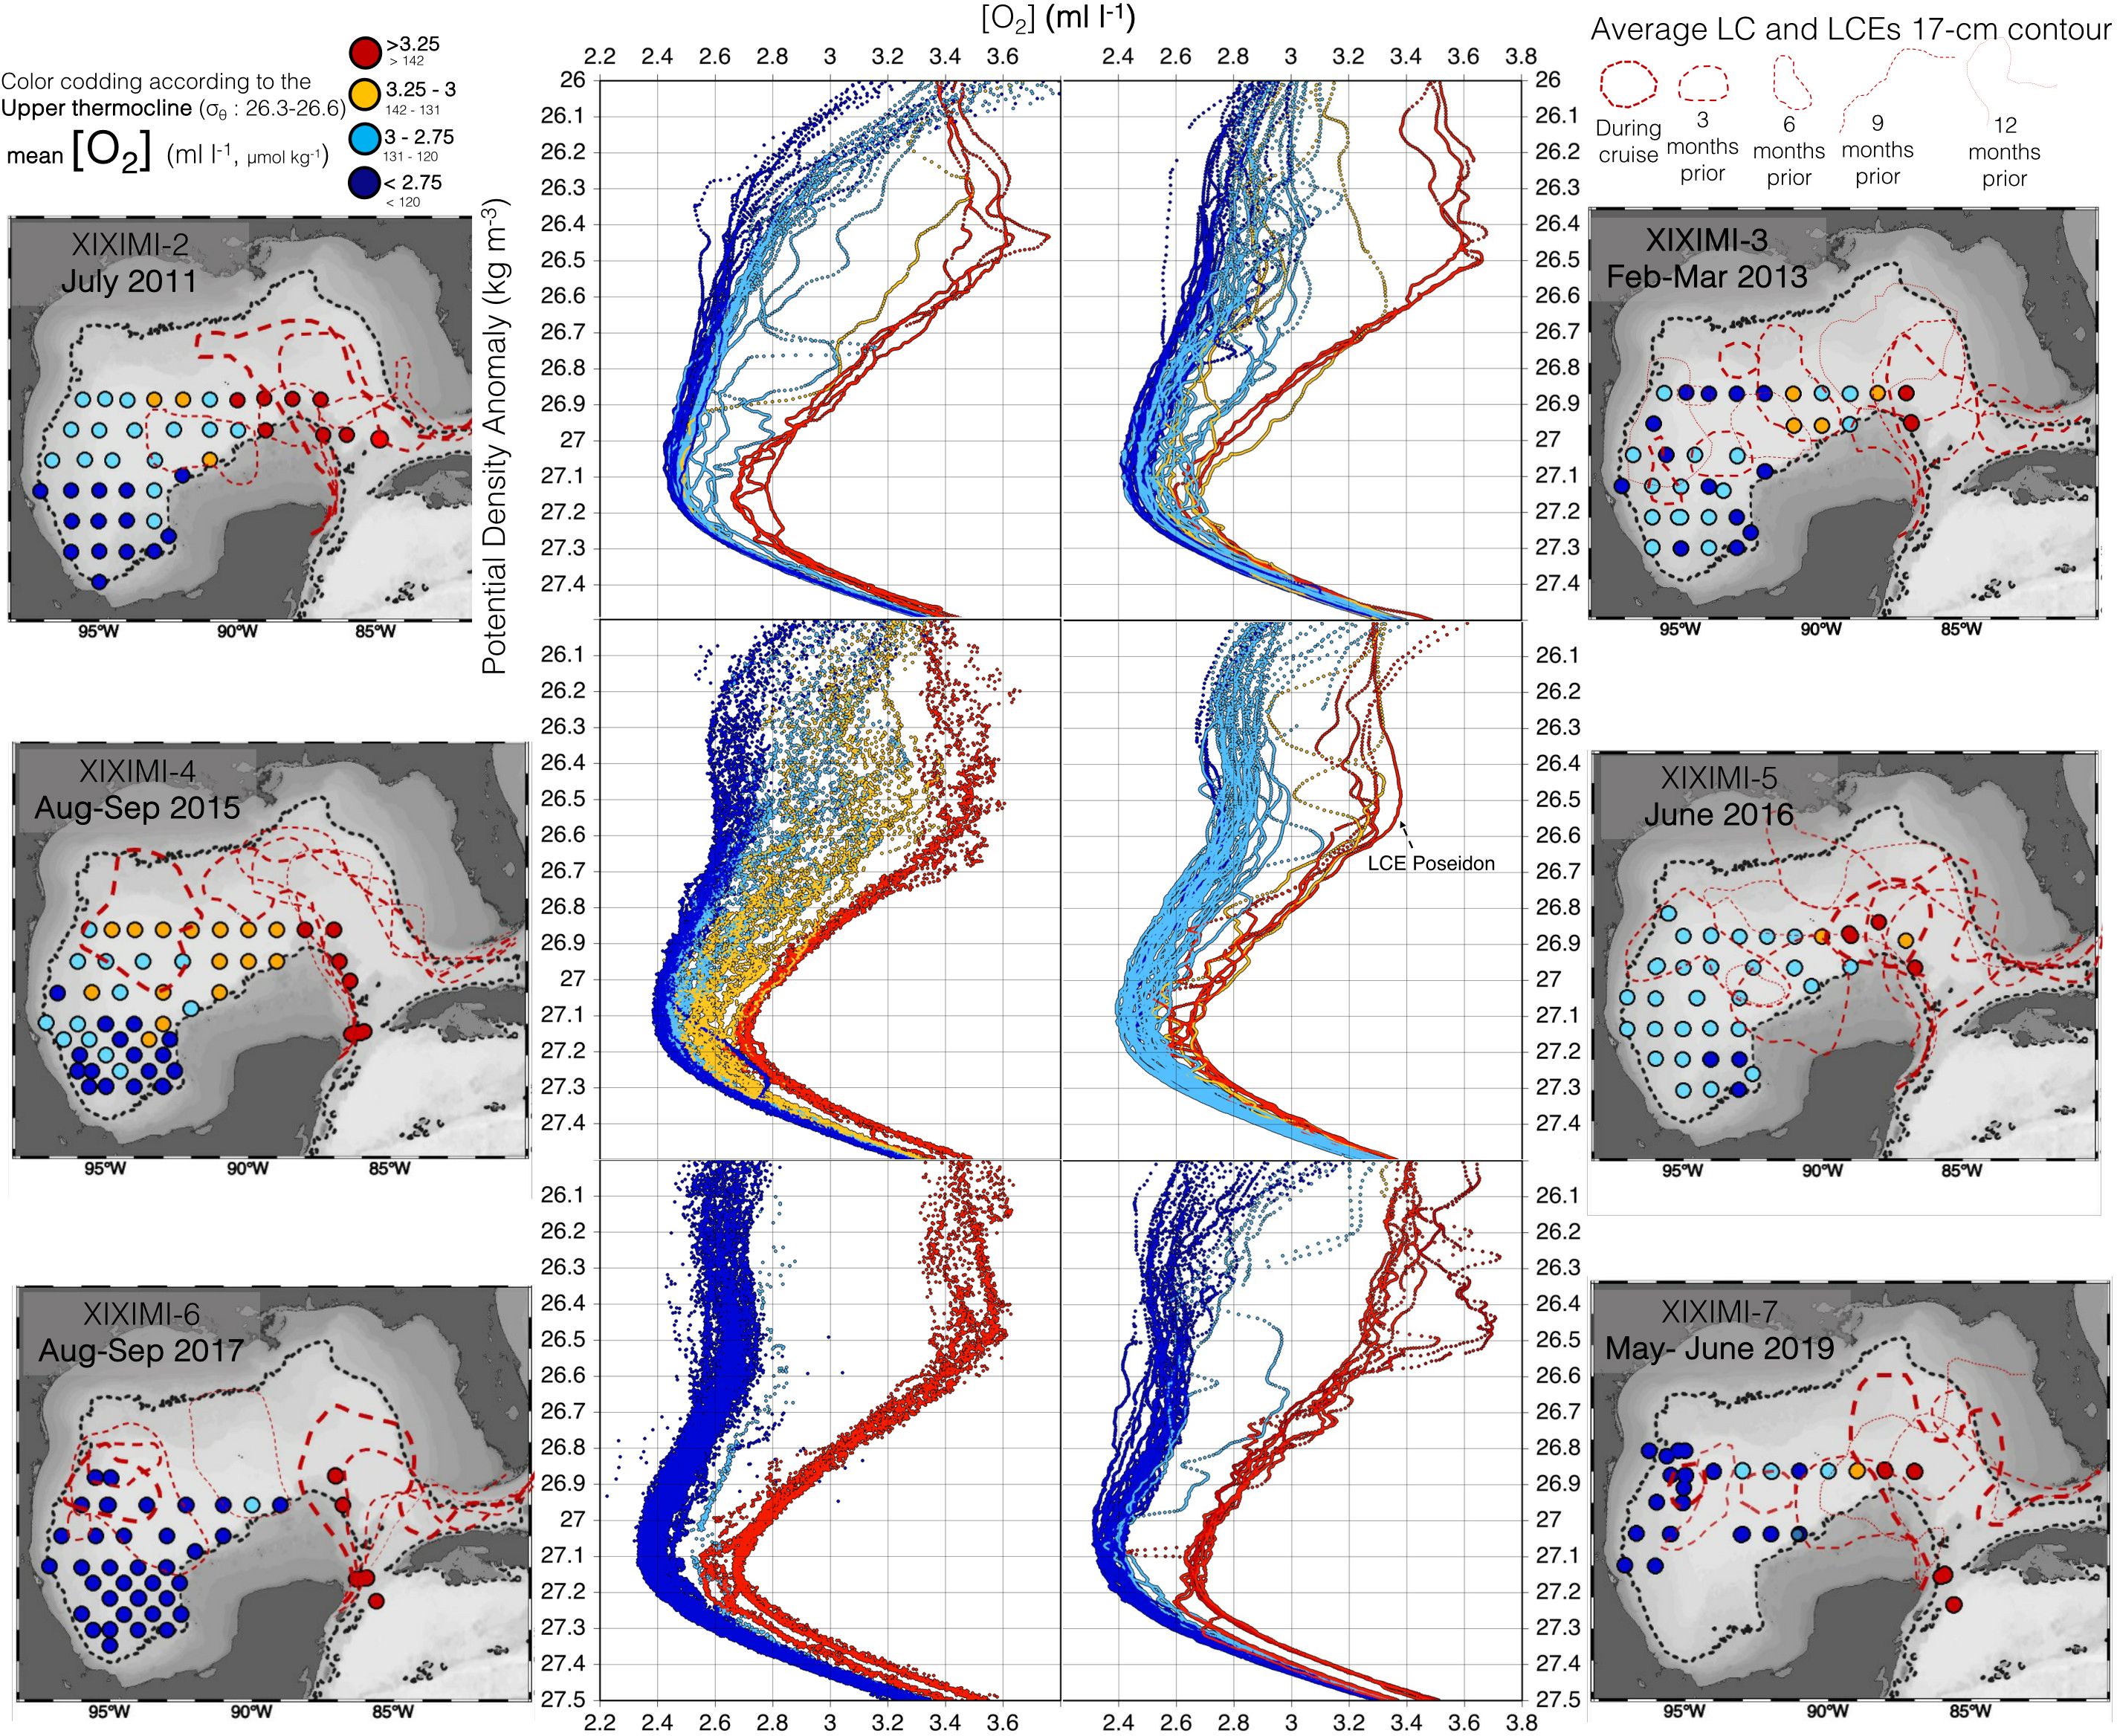
Figure 3. Oxygen profiles with density for the six XIXIMI cruises with color scheme following the described methodology. Maps of stations in each cruise follow the same color scheme. The 17-cm contour altimetry during the month of the expeditions and 3, 6, 9, and 12 months prior is shown in the maps as the red discontinued lines that get more degraded the further from the cruise date.
In contrast to the relatively high oxygen concentrations observed in the LC main thermocline, the western GoM shows distinctly lower [O2] levels (Table 1, Figures 1, 2), implying a longer residence time inside the GoM (Rivas et al., 2005). The largest contrast is observed in the upper thermocline at σθ = 26.5 kg m–3, which depicts an east- to-southwest decrease of up to 0.8 mL L –1 linked to the erosion of the local oxygen maximum that identifies the EDW in the Caribbean and the LC (Jochens et al., 2005). The lower thermocline shows a similar but lower decrease in [O2] of 0.35 mL L –1 with respect to the LC (Morrison et al., 1983). The clear contrast between the oxygen content of the LC and the western GoM can be an indicator of the water exchange between the LC and the GoM interior (Rivas et al., 2005).
1.3 Present study
According to Rivas et al. (2005), the ventilation of the GoM thermocline is strongly controlled by the exchange of water between the relatively high [O2] LC waters and the GoM interior; therefore, the contrasting oxygen values observed between the LC and the central and western GoM imply a relatively slow exchange between the LC and the Gulf interior waters. The annual volume exchanged in the upper 700 m between both regions has been estimated to be of only 10% of the annual LC flow, and most of this exchange was estimated to be caused by the sporadic LCE detachments (Maul, 1980) and their westward movement. Consequently, changes in the exchanged water mass volumes between the LC and the western GoM driven by the variability of the LCE detachments could lead to changes in the oxygen content of the thermocline of the GoM interior waters, similar to the North Atlantic, where the oxygen transport by eddies has been shown to be an important mechanism for the ventilation of the thermocline waters (Robbins et al., 2000; Brandt et al., 2015; Hahn et al., 2017; Pitcher et al., 2021).
Satellite altimetry data allow identification of the LC position, LCE size, and their time of detachment (Leben, 2005; Hall and Leben, 2016) (Figure 4), but the scarcity of oxygen time series in the deep GoM has, so far, made it difficult to assess the effect of LCE detachments on the oxygen variability. This paper presents new oxygen data from six cruises and two BioARGO drifters, obtained during 2010–2023, which, together with altimetry data (LCE metrics), are used to study the effects of LCEs in the GoM oxygen concentration variability (Figure 5). A simple box model that considers LCEs as the only ventilating source of GoM thermocline waters is proposed here in an effort to reproduce both historical and new oxygen measurements (Figures 6–8).
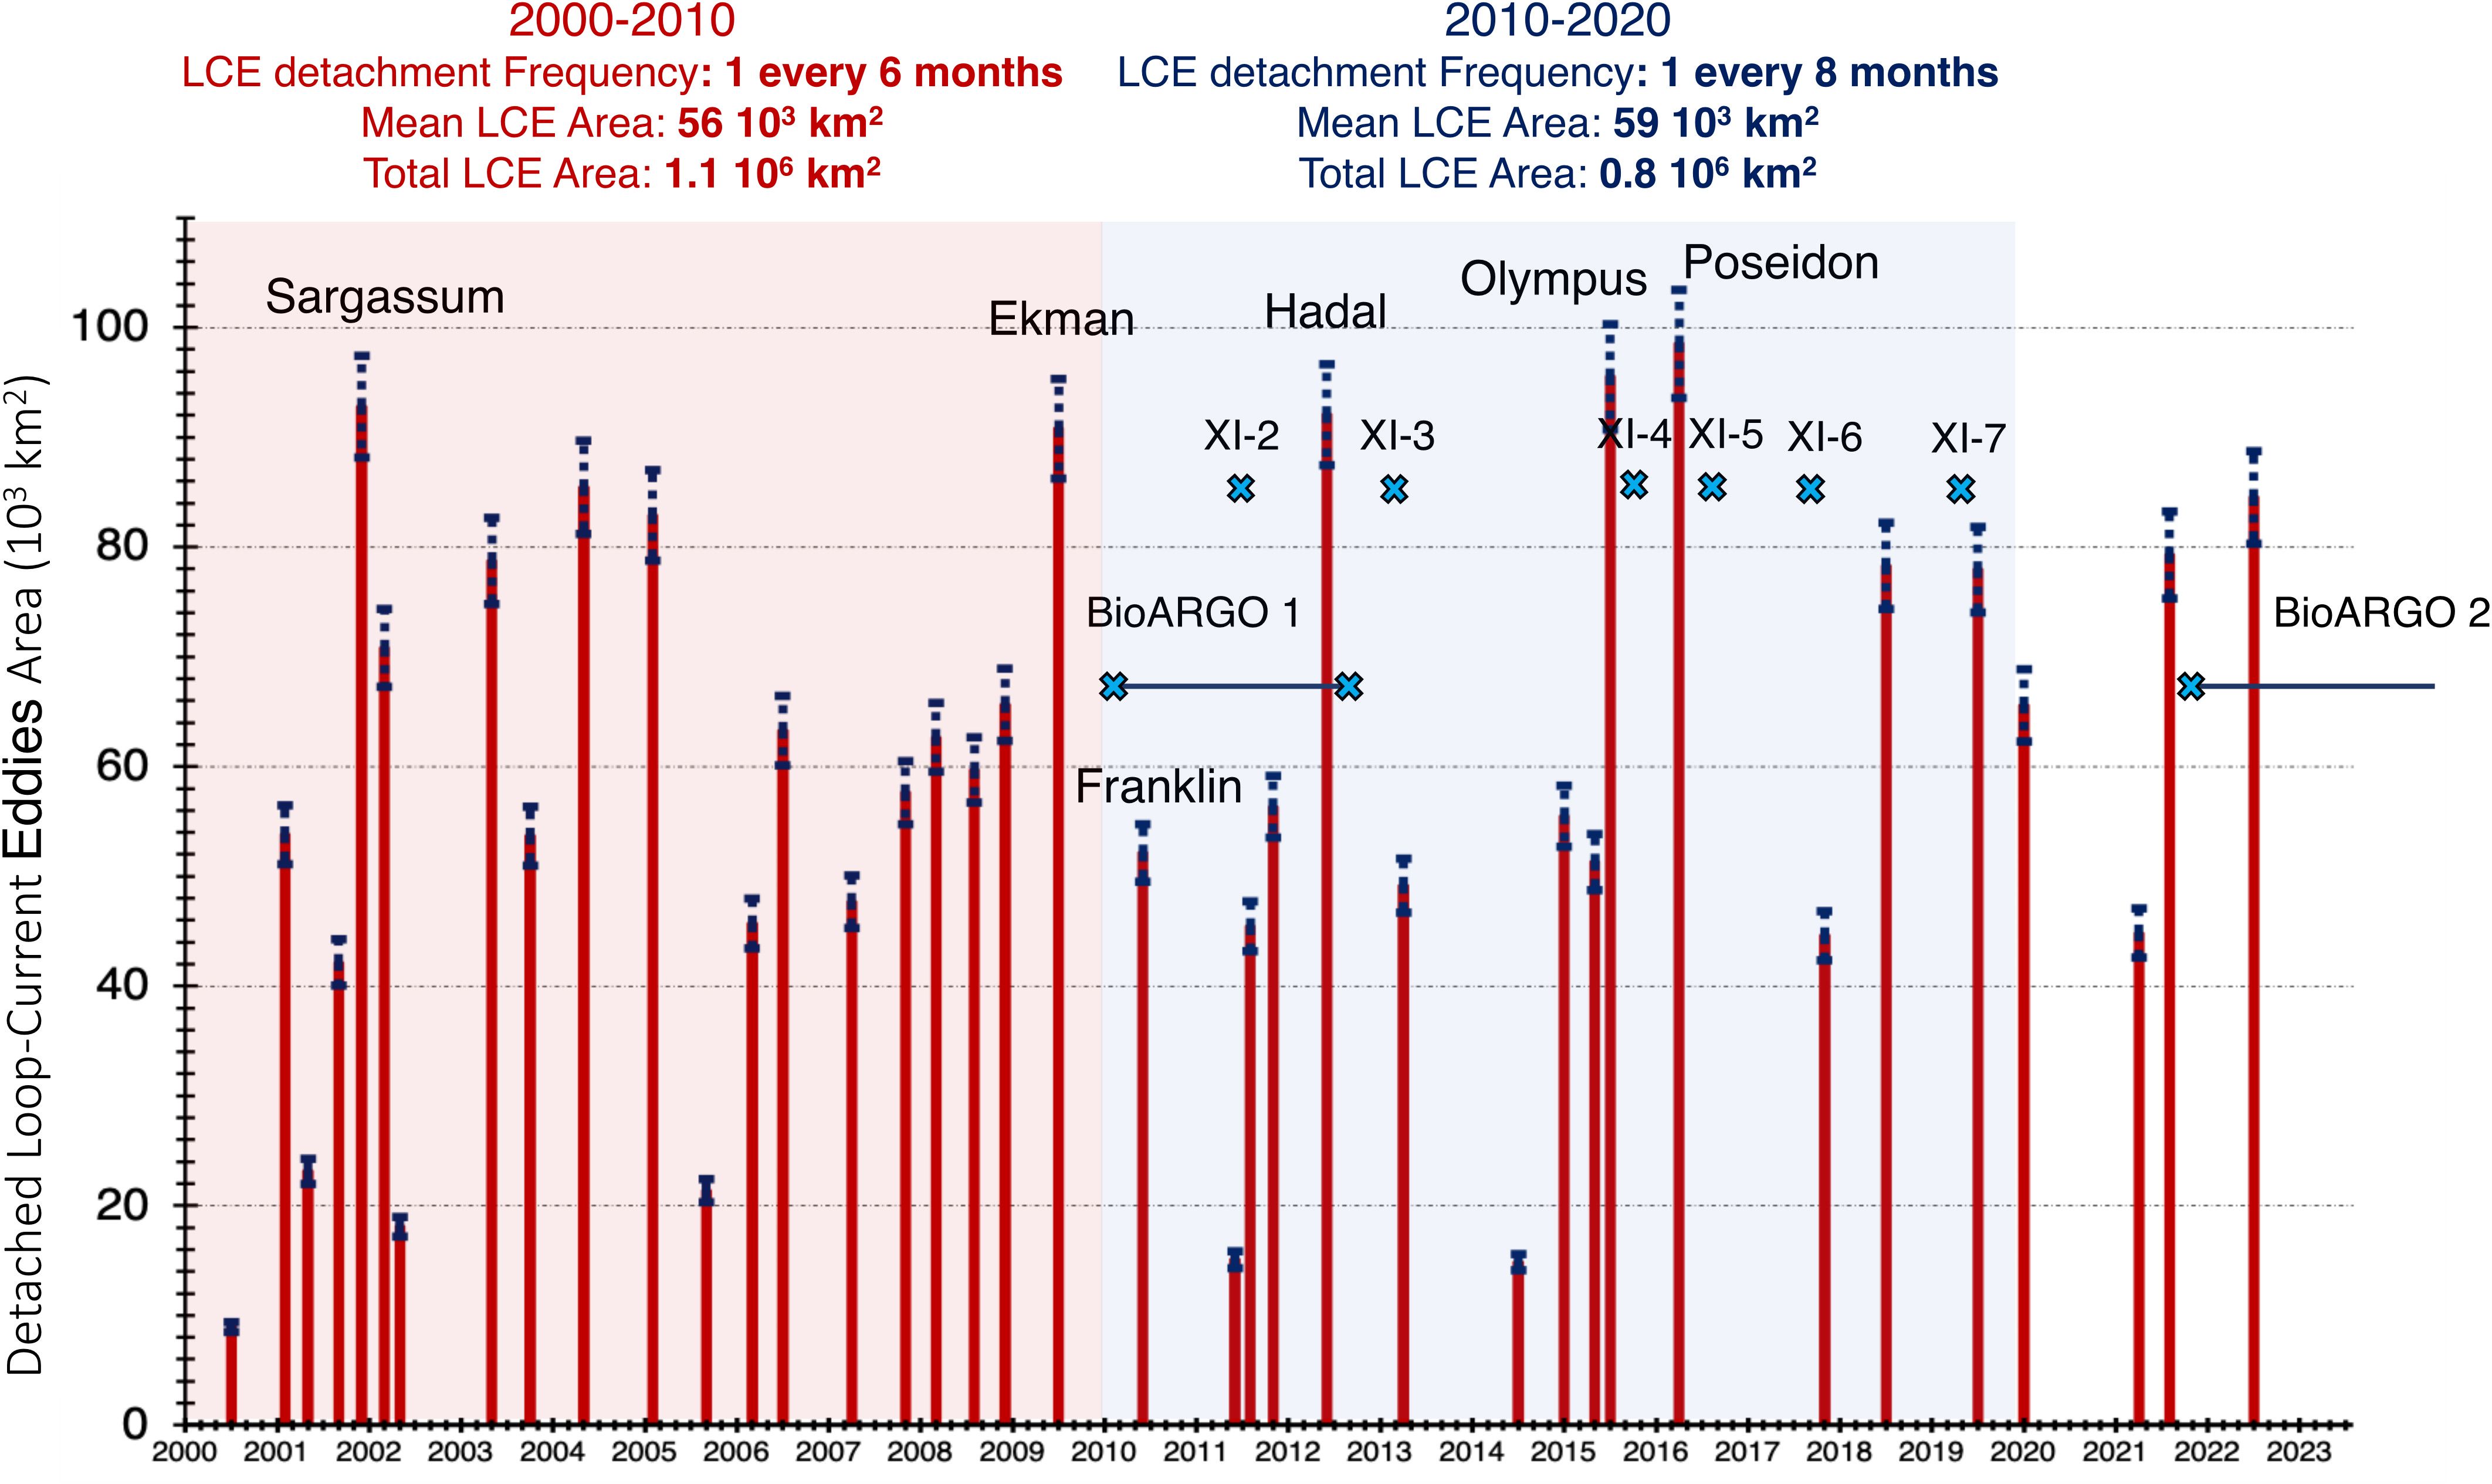
Figure 4. Date of detachment of Loop Current eddies and their mean area (red bars) with standard deviation (blue dashed bars) estimated from the 17-cm SSH contour using AVISO altimetry. Blue crosses show the date of XIXIMI cruises and BioARGO measurements.
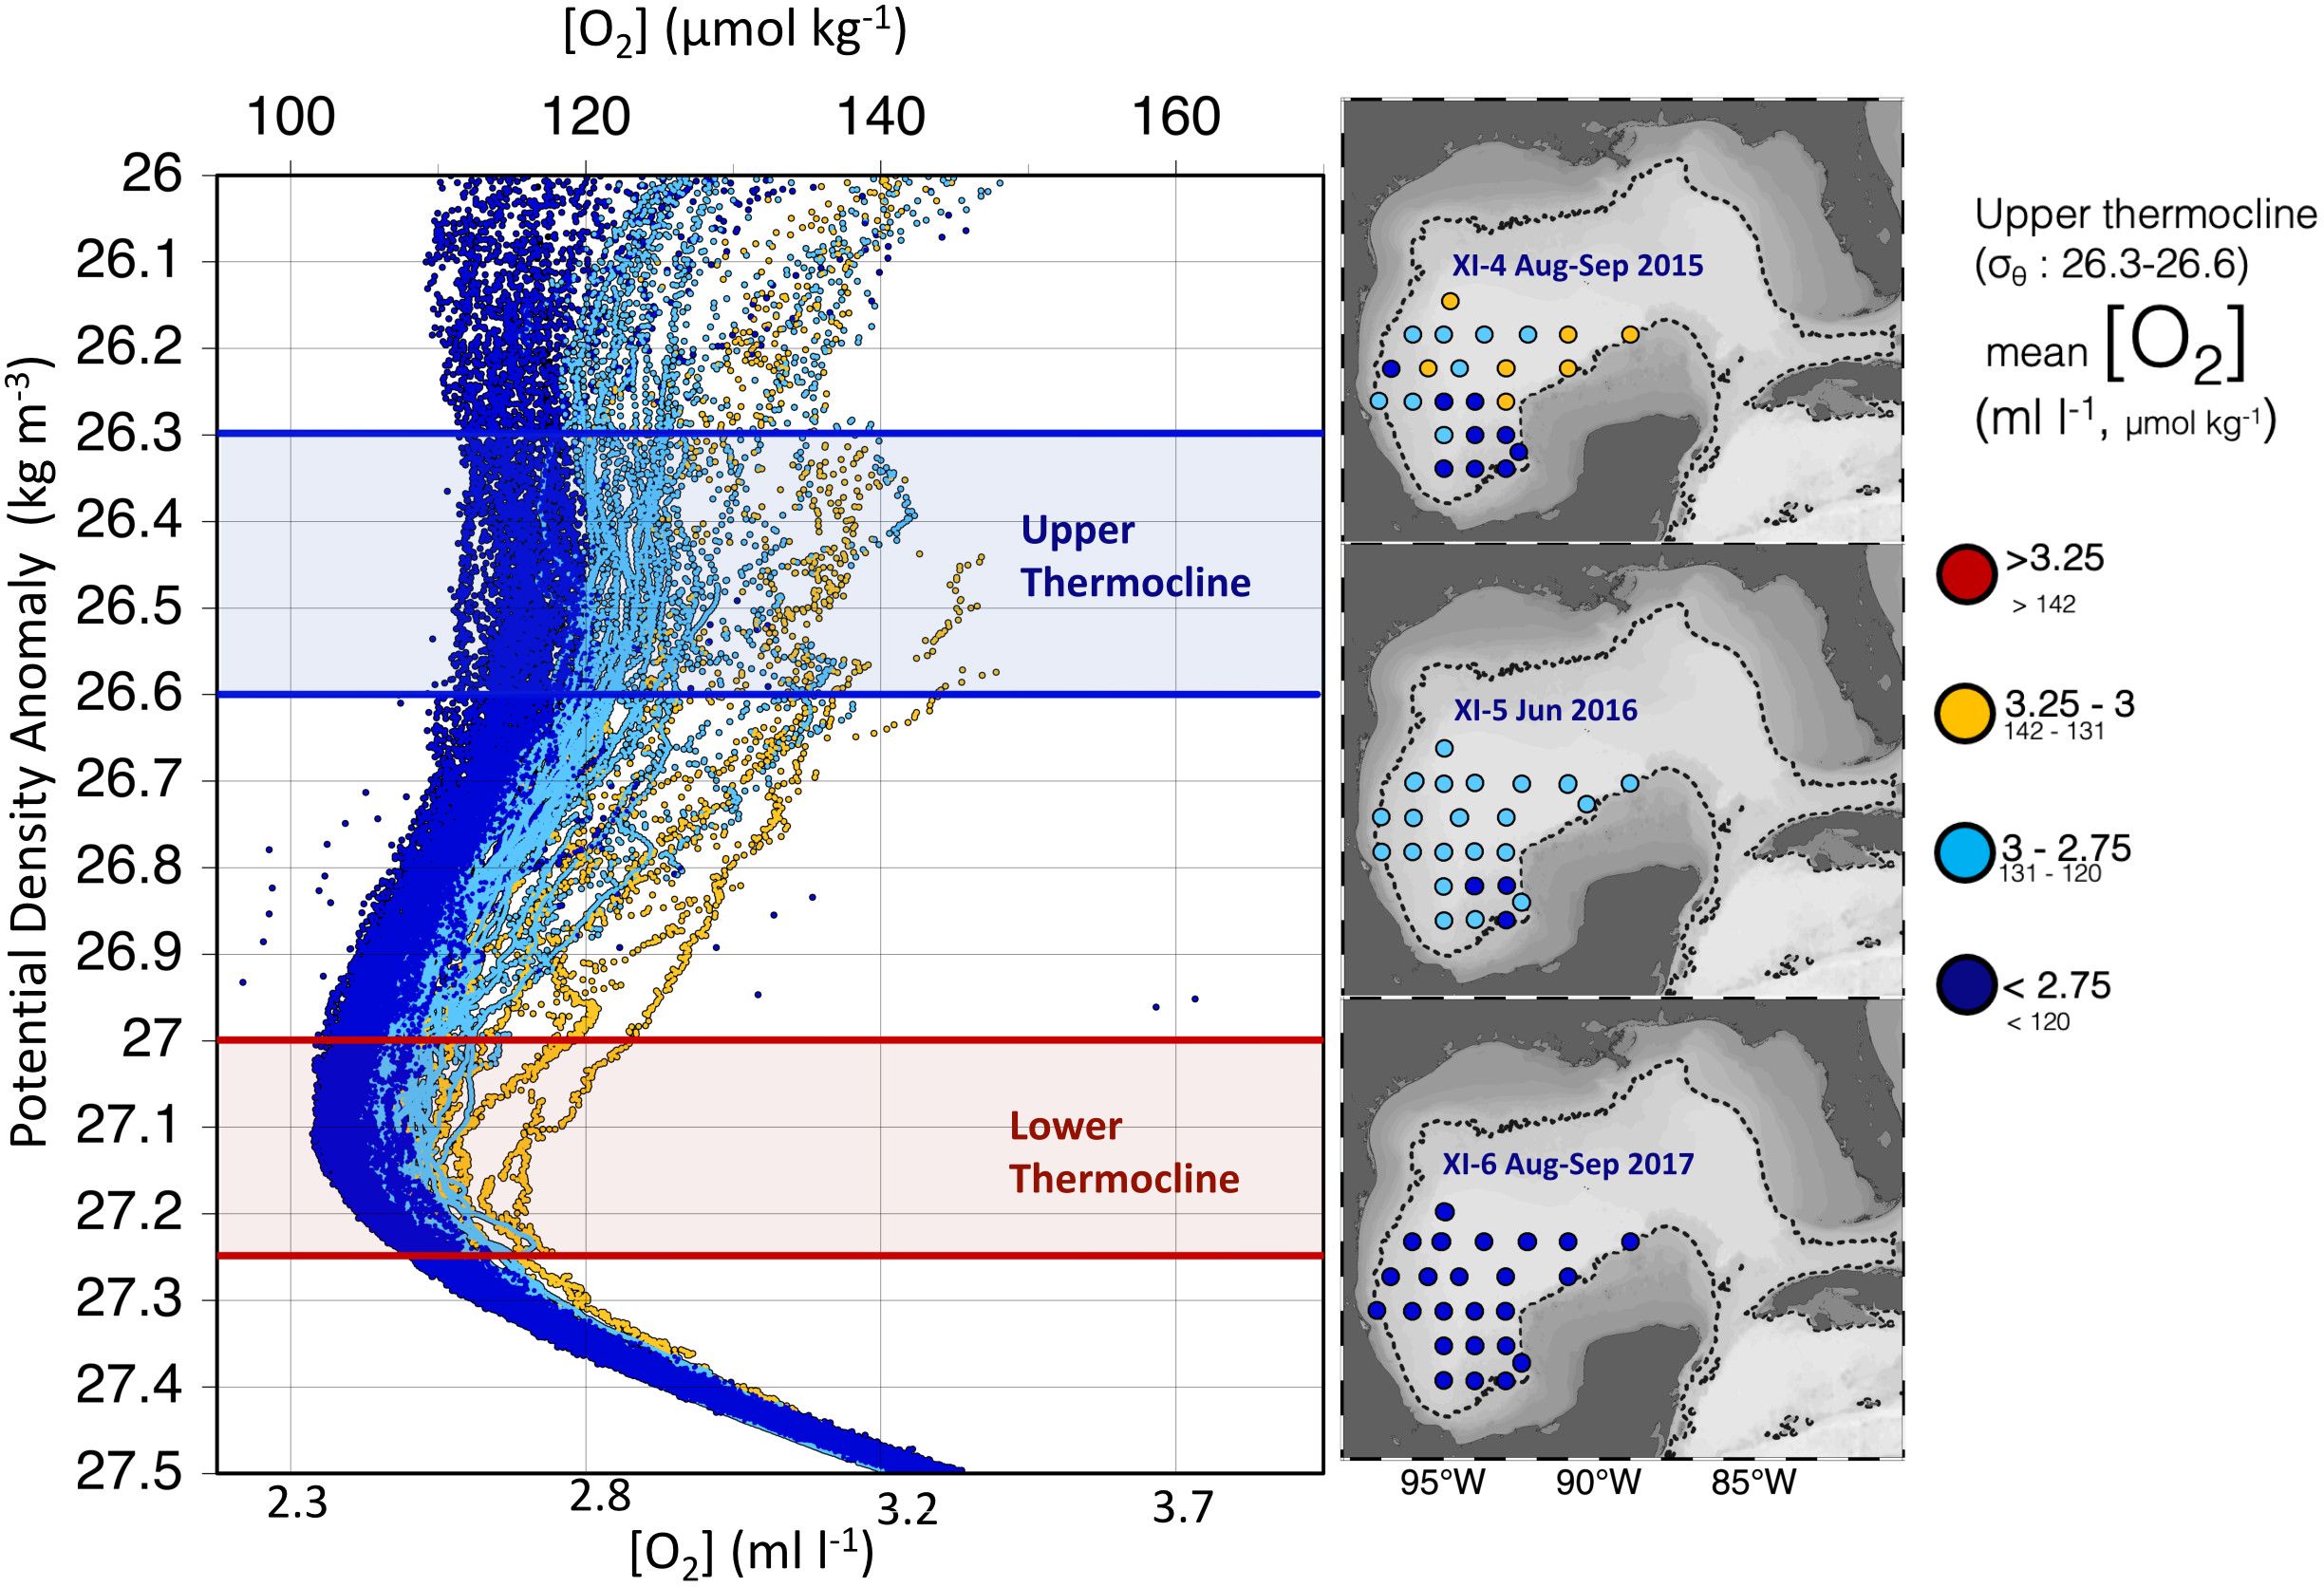
Figure 5. Oxygen profiles with density and maps of 24 stations located in the same coordinates from three consecutive XIXIMI summer cruises, with color scheme according to the oxygen concentrations of the upper thermocline.
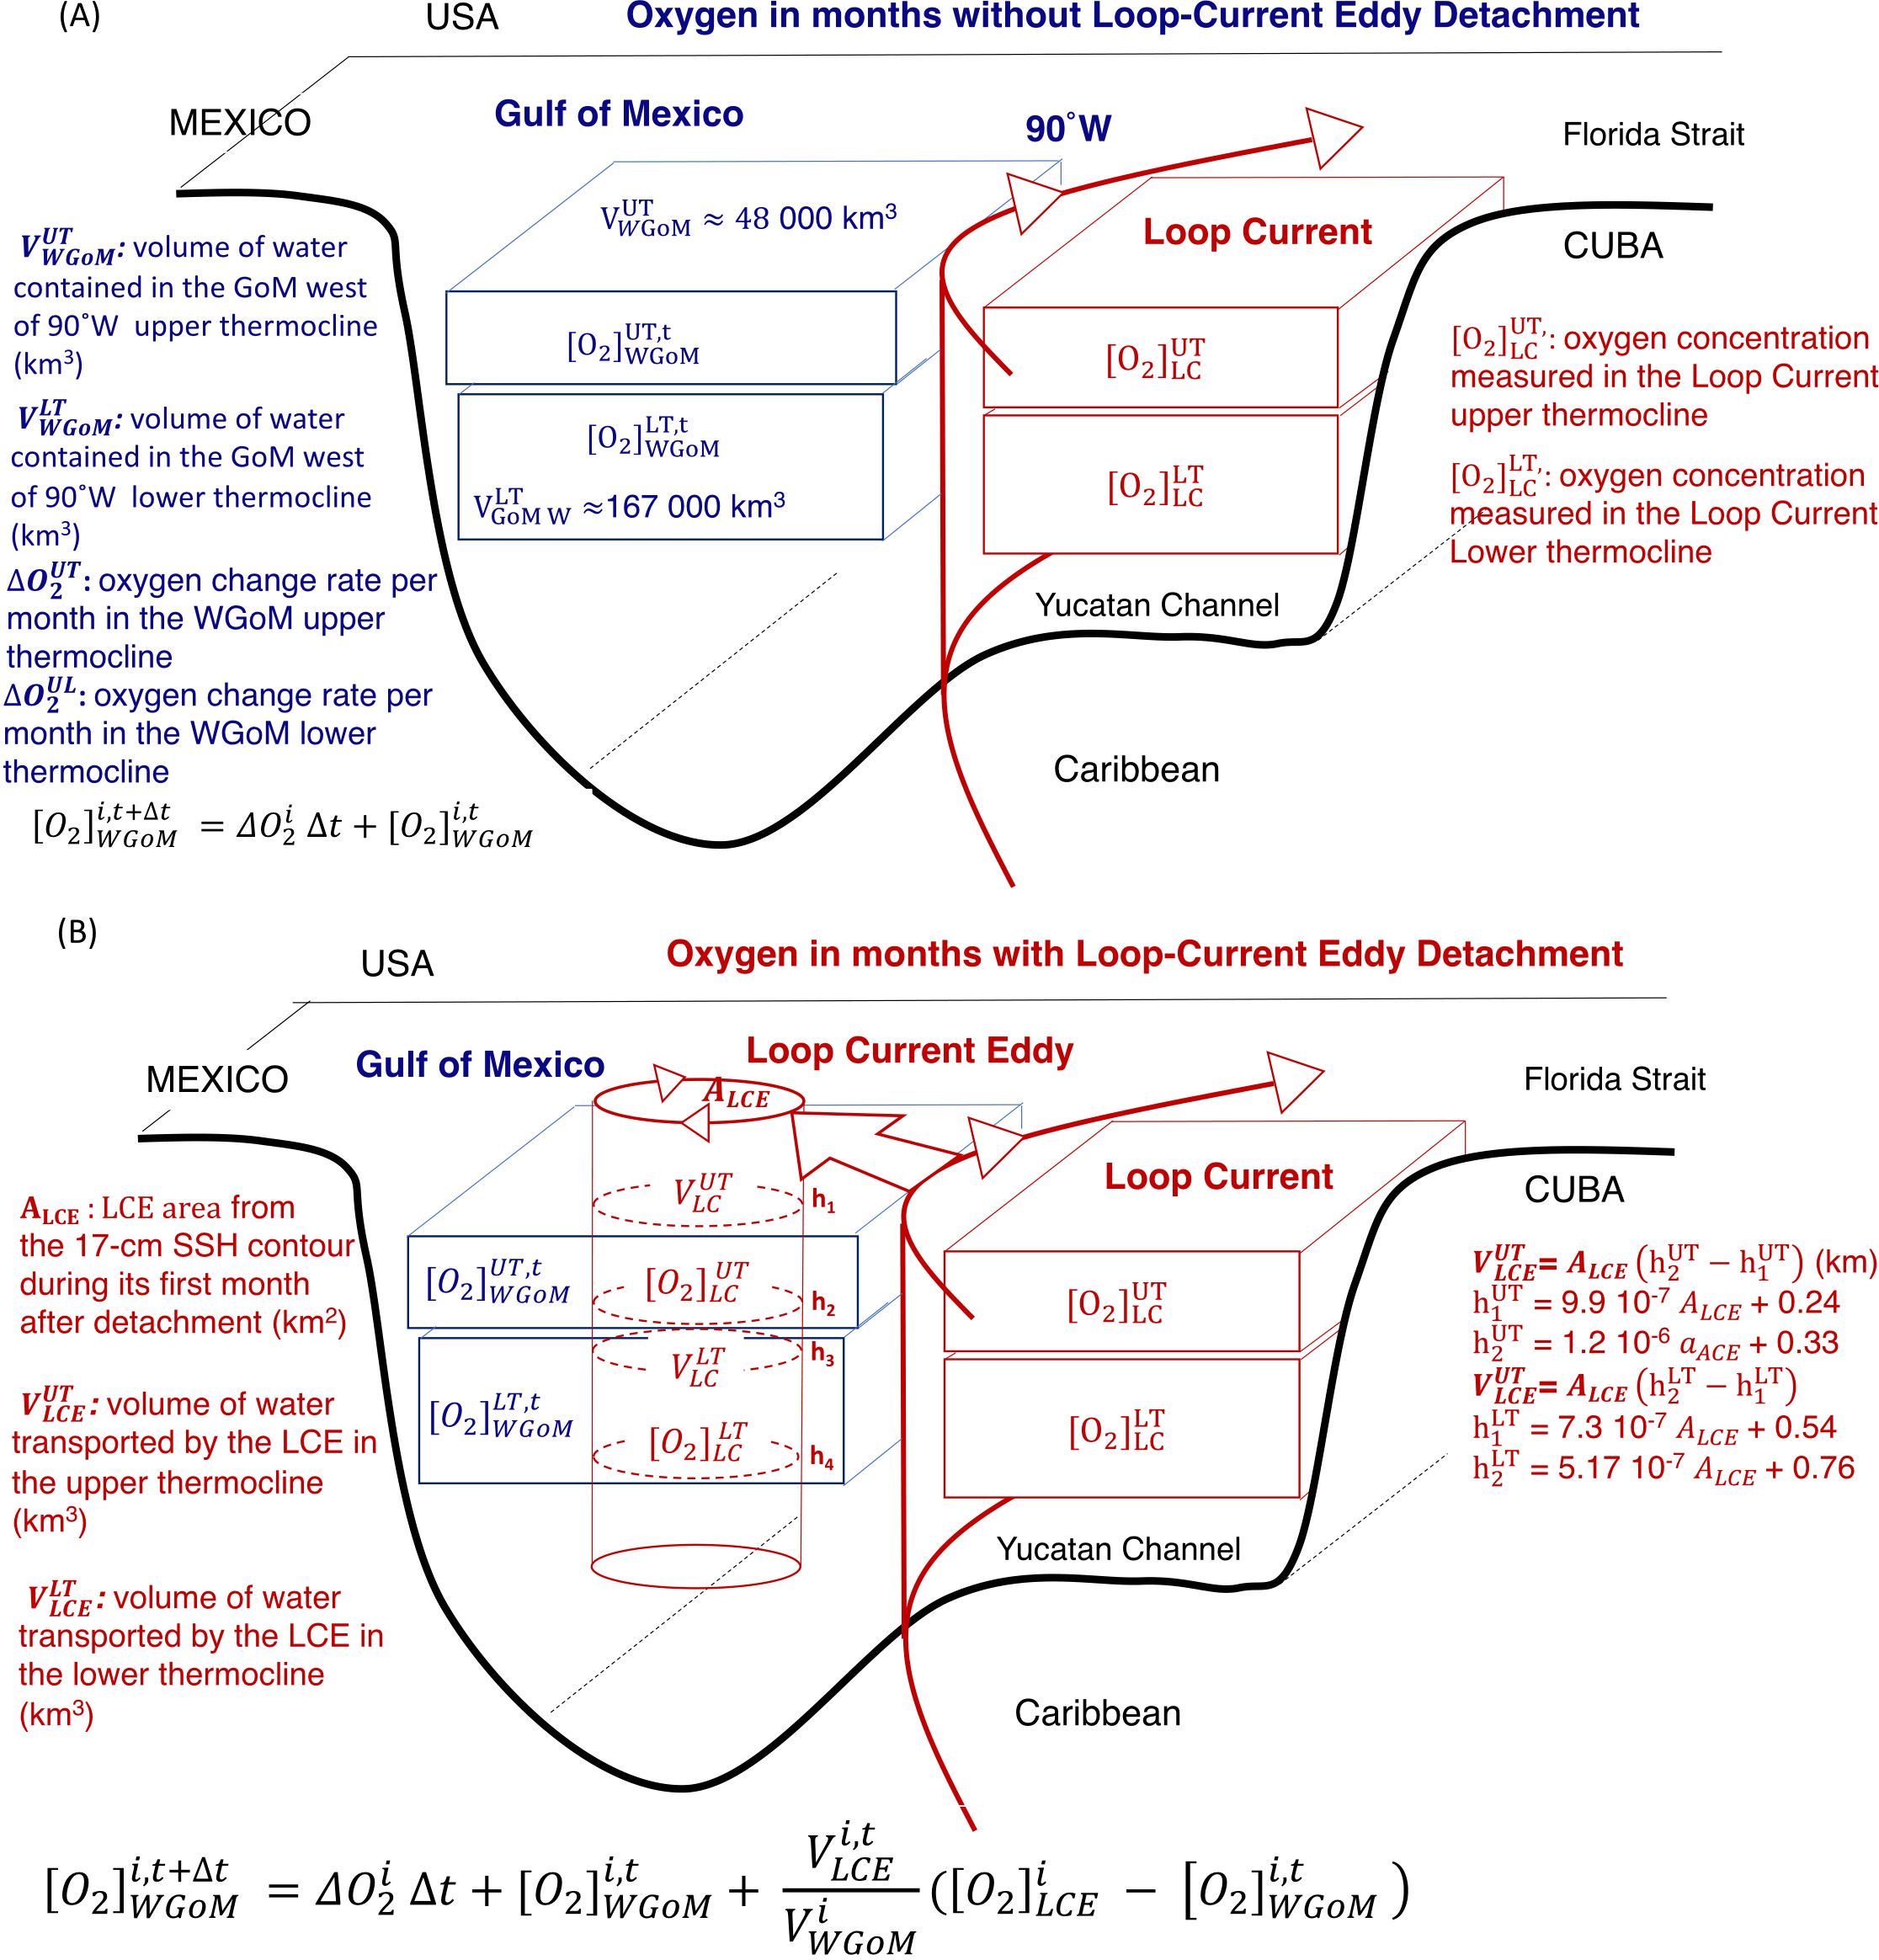
Figure 6. Schematic representation of box model equation and assumptions during (A) months without Loop Current eddy detachment and (B) during months of Loop Current eddy detachment.
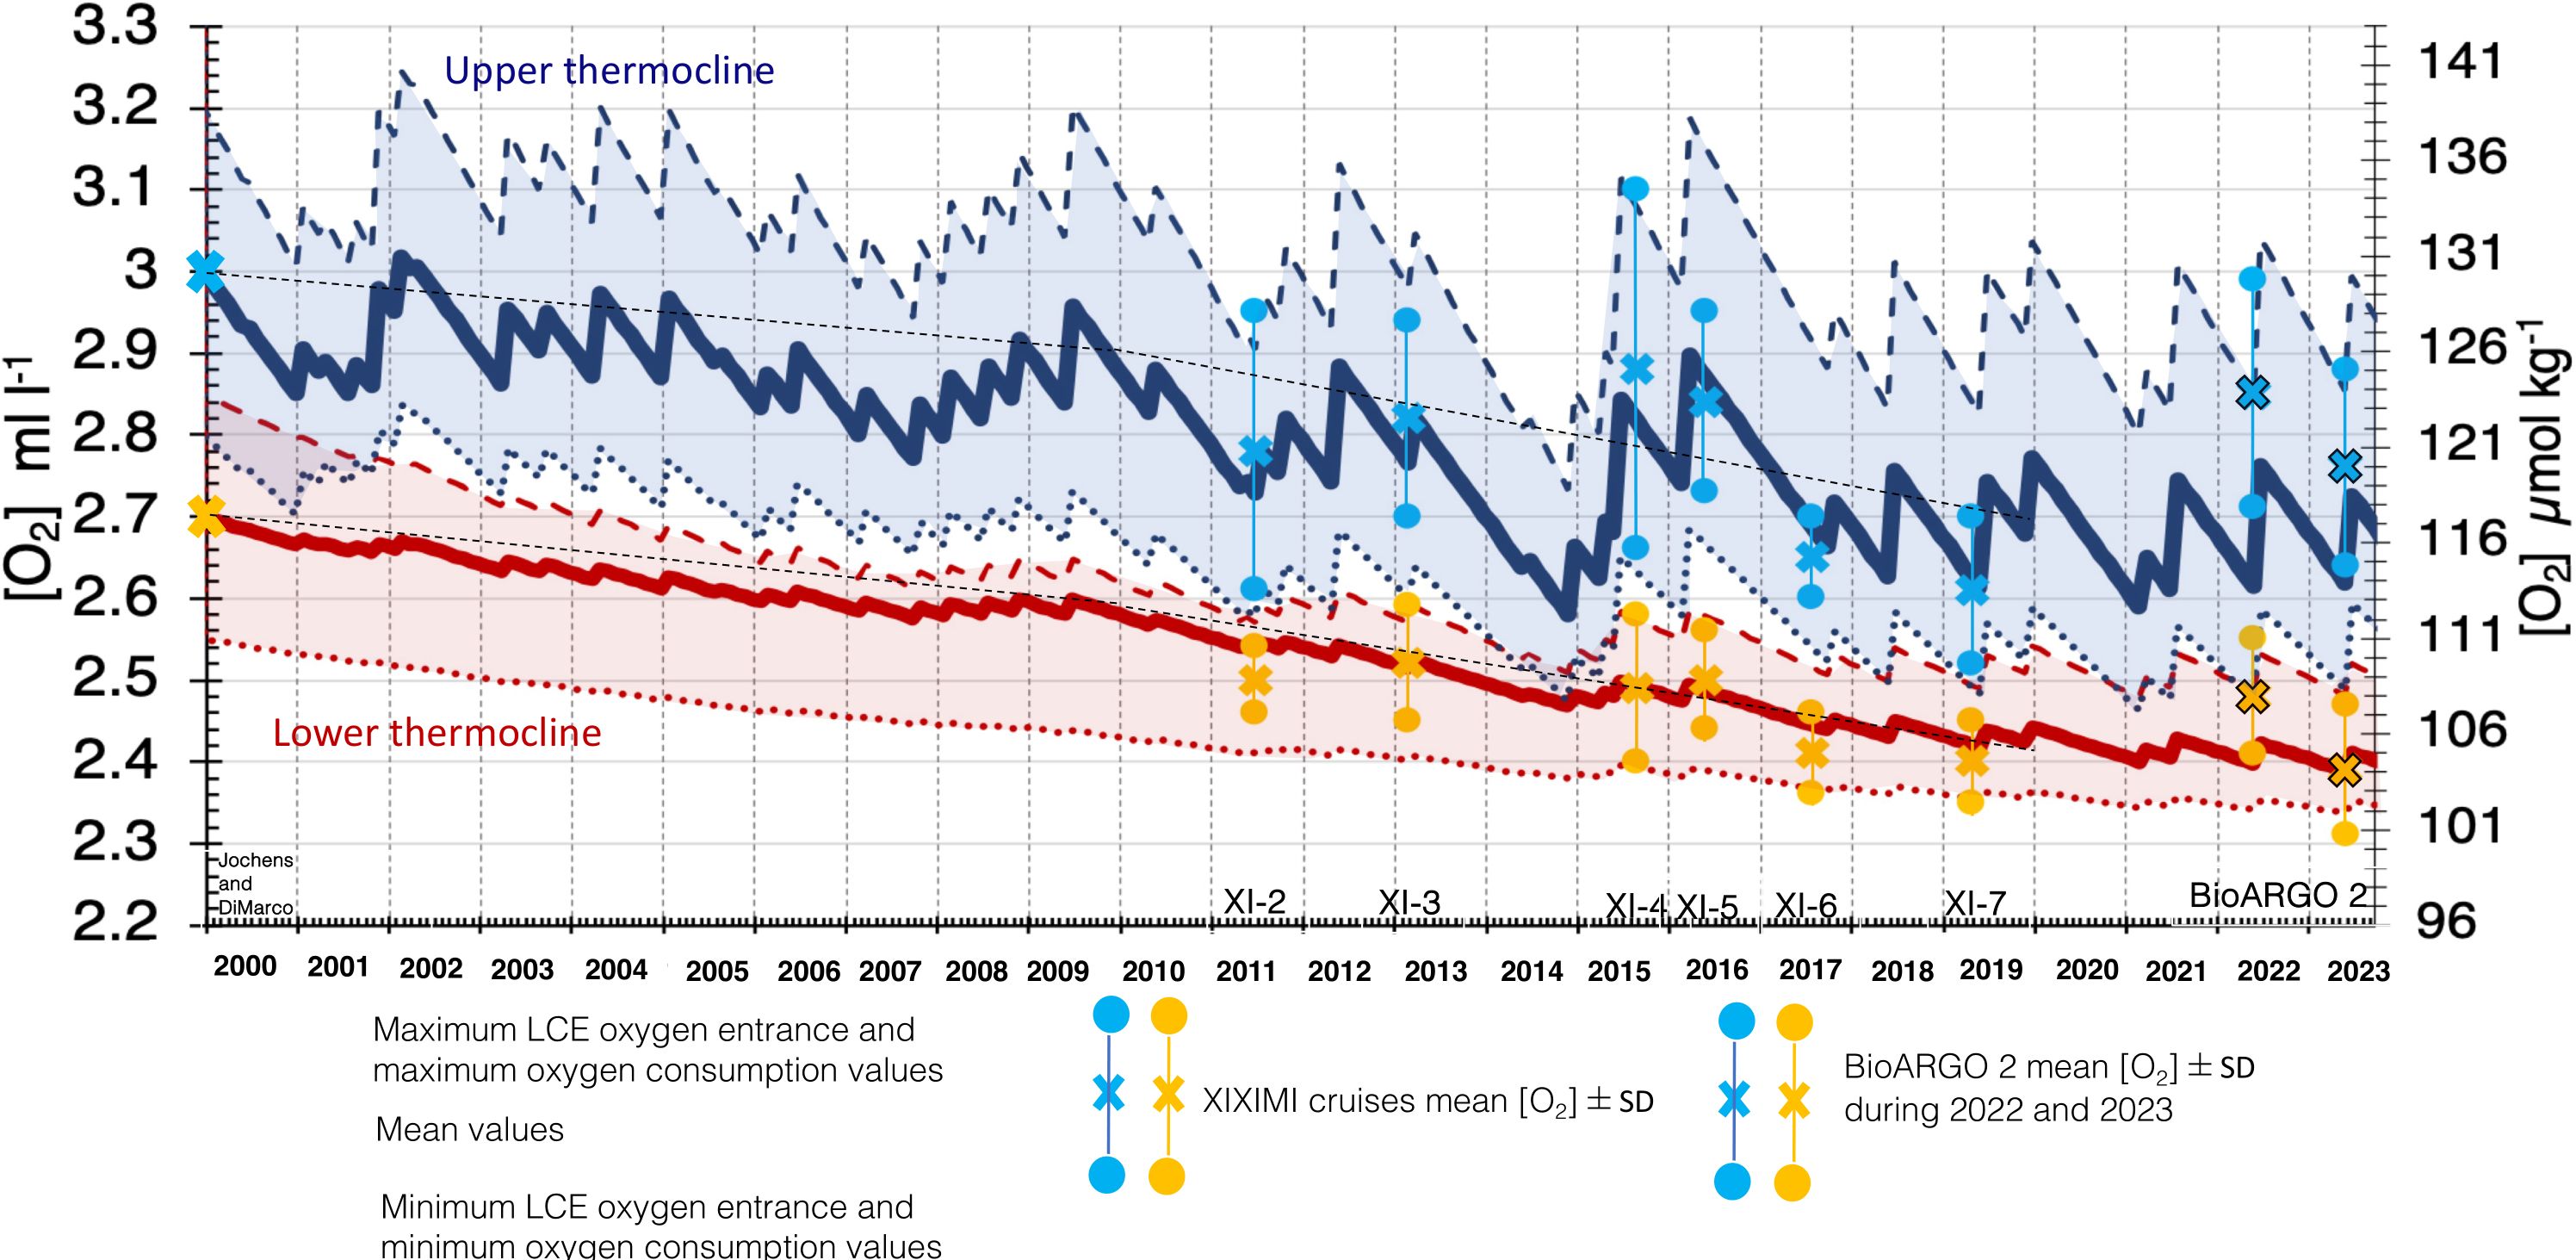
Figure 7. Oxygen variability estimated from the box model for the upper (blue) and lower (red) thermocline from 2000 to 2020.
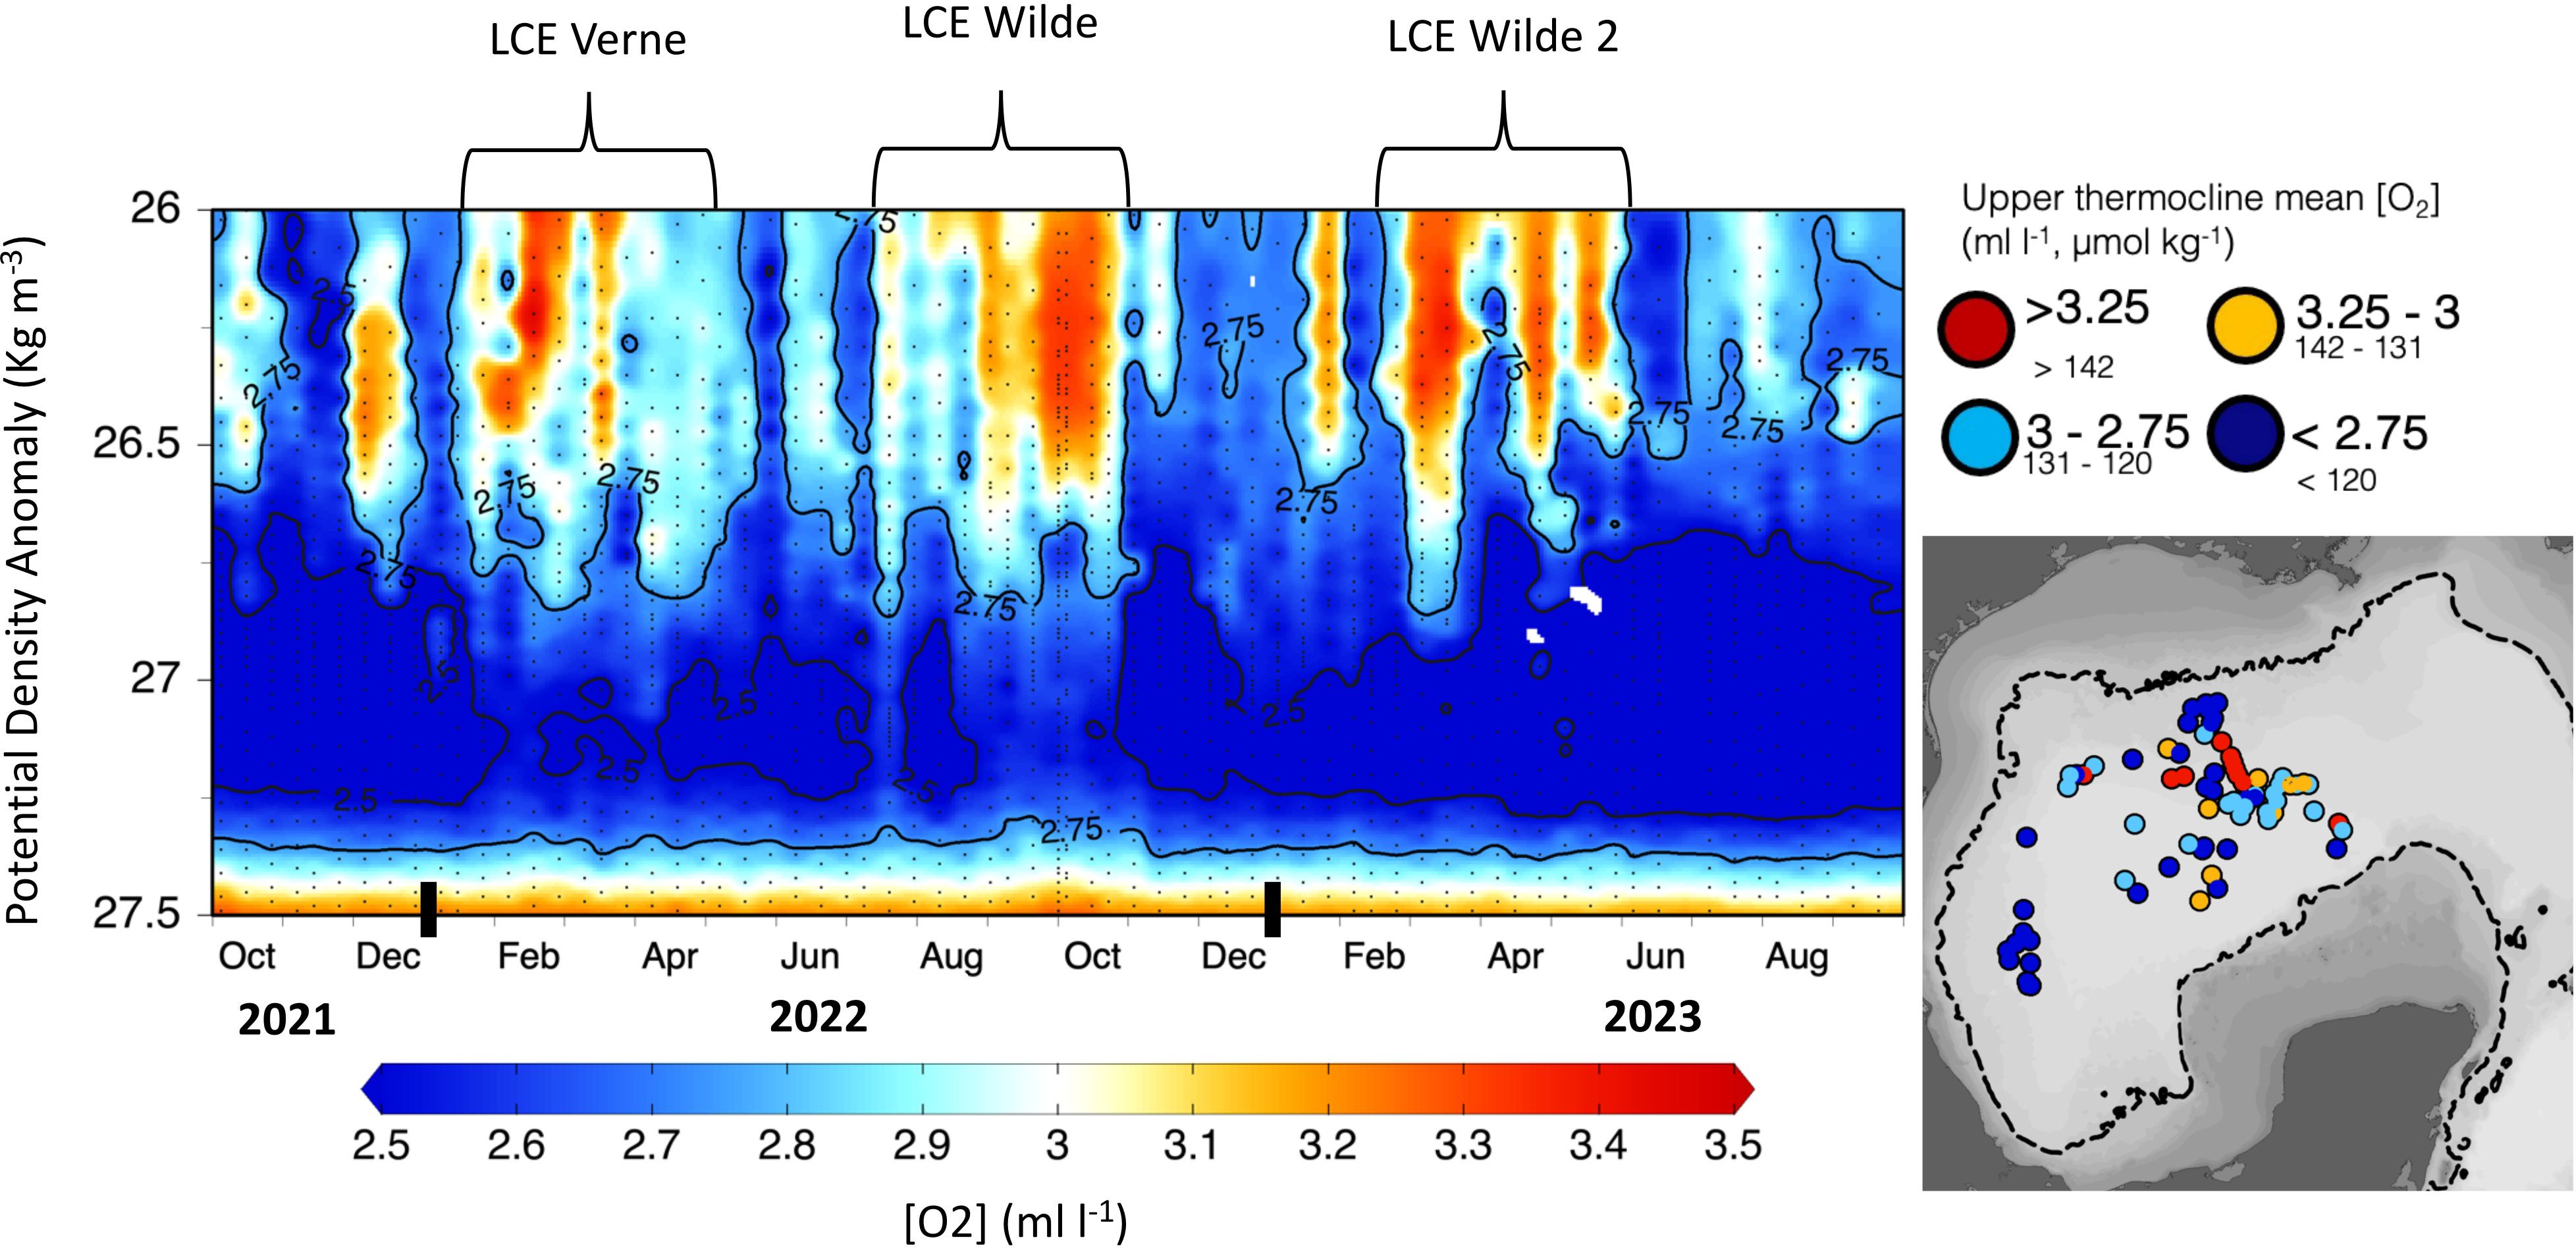
Figure 8. Temporal variability of oxygen in the thermocline measured by BioARGO buoy 4903622 (BioARGO 2) released in October 2021.
2 Methods
2.1 XIXIMI cruises and ARGO data
The oxygen data used for this study were collected during the XIXIMI cruises, carried out by the Consorcio de Investigación del Golfo de México (CIGoM) onboard the RV/Justo Sierra from 2011 to 2019 (dates are listed in Tables 2, 3). Oxygen values from the XIXIMI cruises were measured with a CTD equipped with a calibrated SBE43 oxygen sensor and the data were again calibrated on board following the microwinkler method (Furuya and Harada, 1995). The array of stations was intended to be as similar as possible across the cruises, with a spatial resolution of approximately 1° (Table 3, Figures 1, 3). In the sampling during the XIXIMI-5 cruise, the center of LCE Poseidon was sampled (Table 4), and during the XIXIMI-6 and -7 cruises, samples were further collected from the upper north Caribbean basin, as well as during XIXIMI-7 when four extra stations were sampled in the northwestern GoM. Unfortunately, the “Nortes” (cold fronts with northerly winds) during XIXIMI-3 and tropical cyclones during XIXIMI-6 and -7 did not allow the complete sampling of all planned stations during these cruises (Figure 3). In spite of these gaps, the sampled area is considered representative of the deep GoM region as it encompasses a considerable spatial area, including stations in the Yucatan Channel and in the northwestern Caribbean (Figures 1–3).
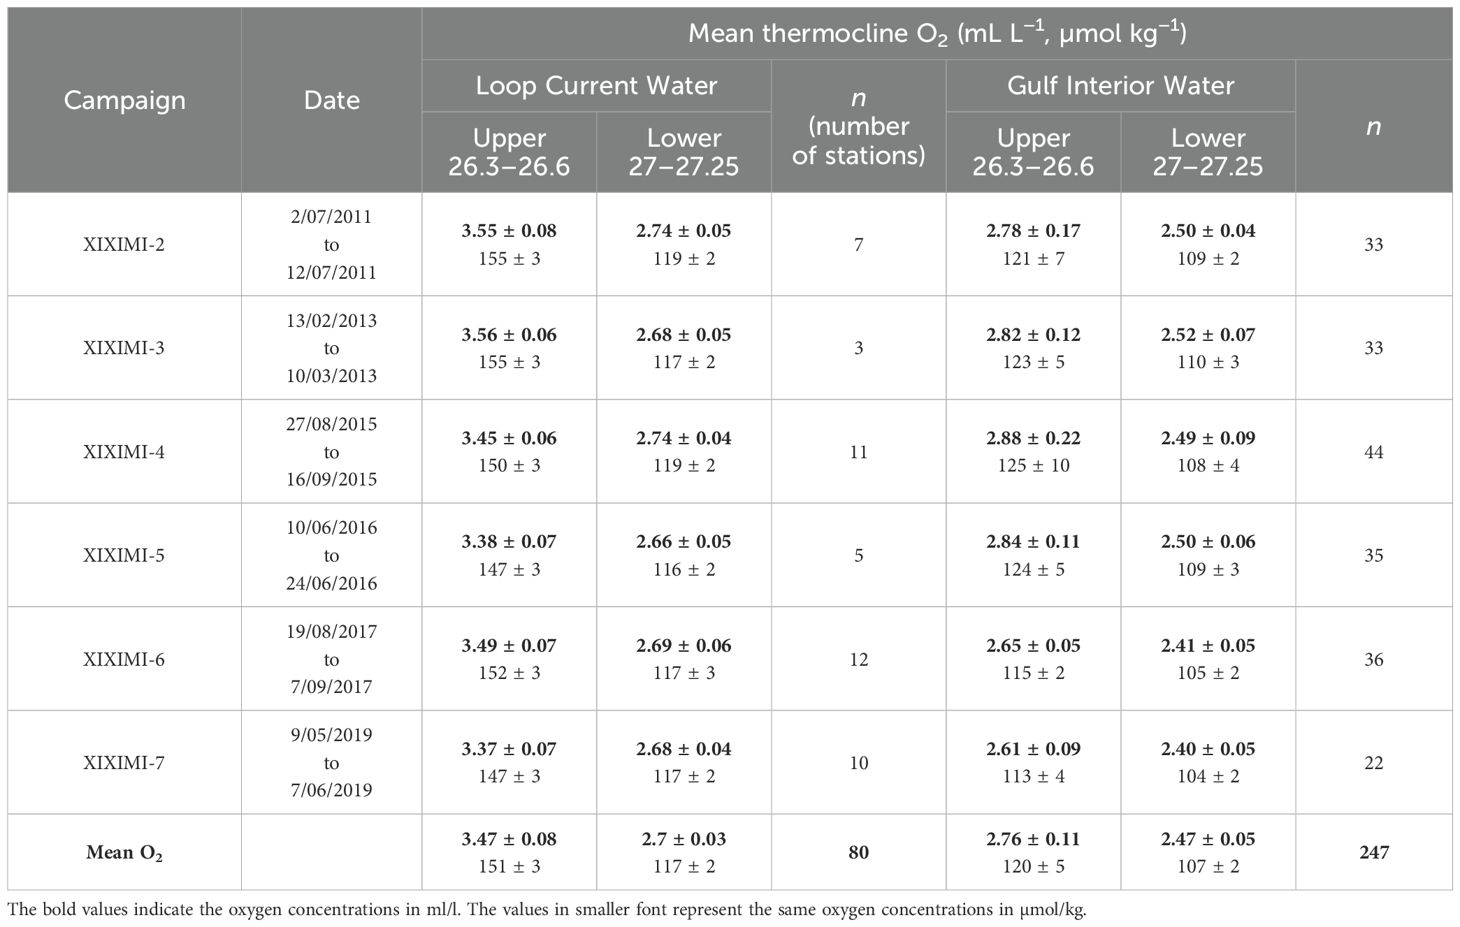
Table 2. Dates of XIXIMI campaigns and mean oxygen concentrations in the upper and lower thermocline for the Loop Current and Gulf interior water.
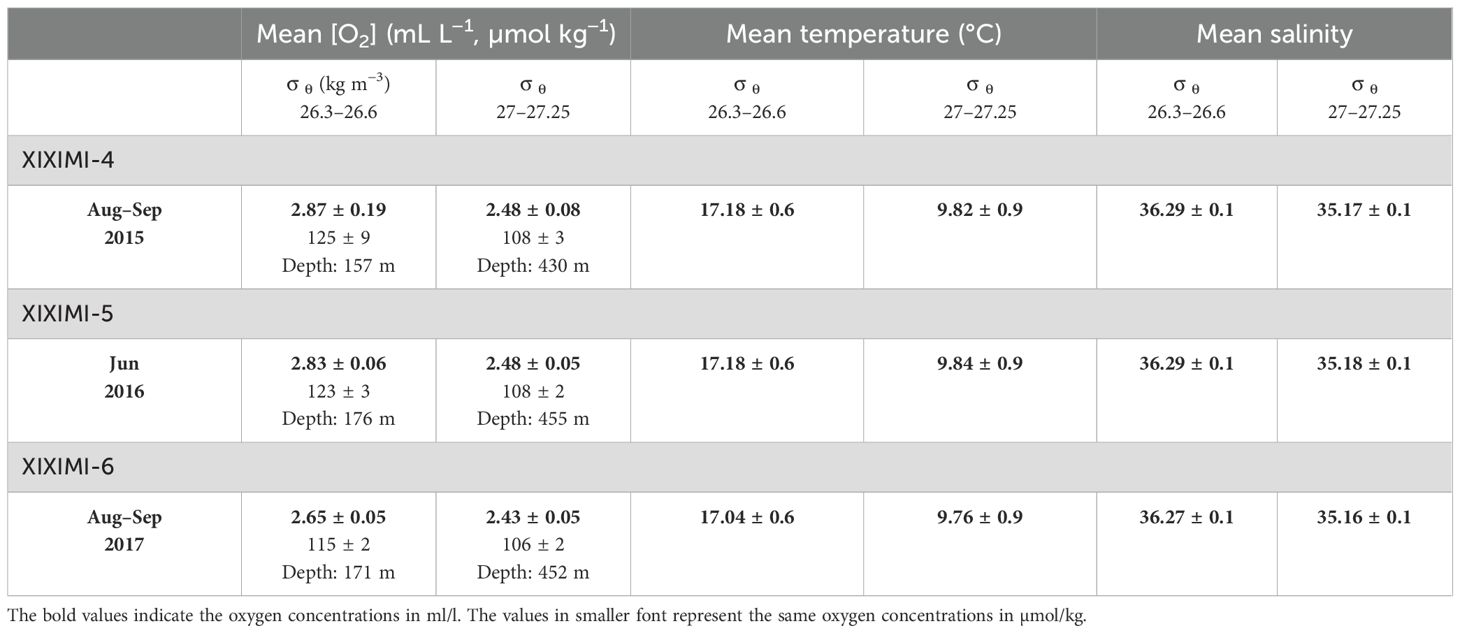
Table 3. Mean oxygen, temperature, salinity and isopycnal depth measured in the upper and lower thermocline from 24 stations located in the same coordinates from three cruises.
In addition to the cruise data, oxygen measurements from two Biogeochemical ARGO floats 4901043 (BioARGO 1, Figures 1, 2) and 4903622 (BioARGO 2, Figure 8) (https://biogeochemical-argo.org) were used to provide value comparisons with the XIXIMI cruises as well as to get spatial coverage of the north eastern deep GoM. The BioARGO measurements presented here (Table 1, Figures 1, 2, 8) are the raw measurements without any post-calibration work; as such, the sensor might present offset and drift errors of up to 5% per year after its deployment (Bushinsky et al., 2016). A correction technique in the absence of near-calibrated oxygen measurements has been suggested that employs WOCE climatology to correct first-order errors (Takeshita et al., 2013); however, we did not apply it here as following this method would bias the float data towards a climatology based on 1980s to 1990s data, obscuring to some extent the last decade oxygen concentrations, but we acknowledge the need of corrected BioARGO data for future analysis. Without this calibration, the BioARGO measurements show the same trend to lower oxygen concentrations as the calibrated [O2] results from XIXIMI cruises (Table 1) above the precision or drift errors reported for the sensors (Uchida et al., 2008).
We used the TEOS-10 algorithms (McDougall and Barker, 2011) to calculate absolute salinity, potential temperature, and potential density (both referenced to the surface) from the cruise and ARGO CTD measurements. The upper and lower thermocline were identified as the density range from 26.3 to 26.6 kg m–3 and from 27 to 27.25 kg m–3, respectively, following similar ranges previously reported (Table 1, Figures 1, 2, 5) and ensuring that both the [O2] local maximum of the EDW in the LC and the [O2] minimum of the TACW in the LC and the western GoM are well captured (the mid-thermocline waters present transitional [O2] values between these two extremes).
[O2] values are reported in the text and figures in mL L –1 to be consistent with the historically reported units in GoM studies (Table 1). Since the unit µmol kg–1 is the most commonly reported in the recent literature, the conversion to this unit was made using the TEOS-10 equation based on the calculated potential density.
The mean [O2] values in the upper and lower thermocline were calculated for every profile of the XIXIMI cruises and the BioARGO float. With the objective of simplifying the visualization of the data and the comparison between cruises, each profile was labeled with a color code according to the mean oxygen value in the upper thermocline in the density range from 26.3 to 26.6 kg m–3 (where the [O2] spatial and temporal change were more pronounced) using the following criteria (applied in Figures 1, 2, 3, 5, 8, color code in parenthesis):
● Loop Current Water (red): [O2] > 3.25 mL L –1 (142 µmol kg–1).
● Transition Water 1 (orange): 3–3.25 mL L –1 (131–142 µmol kg–1).
● Transition Water 2 (cyan): 2.75–3 mL L –1 (120–131 µmol kg–1).
● Resident Water of the GoM interior (blue): [O2] < 2.75 mL L –1 (120 µmol kg–1).
The map of locations of the XIXIMI stations and BioARGO profiles (Figures 1, 2) and the [O2] profiles plotted against depth (Figure 2B) and against potential density anomaly (Figure 2C) are presented with the aforementioned color coding. The mean depths for the upper and lower thermocline of the LC were estimated using all the profiles identified as Loop Current water while the mean depths for the upper and lower thermocline of the GoM were estimated using all the profiles identified as transition water 1 and 2 and resident water (shown in Figure 2B).
2.2 Loop Current and Loop Current eddy data
The LC and LCE metrics were computed from the Global Ocean gridded L4 sea surface heights and derived variables reprocessed starting in 1993 to 2019 [product distributed by Copernicus (https://doi.org/10.48670/moi-00148)]. In accordance with Leben (2005) and Hall and Leben (2016), the daily gridded SSH corrected for a steric signal from 1 January 2000 to 31 December 2019 was used to identify the LC and LCE position tracking the SSH 17-cm contour. The LCT code identifies the time when the 17-cm contour breaks from the LC. For this work, the detachment date of an LCE was estimated as the initial date that the LC 17-cm contour separated in two portions without any subsequent reattachment. The area of the LCEs was estimated computing the mean and standard deviation of their daily area based on the 17-cm contour during the first 30 days after the detachment date. This 30-day period was arbitrarily selected but seems to provide a fair estimate of their area given the LCE development time scales; the standard deviation was on average close to ± 10%. The detachment dates and LCE areas (Figure 4) were used to compare the LCE detachment frequency and the total detached area during the 2000–2009 and 2010–2019 decades and were used also as parameters in the box model described in Section 4. The computed LC and LCE positions are represented in Figure 3 as surface maps that depict the mean SSH 17-cm contour during the days that the cruises took place, together with monthly average values of the SSH 17-cm contour at 3, 6, 9, and 12 months prior to the cruises’ dates.
3 Results and discussion
3.1 Oxygen variability in the Gulf of Mexico thermocline
All the oxygen data used for this work are shown in Figure 2. The stations map in Figures 1–3 show the locations of all the XIXIMI and BioARGO profiles with the color coding according to the upper thermocline oxygen values in order to show the [O2] spatial variability. Figure 2B shows the [O2] profiles plotted against depth from 0 to 1,000 m; the mean depth of the upper and lower thermocline ranges is shown as a shadowed interval to identify the depth difference of the isopycnals in the LC and the GoM interior, respectively. Figure 2C shows the [O2] profiles plotted against the potential density anomaly from 26 to 27.5 kg m-3, zooming in the main thermocline density range. Plotting the oxygen against density makes it easier to compare the oxygen values of the thermocline in the LC and in the GoM as it removes the depth difference of the isopycnals in the two regions caused by their distinct stratification and circulation.
Maxima in upper thermocline concentrations () above 3.25 mL L −1 are consistently observed in Caribbean and LC waters (Figure 1A). Every XIXIMI cruise and BioARGO profile confirm that the highest mean values of ≥ 3.25 mL L−1 and ≥ 2.6 mL L−1 corresponding to upper and lower thermocline waters, respectively, are consistently found in the Caribbean, the Yucatan Channel, and inside the GoM at a maximum LC western penetration of 87°W.
The BioARGO oxygen profiles were mainly taken inside the LC area of influence east of 90˚ W (Figure 2). Of the total 76 BioARGO profiles, 32 had a mean upper thermocline equal to or greater than 3.25 mL L−1, considered as LC water, 24 profiles were considered as transition waters, 16 were considered as transition waters, and only 4 profiles presented mean values below 2.75 mL L−1 and were considered as resident waters of the GoM interior. The XIXIMI data show a similar pattern with the highest values located in the LC area.
A comparison between the previously reported oxygen measurements and the 2010–2019 XIXIMI and BioARGO data (Table 1, Figures 1, 2) highlights the following observations:
- East of 90°W, the oxygen concentrations in the upper thermocline showed very similar values in the last two decades, ranging from a minimum mean of = 3.23 ± 0.25 mL L−1 measured by the BioARGO buoy to a maximum mean of 3.40 ± 0.20 mL L−1 measured in 2000 (Rivas et al., 2005), with the 2011 to 2019 XIXIMI mean falling in between at 3.37 ± 0.21 mL L−1. These observations suggest that any change in the oxygen content of the upper thermocline of the GoM interior in the last decade cannot be attributed to changes in the LC source waters.
- East of 90°W, the oxygen concentrations in the lower thermocline decreased in the last two decades from a mean = 2.8 ± 0.25 mL L−1 measured in 2000 (Jochens and DiMarco, 2008; Rivas et al., 2005) to a mean 2.66 ± 0.08 mL L−1 measured during the XIXIMI cruises and 2.54 ± 0.07 mL L−1 measured by the BioARGO buoy. Recent measurements have identified the TACW in the Eastern Caribbean with an oxygen minimum that is below 2.8 mL L−1 (<120 µmol kg-1) (Van Der Boog et al., 2019), in the western Caribbean (Carrillo et al., 2016), and in the LC (Portela et al., 2018). This suggests a deoxygenation trend in the lower thermocline of the Caribbean that is happening outside the GoM, and could be in part responsible for a deoxygenation trend of this isopycnal range inside the GoM.
- West of 90°W, the oxygen concentrations in the upper and lower thermocline have decreased from mean values of = 3.0 ± 0.20 mL L−1 and = 2.7 ± 0.20 mL L−1 in 1978 and in 2000 (Morrison et al., 1983 and Jochens and DiMarco, 2008) to mean concentrations of 2.75 ± 0.20 mL L−1 and 2.46 ± 0.07 mL L−1 as observed from all the XIXIMI cruises, and similar values were also reported with glider measurements from 2010 to 2017 (Portela et al., 2018).
These observations suggest that during the last two decades, changes in the oxygen content of the upper thermocline of the deep GoM may be attributed to processes within the basin proper and not due to changes in the LC source waters, whereas changes in the oxygen content of the lower thermocline of the deep GoM may be related to changes in the LC source water in addition to changes attributed to processes within the basin proper.
In this section, we describe the temporal and spatial variability of oxygen within the GoM thermocline during the 2010–2020 decade and its relation to the LC and LCE metrics. This is shown in Figure 3, which depicts individual [O2] measurements from each station of the six XIXIMI cruises from 2011 to 2019 in the deep GoM, using the same color scheme described in the Methods section as well as surface maps (left/right panels) that include the mean SSH 17-cm contour of the LC and LCEs tracked during the cruises as well as its location 3, 6, 9, and 12 months prior to the surveys. A clear signal emerges from the combination of these different data sets that suggests a specific mechanism to explain the oxygen balance of the GoM thermocline. Section 3.4 follows up this lead and provides a simple box model that links the thermocline oxygen concentration to LCE detachments and the presence of LCEs in the GoM interior.
During the XIXIMI-2 cruise (July 2011), the oxygen concentrations of the upper thermocline () showed the typical decreasing gradient from the LC stations in the eastern GoM to the transition stations in the central Gulf, showing a mean between 2.75 and 3 mL L –1, to the southwestern region and the Campeche Bay, where the lowest concentrations were consistently found. During this expedition, the 17-cm SSH contour was localized in the eastern region of the LC; the last big LCE detachment (Franklin, area: = 52,133 ± 2,700 km2) had occurred 12 months before the cruise.
The following cruise took place in February and March 2013. This is the only XIXIMI cruise that took place during the winter season, and the observations indicate no evident changes in the vertical structure of the permanent thermocline. During the expedition, strong cold front winds (“Nortes”) did not allow the completion of the 24˚ N line. In comparison with the previous expedition, in XIXIMI-3, the green-colored transition stations and the blue-colored resident waters seemed to have been more mixed, without a clear north–south distribution. Along the 25˚ N line, four stations were sampled with ≤ 2.75 mL L –1 and three stations in the Campeche Bay with ≥ 2.75 mL L –1. Although the LC was relatively retracted to the east during the expedition, the 17-cm SSH contour of the huge LCE Jumbo ( = 92,078 ± 4,500 km2) that detached 9 months before was still observed in the western GoM. The evolution of this eddy from the LC region to the western GoM shelf can be seen in the SSH 17-cm contours 3, 6, and 9 months prior to the cruise, and could explain the presence of relatively high thermocline [O2] observed in the southwestern GoM. This suggests that the eddy still carried a large volume of water with higher oxygen concentrations than its surrounding waters even 9 months after its detachment from the LC.
The XIXIMI-4 cruise in August and September of 2015 was remarkable for the continuum of oxygen concentrations in the upper and lower thermocline, implying a continuum degree of mixing between the two end members, the Loop Current waters and the southern GoM ones. Results from prior expeditions showed a marked gap in the oxygen content with almost no profiles with between 3 and 3.25 mL L –1 (yellow stations being relatively rare), which led to the idea that the “gaps” at intermediate waters had to be filled mainly with unsampled northern GoM waters. The year 2015 was also distinctive for having a fairly extended LC to the northwest and by the detachment of several big LCEs: the Olympus eddy had detached 2 months prior to the cruise ( = 95,516 ± 4,200 km2), and Nautilus ( = 51,297 ± 2,500 km2) and Michael ( = 55,484 ± 2,800 km2) had detached up to 4 and 8 months before the cruise, respectively, showing significant LCE activity prior to the expedition.
This situation changed the following year during the XIXIMI-5 cruise, when most of the stations in the central and western Gulf showed relatively higher oxygen values and were considered as transition stations with > 2.75 mL L –1. These results indicate that the transition and resident waters measured during the previous cruise had mixed to form a relatively well-oxygenated and homogeneous water filling the thermocline in the central GoM. Two months before this cruise, LCE Poseidon ( = 98,517 ± 4,900 km2) detached from the LC, probably the largest LCE detachment recorded since January 2000 to this date. At the time of the cruise, it was still located near the LC and one CTD station sampled its center (Figure 3). The oxygen profile of the LCE Poseidon was similar to the one from LCE Franklin measured by the ARGO float only showing deeper isopycnals (Table 4).
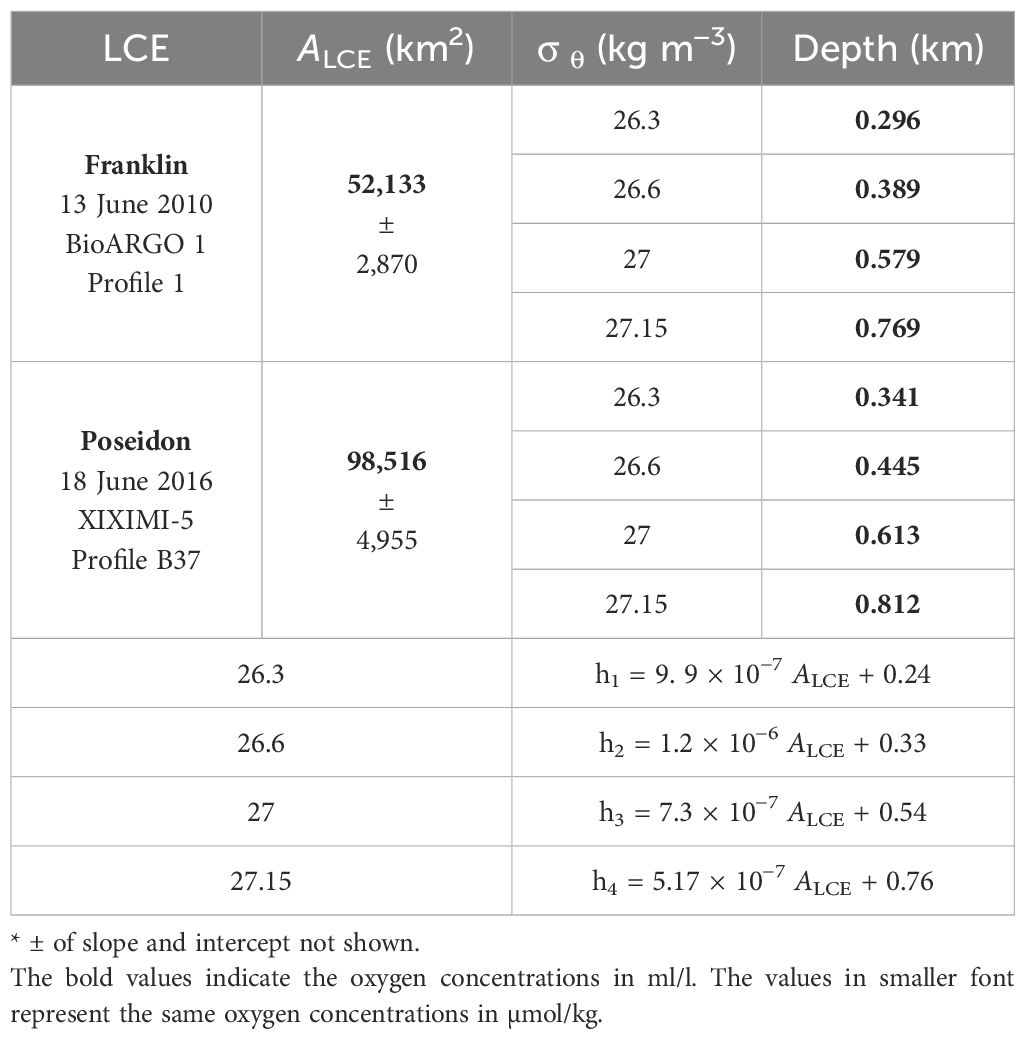
Table 4. Area and isopycnal depth of profiled Loop Current eddies and linear equations to relate both parameters.
After the Poseidon detachment, there was a 19-month period without any detachments, although the signal of Poseidon’s 17-cm SSH contour was still visible in the western GoM 20 months after its detachment. The XIXIMI-6 cruise took place during August and September 2017, 18 months after Poseidon’s detachment. During this cruise, most of the stations showed typical lower dissolved oxygen values of resident waters except for the LC ones. The consistently low [O2] values measured during the XIXIMI-6 cruise could result from the mixing of the intermediate waters measured during XIXIMI-5, with the resident waters of the interior and by depletion of oxygen through respiration processes during a 19-month period without LCE detachment and no input of oxygen richer intermediate waters. Even the stations located over the remaining Poseidon LCE showed lower values of ≤ 2.75 mL L –1. An implication of these observations is that although a huge LCE may still be visible in altimetry data more than a year after its detachment, their properties at depth, specifically [O2] profiles, show clear signs of mixing with the Gulf’s interior waters at these intermediate depths (Meunier et al., 2018). Unfortunately, the arrival of a hurricane limited the sampling of seven of the planned stations in the 25˚ N line.
Probably some transition stations with higher could have been measured there; nonetheless, the remaining stations clustered around the typical low oxygen values of the interior waters.
The last cruise, XIXIMI-7, between May and June 2019, was also fraught by technical difficulties and was the least complete of all cruises. Fortunately, this time, the 25°N line was completed first, and although it shows four transition stations, the majority showed the typical oxygen lower concentration of GoM resident waters at depth. During this cruise, four stations were sampled in the western shelf, north of 25°N, as part of a collaboration with other series of cruises. The LCE Revelle detached 10 months prior to this cruise ( = 78,270 ± 4,000 km2) and was still visible from altimetry data in the western GoM, but, again, as in the previous cruise, even stations located within this remanent eddy showed low oxygen content in the thermocline waters. During the XIXIMI-6 and -7 cruises, one station in the northern shelf of the Mexican Caribbean was also sampled, with a profile fairly similar to the ones observed in the Yucatan Channel.
3.2 A decreasing trend in the detachment frequency of Loop Current eddies
The time series of LCE detachments from 2000 to 2020 with the estimated areas and dates of these events is shown in Figure 6. These estimates were further compared with the ones reported by Hall and Leben (2016) and the names and dates given by the Woods Hole Eddies Watch (https://www.horizonmarine.com/loop–current–eddies). Although there are some slight differences in the time of detachment, overall, the results from both identification exercises are similar.
From January 2000 to December 2009, the estimated LCE shedding period was of one every 5.85 ± 2.60 months or approximately two per year. In comparison, Vukovich (2012) estimated a frequency of 8.8 ± 5 months per shedding during the 2000–2010 decade, the difference being that in the study, only the detachments of major rings were considered (diameter > 300 km). The mean diameter estimated (assuming a circular shape) of the detached LCEs from 2000 to 2019 was 272 ± 12 km, which falls close to previously reported diameters of approximately 300 km (Hall and Leben, 2016; Moreles et al., 2021). The maximum diameter estimated was from the LCE Poseidon of 354 ± 9 km.
From January 2000 to December 2009, the average detached area was 5.6 ± 0.3 × 10⁴ km2, reaching a cumulative detached area during that decade of 1.1 ± 0.05 × 10⁶ km2. In comparison and following the same method and criteria, from January 2010 to December 2019, the estimated frequency was one detachment every 8.4 ± 4.9 months, or 1.4 detachments per year, with an average area of 5.7 ± 0.3 × 10⁴ km2, making a cumulative detached area during that decade of 0.8 ± 0.04 × 10⁶ km2 (Figure 4). A decreasing trend in the number of LCE detachments during the last decade coincides with the hypothesis that a reduced transport of the LC, expected under some climate change scenarios, will decrease the frequency of LCE detachments (Moreles et al., 2021). However, more data and analysis are needed to confirm this trend and reject it as part of lower-frequency variations (Meunier et al., 2022).
3.3 Interannual thermocline deoxygenation linked to a decrease of LCE detachments
While the first two XIXIMI cruises were planned in different seasons (summer and winter) to observe the seasonal variability of the deep GoM, the next cruises were all planned during the summer season to observe the interannual variability. The cruises XIXIMI-4, -5, and -6 share a total of 24 stations located in the same locations (Figure 5); this allows for a direct comparison between consecutive summers without noise from inhomogeneous sampling.
Considering the mean oxygen difference between consecutive cruises as an annual oxygen change rate () following Equation 1:
This change can be positive or negative and is the net result of a ventilation rate (the net oxygen flux into western GoM as control volume via advection and diffusion) minus an oxygen utilization rate (OUR represents a net utilization of oxygen via biological respiration, Jenkins, 1982). Thus, a negative oxygen change rate indicates a net oxygen reduction.
The oxygen change rate from XIXIMI-4 (August 2015) to XIXIMI-5 (June 2016) was = −0.5 ± 0.06 mL L−1 year−1 (not a significant difference based on the Kruskal–Wallis test, p = 0.25) and = 0 mL L−1 year−1, while the from XIXIMI-5 (June 2016) to XIXIMI-6 (August 2017) was = − 0.16 ± 0.05 mL L−1 year−1 (− 6.9 ± 2.1 µmol kg-1 year−1) and = − 0.04 ± 0.02 mL L−1 year−1 (− 1.7 ± 0.8 µmol kg-1 year−1) (both showing significant difference on the Kruskal–Wallis test, p < 0.0001). Such a reduction in oxygen during 1 year requires a deoxygenation rate one order of magnitude higher than the global deoxygenation rate at those same densities (Oschlies et al., 2018). Thus, there must have been a significant reduction in thermocline ventilation, an increase in oxygen consumption at those densities, or a combination of both (Deutsch et al., 2006).
Could an increment in the oxygen utilization rate explain the observed oxygen reduction?
If the ventilation rate stayed constant, then the OUR would have to have almost doubled between 2016 and 2017 compared to the previous year. The lack of direct OUR measurements makes it impossible to totally discard this possibility, but for such an OUR increase to occur, primary productivity in the photic layer would have to increase significantly. Satellite-derived surface chlorophyll-a concentrations do not show a decadal variability trend from 1997 to 2018 that could indicate a significant increase in surface primary productivity during the past decade (Li et al., 2022). This, in addition to the published data on POC for the same cruises (Contreras-Pacheco et al., 2023) that show very similar values during the same period and no sign of an increase in these values, indicates that the trend towards lower oxygen values in the main thermocline is unlikely to be explained by a higher export of organic carbon to depth.
Could ocean warming explain the observed oxygen reduction?
A warming of the GoM from 0 to 2,000 m during the 1970–2020 period has been observed and documented by Wang et al. (2023). However, they also report a decadal scale oscillation of the heat content in the 200–600 m layer within the GoM, with a very weak warming during 2010–2020 at these depths (see their Figure 6). Other studies indicate that the potential temperature of the thermocline seems to have remained unchanged around 17.15°C and 9.90°C from 2000 to 2020 (T–S diagram from Jochens and DiMarco, 2008, Table 3, Figure 1). If ocean warming is not at the heart of the GoM thermocline recent deoxygenation, it is important to understand which other controls are lowering oxygen concentrations of this water volume due to its impact on the macroorganism populations with high economic and ecological value that are either stressed or migrate out under lower oxygen concentrations in the water column (Stramma et al., 2010; Andrews et al., 2017). Temperature data gathered in this study show slightly lower temperatures in the main thermocline (but not significant, p > 0.05) than during the previous 2 years, as well as a slight deepening of the isopycnals range (Table 3). This evidence suggest that the 2017 oxygen reduction was not a direct result of a temperature increase in the intermediate GoM.
Could changes in vertical mixing produce the observed oxygen reduction? In that case, we would expect significant changes in the temperature and salinity of the chosen isopycnals, and this is not observed during the cruises (Table 3). Interannual changes in horizontal mixing are usually related to mesoscale variability (Morrison et al., 2022) and, as observed in Section 3.2, the more evident change in mesoscale circulation before the XIXIMI-6 cruise was the absence of LCE detachments from April 2016 to November 2017.
Could the changes in LCEs produce the observed oxygen reduction? LCEs seem to be an important source of oxygen via advection and isopycnal mixing of Caribbean waters into the GoM interior. Our observations suggest that the significative drop in oxygen from 2016 to 2017 could be the result of a reduced ventilation from advection and isopycnal mixing caused by the absence of recently detached LCEs in the GoM interior. The absence of LCE detachments could also lead to a reduction of productivity as suggested by Damien et al. (2018), which could explain the reduction of POC measured in 2017 (Contreras-Pacheco et al., 2023), and be linked to a reduction of the OUR. If is lower in times when the OUR is also lower, this would mean that the ventilation rate must be also lower as follows from Equation 1: . This could be the case during long periods without eddy detachments (McGillicuddy et al., 1998).
In summary, evidence suggests that the ventilation produced by advection and mixing of detached LCEs is, to a first order, the main driver of oxygen variability in the GoM thermocline. If that is the case, a model based on LCEs as the main ventilation sources of the GoM interior waters should be able to capture the observed interannual and decadal deoxygenation signal.
While the principal concern on the deoxygenation in the GoM is the expanding low oxygen “dead zone” of the northern shelf waters (Rabalais et al., 2002), in the Gulf’s deep-water region (here delimited as the region with depths greater than 1000 m, Figures 1–3), measurements obtained during the 2010–2020 decade suggest another deoxygenation trend of lesser magnitude in the main thermocline (Table 1) that has not been previously addressed.
3.4 Estimating the GoM thermocline oxygen variability from LCE metrics
The data clearly show that the oxygen content of thermocline waters (defined using a potential density range) from the Caribbean is higher than in the interior of the GoM. Furthermore, it is well established that waters of Caribbean origin enter the GoM via the LC and its irregular shedding of LCEs with periodicities between few months to over a year, which then travel westward into the interior of the Gulf (Jochens and DiMarco, 2008, Portela et al., 2018; Meunier et al., 2020). Using altimetry and hydrographic observations, we find remarkable differences in the [O2] measurements during the XIXIMI cruises, which concur with the presence/absence of LCEs in the region (Figure 3). This finding, together with (a) no drastic changes in particulate organic carbon (POC) reported in Contreras-Pacheco et al. (2023); (b) the lack of substantial changes in surface productivity based on satellite observations (Li et al., 2022); and (c) no evidence of an increment of the thermocline temperature (Table 3), suggests that the LCEs appear to be the main source of oxygen to the GoM thermocline waters.
In this section, a simple box model is formulated to check whether such hypothesis is warranted, making simplifications and using order of magnitude estimates of several processes and parameters. Its purpose is mainly to guide future work, which requires more observations and higher complexity models to determine more accurately the oxygen budget of the GoM thermocline waters. The rough but physically and biogeochemically sound estimates of the several processes (parameters) used to build the simplest box model we could think of are made based on available published data, on the time scales determined by the eddy shedding and movement as well as the year- to-year observed differences in oxygen content in the XIXIMI cruises.
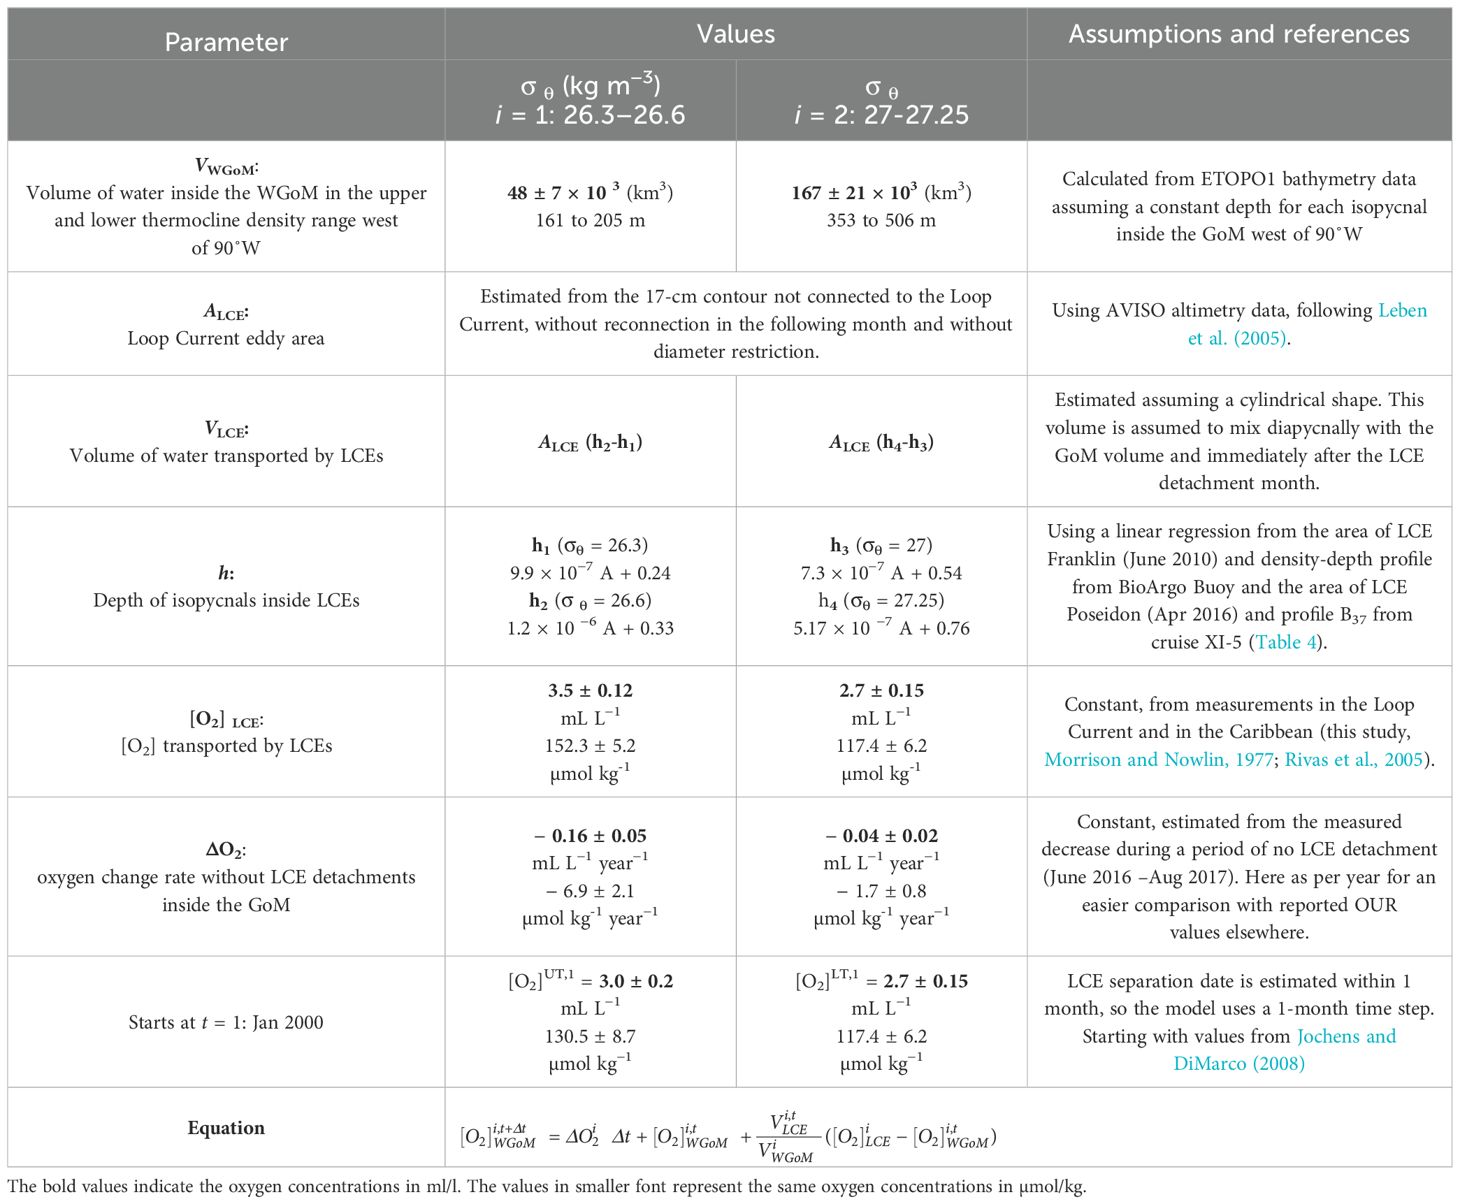
To estimate how changes in the LCE detachment frequency and some eddy characteristics (size) could affect the oxygen content of the western GoM’s thermocline (WGoM), a simple box model was formulated taking into account the oxygen input from the LCE detachments. Consider Equation 2 schematized in Figure 6 and summarized in Table 5:
The right side of the equation separates the oxygen change in two parts: the first term (involving the rate ) represents the change in the GoM interior without the LCE oxygen input, whereas the second term represents the entrance and exit oxygen fluxes produced by an LCE detachment event during a time . Volume is conserved so the volume fluxed into the GoM by an LCE has to exit too; the difference is in the oxygen concentration of the inflow/outflow waters.
Assuming a constant volume for the upper and lower thermocline (considering the WGoM interior box of thermocline waters is much larger than the average eddy volume contained within the same isopycnals), the equation becomes
Assuming a discrete time step of 1 month and that all the eddy volume enters the GoM during that time step, the equation is:
where:
- is the estimated oxygen content in the western GoM thermocline, for i = 1 the upper thermocline volume (with the isopycnal range σθ: 26.3 to 26.6 kg m–3) and for i = 2 the lower thermocline volume (σθ: 27 to 27.25 kg m–3), represents a chosen discrete time step of 1 month. The model starts at t = January 2000 with the initial values reported during that year, = 3 ± 0.2 mL L−1 and =2.7 ± 0.15 mL L−1 (Jochens and DiMarco, 2008).
- is the control volume (assumed constant) contained inside the deep GoM in the upper and lower thermocline west of 90˚W (WGoM) in order to leave out the mean area occupied by the LC ( box in Figure 6A). The WGoM volume was computed from the ETOPO1 bathymetry using the average depths of the isopycnals in the profiles from Gulf resident waters. For the upper thermocline, the layer was estimated between 155 ± 7 and 210 ± 8 m, a depth range that according to the bathymetry contains a volume of = 48 ± 7 × 10³ km3. For the lower thermocline layer, the average depths of the isopycnals were observed between 345 ± 20 m to 534 ± 18 m with an average volume of = 167 ± 21 × 103 km3.
- is the volume of water that enters the GoM in the upper or lower thermocline in the event of an LCE detachment during the month t (red cylinder in Figure 6B). If there is no detachment during the month t, then VLCE = 0 and the third term on the right side of Equation 2 is equal to 0, making Equation 2 a simple sum of the oxygen calculated the previous month plus the oxygen monthly change rate . If there is an LCE detachment during month t, then the transported LCE volume for each thermocline layer is estimated from the LCE area (Figure 4) during the first month after the detachment. The volume of the LCE upper and lower thermocline layers is estimated assuming that the eddies have a cylindrical shape with a constant area from the surface to the depths of the lower thermocline using Equation 3:
-where A LCE is the mean area of the LCE surface 17-cm SSH contour in km2 estimated during a month after its detachment, and are the depths of the shallowest and deepest limits of the upper or lower thermocline layers. A cylindrical shape was chosen as the simplest shape to estimate the volume of water transported by an LCE of area aLCE, but if the shape of the eddy was closer to a bowl rather than a cylinder, the volume of water transported by the LCE would be somewhat overestimated especially at depth. The simple cylindrical shape is sufficient for the purposes and scope of this box model. To estimate the depths and , a linear equation was calculated using the area of the detached LCEs Franklin and Poseidon and the depths of those isopycnals taken inside those LCEs with the data and equations shown in Table 4.
- is the oxygen concentration in the volume of water transported by the LCEs. We used the mean values measured with the BioARGO float and the XIXIMI cruises in the Caribbean and the LC with the highest standard deviation measured, = 3.5 ± 0.12 and = 2.7 ± 0.15. Both values are considered constant from 2000 to 2019 with a relatively high standard deviation to encompass the full variability of this oxygen entrance. In the upper thermocline of the LC and the LCEs, measured values have remained fairly similar from 1980 to 2019 with a mean value of 3.53 ± 0.14 mL L –1, but in the lower thermocline, the [O2] has decreased in the Caribbean and in the LC from 3.05 mL L –1 in 1980 (Morrison and Nowlin, 1977) to less than 2.50 mL L –1 in 2019. To simulate this oxygen variability, a mean value of 2.70 ± 0.25 mL L –1 was chosen as the [O2] entrance in the lower thermocline. If the oxygen input in the lower thermocline by LCE continues to drop, the deoxygenation rate of the lower thermocline may become even higher than expected. This possibility is something to be aware of and might be addressed with further [O2] measurements in the Cayman basin.
- is the oxygen change rate given by the sum of oxygen entrances minus exits to the control volume limited by the upper and lower thermocline waters inside the WGoM without the influence of LCE detachments (in mL L –1 month–1). As detailed in Section 3.3, this rate integrates an oxygen utilization rate by biological respiration in the water column (Jenkins, 1982), as well as the oxygen lateral and vertical advection and diffusion terms (Oschlies et al., 2018). Each of these processes is complicated to measure explicitly, but the sum of its parts, , was approximated by measuring the rate of [O2] change during a period without LCE oxygen input between cruises XIXIMI-5 and -6. These estimates are = – 0.013 ± 0.004 mL L –1 month–1 and = – 0.0033 ± 0.002 mL L –1 month–1 for the upper and lower thermocline, respectively. Both oxygen change rates are negative, indicating that between August 2017 and June 2016, in the absence of LCE detachments, the sum of the biological consumption of oxygen and the vertical and horizontal oxygen mixing and diffusion resulted in a net loss of [O2] in the WGoM upper and lower thermocline. Since this is the only available estimate for , we proceed assuming that, in the absence of LCEs, the oxygen of the GoM thermocline decreases at these constant rates for the entire January 2000 to December 2019 period. The idea that is constant is clearly an oversimplification, and in the absence of LCE detachments, it implies that the [O2] of the WGOM thermocline will continue to decrease until totally consumed. In reality, oceanic systems, as any ecosystem, tend to balance themselves and a reduction of water entrance via LCE detachment might be balanced by other processes (Deutsch et al., 2006). However, for the purposes of this model, we believe this to be a simple and, to some extent, realistic assumption given its neglect of seasonal and lower-frequency variability, which is only provided by LCEs to first order.For simplicity, we assume that the LCEs enter the WGoM during the month they detach and that their oxygen content mixes immediately with the GoM oxygen content. This is obviously not the case, as we observed during the XIXIMI-3 cruise and is well known that eddies maintain, to some extent, coherence and their internal properties for a few months or in some cases even longer (Meunier et al., 2020). We could easily make the oxygen content of the LCEs enter and mix with the GoM resident waters over several months in the model, However, the end result (long-term [O2] concentration) obtained from slow or rapid mixing is the same; the only difference is just how smooth the transition is. We chose rapid mixing as the simplest, even if crude approximation, given the model characteristics and goals.To represent part of the real variability of the system that cannot be resolved with the crude approximations used in this simple model, the model was ran using a combination of the mean, maximum (mean plus standard deviation), and minimum (mean minus standard deviation) values of each of its parameters to estimate the following scenarios:- The mean scenario, using the mean values of each parameter, represented as the solid blue and red lines in Figure 7 for the upper and lower thermocline, respectively.- The maximum scenario, with a maximum [O2] entrance during an LCE detachment and a maximum [O2] change rate inside the Gulf, using max LCEs volumes, min GoM volumes, max [O2] transported by LCEs, max initial [O2] inside the WGoM, and max absolute oxygen change rate inside the WGoM (dashed blue and red lines in Figure 7). The minimum scenario, with a minimum [O2] entrance during an LCE detachment and minimum [O2] change rate inside the Gulf, using min LCE volumes, max WGoM volumes, min [O2] transported by LCEs, min initial [O2] inside the WGoM, and min absolute oxygen change rate inside the WGoM (dotted blue and red lines in Figure 7). To compare the model results with actual measurements, the mean and standard deviation measured [O2] in each XIXIMI cruise are represented as colored X and error bars in Figure 7. Most of the XIXIMI measurements are enclosed within the model shading, representing maximum and minimum values, except for the XIXIMI-4 large [O2] variability in both the upper and lower thermocline that is not well represented. It could be that the model does not represent well the periods of high [O2] heterogeneity, probably produced during periods of important LCE activity as seen during XIXIMI-4. Nevertheless, it correctly represents the mixing and homogenization of oxygen during periods of low LCE activity. The mean [O2] measured during XIXIMI-6 and -7 in the upper thermocline layer is closer to the minimum [O2] entrance and minimum [O2] change rate scenario than to the maximum scenario. As such, it can be interpreted that, at least between 2017 to 2019, the oxygen input via LCE detachment was closer to the lower estimates and/or that the rate of [O2] change rate was lower (higher decrease rate) than previously estimated. In any case, more measurements are needed in order to confirm the persistence of this trend towards lower oxygen concentration values in the GoM thermocline. If the basic assumptions that support this simple model are found sound, it may provide a useful first approximation tool to estimate the oxygen level conditions in the thermocline of the GoM by keeping track of the LCE metrics via altimetry products.According to the model results (Figure 7), from January 2000 to December 2009, [O2]UT decreased from 3 ml to 2.9 mL L − 1 and [O2] LT decreased from 2.7 to 2.6 mL L−1, whereas [O2]UT decreased from 2.9 to 2.7mL L−1 and [O2] LT decreased from 2.6 to 2.4 mL L−1 during the period January 2010 to December 2019. This indicates that the 0.3% annual mean LCE area drop from 1. 1 × 10⁵ km2 to 0.8 × 10⁵ km2 from the 2000–2010 decade to the 2010–2020 (Figure 4) decade resulted in a doubling of the oxygen decrease rate. Note that there are more LCEs in the GoM during 2000–2009 (Figure 4), yet their estimated area/volume (hence oxygen content) in the model is not sufficient to compensate for the selected oxygen consumption parameter and still leads to an oxygen reduction in the WGoM, although slower than during 2010–2019.With the box model parameters (Table 5), we calculated the average annual eddy area needed to maintain different oxygen concentrations ( inside the WGoM’s thermocline based on the steady-state balance () of Equation 2:
where H is the average depth range of the upper or lower thermocline (Table 4). Using the annual oxygen change rate and equal to 1 year, the LCE detached area per year in order to maintain the minimum oxygen concentration levels measured in 2019 in the upper and lower thermocline at 2.60 and 2.40 mL L –1, respectively, would be 97,400 km2. This threshold was surpassed in 2021 with a total detached LCE area of 124,200 km2, but was not met in 2022 and in 2023 with less than 90,000 km2 of LCE detached in each of those years.
The use of BioARGO buoys is an accessible source of oxygen concentration time series that contributes to the study of ocean ventilation, among many other processes. BioARGO Buoy 4903622 (here refereed as BioARGO 2) was released in the deep GoM in October 2021 (Figure 8). The 10-day data series brings a higher resolution for the study of oxygen temporal variability in the center of the GoM. For the present study, the measurements are used as an extension of the cruise data, to compare them with the box model predictions (Figure 7). According to this study estimates, from January 2020 to August 2023, there have been four LCE detachments with an average surface area of 7.3 × 10⁴ km2. Figure 8 shows the BioARGO 2 oxygen measurements in the thermocline and the LCE events.
The mean upper thermocline oxygen measurements, excluding data from LC water (red locations in Figure 8), was 2.75 mL L−1, close to the mean [O2]UT measured in 2015 and above the concentrations measured during XIXIMI-6 and -7. Although these concentrations are higher than the mean values predicted by the model, they fall in the variability zone predicted in the maximum LCE entrance and maximum OUR scenario. The high variability in the upper thermocline seems to be produced by the presence of LCEs (mean values from non-LCE measurements are below 2.75 mL L−1) with a minimum mean value of 2.54 mL L−1 in August 2023. Meanwhile, the lower thermocline [O2] shows low variability with a mean value of 2.42 mL L−1 that is closely predicted in the model. These concentrations are close to those measured in 2019 and fall within the model predicted values, reflecting the lower variability produced by LCE detachments in the lower thermocline. Further studies of future BioARGO data will be of crucial importance to improve or invalidate the proposed model and gain more knowledge of oxygen variability in the GoM thermocline.
3.5 Global and future trends
According to our observations and simple model, the number of LCEs entering the GoM appears to be a key process for the ventilation of the thermocline, implying that a decreasing trend of LCE detachments would most likely lead to a deoxygenation in the GoM interior thermocline water masses. In this sense, some observations and model results suggest a weakening of the Gulf stream in connection with changes in the Atlantic Meridional Overturning Circulation (AMOC, Rahmstorf et al., 2015; Caesar et al., 2018; Smeed et al., 2018; Chen et al., 2019), which may cause a reduction in the LCE shedding frequency although such a connection remains to be firmly established.
If such a connection indeed exists, then a continuous weakening of the AMOC would continue the deoxygenation trend of the thermocline waters of the GoM in the future.
A possible LC slow-down has been hypothesized in some global warming scenarios (Rhein et al., 2011; Liu et al., 2012). Some model studies suggest that high (low) Yucatan current transports imply a higher (lower) LC extension into the GoM (Chang and Oey, 2012), but observational studies (Athié et al., 2015, 2020) show that is not always the case. Others find modifications in the LC behavior related to changes in the model stratification (Moreles et al., 2021) that might explain the observed decrease in the LCE detachment frequency. The model results are explained using the mechanism suggested by Pichevin and Nof (1997) based on a single-layer reduced gravity model. In contrast, observations (Athié et al., 2012; 2020; Sheinbaum et al., 2016; Hamilton et al., 2018) suggest a more complex behavior involving full-depth ocean processes, not only at the upper layer, and that there is not a simple and straightforward relation between LC transport and the detachment of LCEs.
4 Summary and conclusions
Historical data and a remarkable new data set presented here from observations of six XIXIMI cruises in the deep-water region of the GoM illustrate the spatial and temporal variability of oxygen concentrations ([O2]) in the GoM. These observations link the oxygen concentrations in the upper and lower thermocline waters with the detachment frequency and volumes of LCE water that enter the GoM from the Caribbean.
The time series obtained from six oceanographic cruises, from 2010 to 2019, show evidence that LCE detachments in the GoM introduce significant volumes of relatively oxygen-rich waters into the Gulf’s interior, thereby ventilating the thermocline waters of the basin. Observations from measurements after a high LCE activity period show a relatively well-ventilated thermocline, with oxygen values consistently above 2.8 mL L –1 in the upper thermocline. In contrast, measurements taken after periods of more than a year with no LCE detachment consistently show an important oxygen decrease of its thermocline waters.
Our analysis of AVISO altimetry data indicates that during the 2000–2010 decade, the average detachment frequency was one LCE approximately every 6 months with an average detached area of 110,000 km2 per year. By contrast, during the 2010–2020 decade, the average detachment frequency was one LCE approximately every 8 months with an average detached area of 80,000 km2 per year. Although the biggest LCEs were measured in 2015 and 2016, these did not compensate for the lower frequency of detachments. Interestingly, Lindo-Atichati et al. (2013) report an increase in eddy shedding during the 2000–2010 decade compared to the 1990–2000, so further studies are needed to establish if this negative trend will continue in the future.
Using the oxygen and altimetry measurements, a series of parameters were selected to formulate a simple box model, which, to first order, is able to reproduce gross features of the observed [O2] temporal variability in the GoM thermocline. Results from this simple model suggest that, on average, an LCE surface area of approximately 95,000 km2 per year is necessary to maintain the oxygen levels of the upper and lower thermocline constant within the GoM.
These results imply that if the observed trend during the past decade of decreasing LCE detachment frequency becomes a persistent trend and is not part of an interannual to decadal oscillation, it could lead to a deoxygenation trend in the GoM thermocline waters. The accessibility of altimetry data makes it relatively simple to monitor this behavior in the future to predict, qualitatively, the state of oxygen concentrations in the GoM thermocline waters. However, as we remarked several times, the purpose of the model is simply to test the idea that LCEs can be the main ventilation source of these waters and is perhaps too simple to make reliable quantitative estimates. Limitations and uncertainties in the model highlight the need to continue to gather more in situ data in the deep-water region of the GoM and develop or apply more comprehensive models. This could be achieved by deploying more BioARGO floats in the future and using available numerical models (Damien et al., 2018; Damien et al., 2021).
A possible link between the weakening of the AMOC and the deoxygenation trend of the thermocline waters of the GoM suggests important implications for the ecological web structure at these depths and its long-term sustainability. Although these trends and connections remain to be firmly established with future observations, the possible link between the AMOC, the flow through the Yucatan Channel, and the number of detached eddies opens up the possibility of using the altimetry observations as proxies with some useful information about the state of the AMOC and the GoM oxygen conditions.
Data availability statement
The datasets presented in this study can be found in online repositories. The names of the repository/repositories and accession number(s) can be found below: https://doi.org/10.5281/zenodo.7830465.
Author contributions
GQ: Conceptualization, Data curation, Formal analysis, Investigation, Methodology, Software, Visualization, Writing – original draft, Writing – review & editing. JH: Conceptualization, Data curation, Funding acquisition, Investigation, Methodology, Project administration, Resources, Supervision, Validation, Writing – review & editing. JS: Conceptualization, Formal analysis, Funding acquisition, Investigation, Methodology, Project administration, Resources, Supervision, Validation, Visualization, Writing – review & editing.
Funding
The author(s) declare financial support was received for the research, authorship, and/or publication of this article. This research has been funded by the Mexican National Council for Science and Technology CONAHCYT, project 201441. This is a contribution of the Gulf of Mexico Research Consortium (CIGoM). We acknowledge PEMEX specific request to the Hydrocarbon Fund to further the knowledge on the environmental effects of oil spills in the Gulf of Mexico. Partial support also obtained by CICESE’s discretionary funding.
Acknowledgments
We acknowledge Enric Pallàs, Pierre Damien, and Helmut Maske for the important feedback they provided. We mainly want to acknowledge Vicente Ferreira whose observations and understanding made this paper possible. Finally, thanks to CONACYT, CICESE, and CiGOM for their financial support and educational support.
Conflict of interest
The authors declare that the research was conducted in the absence of any commercial or financial relationships that could be construed as a potential conflict of interest.
Publisher’s note
All claims expressed in this article are solely those of the authors and do not necessarily represent those of their affiliated organizations, or those of the publisher, the editors and the reviewers. Any product that may be evaluated in this article, or claim that may be made by its manufacturer, is not guaranteed or endorsed by the publisher.
References
Andrews O., Buitenhuis E., Le Quéré C., Suntharalingam P. (2017). Biogeochemical modelling of dissolved oxygen in a changing ocean. Philos. T. R. Soc A. 375:20160328. doi: 10.1098/rsta.2016.0328
PubMed Abstract | PubMed Abstract | Crossref Full Text | Google Scholar
Athié G., Candela J., Ochoa J., Sheinbaum J. (2012). Impact of Caribbean cyclones on the detachment of Loop Current anticyclones. J. Geophys. Res–Oceans 117, C3018. doi: 10.1029/2011JC007090
Athié G., Sheinbaum J., Candela J., Ochoa J., Pérez-Brunius P., Romero-Arteaga A. (2020). Seasonal variability of the transport through the Yucatan Channel from observations. J. Phys. Oceanogr 50, 343–360. doi: 10.1175/JPO-D-18-0269.1
Athié G., Sheinbaum J., Leben R., Ochoa J., Shannon M. R., Candela J. (2015). Interannual variability in the Yucatan Channel flow. Geophys. Res. Lett. 42, 1496–1503. doi: 10.1002/2014GL062674
Billheimer S. J., Talley L. D., Martz T. R. (2021). Oxygen seasonality, utilization rate, and impacts of vertical mixing in the Eighteen Degree Water region of the Sargasso Sea as observed by profiling biogeochemical floats. Global Biogeochem. Cy. 35, e2020GB006824. doi: 10.1029/2020GB006824
Brandt P., Bange H. W., Banyte D., Dengler M., Didwischus S.–H., Fischer T., et al. (2015). On the role of circulation and mixing in the ventilation of oxygen minimum zones with a focus on the eastern tropical North Atlantic. Biogeosciences 12, 489–512. doi: 10.5194/bg–12–489–2015
Bushinsky S. M., Emerson S. R., Riser S. C., Swift D. D. (2016). Accurate oxygen measurements on modified Argo floats using in situ air calibrations. Limnol. Oceanogr-Meth 14, 491–505. doi: 10.1002/lom3.101076
Caesar L., Rahmstorf S., Robinson A., Feulner G., Saba V. (2018). Observed fingerprint of a weakening Atlantic Ocean overturning circulation. Nature 556, 191–196. doi: 10.1038/s41586–018–0006–5
PubMed Abstract | PubMed Abstract | Crossref Full Text | Google Scholar
Carrillo L., Johns E. M., Smith R. H., Lamkin J. T., Largier J. L. (2016). Pathways and hydrography in the Mesoamerican Barrier Reef System Part 2: Water masses and thermohaline structure. Cont. Shelf. Res. 120, 41–58. doi: 10.1016/j.csr.2016.03.014
Chang Y. L., Oey L. Y. (2012). Why does the Loop Current tend to shed more eddies in summer and winter? Geophys. Res. Lett. 39. doi: 10.1029/2011GL050773
Chen C., Wang G., Xie S. P., Liu W. (2019). Why does global warming weaken the Gulf Stream but intensify the Kuroshio? J. Climate 32, 7437–7451. doi: 10.1175/JCLI-D-18-0895.1
Contreras-Pacheco Y. V., Herzka S. Z., Vallejo-Espinosa G., Herguera J. C. (2023). Particulate organic carbon in the deep-water region of the Gulf of Mexico. Front. Mar. Sci. 10. doi: 10.3389/fmars.2023.1095212
Damien P., Pasqueron de Fommervault O., Sheinbaum J., Jouanno J., Camacho-Ibar V. F., Duteil O. (2018). Partitioning of the open waters of the Gulf of Mexico based on the seasonal and interannual variability of chlorophyll concentration. J. Geophys. Res–Oceans. 123, 2592–2614. doi: 10.1002/2017JC013456
Damien P., Sheinbaum J., Pasqueron de Fommervault O., Jouanno J., Linacre L., Duteil O. (2021). Do Loop Current eddies stimulate productivity in the Gulf of Mexico? Biogeosciences 18, 4281–4303. doi: 10.5194/bg-18-4281-2021
Deutsch C., Emerson S., Thompson L. (2006). Physical-biological interactions in North Pacific oxygen variability. J. Geophys. Res. 111, C09S90. doi: 10.1029/2005JC003179
Elliott B. A. (1982). Anticyclonic rings in the gulf of Mexico. J. Phys. Oceanogr. 12, 1292–1309. doi: 10.1175/1520-0485(1982)012<1292:ARITGO>2.0.CO;2
Falkowski P. G., Algeo T., Codispoti L., Deutsch C., Emerson S., Hales B., et al. (2011). Ocean deoxygenation: past, present, and future. Eos Trans. Am. Geophys. Union 92, 409–410. doi: 10.1029/2011EO460001
Furuya K., Harada K. (1995). An automated precise Winkler titration for determining dissolved oxygen on board ship. J. Oceanogr. 51, 375–383. doi: 10.1007/BF02285173
Gruber N., Doney S. C., Emerson S. R., Gilbert D., Kobayashi T., Körtzinger A., et al. (2010). “Adding oxygen to ARGO: developing a global in situ observatory for ocean deoxygenation and biogeochemistry,” in Proceedings of Oceanobs’09: Sustained Ocean Observations and Information for Society, Venice, Italy, 21–25 September 2009. 21–25. doi: 10.5270/OceanObs09.cwp.39
Hahn J., Brandt P., Schmidtko S., Krahmann G. (2017). Decadal oxygen change in the eastern tropical North Atlantic. Ocean Sci. 13, 551–576. doi: 10.5194/os-13-551-2017
Hall C. A., Leben R. R. (2016). Observational evidence of seasonality in the timing of loop current eddy separation. Dynam. Atmos. Oceans 76, 240–267. doi: 10.1016/j.dynatmoce.2016.06.002
Hamilton P., Leben R., Bower A., Furey H., Pérez–Brunius P. (2018). Hydrography of the Gulf of Mexico using autonomous floats. J. Phys. Oceanogr. 48, 773–794. doi: 10.1175/JPO–D–17–0205.1
Hurlburt H. E., Thompson J. D. (1980). A numerical study of Loop Current intrusions and eddy shedding. J. Phys. Oceanogr. 10, 1611–1651. doi: 10.1175/1520-0485(1980)010<1611:ANSOLC>2.0.CO;2
Jenkins W. J. (1982). Oxygen utilization rates in North Atlantic subtropical gyre and primary production in oligotrophic systems. Nature 300, 246–248. doi: 10.1038/300246a0
Jochens A. E., Bender L. C., DiMarco S. F., Morse J. W., Kennicutt M. C. II, Howard M. K., et al. (2005). Understanding the Processes that Maintain the Oxygen Levels in the Deep Gulf of MEXICO: Synthesis Report (New Orleans, LA: U.S. Department of the Interior, Minerals Management Service, Gulf of Mexico OCS Region), 142. OCS Study MMS 2005–032.
Jochens A. E., DiMarco S. F. (2008). Physical oceanographic conditions in the deepwater Gulf of Mexico in summer 2000–2002. Deep–Sea Res. Pt. II 55, 2541–2554. doi: 10.1016/j.dsr2.2008.07.003
Kinard W. F., Atwood D. K., Giese G. S. (1974). Dissolved oxygen as evidence for 18 C Sargasso Sea Water in the eastern Caribbean Sea. Deep Sea Res. Oceanogr. Abstr. 21, 79–82. doi: 10.1016/0011–7471(74)90021–7
Kwon Y. O., Riser S. C. (2004). North Atlantic subtropical mode water: A history of ocean–atmosphere interaction 1961–2000. Geophys. Res. Lett. 31, L19307. doi: 10.1029/2004GL021116
Leben R. R. (2005). Altimeter–derived loop current metrics. Geoph. Monog. Ser. 161, 181–201. doi: 10.1029/161GM15
Levin L. A. (2018). Manifestation, drivers, and emergence of open ocean deoxygenation. Annu. Rev. Mar. Sci. 10, 229–260. doi: 10.1146/annurev–marine–121916–063359
PubMed Abstract | PubMed Abstract | Crossref Full Text | Google Scholar
Li G., Wang Z., Wang B. (2022). Multidecade trends of sea surface temperature, chlorophyll-a concentration, and ocean eddies in the gulf of Mexico. Remote Sens. 14, 3754. doi: 10.3390/rs14153754
Lindo-Atichati D., Bringas F., Goni G. (2013). Loop Current excursions and ring detachments during 1993–2009. Int. J. Remote Sens. 34, 5042–5053. doi: 10.1080/01431161.2013.787504
Liu Y., Lee S.-K., Muhling B. A., Lamkin J. T., Enfield D. B. (2012). Significant reduction of the Loop Current in the 21st century and its impact on the Gulf of Mexico. J. Geophys. Res–Oceans. 117, C05039. doi: 10.1029/2011JC007555
Maul G. A. (1977). “The annual cycle of the Gulf Loop Current Part I: Observations during a one–year time series,” in Collected reprints, Atlantic Oceanographic and Meteorological Laboratories, vol. 1. (U.S. Department of Commerce, National Oceanic and Atmospheric Administration, Environmental Research Laboratories, Boulder, Colorado), 398–416.
Maul G. A. (1980). “The 1972–1973 cycle op the Golf Loop Current Part II: mass and salt balances of the basin,” in Collected reprints, Atlantic Oceanographic and Meteorological Laboratories (U.S. Department of Commerce, National Oceanic and Atmospheric Administration, Environmental Research Laboratories, Boulder, Colorado), 358–380.
McDougall T. J., Barker P. M. (2011). Getting started with TEOS–10 and the Gibbs Seawater (GSW) oceanographic toolbox, SCOR/IAPSO WG127. 28.
McGillicuddy D. J. Jr., Robinson A. R., Siegel D. A., Jannasch H. W., Johnson R., Dickey T. D., et al. (1998). Influence of mesoscale eddies on new production in the Sargasso Sea. Nature 394, 263–266. doi: 10.1038/28367
Meunier T., Pallás-Sanz E., Tenreiro M., Portela E., Ochoa J., Ruiz-Angulo A., et al. (2018). The vertical structure of a Loop Current Eddy. J. Geophys. Res–Oceans 123, 6070–6090. doi: 10.1029/2018JC013801
Meunier T., Pérez-Brunius P., Bower A. (2022). Reconstructing the three-dimensional structure of loop current rings from satellite altimetry and in situ data using the gravest empirical modes method. Remote Sens. 14, 4174. doi: 10.3390/rs14174174
Meunier T., Sheinbaum J., Pallàs-Sanz E., Tenreiro M., Ochoa J., Ruiz-Angulo A., et al. (2020). Heat content anomaly and decay of warm-core rings: The case of the Gulf of Mexico. Geophys. Res. Lett. 47, e2019GL085600. doi: 10.1029/2019GL085600
Moreles E., Zavala-Hidalgo J., Martínez-López B., Ruiz-Angulo A. (2021). Influence of stratification and Yucatan Current transport on the Loop Current Eddy shedding process. J. Geophys. Res–Oceans 126, e2020JC016315. doi: 10.1029/2020JC016315
Morrison J. M., Merrell W. J. Jr., Key R. M., Key T. C. (1983). Property distributions and deep chemical measurements within the western Gulf of Mexico. J. Geophys. Res-Oceans 88, 2601–2608. doi: 10.1029/JC088iC04p02601
Morrison J. M., Nowlin W. D. Jr. (1977). Repeated nutrient, oxygen, and density sections through the Loop Current. J. Mar. Res. 35, 105–128.
Morrison A. K., Waugh D. W., Hogg A. M., Jones D. C., Abernathey R. P. (2022). Ventilation of the southern ocean pycnocline. Annu. Rev. Mar. Sci. 14, 405–430. doi: 10.1146/annurev-marine-010419-011012
PubMed Abstract | PubMed Abstract | Crossref Full Text | Google Scholar
Oschlies A., Brandt P., Stramma L., Schmidtko S. (2018). Drivers and mechanisms of ocean deoxygenation. Nat. Geosci. 11, 467–473. doi: 10.1038/s41561-018-0152-2
Pichevin T., Nof D. (1997). The eddy cannon. Ocean. Lit. Rev. 5, 415. doi: 10.1016/S0967-0637(96)00064-7
Pitcher G. C., Aguirre–Velarde A., Breitburg D., Cardich J., Carstensen J., Conley D. J., et al. (2021). System controls of coastal and open ocean oxygen depletion. Prog. Oceanogr. 197, 102613. doi: 10.1016/j.pocean.2021.102613
Portela E., Kolodziejczyk N., Vic C., Thierry V. (2020). Physical mechanisms driving oxygen subduction in the global ocean. Geophys. Res. Lett. 47. doi: 10.1029/2020GL089040
Portela E., Tenreiro M., Pallàs-Sanz E., Meunier T., Ruiz-Angulo A., Sosa-Gutiérrez R., et al. (2018). Hydrography of the central and western Gulf of Mexico. J. Geophys. Res–Oceans 123, 5134–5149. doi: 10.1029/2018JC013813
Rabalais N. N., Turner R. E., Wiseman W. J. Jr. (2002). Gulf of Mexico hypoxia, aka “The dead zone. Annu. Rev. Ecol. Syst. 33, 235–263. doi: 10.1146/annurev.ecolsys.33.010802.150513
Rahmstorf S., Box J. E., Feulner G., Mann M. E., Robinson A., Rutherford S., et al. (2015). Exceptional twentieth-century slowdown in Atlantic Ocean overturning circulation. Nat. Clim. Change 5, 475–480. doi: 10.1038/NCLIMATE2554
Rhein M., Kieke D., Huttl-Kabus S., Roessler A., Mertens C., Meissner R., et al. (2011). Deep water formation, the subpolar gyre, and the meridional overturning circulation in the subpolar North Atlantic. Deep-Sea Res. 58, 1819–1832. doi: 10.1016/j.dsr2.2010.10.061
Rivas D., Badan A., Ochoa J. (2005). The ventilation of the deep Gulf of Mexico. J. Phys. Oceanogr. 35, 1763–1781. doi: 10.1175/JPO2786.1
Robbins P. E., Price J. F., Owens W. B., Jenkins W. J. (2000). The importance of lateral diffusion for the ventilation of the lower thermocline in the subtropical North Atlantic. J. Phys. Oceanogr. 30, 67–89. doi: 10.1175/1520-0485(2000)030<0067:TIOLDF>2.0.CO;2
Sheinbaum J., Athié G., Candela J., Ochoa J., Romero-Arteaga A. (2016). Structure and variability of the Yucatan and loop currents along the slope and shelf break of the Yucatan channel and Campeche bank. Dynam. Atmos. Oceans 76, 217–239. doi: 10.1016/j.dynatmoce.2016.08.001
Smeed D. A., Josey S. A., Beaulieu C., Johns W. E., Moat B. I., Frajka-Williams E., et al. (2018). The North Atlantic Ocean is in a state of reduced overturning. Geophys. Res. Lett. 45, 1527–1533. doi: 10.1002/2017GL076350
Stramma L., Schmidtko S., Levin L. A., Johnson G. C. (2010). Ocean oxygen minima expansions and their biological impacts. Deep-Sea Res. Pt. I. 57, 587–595. doi: 10.1016/j.dsr.2010.01.005
Sturges W., Hoffmann N. G., Leben R. R. (2010). A trigger mechanism for Loop Current ring separations. J. Phys. Oceanogr. 40, 900–913. doi: 10.1175/2009JPO4245.1
Takeshita Y., Martz T. R., Johnson K. S., Plant J. N., Gilbert D., Riser S. C., et al. (2013). A climatology-based quality control procedure for profiling float oxygen data. J. Geophys. Res–Oceans. 118, 5640–5650. doi: 10.1002/jgrc.20399
Uchida H., Kawano T., Kaneko I., Fukasawa M. (2008). In situ calibration of optode-based oxygen sensors. J. Atmos. Ocean. Technol. 25, 2271–2281. doi: 10.1175/2008JTECHO549.1
Van Der Boog C. G., de Jong M. F., Scheidat M., Leopold M. F., Geelhoed S. C. V., Schulz K., et al. (2019). Hydrographic and biological survey of a surface-intensified anticyclonic Eddy in the Caribbean Sea. J. Geophys. Res–Oceans 124, 6235–6251. doi: 10.1029/2018JC014877
Vukovich F. M. (2012). Changes in the Loop Current's Eddy shedding in the period 2001–2010. Int. J. Oceanogr. 18. doi: 10.1155/2012/439042
Keywords: Gulf of Mexico, Thermocline ventilation, Dissolved Oxygen, Loop Current eddies, deoxygenation
Citation: Quintanilla JG, Herguera JC and Sheinbaum J (2024) Oxygenation of the Gulf of Mexico thermocline linked to the detachment of Loop Current eddies. Front. Mar. Sci. 11:1479837. doi: 10.3389/fmars.2024.1479837
Received: 12 August 2024; Accepted: 25 October 2024;
Published: 18 December 2024.
Edited by:
Martin F. Soto-Jimenez, National Autonomous University of Mexico, MexicoReviewed by:
David Alberto Salas Salas De León, National Autonomous University of Mexico, MexicoParvathi Vallivattathillam, New York University Abu Dhabi, United Arab Emirates
Copyright © 2024 Quintanilla, Herguera and Sheinbaum. This is an open-access article distributed under the terms of the Creative Commons Attribution License (CC BY). The use, distribution or reproduction in other forums is permitted, provided the original author(s) and the copyright owner(s) are credited and that the original publication in this journal is cited, in accordance with accepted academic practice. No use, distribution or reproduction is permitted which does not comply with these terms.
*Correspondence: Jose Gerardo Quintanilla, anF1aW50YW5AY2ljZXNlLmVkdS5teA==
 Jose Gerardo Quintanilla
 Juan Carlos Herguera
 Julio Sheinbaum