- 1Civil Engineering Department, K. N. Toosi University of Technology, Tehran, Iran
- 2Engineering Cluster, Singapore Institute of Technology, Singapore, Singapore
- 3Institute of Geophysics, University of Tehran, Tehran, Iran
Sediments containing more than 10% clay particles by mass can exhibit cohesive properties. Cohesive sediments are commonly found in coastal areas worldwide, including the southern shore of the Caspian Sea and the northern/northwestern beaches of the Persian Gulf. These cohesive sediments can form a layer of soft to extremely soft mud, known as fluid mud, covering the seabed. The study examined the properties of natural mud samples collected from different depths and locations within three Iranian ports: Anzali Port (Caspian Sea), and Khorramshahr and Bushehr Ports (Persian Gulf). The laboratory analyses included determining the sediment grain-size distribution, density, carbonate content, organic matter content, and rheological properties at different water content ratios. Disregarding the impact of variations in organic matter and carbonate contents in the samples, water content ratio was the main factor affecting the rheological properties of sediments.
1 Introduction
Coastlines covered with cohesive sediments frequently encounter a range of design, building, and operational difficulties. Ensuring proper management of sedimentation and siltation is crucial for maintaining sufficient depth in ports and access channels. A comprehensive understanding of the characteristics and behavior of cohesive sediments is essential to determine the nautical depth for effective port management in maritime environments, dredging activities, and maintenance of navigational channels.
Cohesive sediments, commonly known as mud, generally include different proportions of clay, silt, super fine sand, and organic matter. Organic matter can exist in two states: suspended in the water phase, either in its pure form or in conjunction with fine mineral particles that are still suspended; or bonded to sediment that has already settled (Shakeel et al., 2022). The presence of clay-organic flocs in mud leads to complex rheological behavior, which includes shear thinning, viscoelasticity, thixotropic behavior, and yielding processes (Van Kessel and Blom, 1998; Shakeel et al., 2020a). Mud samples with higher organic matter content exhibit increased rheological properties, such as yield stresses, moduli, and thixotropy. This phenomenon can be caused by the development of more robust and numerous aggregates of clay and organic matter (Shakeel et al., 2019).
Fluid mud is a common form of sediment that consists of fine-grained particles that are often stuck together. It typically accumulates at the seabed of the shipping channel, while the sedimentation rate exceeds the consolidation rate (Winterwerp and van Kesteren, 2004). The settling process is significantly impeded by the close proximity of sediment grains and flocs; however, the connection between these aggregates is insufficient to impede their potential flow (Mcanally et al., 2007). It is in a semi-fluid state and considered as a non-Newtonian fluid that has effects on navigation, sedimentation, and the movement of contaminants by currents and waves. Typically, fluid mud is described as a mixture with a density that ranges between 1030 and 1300 kg/m3, and in which flocs significantly impede settling (Whitehouse et al., 2000; Mcanally et al., 2007). It is well known that fluid mud in navigation channels causes substantial restriction for vessels with a draft exceeding the water depth (Mehta et al., 2014). The rheological characteristics of fluid mud are essential for the navigation of waterways and ports, as well as for the maintenance of dredging channels (Parker and Kirby, 1982; Kirichek et al., 2018).
Nautical depth is defined as the navigable depth in muddy beds. It is the vertical distance between the water surface and a specific rheological parameter of a suspension, often the density of the suspension, ranging from 1,100 to 1,300 kg/m3. This distance ensures safe navigation for vessels, and in regions with fluid mud, it could be deeper or less than the depth indicated by acoustic fathometers (PIANC, 2008). By employing the nautical bottom method, the necessity for extensive dredging can be substantially decreased, leading to a reduction in the expenses associated with port operations. This methodology comprises two fundamental configurations: the Passive and the Active Nautical Depth techniques (Kirby et al., 2008).
Passive nautical depth describes a method of surveying the depth of water in a nautical environment. It entails determining a specific rheological characteristic in a naturally occurring mixture of fluid and mud. This value indicates the level at which it is safe for a vessel to navigate. In the majority of situations, the selected rheological parameter has been the bulk density, typically within the range of 1100 to 1300 kg/m³ (National Research Council (NRC), 1983). On the other hand, active nautical depth refers to the process of changing the physical, chemical, and biological aspects of fluid mud in order to significantly delay its settling and ensure navigability (McAnally et al., 2016). A more recent solution, the active nautical depth method employs purposely stirring of mud to produce a stable and aerobic suspension with a low density, thereby impeding its consolidation into a sediment bed (Wurpts, 2005; Kirby et al., 2008). Active nautical method has been carried out in the Ports of Emden and Bremerhaven, Germany, and Delfzijl, Netherlands. It involves mechanically shredding the floc structure of the suspension and oxygenating it to encourage the growth of aerobic bacteria. These bacteria naturally prevent rapid consolidation and may also help break down certain harmful contaminants (Greiser, 2007; Meinsma and Wiertsema & Partners, 2012).
The present study investigated critical sediment properties and parameters at some commercial ports in Iran, in order to examine the application of the passive nautical depth. Sediment samples from Anzali Port in the Caspian Sea, and Khorramshahr and Bushehr Ports in the Persian Gulf were collected, and comprehensive laboratory experiments were conducted to study the navigability through the mud layers.
2 Rheology
Rheology is a scientific field that studies how materials change shape when external forces are applied to them, and it mostly focuses on fluids and semi-fluids. Rheometry involves the assessment, analysis, and description of changes in shape and movement in fluids and partially semi-solid substances when exposed to shear stress. Understanding the rheological characteristics of cohesive sediments is crucial, as it involves examining the sediment’s viscosity, shear strength, and other properties that influence its movement and behavior in various settings. The rheological properties of sediment samples are influenced by a variety of factors, including water content ratio, concentration, temperature, organic matter content, grain size and distribution, and clay mineral type.
In engineering, both oscillatory and constant loading conditions are crucial for structural design and performance. Oscillatory loading involves time-varying forces, such as waves and vibrations, which can lead to dynamic effects like resonance and fatigue, requiring dynamic analysis. Conversely, constant loading involves steady forces, necessitating static analysis for stability and load distribution. Specifically, when waves interact with soft muddy seabeds, wave energy dissipation occurs due to the viscous properties of the mud, which also influences mass transport within the fluid mud layer (e.g., Sakakiyama and Bijker, 1989; Soltanpour et al., 2018).
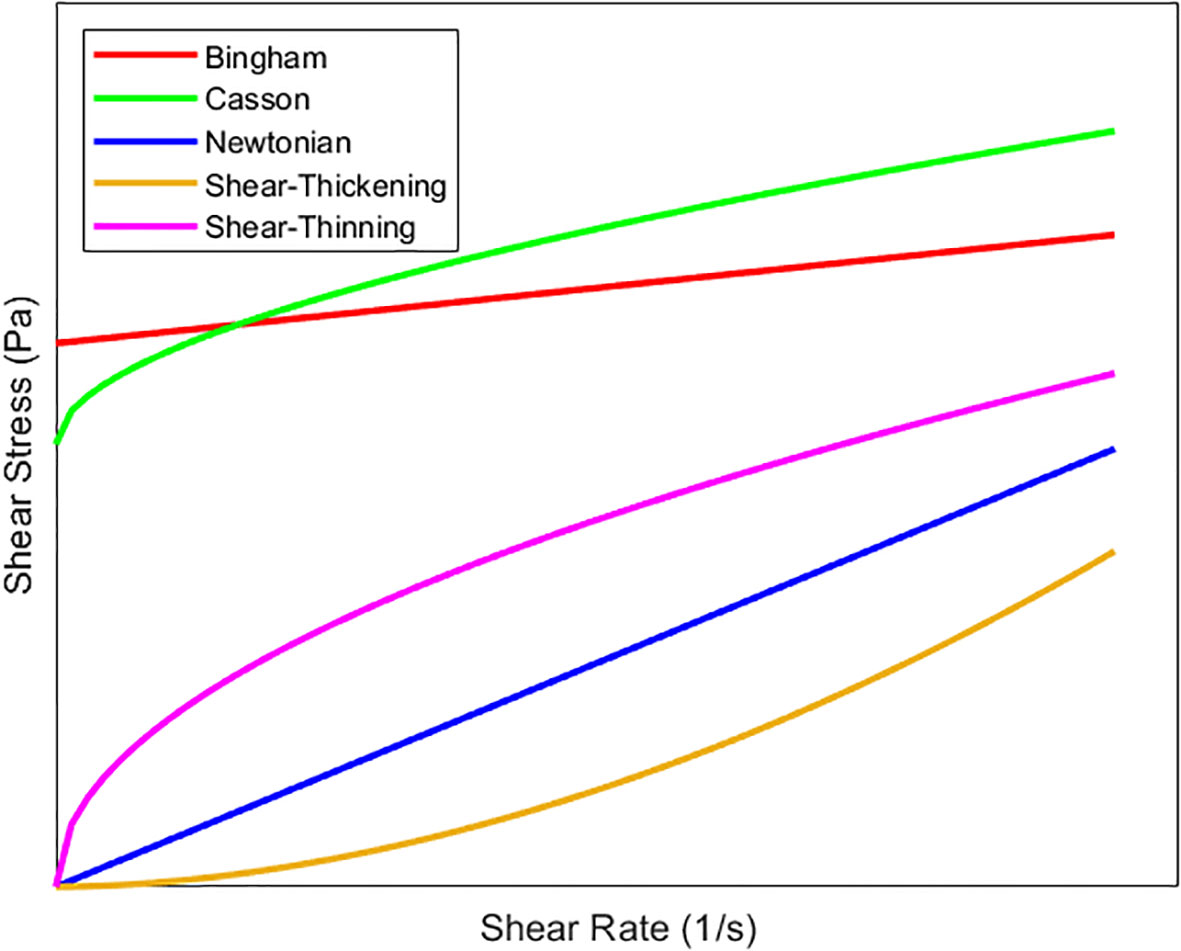
The study of this phenomenon can be conducted using rotational and oscillatory modes. Viscometers operate exclusively by rotational motion and perform static tests, whereas rheometers perform both static tests (rotational) and dynamic testing (oscillatory) (Samsami et al., 2022). The methodology employed in conducting rheometry is illustrated in Figure 1. Static experiments require systematically applying gradually varying changes in stress (or strain) and evaluating the resulting variations in strain (or stress). A schematic diagram of the rheological models is shown in the Figure 2. The Casson model provides an appropriate fit for certain sets of data due to its potential to consider nonlinear behavior in material flow. The findings indicate that nonlinear models have a higher compatibility with data that is relevant to soft muds. The Casson model utilizes curve fitting by employing the square root function, which is represented as follows:
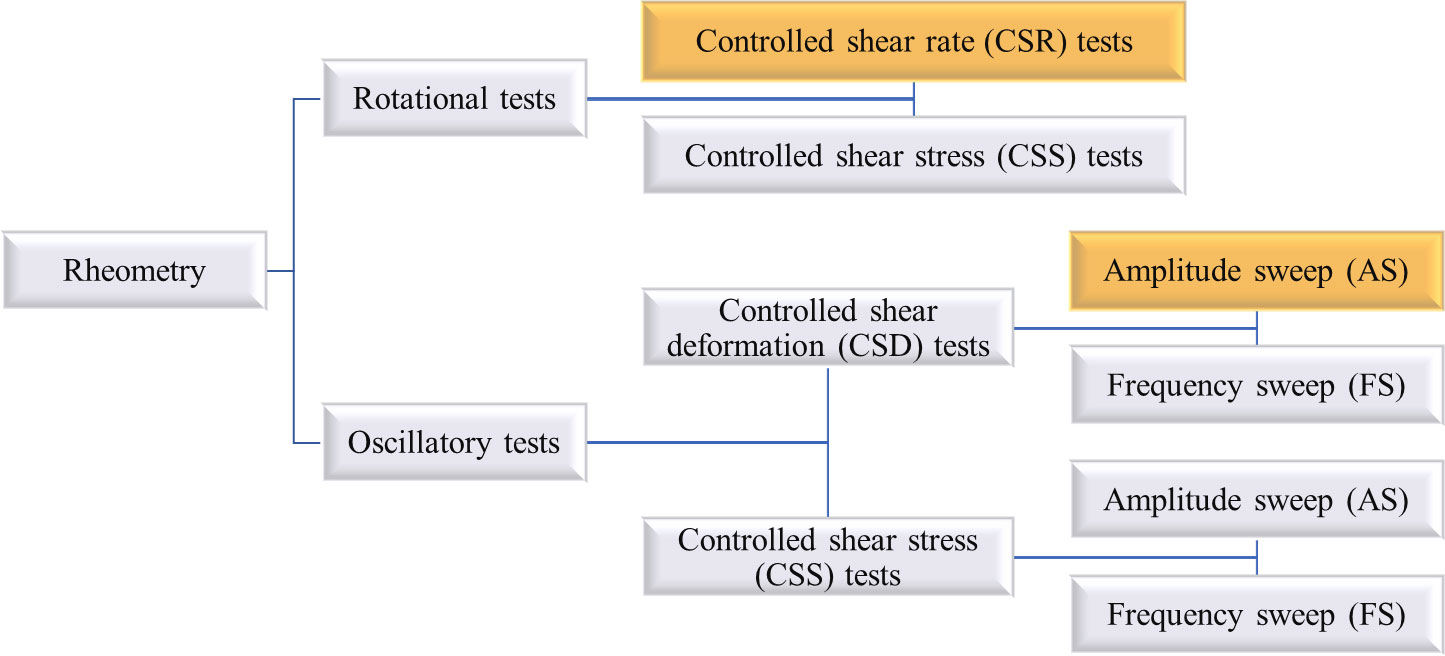
Figure 1. Methods of rheometry (highlighted boxes denote the experiments performed in this study) (Samsami et al., 2022).
where the variables τyc and ηc represent the Casson yield point and Casson viscosity, respectively (Mezger, 2014).
The determination of sediment density and concentration, in addition to water content, is essential for studying changes in the rheological characteristics of sediment samples. Density , solid fraction volume (=C/), and concentration C have the following connection:
where the densities of water and sediment grains, respectively, are denoted by and .
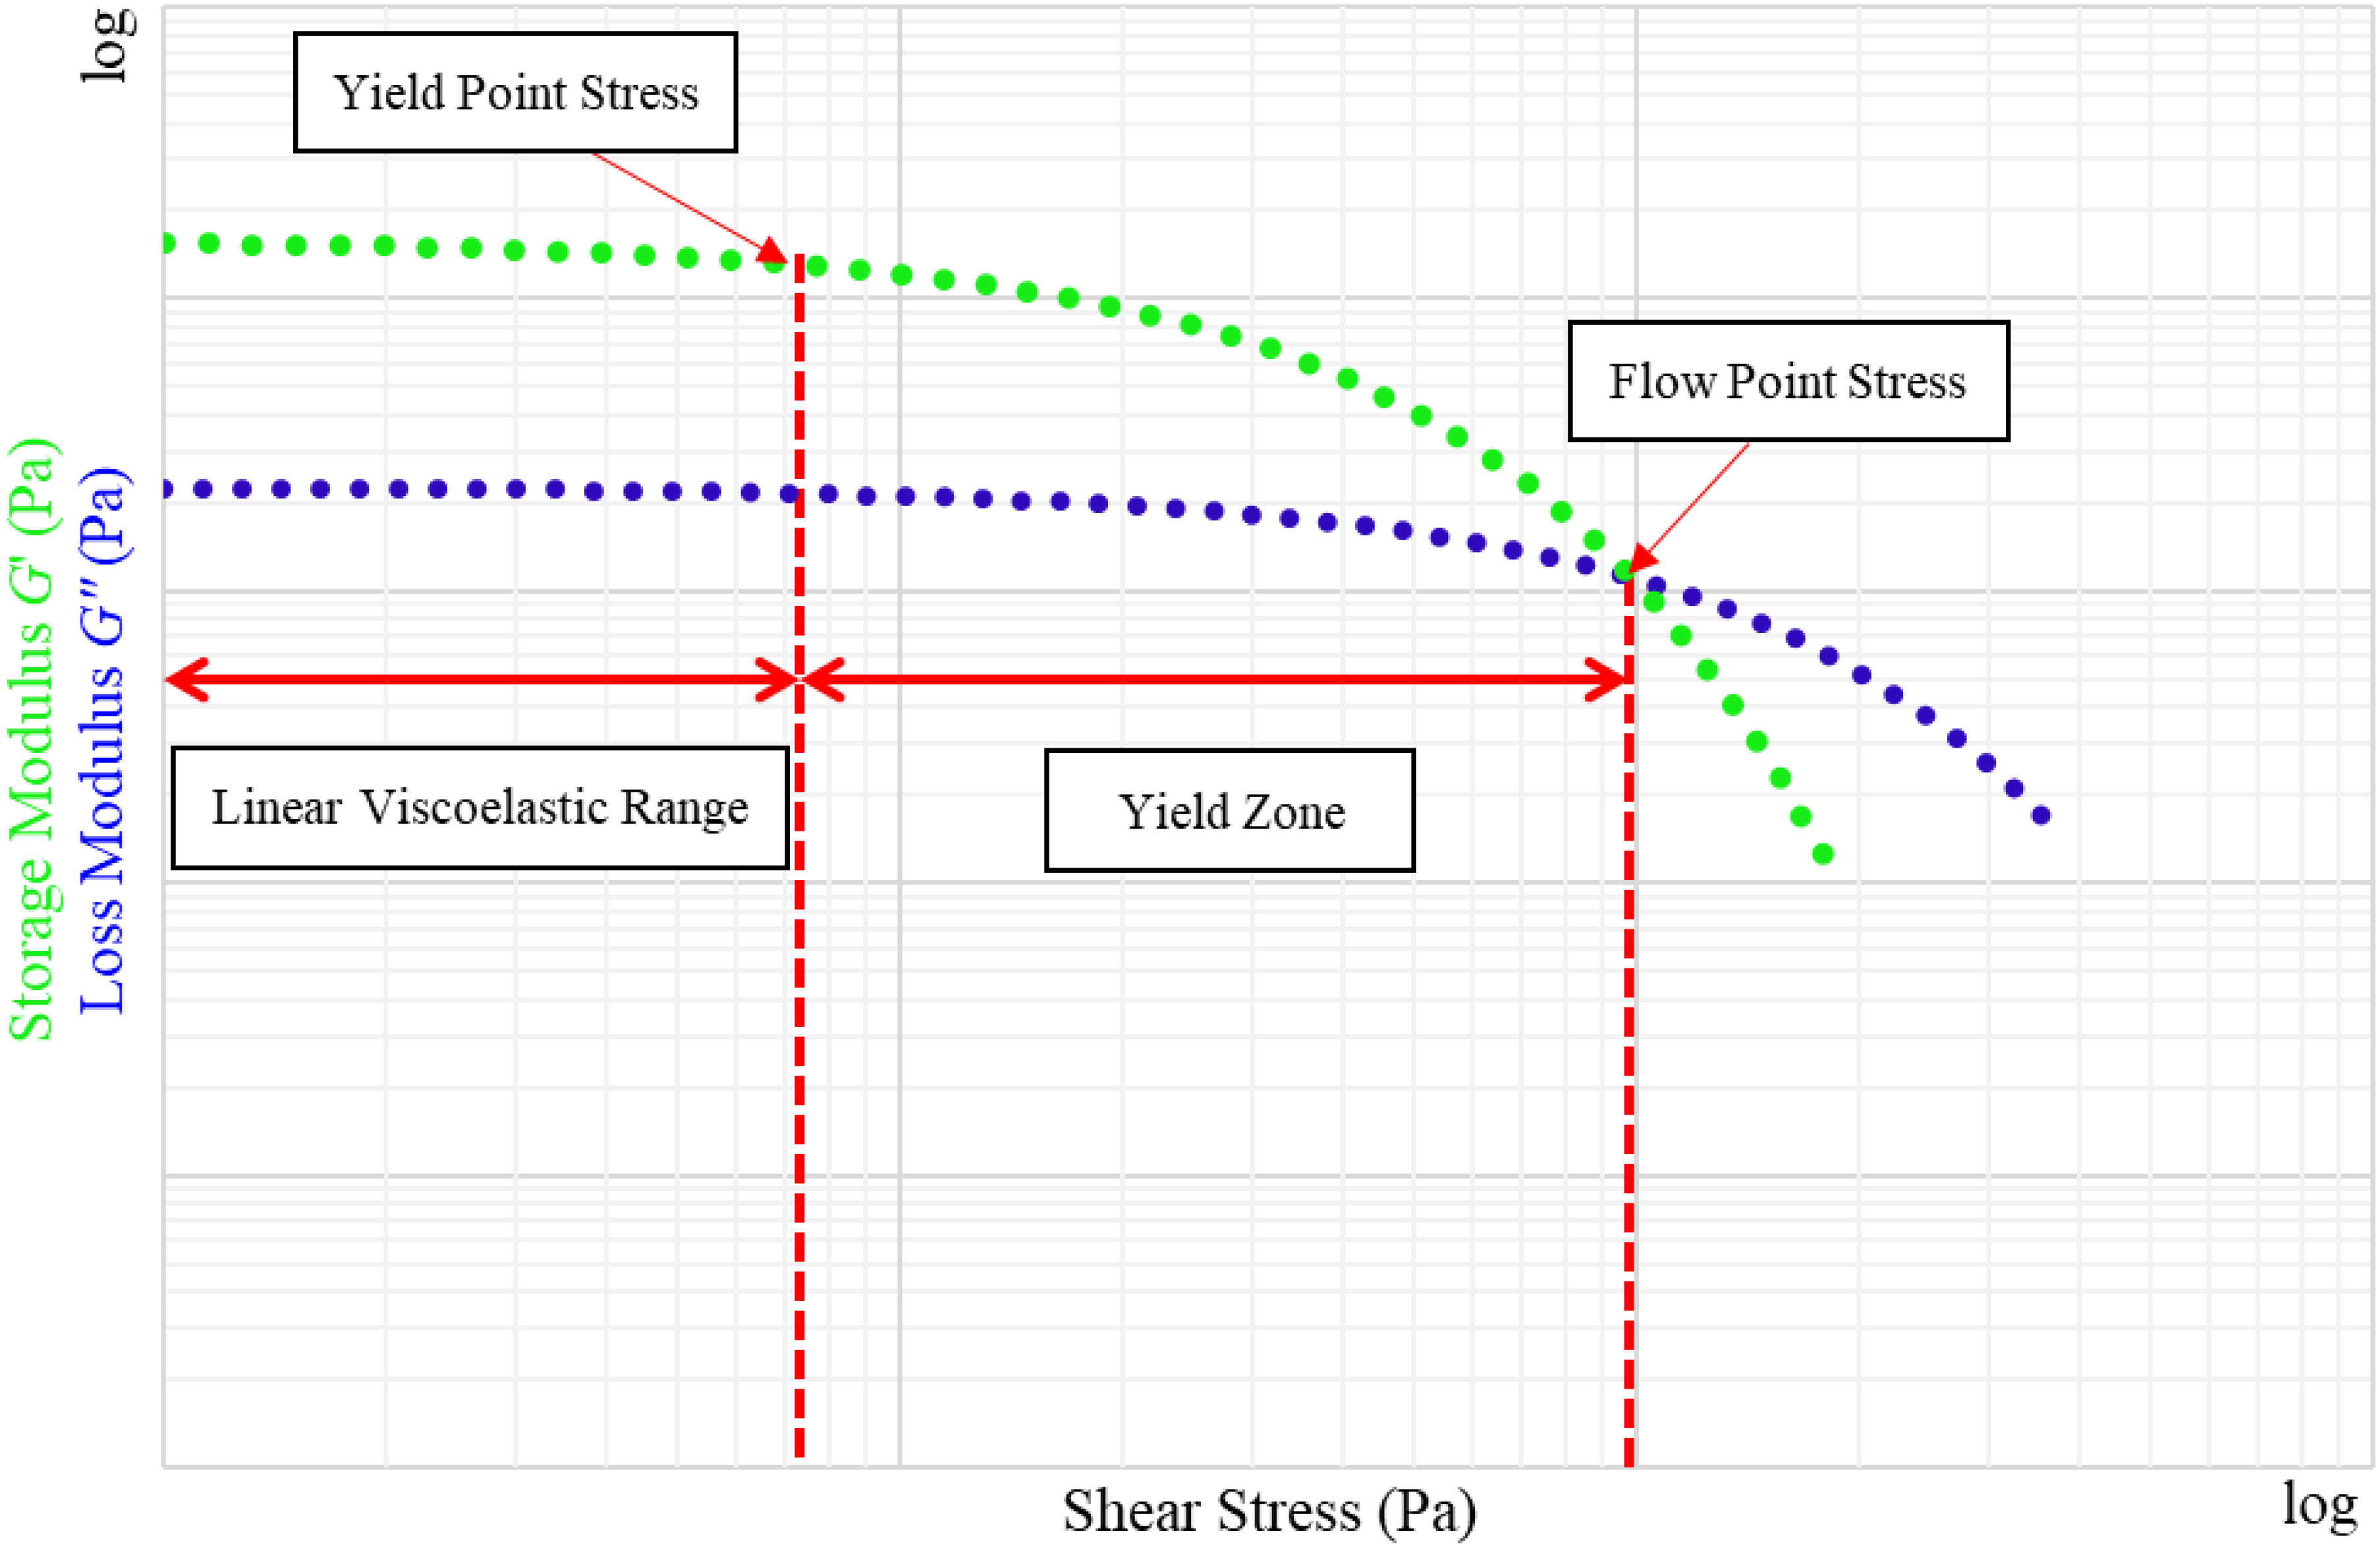
On the other hand, dynamic tests involve repeatedly and continuously subjecting materials to stress or strain. The apparent yield stress refers to the shear stress needed to induce flow in a fluid or the yield stress in a semi-solid substance. Figure 3 shows the determination of yield and flow point stresses using the oscillatory rheological testing. Controlled shear rate or deformation (CSR–CSD) and controlled shear stress rate (CSS) are two processes that can be carried out in both rotational and oscillatory tests.
Soltanpour and Samsami (2011) studied the rheological properties of kaolinite clay and Hendijan mud from the northwest region of the Persian Gulf. They utilized both rotary and oscillatory experiments to compare these materials. Their findings demonstrated a significant correlation between the rheological parameters and the water content ratio of the samples (Soltanpour and Samsami, 2011). Xu and Huhe (2016) investigated the rheological properties of estuary mud at Lianyungang, China using steady and dynamic rheological methods. As the volume fraction of solids increased, they discovered that the yield stress of their mud samples increased exponentially (Xu and Huhe, 2016). Yang et al. (2014) analyzed the rheological properties of cohesive sediments obtained from three specific locations in China: the Yangtze River, the shoal of Hangzhou Bay, and Yangcheng Lake. They identified three distinct deformation patterns in the sediment flow curves (Yang et al., 2014). Shakeel et al. (2020) investigated the rheological properties of mud samples obtained from various sites and depths inside the Port of Hamburg, Germany. Through further examination, it was discovered that the mud samples taken at the water or bed interface exhibited a two-step yielding phenomenon (Shakeel et al., 2020a; Shakeel et al., 2020b). Some researchers have also reported the two-step yielding of mud samples (Mehta et al., 2014; Nie et al., 2020; Shakeel et al., 2021). The first stage of yield, known as static yield, is observed at very low shear rates of approximately 0.01 s−1 and is linked to the breakdown of the sample’s structure in massive flocs or clusters. The second phase of yield, known as fluidic yield, appears at shear rates of 10 s−1 and is correlated with a complete breakdown of the structure.
3 Study area
The present study selected three commercial ports located in the muddy environments of northern and southern Iran - Anzali Port in the Caspian Sea, and Khorramshahr and Bushehr Ports in the Persian Gulf - to assess the applicability of the nautical bottom method in managing sedimentation problems.
3.1 Anzali Port
Anzali Port is located in the northern region of Gilan Province, Iran. This port is situated 40 km northwest of the city of Rasht, in the central part of Anzali city, between the Caspian Sea and the Anzali Lagoon (Figure 4). The construction of the Ghazian and Anzali Breakwaters, measuring 750 m and 520 m in length, commenced in 1895, and the construction project was completed in 1914. The studies for the development plan of the new port basin started in 2008. The final development design featured a ship with a Deadweight Tonnage (DWT) of 12,000 tons, a channel width of 145 m, and a basin depth of 10.5 m. The building of new breakwaters in the port was finalized in 2017, with the western breakwater extending 1570 m and the eastern breakwater extending 1600 m in length. The eastern basin holds 26 hectares of land, while the western basin encompasses an area of 3.5 hectares. Prior to the construction of the Anzali Port’s breakwaters and the development plan, both marine and river sediments had a considerable impact on sedimentation in the port basin. The advancement of the new breakwaters to greater depths has prevented bypassing and sand sedimentation at the entrance, and it is anticipated that now the major sedimentation is caused by the rivers. The average annual fine sediment deposition after the development of the port is estimated to be 290,000 m3 (Khakbaft Consulting Engineers, 2021a).
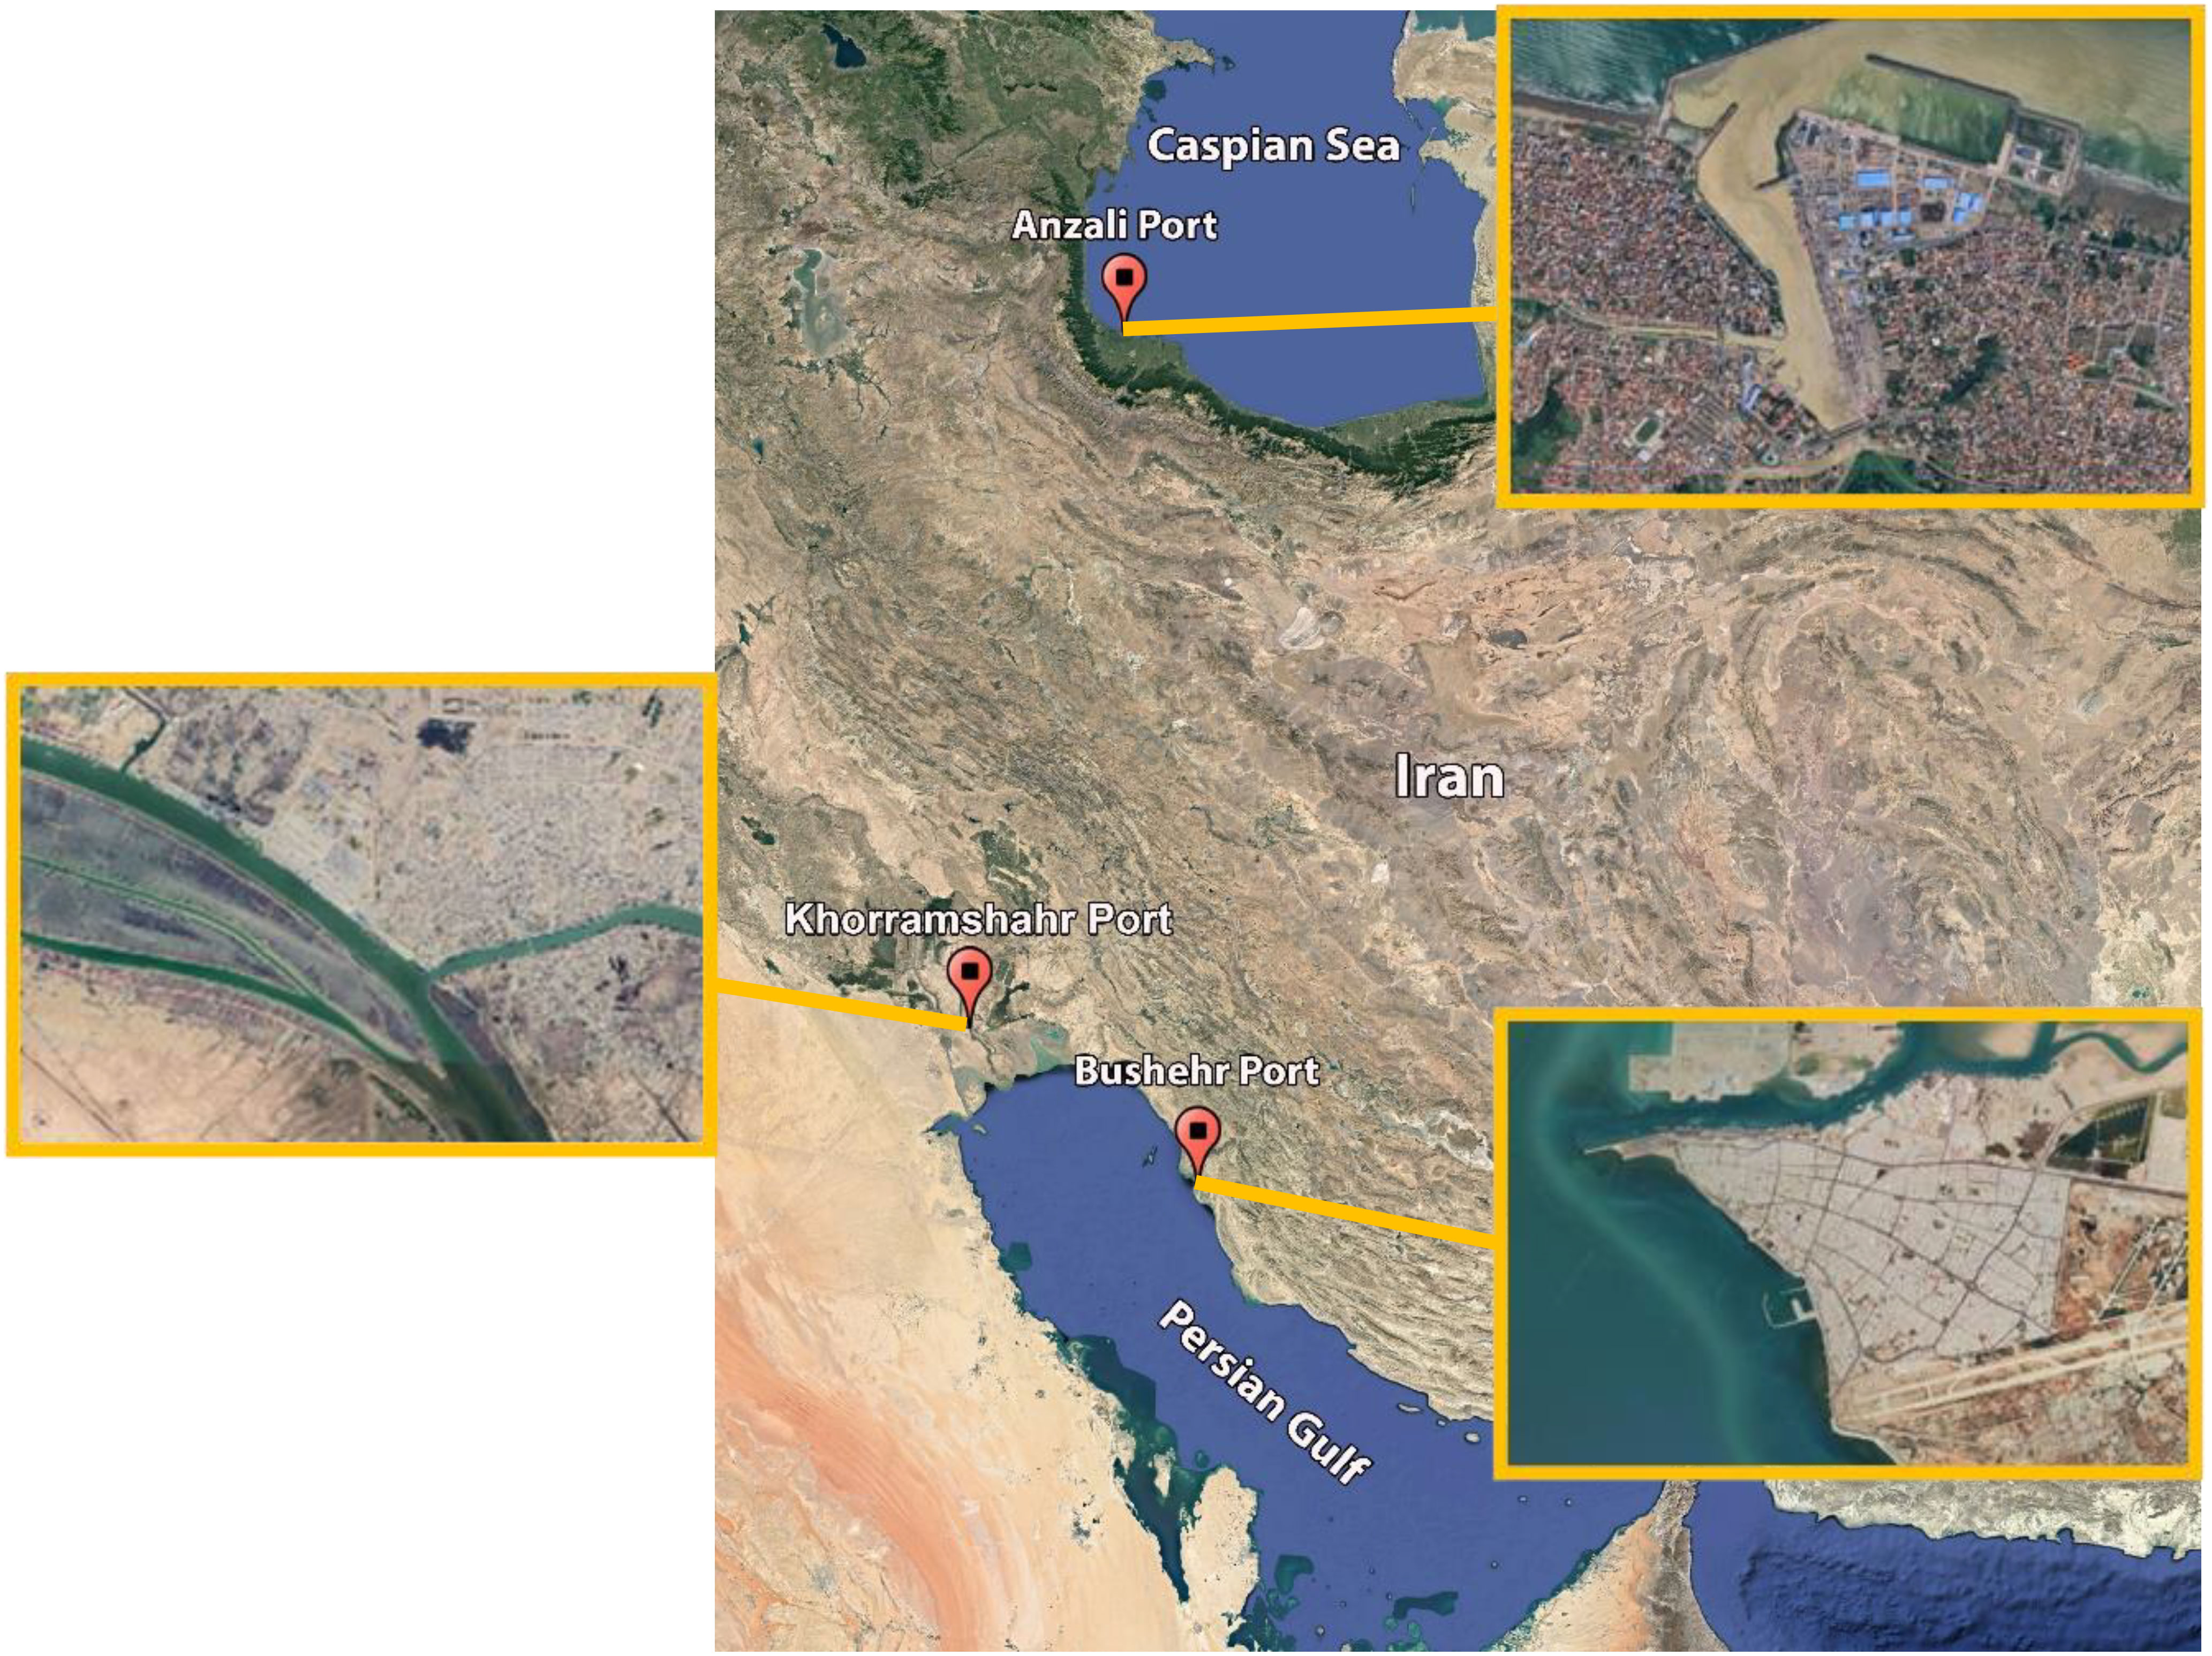
Figure 4. Locations of Anzali Port in the Caspian Sea and Khorramshahr and Bushehr Ports in the Persian Gulf.
3.2 Khorramshahr Port
Khorramshahr Port is located in the northwest of the Persian Gulf, where the Arvand and Karun rivers meet, close to the Iraq-Iran border (Figure 4). Khorramshahr Port presently spans across 230 hectares and has 21 quay posts with a total length of approximately 3,470 m with an important role in maritime trade. The construction and operation of this port to accommodate large cargo ships started in the early 1920s. The exclusive advantages of Khorramshahr Port encompass convenient access to global maritime, establishing a specialized pier specifically designed for the loading and unloading of roll-on/roll-off (Ro-Ro) ships. These ships typically measure approximately 80 m in length and 25 m to 30 m in width, with a capacity of 10,000 to 15,000 tons. The average siltation rate has been approximated to be 35 cm/year. According to satellite photos, most of the dredged sediments are located at the entrance of a river near the Ro-Ro pier, indicating the input of the sediments from this river. Furthermore, the analysis of coastal profiles using hydrographic maps along the Khorramshahr coast reveals that the beach near the river entrance has less depth and slope in comparison to other regions. Therefore, it is apparent that the sediment carried by the river has a substantial impact on the quantity of sediment accumulation and siltation in the study area (Khakbaft Consulting Engineers, 2021b).
3.3 Bushehr Port
Bushehr Port is situated in the Soltani Estuary on the Bushehr Peninsula, along the north coast of the Persian Gulf (Figure 4). It consists of shallow marine regions bordered to the south and north by the Bushehr headland and the Helleh River delta, respectively. This delta is predominantly composed of sediments deposited by the Helleh River system and other rivers in the northern region of Bushehr Bay (Samsami et al., 2022). Oolite deposits are also abundant in the Bushehr Bay (Haghshenas et al., 2012, 10th International Conference on Coasts, Ports & Marine Structures (ICOPMAS 2012): Tehran, Iran). A significant portion of the peninsula consists of shallow water regions and tidal flats, with depths often less than 5 m. The tidal channel of the Soltani Estuary, located in the northeastern section of the Bushehr Peninsula, offers the potential for navigation at great depths. The Bushehr Port access channel is divided into two sections: the interior channel of 3.2 km in length and the outer channel of 9.3 km in length. The inner channel exhibits an analogous alignment to the Soltani Channel, with a 100° bend serving as the connection to the outer channel. The depths of both the inner and outer channels were increased to 10.3 m and 10.8 m in 2007-2008, respectively. The port incurs significant costs for the annual maintenance dredging of the access channel, necessitating a continuous dredging volume of approximately 260,000 m3/year.
4 Field and laboratory experiments
4.1 Sediment sampling
The sampling employed in the ports encompasses surface sampling of the bed, collection of suspended samples, and undisturbed samples. Sampling from the seabed was conducted using a Van Veen Grab. The Van Veen Grab is a corrosion-resistant steel tool specifically intended for collecting silt samples in aquatic situations. Suspended sediment sampling was carried out in accordance with the provided criteria to collect at different depths. Samples were obtained using coring equipment and collected by a diver without any changes to them. The coring device measures around 1.5 m in length and has a diameter of about 6 cm. The depth to which the coring device can penetrate is contingent upon the toughness and density of the sediment. The samples were put into hermetically sealed containers and dispatched to the laboratory for essential examinations.
Figure 5A presents the sampling locations in Anzali Port, including 58 sites designated for the collection of seabed sediment samples, 8 sites for sampling water containing suspended sediments, and 6 sites for the collection of undisturbed sediment samples (coring). The collection of seabed samples encompassed 5 distinct sections, comprising internal regions of the port, areas beyond the port, and the river estuary. The locations of bed sediment sampling comprised three profiles on the western side and 2 on the eastern side of the port. Additionally, positions within the port basin, including channels, entrances, and the entrance of the little estuary in the east, were assessed. Undisturbed sediment sampling was conducted at 6 specific locations within basins and estuaries shown in Figure 5A, while suspended sediment sampling was carried out on sediments transported into the port by estuaries.
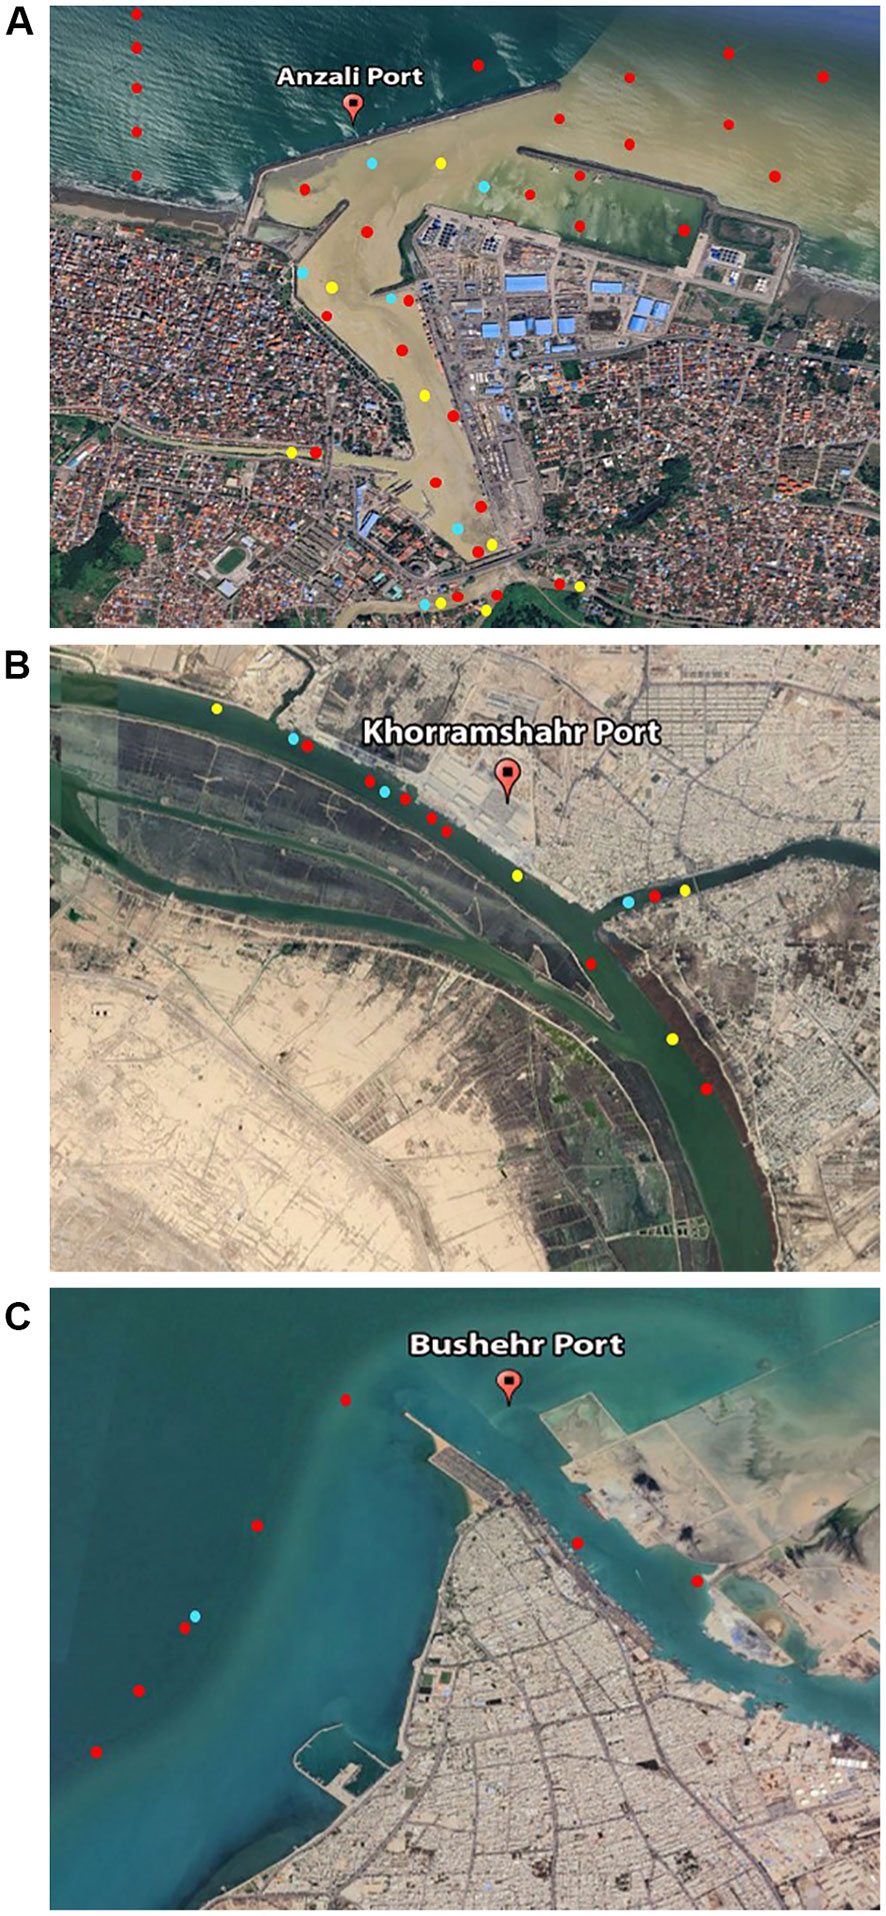
Figure 5. Sampling locations in the basin and around (A) Anzali, (B) Khorramshahr, and (C) Bushehr Ports. The points show  Bed sediment sample,
  Suspended sediment sample,
  Undisturbed sediment sample (Core samples).
Sediment sampling in Khorramshahr Port included the collection of 9 undisturbed sediment samples (coring), 8 bed sediment samples, and water samples that contained suspended sediments. The sampling procedure involved collecting sediment samples from 8 specified places on the seabed, obtaining undisturbed sediment samples from 3 particular areas, and collecting suspended sediment samples from 4 sites, each with 10 sampling points (Figure 5B). 7 locations were selected for surface sediment sampling, and 1 location was chosen for core sampling during the field survey in Bushehr Port and its access channel (Figure 5C).
4.2 Water content measurements
Water content, typically expressed as a percentage, is defined as the ratio of the mass of water to the mass of dry solids,
It can be related to volume concentration by
where C is the volume concentration, ρ is the density of water, and is the density of the sediment grains.
The water content of sediment samples was determined by weighting the soil prior to and after the drying process. The container was accurately weighted (w0) to start the experiment. A designated amount of sediment sample was placed in the container and subsequently weighed (w1). The container was then placed in an oven at 100°C for 24 hours for drying. Subsequent to drying, the container was reweighed (w2). The water content was calculated by the following equation:
4.3 Rheometry
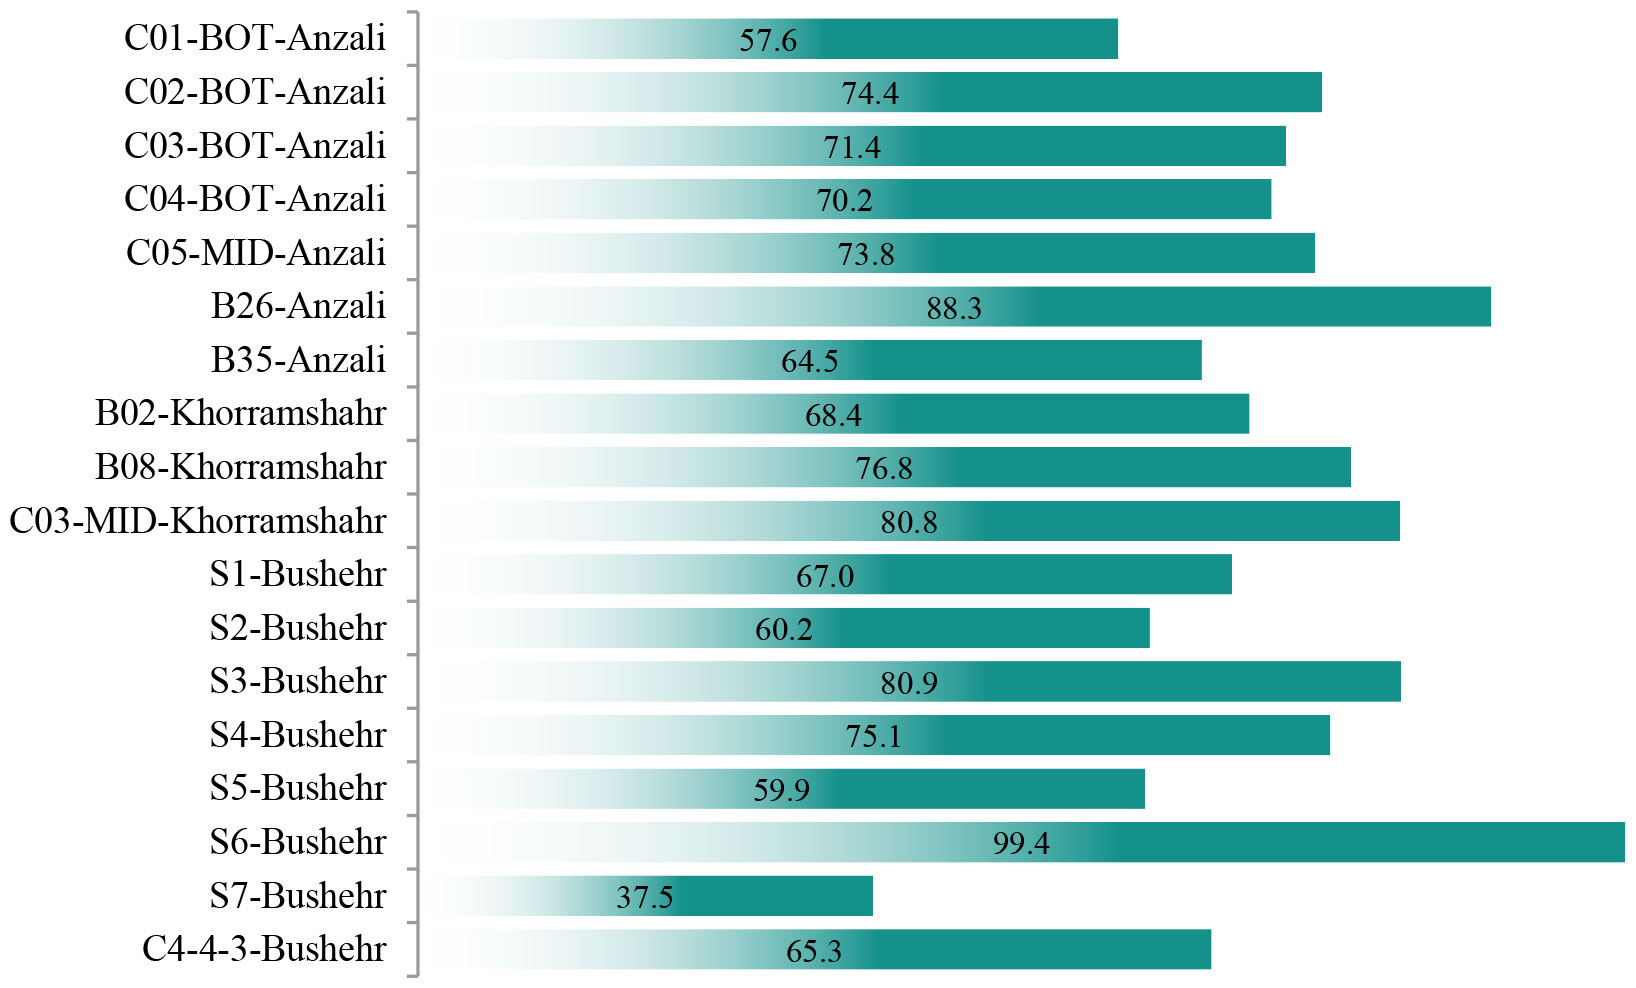
The sediment samples were prepared by combining them with distilled water at different moisture levels. The mixing method was performed many days before the experiment to ensure thorough chemical reactions between the sediment samples and water. Furthermore, to account for the potential presence of excessive materials and larger particles in the natural sediment samples gathered from the ports, which could create difficulties for the rheometer equipment, the sediment samples were kept in their original condition. The objective of this procedure was to preserve the inherent composition of the sediment while removing contaminants and extraneous substances. Figure 6 presents the measured water content ratios before conducting rheometric tests.
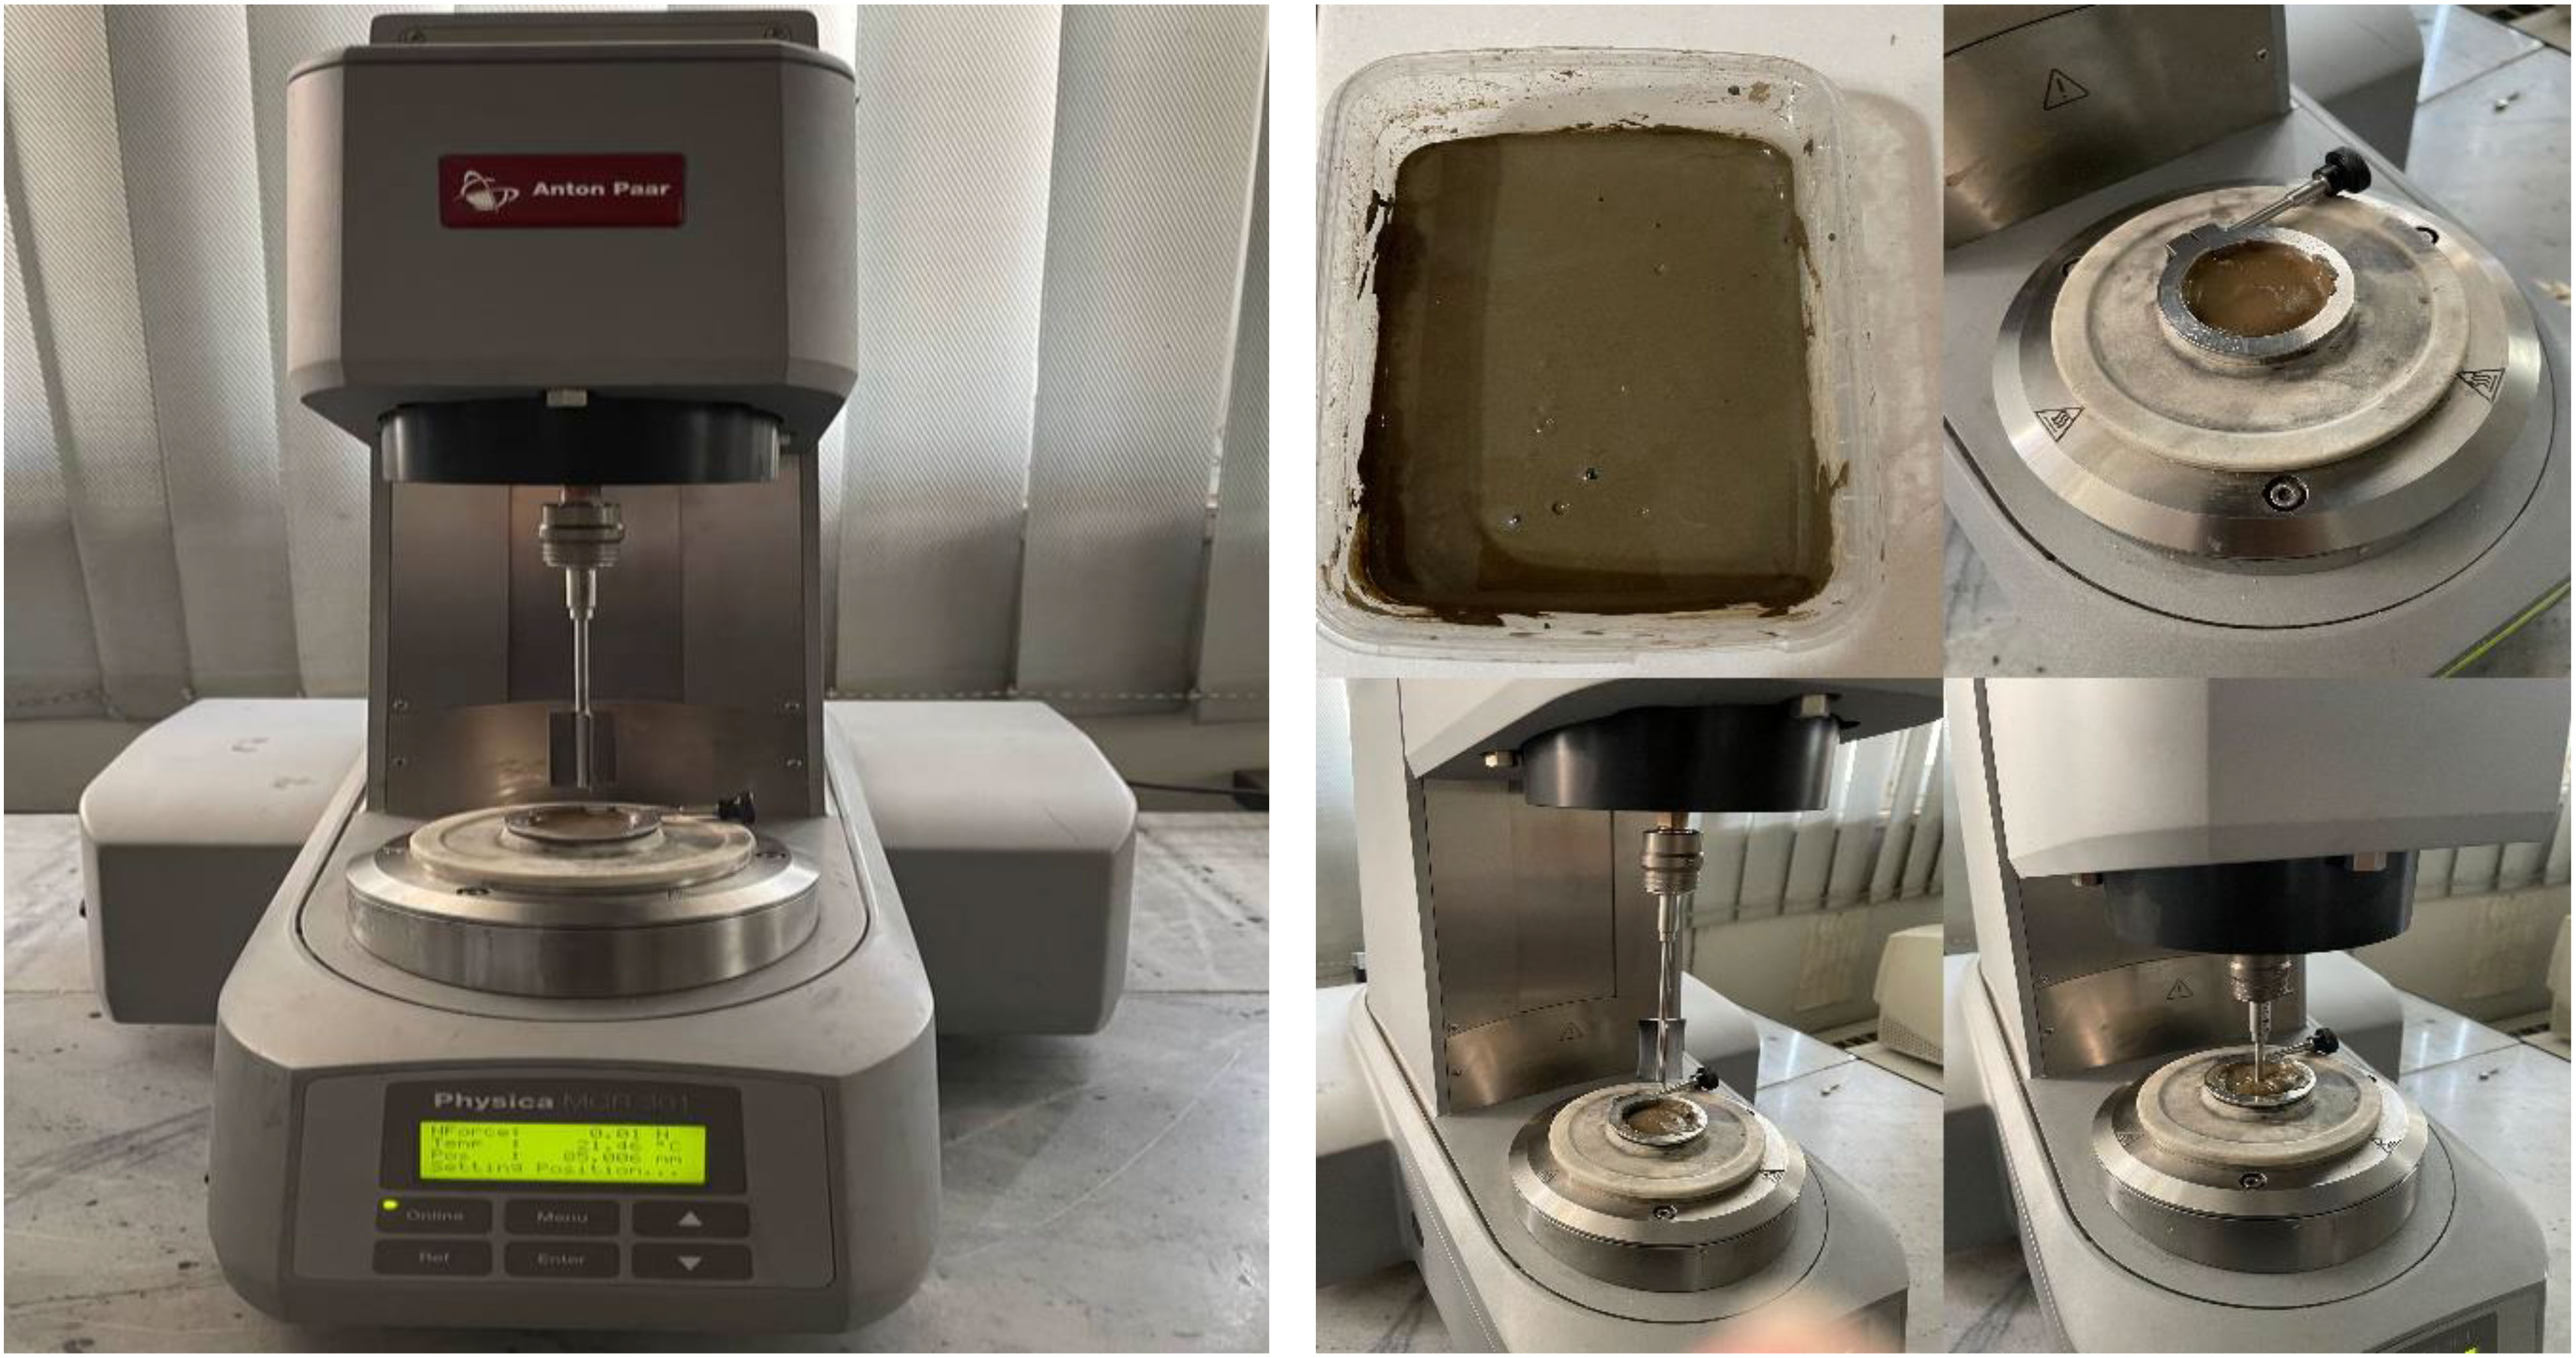
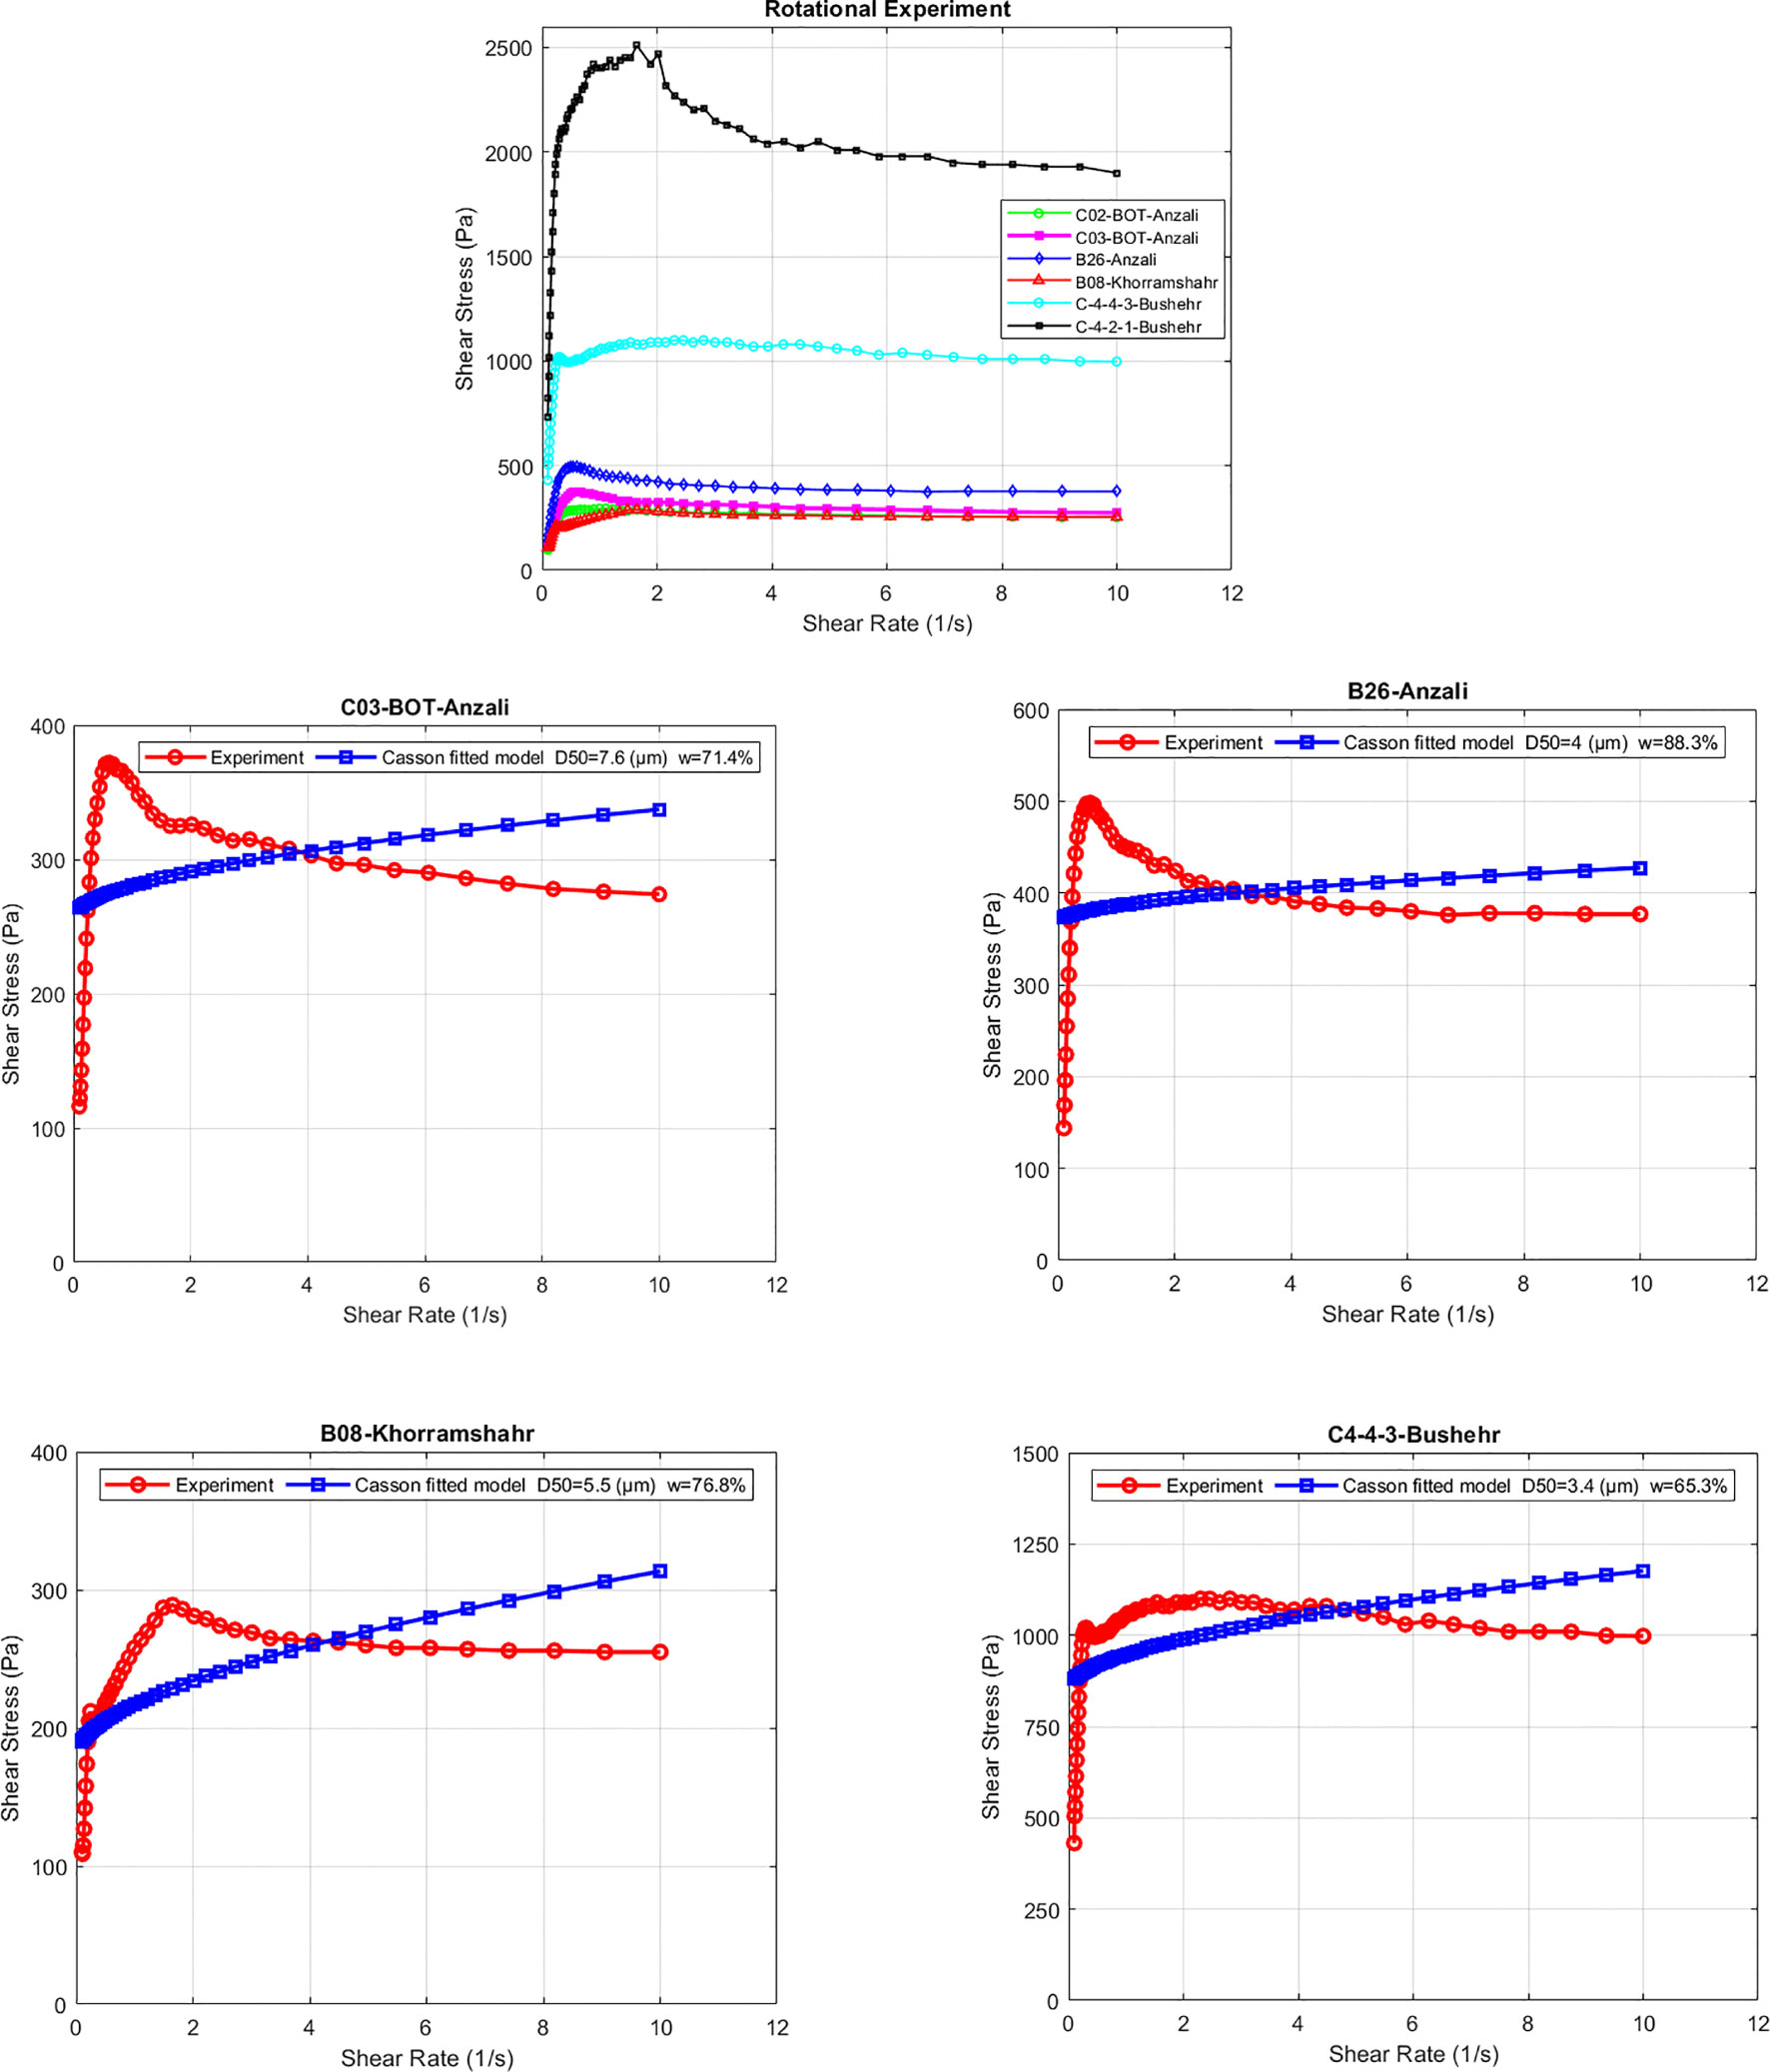
Laboratory tests on mud samples with different water content ratios were conducted at the Rheometry Laboratory of the Materials and Energy Research Center using the Anton Paar Physica MCR301 instrument (Figure 7). This instrument’s diverse capabilities allow for a broad spectrum of rheological tests, including both rotational and oscillatory modes. The rotational shear experiment was performed with a controlled rotational shear rate (CSR) that varies from 0.1 to 100 (1/s). The samples were subjected to a shear rate, and the resulting shear stress was measured. The Casson model, proposed in previous studies, was employed in this study as the flow curve fitting function for all of the sediment samples. The CSD oscillatory test employed an amplitude sweep (AS) from 0.01 to 100% as a logarithmic input with a constant angular frequency of 10 rad/s, and storage and loss modulus values were recorded.
4.4 Organic matter and carbonate content
The percentage of organic matter was determined using the Loss on Ignition (LOI) test, a widely accepted method in analytical chemistry and soil sciences, commonly employed for the analysis of mineral components and the chemical makeup of soil. This technique entails exposing a sample to high temperatures (ignition) to promote the release of volatile substances, and the procedure continues until the sample’s mass change stabilizes. The LOI test usually involves multiple procedural phases. After measuring a specified quantity of the sample, we transferred it into the furnace, which was set at a temperature of 950°C. After 1 hour, we reevaluated the weight of the sample and subsequently expressed the reduction in weight as a percentage, which is referred to as the LOI percentage. The organic matter content was determined using the following formula:
the mass of the organic matter (MO) is equal to the difference between the mass of the dry sediment (MD) and the mass of the burned sediment (MA).
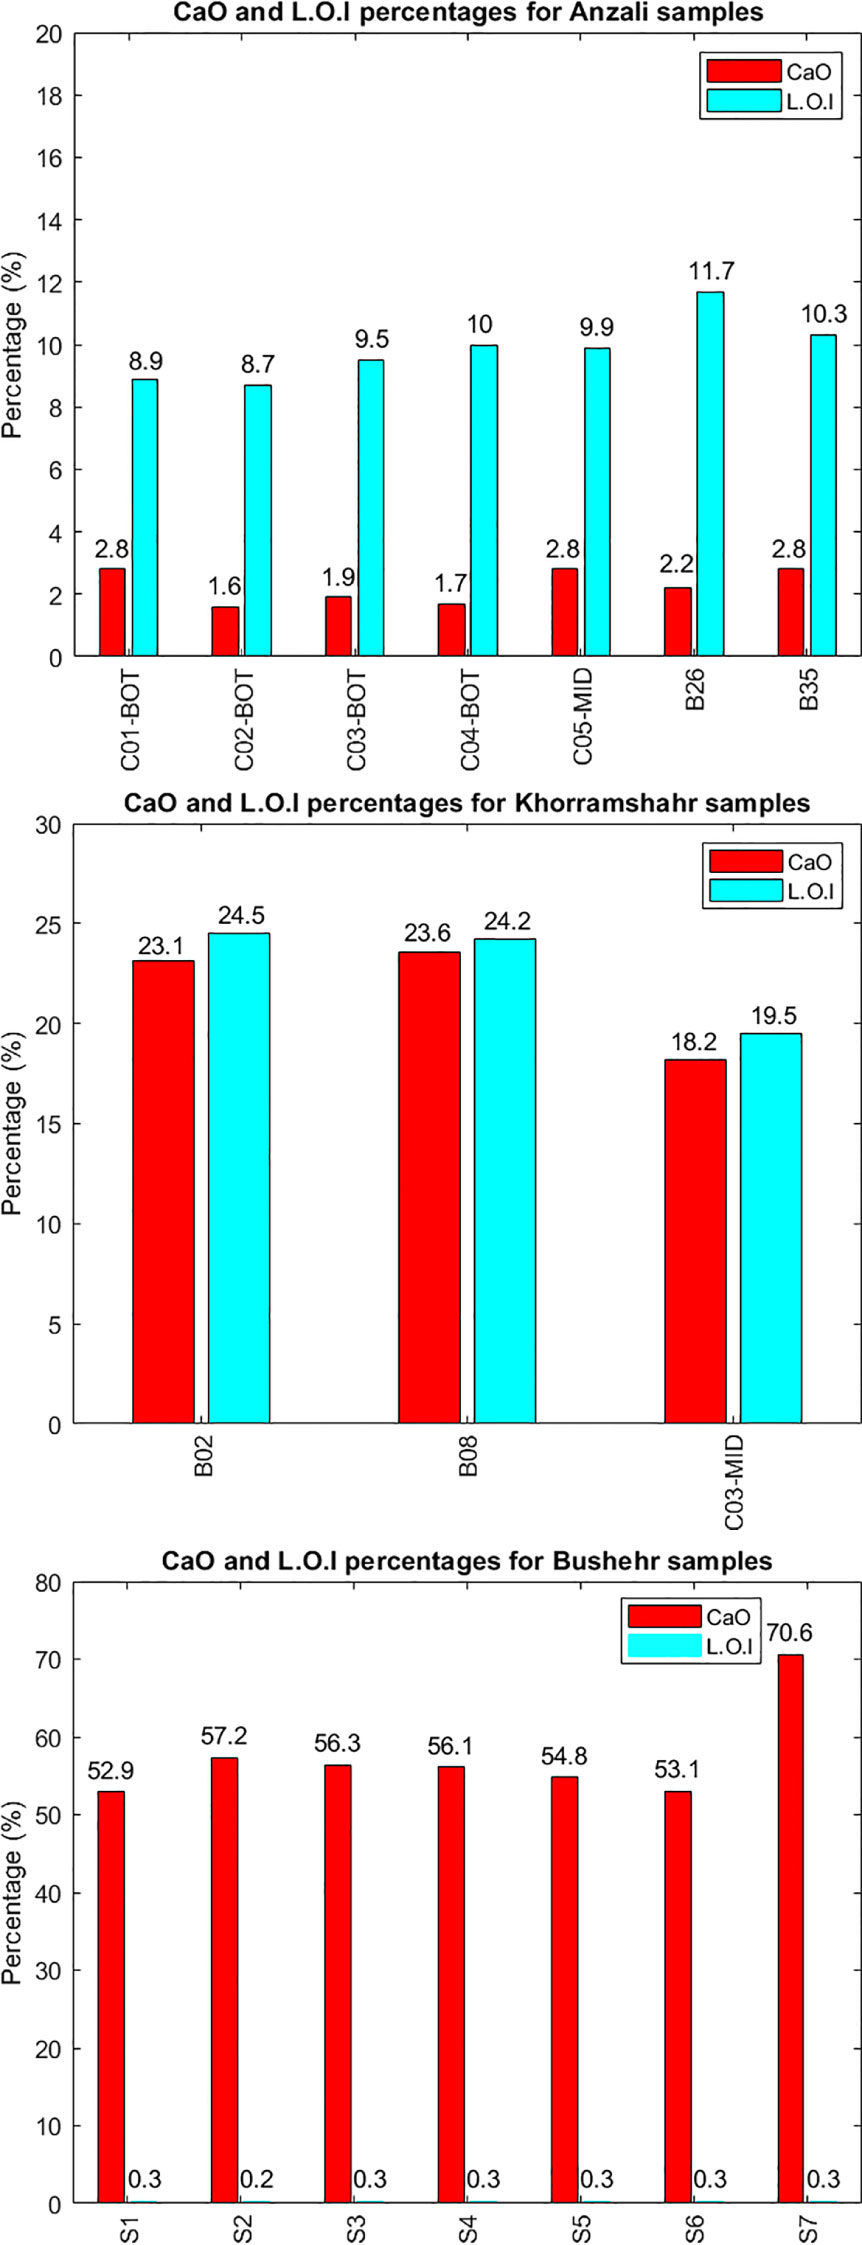
X-ray fluorescence spectroscopy (XRF), an elemental analytical technique, was used to measure the carbonate components. The samples were analyzed utilizing the Philips XRF PW2404 instrument. The objective of this analytical process was to determine the concentrations of both oxide and elemental constituents in the provided sample, shown in Figure 8. The utilization of XRF has significant benefits compared to traditional chemical methods, due to its enhanced speed, cost efficiency, and remarkable accuracy. The XRF device is specifically developed to measure the wavelength and intensity of fluoresced radiation emitted by various atomic species in the sample. This allows for the identification and measurement of elemental elements. The proportions of carbonate materials and organic content identified in the samples are presented in Figure 9. This information enhances the understanding of the material composition of sediments.
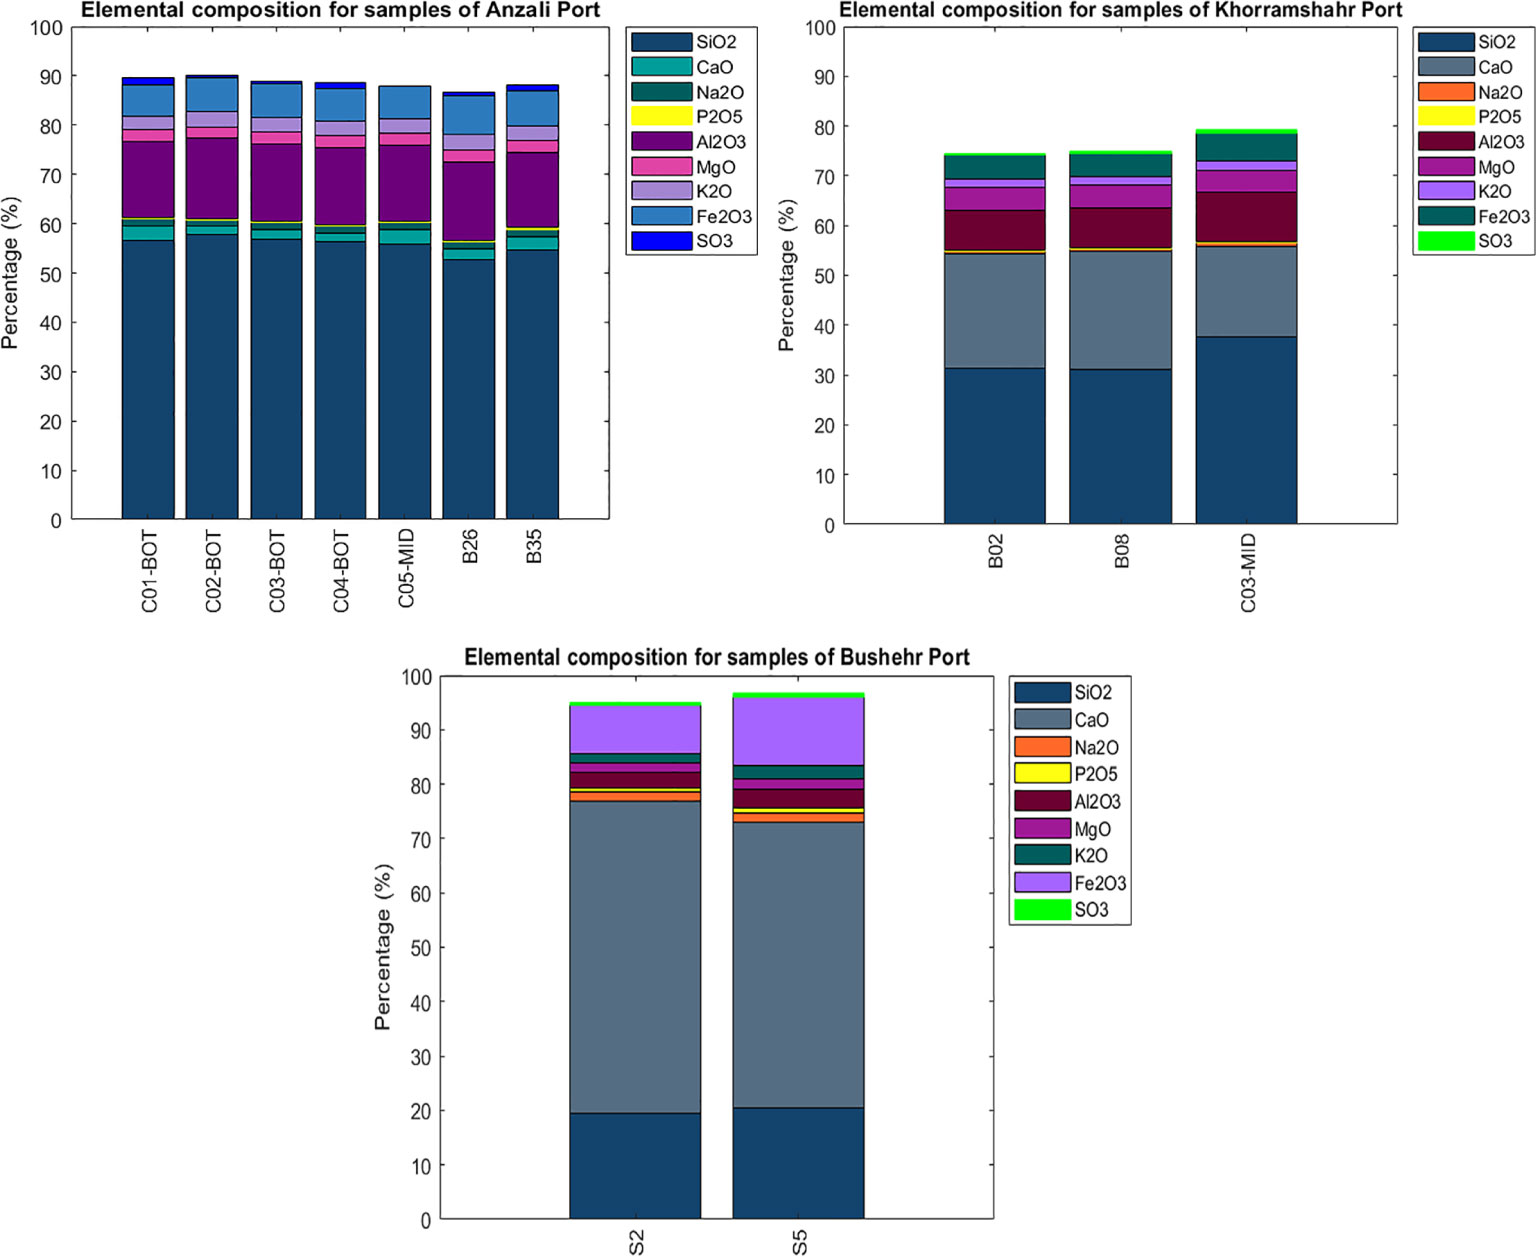
Figure 8. Elemental composition differences in samples from Anzali, Khorramshahr, and Bushehr Ports by (XRF) spectroscopy.
4.5 Grain size
Particle size is a crucial parameter to determine the characteristics of sediment particles, which have a substantial impact on their movement and erosion mechanisms. The study of particle size is utilized to determine the origin of sediment, track its history of transit, and comprehend erosion circumstances in the marine environment. Sediment particles are classified according to their diameter, with categories including clay, silt, mud, sand, gravel, and cobblestone. Sieve analysis and hydrometers were utilized for Anzali and Khorramshahr Ports to accurately categorize the particles based on their respective sizes. These approaches enhance the understanding of the composition of sediments and help us examine the dynamic processes that shape the marine environment. The hydrometric method involves analyzing the sedimentation method to categorize the fine sediments that accumulate at the bottom of culverts. This approach relies on Stokes’ law and tracks the rate at which spherical particles floating in fluids settle. It is important to mention that the hydrometric results have been continuously recorded for a duration of 48 hours.
Using the “analysette22” Laser Particle Sizer apparatus from the Material and Energy Research Center, the analysis of the grain size distribution of the Bushehr Port’s samples was carried out, as illustrated in Figure 10 (Samsami et al., 2022). This sophisticated device provides accurate measurement of particle size for both dry and liquid samples, spanning a range from 0.16 µm to 1160 µm. It complies with the ISO standard for particle-size analysis utilizing laser diffraction techniques. Based on factors like particle size or specific properties, sediment can be classified by different systems, such as the ones developed by the U.S. Department of Agriculture (USDA), the International Society of Soil Science (ISSS), and the British Soil Classification System (BSCS).
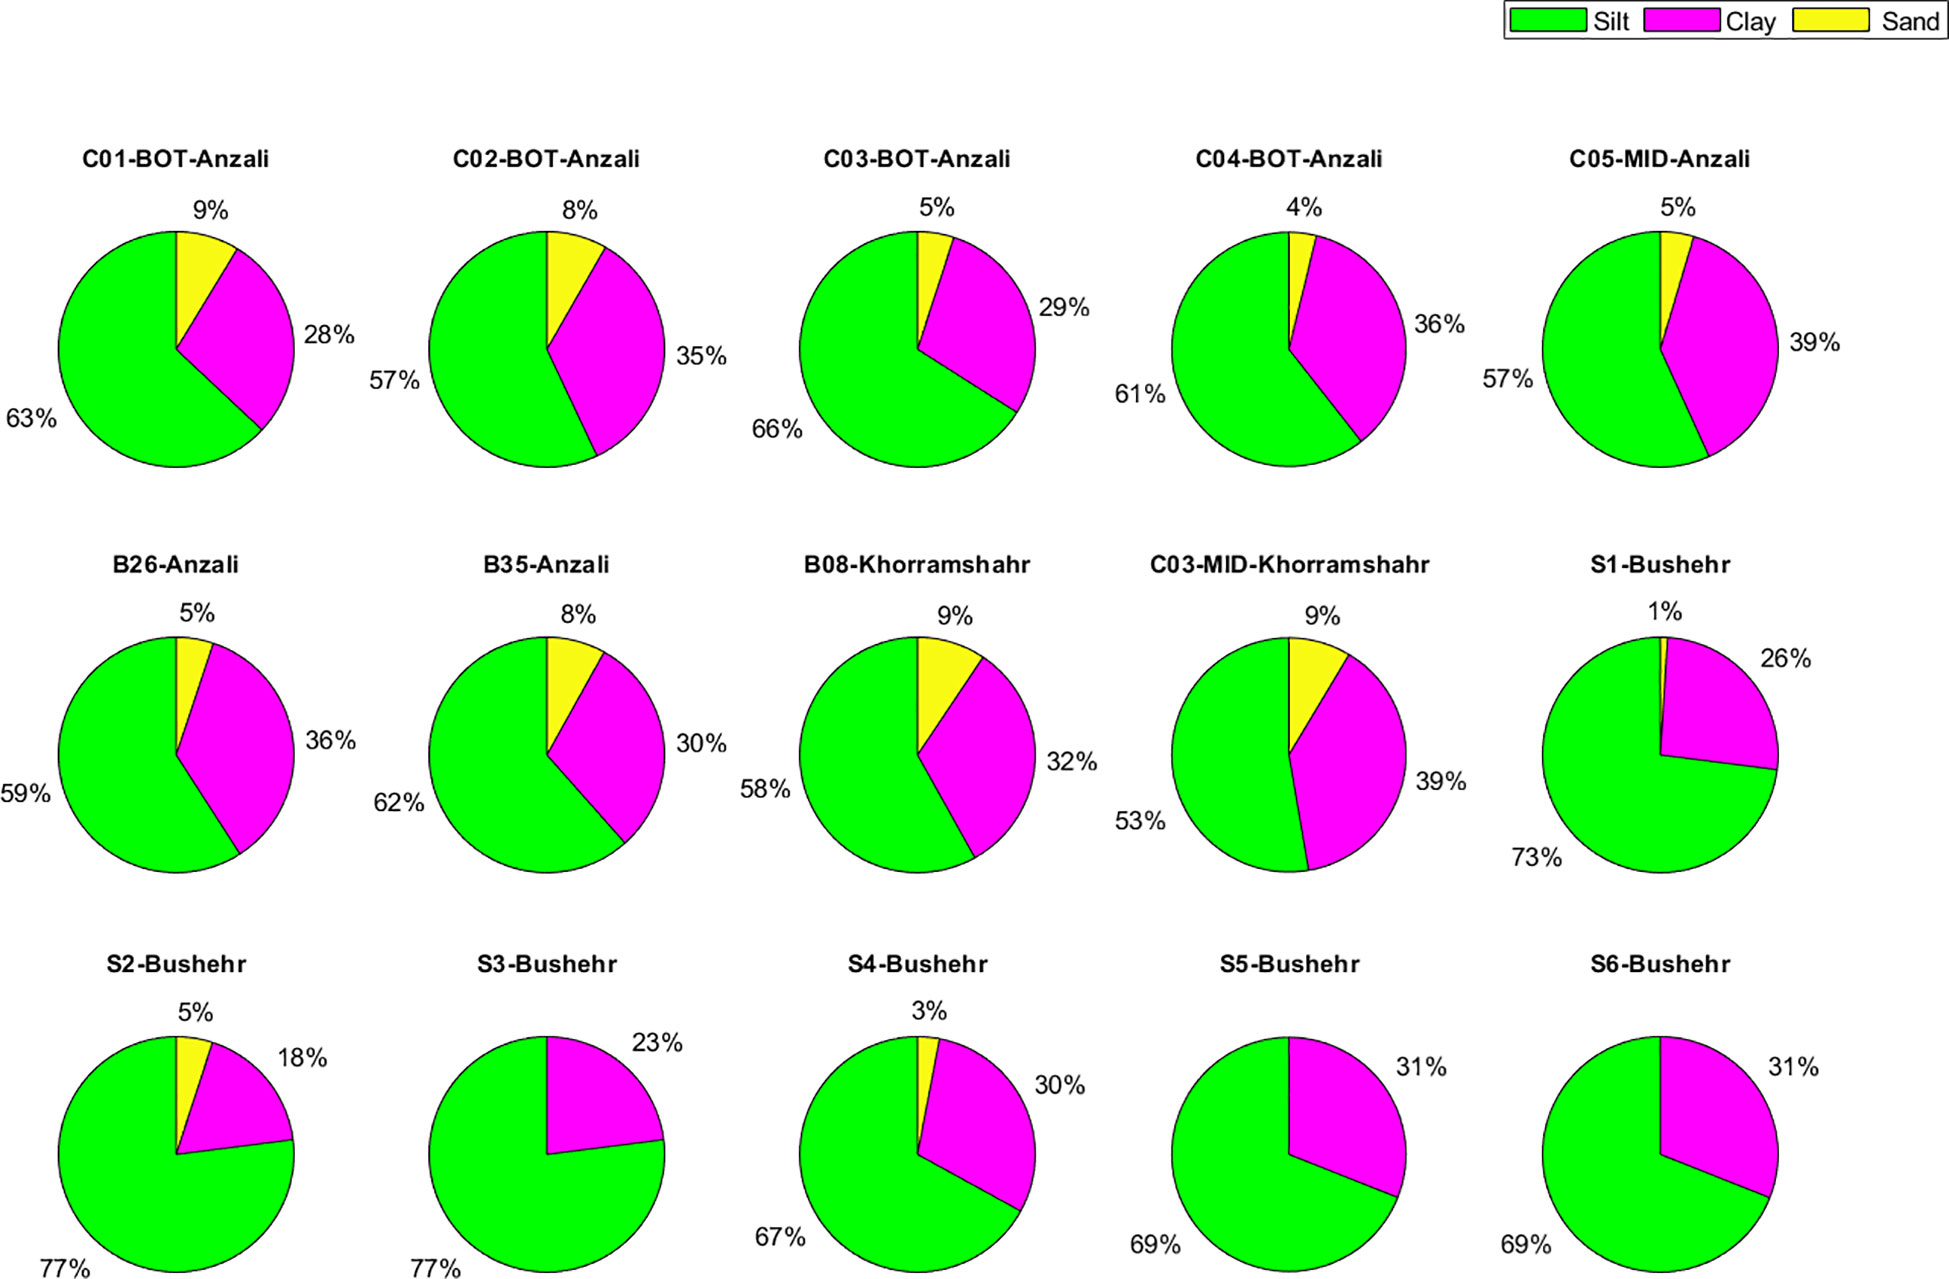
Figure 10. Particle size distribution of sediment samples collected at Anzali, Khorramshahr, and Bushehr Ports.
5 Results and discussion
Table 1 represents the median particle size (D50), water content ratio (w), density (), concentration (C), viscosity (), and the Casson yield point stress (τyc) of sediment samples. Additionally, Figure 10 illustrates the distribution of particle sizes, including sand, silt, and clay fractions. The technique of X-ray fluorescence spectroscopy (XRF) was utilized to perform elemental and oxide studies of sediments. Figure 8 illustrates the elemental composition differences in samples from the ports of Anzali, Khorramshahr, and Bushehr obtained from these analyses. Furthermore, Figure 9 depicts organic matter content, which was determined by the loss-on-ignition (LOI) method, and carbonate content in the sediment samples. The two types of rotational experiments with controlled shear rate (CSR) and oscillatory experiments with controlled shear deformation (CSD) and amplitude sweep mode (AS) were used to provide the rheological properties of sediments. Figure 11 depicts the rotational test results for the samples. The Casson models that have been adjusted are shown in the same figure. It is observed that the simple Bingham model does not accurately represent the flow behavior of sediment samples. Nonlinear models, such as Casson, better depict the flow characteristics of cohesive sediments, specifically soft muds, due to their suitability for modeling such flow behavior. Figure 12 displays the results of the AS oscillatory test for sediment samples, illustrating three distinct zones: the linear viscoelastic range (LVR), yield zone (YZ), and liquid range (LR). The LR’s upper limit is equivalent to the yield stress (τyos). The flow-point stress (τf) is a significant stress point that occurs at the junction of the G’ and G” curves.
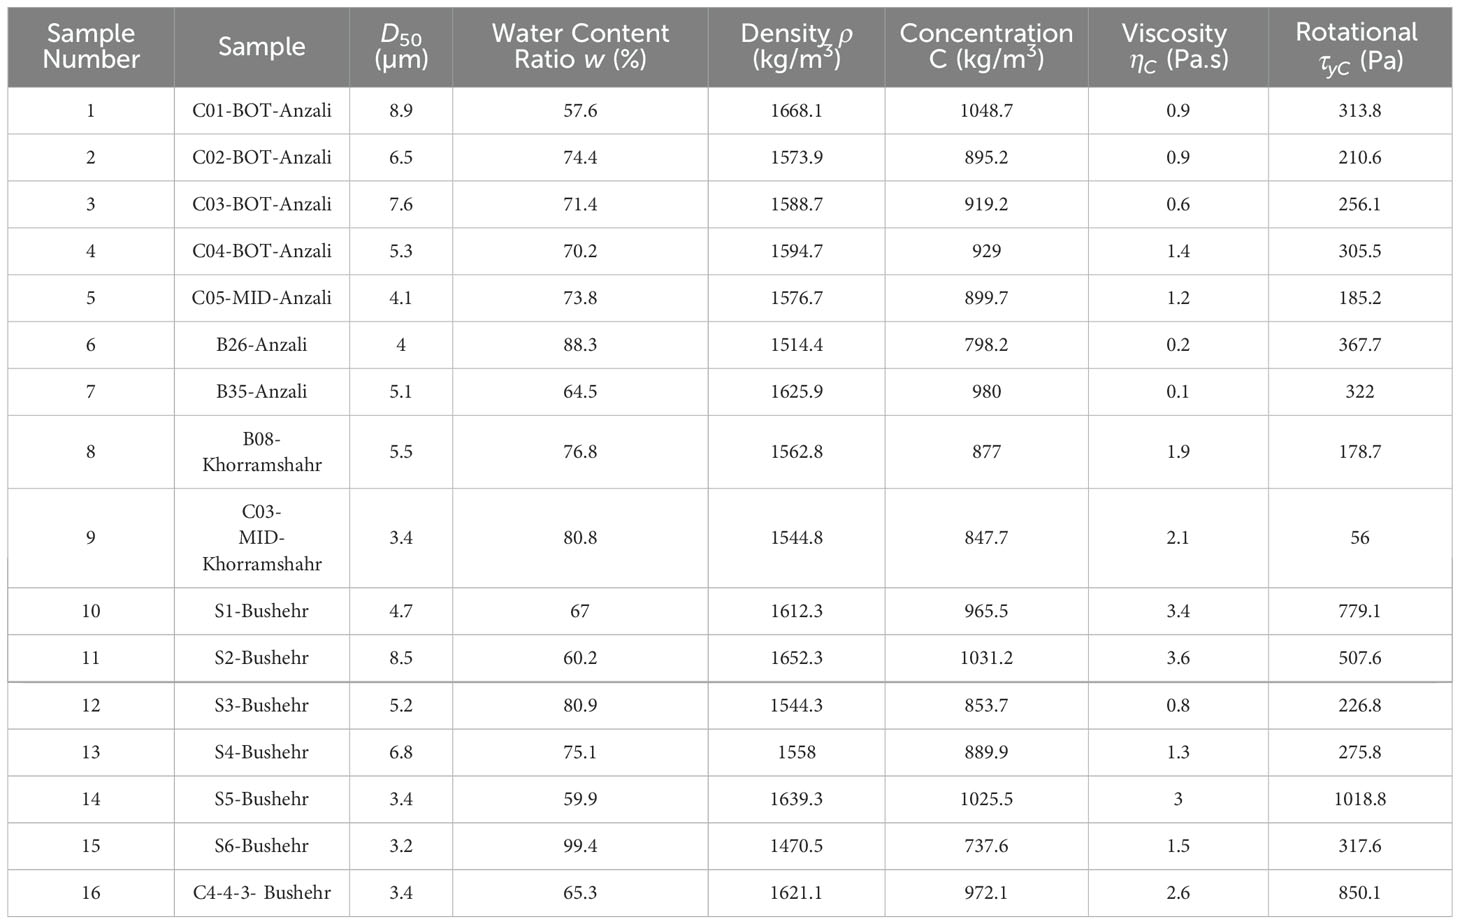
Table 1. Median particle size, water content ratio, density, concentration, viscosity, and Casson yield point stress of sediment samples.
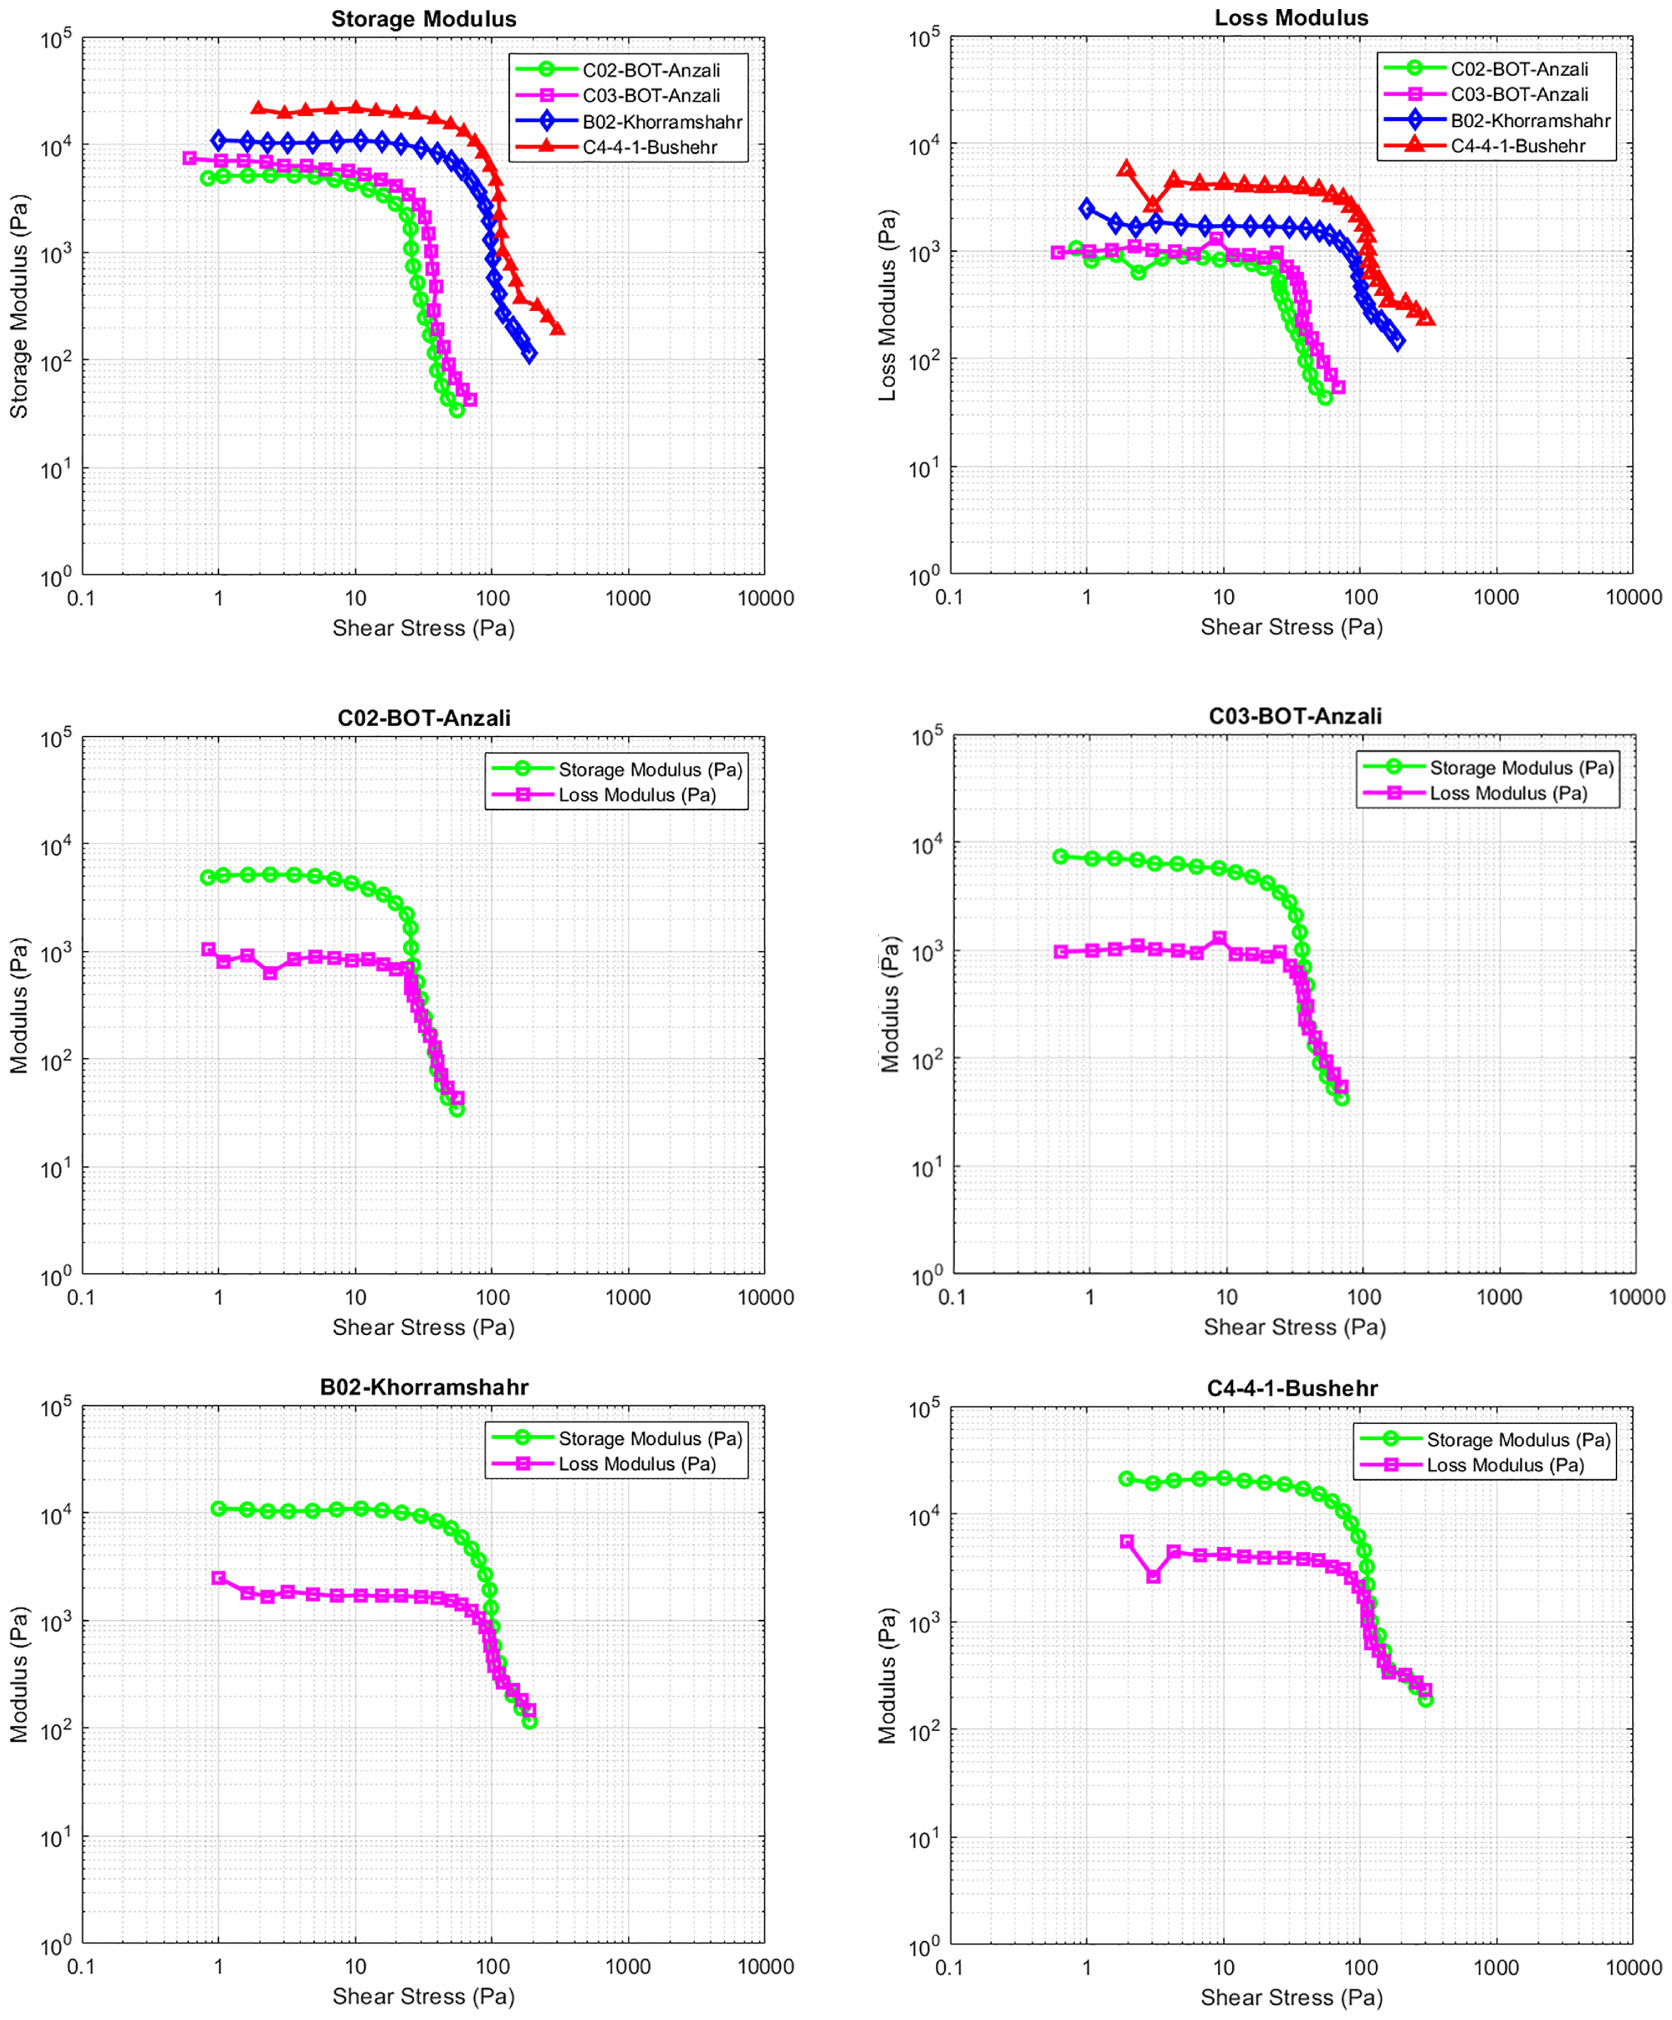
Figure 12. Results of oscillatory amplitude sweep tests conducted on samples from the Anzali, Khorramshahr, and Bushehr Ports.
By analyzing the grain-size distribution of the sediment within the study area, it is possible to ascertain the properties of surface sedimentary environments. Clay, sand, and silt are the three grain-size fractions that are depicted in Figure 10. Among the samples that were shown, the clay-size fraction ranged between 18% and 39%. The majority of cohesive samples in the area under investigation had a median size that ranged from 3.2 to 8.9 µm. The sand-size fraction was the most significant in sample S7, with a median size of 63.76 µm. As a result, this sample can be classified as a non-cohesive sediment based on its characteristics. According to the basic physical features of the surface sediments that are presented in Figure 9, the organic matter and carbonate contents of the samples of Anzali, Khorramshahr, and Bushehr Ports ranged from 0.2% to 24.5% and 1.6% to 70.6%, respectively. The presence of sand particles in sample S7 was the cause of the exceptionally high carbonate content that was found in this sample. In the sediment samples, the water content ratio was less than 100 percent.
The higher stress values seen in the rheological behavior of surface sediment were probably due to the use of the Van Veen grab sampler, which is heavier and allows sampling at a depth greater than the fluid mud depth. The yield stress values obtained from the rotational test were higher than those from the oscillatory test because of the distinct behaviors shown in each investigation. The oscillatory test results in this study were more suitable due to the wave and tidal current’s oscillating character.
Various parameters, such as water content ratio, concentration, temperature, organic matter content, grain size and distribution, and clay mineral type, affect the rheological properties of sediment samples. Table 2 contains information regarding the water content ratio (w), organic matter content, carbonate content, Casson yield point stress (τyc), and the yield and flow-point stresses from the oscillatory test results for the samples. Figure 13 shows the correlation between yield and flow-point stress values obtained from rotational and oscillatory tests, alongside the water content ratios of sediment samples.
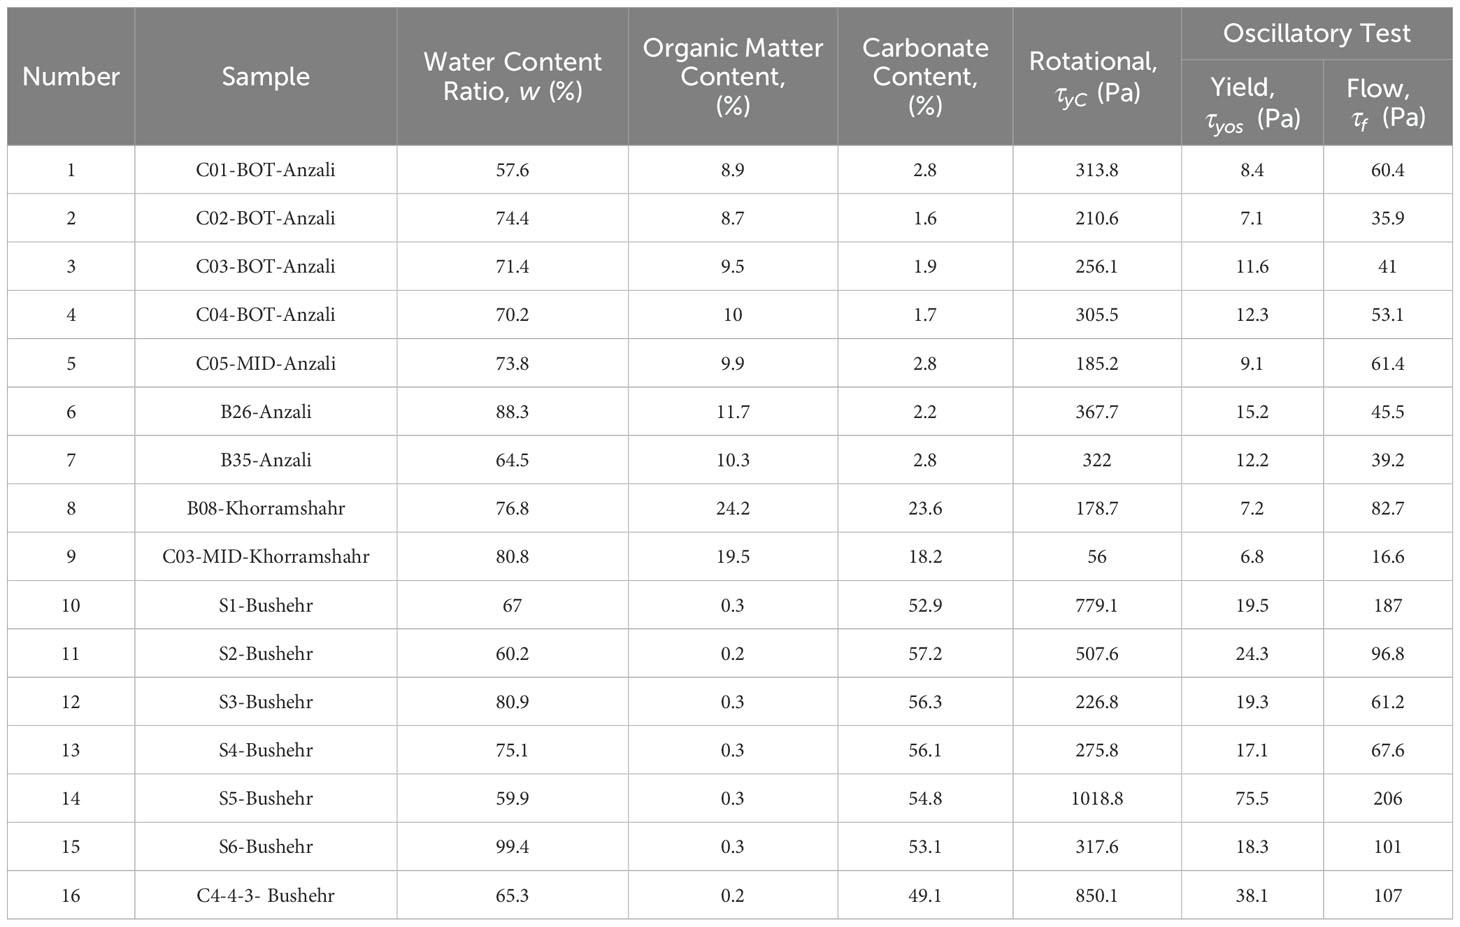
Table 2. Water content ratio, organic matter content, carbonate content, and rheological characteristics of sediment samples for Anzali, Khorramshahr, and Bushehr Ports.
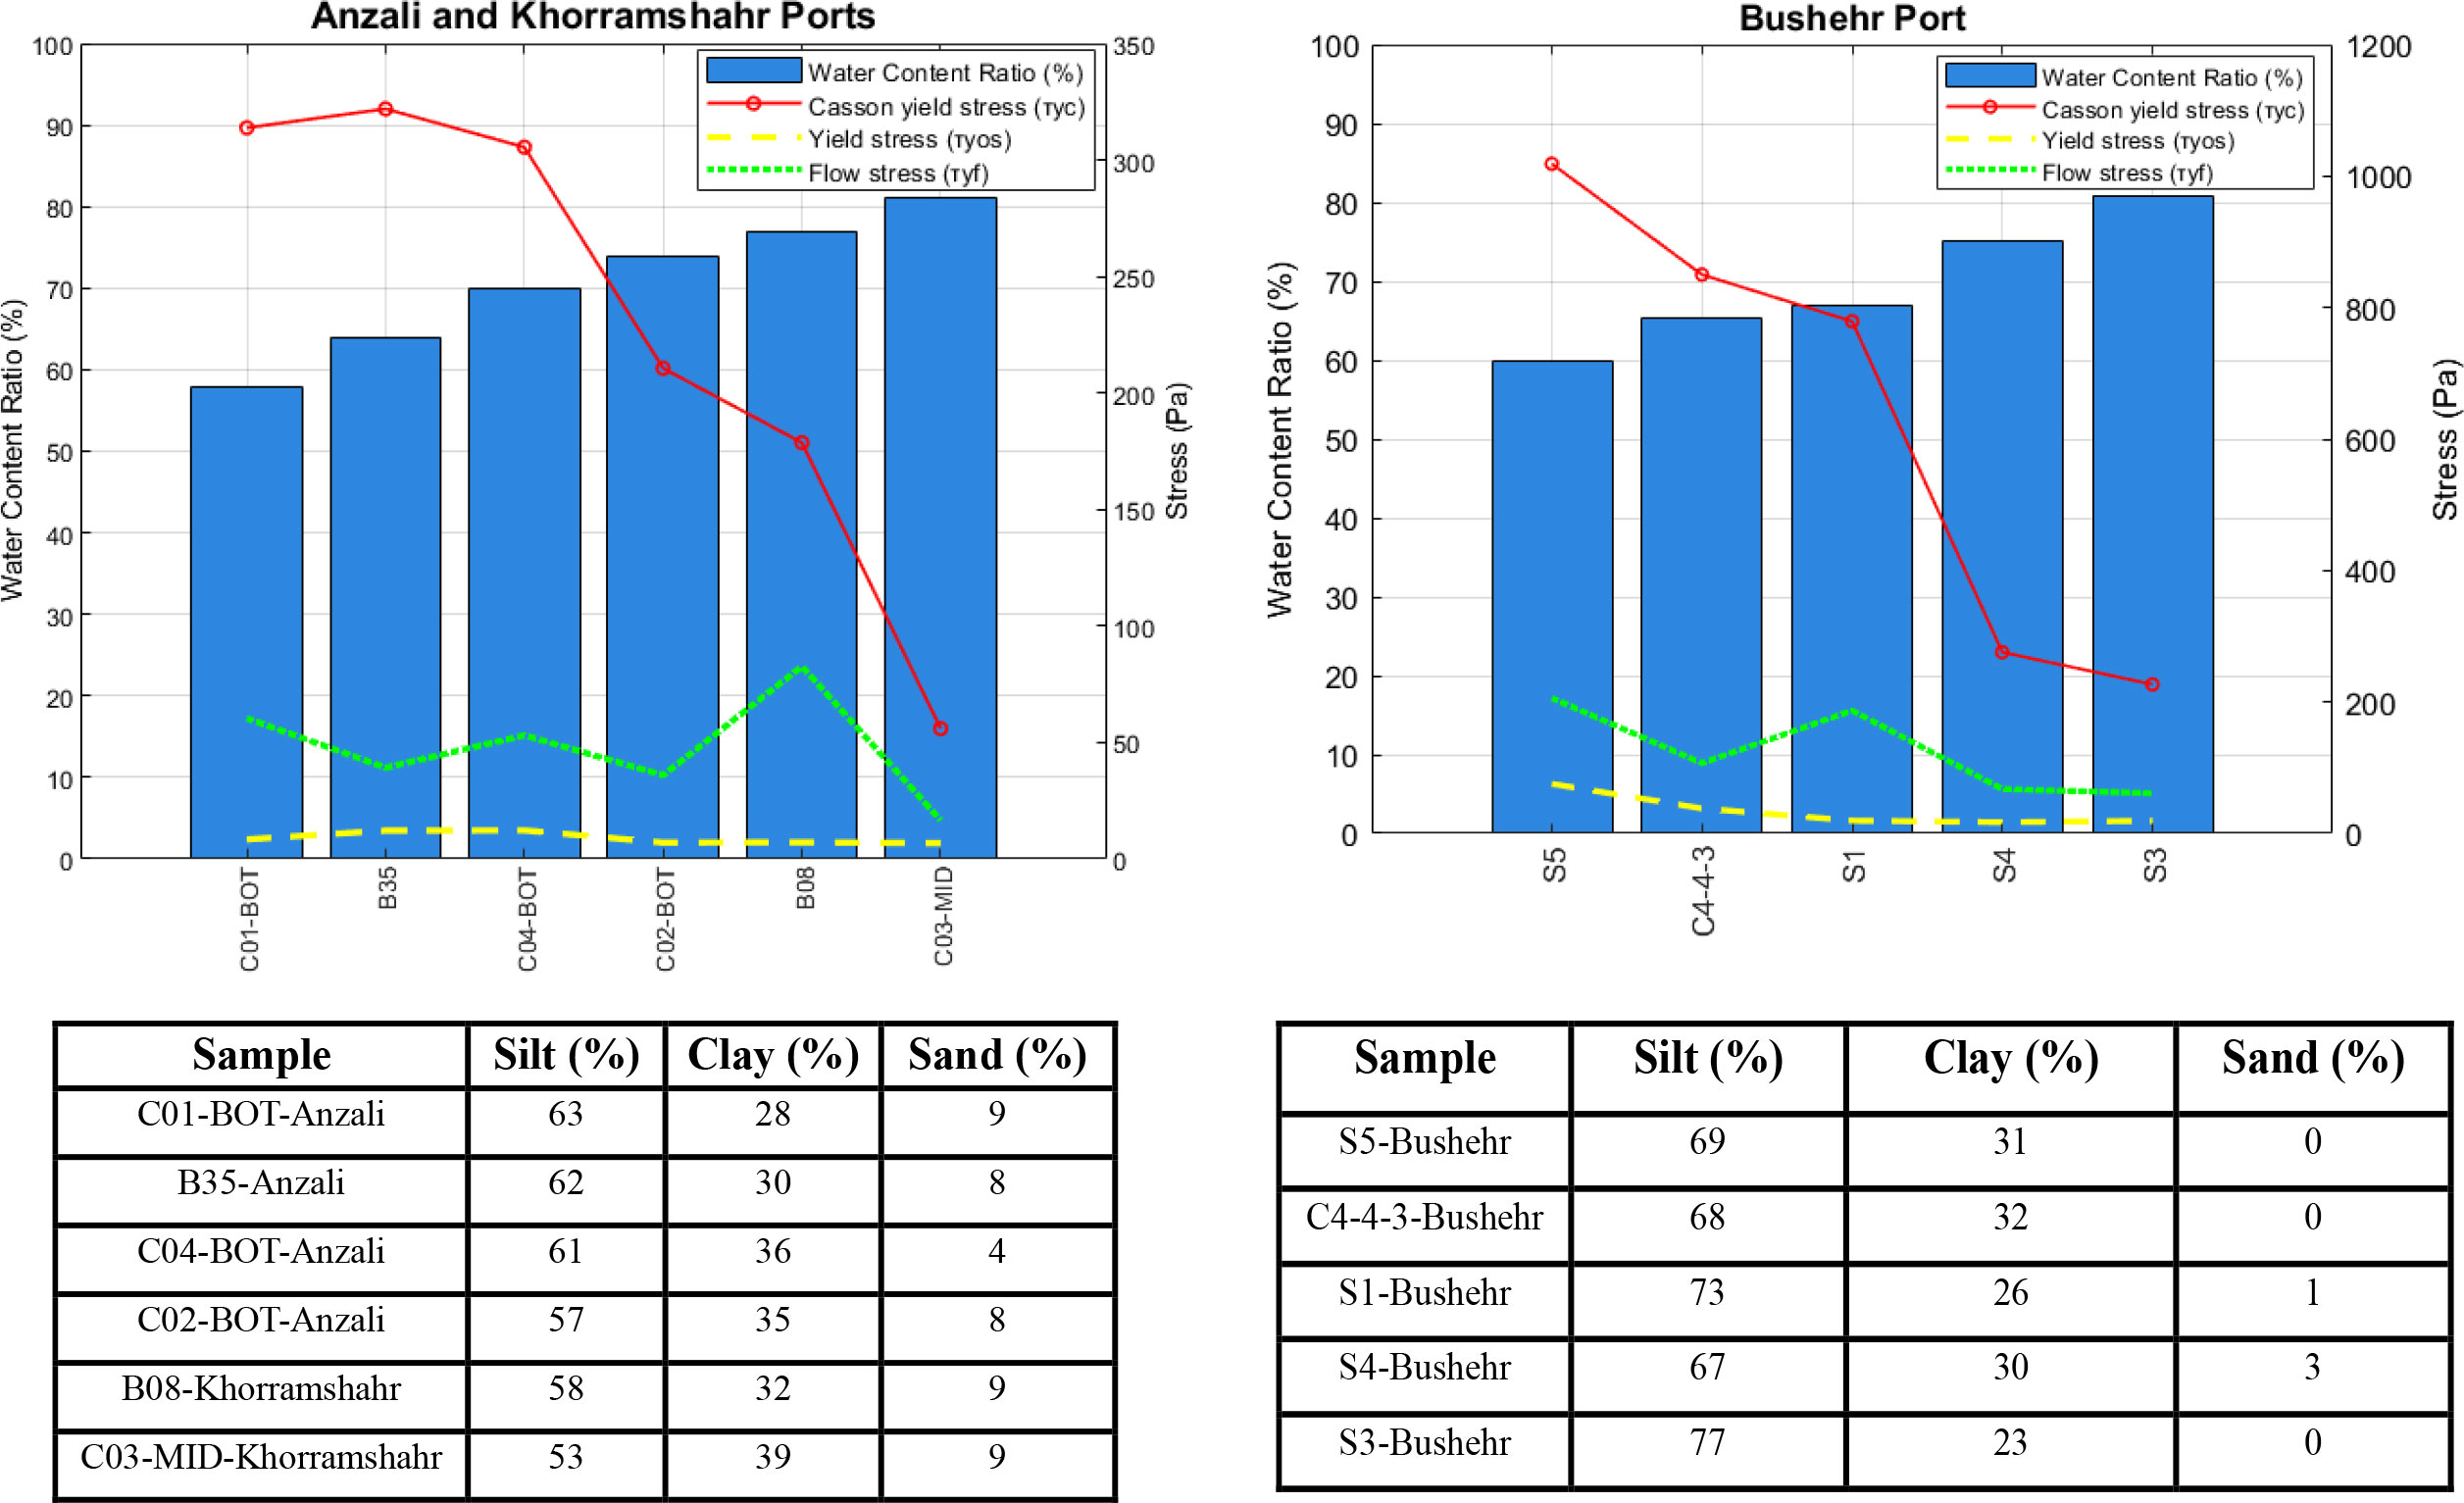
Figure 13. Water content ratios and rheological characteristics for Anzali, Khorramshahr, and Bushehr Ports.
Mud samples exhibiting similar densities demonstrated that even small amounts of organic matter and carbonate content influence the rheological characteristics of sediments. For example, increased organic matter, and carbonate content resulted in higher yield stress values in oscillatory test for samples C02-BOT-Anzali and C05-MID-Anzali shown in Table 2. Each sediment sample from the Ports of Anzali and Khorramshahr contained a specific water content ratio, while the samples from Bushehr Port were analyzed at varying water content ratios (Samsami et al., 2022). In general terms, as the water content increases, both the Casson yield stress and the yield stress from the oscillatory test, as shown in Figure 13, tend to decrease.
6 Summary and conclusion
The existence of cohesive muddy deposits causes navigational issues for the ports, requiring the implementation of additional procedures to ensure safe access to the ports. In order to decrease the necessity for dredging, it has been proposed to implement the nautical depth method as a means to mitigate sedimentation and siltation. Evaluating the nautical bottom conditions is essential for ensuring safe sailing in these regions, considering the accumulation of fine sediments in ports and access channels results in a reduction of the effective depth of the harbor and access channels. The assessment of nautical depth relies on the properties of mud to identify the most effective amount of bottom mud to dredge and reduce resistance to vessels. For the purpose of comprehending the hydrodynamic, acoustic, and nautical depths in navigation channels, it is vital to know the properties and dynamic behavior of fluid mud at various depths. A complete set of the physical characteristics of the seabed and the properties of the fluid sediment layer is necessary for assessing the possibility of the nautical depth method.
A comprehensive rheological investigation was conducted on the mud samples obtained from different locations within the Anzali, Khorramshahr, and Bushehr Ports. The laboratory analyses included determining the sediment grain-size distribution, density, carbonate content, organic matter content, and rheological properties at different water content ratios. The Loss on Ignition (LOI) test was employed to determine the organic matter content, and X-ray fluorescence spectroscopy (XRF), an elemental analytical technique, was used to measure the carbonate component. Disregarding the impact of variations in organic matter and carbonate contents in the samples, water content ratio was the main factor affecting the rheological properties of sediments.
The rheological characteristics of mud samples were assessed by performing rotational and oscillatory experiments using the rheometer. Since the phenomenon is affected by the oscillatory motion of waves, it is crucial to carry out oscillatory experiments to obtain a more profound understanding. Furthermore, the substantial difference between yield stress and flow stress has a significant effect on the modeling of wave-mud interaction, emphasizing the importance of precisely anticipating these dynamics.
Due to the distinct behaviors of the rotational and oscillatory experiments, the yield stress values obtained from the rotational test were higher than those obtained from the oscillatory test. Oscillatory test outputs were more suitable in the present investigation due to the oscillating behavior of the wave and the tidal current. Yield stress values from the oscillatory test that are less than 70 to 100 Pa may suggest that the sediments are less resistant to applied stresses. As a result, it is possible to implement nautical depth with navigable layers, which has the potential to enhance the navigation of ships.
The four criteria (i.e., echo sounding, rheology-related criteria, ship behavior, and mud density level) proposed by PIANC report No. 121 provide a comprehensive understanding of the nautical bottom, enabling better management and operational decision-making in environments where fluid mud is present. In order to determine the thickness of the fluid mud in the study area, it is necessary to conduct hydrographic surveys in the Anzali and Khorramshahr Ports using a dual-frequency echo sounder. The echo sounder employs two transducers, one operating at a high frequency and the other at a low frequency. This method should be performed to precisely ascertain the in-situ thickness of the fluid mud layer (PIANC, 2014).
Data availability statement
The original contributions presented in the study are included in the article. Further inquiries can be directed to the corresponding author.
Author contributions
FSA: Methodology, Writing – original draft, Writing – review & editing. MS: Methodology, Conceptualization, Writing – review & editing. FS: Methodology, Writing – review & editing. SH: Resources, Writing – review & editing. MH: Methodology, Writing – review & editing.
Funding
The author(s) declare that no financial support was received for the research, authorship, and/or publication of this article.
Acknowledgments
The authors would like to thank Ms. Samane Ahmadi for her invaluable support. Thanks are also extended to the Rheometry Laboratory of the Materials and Energy Research Center for providing the necessary facilities and resources. Additionally, we appreciate the financial support from the Ports and Maritime Organization (PMO) of Iran for field works.
Conflict of interest
The authors declare that the research was conducted in the absence of any commercial or financial relationships that could be construed as a potential conflict of interest.
Publisher’s note
All claims expressed in this article are solely those of the authors and do not necessarily represent those of their affiliated organizations, or those of the publisher, the editors and the reviewers. Any product that may be evaluated in this article, or claim that may be made by its manufacturer, is not guaranteed or endorsed by the publisher.
References
Greiser N. (2007). Monitoring of the nautical depth generated by WID in the Schleusenhafen/Fischereihafen 2005 and 2006No Title (Bremerhaven, Germany: Bremenports GmbH & Co. KG, Dredging Dept).
Haghshenas S. A., Samsami F., Arab A. R., Soltanpour M. (2012). Sediment Constituent Analysis ; Application of a new " Toolbox " for the study of Iranian coastlines. (Tehran: Ports and Maritime Organization of Iran (PMO)).
Khakbaft Consulting Engineers. (2021a). The ports and maritime organization of Iran. Data collection, field visits, and integration of Anzali Port. (Tehran: Ports and Maritime Organization of Iran (PMO)).
Khakbaft Consulting Engineers. (2021b). The ports and maritime organization of Iran. Data collection, field visits, and integration of Khorramshahr Port, Vol. 164.
Kirby R., Wurpts R., Greiser N. (2008). Chapter 1 Emerging concepts for managing fine cohesive sediment. Proc. Mar. Sci. 9, 1–15. doi: 10.1016/S1568-2692(08)80003-4
Kirichek A., Chassagne C., Winterwerp J. C., Vellinga T. (2018). How navigable are fluid mud layers? Terra Aqua , 7–18.
Mcanally W. H., Asce F., Friedrichs C., Hamilton D., Hayter E., Shrestha P., et al. (2007). Management of fluid mud in estuaries , bays , and lakes . I : present state of understanding on character and behavior, (ASCE) Vol. 9–22. doi: 10.1061/(ASCE)0733-9429(2007)133:1(9)
McAnally W. H., Kirby R., Hodge S. H., Welp T. L., Greiser N., Shrestha P., et al. (2016). Nautical depth for U.S. Navigable waterways: A review. J. Waterw Port Coastal Ocean Eng. 142, 1–13. doi: 10.1061/(ASCE)WW.1943-5460.0000301
Mehta A. J., Samsami F., Khare Y. P., Sahin C. (2014). Fluid mud properties in nautical depth estimation. J. Waterw Port Coastal Ocean Eng. 140, 210–222. doi: 10.1061/(ASCE)WW.1943-5460.0000228
Meinsma R., Wiertsema & Partners (2012). Project plan sustainable maintenance dredging Delfzijl: Phase 3 full scale field tests. Project Rep. November 01-2012: (Delfzijl, Netherlands).
Mezger T. G. (2014). The Rheology Handbook: For Users of Rotational and Oscillatory Rheometers. Hannover, Germany: Vincentz Network, Corp..
Nie S., Jiang Q., Cui L., Zhang C. (2020). Investigation on solid-liquid transition of soft mud under steady and oscillatory shear loads. Sediment Geol [Internet]. 397, 105570. doi: 10.1016/j.sedgeo.2019.105570
National Research Council (NRC). (1983). Criteria for the depths of dredged navigational channels. (Washington, DC, USA: National Academies Press).
Parker W. R., Kirby R. (1982). Time dependent properties of cohesive sediment relevant to sedimentation management - European experience. In: Lewis L. R. (ed) Estuarine comparisons. Academic Press, 573–589.
PIANC (2014). Harbour approach channels design guidelines. PIANC report no. 121 Vol. 145 p (Brussels: PIANC Maritime Navigation Commission).
Sakakiyama T., Bijker E. W. (1989). Mass transport velocity in mud layer due to progressive waves. Rep Coastal Engineering Group, Delft University of Technology, Netherlands.
Samsami F., Haghshenas S. A., Soltanpour M. (2022). Physical and rheological characteristics of sediment for nautical depth assessment in bushehr port and its access channel Vol. 14 (Basel, Switzerland: Water (Switzerland).
Shakeel A., Kirichek A., Chassagne C. (2019). Is density enough to predict the rheology of natural sediments? Geo-Marine Lett. 39, 427–434. doi: 10.1007/s00367-019-00601-2
Shakeel A., Kirichek A., Chassagne C. (2020a). Yield stress measurements of mud sediments using different rheological methods and geometries: An evidence of two-step yielding. Mar. Geol 427, 106247. doi: 10.1016/j.margeo.2020.106247
Shakeel A., Kirichek A., Chassagne C. (2020b). Rheological analysis of mud from Port of Hamburg, Germany. J. Soils Sediments. 20, 2553–2562. doi: 10.1007/s11368-019-02448-7
Shakeel A., MacIver M. R., van Kan P. J. M., Kirichek A., Chassagne C. (2021). A rheological and microstructural study of two-step yielding in mud samples from a port area. Colloids Surfaces A Physicochem Eng. Asp 624, 126827. doi: 10.1016/j.colsurfa.2021.126827
Shakeel A., Zander F., de Klerk J. W., Kirichek A., Gebert J., Chassagne C. (2022). Effect of organic matter degradation in cohesive sediment: a detailed rheological analysis. J. Soils Sediments 22, 2883–2892. doi: 10.1007/s11368-022-03156-5
Soltanpour M., Samsami F. (2011). A comparative study on the rheology and wave dissipation of kaolinite and natural Hendijan Coast mud, the Persian Gulf. Ocean Dyn 61, 295–309. doi: 10.1007/s10236-011-0378-7
Soltanpour M., Shamsnia S. H., Shibayama T., Nakamura R. (2018). A study on mud particle velocities and mass transport in wave-current-mud interaction. Appl. Ocean Res. 78, 267–280. doi: 10.1016/j.apor.2018.06.019
Van Kessel T., Blom C. (1998). Rheology of cohesive sediments: Comparison between a natural and an artificial mud. J. Hydraul Res. 36, 591–612. doi: 10.1080/00221689809498611
Whitehouse R., Soulsby R., Roberts W M. H. (2000). Dynamics of estuarine muds: a manual for practical applications (London: homas Telford).
Winterwerp J. C., van Kesteren W. G. M. (2004). Introduction to the physics of cohesive sediment dynamics in the marine environment In: van Loon T. Developments in sedimentology. (Amsterdam: Elsevier). 56, 466p.
Wurpts R. W. (2005). 15 years experience with fluid mud: Definition of the nautical bottom with rheological parameters. Terra Aqua. 99), 22–32.
Xu J., Huhe A. (2016). Rheological study of mudflows at Lianyungang in China. Int. J. Sediment Res. 31, 71–78. doi: 10.1016/j.ijsrc.2014.06.002
Keywords: Iranian ports, cohesive sediment, navigation, fluid mud, nautical depth, rheometry
Citation: Shokri Alikhanlou F, Soltanpour M, Samsami F, Haghshenas SA and Hajibaba M (2024) Study of the rheological properties and nautical depth assessment of fine sediments in Iranian ports. Front. Mar. Sci. 11:1474610. doi: 10.3389/fmars.2024.1474610
Received: 01 August 2024; Accepted: 14 October 2024;
Published: 12 November 2024.
Edited by:
Francisco Pedocchi, Universidad de la República, UruguayReviewed by:
Yasuyuki Nakagawa, Port and Airport Research Institute (PARI), JapanDake Chen, Nanjing Hydraulic Research Institute, China
Copyright © 2024 Shokri Alikhanlou, Soltanpour, Samsami, Haghshenas and Hajibaba. This is an open-access article distributed under the terms of the Creative Commons Attribution License (CC BY). The use, distribution or reproduction in other forums is permitted, provided the original author(s) and the copyright owner(s) are credited and that the original publication in this journal is cited, in accordance with accepted academic practice. No use, distribution or reproduction is permitted which does not comply with these terms.
*Correspondence: Fatemeh Shokri Alikhanlou, Zi5zaG9rcmlhbGlraGFubG91QGVtYWlsLmtudHUuYWMuaXI=
†ORCID: Fatemeh Shokri Alikhanlou, orcid.org/0009-0007-9956-8067
Mohsen Soltanpour, orcid.org/0000-0003-4297-093X
Farzain Samsami, orcid.org/0000-0002-4655-8355
Maryam Hajibaba, orcid.org/0000-0003-0592-1370
 Fatemeh Shokri Alikhanlou
 Mohsen Soltanpour
 Farzin Samsami
 S. Abbas Haghshenas
 Maryam Hajibaba