 Huabing Xu
 Mingming He1
- 1College of Electronic and Information Engineering, Guangdong Ocean University, Zhanjiang, China
- 2Zhongshan City Banfu Town Comprehensive Administrative Law Enforcement Bureau, Zhongshan, China
- 3Chinese Academy of Sciences (CAS) Key Laboratory of Tropical Marine Bio-resources and Ecology, Guangdong Provincial Key Laboratory of Applied Marine Biology, South China Sea Institute of Oceanology, Chinese Academy of Sciences, Guangzhou, China
- 4Key Laboratory of Tropical Marine Biotechnology of Hainan Province, Sanya Institute of Ocean Eco-Environmental Engineering, South China Sea Institute of Oceanology, Sanya, China
- 5Sanya National Marine Ecosystem Research Station, Tropical Marine Biological Research Station in Hainan, South China Sea Institute of Oceanology, Chinese Academy of Sciences, Sanya, China
The distribution characteristics of size-fractionated Chlorophyll a (Chl-a) and the environmental factors were studied in the coastal area of the Leizhou Peninsula in January 2022. The result showed that Chl-a ranged from 0.39 to 4.78 mg/m3 (averaging 1.21 mg/m3) at the surface and 0.43 to 2.78 mg/m3 (averaging 1.04 mg/m3) at the bottom layer, respectively. The spatial distribution of Chl-a concentration was associated with salinity. High Chl-a concentration was observed in the eastern part of the Leizhou Peninsula characterized by lower salinity, and low Chl-a concentration in Qiongzhou Strait with higher salinity. Nanophytoplankton (2–20 µm) was the dominant contributor, accounting for 61.3% and 63.7% of the total Chl-a at the surface and bottom layer, respectively. Both microphytoplankton (>20 µm) and nanophytoplankton displayed increased Chl-a with the increase in total Chl-a. Salinity, nutrients and temperature appear to influence the phytoplankton size structure in the coastal area of the Leizhou Peninsula. Additionally, the regulation of nutrient varied among phytoplankton of different sizes. This study contributed to our understanding of coastal ecosystem processes and has potential implications for coastal management and monitoring efforts.
1 Introduction
The size structure of phytoplankton communities plays an important role in influencing the function of aquatic ecosystems (Fortier et al., 1994; Froneman et al., 2004), since a suite of phytoplankton biochemical functions was associated with size, such as metabolic rate, growth and nutrient uptake (Finkel et al., 2009). The photo-physiological properties of phytoplankton varied depending on the cell size (Uitz et al., 2008). Large cells may be more efficient in carbon storage than the smaller cells. Hence, the size of phytoplankton directly impacts the photosynthetic rate and ocean heating. The export production of phytoplankton was also influenced by size. Generally, large phytoplankton cells tend to be grazed by large zooplankton via a short, classical food chain, showcasing a substantial capability for organic matter exportation (Rousseaux and Gregg, 2014; Tilstone et al., 2017). This transfer of fixed carbon and nutrients from the surface to the deep ocean leads to the prolonged sequestration of carbon from the ocean-atmosphere system, with a time scale spanning hundreds to thousands of years (Eppley and Peterson, 1979; Falkowski et al., 2000). In contrast, the carbon fixed by small phytoplankton cells primarily undergoes transfer through the microbial food web, facilitating the recycling of organic matter within the euphotic layer (Azam, 1998). Therefore, studies of the mechanisms that regulate the size distribution of the phytoplankton community in relation to environmental forcing can provide greater insight into spatio-temporal variability of the food web structure and the regulation of the biological pump.
The major photosynthetic pigment in marine phytoplankton, Chlorophyll a (Chl-a), is generally thought to be the most widely used proxy of total phytoplankton biomass (Behrenfeld and Falkowski, 1997). The Chl-a concentration can be routinely estimated using satellite remote sensing, in situ (fluorometers), or measured on filtered discrete samples though the fluorometric method (Liao et al., 2021), while the phytoplankton carbon was more challenging to measure. Phytoplankton can be typically classified into three size classes: microphytoplankton (>20 µm), nanophytoplankton (2–20 µm), and picophytoplankton (<2 µm) (Sieburth et al., 1978). Generally, picophytoplankton dominate in oligotrophic waters such as the subtropical gyres, while nanophytoplankton and microphytoplankton in eutrophic water, especially the upwelling areas (Brewin et al., 2010; Uitz et al., 2010; Marañón et al., 2012). Numerous studies have been conducted to examine the factors that drive spatial gradients in phytoplankton size structure in the world’s oceans. It is widely recognized that phytoplankton size structure is influenced by both top-down (predation-driven) and bottom-up (resource-driven) controls. Zooplankton shape the size structure of the phytoplankton community through their grazing activities (Varela et al., 2002). The presence of nutrients, which can be a consequence of eutrophication processes, can promote the growth and dominance of specific phytoplankton species (Albin et al., 2022). Environmental factors such as temperature and light also play a significant role in shaping the size structure of the phytoplankton community (Cermeño et al., 2005; Kocum and Sutcu, 2013; López-Urrutia and Morán, 2015). Moreover, changes in hydrodynamic conditions, including water mixing and turbulence, could lead to shift in phytoplankton species composition (Riegman et al., 1993). These factors interact in complex ways, and their relative importance can vary across different regions and ecosystems.
The Leizhou Peninsula is the third-largest peninsula in China and is located at the southern tip of the Chinese mainland (Xia et al., 2022). It covers an area of more than 13000 km2 and has a coastline that is approximately 1450 km long. The Leizhou Peninsula is surrounded by the Zhanjiang Bay to the east, the Qiongzhou Strait to the south, and the Beibu Gulf to the west. The coastline of the peninsula is winding, and there are numerous harbors and islands near the peninsula. The coastal region of the Leizhou Peninsula is a complicated system that is influenced by multiple factors, including riverine inputs, tide processes, and human activities (Zhang et al., 2021). For example, an irregular semi-diurnal tide is observed on the east coast of the Leizhou Peninsula, while the west coast experiences a regular diurnal tide. The differences in terrestrial input and hydrodynamic conditions around the Leizhou Peninsula were associated with the distinct spatial variations in nutrient structure and phytoplankton abundance in the coastal areas. East coast of the Leizhou Peninsula exhibited phosphorus limitation, while the west area was nitrogen limitation (Feng et al., 2019). Phytoplankton cell abundances are more than 10 times higher in the northeast coastal areas compared to the southeast coastal areas of the Leizhou Peninsula (Gong et al., 2012). Coastal waters around the Leizhou Peninsula provide an interesting location to explore relationships between phytoplankton community and environmental variability. However, the distribution characteristics of phytoplankton particle size structure at this region remain poorly understood. This study aims to fill this knowledge gap by evaluating the distribution characteristics of phytoplankton particle size structure and its relationship with environmental factors in the coastal waters of the Leizhou Peninsula. By exploring the regulatory mechanisms of environmental factors on phytoplankton size structure, this research seeks to provide insights into the complex interactions shaping the phytoplankton community in this region.
2 Materials and methods
2.1 Study area
A cruise (R/V Tianlong) was conducted in the coastal waters of Leizhou Peninsula during January 4 to January 11, 2022. A total of 43 stations were visited (Figure 1). These stations were strategically chosen to investigate and compare the distinct characteristics of these regions in terms of their nutrient dynamics, phytoplankton communities, and hydrodynamics. To facilitate a comparison between regions in the study, the areas were grouped as follows: The Qiongzhou Strait consisted of stations B22, B23, B24, B27, B41, B43, B50, B51 and B52. The east coast of the Leizhou Peninsula encompassed stations B1, B2, B3, B8, B9, B10, B11, B12, B14, B15, B17, B49, B53, B54 and B55. The remaining stations were designated as the west coast of the Leizhou Peninsula. Temperature and salinity were determined by using a WQMx water quality monitor (Sea-Bird Scientific). Water samples were collected by Niskin bottles for the measurements of nutrient concentrations and size-fractionated Chl-a at both the surface and bottom layers (3 m above the seabed). Water depth of stations ranged between 9.5 to 85 m (Figure 1). The average water depth of all the stations was 24.6 m.
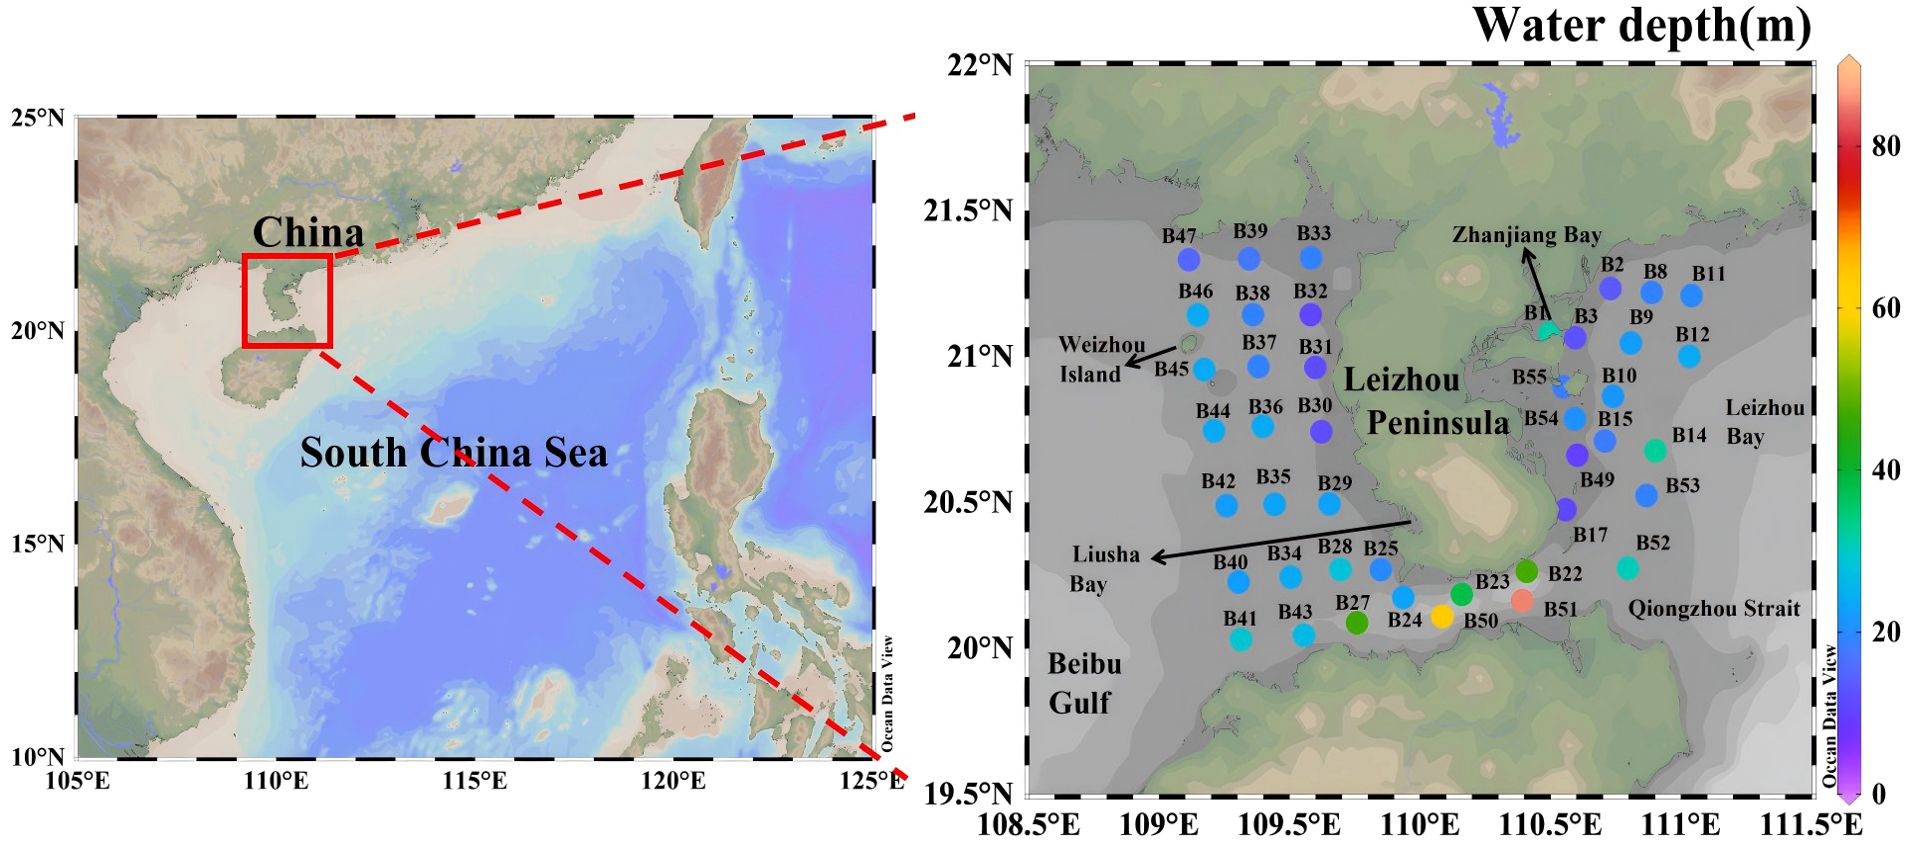
Figure 1. Sampling stations in the coastal zone of the Leizhou Peninsula in January 2022.
2.2 Sampling and analysis
For the size-fractionated Chl-a concentrations measurement, water samples of 0.5–1 L were sequentially filtered through 20 µm, 2 µm and 0.2 µm pore size Millipore filters. The filters were kept in dark and stored in a –20°C freezer until laboratory analysis. After the extraction in 90% acetone for 24 h, Chl-a was measured fluorometrically using a fluorometer (Turner Designs, 10-AU) before and after acidification (Knap et al., 1996). The total Chl-a was calculated by summing each size-fractionated Chl-a.
Water samples for nutrients determination were filtered through 0.45 μm membranes and subsequently stored in 100-mL polyethylene bottles at –20°C. The concentrations of nitrate (NO3-), nitrite (NO2-), ammonium (NH4+), phosphate (PO43-) and dissolved silicate (SiO32-) were measured using an auto-analyzer (Skalar Analytical SAN++, Netherlands) (Weatherburn, 1967; Knap et al., 1996). Nitrate was determined by reduction to nitrite via a copperized cadmium column. Nitrite was determined by diazotizing with sulfanilamide and coupling with N-(1-naphthyl)ethlyenediaminie dihydrochloride. The phenol-hypochlorite reaction was used for ammonium analysis. Phosphorus analysis was performed by the molybdenum blue method, and SiO32- by the silicomolybdate blue method. Dissolved inorganic nitrogen (DIN) is the sum of ammonium, nitrite and nitrate.
2.3 Statistical analysis
The Figures were plotted using Ocean Data View and ArcGIS 10.8 software. Comparisons involving multiple groups were performed using a one-way analysis of variance (ANOVA) conducted with SPSS software. The relationship between phytoplankton size structure and environmental variables was analyzed using the CANOCO 5 software. The redundancy analysis (RDA) was chosen, since the maximum gradient length of detrended correspondence analysis was shorter than 3.0 (Zhang et al., 2014). The results of the Monte Carlo permutation test showed all the canonical axes were significant (p<0.05), indicating phytoplankton size structure and environmental factors were highly correlated. Pearson’s correlation analysis was used to identify which environmental factor has a significant impact on size-fractionated Chl-a.
3 Results
3.1 Temperature and salinity
The surface temperature in the studied area varied between 18.50°C and 21.29°C, with an average value of 20.21°C. The highest surface temperature was found at the southwest part of the Leizhou Peninsula (station B28), while the lowest temperature was observed in the north of Beibu Gulf (station B47) (Figure 2A). Regarding the bottom layer, temperatures ranged from 18.50°C to 20.74°C, with an average of 20.08°C. The highest temperature in the bottom layer was also found at the southwest part of the Leizhou Peninsula (station B34), and the lowest at station B47. It should be noted that there was no significant difference in temperature between the surface and bottom layers.
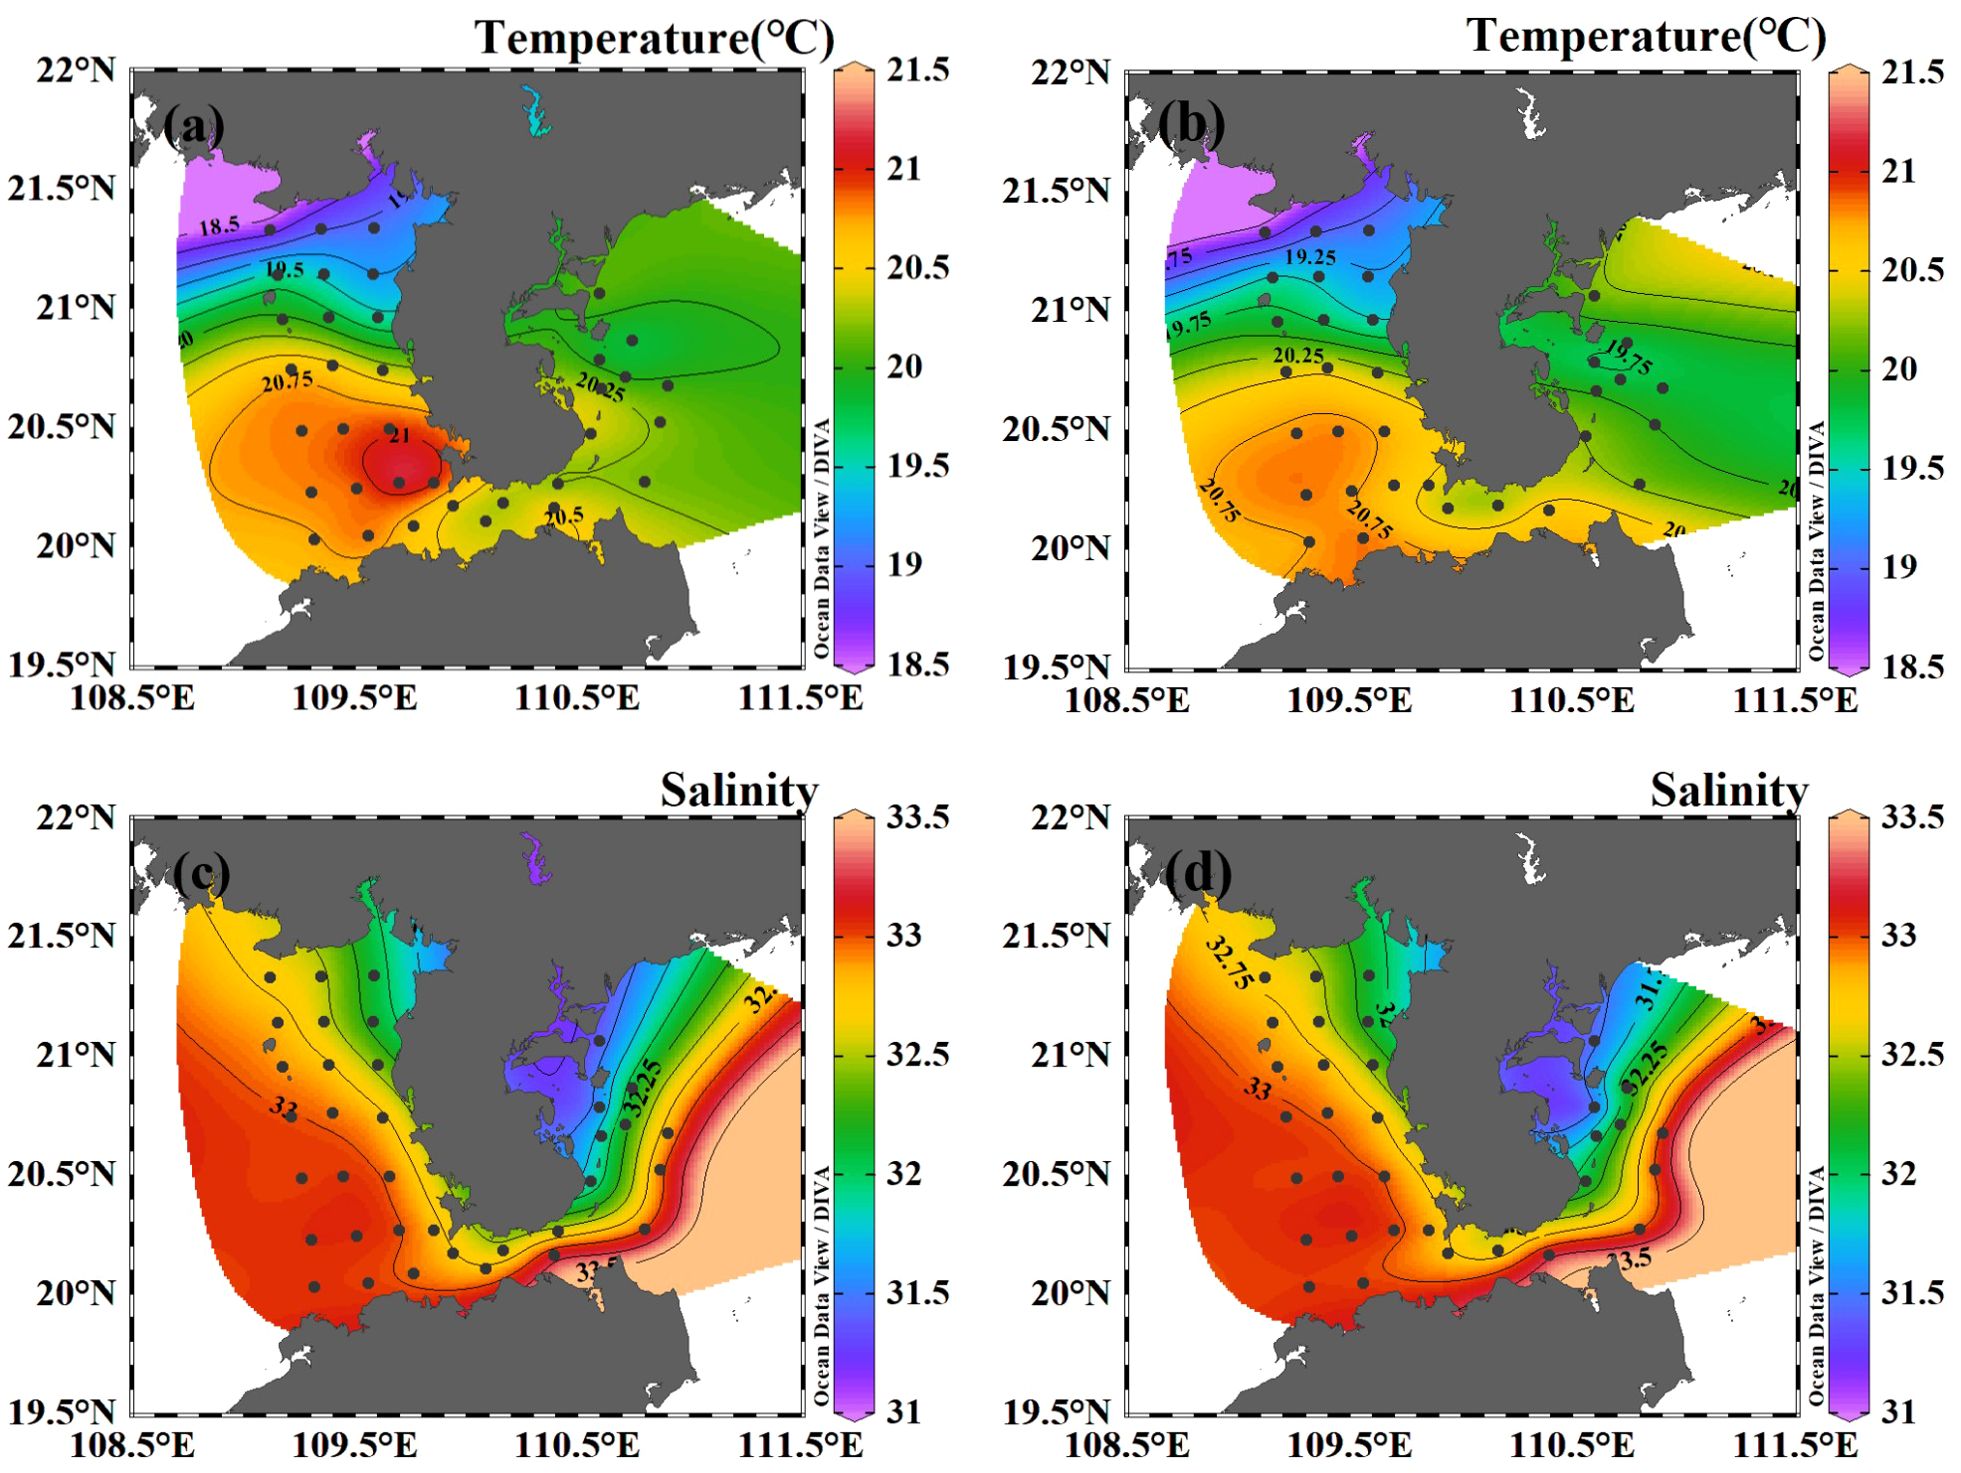
Figure 2. The horizontal distribution of temperature and salinity in the coastal water of the Leizhou Peninsula in January 2022 (Surface: A, C; Bottom: B, D).
The surface salinity in the studied area varied between 31.34 and 33.44, with an average salinity of 32.65. At the bottom layer, salinity ranged from 31.17 to 33.45, with an average of 32.67. The highest salinity was detected at the Qiongzhou Strait, while the lowest salinity was observed at the mouth of Leizhou Bay (Figures 2C, D).
3.2 Nutrients
Surface nitrate concentrations varied from 2.25 to 13.28 µmol/L, with an average of 5.40 µmol/L (Figure 3A). High surface nitrate concentration was found at the waters near the Leizhou Bay and Zhanjiang Bay. Concentration of nitrate presented a seaward decreasing trend in the surface water. The spatial distribution of surface nitrite was similar to that of nitrate. However, the average nitrite was ~0.05 µmol/L, which was much lower compared to nitrate and ammonium at the surface. Surface ammonium concentration was lower than 3.50 µmol/L in most areas, except four stations (30, 39, 41, 49) characterized by high ammonium concentration (>15.00 µmol/L). Phosphate and silicate concentrations varied between 0.21 to 1.45 µmol/L and 1.96 to 17.22 µmol/L, respectively, with high values occurring in the water near the Zhanjiang Bay. The bottom nitrate concentrations ranged between 2.01 to 8.68 µmol/L (Figure 3B). Averaged phosphate and silicate concentrations were slightly higher at bottom (0.99 and 10.31 µmol/L) than at surface (0.71 and 7.53 µmol/L).
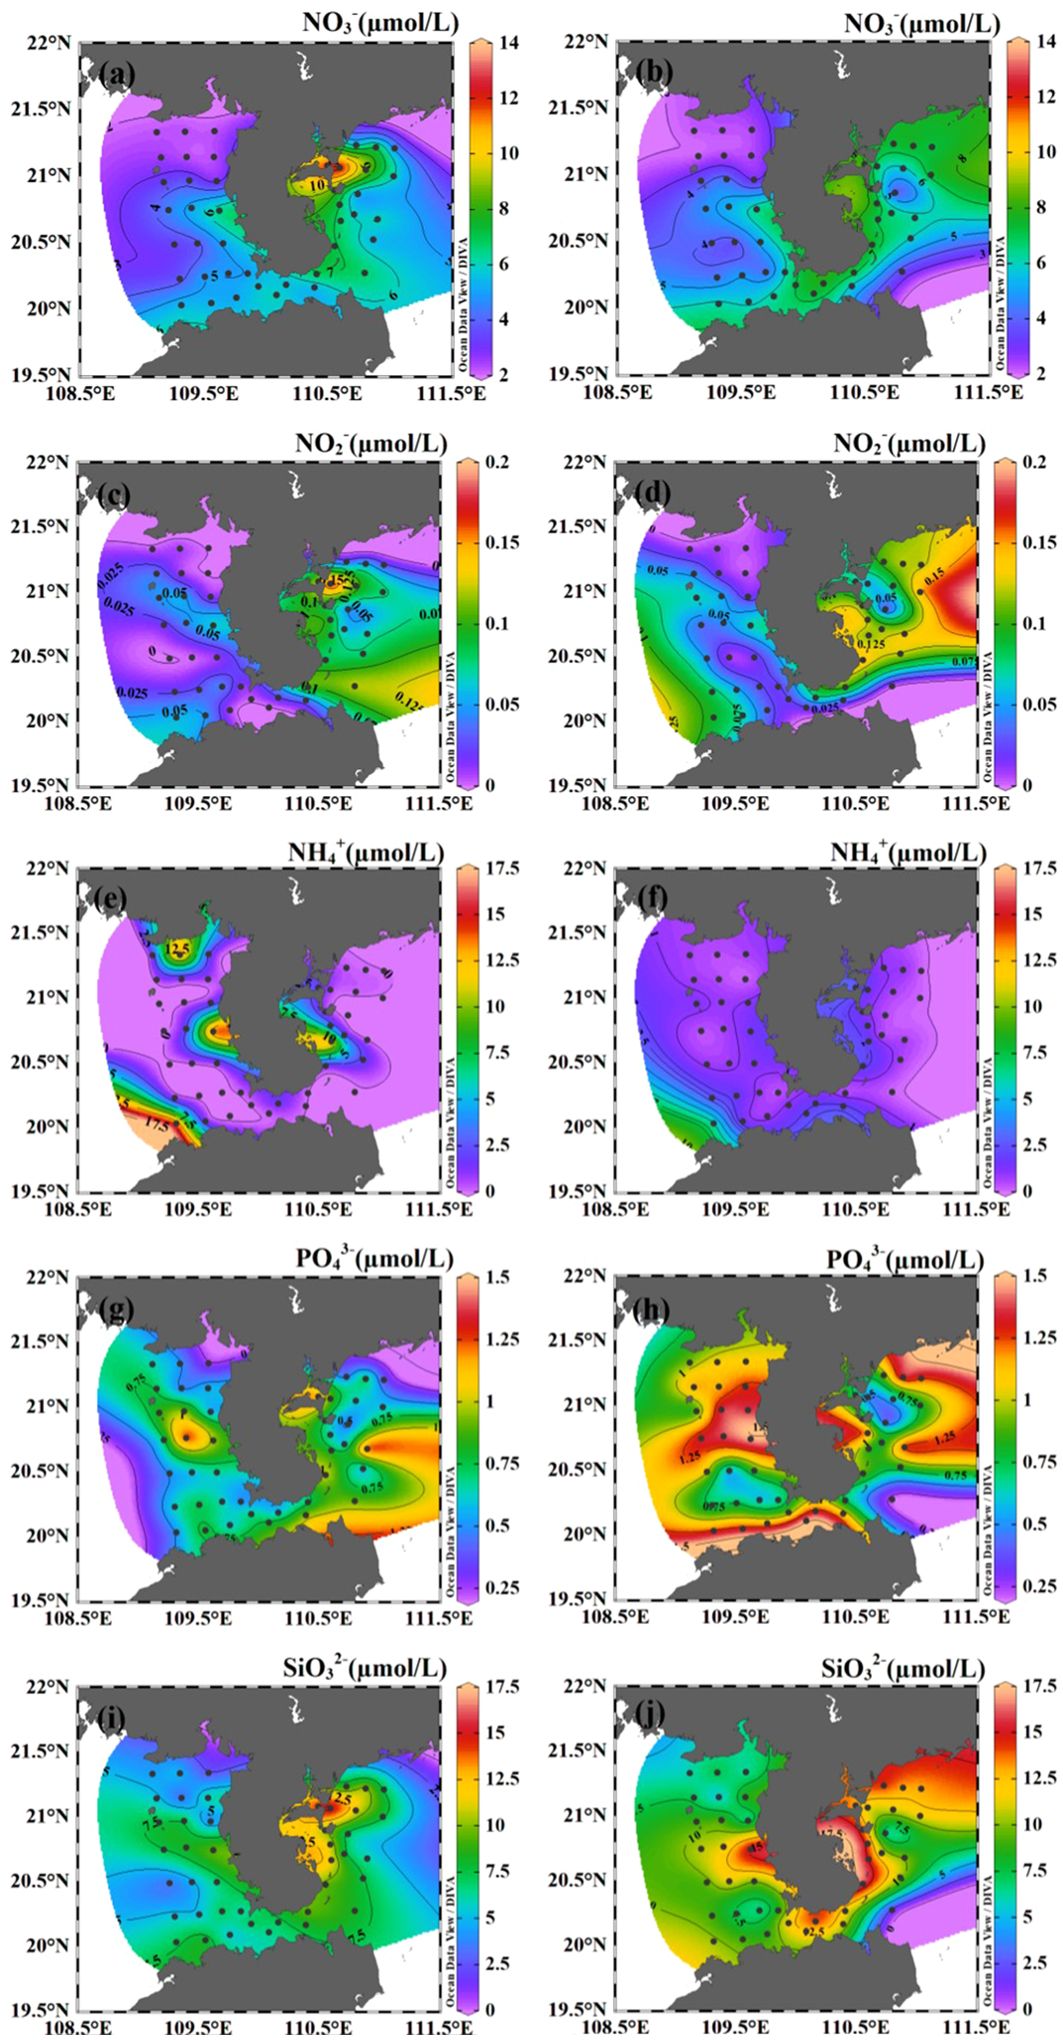
Figure 3. The horizontal distribution of nutrients (NO3-, NO2-, NH4+, PO43- and SiO32-) in the coastal water of the Leizhou Peninsula in January 2022 (Surface: A, C, E, G, I; Bottom: B, D, F, H, J).
3.3 Total and size-fractionated Chl-a
Surface Chl-a concentration was in the range of 0.39 to 4.78 mg/m3, with an average of 1.21 mg/m3. The surface Chl-a concentration was high in Zhanjiang Bay and Leizhou Bay, particularly at station B15, where the Chl-a concentration reached 4.78 mg/m3 (Figure 4A). The phytoplankton size structure in the Zhanjiang Bay and Leizhou Bay was dominated by the nano-fraction, with 64.5% of the phytoplankton being in the nano-size range at the surface and 72.3% at the bottom (Figure 4). However, the lowest surface Chl-a was found at the mouth of Zhanjiang Bay (station B1) where microphytoplankton was dominant (64.8%). High Chl-a concentrations were also found at the waters of Weizhou Island (stations B45 and B46). The size structure of the phytoplankton community was dominated by micro-phytoplankton in these two stations where proportion of micro-phytoplankton Chl-a to total Chl-a was 47.9% at surface and was 63.9% at bottom. The Qiongzhou Strait was characterized by a comparatively low Chl-a concentration, and the community structure in this area was dominated by pico- and nano-size organisms. Low Chl-a concentration also observed at the stations B39 and B47, which are located in the north part of the Beibu Gulf, and these stations exhibited a high proportion of picophytoplankton. Bottom Chl-a concentration was in the range of 0.42 to 2.77 mg/m3, with an average of 1.04 mg/m3. At the bottom, the waters near Weizhou Island exhibited the highest Chl-a concentration, while the lowest Chl-a concentration was observed at station B47, located in the northern part of the Beibu Gulf. Nanophytoplankton was dominated at most stations, accounting for 61.3% of the phytoplankton community at the surface and 63.7% at the bottom.
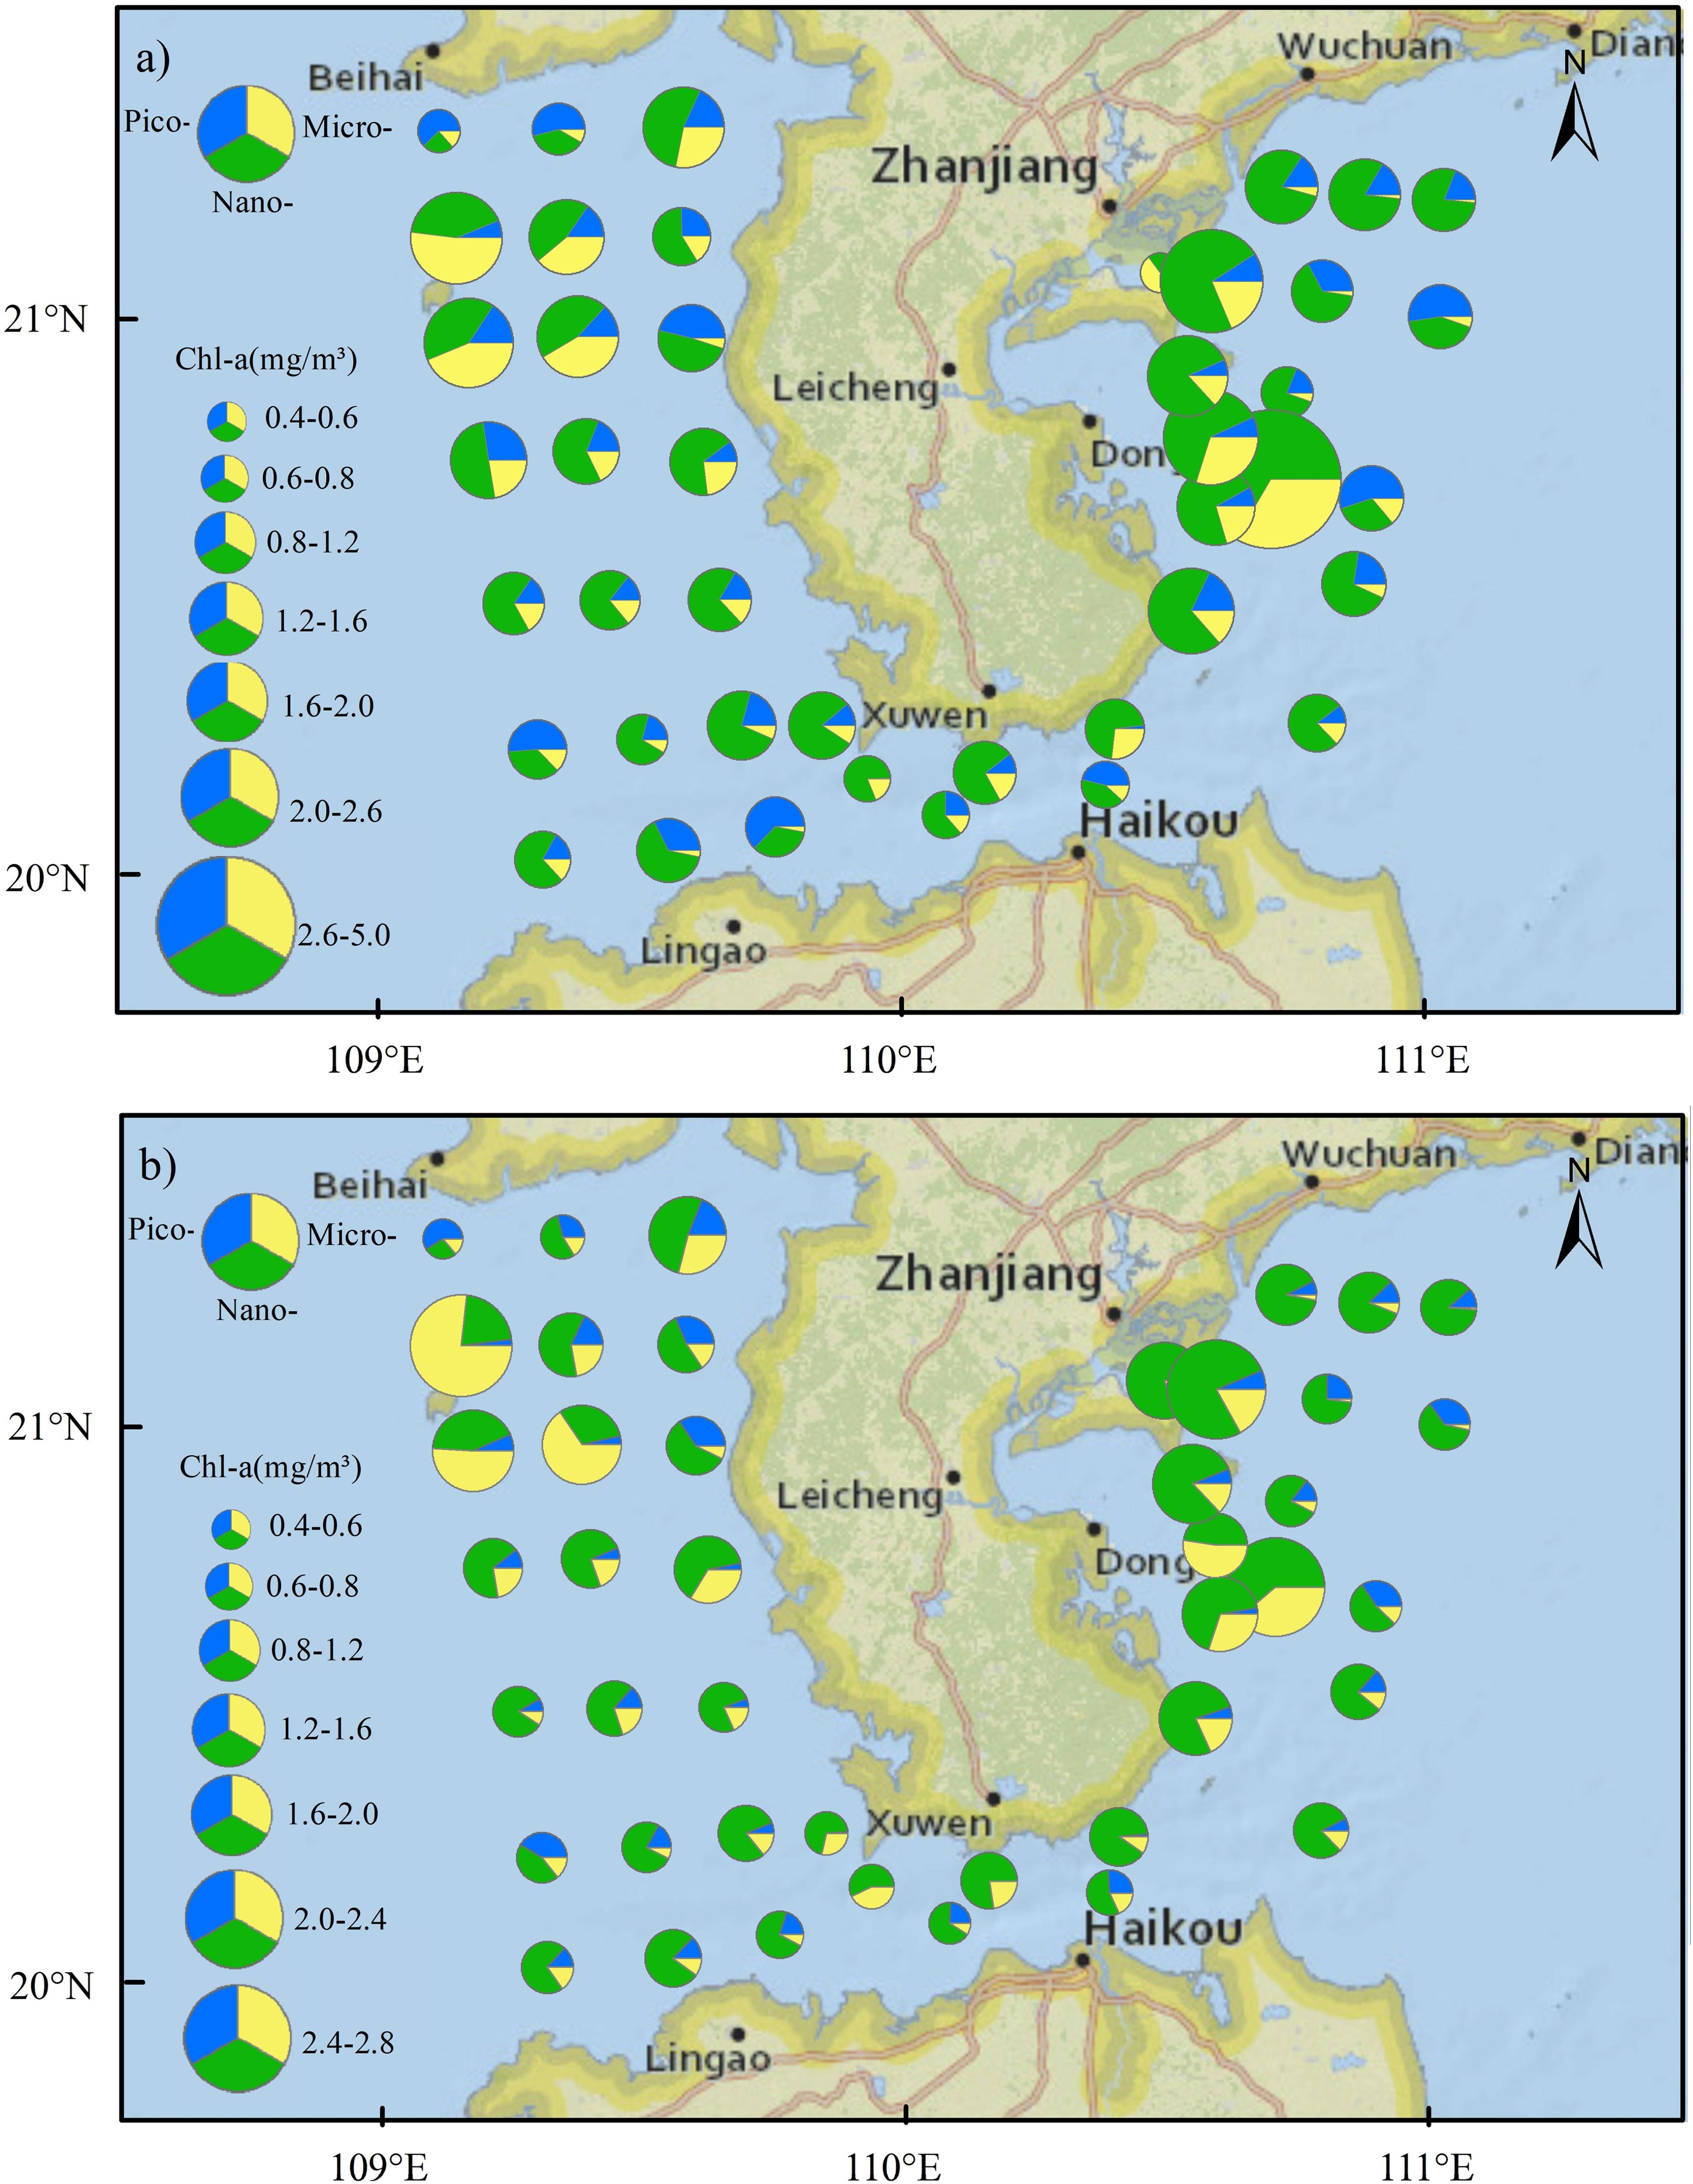
Figure 4. The horizontal distribution of size-fractionated Chl-a concentration in the coastal water of the Leizhou Peninsula in January 2022 (Surface: A; Bottom: B).
The Chl-a concentration of pico- and micro-sized phytoplankton did not exhibit significant differences among the three regions: the eastern and western parts of the Leizhou Peninsula and the Qiongzhou Strait (Table 1). The surface Chl-a concentration of nano-sized phytoplankton was the highest in the eastern part of the Leizhou Peninsula. Furthermore, at the bottom, nanophytoplankton showed significantly higher levels in the eastern part of the Leizhou Peninsula compared to both the western region and the Qiongzhou Strait. The distribution of total Chl-a concentration followed a similar pattern.
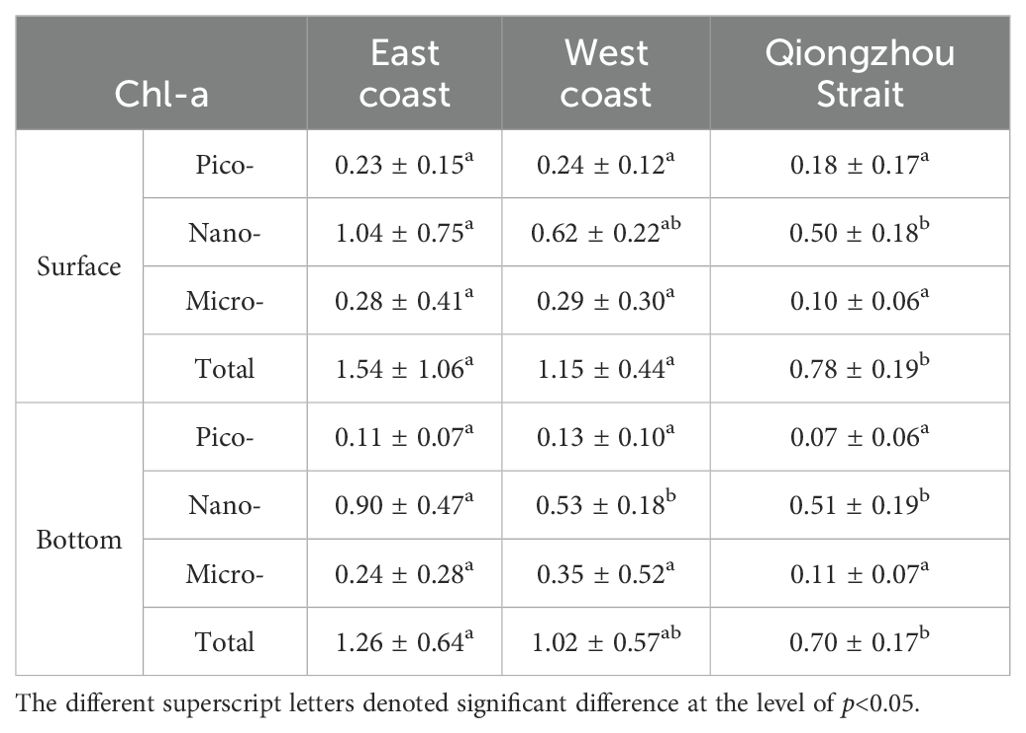
Table 1. Mean ± SD of Chl-a (mg/m3) in three regions.
The size structure of phytoplankton showed a correlation with the total Chl-a concentration. (Figure 5). The Chl-a concentration of microphytoplankton and nanophytoplankton was significantly positive with the total Chl-a concentration at both surface and bottom (p<0.01). The Chl-a concentration of picophytoplankton exhibited a negative relationship with the total Chl-a concentration at both the surface and bottom. However, this relationship did not reach statistical significance.
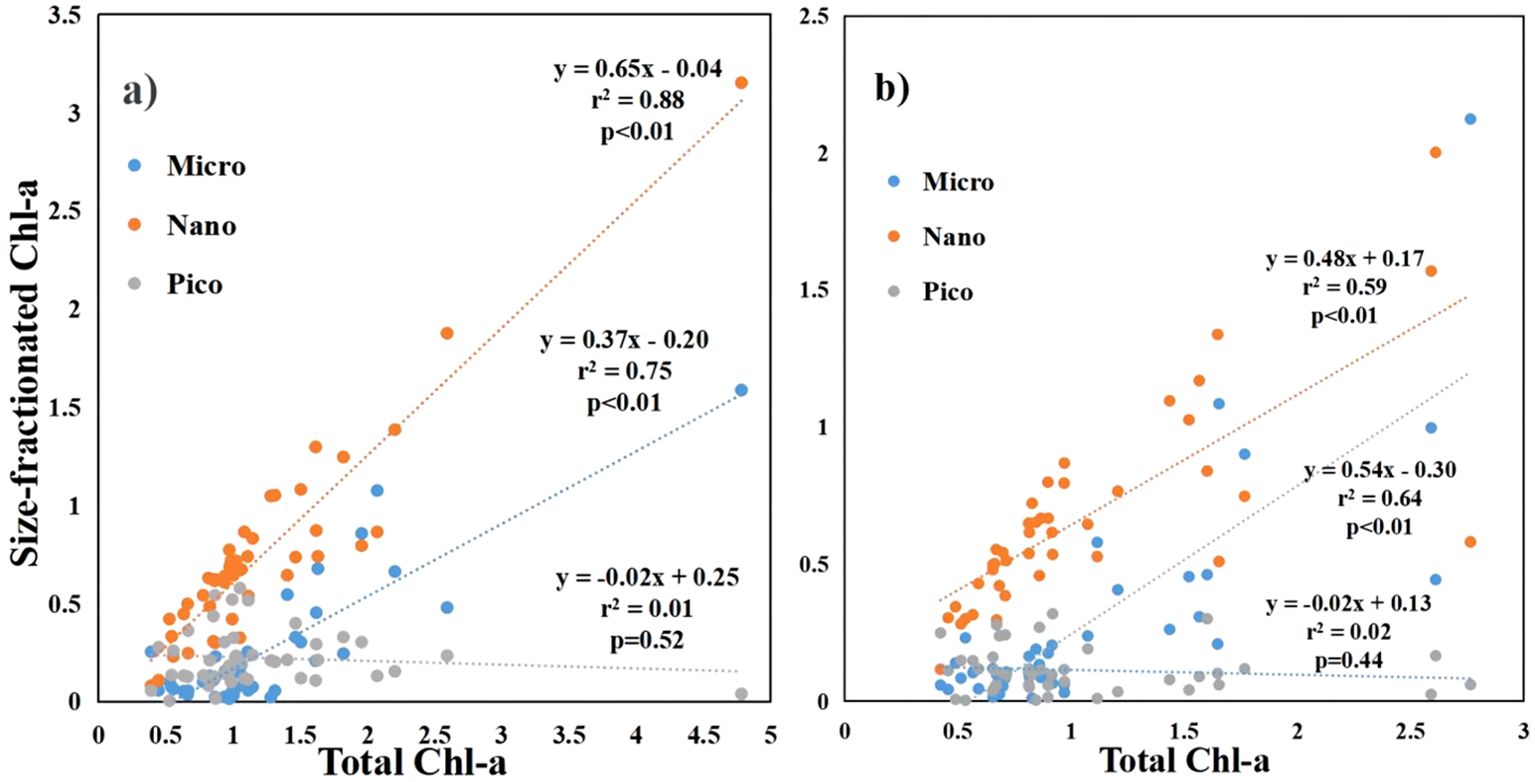
Figure 5. The relationship between size-fractionated Chl-a and total Chl-a in the coastal water of the Leizhou Peninsula in January 2022 (Surface: A; Bottom: B).
3.4 Relationships between environmental variables and Chl-a
The RDA analysis provided further insight into the relationship between phytoplankton size structure and environmental variables. At the surface, the first two axes of the RDA explained 88.36% and 10.44% of the total variation for the relationship between phytoplankton size structure and environmental variables, and the eigenvalues were 0.293 and 0.035, respectively. At the bottom, the first two axes of the RDA explained 65.65% and 32.23% of the total variation for the relationship between phytoplankton size structure and environmental variables, and the eigenvalues were 0.220 and 0.108, respectively (Figure 6). Above results indicated that there was a significant correlation between phytoplankton size structure and environmental variables. At the surface layer, the Chl-a concentration of nanophytoplankton showed a positive correlation with nitrite (p<0.05) and a negative correlation with salinity (p<0.01). However, no significant relationship was found between environmental factors and Chl-a of picophytoplankton and microphytoplankton at the surface.
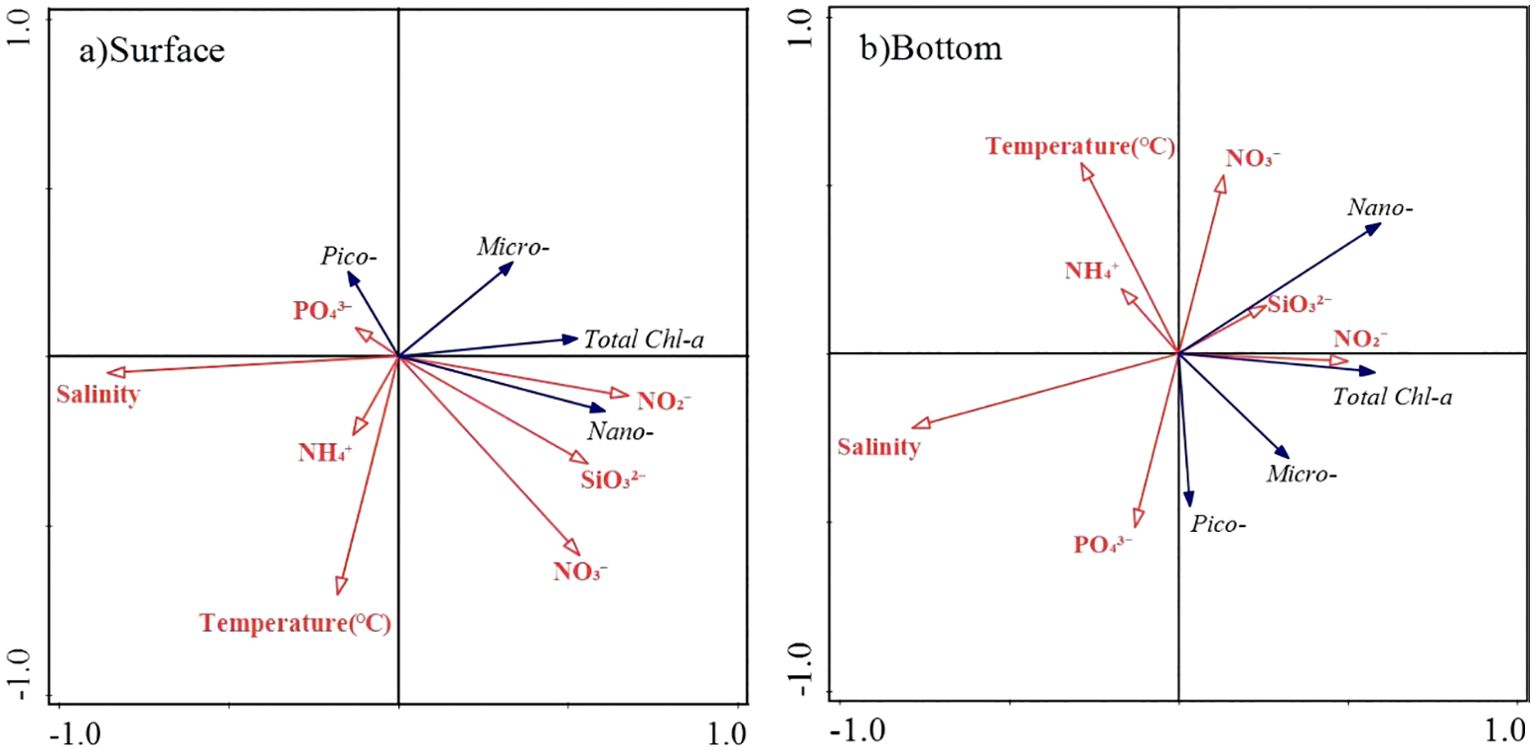
Figure 6. The RDA analysis of size-fractionated Chl-a and environmental factors in the coastal water of the Leizhou Peninsula in January 2022 (Surface: A; Bottom: B).
At the bottom layer, the Chl-a of picophytoplankton was significantly negatively correlated with temperature, silicate concentration, and nitrate concentration. The Chl-a of nanophytoplankton showed a positive correlation with nitrate and nitrite concentration, and a negative correlation with salinity (Figure 6B). There was no significant relationship was found between Chl-a of microphytoplankton and environmental factors.
4 Discussion
4.1 Spatial variations in Chl-a
Due to limited research on size-fractionated Chl-a in the studied area, we compared our findings with other regions that shares similar latitudes, such as the South China Sea. In the northern South China Sea, the concentration of Chl-a was found to be 0.36 mg/m3 in shallow water (<200 m), and nano- and picophytoplankton accounted for 50.99% and 39.30% of total phytoplankton biomass, respectively (Liu et al., 2016). In the oligotrophic northern South China Sea, the Chl-a concentration further decrease to 0.23 mg/m3, and picophytoplankton became the major contributor to total phytoplankton biomass, accounting for 52.87% (Li et al., 2022). These results indicated a decrease in Chl-a concentration and a transition in dominant species from nano-sized to pico-sized phytoplankton from the coastal to the basin areas in the northern South China Sea.
In this study, there was a general trend of decreasing Chl-a concentration along the salinity gradient, which was evidenced by the negative relationship between salinity and Chl-a concentration in this study (Figure 6). The noticeable high Chl-a concentration was observed in the east coast of the peninsula (Table 1), especially the Zhanjiang Bay and Leizhou Bay (Figure 4). Feng et al. (2019) has reported that the surface Chl-a has a range between 0.09 to 7.35 mg/m3 in the coastal waters of the peninsula in autumn, and the highest value was found at the mouth of Zhanjiang Bay. Gong et al. (2012) showed the phytoplankton cell abundance was the highest in the northeast part of the peninsula. Zheng et al. (2014) has investigated the size-fractionated Chl-a in Zhanjiang Bay, and showed the Chl-a was highest in the summer (21.37 mg/m2), followed by autumn (6.49 mg/m2) and spring (3.05 mg/m2). Furthermore, microphytoplankton dominated in Zhanjiang Bay during the summer and autumn seasons, whereas picophytoplankton dominated during the spring season (Zheng et al., 2014). The high phytoplankton biomass in these areas could be attributed to the influence of higher river discharge, as indicated by the low salinity levels (Figure 2). Several rivers, including the Nandu River, Xixi River, Tongming River and Jianjiang River, transport industrial, agricultural, and domestic wastewater into the northeast part of the peninsula (Xia et al., 2022). In addition, aquaculture activities, specifically fish farming, are potential sources of nutrients that can support the growth of phytoplankton in the northeast part of the peninsula. Results from a hydrodynamic numerical model showed that average concentration and fluxes of land-sourced pollutants in Zhanjiang Bay were very high (Chen et al., 2023). Feng et al. (2019) found that the increase in nitrogen discharges during the rainy days could further increase the biomass in the northeast part of the peninsula.
High Chl-a concentrations were also found in waters of the Weizhou Island (stations B45 and B46). The island is a popular tourist destination and heavily influenced by anthropogenic activities (Yu, 2012; Chen et al., 2013). However, nutrients in these two stations were comparatively low, probably due to external nutrients were exhausted during the studied period. Feng et al. (2019) have also found high Chl-a areas with low nutrients concentration in the coastal waters of Leizhou Peninsula in autumn. Many studies have observed a negative correlation between phytoplankton biomass and nutrient concentrations in coastal waters (Li et al., 2013; Zhang et al., 2015; Li, 2019). This negative correlation is commonly explained by the significant utilization of nutrients by phytoplankton during their growth in areas with high phytoplankton biomass.
The lower Chl-a concentration in the southwest coast (stations B25, B28, B29, B34, B35, B40 and B42) could be attributed to followed reasons. Firstly, this area exhibited a limited input of terrestrial nutrients, as evidenced by high salinity (~33.0) (Figures 2, 3). Secondly, the strong water exchange capacity in this area facilitated the removal of nutrients and others materials (Zhang et al., 2010). Additionally, during the survey period, the southwest coast of the Leizhou Peninsula was primarily influenced by warm, oligotrophic offshore waters (Figure 2). These offshore waters are known for their low nutrient concentrations, which restrict the growth of phytoplankton and consequently lead to reduced Chl-a concentrations.
Similar to the findings of Feng et al. (2019), Chl-a concentration in Qiongzhou Strait was low (Table 1). During winter, the Qiongzhou Strait experienced a strong westward residual flow that possesses high energy (Shi et al., 2002; Chen et al., 2009). This flow carries a substantial amount of nutrients and materials away from the Qiongzhou Strait, leading a low concentration of Chl-a.
4.2 Role of environmental forcing in the regulation of phytoplankton size structure
In this study, temperature, salinity and nutrients were identified to have a significant effect on the phytoplankton size structure. The negative relationship between temperature and biomass of picophytoplankton was detected in the bottom water. Synechococcus and Prochlorococcus are the primary components of picophytoplankton in the oceans. According the study conducted by Xiao et al. (2019), the relative abundances of both Synechococcus and Prochlorococcus increased as the temperature increased within the range of 20.6°C to 31.2°C in the South China Sea, which is in contradiction to our findings. Although temperature was statistically significantly related to the biomass of picoplankton, its effect cannot be statistically separated from other environmental factors, such as nutrients (Agawin et al., 2000). In this study, the lowest temperature, combined with low nutrient levels, was observed in the northern region of Beibu Gulf (Station B47) where the phytoplankton community was dominated by picophytoplankton. This was likely the reason for the negative correlation between picophytoplankton abundance and temperature. Marañón et al. (2012) emphasized that resource availability, rather than temperature, was the key factor explaining the relative success of different algal size classes by conducting a meta-analysis of published data throughout the global oceans. Our study found that salinity has a greater impact on the distribution of phytoplankton size structure in the coastal area of the Leizhou Peninsula. Actually, salinity not only reflects the influence of osmotic pressure changes on phytoplankton (Baklouti et al., 2011), but also can indicate the mixing degree of coastal and offshore waters. Therefore, the negative correlation between salinity and nutrient concentration is a commonly observed pattern in many aquatic systems (Iwata et al., 2005; Liu, 2023). Nutrients were commonly regarded as the main factors affecting the abundance and community composition of phytoplankton (Rousseaux and Gregg, 2015; Villafañe et al., 2015). Generally, large-size phytoplankton, with their higher maximal growth rate and larger half-saturation constant, have a competitive advantage in nutrient-rich waters, while picophytoplankton, with a greater surface to volume ratio, have a competitive advantage in oligotrophic waters (Carrillo et al., 2008). Along the salinity gradient, the biomass of microphytoplankton and nanophytoplankton decreased gradually (Figures 2, 4, 6). This is because nutrients input from rivers can favors the growth of larger-size phytoplankton. Nanophytoplankton are the dominant community in the study area, and the biomass of nanophytoplankton was negatively correlated with salinity. Moreover, the nanophytoplankton biomass was positively correlated with nitrite at the surface and with nitrate at the bottom. This likely suggests that nitrite and nitrate are favorable for the growth of nanophytoplankton. It has been reported that diatoms are the dominant group of phytoplankton in the coastal water of Leizhou Peninsula (Zhu et al., 2003; Gong et al., 2012). As cell size of diatoms typically larger than 2 μm, we infer that the nanophytoplankton community was dominated by diatoms. Diatoms are known to preferentially utilize nitrate as a source of nitrogen for their growth and metabolic processes (Glibert et al., 2016). The optimal ratio for phytoplankton to absorb nutrients is often described as N:P = 16:1. When ratio of a certain nutrient in the water deviates from the optimal ratio, it will potentially limit the growth of phytoplankton. In this study, the measured nitrogen to phosphorus ratios of 11:1 at the surface and 7.9:1 at the bottom indicated a potential nitrogen limitation in the studied area, which was consistent with Gong et al. (2012). Moreover, Chen et al. (2023) showed that most of the Zhanjiang Bay waters has been restricted by nitrogen for over a decade. As a result, the biomass of nanophytoplankton was regulated by nitrogen but not phosphorus in this study. The lower N:P ratio observed at the bottom compared to the surface can be attributed to denitrification processes (Ward, 2013), indicating a more severe nitrogen limitation at the bottom layer. Hence, the nanophytoplankton biomass was regulated by nitrate at bottom. Similarly, Liu et al. (2016) has shown that Chl-a of microphytoplankton and nanophytoplankton were positively correlated with DIN and silicates in the northern South China Sea. A mesocosm experiment demonstrated that phosphorus-enrichment caused no obvious effect on phytoplankton growth, while nitrogen-enrichment greatly increased Chl-a concentration in Daya Bay, northern South China Sea (Song et al., 2019). However, phosphorus limitation was detected in the northern South China Sea during late summer due Pearl River discharge which was characterized by high concentrations of nitrate (∼100 μmol/L) and relatively low phosphate (∼1 μmol/L) (Xu et al., 2008). In addition to the influence of nutrients, grazing by zooplankton can contribute to the dominance of nanophytoplankton. When zooplankton selectively consume larger-sized phytoplankton, it can create favorable conditions for the proliferation of smaller-sized phytoplankton, such as nanophytoplankton. Previous study has found that grazing mortality of microphytoplankton increases significantly with the increase in total Chl-a concentration in the northern South Chia Sea (Dong et al., 2018). Abundance of picophytoplankton was negatively correlated with nitrates and silicates, suggested the picophytoplankton tend to thrive in environments with low nutrient concentrations. In the northern South China Sea, picophytoplankton Chl-a was found to negative with DIN and silicates (Liu et al., 2016). And the similar phenomenon was also observed in Jiaozhou Bay (Sun and Sun, 2012). Moreover, the size structure of phytoplankton was correlated with its biomass. The Chl-a concentrations of micro- and nanophytoplankton increased with rising total Chl-a levels (Figure 5). This result was consistent with previous reports that large phytoplankton dominated in coastal waters with relatively high Chl-a concentrations (Wei et al., 2022). Chl-a played a key role in modeling the size structure in remote sensing applications. In the method proposed by Sathyendranath et al. (2001), it is assumed that small cells dominate at low Chl-a concentrations, while large cells dominate at high Chl-a concentrations. The estimation of Chl-a concentrations for each size class was predicated on the assumption that the shift in the percentage of the three size classes of phytoplankton was a function of the total Chl-a concentration (Brewin et al., 2010). In summary, nutrients from river input were the major factors regulating the phytoplankton community. The regulation of nutrients varied among phytoplankton of different sizes.
5 Conclusions
This study provides useful information for understanding spatial distribution characteristics of size-fractionated Chl-a and its relationship with environmental factors in the coastal area of the Leizhou Peninsula in winter. The distribution of Chl-a exhibited significant spatial variation, which was associated with salinity, with higher Chl-a concentration observed in Leizhou Bay and Weizhou Island, and lower concentration in Qiongzhou Strait. Nanophytoplankton were the most abundant size class of phytoplankton, accounting for over 60% of the total Chl-a. Microphytoplankton and nanophytoplankton were more abundant in the high Chl-a areas. The findings suggested that nutrients, specifically nitrogen and silicates, played an important in shaping the phytoplankton size structure. The Chl-a of nanphytoplankton was related to the nitrogen availability. The negative relationship between picophytoplankton Chl-a and nitrates and silicates suggested that picophytoplankton thrives in environments with low nutrient concentrations. The results of our study supported the classical perspective that the dominant factor influencing the structure of the community is bottom-up control.
Data availability statement
The original contributions presented in the study are included in the article/Supplementary Material. Further inquiries can be directed to the corresponding author.
Author contributions
HX: Formal analysis, Funding acquisition, Writing – original draft, Writing – review & editing. MH: Data curation, Formal analysis, Software, Writing – original draft. JL: Formal analysis, Methodology, Validation, Visualization, Writing – original draft, Writing – review & editing. WZ: Funding acquisition, Supervision, Writing – original draft, Writing – review & editing.
Funding
The author(s) declare that financial support was received for the research, authorship, and/or publication of this article. This research was funded by Innovation Projects of Colleges and Universities in Guangdong Province (2021KQNCX028), the Natural Science Foundation of China (42106148), Open Fund of Key Laboratory of Tropical Marine Biotechnology of Hainan Province (LTMB202201), Scientific Research Start-up Funds of Guangdong Ocean University (R20008), Guangdong Province College Students Innovation and Entrepreneurship Training Program (S202210566065) and Undergraduate Innovation Team of Guangdong Ocean University (CXTD2023017).
Conflict of interest
The authors declare that the research was conducted in the absence of any commercial or financial relationships that could be construed as a potential conflict of interest.
Publisher’s note
All claims expressed in this article are solely those of the authors and do not necessarily represent those of their affiliated organizations, or those of the publisher, the editors and the reviewers. Any product that may be evaluated in this article, or claim that may be made by its manufacturer, is not guaranteed or endorsed by the publisher.
Supplementary material
The Supplementary Material for this article can be found online at: https://www.frontiersin.org/articles/10.3389/fmars.2024.1473950/full#supplementary-material
References
Agawin N. S., Duarte C. M., Agustí S. (2000). Nutrient and temperature control of the contribution of picoplankton to phytoplankton biomass and production. Limnology oceanography 45, 591–600. doi: 10.4319/lo.2000.45.3.0591
Albin K. J., Jyothibabu R., Alok K. T., Santhikrishnan S., Sarath S., Sudheesh V., et al. (2022). Distinctive phytoplankton size responses to the nutrient enrichment of coastal upwelling and winter convection in the eastern Arabian Sea. Prog. Oceanography 203, 102779. doi: 10.1016/j.pocean.2022.102779
Azam F. (1998). Microbial control of oceanic carbon flux: The plot thickens. Science 280, 694–696. doi: 10.1126/science.280.5364.694
Baklouti M., Chevalier C., Bouvy M., Corbin D., Pagano M., Troussellier M., et al. (2011). A study of plankton dynamics under osmotic stress in the Senegal River Estuary, West Africa, using a 3D mechanistic model. Ecol. Model. 222, 2704–2721. doi: 10.1016/j.ecolmodel.2011.04.028
Behrenfeld M. J., Falkowski P. G. (1997). Photosynthetic rates derived from satellite-based chlorophyll concentration. Limnology Oceanography 42, 1–20. doi: 10.4319/lo.1997.42.1.0001
Brewin R. J. W., Sathyendranath S., Hirata T., Lavender S. J., Barciela R. M., Hardman-Mountford N. J. (2010). A three-component model of phytoplankton size class for the Atlantic Ocean. Ecol. Model. 221, 1472–1483. doi: 10.1016/j.ecolmodel.2010.02.014
Carrillo P., Delgado-Molina J. A., Medina-Sánchez J. M., Bullejos F. J., Villar-Argaiz M. (2008). Phosphorus inputs unmask negative effects of ultraviolet radiation on algae in a high mountain lake. Global Change Biol. 14, 423–439. doi: 10.1111/j.1365-2486.2007.01496.x
Cermeño P., Marañón E., Rodríguez J., Fernández E. (2005). Large-sized phytoplankton sustain higher carbon-specific photosynthesis than smaller cells in a coastal eutrophic ecosystem. Mar. Ecol. Prog. Ser. 297, 51–60. doi: 10.3354/meps297051
Chen C., Li P., Shi M., Zuo J., Chen M., Sun H. (2009). Numerical study of the tides and residual currents in the Qiongzhou Strait. Chin. J. Oceanology Limnology 27, 931–942. doi: 10.1007/s00343-009-9193-0
Chen T., Li S., Yu K., Zheng Z., Wang L., Chen T. (2013). Increasing temperature anomalies reduce coral growth in the Weizhou Island, northern South China Sea. Estuarine Coast. Shelf Sci. 130, 121–126. doi: 10.1016/j.ecss.2013.05.009
Chen Y., Sun Y., Shi H., Zhao H., Gao H., Pan G., et al. (2023). Environmental capacity and fluxes of land-sourced pollutants around the Leizhou Peninsula in the summer. Front. Mar. Sci. 10. doi: 10.3389/fmars.2023.1280753
Dong Y., Li Q. P., Liu Z. J., Wu Z. C., Zhou W. W. (2018). Size-dependent phytoplankton growth and grazing in the northern South China Sea. Mar. Ecol. Prog. Ser. 599, 35–47. doi: 10.3354/meps12614
Eppley R. W., Peterson B. J. (1979). Particulate organic matter flux and planktonic new production in the deep ocean. Nature 282, 677–680. doi: 10.1038/282677a0
Falkowski P., Scholes R. J., Boyle E., Canadell J., Canfield D., Elser J., et al. (2000). The global carbon cycle: A test of our knowledge of Earth as a system. Science 290, 291–296. doi: 10.1126/science.290.5490.291
Feng Y., Zhao H., Shi Y. (2019). The concentration of nutrients and Chlorophyll a in the offshore of Leizhou Peninsula in Autumn spatial distribution and their relationship. J. Guangdong Ocean Univ. (in Chinese) 39, 75–82. doi: 10.3969/j.issn.1673-9159.2019.02.010
Finkel Z. V., Beardall J., Flynn K. J., Quigg A., Rees T. A. V., Raven J. A. (2009). Phytoplankton in a changing world: cell size and elemental stoichiometry. J. Plankton Res. 32, 119–137. doi: 10.1093/plankt/fbp098
Fortier L., Le Fèvre J., Legendre L. (1994). Export of biogenic carbon to fish and to the deep ocean: the role of large planktonic microphages. J. Plankton Res. 16, 809–839. doi: 10.1093/plankt/16.7.809
Froneman P. W., Pakhomov E. A., Balarin M. G. (2004). Size-fractionated phytoplankton biomass, production and biogenic carbon flux in the eastern Atlantic sector of the Southern Ocean in late austral summer 1997–1998. Deep-Sea Res. Part II: Topical Stud. Oceanography 51, 2715–2729. doi: 10.1016/j.dsr2.2002.09.001
Glibert P. M., Wilkerson F. P., Dugdale R. C., Raven J. A., Dupont C. L., Leavitt P. R., et al. (2016). Pluses and minuses of ammonium and nitrate uptake and assimilation by phytoplankton and implications for productivity and community composition, with emphasis on nitrogen-enriched conditions. Limnology Oceanography 61, 284–300. doi: 10.1002/lno.10203
Gong Y., Zhang C., Sun X., Zhang Y., Shi Y., Xie Q. (2012). Community characteristics of phytoplankton in the coastal area of Leizhou Peninsula and their relationships with primary environmental factors in the summer of 2010. Acta Ecologica Sin. (in Chinese) 32, 5972–5985. doi: 10.5846/stxb201109011280
Iwata T., Shinomura Y., Natori Y., Igarashi Y., Sohrin R., Suzuki Y. (2005). Relationship between salinity and nutrients in the subsurface layer in the suruga bay. J. Oceanography 61, 721–732. doi: 10.1007/s10872-005-0079-2
Knap A., Michaels A., Close A., Ducklow H., Dickson A. (1996). Protocols for the joint global ocean flux study (JGOFS) core measurements. JGOFS Rep. 19, 1–170. doi: 10.25607/OBP-1409
Kocum E., Sutcu A. (2013). Analysis of variations in phytoplankton community size-structure along a coastal trophic gradient. J. Coast. Res. 30, 777–784. doi: 10.2112/jcoastres-d-12-00045.1
Li H. (2019). The distribution characteristics of nutritive salt in Dongshan Bay and the its interrelation with chlorophyll a. Boreal Environ. Res. 31, 119–120. doi: 10.16647/j.cnki.cn15-1369/X.2019.11.065
Li L., Jiang T., Lv S. (2013). Size-fractionated biomass of phytoplankton in the coastal waters of Daya Bay in summer and autumn. Mar. Environ. Sci. (in Chinese) 32, 185–189.
Li D., Yang S., Wei Y., Wang X., Mao Y., Guo C., et al. (2022). Response of size-fractionated Chlorophyll a to upwelling and Kuroshio in northeastern South China Sea. J. Mar. Sci. Eng. 10, 784. doi: 10.3390/jmse10060784
Liao J. Z., Xu J., Li R. H., Shi Z. (2021). Photosynthesis-irradiance response in the eddy dipole in the western South China Sea. J. Geophysical Research: Oceans 126, e2020JC016986. doi: 10.1029/2020JC016986
Liu L. (2023). Temporal and spatial nutrient variations in inshore waters of Xiamen and eutrophication assessment. J. Appl. Oceanography (in Chinese) 42, 75–84. doi: 10.3969/J.ISSN.2095-4972.2023.01.009
Liu H., Xue B., Feng Y., Zhang R., Chen M., Sun J. (2016). Size-fractionated Chlorophyll a biomass in the northern South China Sea in summer 2014. Chin. J. Oceanology Limnology 34, 672–682. doi: 10.1007/s00343-016-5017-1
López-Urrutia Á., Morán X. A. G. (2015). Temperature affects the size-structure of phytoplankton communities in the ocean. Limnology Oceanography 60, 733–738. doi: 10.1002/lno.10049
Marañón E., Cermeño P., Latasa M., Tadonléké R. D. (2012). Temperature, resources, and phytoplankton size structure in the ocean. Limnology Oceanography 57, 1266–1278. doi: 10.4319/lo.2012.57.5.1266
Riegman R., Kuipers B. R., Noordeloos A. A. M., Witte H. J. (1993). Size-differential control of phytoplankton and the structure of plankton communities. Netherlands J. Sea Res. 31, 255–265. doi: 10.1016/0077-7579(93)90026-O
Rousseaux C. S., Gregg W. W. (2014). Interannual variation in phytoplankton primary production at a global scale. Remote Sens. 6, 1–19. doi: 10.3390/rs6010001
Rousseaux C. S., Gregg W. W. (2015). Recent decadal trends in global phytoplankton composition. Global Biogeochemical Cycles 29, 1674–1688. doi: 10.1002/2015GB005139
Sathyendranath S., Cota G., Stuart V., Maass H., Platt T. (2001). Remote sensing of phytoplankton pigments: A comparison of empirical and theoretical approaches. Int. J. Remote Sens. 22, 249–273. doi: 10.1080/014311601449925
Shi M., Chen C., Xu Q., Lin H., Liu G., Wang H., et al. (2002). The role of Qiongzhou Strait in the seasonal variation of the South China Sea circulation. J. Phys. Oceanography 32, 103–121. doi: 10.1175/1520-0485(2002)032<0103:TROQSI>2.0.CO;2
Sieburth J. M., Smetacek V., Lenz J. (1978). Pelagic ecosystem structure: Heterotrophic compartments of the plankton and their relationship to plankton size fractions. Limnology Oceanography 23, 1256–1263. doi: 10.4319/lo.1978.23.6.1256
Song X., Xu M., Su Ge, Liu X., Ni J., Li G., et al. (2019). Is phosphorus a limiting factor to regulate the growth of phytoplankton in Daya Bay, northern South China Sea: a mesocosm experiment. Ecotoxicology 28, 559–568. doi: 10.1007/s10646-019-02049-7
Sun X., Sun S. (2012). Phytoplankton size structure and its temporal and spatial changes in Jiaozhou Bay. Oceanologia Limnologia Sin. (in Chinese) 43, 411–418. doi: 10.11693/hyhz201203003003
Tilstone G. H., Lange P. K., Misra A., Brewin R. J. W., Cain T. (2017). Micro-phytoplankton photosynthesis, primary production and potential export production in the Atlantic Ocean. Prog. Oceanography 158, 109–129. doi: 10.1016/j.pocean.2017.01.006
Uitz J., Claustre H., Gentili B., Stramski D. (2010). Phytoplankton class-specific primary production in the world's oceans: Seasonal and interannual variability from satellite observations. Global Biogeochemical Cycles 24, GB3016. doi: 10.1029/2009GB003680
Uitz J., Huot Y., Bruyant F., Babin M., Claustre H. (2008). Relating phytoplankton photophysiological properties to community structure on large scales. Limnology Oceanography 53, 614–630. doi: 10.4319/lo.2008.53.2.0614
Varela M., Fernandez E., Serret P. (2002). Size-fractionated phytoplankton biomass and primary production in the Gerlache and south Bransfield Straits (Antarctic Peninsula) in Austral summer 1995–1996. Deep Sea Res. Part II: Topical Stud. Oceanography 49, 749–768. doi: 10.1016/S0967-0645(01)00122-9
Villafañe V. E., Valiñas M. S., Cabrerizo M. J., Helbling E. W. (2015). Physio-ecological responses of Patagonian coastal marine phytoplankton in a scenario of global change: Role of acidification, nutrients and solar UVR. Mar. Chem. 177, 411–420. doi: 10.1016/j.marchem.2015.02.012
Weatherburn M. W. (1967). Phenol-hypochlorite reaction for determination of ammonia. Analytical Chem. 39, 971–974. doi: 10.1021/ac60252a045
Wei Y., Cui Z., Wang X., Teng G., Qu K., Sun J. (2022). Comparative analysis of total and size-fractionated Chlorophyll a in the Yellow Sea and Western Pacific. Front. Microbiol. 13. doi: 10.3389/fmicb.2022.903159
Xia J., Han Y., Tan J., Abarike G. A., Song Z. (2022). The characteristics of organic carbon in the offshore sediments surrounding the Leizhou Peninsula, China. Front. Earth Sci. 10, 648337. doi: 10.3389/feart.2022.648337
Xiao W., Laws E. A., Xie Y., Wang L., Liu X., Chen J., et al. (2019). Responses of marine phytoplankton communities to environmental changes: New insights from a niche classification scheme. Water Res. 166, 115070. doi: 10.1016/j.watres.2019.115070
Xu J., Yin K. D., He L., Yuan X. C., Ho A. Y. T., Harrison P. J. (2008). Phosphorus limitation in the northern South China Sea during late summer: Influence of the Pearl River. Deep-Sea Res. Part I: Oceanographic Res. Papers 55, 1330–1342. doi: 10.1016/j.dsr.2008.05.007
Yu K. (2012). Coral reefs in the South China Sea: Their response to and records on past environmental changes. Sci. China Earth Sci. 55, 1217–1229. doi: 10.1007/s11430-012-4449-5
Zhang P., Dai P., Zhang J., Li J., Zhao H., Song Z. (2021). Spatiotemporal variation, speciation, and transport flux of TDP in Leizhou Peninsula coastal waters, South China Sea. Mar. pollut. Bull. 167, 112284. doi: 10.1016/j.marpolbul.2021.112284
Zhang W., Sun J., Nie H., Jiang G., Tao J. (2015). Seasonal and spatial variations of nutrient and the response of phytoplankton in PRE and adjacent sea areas. Acta Ecologica Sin. (in Chinese) 35, 4034–4044. doi: 10.5846/stxb201308262158
Zhang Y., Xie X., Jiao N., Hsiao S.-Y., Kao S.-J. (2014). Diversity and distribution of amoA-type nitrifying and nirS-type denitrifying microbial communities in the Yangtze River estuary. Biogeosciences 11, 2131–2145. doi: 10.5194/bg-11-2131-2014
Zhang J., Zeng J., ZHANG Y., Zhang C., Sun X. (2010). Relationship between distribution of Chlorophyll a and main environmental factors in Liusha Bay. Mar. Sci. Bull. (in Chinese) 29, 514–520. doi: 10.3969/j.issn.1001-6392.2010.05.007
Zheng Y., Zhang Y., Guo K., Sun X. (2014). Distribution of size-fractionated Chlorophyll a of phytoplankton and its relationship with environmental factors in Zhanjiang Bay. Environ. Sci. Technol. 37, 20–25. doi: 10.3969/j.issn.1003-6504.2014.04.005
Keywords: Chlorophyll a, size structure, redundancy analysis, Leizhou Peninsula, salinity
Citation: Xu H, He M, Liao J and Zhou W (2024) Distribution characteristics of size-fractionated Chlorophyll a in the coastal area of the Leizhou Peninsula in winter. Front. Mar. Sci. 11:1473950. doi: 10.3389/fmars.2024.1473950
Received: 31 July 2024; Accepted: 19 September 2024;
Published: 04 October 2024.
Edited by:
Jing Yu, Chinese Academy of Fishery Sciences (CAFS), ChinaReviewed by:
Linjian Ou, Jinan University, ChinaHuaxue Liu, Chinese Academy of Fishery Sciences (CAFS), China
Copyright © 2024 Xu, He, Liao and Zhou. This is an open-access article distributed under the terms of the Creative Commons Attribution License (CC BY). The use, distribution or reproduction in other forums is permitted, provided the original author(s) and the copyright owner(s) are credited and that the original publication in this journal is cited, in accordance with accepted academic practice. No use, distribution or reproduction is permitted which does not comply with these terms.
*Correspondence: Weihua Zhou, d2h6aG91QHNjc2lvLmFjLmNu