- 1Division of Earth and Climate Sciences, Nicholas School of the Environment, Duke University, Durham, United States
- 2School of Environmental Sciences, University of Liverpool, Liverpool, United Kingdom
- 3CNRS, Université de Brest, IRD, Ifremer, LEMAR, Plouzané, France
A Corrigendum on
Data-driven modeling of dissolved iron in the global ocean
By Huang Y, Tagliabue A and Cassar N (2022). Front. Mar. Sci. 9:837183. doi: 10.3389/fmars.2022.837183
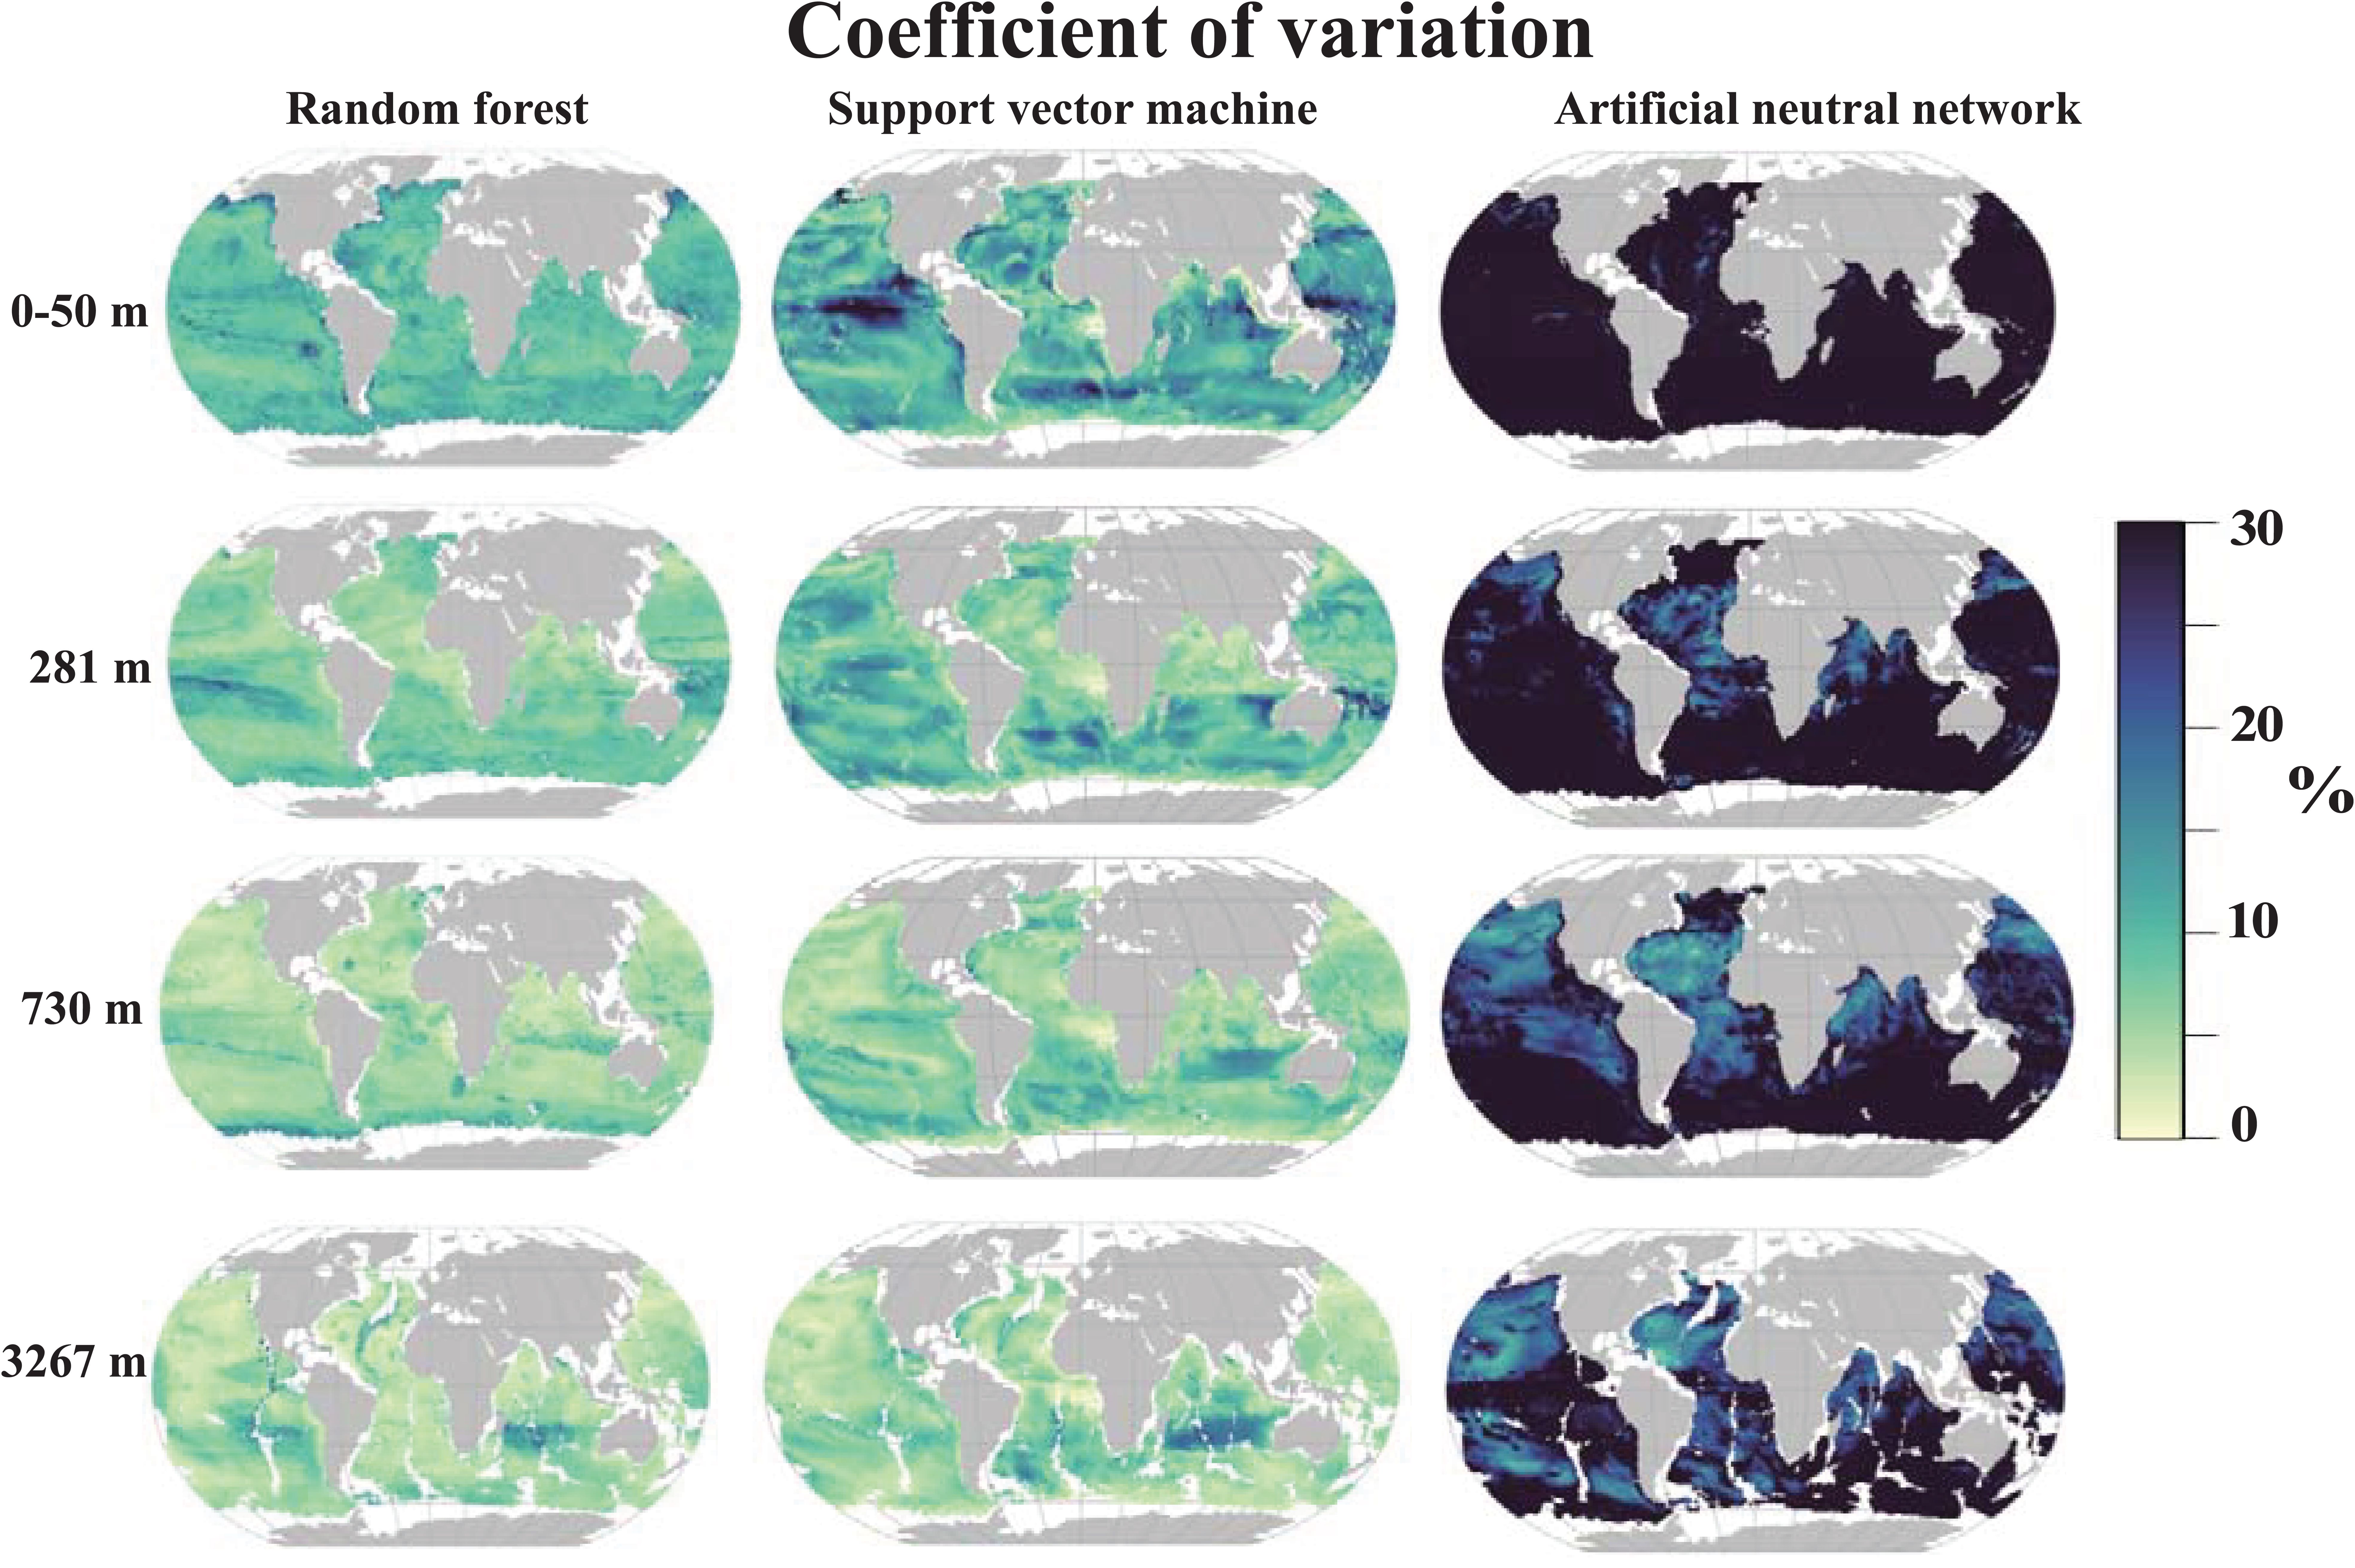
In the original article, there are two issues in Figure 4. First, cross “artifacts” appear at the longitude and latitude of 0 degrees in the panels showing the coefficient variability (C.V.) of the Support Vector Machine and Artificial Neural Network (ANN) algorithms. Second, the wrong figures were included for the subsurface C.V. of the ANN algorithm in error, resulting in a significant disparity in C.V. observed in the ANN algorithm between the surface and other depths, as well as inconsistencies in the bathymetry for results at a depth of 3267 meters.
We have updated this figure to correct these plotting issues. In doing so, we note that there are small differences in the C.V. in the updated version for the Support Vector and Artificial Neural Network algorithms. However, we emphasize that the subsequent analyses and major findings of our study rely solely on the dissolved iron projection derived from the random forest algorithm. Therefore, correcting these errata do not affect the main findings and conclusions presented in our article.
The corrected Figure 4 and its caption appear below:

Figure 4. Coefficient of variation of projected dissolved Fe in September calculated from 1000 reconstruction of the training dataset using three machine-learning algorithms.
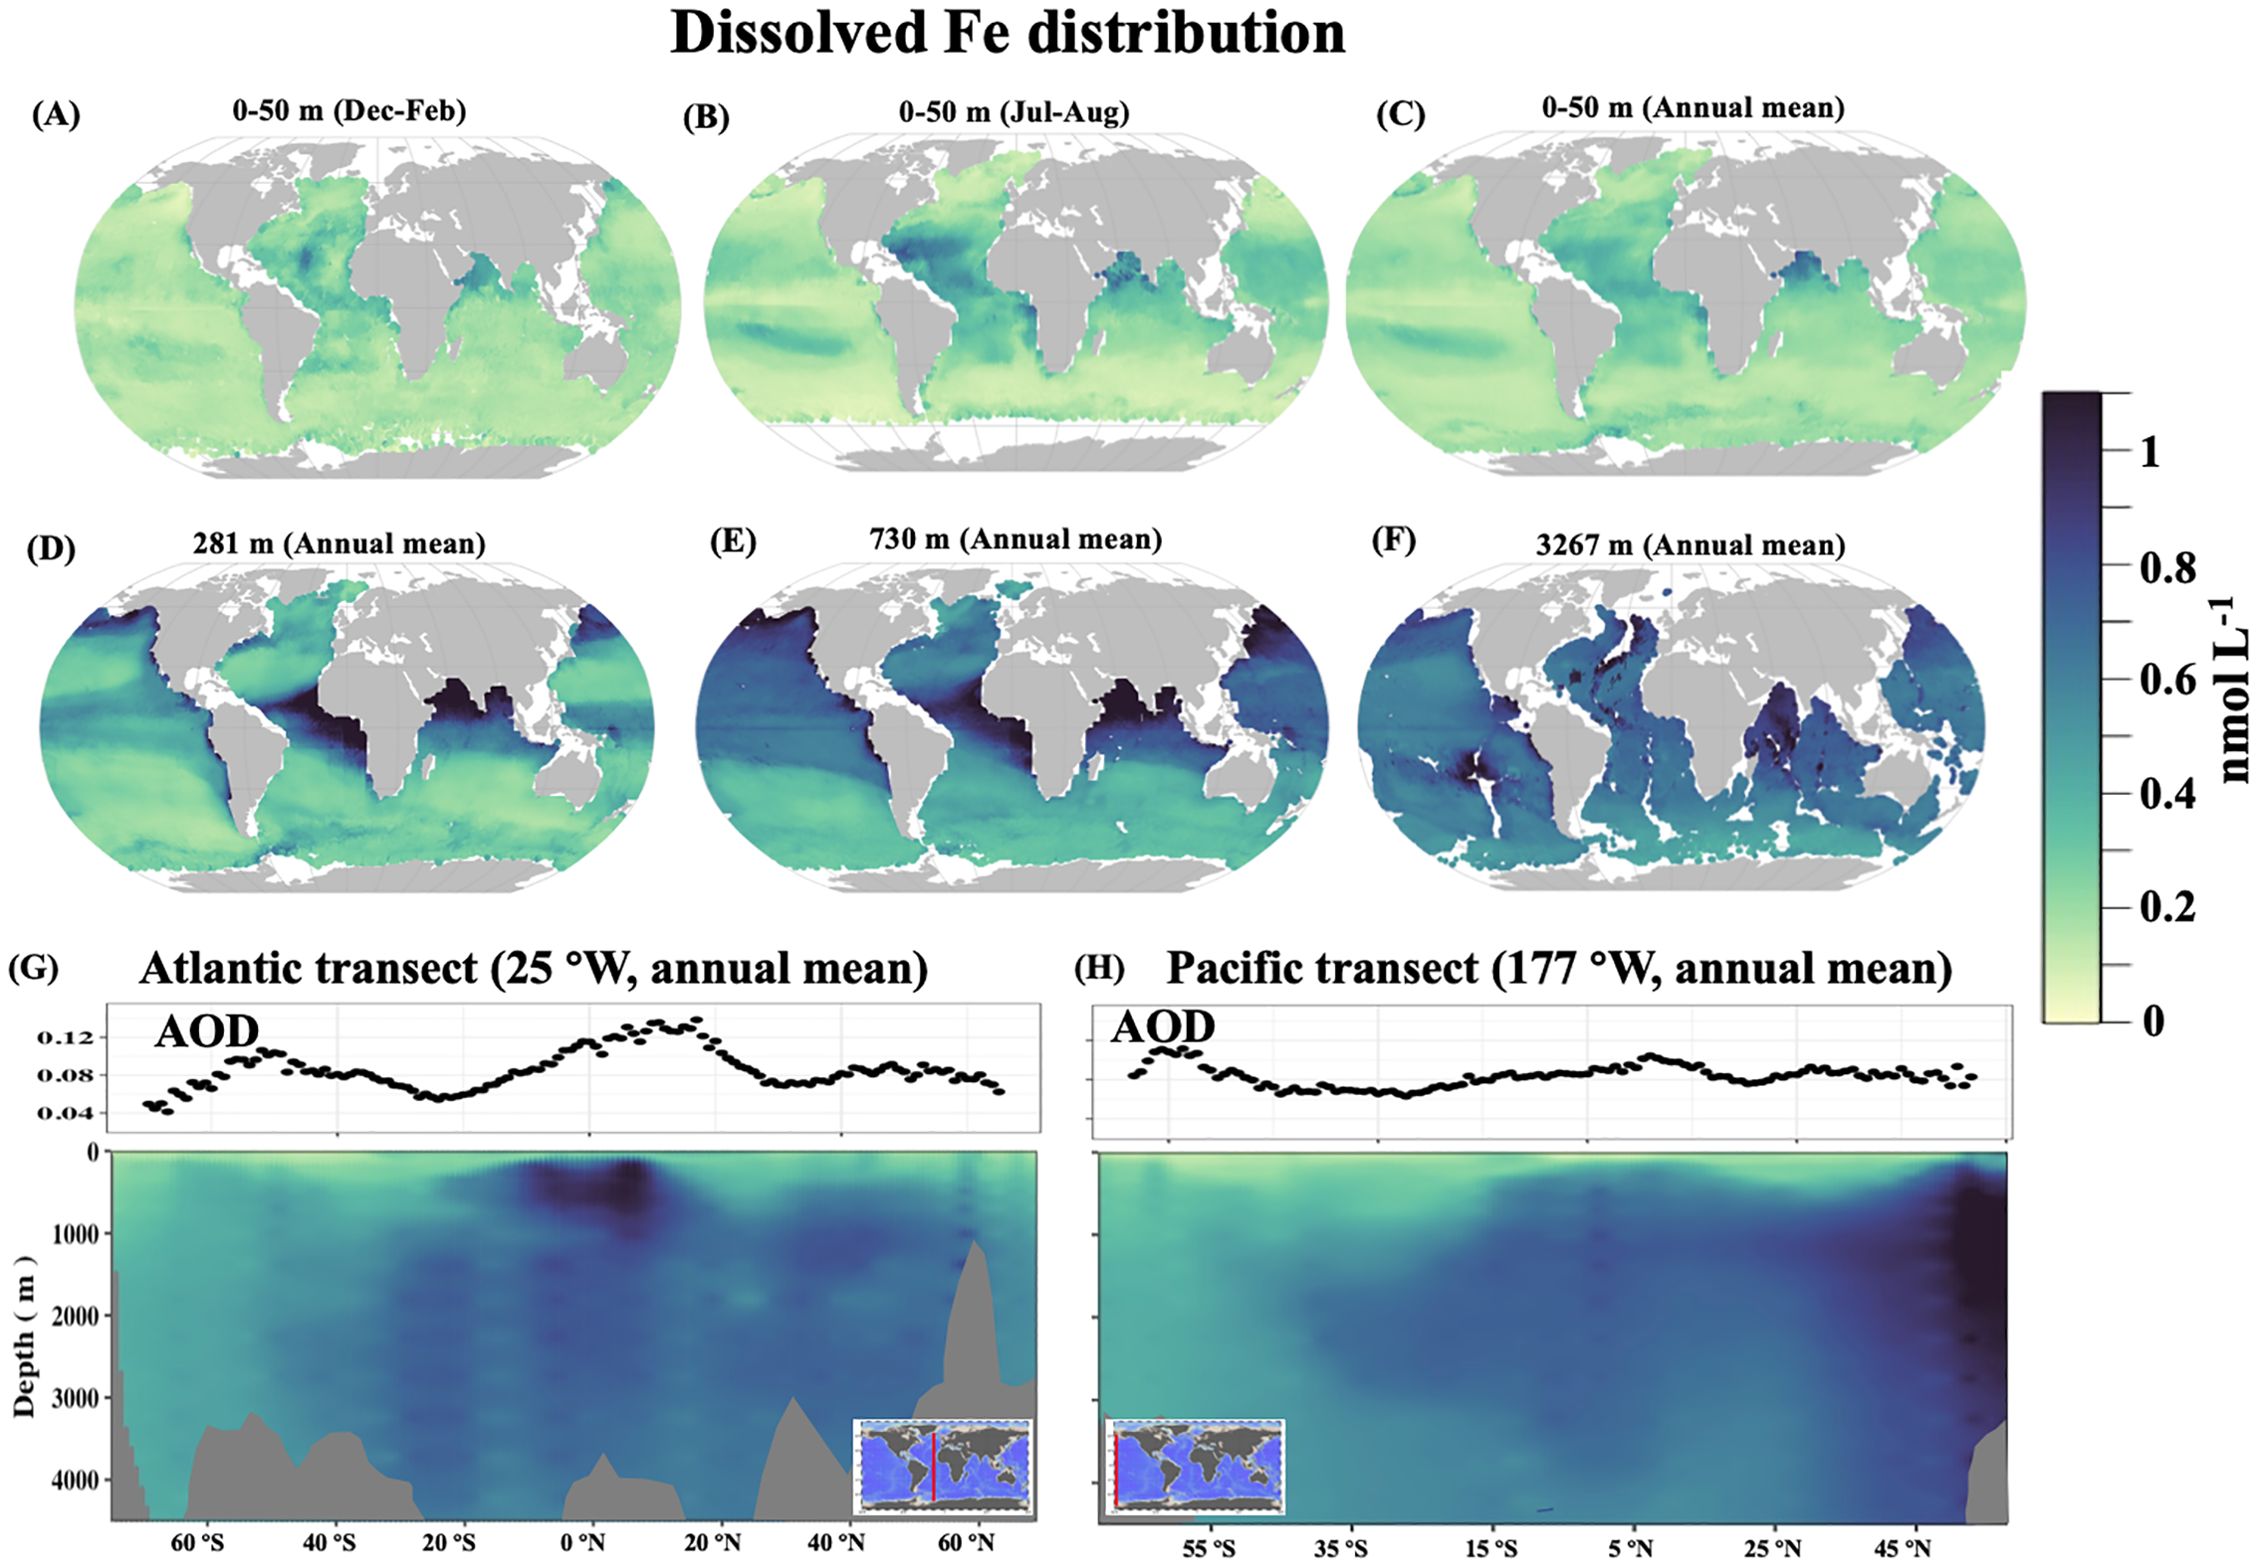
In the published article, there was an error in Figure 5 as published. The small world ocean map for the Atlantic and Pacific were swapped. The corrected Figure 5 and its caption appear below:

Figure 5. The global modeled dissolved Fe using the random forest approach. (A–F) show global maps of modeled dissolved Fe at various depth horizons; (G, H) display the corresponding dissolved Fe transects across the Atlantic and Pacific.
In the published article, there are some typos associated with the geographic coordinate transformation in Equation 1. In the model construction, we strictly followed the method proposed in Gade (2010) to conduct the geographic coordinate transformation and also provided the correct equation in the submitted manuscript. The typo was not present in our original and revised article, but introduced during the manuscript copy-editing process and was not caught during proofreading. The corrected Equation 1 appears below:
In the published article, the data link only leads to the first version of the simulated dissolved iron data product. We have replaced it with a link that provides access to all historical versions of the simulated dissolved iron product, allowing readers to track the most recent updates in the dissolved iron gridded product. The correct Data availability statement appears below:
“The products of the monthly climatological dissolved Fe generated in this study are available on the public data library Zenodo (https://zenodo.org/records/6994318, doi: 10.5281/zenodo.6994318).”
The authors apologize for these errors and reiterate that these do not change the scientific conclusions of the article in any way.
Publisher’s note
All claims expressed in this article are solely those of the authors and do not necessarily represent those of their affiliated organizations, or those of the publisher, the editors and the reviewers. Any product that may be evaluated in this article, or claim that may be made by its manufacturer, is not guaranteed or endorsed by the publisher.
Reference
Keywords: dissolved iron, monthly climatology, data-driven model, machining learning, controlling mechanism
Citation: Huang Y, Tagliabue A and Cassar N (2024) Corrigendum: Data-driven modeling of dissolved iron in the global ocean. Front. Mar. Sci. 11:1473714. doi: 10.3389/fmars.2024.1473714
Received: 31 July 2024; Accepted: 08 August 2024;
Published: 23 September 2024.
Edited and Reviewed by:
Elodie Claire Martinez, UMR6523 Laboratoire d’Oceanographie Physique et Spatiale (LOPS), FranceCopyright © 2024 Huang, Tagliabue and Cassar. This is an open-access article distributed under the terms of the Creative Commons Attribution License (CC BY). The use, distribution or reproduction in other forums is permitted, provided the original author(s) and the copyright owner(s) are credited and that the original publication in this journal is cited, in accordance with accepted academic practice. No use, distribution or reproduction is permitted which does not comply with these terms.
*Correspondence: Nicolas Cassar, bmljb2xhcy5jYXNzYXJAZHVrZS5lZHU=
 Yibin Huang
 Alessandro Tagliabue
 Nicolas Cassar1,3*