- 1Key Laboratory of Ocean Observation and Forecasting and Key Laboratory of Ocean Circulation and Waves, Institute of Oceanology, Chinese Academy of Sciences, Qingdao, China
- 2University of Chinese Academy of Sciences, Beijing, China
- 3Laoshan Laboratory, Qingdao, China
- 4School of Marine Sciences, Nanjing University of Information Science and Technology, Nanjing, China
Incident shortwave radiation can penetrate and heat the upper ocean water column, acting to modulate the stratification, vertical mixing and sea surface temperature. As a light-absorbing constituent, ocean chlorophyll (CHL) plays an important role in regulating these processes; however, its heating effect on the ocean state remains controversial and exhibits strong model dependence on ways the solar radiation transmission and the related CHL-induced heating are represented. In this study, we implement a chlorophyll-based two-way coupling between physical and ecological processes within the Regional Ocean Modeling System (ROMS). The bio-physics coupled model performs well in simulating the structure and variability of oceanic physical and ecological fields in the tropical Indo-Pacific region. Three CHL-related heating terms are analyzed based on the model output to diagnose the ocean biology-induced heating effects, namely the shortwave radiation part penetrating out of the base of the mixed layer (ML; Qpen), the portion absorbed within the ML (Qabs), and the rate of temperature change of the ML resulting from the Qabs effects (Rsr). Results show that the spatio-temporal distributions of the three heating terms are mainly determined by the ML depth (MLD). However, Qpen can also be regulated by the euphotic depth (ED), especially in the western-central equatorial Pacific. This moderating effect is particularly evident during El Niño when the ED tends to be greater than the MLD; positive ED anomalies act to enhance the positive Qpen anomalies caused by negative MLD anomalies. For the first time, the bio-heating effects are quantified within the ROMS-based two-way coupling context between the physical submodel and ecological submodel over the tropical Indo-Pacific Ocean, providing a basis for further understanding of the bio-effects and mechanisms. It is expected that the methodology and understanding developed in this study can help explore the chlorophyll-related processes in the ocean and the interactions with the atmosphere.
1 Introduction
Solar radiation is the primary energy source for physical, biological and chemical processes in the Earth’s surface system (Allen, 1997). Solar radiation can penetrate through the sea surface and heat a few meters of the upper ocean water column, which thus affects the stratification and mixing in the upper ocean. In addition, solar radiation provides energy for photosynthesis and helps fix carbon dioxide in the presence of chlorophyll in phytoplankton. The ecological processes in the ocean are more complex than those on land, because they are affected by the geofluid dynamic processes in the marine physical environment. For example, the ocean stratification causes the retention of phytoplankton in the upper layer, wherein light is more readily available with inorganic nutrients being limited (Mann and Lazier, 2006). In addition, chlorophyll-a is the main light-absorbing constituent in the ocean (Mobley, 2001), acting to trap more solar radiation in the surface layer, which in turn alters the vertical distribution of light and heat in the ocean (Mann and Lazier, 2006).
In the tropical upper ocean, phytoplankton is usually not light-limited (Shell et al., 2003; Mann and Lazier, 2006; Jochum et al., 2010). In particular, in the eastern equatorial Pacific, as the strong equatorial upwelling brings abundant nutrients, there is a triangular region with higher phytoplankton biomass expressed as the chlorophyll concentration (Lewis et al., 1990; Lin et al., 2007; Khanna et al., 2009). In the equatorial Pacific, the impact of chlorophyll on SST can be further amplified through the ocean-atmosphere interaction and then can influence SST interannual variations in association with the El Niño-Southern Oscillation (ENSO) events (Philander, 1983; Zhang and Gao, 2016; Gao and Zhang, 2023; Gao et al., 2022; Zhang et al., 2020, 2022, 2024). In addition to interactions among the hydrosphere, biosphere and atmosphere, there are also inter-basin linkages between the tropical Pacific and Indian Ocean, which may cause inter-basin effects through the Walker circulation in the atmosphere (Latif and Barnett, 1995) and the Indonesian Throughflow in the ocean (Sprintall et al., 2014). Thus, it is necessary to take into account chlorophyll variability and its effect in the Indo-Pacific region (Murtugudde et al., 2002; Marzeion et al., 2005; Wetzel et al., 2006; Ballabrera-Poy et al., 2007; Lengaigne et al., 2007; Park et al., 2014; Kang et al., 2017; Zhang et al., 2019b; Tian et al., 2021). At present, it is difficult to quantify the effects of ocean biology-induced heating (OBH) on the climate through in situ observations. Fortunately, since the launch of the Coastal Zone Color Scanner in 1979, the Sea-viewing Wide Field-of-view Sensor (SeaWiFS), the Moderate-resolution Imaging Spectroradiometer and the Medium Resolution Imaging Spectrometer have been launched successively (Gordon and Morel, 1983; Mann and Lazier, 2006; Valiela, 2015). The development of satellite remote sensing makes it possible to obtain satellite color images of the ocean surface and to retrieve chlorophyll by inverse modeling techniques (Rast et al., 1999). With the mapping of chlorophyll concentrations over large areas, the influence of chlorophyll on shortwave radiation penetration in the vertical direction can be considered in large-scale ocean models.
Numerical models have been developed to study the bio-physical feedback induced by chlorophyll (CHL) in the tropical Pacific. Several types of ocean general circulation models (OGCMs) based on different vertical coordinate systems have been employed to study the ocean biology-induced heating effects, including the most popularly used level OGCMs developed by GFDL/NOAA (Sathyendranath et al., 1991; Sweeney et al., 2005; Park et al., 2014; Kang et al., 2017), and layer ocean model (e.g., Zhang, 2015a; Gao et al., 2020). Historically, CHL-induced heating effects in oceanic models have been differently represented, which evolves with different complexities, including horizontally uniform penetration depth of solar radiation (Wetzel et al., 2006; Ballabrera-Poy et al., 2007; Gnanadesikan and Anderson, 2009), the spatially-varying sea surface CHL from satellite observations (Anderson et al., 2007, 2009; Park et al., 2014), the empirical statistical model for CHL interannual anomalies (Zhang et al., 2009, 2011; Zhang, 2015b), and the interactive oceanic ecological models for horizontally and vertically varying chlorophyll depictions (Wetzel et al., 2006; Lengaigne et al., 2007; Patara et al., 2012; Park et al., 2014; Lim et al., 2018; Zhang et al., 2018, 2019a; Tian et al., 2021; Shi et al., 2023). For example, Zhang et al. (2009) coupled the Gent-Cane ocean general circulation model (OGCM) with an empirical statistical model for the penetration depth (, defined as the inverse of the attenuation coefficient for the penetrative solar radiation), and diagnosed the impact of interannual variability on bio-heating. Previous studies indicated that chlorophyll can cause contrasting effects on sea surface temperature (SST) and its interannual variability through direct thermodynamic heating (Sweeney et al., 2005; Löptien et al., 2009; Park et al., 2014; Lim et al., 2018; Gera et al., 2020) or indirect dynamic cooling (Murtugudde et al., 2002; Marzeion et al., 2005; Zhang et al., 2009; Gera et al., 2020), respectively. Currently, the nature of the bio-effects in oceanic and coupled ocean-atmosphere models remains elusive and the underlying processes are controversial. Evidently, the results from previous modeling studies are quite inconsistent and strongly model-dependent in terms of the ocean biology-induced heating effects on mean SST and its variability in the eastern equatorial Pacific (Table 1), underscoring the need for alternative modeling approaches.
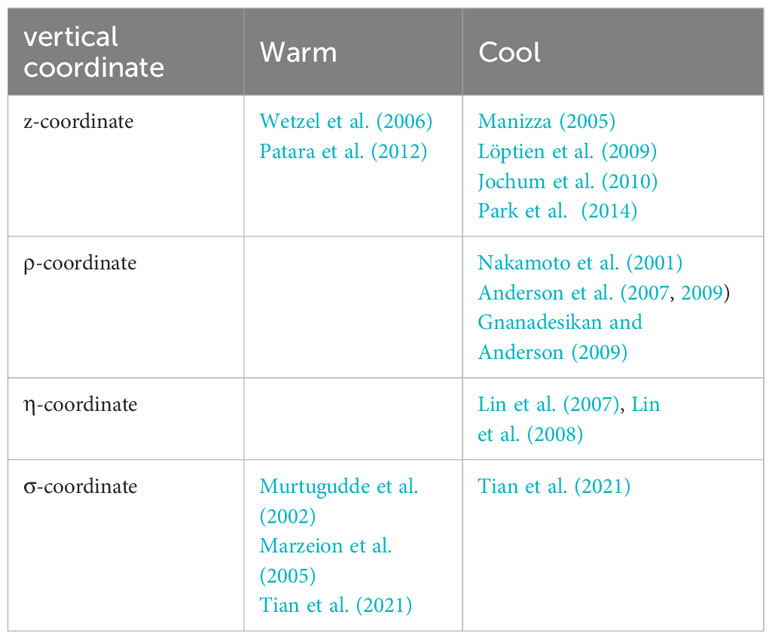
Table 1. Representative studies investigating the influence of chlorophyll on the eastern equatorial Pacific mean sea surface temperature (SST) using models with different vertical coordinate systems.
The Regional Ocean Modeling System (ROMS) is an ocean model which is based on free-surface, terrain-following and primitive-equations, which is widely utilized among oceanographers (Shchepetkin and McWilliams, 2005; Hedström, 2018). The ROMS offers flexible vertical coordinate systems that incorporate two kinds of vertical transformation equations and a variety of vertical stretching functions. The stretched coordinates allow higher resolution in the areas of interest, such as the upper mixed layer (Song and Haidvogel, 1994; Shchepetkin and McWilliams, 2005). The ROMS includes several vertical mixing parameterization schemes for turbulence closure and modules for ecological, sediment and sea ice applications. Although the ROMS offers various ecosystem sub-models with varying levels of complexity (Haidvogel et al., 2008), the coupling between its physical and ecological sub-models is in one way from the physics to ecological state, in which the scheme of Paulson and Simpson (1977) is adopted for solar radiation penetration parameterization. For example, in current ROMS setting, a simplified empirical formula is adopted to represent this intricate radiation transfer process. The bimodal-exponential function of Paulson and Simpson (1977) is a traditional parameterization scheme to represent the attenuation of shortwave radiation with depth (z, which is defined to be negative below the ocean surface). The formula is expressed as follows:
where I and denote the shortwave radiation at depth z and the sea surface, respectively. The proportion of I to represents the decay rate of shortwave radiation. , , and are tunable parameters determined empirically by fitting the function to downward irradiance observations according to the water types of Jerlov (1968). The descriptive classification scheme defines five types of water based on the ocean transparency that can be considered as a proxy for chlorophyll concentration. For example, a clear open ocean is classified as Type I (Jerlov, 1968). In such a way, when the water type is given, the decay rate at a particular depth is identical everywhere regardless of the distribution of chlorophyll. Clearly, this parameterization scheme for the penetration of solar radiation in the upper ocean cannot represent the effects of temporal and spatial variations in chlorophyll concentrations; only the impacts of ocean dynamics on ecological processes are taken into account, while the impacts of chlorophyll on the physical fields are not considered. So, there is no feedback from ocean ecological processes to physical processes. Note that Liu et al. (2020) previously tested four shortwave radiation transmission schemes using an idealized one-dimensional ROMS model, and they found that the simulation results with chlorophyll-based schemes exhibit obvious differences in the vertical temperature and upper mixing when compared with the default water-type scheme, with SST differences reaching 1.5–2.0°C. These results clearly indicate the importance of incorporating chlorophyll-based shortwave radiation parameterization schemes into the ROMS. Despite its capabilities and wide applications to regional oceanic problems, the ROMS has not yet been extensively utilized in simulating and understanding large-scale ocean circulations. Previous studies using ROMS-based ecological models have been limited by their shortwave radiation scheme. The ocean biology-induced heating effects have not been adequately explored.
This study addresses this gap by implementing a two-way coupling between the physical and ecological processes within the ROMS, in which the default shortwave penetration parameterization scheme within the ROMS is substituted by a chlorophyll-based scheme. This modeling application to a basinwide Indo-Pacific region allows to represent the CHL-induced heating feedback onto physics, including SST, a field that is important to the climate system. Furthermore, processes underlying the bio-effects are analyzed based on the ROMS simulations for the Indo-Pacific region; the corresponding bio-heating effects are quantified by adopting a diagnostic scheme and separating the shortwave radiation part penetrating out of the base of the mixed layer (ML; Qpen), the portion absorbed within the ML (Qabs), and the rate of temperature change of the ML (Rsr), respectively. These dedicated efforts provide a basis for further understanding of the thermodynamic and dynamic effects associated with ocean biology-induced heating within the ROMS. It is expected that the methodology and understanding developed in this study can help explore the CHL-related processes in the ocean and further the interactions with the atmosphere.
A detailed description of the model, experiments and data sources is provided in Section 2. The model results are described in Section 3, in which following the method of Zhang et al. (2011; Zhang, 2015a), three bio-heating terms are analyzed to isolate and quantify the direct OBH effects in association with the mixed layer depth (MLD) and chlorophyll. A brief discussion and conclusion are given in Sections 4 and 5. Table 2 presents the nomenclature and abbreviation adopted in this paper.
2 The model, experimental design and data
In this study, ocean-only experiments are performed using a basin-scale three-dimensional ocean circulation model and a simple ecological model. The former is the ROMS provided by the ROMS/Terrain-following Ocean Modeling System Group (https://www.myroms.org/). The latter is the Nutrient-Phytoplankton-Zooplankton-Detritus Model with Iron Limitation on Phytoplankton Growth (hereinafter referred to as the NPZD-IRON) developed by Fiechter et al. (2009). Some details are presented in this section.
2.1 Model configuration
2.1.1 Physical model
The ocean model used is the Regional Ocean Modeling System (ROMS), which is based on free-surface, terrain-following and primitive-equations, and it is widely utilized among oceanographers. The stretched coordinates allow higher resolution in the areas of interest, such as the upper mixed layer (Song and Haidvogel, 1994; Shchepetkin and McWilliams, 2005). The ROMS includes several vertical mixing parameterization schemes for turbulence closure and modules for ecological, sediment and sea ice applications. The Mellor-Yamada level-2.5 closure scheme (Mellor and Yamada, 1982) is chosen for the surface ocean mixing parameterization, and the bathymetric dataset Earth Topography 2 is used to represent the ocean bottom topography. The model domain covers the entire tropical Pacific and Indian Ocean (20°E–70°W, 35°S–35°N), with a zonal resolution of 0.5° and meridionally varying resolution of 0.4°-0.6° and with 50 vertical σ-levels. The monthly climatology of temperature and salinity from the World Ocean Atlas (WOA) 2009 is used to provide initial and lateral boundary conditions for the model (Penven et al., 2008). There are three open boundaries at the northern, southern and western edges. The free surface and barotropic horizontal velocities are respectively subject to the boundary conditions as designed in Chapman (1985) and Flather (1976), while the baroclinic horizontal velocities and tracers use radiation boundary conditions with a nudging to observations (Marchesiello et al., 2001).
2.1.2 Ecological model
The NPZD-IRON includes four standard state variables (represented in terms of nitrogen concentration): nitrate concentration (N), phytoplankton biomass (P), zooplankton biomass (Z) and detritus concentration (D). Considering the iron limitation on phytoplankton growth, there are also two nutrient components: bioavailable iron incorporated within phytoplankton cells () and dissolved iron concentration ().
Initial and boundary conditions for nitrate are obtained from the WOA. As for the phytoplankton, phytoplankton-associated iron, zooplankton and detritus concentration, their values are estimated from the seasonal surface chlorophyll concentrations derived from SeaWiFS under the assumption of constant ratios of 0.4/1 for phytoplankton/chlorophyll, 0.01/1 for phytoplankton-associated iron/chlorophyll, 0.1/1 for zooplankton/chlorophyll, and 0.15/1 for detritus/chlorophyll (Penven et al., 2008). The available dissolved iron concentration is set to 0.02 mmolFe m−3. The boundary conditions for all these biogeochemical tracers are the same as temperature and salinity.
2.1.3 Coupling between ocean physics and ecology
In the present study, the default shortwave transmission scheme is replaced by a CHL-dependent scheme, allowing to represent bio-feedback. Specifically, an optics scheme that parameterizes the effect of chlorophyll distribution on solar radiation penetration is employed as a single-exponential function (Fennel et al., 2006):
where is the fraction of shortwave radiation that is photosynthetically active and equals 0.43; and are the vertical attenuation coefficients of light for water and chlorophyll, which are set to 0.028 m−1 and 0.058 m mgChl−1, respectively; is the chlorophyll concentration at a certain vertical point . In this model, the chlorophyll concentrations are estimated by multiplying simulated phytoplankton nitrogen concentrations by a Chl: N ratio (0.53 gChl molN−1), which is calculated from a C: Chl ratio of 150:1 gC gChl−1 and a C: N Redfield ratio of 106:16 molC molN−1. Note that in this function, the self-shading effect is considered, which means that light is reduced by the chlorophyll concentration itself and subsequently the phytoplankton growth is restrained.
2.2 Experimental design
The ocean-only simulation, initialized by using the WOA hydrography with no flow, is forced by monthly mean 10-meter wind speed, solar shortwave radiation flux, downwelling longwave radiation flux, surface air temperature, surface air specific humidity, surface air pressure and precipitation derived from the National Centers for Environmental Prediction (NCEP)/National Center for Atmospheric Research (NCAR) reanalysis product with the bulk flux algorithm (Fairall et al., 2003).
After the first 80-year spin-up period, the ROMS is coupled to the NPZD-IRON and is integrated from 1979 to 2019 for a real-ocean model setting. Atmospheric forcing fields (the variables are the same as the spin-up run) are extracted from the monthly average output of the European Centre for Medium-range Weather Forecasts (ECMWF) Reanalysis V5 (Hersbach et al., 2020). The model outputs are extracted from the 40-year simulation in the form of monthly mean values for the years from 1995 to 2018.
2.3 Reanalysis and observational data
Atmospheric fields are used to force the ocean model, including climatological monthly-mean fields from the NCEP/NCAR reanalysis product, and interannually varying monthly-mean fields from the ECMWF Reanalysis V5 (Hersbach et al., 2020). Various observational datasets are used to validate the model performance. SST data are from the Optimum Interpolation Sea Surface Temperature (OISST) (https://psl.noaa.gov/data/gridded/data.noaa.oisst.v2.html) with a spatial resolution of 1° and a monthly temporal resolution provided by the National Climate Data Center of the National Ocean and Atmospheric Administration. Monthly climatology of surface chlorophyll concentration is the satellite-retrieved data from the SeaWiFS provided by the Asia-Pacific Data-Research Center of the International Pacific Research Center (http://apdrc.soest.hawaii.edu/las/v6/dataset?catitem=13078).
2.4 Definitions of variables of interest
2.4.1 The euphotic depth
Ocean phytoplankton needs light to maintain growth and reproduction. Because of the unidirectional nature of light, the solar radiation that reaches the sea surface passes downward in a finite layer, named euphotic zone (Kirk, 1994), in which there is sufficient light for photosynthesis and phytoplankton growth. Usually, the euphotic depth (ED) is defined as the depth where the solar radiation declines to 1% of its value below the sea surface (Khanna et al., 2009). At the ED, thus, the decay rate of shortwave radiation equals 0.01, which can be expressed as follows:
2.4.2 The mixed layer depth
Due to the convective overturning, the temperature, salinity and density are vertically uniform within the mixed layer (Bosc et al., 2009). The MLD is the main factor determining the heat content of the upper ocean and the vertical distribution of solar radiation between the mixed layer and the subsurface layer (de Boyer Montégut, 2004). The MLD can be estimated based on the difference or gradient of potential temperature or density. Here, we define the density ()-based MLD following Sprintall and Tomczak (1992), which considers both salinity and temperature effects:
where , and are the temperature, salinity and pressure values at the sea surface, respectively; is the temperature threshold ( =0.5°C).
2.4.3 Ocean chlorophyll-induced heating terms (, and )
Lewis et al. (1990) indicated that the amplitude of shortwave radiation flux reaching the bottom of the mixed layer is equivalent to that of the net surface heat flux, especially in the western Pacific. With the increase of chlorophyll concentration, the turbidity and absorption of shortwave radiation in the upper ocean increase, and more heat is retained in the mixed layer, further affecting SST. In this study, three chlorophyll-induced heating terms are analyzed according to Zhang (2015a) to quantify the direct OBH effects.
According to the radiation transfer function, the solar radiation that penetrates through the base of the surface mixed layer (denoted as ) can be expressed as follows:
where is the incident solar radiation flux at the sea surface, and is the MLD.
The absorbed solar radiation flux within the mixed layer (denoted as ) is the difference between the solar radiation flux at the surface and at the MLD:
Furthermore, the rate of temperature variation resulting from the effect in the mixed layer (denoted as ) is directly related to the and :
where and are respectively the mean density and specific heat capacity of seawater, whose typical values are set to =1025 kg m−3 and =4000 J K−1 kg−1. Since the temperature in the mixed layer is almost identical to that at the sea surface, the temperature variation resulting from the effect in the mixed layer (i.e., ) can help diagnose the direct bio-effects on SST.
3 The simulated results
3.1 Annual mean
The horizontal distributions of annual mean physical and ecological fields in the tropical Pacific are displayed in Figures 1–3. The spatial pattern of the simulated SST (Figure 1A) is similar to that of observation (Figure 1B), and the Indo-Pacific warm pool and the eastern Pacific cold tongue can be well simulated. A detailed comparison between simulation and observation reveals that the simulated SST is slightly lower in the eastern equatorial Pacific; the differences in these simulated and observed fields can be more convincingly seen (figures not shown). Due to the effects of easterly wind above the equator which transports seawater to the west, the thermocline (the 20°C isothermal depth) is shallow in the eastern equatorial Pacific, with the shoaled mixed layer (<25 m) (Figure 3A). The mixed layer is deep (>40 m) in the mid-basin and shallow over the western equatorial Pacific. Near 10°N in the central-eastern Pacific, the SST is higher (Figure 1A) and the MLD is smaller (Figure 3A). This is because there is an intertropical convergence zone (Byrne et al., 2018), which is maintained by several positive feedbacks, such as the convection-shortwave flux-SST feedback and the convection-wind-evaporation-SST feedback (Song and Zhang, 2009). The simulated MLD (Figure 3A) is consistent with the corresponding observations (shown in the Supplementary Figure 1A).
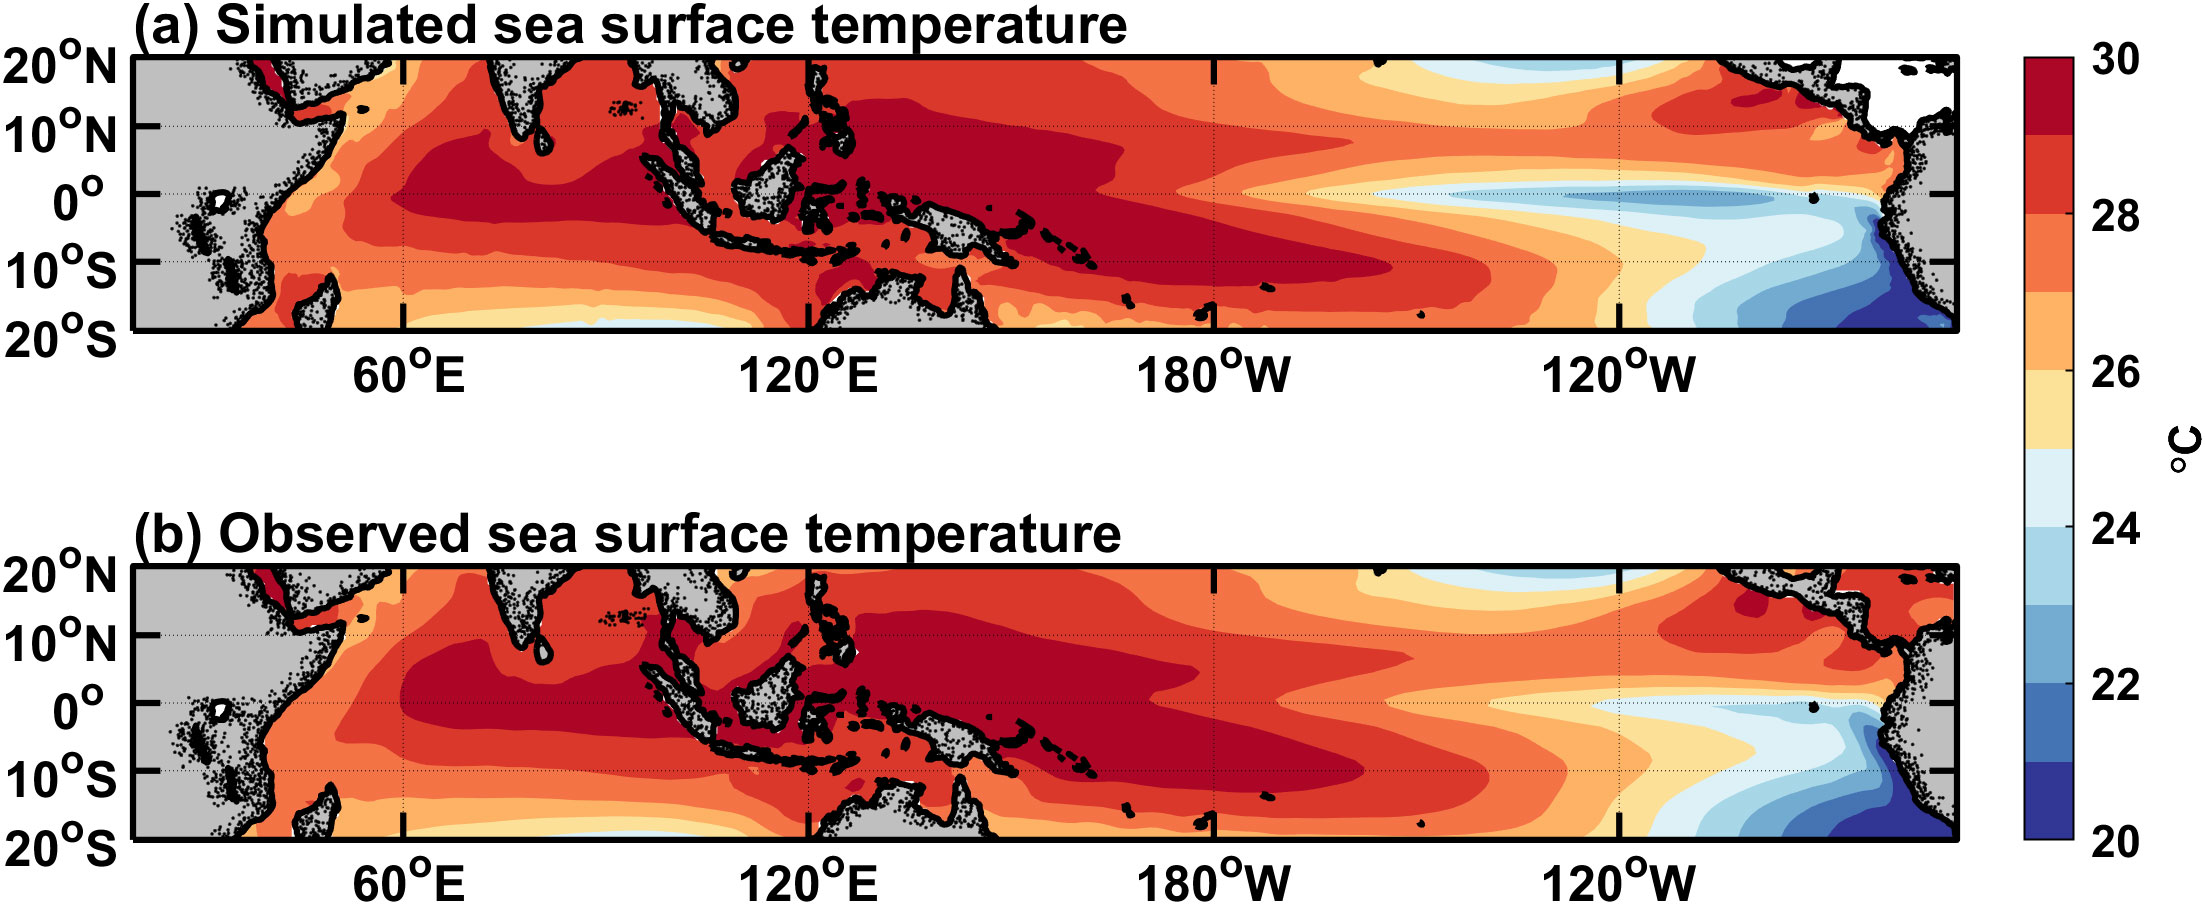
Figure 1. Horizontal distributions of annual-mean SST fields for (A) the model simulation and (B) the observation from OISST V2 data averaged over the years 1995-2018. The contour interval is 1 °C.
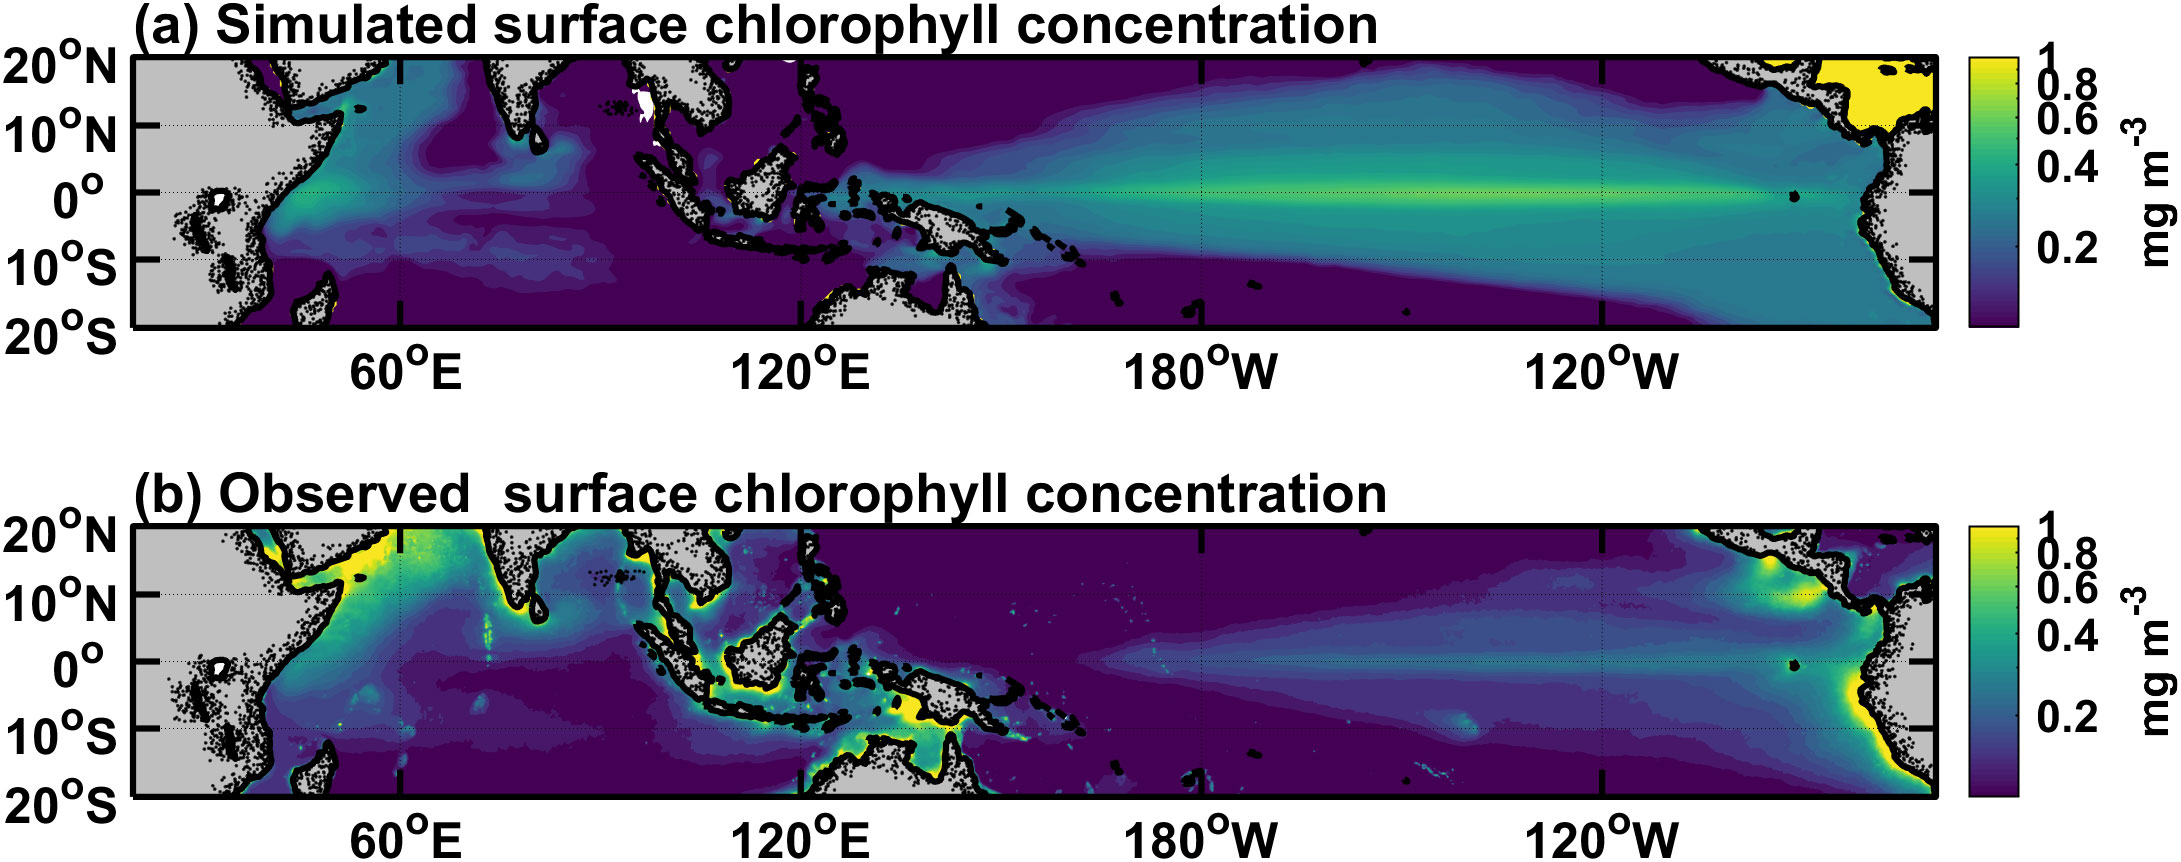
Figure 2. Horizontal distributions of annual-mean (A) simulated and (B) satellite SeaWiFS surface chlorophyll concentrations averaged over the years 1998-2009. Note that the color mapping and the tick values along the colorbar are displayed on a logarithmic scale. The contour interval is 0.02 mg Chl m–3.
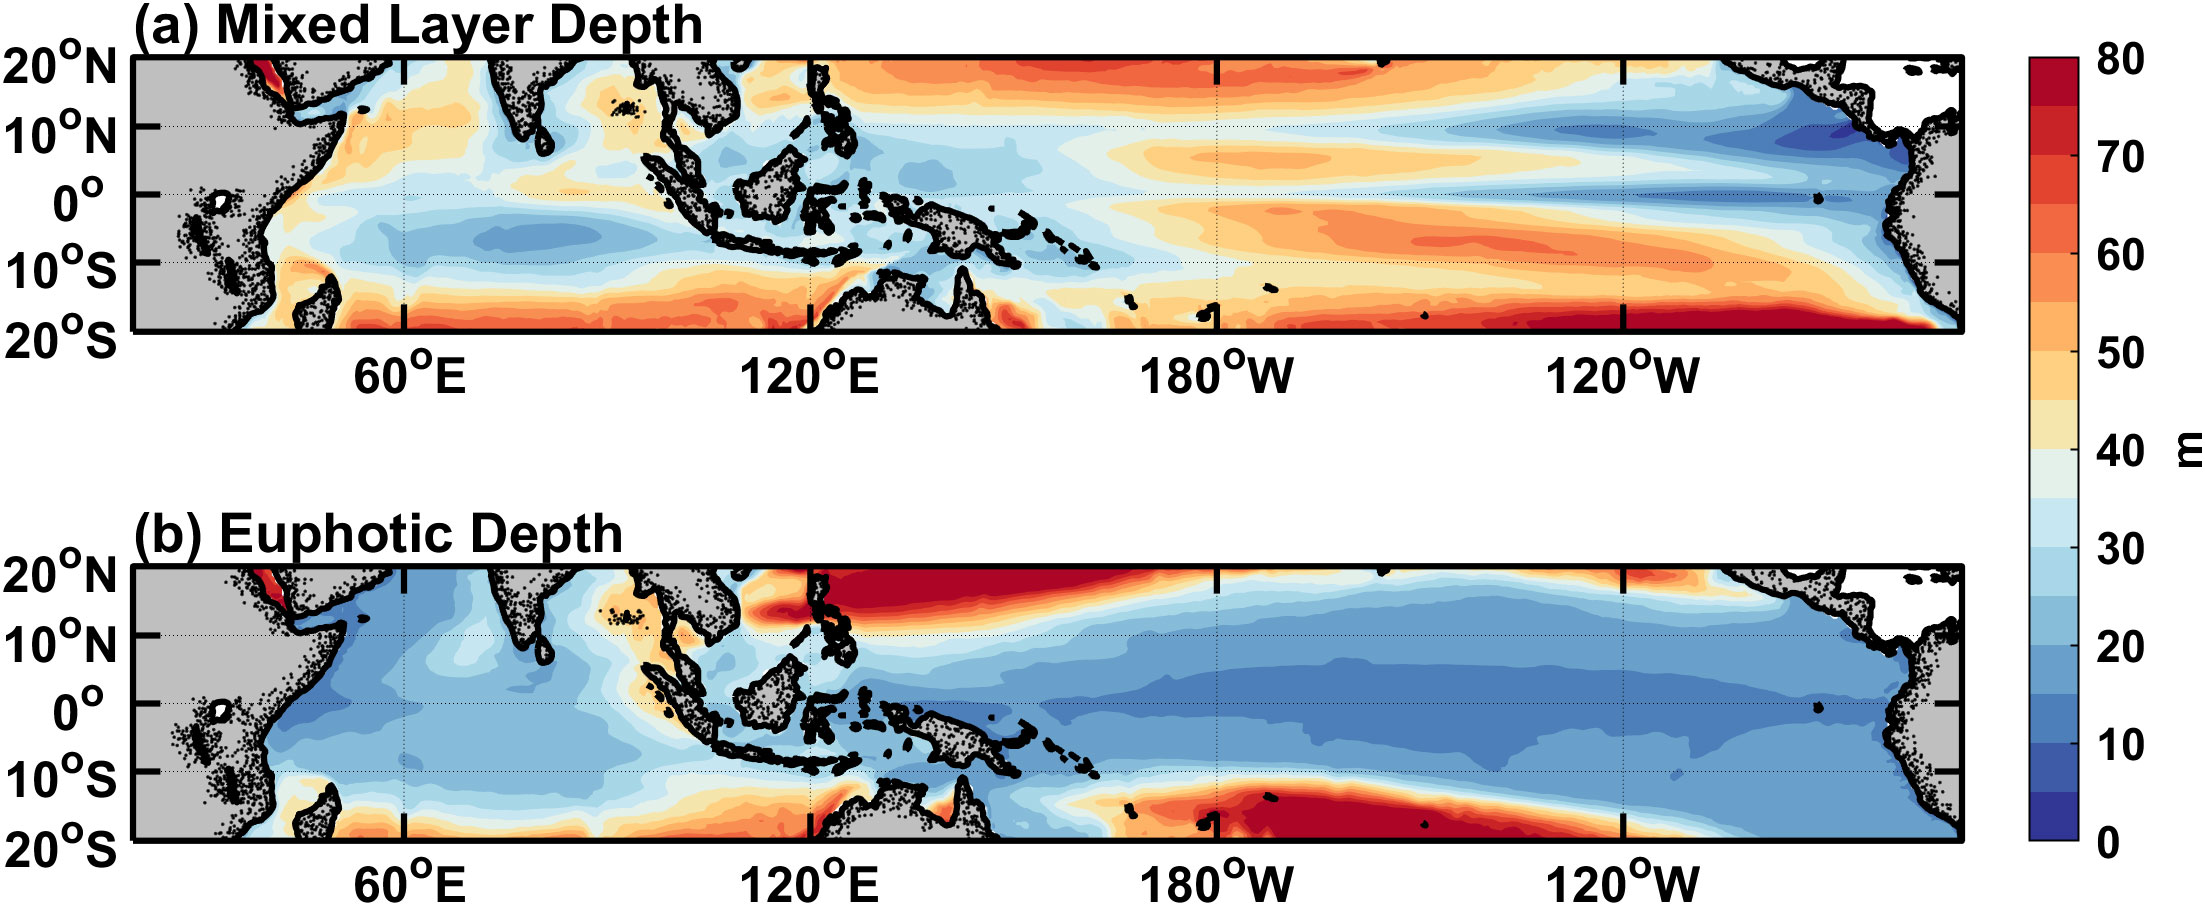
Figure 3. Horizontal distributions of simulated annual-mean (A) mixed layer depth and (B) euphotic depth averaged over the years 1995-2018. The contour interval is 5 m.
As shown in Figure 2, by comparing it with satellite data, it is seen that the model can well capture main features of the annual mean chlorophyll concentration. For example, the chlorophyll concentration is higher in the eastern equatorial Pacific, where strong upwelling brings plenty of nutrients. In contrast, the chlorophyll concentration is low in the subtropical gyres. Note that the simulated chlorophyll concentration in the eastern equatorial Pacific is somehow overestimated. The simulated maximum value can reach 0.5 mgChl m−3, while the maximum observation is only about 0.25 mgChl m−3. The reason for this bias may be that the simulated upwelling is too vigorous, which results in a high nitrate concentration. The ED can be estimated from the chlorophyll concentration in the upper ocean (Figure 2A). The spatial pattern of the ED in Figure 3B shows a spatial structure that is opposite to the chlorophyll concentration. Shortwave radiation decays faster in the eastern Pacific because of the higher chlorophyll concentration, whereas it can penetrate more than 60 m in the subtropical gyres with little chlorophyll. The ED is less than 15 m in most areas of the equatorial Pacific, and the MLD is greater than this value except for the region to the east of 120°W in the eastern equatorial Pacific (Figure 3A).
The aforementioned mathematical expressions in Equations 5–7 indicate that the three heating terms are functions of shortwave radiation, the MLD and chlorophyll concentration. As can be seen in Figure 4, the horizontal distribution of the annual mean is similar to that of shortwave radiation (figure omitted). has an order of 200 W m−2, while is less than 30 W m−2. This indicates that most of the incident shortwave radiation is absorbed within the mixed layer, while a little can penetrate into the subsurface. For , regions with large values (>15 W m−2) are mainly located in the subtropical gyres where the euphotic zone is deep (Figure 3B), and around 10°N where the mixed layer is shallow (Figure 3A). exhibits high values in the eastern basin near the equator and 10°N, and its spatial pattern is similar to that of the MLD (Figure 3A).
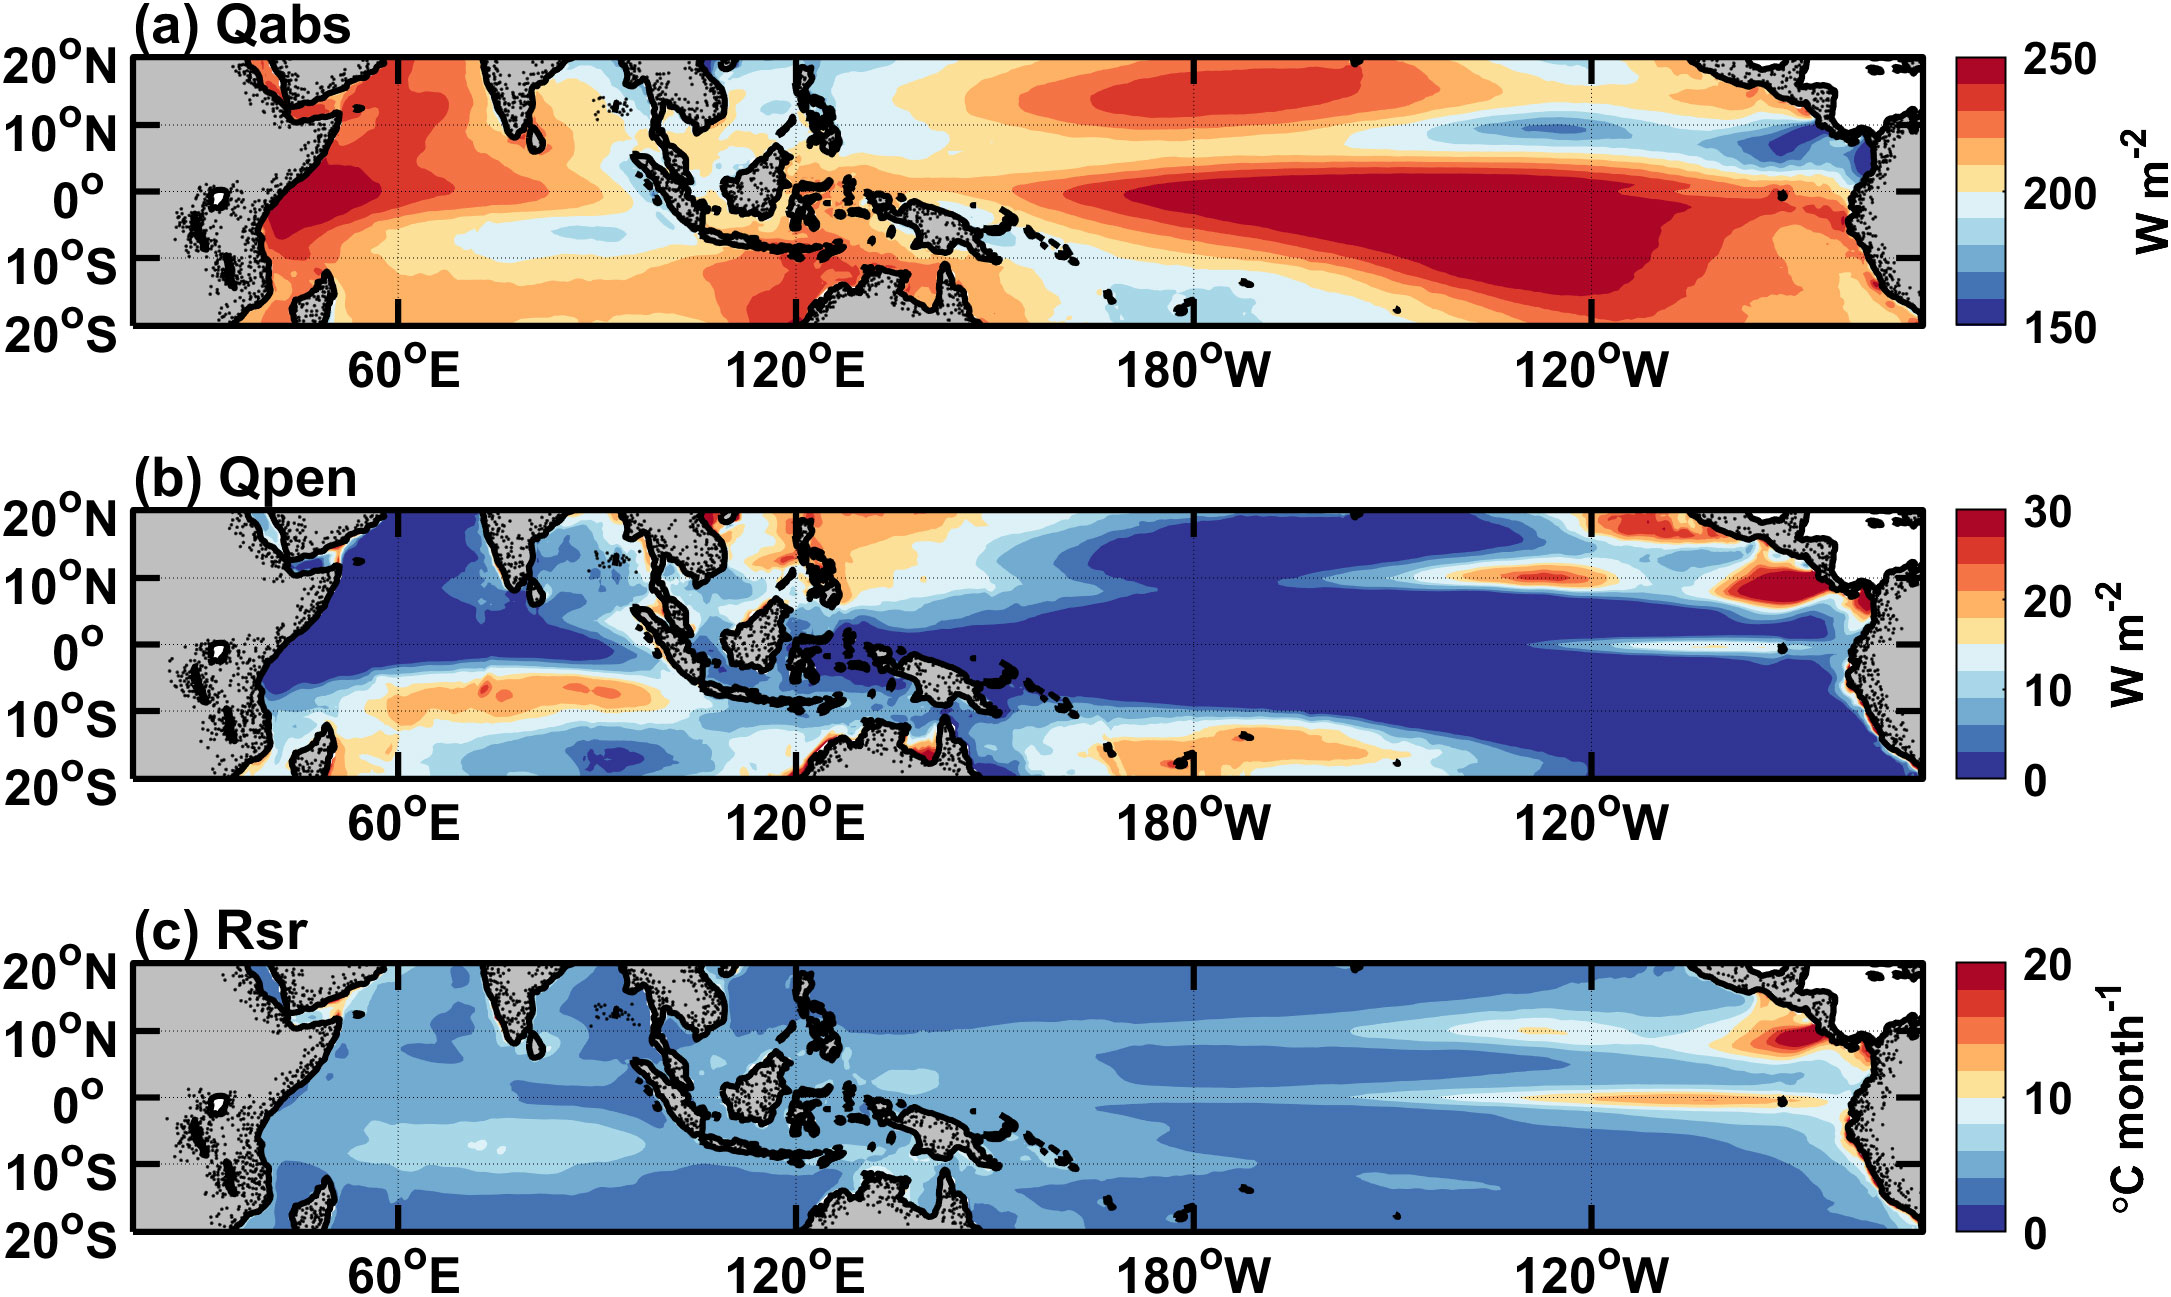
Figure 4. Horizontal distributions of simulated annual-mean (A) Qabs, (B) Qpen, and (C) Rsr averaged over the years 1995-2018. The contour interval is 10 W m–2 in (A), 2 W m–2 in (B), and 1 °C mon–1 in (C).
3.2 Seasonal variability
Figures 5A, B demonstrate the annual variations (i.e., the climatological annual-mean are subtracted from climatological monthly means) of simulated and observed SST over the tropical Pacific. There is an obvious seasonal variation in the eastern equatorial Pacific, with the warmest in spring and the coldest in autumn. The simulation exhibits a phase difference by one month compared with the corresponding observation. The warming occurs in February in simulation, while it is in March in observation. Correspondingly, the simulated cooling precedes the observed cooling also for about one month. Figure 6A shows the seasonal evolution of the MLD along the equator. The simulated seasonal cycle of the MLD is in good agreement with the corresponding observation (Supplementary Figure 1B). The mixed layer is the deepest in the central Pacific basin in summer and winter. In the eastern equatorial Pacific, the MLD simulation presents notable seasonal variations. The mixed layer is shallow in spring but deep in autumn.
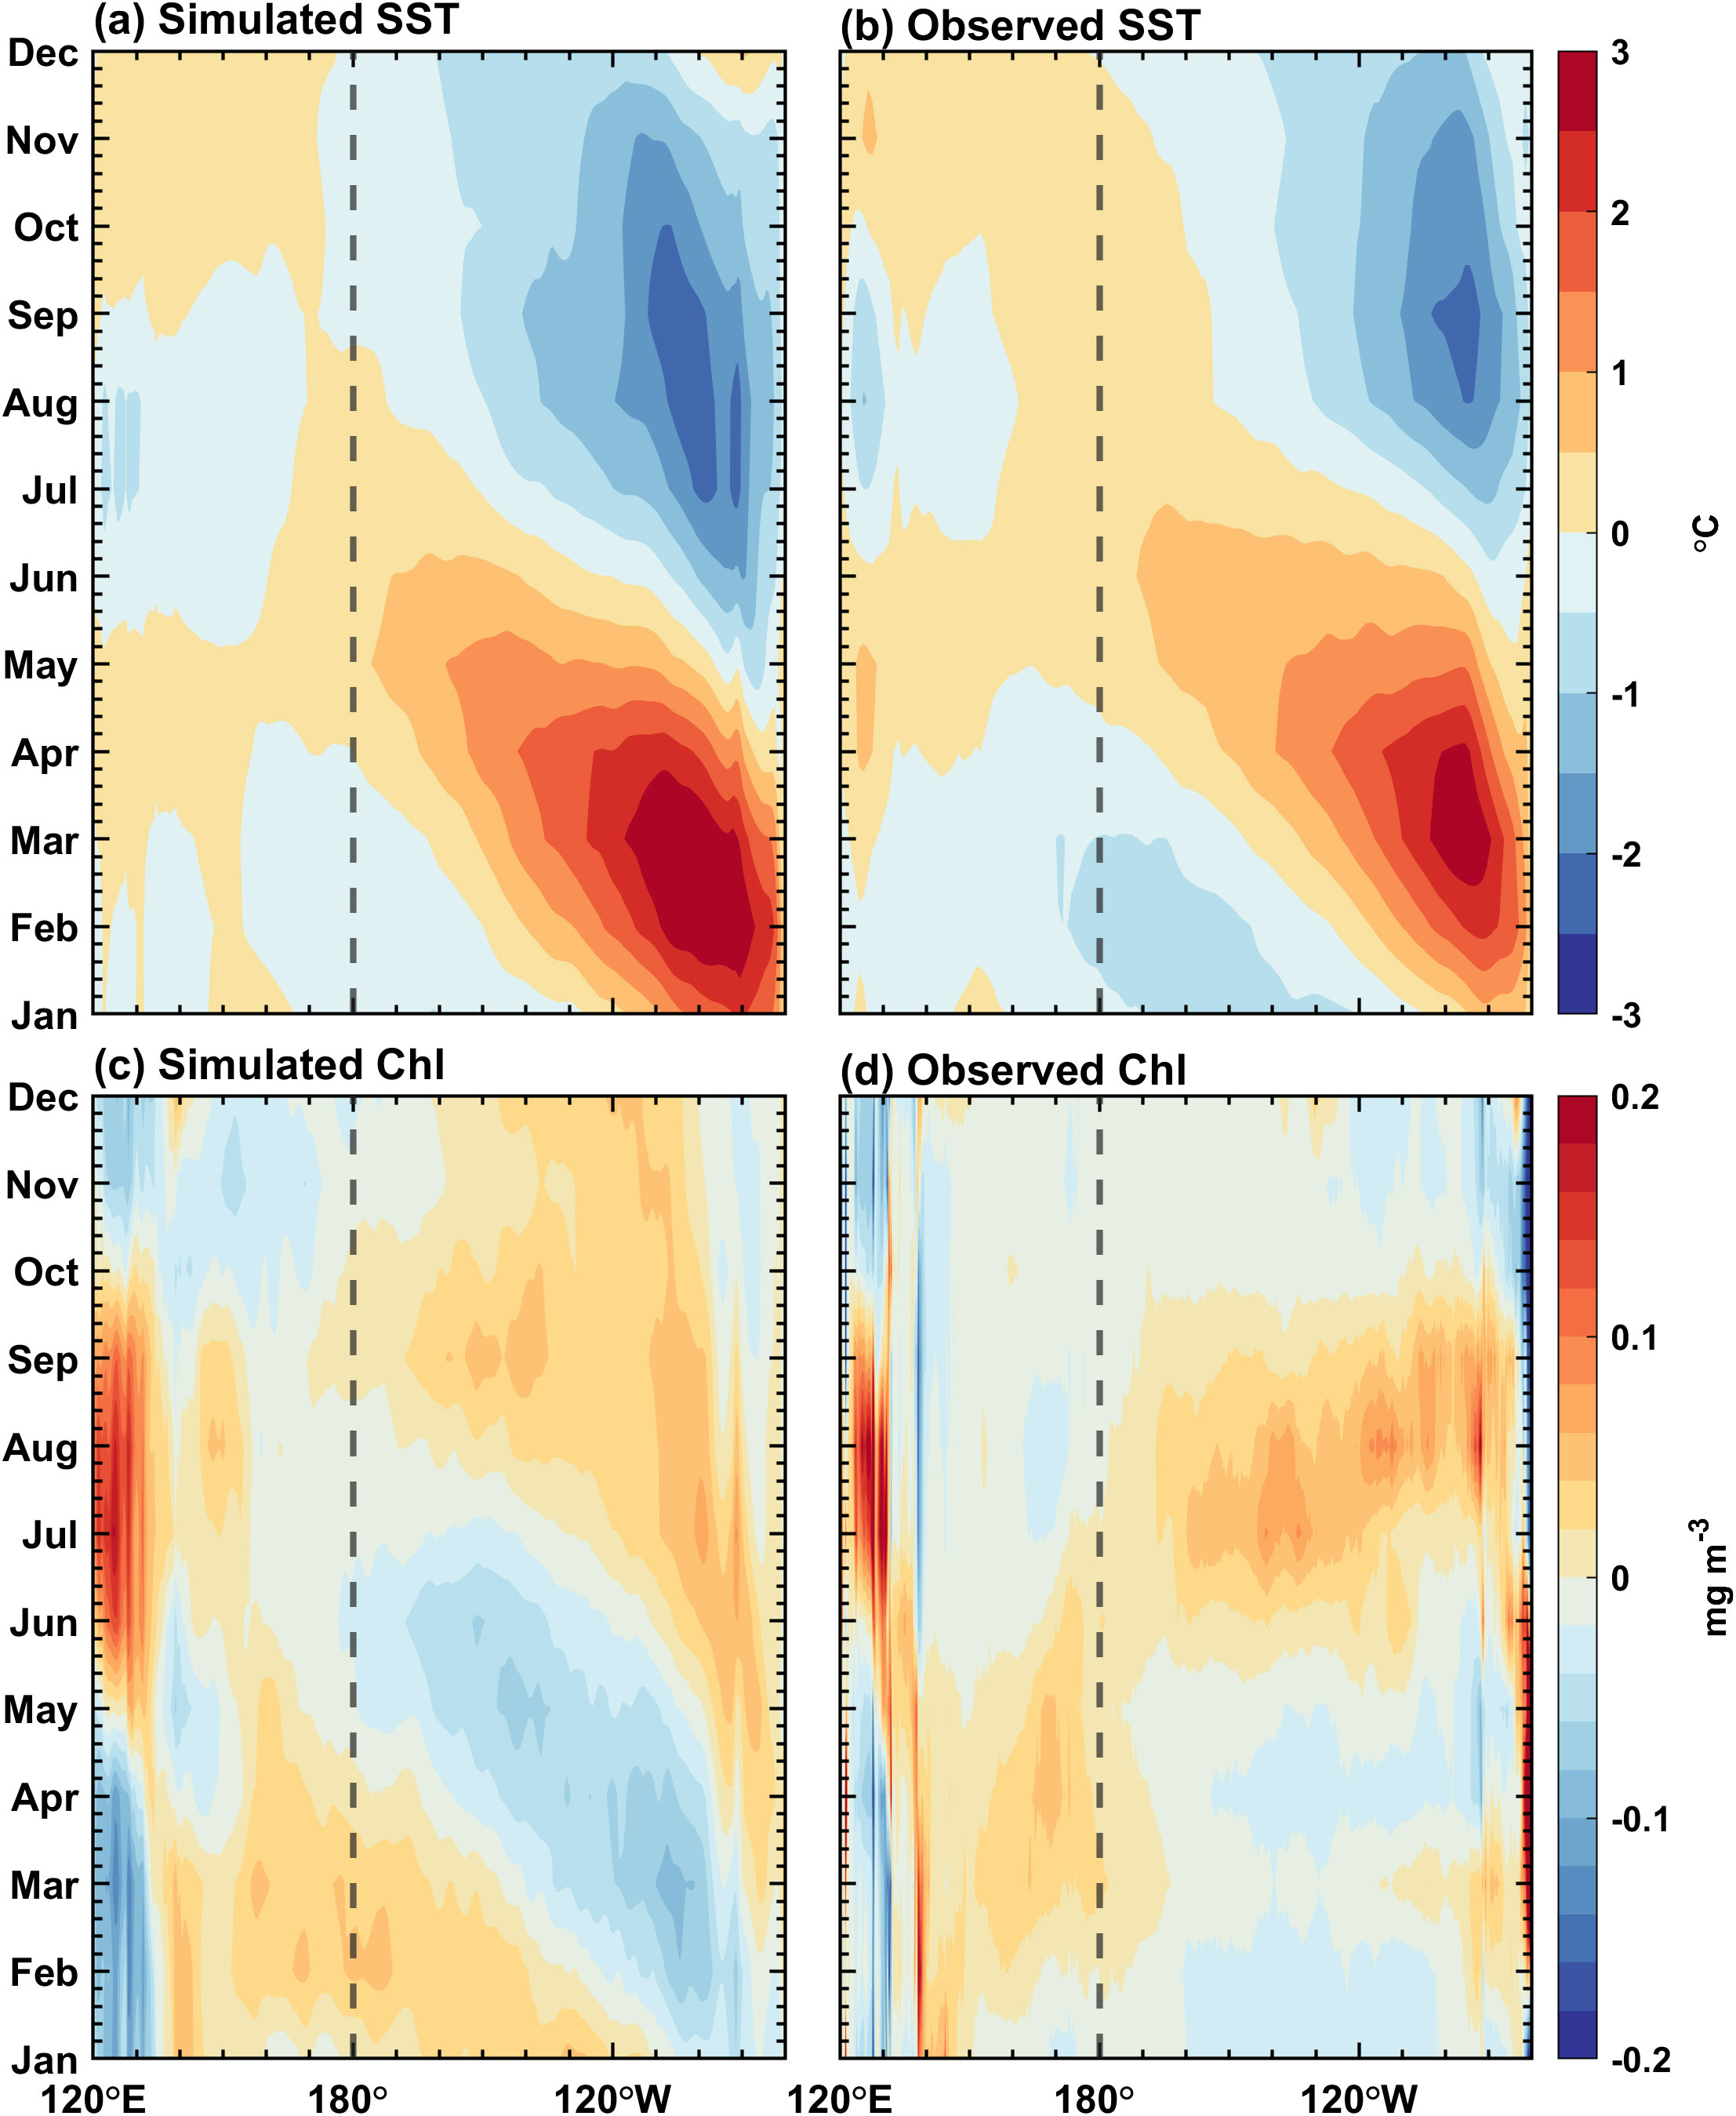
Figure 5. Annual variations (relative to their annual mean) along the equator (5°S–5°N) for simulated (left panels) and observed (right panels) (A, B) SST and (C, D) surface chlorophyll concentrations in the Pacific Ocean. The contour interval is 0.5 °C in (A, B), and 0.02 mg Chl m–3 in (C, D). The observed SST is from OISST V2 data, and the observed surface chlorophyll concentration is from SeaWiFS.
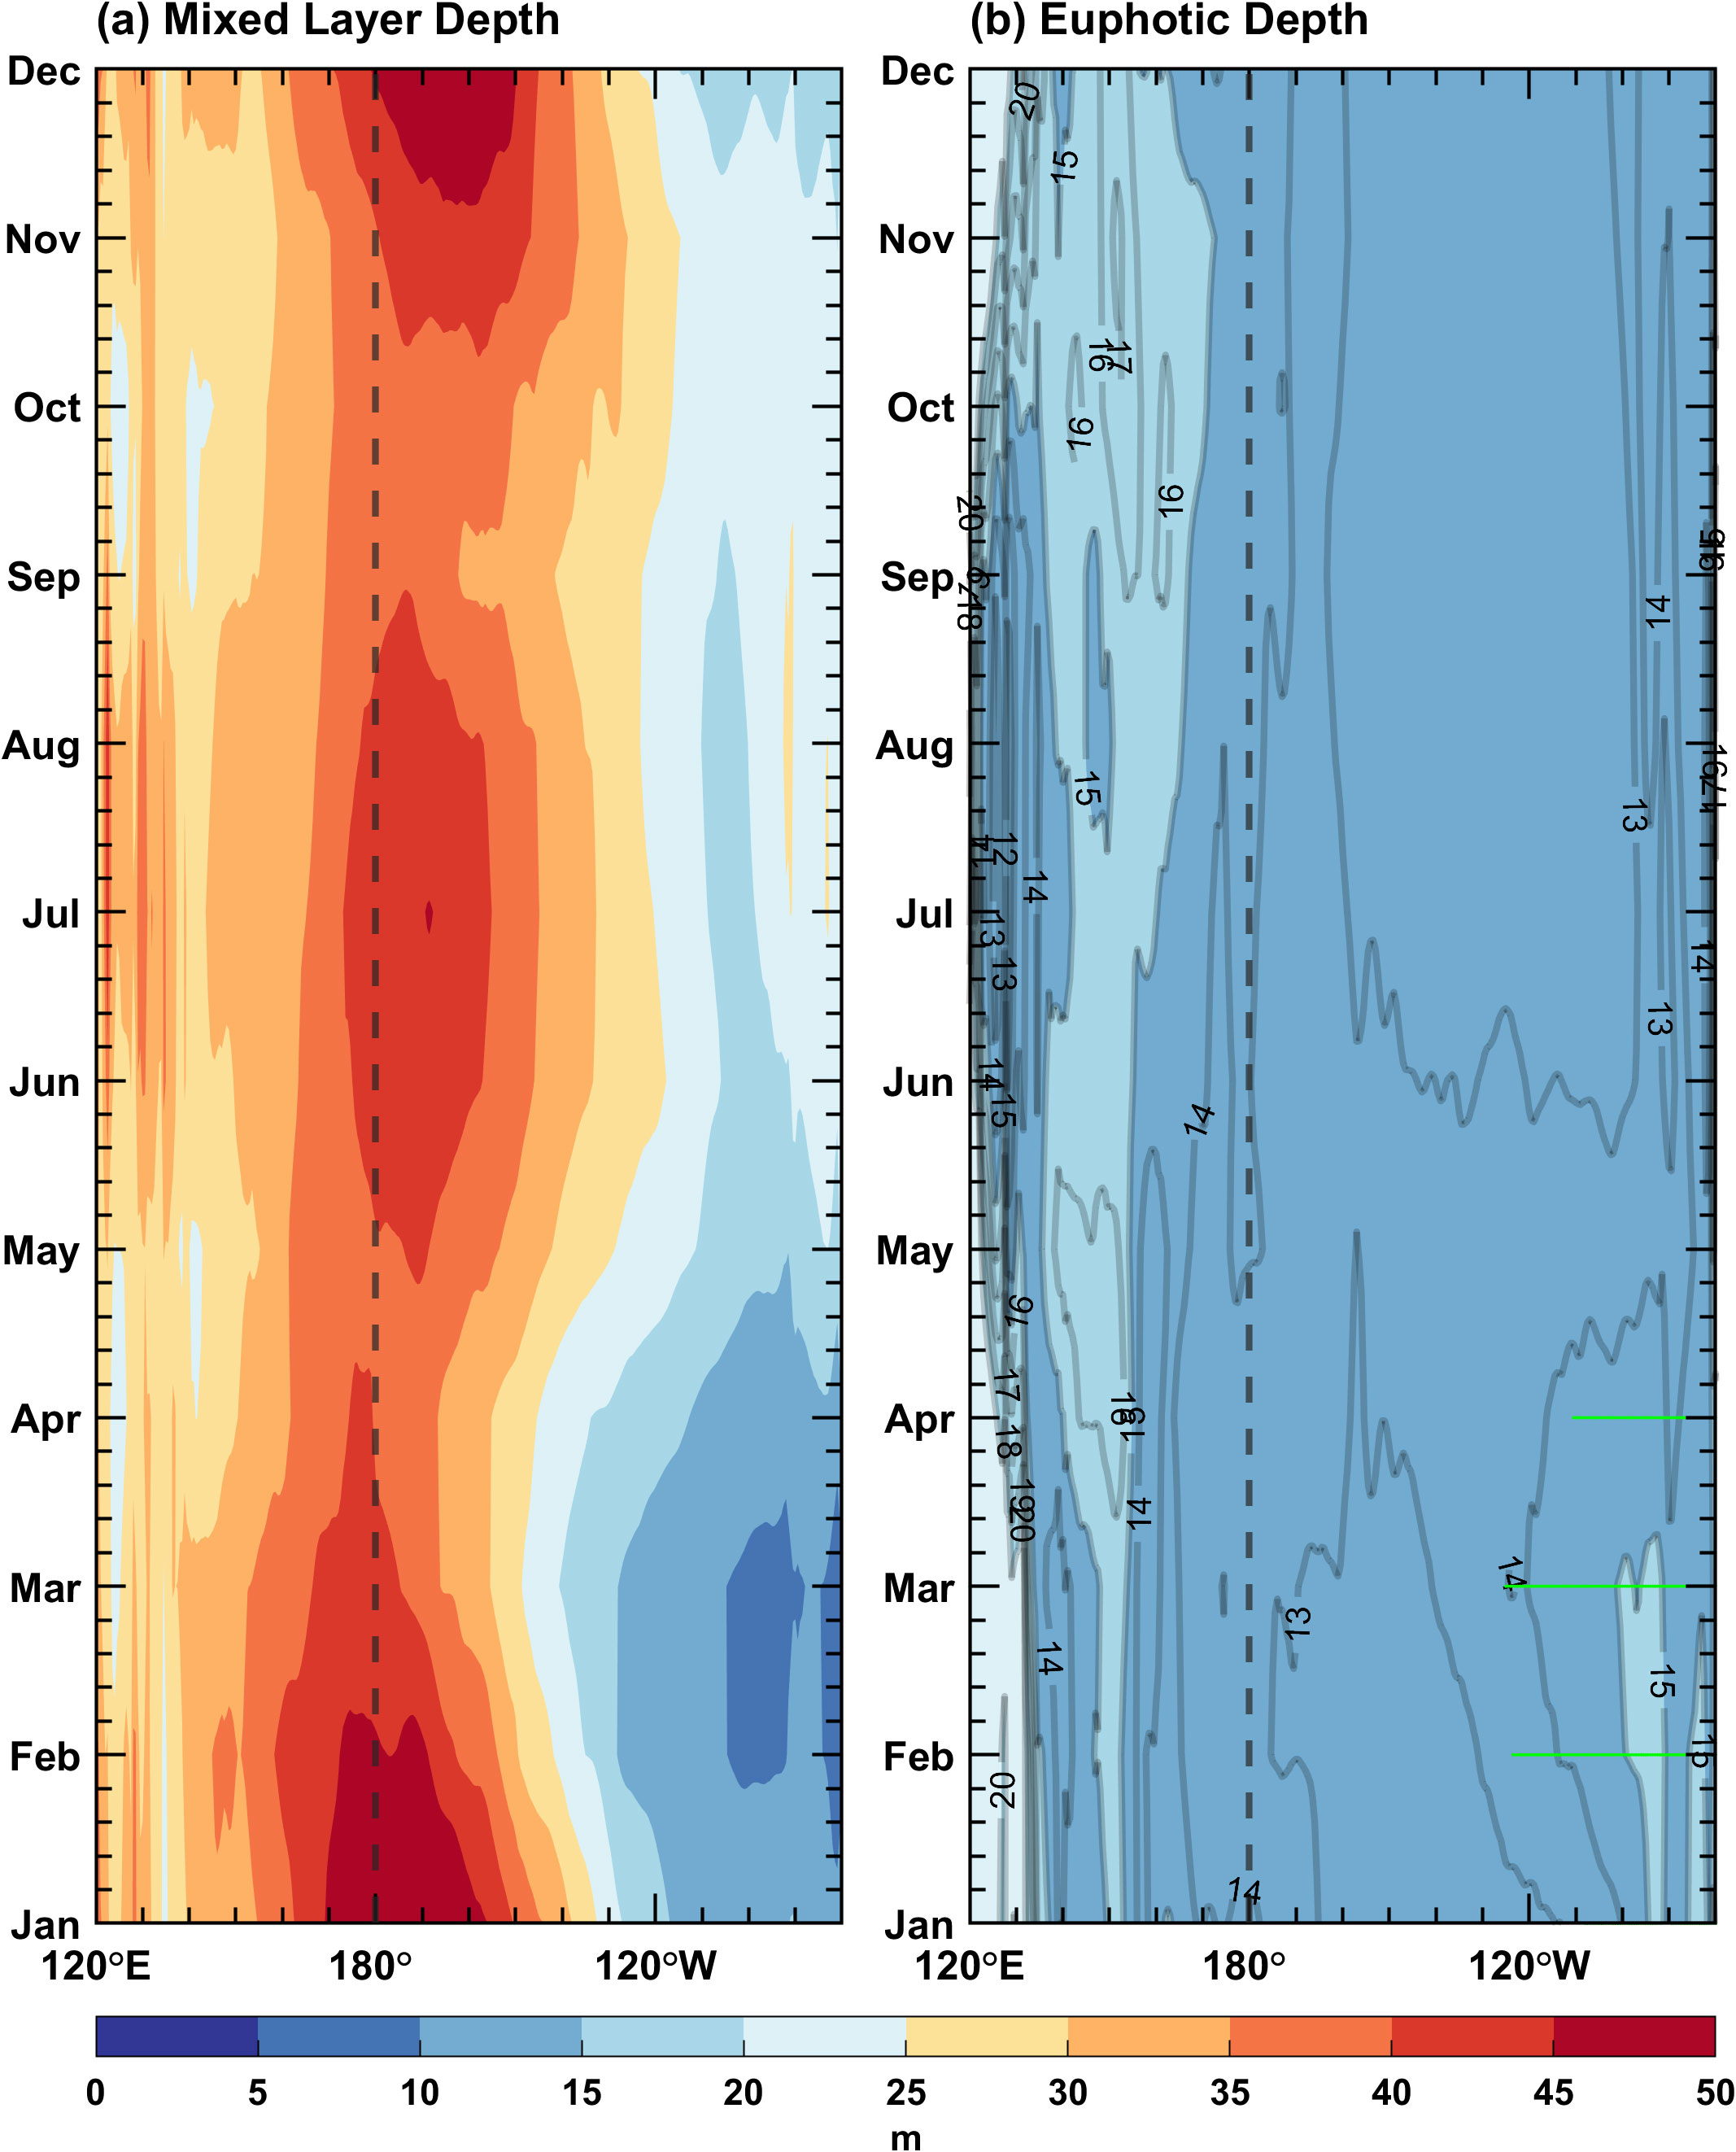
Figure 6. Seasonal cycles along the equator (5°S–5°N) for simulated (A) mixed layer depth and (B) euphotic depth in the Pacific Ocean. The contour interval is 5 m, and the green dots indicate that the depth of the euphotic layer is greater than that of the mixed layer.
Figures 5C, D demonstrate the seasonal cycle of sea surface chlorophyll concentration over the tropical Pacific for simulation and observation, respectively. The annual mean is removed to avoid the influence of the overestimated chlorophyll concentration. The simulated surface chlorophyll concentration differs from observation in the eastern equatorial Pacific; only some broad features can be captured well, such as a decrease in spring and summer and an increase in autumn and winter, respectively. The seasonally varying signal starts from the South American coast and then propagates westward. Its seasonality and propagation characteristics resemble those of the SST in the eastern Pacific, suggesting that the seasonal variation in chlorophyll may be dominated by the upwelling. The ED is calculated based on the chlorophyll concentration. Figure 6B exhibits that the euphotic zone is generally shallow in the equatorial Pacific (<20 m); it deepens in spring and shallows in autumn. In February, March and April, the euphotic layer over the eastern equatorial Pacific is deeper than the mixed layer (Figure 6B), with a reduced chlorophyll concentration (Figure 5C) and a shallower mixed layer (Figure 6A), indicating that the incident shortwave radiation penetrates through the mixed layer and reaches the deeper ocean.
Seasonal variations in the three biology-induced heating terms along the equator (averaged from 5°S–5°N) are shown in Figure 7. The variation of closely resembles that of shortwave radiation (figure omitted), except in the east of 120°W from January to May when the mixed layer is shallow and the euphotic layer is deep. The shortwave radiation can penetrate below the mixed layer, resulting in that exceeds 15 W m−2. The seasonal variation of is basically opposite to that of the MLD. In the eastern equatorial Pacific, is greater than 10°C month−1 throughout the year, with a notable increase from January to May, corresponding to a shallower mixed layer (Figure 6A). These findings indicate that these terms are predominately determined by the MLD. Nevertheless, is also modulated by the ED, which is characterized by strong regional and seasonal dependences. For instance, rises markedly in the eastern equatorial Pacific during late winter and early spring, coinciding with the euphotic layer that lies beneath the mixed layer (Figure 6). In other regions or other months, the mixed layers are so deep that the incident shortwave radiation is almost absorbed within the mixed layer, leading to that is extremely small.
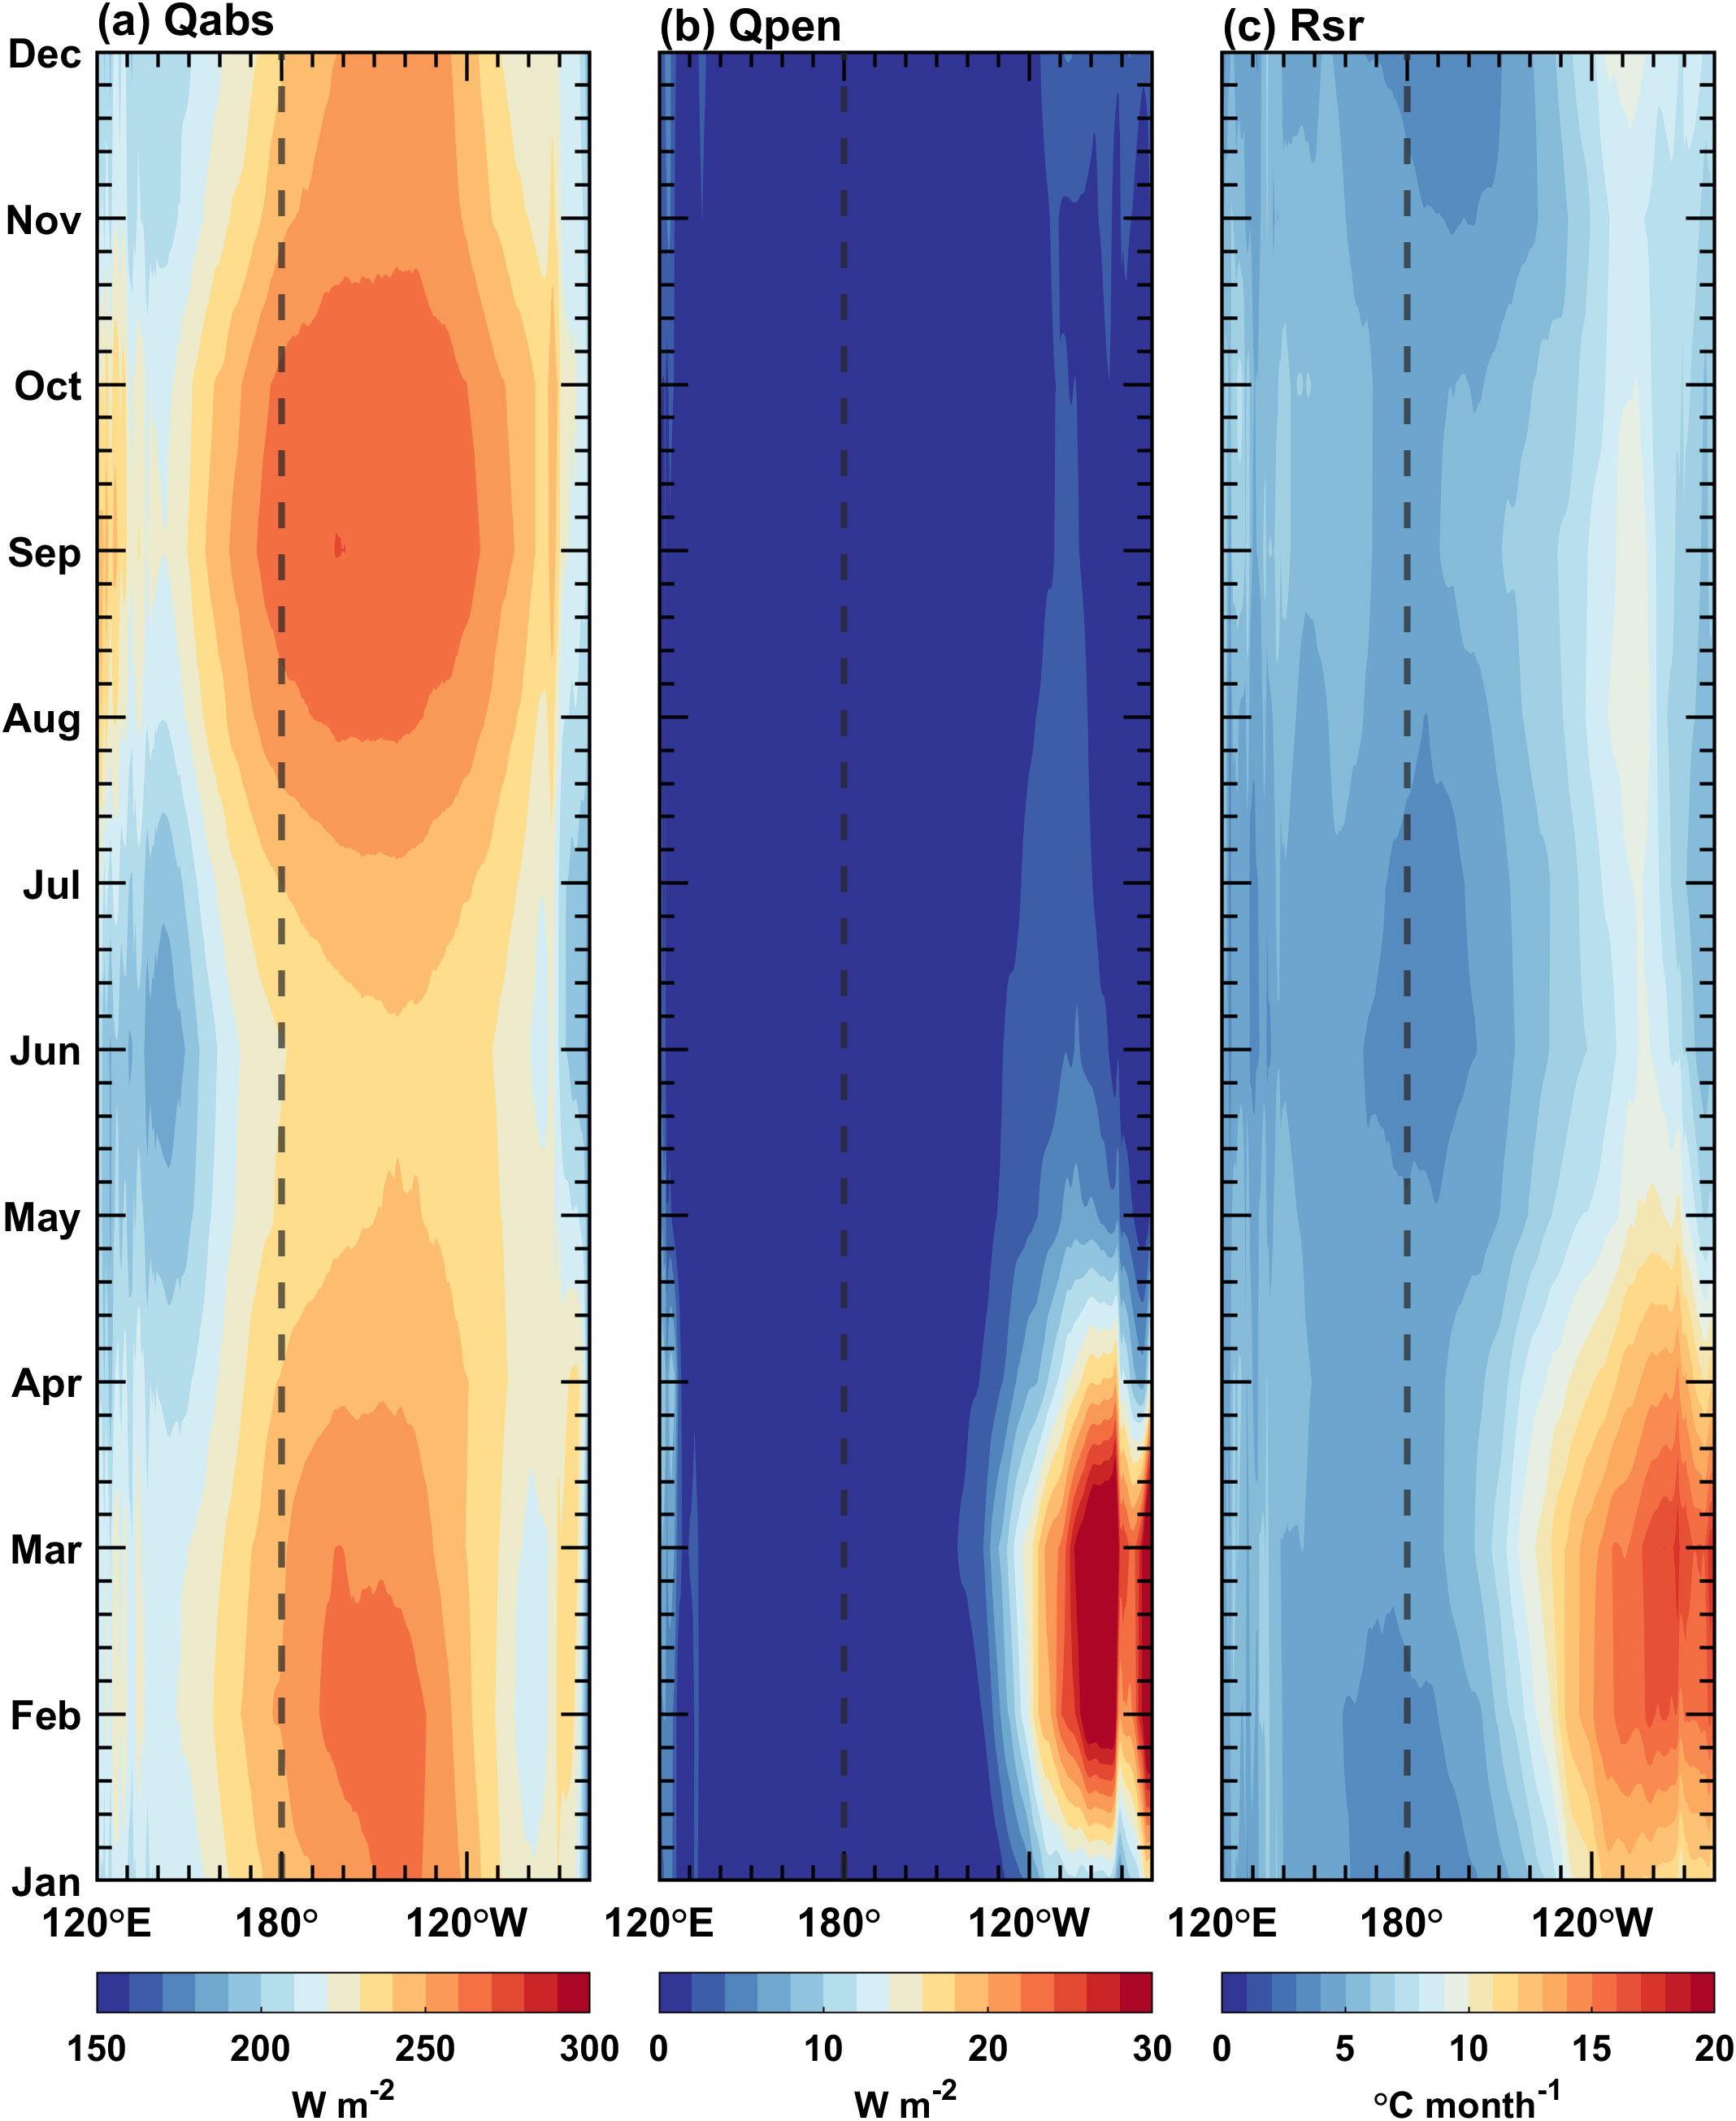
Figure 7. Seasonal cycles along the equator (5°S–5°N) for simulated (A) Qabs, (B) Qpen, and (C) Rsr fields in the Pacific Ocean. The contour interval is 10 W m–2 in (A), 2 W m–2 in (B), and 1 °C mon–1 in (C).
3.3 Interannual variability
Figure 8A displays the temporal evolution of simulated SST anomalies along the equator. The simulated interannual SST anomaly is consistent with the observation (Supplementary Figure 2A). For example, there are large warm SST anomalies during 1997/98 and 2015/16 when extreme El Niño events happened. Apart from the typical eastern Pacific (EP) El Niño events (large warm SST anomalies occur both in the eastern and central Pacific, hereinafter referred to as EP-El Niño) (Radenac et al., 2012), another type of El Niño, termed the central Pacific (CP) El Niño events (large warm SST anomalies occur in the central Pacific, hereinafter referred to as CP-El Niño) (Radenac et al., 2012; Zhang et al., 2022), is also captured during 2002/03, 2004/05 and 2009/10, respectively. The large center of interannual SST variability is located in the central-eastern equatorial Pacific. Warm SST anomalies are accompanied by a weakened upwelling in the eastern Pacific and westerly wind anomalies in the western Pacific (Ren and Jin, 2013). The mixed layer (Figure 9A) is anomalously deep in the eastern Pacific and anomalously shallow in the central-western Pacific during El Niño events, and it is opposite during La Niña events, e.g., 1998/2000, 2007/08, and 2010/11. The interannual variability of the MLD is characterized by a see-saw pattern in the zonal direction with a zero line near 160°W along the equator, similar to observations (Supplementary Figure 1C).
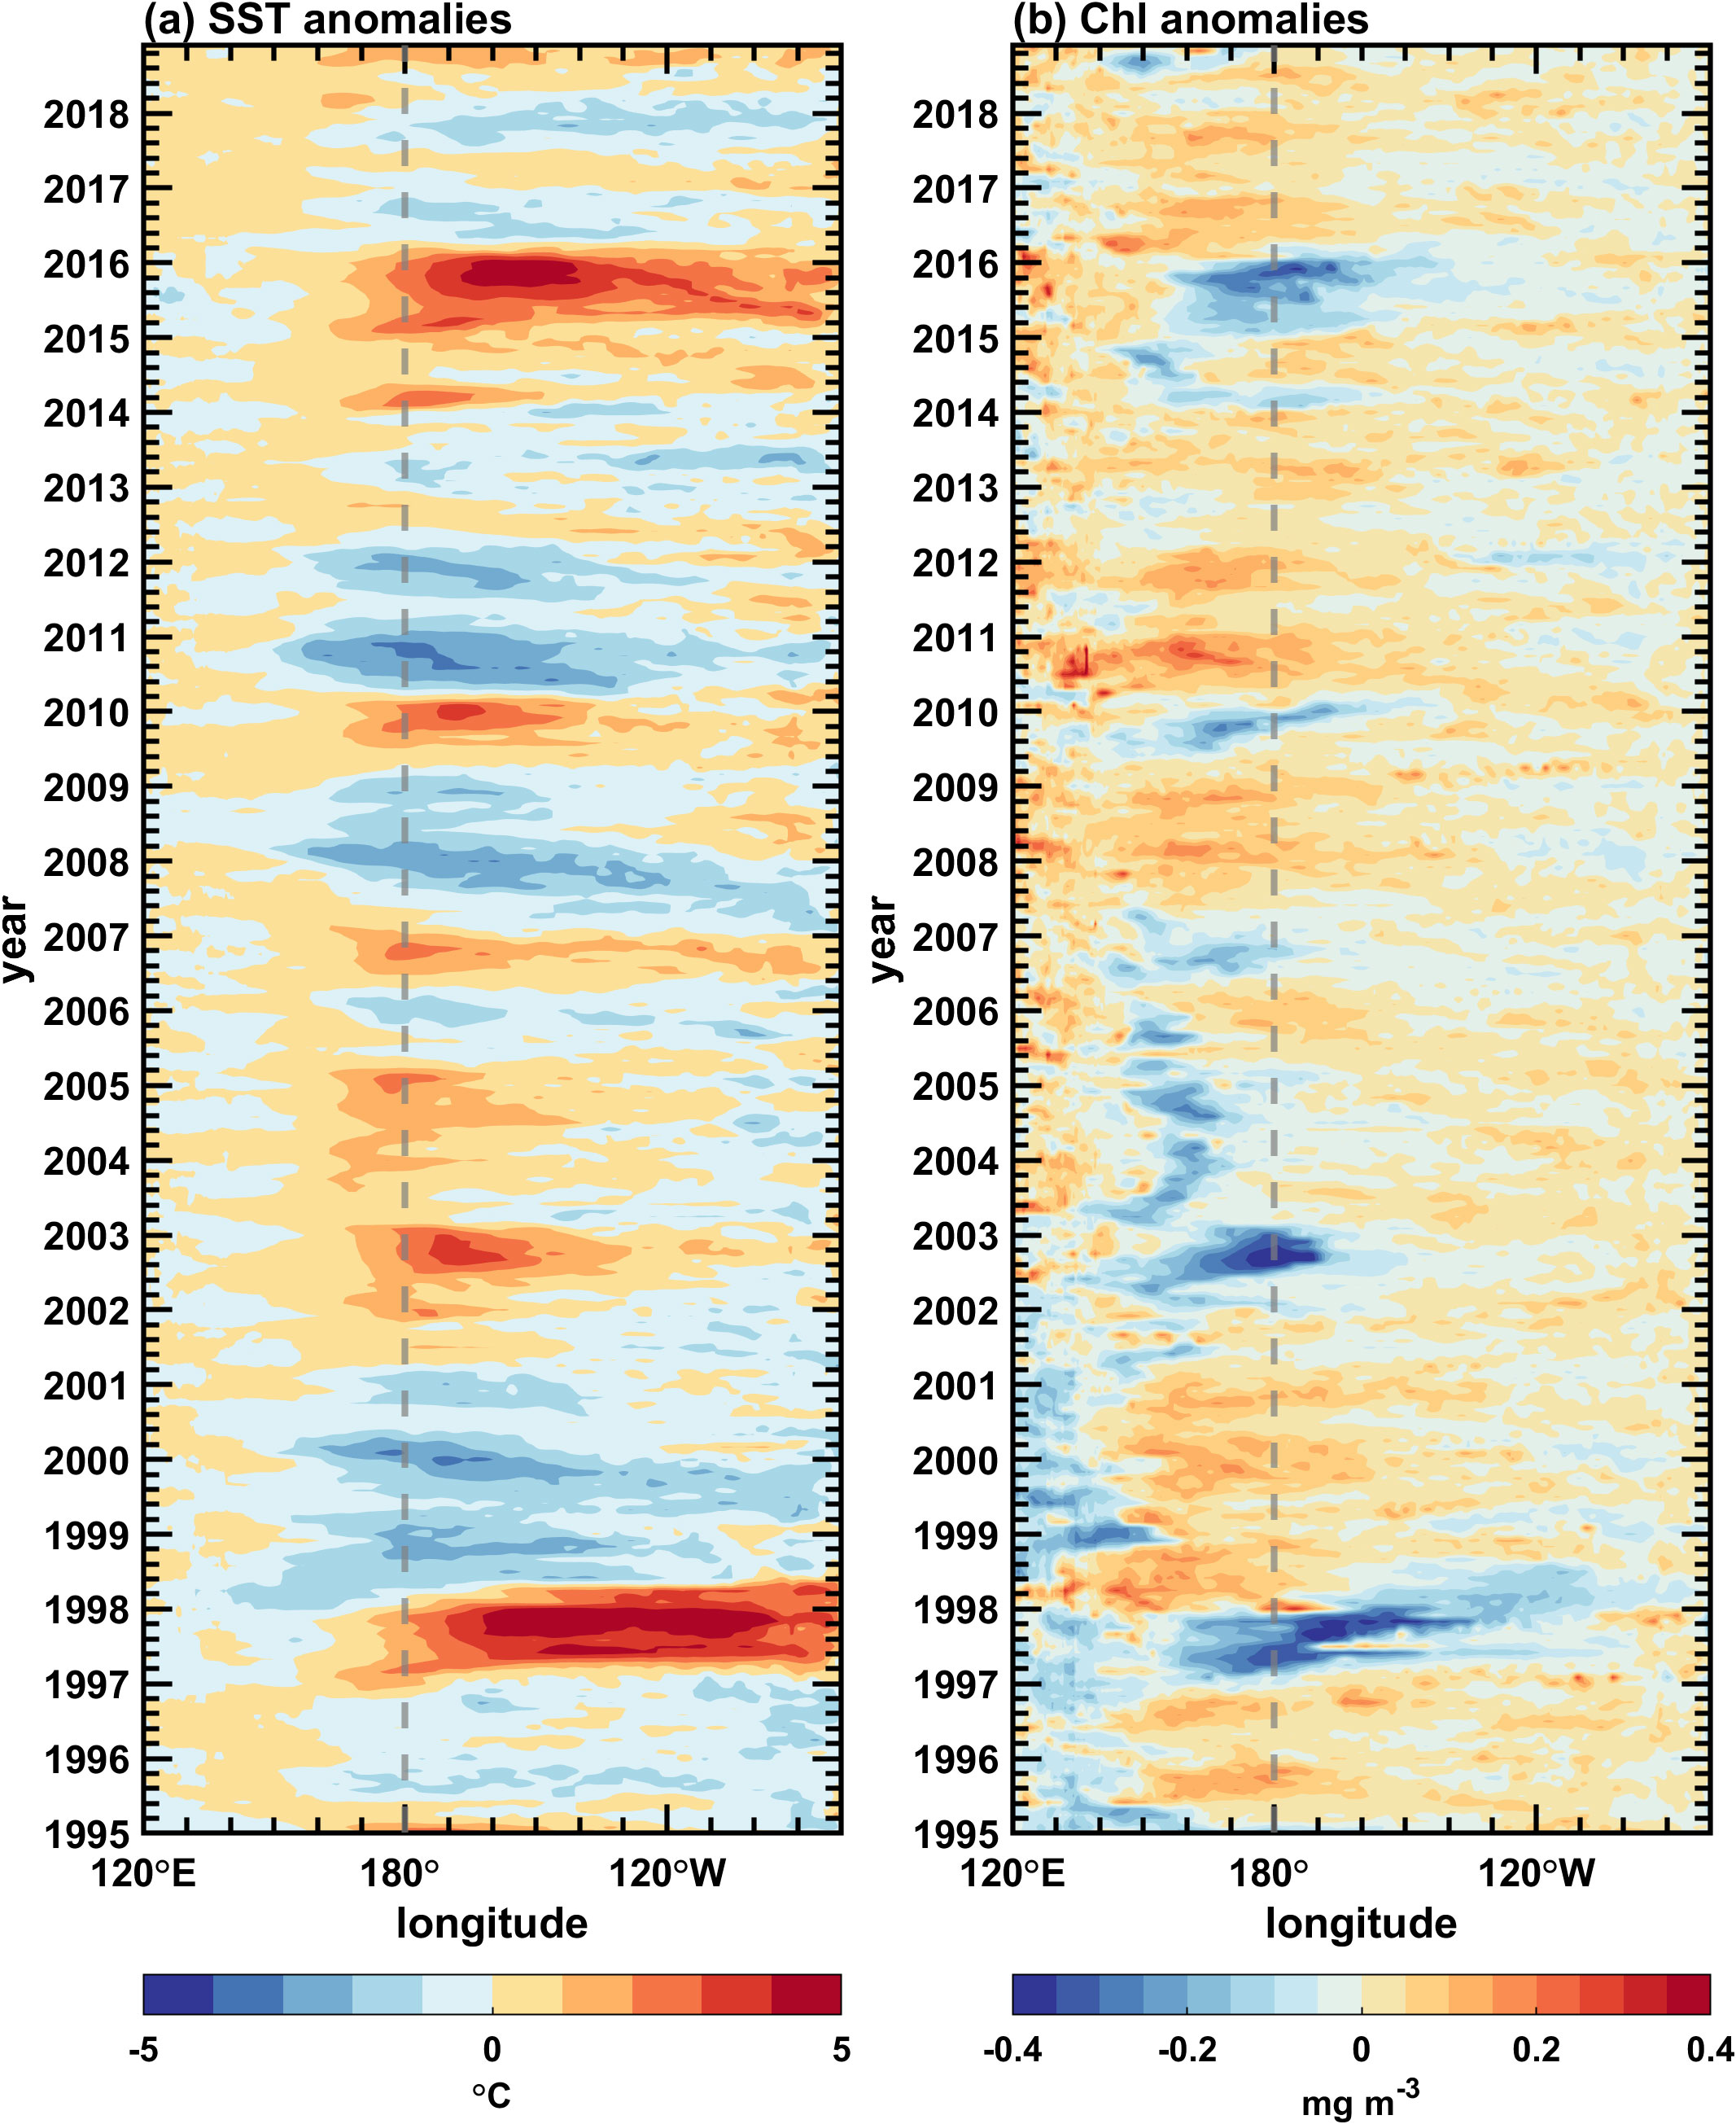
Figure 8. Longitude-time sections along the equator (5°S–5°N) for simulated interannual anomalies of (A) SST and (B) surface chlorophyll concentrations in the Pacific Ocean. The contour interval is 1 °C in (A), and 0.05 mg Chl m–3 in (B).
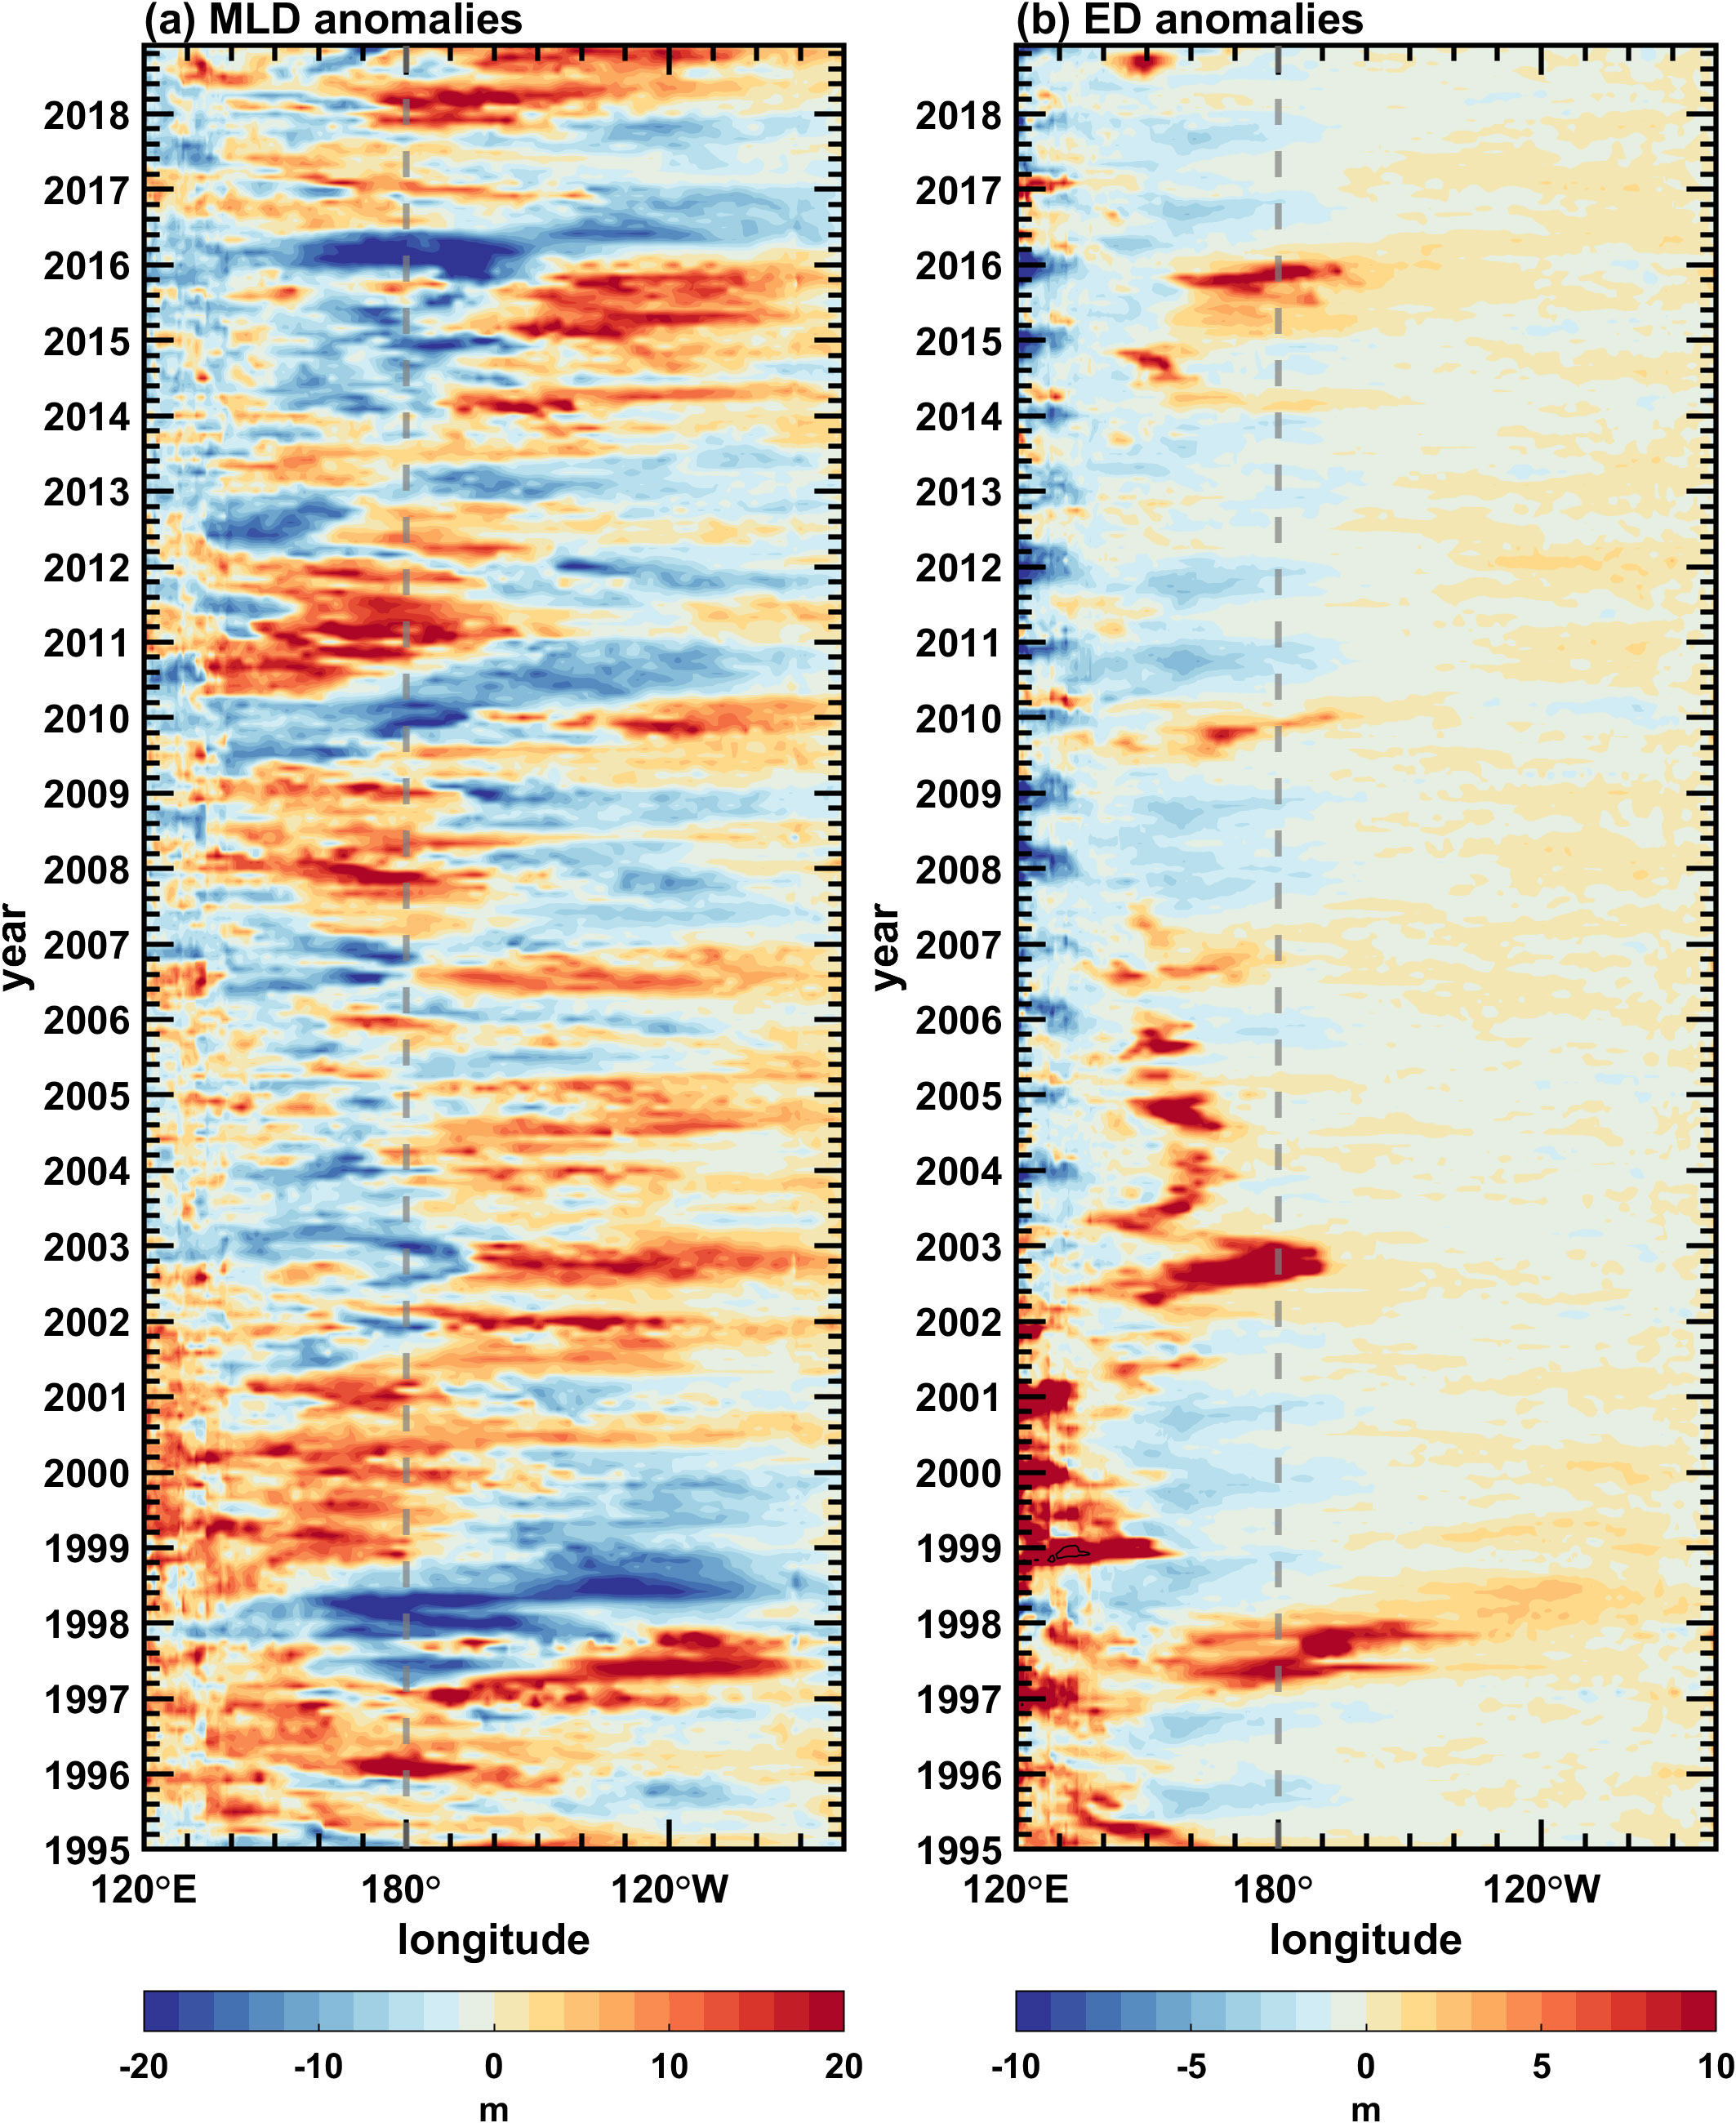
Figure 9. Longitude-time sections along the equator (5°S–5°N) for simulated interannual anomalies of (A) mixed layer depth and (B) euphotic depth in the Pacific Ocean. The contour interval is 2 m in (A, B).
With these anomalies in physical fields, the surface chlorophyll shows a basin-scale interannual variation dominated by ENSO events (Figure 8B), similar to observations (Supplementary Figure 2B). The chlorophyll concentration decreases in the central and eastern equatorial Pacific during the 1997/98 and 2015/16 El Niño events due to the suppression of the equatorial upwelling, which carries rich nutrients from deep waters. The core of the maximum negative chlorophyll anomaly is near the dateline for EP-El Niño events and around 160°E for CP-El Niño. The spatial pattern of surface chlorophyll concentration during La Niña events is somewhat opposite to that during CP-El Niño events. In general, a coherently opposite relationship exists between chlorophyll anomalies and SST anomalies over the equatorial Pacific (Zhang et al., 2011). The interannual variability of the ED along the equator (Figure 9B) is similar to that of the surface chlorophyll concentration (Figure 8B). For example, in the western-central equatorial Pacific, the ED exhibits positive anomalies during El Niño events, while chlorophyll concentration presents negative anomalies. During La Niña events, the ED presents negative anomalies, while the chlorophyll concentration presents positive anomalies. In this region, the amplitude of the interannual variability of the ED is large and comparable to that of the MLD; in the eastern equatorial Pacific, it is much smaller than that of the MLD (Figure 9).
Figure 10 displays interannual variations in , and along the equator. The interannual anomaly of (Figure 10A) is consistent with that of the shortwave radiation (figure omitted) in most areas, with only minor differences to the east of 130°W. exhibits two variability centers (Figure 10B): one is located in the western-central equatorial Pacific, with variations similar to those of the ED (Figure 9B); the other is located in the eastern equatorial Pacific, with significant variations only in late winter and early spring. Focusing on the equatorial western-central Pacific, it is found that the maximum interannual variability of the ED is also located in this region, with its amplitude being comparable to that of the MLD (Figure 9). In this region, the interannual variability of the ED (chlorophyll) exerts an asymmetric modulating effect on , which is out-of-phase (in-phase) with that of the mixed layer depth. During El Niño events, the mixed layer becomes shallow, which leads to a decrease in and an increase in (Figures 9, 10). Meanwhile, the ED increases as the chlorophyll decreases, and can even exceed the MLD (Supplementary Figure 3). In this case, becomes pronouncedly larger, and the positive ED anomaly (the negative chlorophyll anomaly) acts to enhance a positive anomaly. During La Niña events, the depth variations of the mixed layer and the euphotic layer are opposite. The negative ED anomaly (the positive chlorophyll anomaly) should theoretically enhance the negative anomaly. However, since the depth of the euphotic layer here is smaller than that of the mixed layer, which means that almost all of the shortwave radiation is absorbed within the euphotic layer, and very little shortwave radiation penetrates below the mixed layer (i.e., the is extremely small) (Figure 10B). Therefore, the changes in are not significant, and the variations in the ED (chlorophyll) have little effects on . is also a function of both MLD and , with the latter being also related to the MLD. Comparing Figure 10C with Figure 9, it is evident that the interannual variations of are more effectively affected by the MLD.
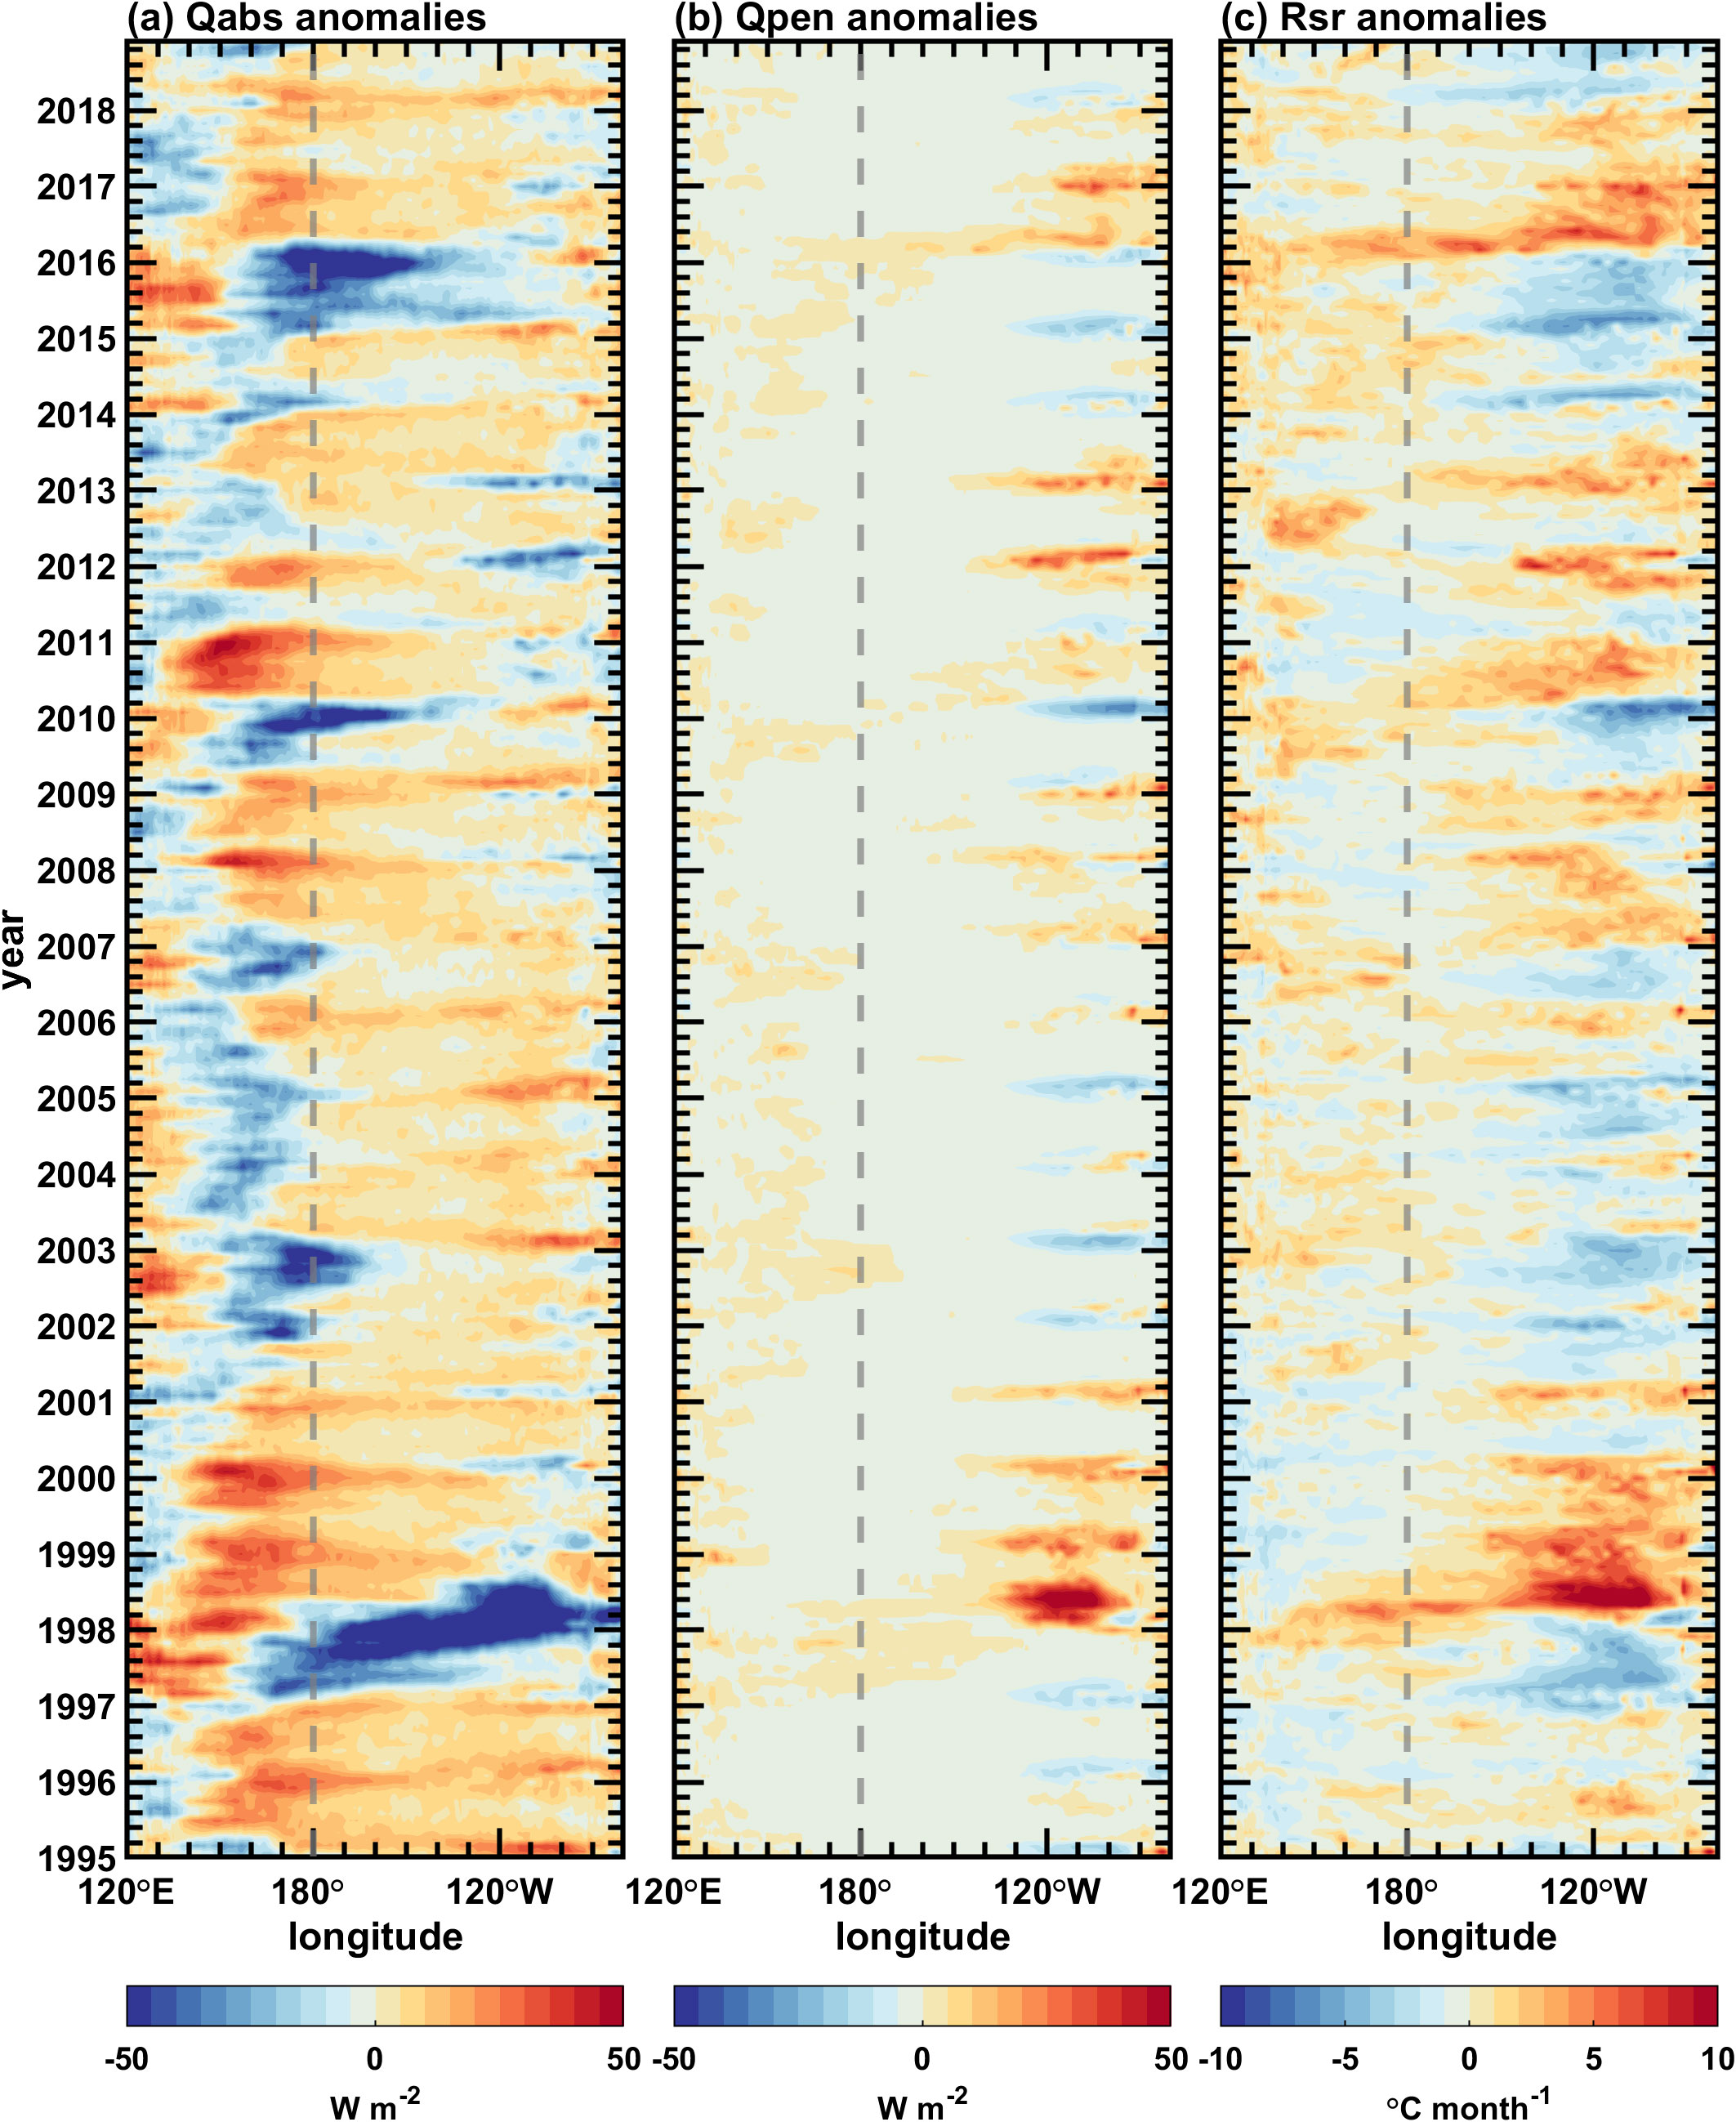
Figure 10. Longitude-time sections along the equator (5°S–5°N) for simulated interannual anomalies of (A) Qabs, (B) Qpen, and (C) Rsr fields in the Pacific Ocean. The contour interval is 5 W m–2 in (A, B) and 1 °C mon–1 in (C).
4 Discussion
The ROMS employs a stretched terrain-following coordinate system, which not only has the benefit of a σ-coordinate system, but also enables further refinement near the surface or the bottom boundary regions. The ROMS, as a state-of-the-art ocean dynamical model that allows higher resolution and better adaptability to coastal boundaries, has been extensively utilized by the scientific community, but it is often limited to regional-scale applications. Here, we apply the ROMS to a basinwide tropical Indo-Pacific Ocean to achieve a two-way coupling between its physical and ecological components, which can represent interactive impacts of the marine ecological fields on the physical fields.
As stated in the introduction, bio-modeling in the tropical Pacific with differently formulated OGCMs is clearly needed to explore interactions between ocean biogeochemistry and the climate system in the tropical Pacific. The ROMS supplies several ecological modules, including the NPZD-IRON ecological model, which can be activated in modeling experiments. Due to the simple variable selections of the ecological model, it is economical in terms of computations. It should be noted that the coupling between the ROMS and ecological model in its default setting is still one-way from physical side to ecological side, not the other way around. Thus, in most previous studies, ecological models based on the ROMS are often used to study marine ecological dynamics. In this study, the coupling between the ROMS and the NPZD-IRON has been expanded from one-way to two-way by modifying the default shortwave penetration parameterization to reflect the influences of the ocean ecological fields on the physical fields.
In order to simplify the conversion of phytoplankton biomass into chlorophyll concentration, this study still uses a fixed C:Chl ratio; the NPZD-IRON model used in this paper is still at a lower trophic level with only two limiting nutrients and one size class for phytoplankton and zooplankton (Fiechter et al., 2009). As noted by Wang et al. (2009), the C:Chl ratio can vary with the irradiance, temperature, nitrate and iron concentrations. Since the ROMS provides a variety of ecological modules, other more complex ecological models can be selected and tested in the future according to actual needs, including a way to represent a varying C: Chl ratio. Nevertheless, results from this modeling activity indicate that the model is sufficiently realistic for qualitative investigation since it can well reproduce the spatial pattern of chlorophyll, such as the triangular high-value region in the eastern Pacific. The ROMS-based ocean physical-ecological coupled model provides an alternative flexible vertical layering method for successful applications, and its results can be cross-validated with other ocean models (Nakamoto et al., 2001; Murtugudde et al., 2002; Manizza, 2005; Lin et al., 2007; Löptien et al., 2009; Zhang, 2015b).
Additionally, this study analyzes three heating terms that are related to chlorophyll and the MLD. It is generally recognized that chlorophyll absorbs solar radiation in seawater, but its impact on the ocean remains intricate and is not fully comprehended. For instance, the chlorophyll absorbs solar radiation and heats seawater directly. Nonetheless, the SST variation induced by the chlorophyll does not always increase (Nakamoto et al., 2001; Manizza, 2005; Anderson et al., 2007; Lin et al., 2007, 2008; Anderson et al., 2009; Gnanadesikan and Anderson, 2009; Löptien et al., 2009; Jochum et al., 2010; Park et al., 2014). To better understand the CHL effects on the upper ocean, Ballabrera-Poy et al. (2007) performed a Taylor expansion of the equation for the absorbed radiation heat budget in the mixed layer; when considering only the first term, they pointed out that the sign of Qabs is determined by the relative amplitude of the direct term (variation in the transparency) and indirect term (variation in the MLD), respectively. By analyzing the heating terms associated with the MLD, it is feasible to isolate and quantitatively diagnose the direct OBH effects on marine physical fields.
Moreover, the ED is analyzed in this study to represent the bio-effects compared with the penetration depth (Hp; Zhang et al., 2011). The physical meaning of the ED is more apparent than the penetration depth (also called e-fold depth, a mathematically derived concept). Below the euphotic layer, there is little shortwave radiation, and phytoplankton is difficult to flourish. The relative positions of the euphotic layer and the mixed layer in the vertical direction are important factor affecting the variations in the related bio-heating terms and their effects on ocean thermodynamics and dynamics.
5 Conclusion
In this study, a two-way coupling between ocean physical-ecological models is constructed within the ROMS, providing a useful numerical modeling tool to represent chlorophyll-induced heating effects and the interactions between ocean physical and biogeochemistry processes in the tropical Indo-Pacific region at the basin scale. The comparison between the model output and observation shows that the model is capable of reproducing the spatial structure and temporal variations in ocean physical and ecological fields. For example, the simulated variations of SST and the MLD are consistent with observations. In addition, sea surface chlorophyll anomalies are out-of-phase with SST anomalies during the ENSO events, which reflects a coherent relationship between ecological and physical fields. These outcomes indicate that the model can well reproduce the spatial pattern of chlorophyll in the eastern Pacific.
Processes underlying the effects are analyzed. Three heating terms are calculated to quantitatively diagnose the direct heating effects induced by ocean biology. The results show that the mixed layer depth plays a dominant role in the allocation of solar radiation between the mixed layer and subsurface. In addition, the ED also has a modulation effect on penetrative solar radiation, especially in the central-western equatorial Pacific, where the interannual variability of the ED exhibits a comparable amplitude to that of the MLD. This modulation is asymmetric and more pronounced during El Niño events relative to La Niña events. As the chlorophyll decreases, the euphotic layer deepens and its maximum depth lies below the mixed layer. The shortwave radiation penetrating below the mixed layer increases significantly. In contrast, the structure and variation of are less affected by the ED, and are dominated by the MLD. These findings are consistent with those based on observational analyses (Zhang et al., 2019b).
There are obvious discrepancies between the simulated and observed chlorophyll fields in the tropical Pacific. For example, the simulated annual-mean chlorophyll is relatively higher than the observed in the eastern equatorial Pacific, which is due to the overestimation of upwelling and nutrients. This can also result from the simplicity of the components and marine food web in the ecological model used in this study. Since the ROMS also provides a variety of ecological modules, other more complex ecological submodels can be selected and tested to better represent CHL fields and explore its effects on the climate system in the tropical Pacific.
More numerical experiments based on this model are under way to better represent and understand how chlorophyll influences the physical environment, including the climate system over the tropical Pacific. For example, it has been planned to integrate this ROMS-based ocean model with a statistical atmospheric model to form a hybrid coupled model (HCM), which can achieve a multi-way coupling not only between its physical and ecological model components, but also between the atmosphere and ocean, representing interactive impacts of the marine ecological field on the physical field; such a constructed HCM can have a variety of applications. For instance, previous research suggested that the ocean-atmosphere interactions tend to increase the uncertainty in representing these bio-effects. So, the model can be used to examine the modulating impacts of chlorophyll interannual variability on ENSO in the tropical Pacific; it can be used to quantify how the ocean-atmosphere coupling intensity influences the chlorophyll-induced SST variation in the tropical Pacific, and so on. Additionally, the model covers both the Indian Ocean and the Pacific Ocean, and further research should be undertaken to find out the remote inter-basin effects from the Indian Ocean on conditions in the Pacific basin. Also, comparisons with other modeling results can be made with different model configurations (Zeng et al., 1991; Zhang and Endoh,1992; Timmerman and Jin, 2002; Lin et al., 2011).
Data availability statement
The raw data supporting the conclusions of this article will be made available by the authors, without undue reservation.
Author contributions
WZ: Formal analysis, Investigation, Methodology, Software, Validation, Visualization, Writing – original draft. CG: Funding acquisition, Methodology, Writing – review & editing. FT: Investigation, Methodology, Writing – review & editing. YY: Methodology, Writing – review & editing. HW: Funding acquisition, Supervision, Writing – review & editing. R-HZ: Conceptualization, Funding acquisition, Methodology, Supervision, Writing – review & editing.
Funding
The author(s) declare that financial support was received for the research, authorship, and/or publication of this article. This work is supported by the Strategic Priority Research Program of the Chinese Academy of Sciences (Grant No. XDB42000000), Laoshan Laboratory (No. LSKJ202202404), the National Natural Science Foundation of China (NSFC; Grant Nos. 42176032, 42030410), the Startup Foundation for Introducing Talent of NUIST, and Jiangsu Innovation Research Group (JSSCTD 202346).
Acknowledgments
The authors wish to thank the three reviewers for their comments that helped to improve the original manuscript.
Conflict of interest
The authors declare that the research was conducted in the absence of any commercial or financial relationships that could be construed as a potential conflict of interest.
Publisher’s note
All claims expressed in this article are solely those of the authors and do not necessarily represent those of their affiliated organizations, or those of the publisher, the editors and the reviewers. Any product that may be evaluated in this article, or claim that may be made by its manufacturer, is not guaranteed or endorsed by the publisher.
Supplementary material
The Supplementary Material for this article can be found online at: https://www.frontiersin.org/articles/10.3389/fmars.2024.1473208/full#supplementary-material
Supplementary Figure 1 | (A) Horizontal distributions of observed annual-mean MLD in the tropical Pacific Ocean averaged over the years 2001-2018; (B) Seasonal cycles along the equator (5°S–5°N) for observed MLD; (C) Longitude-time sections along the equator for observed interannual anomalies of MLD. The data are obtained from the Argo. The contour interval is 2 m in (A), 5 m in (B), and 2 m in (C).
Supplementary Figure 2 | (A) Longitude-time sections along the equator (5°S–5°N) for observed interannual anomalies of SST; (B) Longitude-time sections along the equator for observed interannual anomalies of surface chlorophyll concentrations. The observed SST data are from the OISST V2 data and the observed surface chlorophyll concentration data are from the SeaWiFS. The contour interval is 1 °C in (A) and 0.05 mg Chl m–3 in (B).
Supplementary Figure 3 | Longitude-time sections along the equator for simulated interannual (A) mixed layer depth and (B) euphotic depth. The contour interval is 5 m, and the green dots indicate that the depth of the euphotic layer is greater than that of the mixed layer.
Supplementary Figure 4 | Longitude-time sections along the equator for observed interannual anomalies of mixed layer depth in the Pacific Ocean. The data are obtained from the Argo. The contour interval is 2 m.
References
Anderson W. G., Gnanadesikan A., Hallberg R., Dunne J., Samuels B. L. (2007). Impact of ocean color on the maintenance of the Pacific Cold Tongue. Geophys. Res. Lett. 34, L11609. doi: 10.1029/2007GL030100
Anderson W. G., Gnanadesikan A., Wittenberg A. (2009). Regional impacts of ocean color on tropical Pacific variability. Ocean Sci. 5, 313–327. doi: 10.5194/os-5-313-2009
Ballabrera-Poy J., Murtugudde R., Zhang R.-H., Busalacchi A. J. (2007). Coupled ocean–atmosphere response to seasonal modulation of ocean color: impact on interannual climate simulations in the tropical Pacific. J. Clim. 20, 353–374. doi: 10.1175/JCLI3958.1
Bosc C., Delcroix T., Maes C. (2009). Barrier layer variability in the western Pacific warm pool from 2000 to 2007. J. Geophys. Res. 114, C06023. doi: 10.1029/2008JC005187
Byrne M. P., Pendergrass A. G., Rapp A. D., Wodzicki K. R. (2018). Response of the intertropical convergence zone to climate change: location, width, and strength. Curr. Clim. Change Rep. 4, 355–370. doi: 10.1007/s40641-018-0110-5
Chapman D. C. (1985). Numerical treatment of cross-shelf open boundaries in a barotropic coastal ocean model. J. Phys. Oceanogr. 15, 1060–1075. doi: 10.1175/1520-0485(1985)015<1060:NTOCSO>2.0.CO;2
de Boyer Montégut C. (2004). Mixed layer depth over the global ocean: An examination of profile data and a profile-based climatology. J. Geophys. Res. 109, C12003. doi: 10.1029/2004JC002378
Fairall C. W., Bradley E. F., Hare J. E., Grachev A. A., Edson J. B. (2003). Bulk parameterization of air–sea fluxes: updates and verification for the COARE algorithm. J. Clim. 16, 571–591. doi: 10.1175/1520-0442(2003)016<0571:BPOASF>2.0.CO;2
Fennel K., Wilkin J., Levin J., Moisan J., O’Reilly J., Haidvogel D. (2006). Nitrogen cycling in the Middle Atlantic Bight: Results from a three-dimensional model and implications for the North Atlantic nitrogen budget: Nitrogen cycling in the middle Atlantic. Glob. Biogeochem. Cycles 20, GB3007. doi: 10.1029/2005GB002456
Fiechter J., Moore A. M., Edwards C. A., Bruland K. W., Di Lorenzo E., Lewis C. V. W., et al. (2009). Modeling iron limitation of primary production in the coastal Gulf of Alaska. Deep Sea Res. Part II Top. Stud. Oceanogr. 56, 2503–2519. doi: 10.1016/j.dsr2.2009.02.010
Flather R. (1976). A tidal model of the north-west European continental shelf. MEM. SOC. ROYALE SCI. DE LIEGE, SER.6, 10, 1976 ((Seventh Liege Colloquium on Ocean Hydrodynamics and Continental Shelf Dynamics, Liege, Belgium: Ma), 141–164.
Gao C., Chen M., Zhou L., Feng L., Zhang R.-H. (2022). The 2020–2021 prolonged La Niña evolution in the tropical Pacific. Sci. China Earth Sci. 65, 2248–2266. doi: 10.1007/s11430-022-9985-4
Gao C., Zhang R.-H. (2023). A mechanism for the generation of a warm SST anomaly in the western equatorial Pacific: A pathway perspective. J. Geophy. Res. 128, e2023JC020119. doi: 10.1029/2023JC020119
Gao C., Zhang R.-H., Karnauskas K. B., Zhang L., Tian F. (2020). Separating freshwater flux effects on ENSO in a hybrid coupled model of the tropical Pacific. Clim. Dyn. 54, 4605–4626. doi: 10.1007/s00382-020-05245-y
Gera A., Mitra A. K., McCreary J. P., Hood R., Momin I. M. (2020). Impact of chlorophyll concentration on thermodynamics and dynamics in the tropical Indian ocean. Deep Sea Res. Part II Top. Stud. Oceanogr. 179, 104871. doi: 10.1016/j.dsr2.2020.104871
Gnanadesikan A., Anderson W. G. (2009). Ocean water clarity and the ocean general circulation in a coupled climate model. J. Phys. Oceanogr. 39, 314–332. doi: 10.1175/2008JPO3935.1
Gordon H. R., Morel A. Y. (1983). Remote Assessment of Ocean Color for Interpretation of Satellite Visible Imagery: A Review, Lecture Notes on Coastal and Estuarine Studies (Washington, D. C: American Geophysical Union). doi: 10.1029/LN004
Haidvogel D. B., Arango H., Budgell W. P., Cornuelle B. D., Curchitser E., Di Lorenzo E., et al. (2008). Ocean forecasting in terrain-following coordinates: Formulation and skill assessment of the Regional Ocean Modeling System. J. Comput. Phys. 227, 3595–3624. doi: 10.1016/j.jcp.2007.06.016
Hedström K. S. (2018). Technical Manual for a Coupled Sea-Ice/Ocean Circulation Model (Version 5) (Alaska OCS Region: US Dept. of the Interior, Bureau of Ocean Energy Management), 182 pp. OCS Study BOEM 2018-007.
Hersbach H., Bell B., Berrisford P., Hirahara S., Horányi A., Muñoz-Sabater J., et al. (2020). The ERA5 global reanalysis. Q. J. R. Meteorol. Soc 146, 1999–2049. doi: 10.1002/qj.3803
Jochum M., Yeager S., Lindsay K., Moore K., Murtugudde R. (2010). Quantification of the feedback between phytoplankton and ENSO in the community climate system model. J. Clim. 23, 2916–2925. doi: 10.1175/2010JCLI3254.1
Kang X., Zhang R.-H., Gao C., Zhu J. (2017). An improved ENSO simulation by representing chlorophyll-induced climate feedback in the NCAR Community Earth System Model. Sci. Rep. 7, 17123. doi: 10.1038/s41598-017-17390-2
Khanna D., Bhutiani R., Chandra K. S. (2009). Effect of the euphotic depth and mixing depth on phytoplanktonic growth mechanism. Int. J. Environ. Res. 3 (2), 223–228. doi: 10.22059/IJER.2010.49
Kirk J. T. (1994). Light and photosynthesis in aquatic ecosystems (Cambridge-New York-Melbourne: Cambridge University Press).
Latif M., Barnett T. P. (1995). Interactions of the tropical oceans. J. Clim. 8, 952–964. doi: 10.1175/1520-0442(1995)008<0952:IOTTO>2.0.CO;2
Lengaigne M., Menkes C., Aumont O., Gorgues T., Bopp L., André J.-M., et al. (2007). Influence of the oceanic biology on the tropical Pacific climate in a coupled general circulation model. Clim. Dyn. 28, 503–516. doi: 10.1007/s00382-006-0200-2
Lewis M. R., Carr M.-E., Feldman G. C., Esaias W., McClain C. R. (1990). Influence of penetrating solar radiation on the heat budget of the equatorial Pacific Ocean. Nature 347, 543–545. doi: 10.1038/347543a0
Lim H. G., Park J. Y., Kug J. S. (2018). Impact of chlorophyll bias on the tropical Pacific mean climate in an earth system model. Clim. Dyn. 51, 2681–2694. doi: 10.1007/s00382-017-4036-8
Lin P., Liu H., Yu Y., Zhang X. (2011). Response of sea surface temperature to chlorophyll-a concentration in the tropical Pacific: Annual mean, seasonal cycle, and interannual variability. Adv. Atmos. Sci. 28, 492–510. doi: 10.1007/s00376-010-0015-2
Lin P., Liu H., Zhang X. (2007). Sensitivity of the upper ocean temperature and circulation in the equatorial Pacific to solar radiation penetration due to phytoplankton. Adv. Atmos. Sci. 24, 765–780. doi: 10.1007/s00376-007-0765-7
Lin P., Liu H., Zhang X. (2008). Effect of chlorophyll-a spatial distribution on upper ocean temperature in the central and eastern equatorial Pacific. Adv. Atmos. Sci. 25, 585–596. doi: 10.1007/s00376-008-0585-4
Liu T., Lee Z., Shang S., Xiu P., Chai F., Jiang M. (2020). Impact of transmission scheme of visible solar radiation on temperature and mixing in the upper water column with inputs for transmission derived from ocean color remote sensing. J. Geophys. Res. Oceans 125, 0–3. doi: 10.1029/2020JC016080
Löptien U., Eden C., Timmermann A., Dietze H. (2009). Effects of biologically induced differential heating in an eddy-permitting coupled ocean-ecosystem model. J. Geophys. Res. 114, C06011. doi: 10.1029/2008JC004936
Manizza M. (2005). Bio-optical feedbacks among phytoplankton, upper ocean physics and sea-ice in a global model. Geophys. Res. Lett. 32, L05603. doi: 10.1029/2004GL020778
Mann K. H., Lazier J. R. N. (2006). Dynamics of marine ecosystems: biological-physical interactions in the oceans. 3rd ed (Malden, MA: Blackwell Pub).
Marchesiello P., McWilliams J. C., Shchepetkin A. (2001). Open boundary conditions for long-term integration of regional oceanic models. Ocean Model. 3, 1–20. doi: 10.1016/S1463-5003(00)00013-5
Marzeion B., Timmermann A., Murtugudde R., Jin F.-F. (2005). Biophysical feedbacks in the tropical Pacific. J. Clim. 18, 58–70. doi: 10.1175/JCLI3261.1
Mellor G. L., Yamada T. (1982). Development of a turbulence closure model for geophysical fluid problems. Rev. Geophys. 20, 851. doi: 10.1029/RG020i004p00851
Mobley C. D. (2001). Radiative transfer in the ocean. Encyclopedia of ocean sciences 4, 2321–2330. doi: 10.1006/rwos.2001.0469
Murtugudde R., Beauchamp J., McClain C. R., Lewis M., Busalacchi A. J. (2002). Effects of penetrative radiation on the upper tropical ocean circulation. J. Clim. 15, 470–486. doi: 10.1175/1520-0442(2002)015<0470:EOPROT>2.0.CO;2
Nakamoto S., Kumar S. P., Oberhuber J. M., Ishizaka J., Muneyama K., Frouin R., et al. (2001). Response of the equatorial Pacific to chlorophyll pigment in a mixed layer isopycnal ocean general circulation model. Geophys. Res. Lett. 28, 2021–2024. doi: 10.1029/2000GL012494
Park J.-Y., Kug J.-S., Seo H., Bader J. (2014). Impact of bio-physical feedbacks on the tropical climate in coupled and uncoupled GCMs. Clim. Dyn. 43, 1811–1827. doi: 10.1007/s00382-013-2009-0
Patara L., Vichi M., Masina S., Fogli P. G., Manzini E. (2012). Global response to solar radiation absorbed by phytoplankton in a coupled climate model. Clim. Dyn. 39, 1951–1968. doi: 10.1007/s00382-012-1300-9
Paulson C. A., Simpson J. J. (1977). Irradiance measurements in the upper ocean. J. Phys. Oceanogr. 7, 952–956. doi: 10.1175/1520-0485(1977)007<0952:IMITUO>2.0.CO;2
Penven P., Marchesiello P., Debreu L., Lefèvre J. (2008). Software tools for pre- and post-processing of oceanic regional simulations. Environ. Model. Software 23, 660–662. doi: 10.1016/j.envsoft.2007.07.004
Philander S. G. H. (1983). El Niño southern oscillation phenomena. Nature 302, 295–301. doi: 10.1038/302295a0
Radenac M.-H., Léger F., Singh A., Delcroix T. (2012). Sea surface chlorophyll signature in the tropical Pacific during eastern and central Pacific ENSO events. J. Geophys. Res. Oceans 117, C04007. doi: 10.1029/2011JC007841
Rast M., Bezy J. L., Bruzzi S. (1999). The ESA Medium Resolution Imaging Spectrometer MERIS a review of the instrument and its mission. Int. J. Remote Sens. 20, 1681–1702. doi: 10.1080/014311699212416
Ren H.-L., Jin F.-F. (2013). Recharge oscillator mechanisms in two types of ENSO. J. Clim. 26, 6506–6523. doi: 10.1175/JCLI-D-12-00601.1
Sathyendranath S., Gouveia A. D., Shetye S. R., Ravindran P., Platt T. (1991). Biological control of surface temperature in the Arabian Sea. Nature 349, 54–56. doi: 10.1038/349054a0
Shchepetkin A. F., McWilliams J. C. (2005). The regional oceanic modeling system (ROMS): a split-explicit, free-surface, topography-following-coordinate oceanic model. Ocean Model. 9, 347–404. doi: 10.1016/j.ocemod.2004.08.002
Shell K. M., Frouin R., Nakamoto S., Somerville R. C. J. J. (2003). Atmospheric response to solar radiation absorbed by phytoplankton. J. Geophys. Res. 108, 1–8. doi: 10.1029/2003JD003440
Shi Q., Zhang R.-H., Tian F. (2023). Impact of the deep chlorophyll maximum in the equatorial Pacific as revealed in a coupled OGCM-ocean biology model. J. Geophy. Res. 128, e2022JC018631. doi: 10.1029/2022JC018631
Song Y., Haidvogel D. (1994). A semi-implicit ocean circulation model using a generalized topography-following coordinate system. J. Comput. Phys. 115, 228–244. doi: 10.1006/jcph.1994.1189
Song X., Zhang G. J. (2009). Convection parameterization, tropical Pacific double ITCZ, and upper-ocean biases in the NCAR CCSM3. Part I: climatology and atmospheric feedback. J. Clim. 22, 4299–4315. doi: 10.1175/2009JCLI2642.1
Sprintall J., Gordon A. L., Koch-Larrouy A., Lee T., Potemra J. T., Pujiana K., et al. (2014). The Indonesian seas and their role in the coupled ocean–climate system. Nat. Geosci. 7, 487–492. doi: 10.1038/ngeo2188
Sprintall J., Tomczak M. (1992). Evidence of the barrier layer in the surface layer of the tropics. J. Geophys. Res. 97, 7305. doi: 10.1029/92JC00407
Sweeney C., Gnanadesikan A., Griffies S. M., Harrison M. J., Rosati A. J., Samuels B. L. (2005). Impacts of shortwave penetration depth on large-scale ocean circulation and heat transport. J. Phys. Oceanogr. 35, 1103–1119. doi: 10.1175/JPO2740.1
Tian F., Zhang R.-H., Wang X. (2021). Coupling ocean–atmosphere intensity determines ocean chlorophyll-induced SST change in the tropical Pacific. Clim. Dyn. 56, 3775–3795. doi: 10.1007/s00382-021-05666-3
Timmermann A., Jin F.-F. (2002). Phytoplankton influences on tropical climate. Geophys. Res. Lett. 29, 19-1-19–4. doi: 10.1029/2002GL015434
Valiela I. (2015). Marine Ecological Processes (New York, NY: Springer New York). doi: 10.1007/978-0-387-79070-1
Wang X., Le Borgne R., Murtugudde R., Busalacchi A. J., Behrenfeld M. (2009). Spatial and temporal variability of the phytoplankton carbon to chlorophyll ratio in the equatorial Pacific: A basin-scale modeling study. J. Geophys. Res. 114, C07008. doi: 10.1029/2008JC004942
Wetzel P., Maier-Reimer E., Botzet M., Jungclaus J., Keenlyside N., Latif M. (2006). Effects of ocean biology on the penetrative radiation in a coupled climate model. J. Clim. 19, 3973–3987. doi: 10.1175/JCLI3828.1
Zeng Q.-C., Zhang X.-H., Zhang R.-H. (1991). A design of an oceanic GCM without the rigid lid approximation and its application to the numerical simulation of the circulation of the Pacific Ocean. J. Mar. Syst. 1, 271–292. doi: 10.1016/0924-7963(91)90033-Q
Zhang R.-H. (2015a). Structure and effect of ocean biology-induced heating (OBH) in the tropical Pacific, diagnosed from a hybrid coupled model simulation. Clim. Dyn. 44, 695–715. doi: 10.1007/s00382-014-2231-4
Zhang R.-H. (2015b). A hybrid coupled model for the Pacific ocean-atmosphere system. Part I: Description and basic performance. Adv. Atmos. Sci. 32, 301–318. doi: 10.1007/s00376-014-3266-5
Zhang R.-H., Busalacchi A. J., Wang X., Ballabrera-Poy J., Murtugudde R. G., Hackert E. C., et al. (2009). Role of ocean biology-induced climate feedback in the modulation of El Niño-Southern Oscillation. Geophys. Res. Lett. 36, L03608. doi: 10.1029/2008GL036568
Zhang R.-H., Chen D., Wang G. (2011). Using satellite ocean color data to derive an empirical model for the penetration depth of solar radiation (Hp) in the tropical Pacific Ocean. J. Atmos. Ocean. Technol. 28, 944–965. doi: 10.1175/2011JTECHO797.1
Zhang R.-H., Endoh M. (1992). A free surface general circulation model for the tropical Pacific Ocean. J. Geophys. Res. Oceans 97, 11237–11255. doi: 10.1029/92JC00911
Zhang R.-H., Gao C. (2016). The IOCAS intermediate coupled model (IOCAS ICM) and its real-time predictions of the 2015-16 El Niño event. Sci. Bull. 66, 1061–1070. doi: 10.1007/s11434-016-1064-4
Zhang R.-H., Gao C., Feng L. (2022). Recent ENSO evolution and its real-time prediction challenges. Natl. Sci. Rev. 9, nwac052. doi: 10.1093/nsr/nwac052
Zhang R.-H., Tian F., Busalacchi A. J., Wang X. (2019a). Freshwater flux and ocean chlorophyll produce nonlinear feedbacks in the tropical Pacific. J. Clim. 32, 2037–2055. doi: 10.1175/JCLI-D-18-0430.1
Zhang R.-H., Tian F., Shi Q., Wang X., Wu T. (2024). Counteracting effects on ENSO induced by ocean chlorophyll interannual variability and tropical instability wave-scale perturbations in the tropical Pacific. Sci. China Earth Sci. 67, 387–404. doi: 10.1007/s11430-023-1217-8
Zhang R.-H., Tian F., Wang X. (2018). A new hybrid coupled model of atmosphere, ocean physics, and ocean biogeochemistry to represent biogeophysical feedback effects in the tropical Pacific. J. Adv. Model. Earth Syst. 10, 1901–1923. doi: 10.1029/2017MS001250
Zhang R.-H., Tian F., Zhi H., Kang X. (2019b). Observed structural relationships between ocean chlorophyll variability and its heating effects on the ENSO. Clim. Dyn. 53, 5165–5186. doi: 10.1007/s00382-019-04844-8
Keywords: ocean physical-ecological model, shortwave radiation penetration, ocean biology-induced heating, two-way coupling, Regional Ocean Modeling System (ROMS)
Citation: Zhang W, Gao C, Tian F, Yu Y, Wang H and Zhang R-H (2024) Representing ocean biology-induced heating effects in ROMS-based simulations for the Indo-Pacific Ocean. Front. Mar. Sci. 11:1473208. doi: 10.3389/fmars.2024.1473208
Received: 30 July 2024; Accepted: 14 October 2024;
Published: 07 November 2024.
Edited by:
Kyung-Ae Park, Seoul National University, Republic of KoreaReviewed by:
Hailun He, Ministry of Natural Resources, ChinaTien Anh Tran, Seoul National University, Republic of Korea
Xianqing Lv, Ocean University of China, China
Copyright © 2024 Zhang, Gao, Tian, Yu, Wang and Zhang. This is an open-access article distributed under the terms of the Creative Commons Attribution License (CC BY). The use, distribution or reproduction in other forums is permitted, provided the original author(s) and the copyright owner(s) are credited and that the original publication in this journal is cited, in accordance with accepted academic practice. No use, distribution or reproduction is permitted which does not comply with these terms.
*Correspondence: Chuan Gao, Z2FvY2h1YW5AcWRpby5hYy5jbg==; Rong-Hua Zhang, cnpoYW5nQG51aXN0LmVkdS5jbg==
 Wenzhe Zhang
 Chuan Gao
 Feng Tian
 Yang Yu
 Hongna Wang1,3
 Rong-Hua Zhang