- Department of Ocean Engineering and Marine Sciences, Florida Institute of Technology, Melbourne, FL, United States
Biofouling is a major concern for anthropogenic structures in terms of fuel costs, maintenance and environmental concerns with greenhouse gas emissions and transport of nonindigenous species. Antifouling coatings do not effectively protect many structures and niche areas. Encapsulation has been introduced as a potential long-lasting solution to prevent macrofouling. This study aims to determine the applicability of encapsulation for complex structures that cannot be wrapped with a tight-fitting bag. An experiment was designed to test the impact of different volumes and sizes of bags on the efficacy and life span of protection. Encapsulation within one and two-foot-diameter bags prevented macrofouling on inert PVC and bronze surfaces for the entire 12-month experiment. Four-foot diameter bags prevented macrofouling on inert PVC surfaces for 8 months and bronze surfaces for 9 months. Regardless of bag size, a decrease in dissolved oxygen was observed within all bags compared to open water readings, which may play a role in decreased settlement on encapsulated surfaces. This method has proven effective for extended periods despite large enclosed volumes of water.
1 Introduction
All surfaces in aquatic environments are impacted by biofouling, which begins accumulating immediately when a surface is introduced into the water (Dafforn et al., 2011). The majority of fouling occurs when a surface is idle, especially in port or nearshore waters (Floerl and Inglis, 2003; Davidson et al., 2020; Floerl et al., 2021; Hopkins et al., 2021; Luoma et al., 2021). Microfouling consists of conditioning films (adsorbed chemicals), biofilms or “slime” composed of bacteria, fungi, diatoms and other microalgae. Macrofouling includes barnacles, tube worms, oysters, tunicates, and more (Vuong et al., 2023). These different types of fouling occur on differing time scales and interact with surfaces in various ways, making them more or less attractive to subsequent fouling (Weber and Esmaeili, 2023).
Maintaining surfaces free of fouling is critical for many industries; however, ships have received the most attention because of the scale of the problem. The calculated wetted surface area globally for vessels over 100 gross tons between 1999 and 2013 was 571 square kilometers, and for those entering the US between 2011 and 2014, it was 510 square kilometers annually (Miller et al., 2018; Weber and Esmaeili, 2023). Globally, shipping produces about 3% of anthropogenic emissions, which increased slightly from 2012 to 2018 (Balcombe et al., 2019; IMO, 2021). Despite this increase, the overall efficiency has improved (Balcombe et al., 2019; IMO, 2021; Weber and Esmaeili, 2023). Biofouling increases ships’ drag, fuel costs, greenhouse gas (GHG) emissions, and maintenance costs associated with engine wear and tear. It also increases the risk of transporting potentially invasive nonindigenous species (NIS) (Davidson et al., 2016; Balcombe et al., 2019; Luoma et al., 2021; Wu et al., 2022; Weber and Esmaeili, 2023). Additionally, fouling can increase corrosion, an issue affecting more than just ships (Wu et al., 2022; Davidson et al., 2023).
Niche areas may be defined as non-hull surfaces of a ship’s wetted surface and include rudders, propellers, intakes, sea chests, internal piping, sacrificial anodes, dock block areas and others that are not traditionally well protected by standard fouling prevention solutions (Davidson et al., 2016; Luoma et al., 2021). These areas may comprise up to 20% of a vessel’s total wetted surface area and have at least twice the biofouling accumulation of the rest of the hull (Davidson et al., 2016; Luoma et al., 2021). Propellers are a particular case in that they are not well protected by traditional antifouling coatings and are potentially significant contributors to drag and fuel costs (Davidson et al., 2016; Farkas et al., 2021). In addition to propellers, internal seawater systems (ISS) are another niche that is difficult to protect and prone to accumulation of high levels of fouling (Davidson et al., 2023). Impacts from fouling in niche areas include restricted flow, corrosion, loss of critical functions like heat exchange and increased maintenance. These are also areas at high risk for the transport of NIS (Davidson et al., 2023). The costs associated with necessary responses to fouled ISS can be substantial, greater than US$450,000 per vessel per month (Davidson et al., 2023).
Biofouling also impacts non-ship installations. Piping for power plants and other industries have been shown to have a 20% increase in the cost of pumping after one year and over 40% after two years in a heavily impacted system (de Souza et al., 2023). Additionally, biofouling is the primary factor limiting long-term monitoring studies using optical instruments. A thin biofilm on the sensor face can impact collected data quality (Matos et al., 2023). In a high fouling environment, macrofouling can begin accumulating on sensor faces within days, and some fouling can damage the surface coating on the sensors (pers obs). Cleaning the sensors to remove fouling can lead to damage and impact readings (Matos et al., 2023). Fouling on static structures can lead to corrosion and increased maintenance costs (Weber and Esmaeili, 2023).
The global antifouling market is estimated at US$5 billion annually and is expected to continue to grow, increasing the demand for novel antifouling solutions (Davidson et al., 2016). Historically, several methods of biofouling control have been commonly utilized, including inert, antifouling and fouling release coatings (Dafforn et al., 2011; Lejars et al., 2012). Fouling control coatings can fall short due to mismatches between paint type and duty cycle, presence of biocide tolerant organisms, improperly applied, old or damaged paint, and many other factors (Davidson et al., 2009; Dafforn et al., 2011; Sylvester et al., 2011; Davidson et al., 2016). Because these historically utilized methods of biofouling control are inadequate in ports where there are concentrations of sensitive anthropogenic structures like ships, pilings, seawalls, instruments and more, the development of novel antifouling methods is of critical importance not only to the shipping industry but to anyone wishing to protect submerged surfaces.
Ralston and Pringle (2023) introduced a novel antifouling method where the surface to be protected is enclosed or encapsulated in a wrap or bag while static. In this experiment, sleeves prevented macrofouling for more than 12 months in a location known for rapid and diverse fouling accumulation, even on biocidal surfaces (Ralston et al., 2022; Ralston and Pringle, 2023). Most antifouling coatings have higher biocide output while voyaging and are least vulnerable to fouling, creating a mismatch with higher fouling pressure in port (Balcombe et al., 2019).
Encapsulation may not be able to cover complex structures like boat hulls or instruments closely. In many cases, there may need to be a larger volume enclosed by the bag to encapsulate the entire surface. This experiment aimed to determine the impact of encapsulating larger volumes and the proximity of the fabric to the protected surfaces on the efficacy of the antifouling enclosures.
2 Method
2.1 Sample preparation
To maintain a consistent set-off distance and volume, discs were fabricated out of Expanded Polyvinyl Chloride (PVC) sheet (Figure 1). The discs measured 30.5 (1’), 46 (Open), 61 (2’) or 122 (4’) cm and were fabricated in triplicate for replication. Cylindrical bags with one closed end were made to fit the 30.5, 61 and 122 cm discs. All bags had a height of 91.5 cm and were made of the coated spun material introduced in Ralston and Pringle (2023). The bags had different set-off distances to the panels and enclosed volumes (Table 1). The distance to the panels ranged from 10 cm to 56 cm, and the volume ranged from approximately 67,000 cm3 to 1,067,000 cm3. The 46 cm discs held control panels and did not have bags attached. Discs with bags were modified to have a standpipe made of PVC with a 15 cm diameter. The standpipe was closed with a threaded cap and handle, allowing access to the settlement panels and OnSet HOBO dissolved oxygen (DO) gauges during monthly assessments without disturbing the bags by opening or removing them from the water. HOBO DO gauges were set to take readings every 15 minutes.
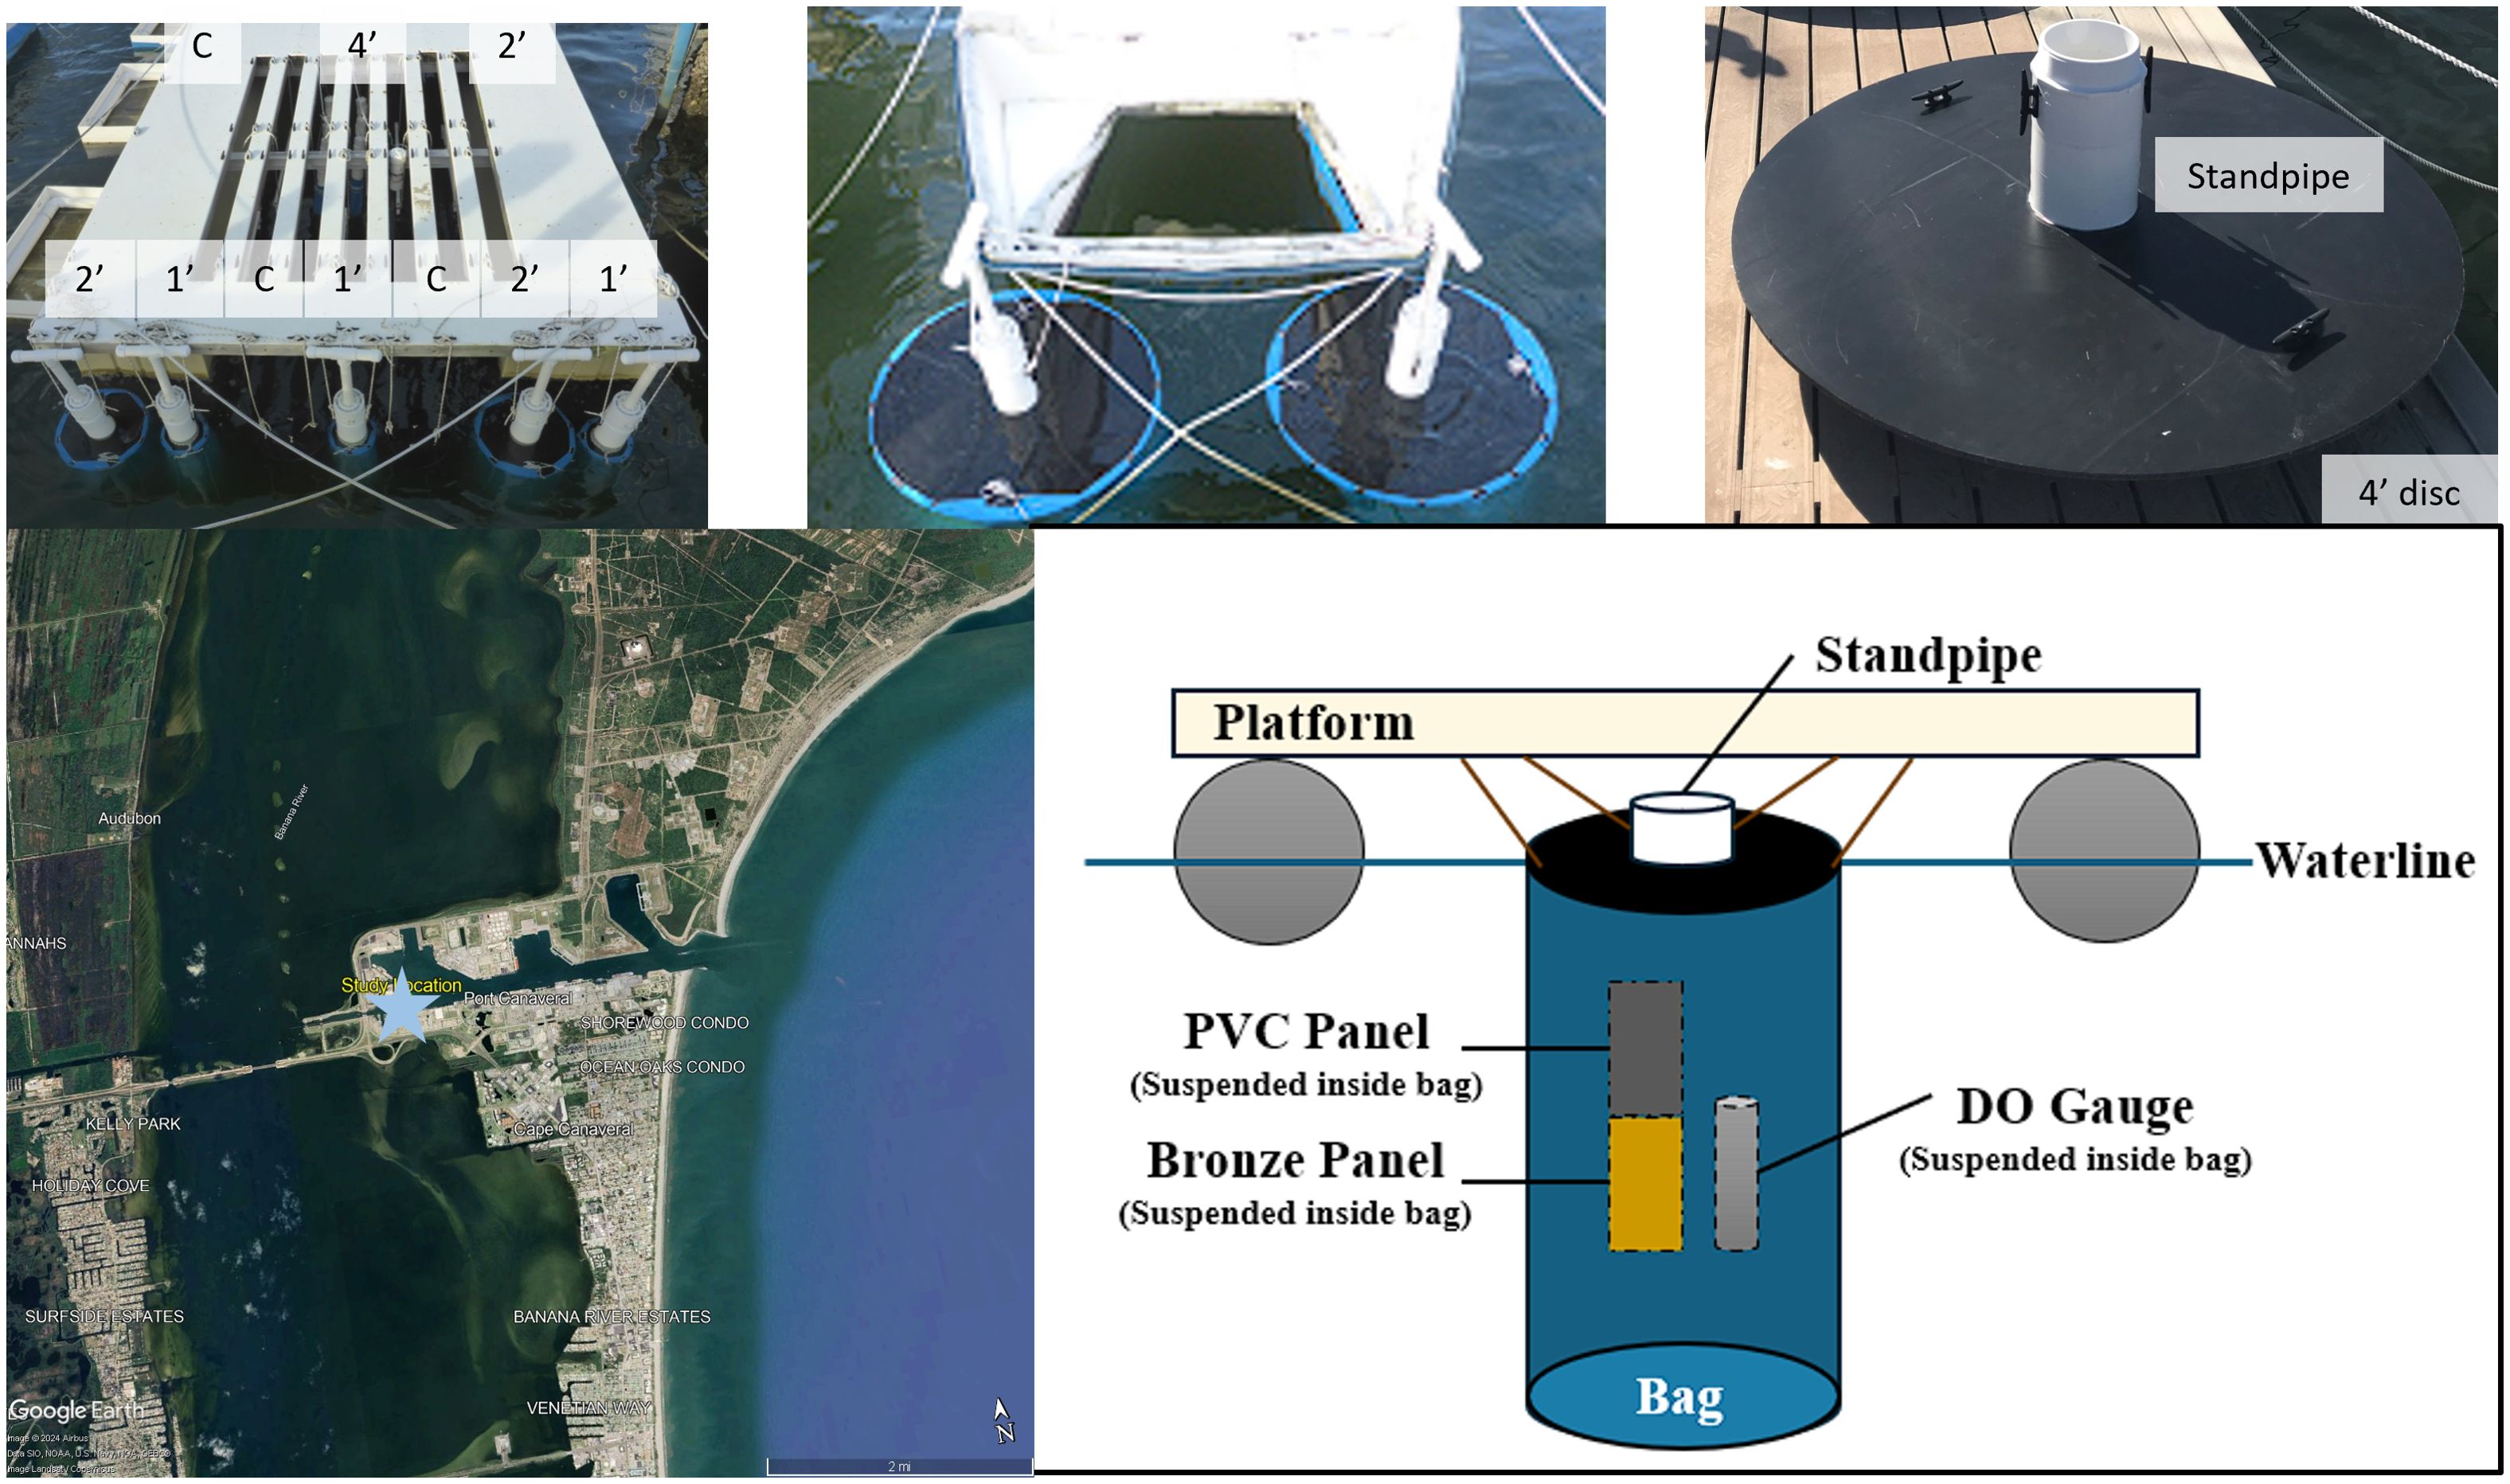
Figure 1. Image of the field site with experiment installed, a close up of a 4’ disc with standpipe before bag was installed, a map of the study area, denoted by a blue star, and a diagram of the experimental set up.
Two settlement panels were installed under each disc centered at a depth of 0.5 m. One panel was a propeller mimic consisting of propeller bronze with a sacrificial zinc anode (Ralston and Pringle, 2023). The second panel, which consisted of PVC, was attached to the bronze panel using the stainless steel bolt. All panels measured 10x20 cm. The PVC panels were washed and sanded before use to remove mold release or other contaminants and enhance attractiveness to settling organisms. A line suspended the panels and a DO gauge from the standpipe lid. Panels for the open control were suspended by line directly from an eyebolt under the 46 cm discs. One control had a DO gauge for comparison. This gauge was switched out weekly for cleaning because fouling on the face impacted data quality.
2.2 Installation
Bags were installed in the water to replicate realistic conditions. Bags had a drawstring, which was tightened around the discs, which had a groove for that purpose. Two cleats were installed on top of the discs to hold the bag’s drawstring and to prevent the bag from slipping. Discs were randomized and suspended from the Florida Institute of Technology static immersion test site at Port Canaveral, FL (Figure 1). Samples were only hung from the ends of the test platforms to ensure similar conditions. Once bags and discs were installed on August 31, 2018, the panels and DO gauges were inserted into each bag through the standpipe and the lid was screwed on.
2.3 Sampling
Every month, the lid of the standpipe was removed, pulling the panels and DO gauges out of the water. Panels were photographed and visually assessed according to ASTM D6990. Pecent cover of different macrofouling taxa was visually estimated in the field. The taxa included hydroids, encrusting and arborescent bryozoans, barnacles, tube worms, sponges, oysters, tunicates and sea anemones. Any space not occupied by macrofouling was quantified for percent cover of biofilms. The DO gauges were downloaded at this time. Additionally, water quality spot readings were taken by lowering Yellow Springs Instruments (YSI) ProODO, Pro10 and Pro30 probes to measure DO, pH, temperature and salinity, respectively. Probes were lowered into the bags through the standpipe to a depth of 0.5 m.
2.4 Statistics
Water quality from the monthly readings were compared among treatments using 1-way ANOVA (SigmaPlot11). Assumptions for normality and equal distribution were met. The p-value was set at 0.05 for significance. Post hoc testing determined where significant differences lay. Data from the visual assessments were not normally distributed because of a high number of 0 values for percent cover. ANOVA could not be used effectively, so a Principal Components Analysis (PCA, Primer7) was used to compare fouling cover for the fouling communities among treatments.
3 Results
The bags were effective at preventing macrofouling for eight months across all bags (Figure 2). At the eight-month assessment, the PVC in the 4’ bags began to accumulate a very light cover (<3%) of hydroids and tube worms. The hydroids were no longer present at the eleven-month immersion assessment. One replicate of the bronze in the 4’ bags began accumulating tube worm fouling at nine months of immersion. At the end of the experiment, after twelve months of immersion, only the settlement plates in the 4’ bags had accumulated macrofouling consisting of a very light cover of tube worms. The total cover of macrofouling in the bags never reached 5% cover. The settlement plates in the 1’ and 2’ bags never accumulated macrofouling through twelve months of immersion.
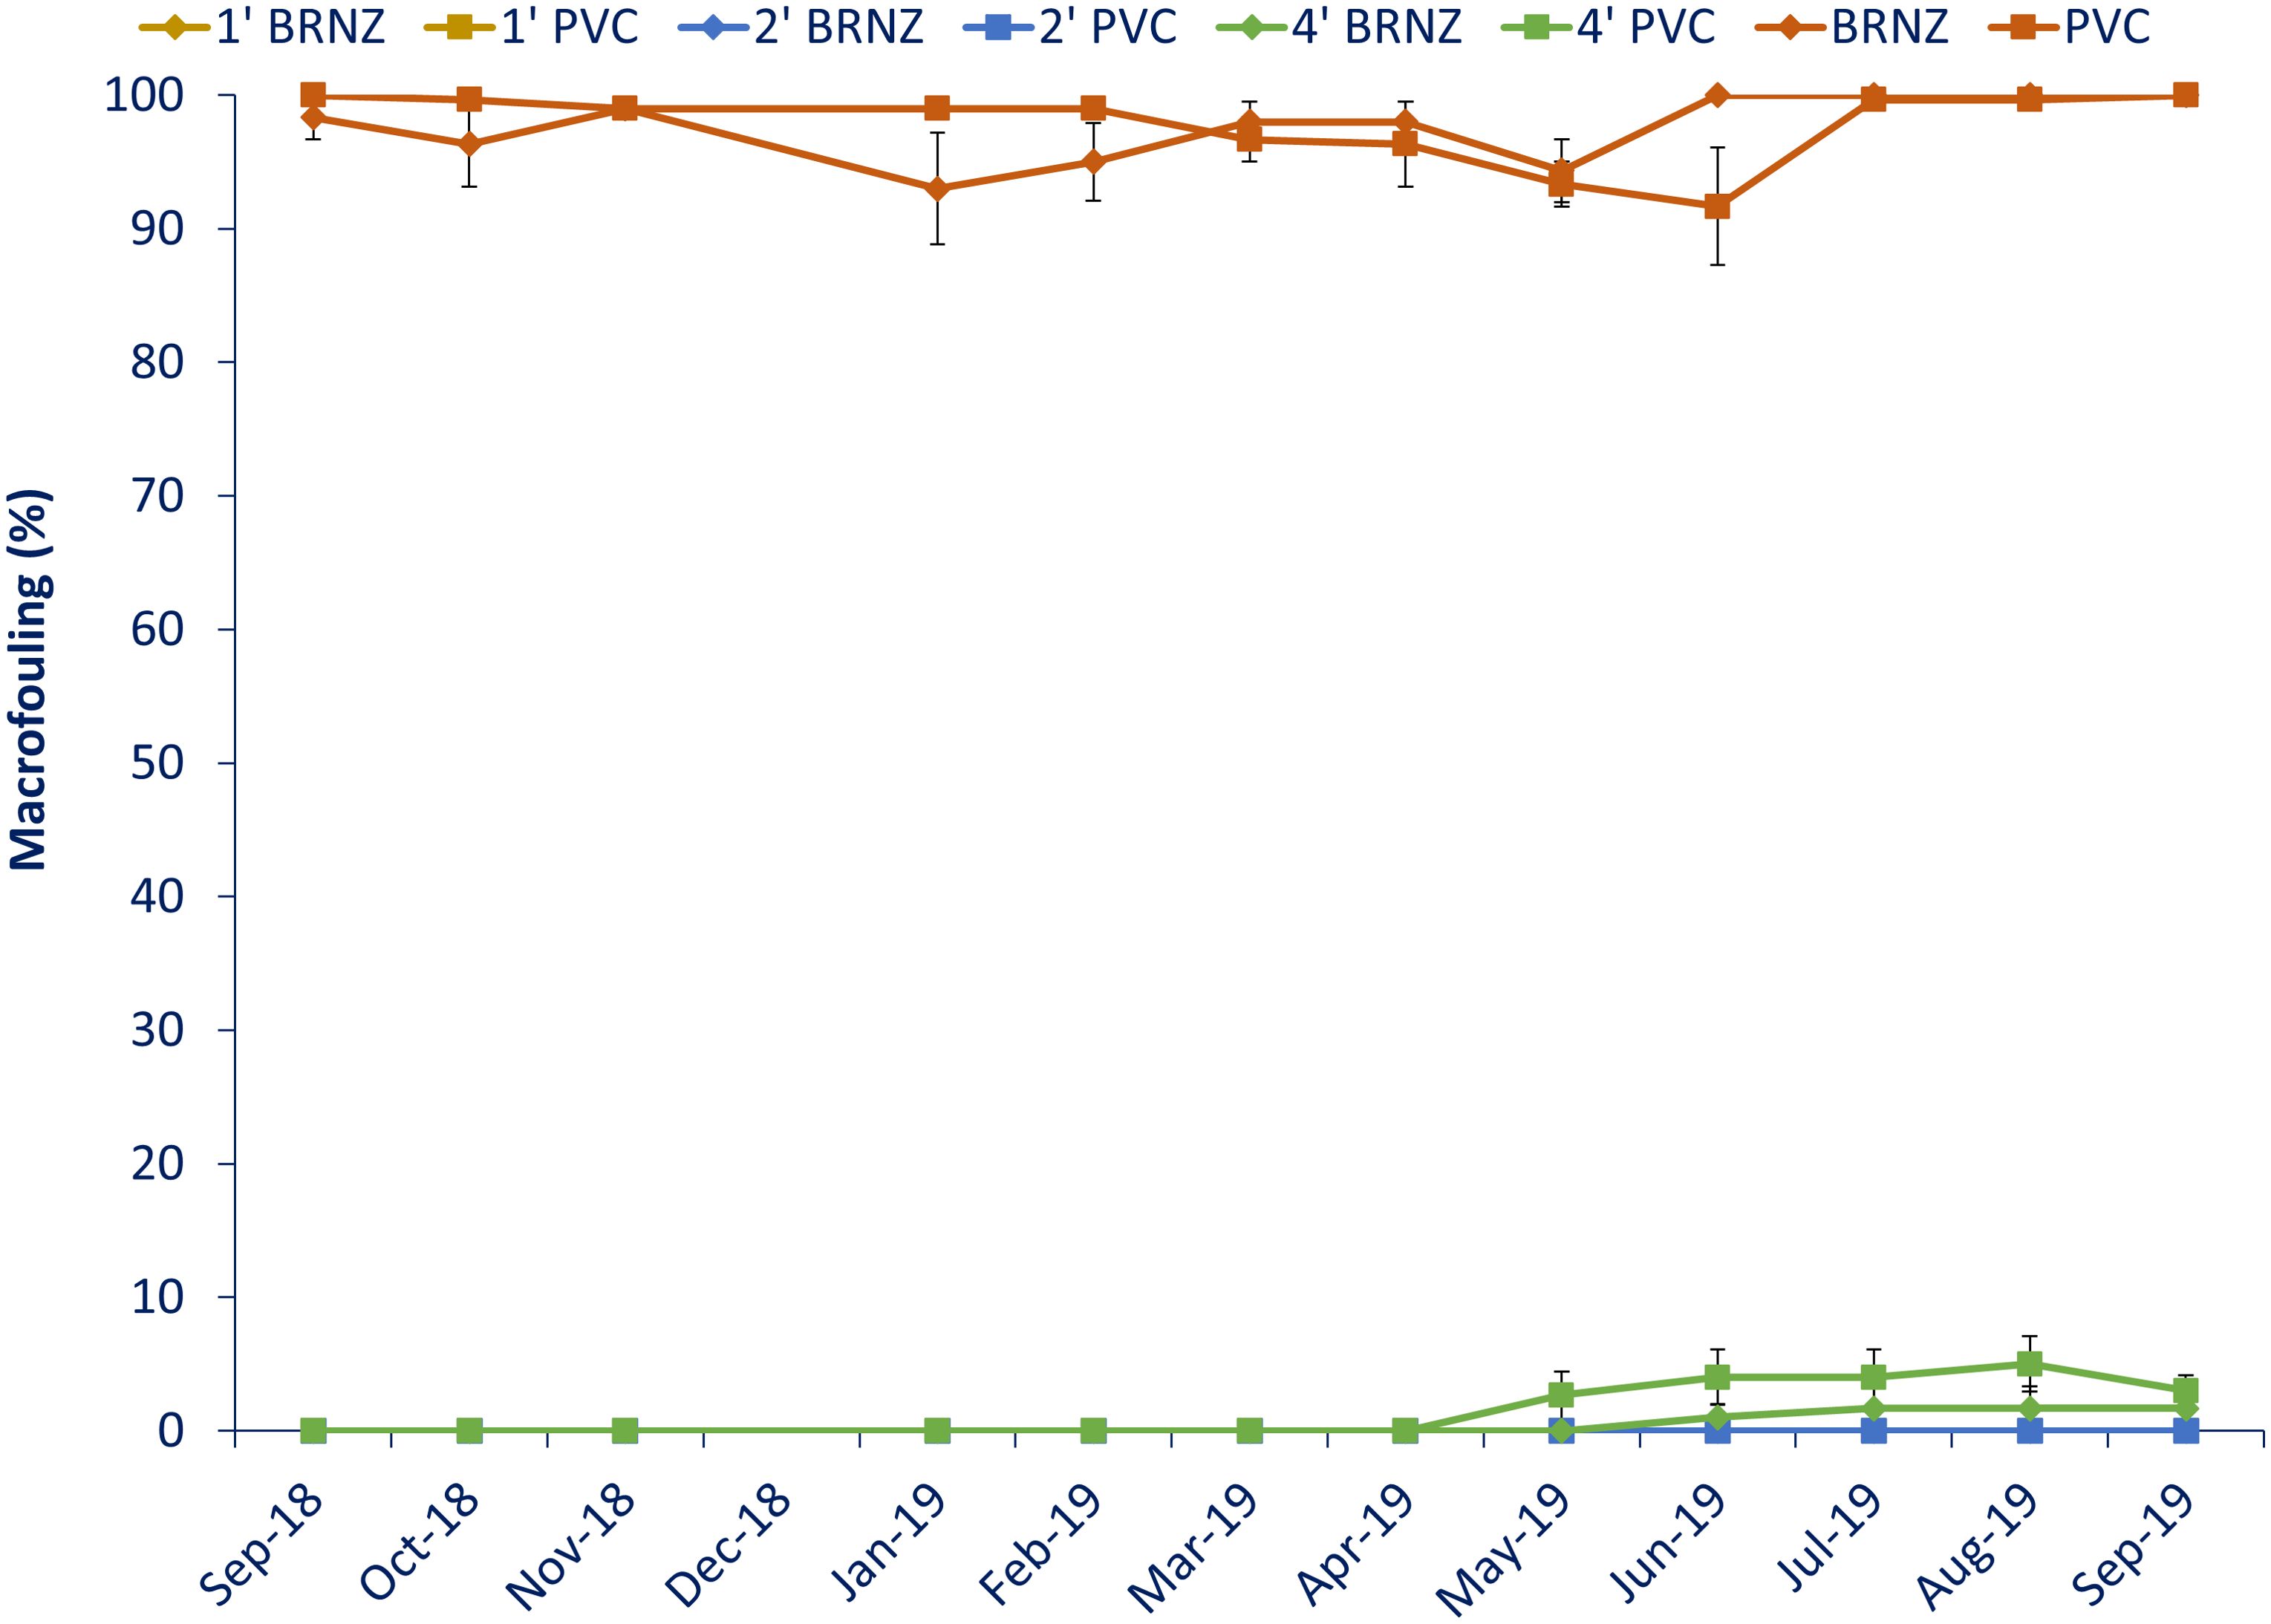
Figure 2. Macrofouling cover on the different panels. Samples are averaged over three replicates and error bars represent one standard error.
In contrast, control plates were heavily fouled after one month of immersion, with macrofouling cover at nearly 100% over the entire experiment. The fouling was significantly different among the bagged samples and the open controls. Fouling changed seasonally and consisted of hydroids, encrusting and arborescent bryozoans, barnacles, tube worms, oysters, sponges, tunicates and sea anemones (Figure 3). The percent cover of biofilm on the samples in the bags never exceeded 50% cover. A PCA grouped panels into two loose groups, one consisting of all of the controls and the other comprised of the bagged samples (Figure 4). Differences were primarily attributable to differences in barnacle cover (82.7%), biofilm (9.4%) and encrusting bryozoan (4.1%).
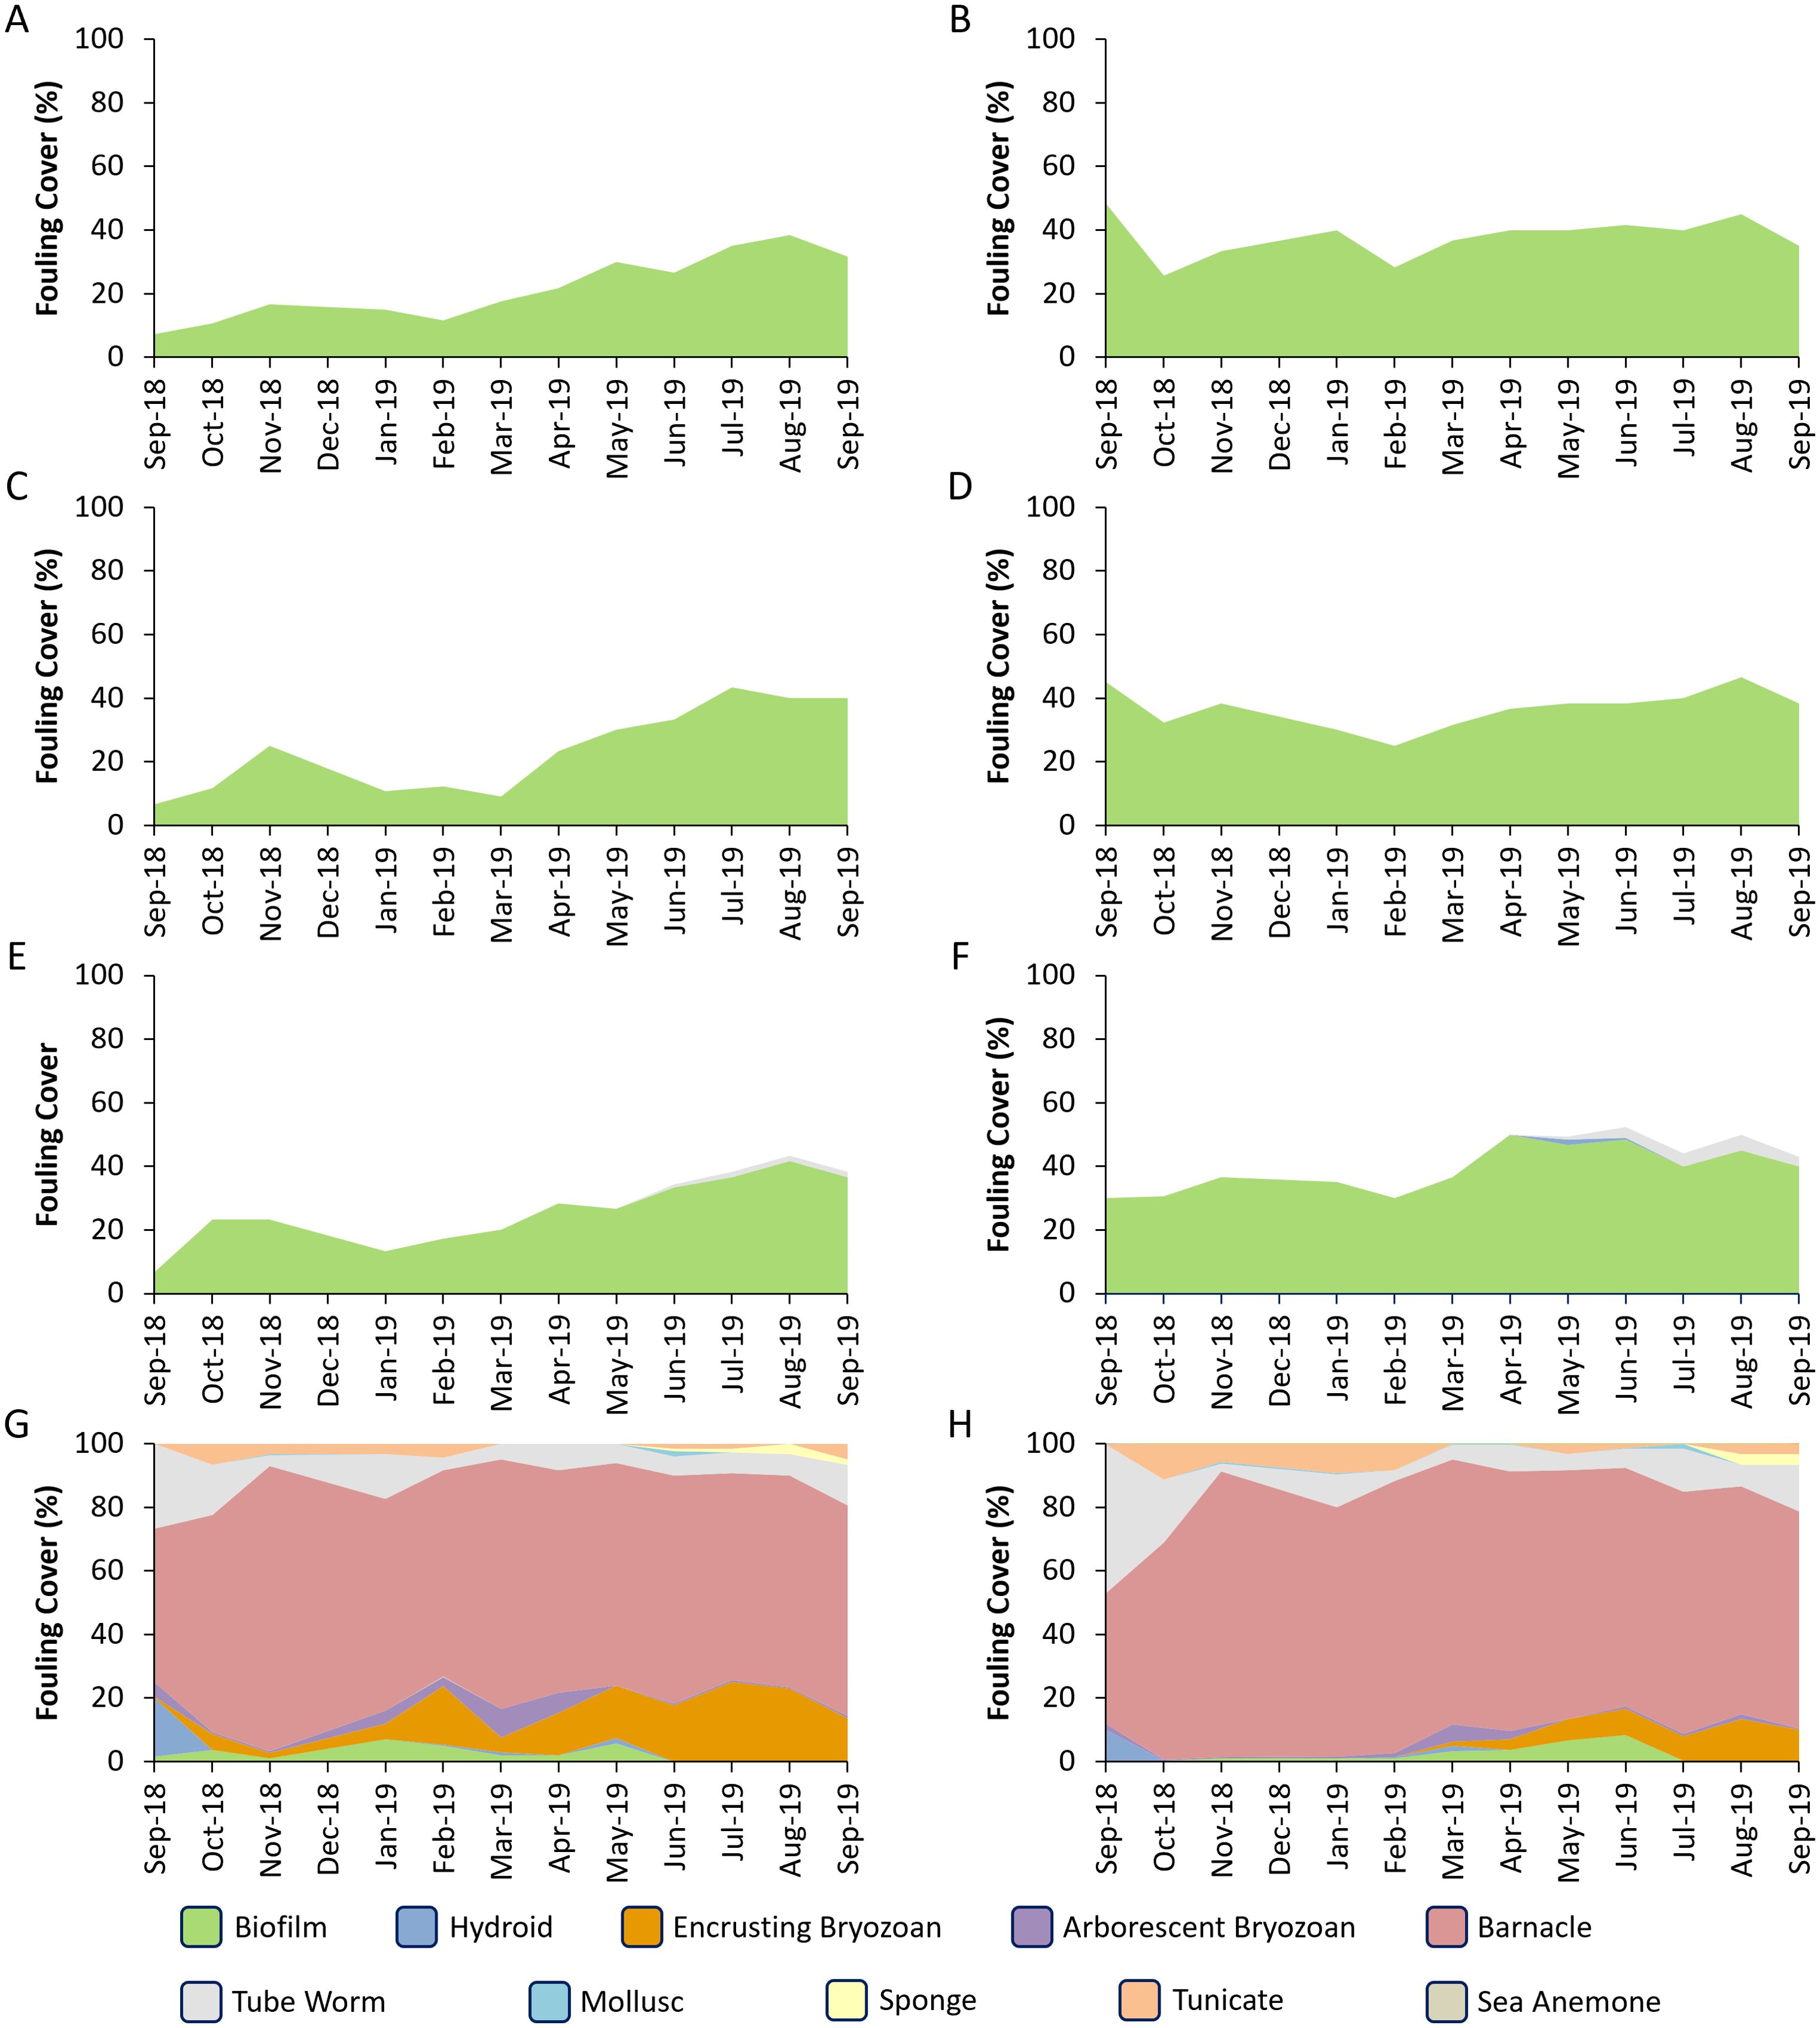
Figure 3. Fouling cover on the different treatments. The first column (A, C, E, G) indicates the fouling on the bronze panels. The second column shows fouling on the PVC panels. Rows indicate different sizes: (A, B) are 1’ bags, (C, D) are from the 2’ bags, (E, F) are from the 4’ bags, and (G, H) are the control panels.

Figure 4. Graphical depiction of the results of the PCA. Data grouped loosely into two groups, the control surfaces and the bagged surfaces. These differences were primarily attributable to barnacles, biofilms and encrusting bryozoans.
Water quality varied between the open readings and the bagged readings for DO and pH, while temperature and salinity never varied significantly (Figure 5). Dissolved oxygen was always significantly lower in the bags than in the open readings. The pH varied at times throughout the year. It was significantly lower in the bags in months one (September), nine (May) and twelve (August). The pH was significantly lower in the 4’ bags than all other treatments in month five (January) and lower than the open in month seven (March). The pH was lower in the 2’ and 4’ bags in months eight (April) and ten (June) than in the open readings. The pH was not significantly different during other months.

Figure 5. Water quality from monthly assessments. Data are averages from three replicates and error bars indicate one standard error. (A) shows temperature and salinity averaged over all samples, since the values never varied significantly. (B, C) show dissolved oxygen in mg/L and percent, respectively. Open readings were always significantly higher than bagged readings. (D) shows pH, which varied significantly, but inconsistently among the months.
Continuous monitoring of temperature and DO showed some interesting patterns. When using the data averaged over the month, temperature did not show significant differences between open and bagged readings. However, using the unaveraged data, the temperature change was slower in the bags than in the open during periods of rapid temperature change (Figure 6). The buffering effect was more evident in the larger bags. When temperature change was more gradual, this apparent buffering disappeared. These differences were slight and nonsignificant statistically. Dissolved oxygen showed interesting changes during the first month of immersion and could be divided roughly into four zones (Figure 7). When first immersed, little difference was observed in DO between the bags and open water. After about a week, the oxygen in the bags dropped to very low, hypoxic, and even approaching anoxic values. After around ten days, oxygen in the bags increased but was highly variable. Finally, DO settled into a balance where concentrations were lower than the open readings but followed normal daily trends. This trend continued throughout the remainder of the experiment (Supplementary Materials).
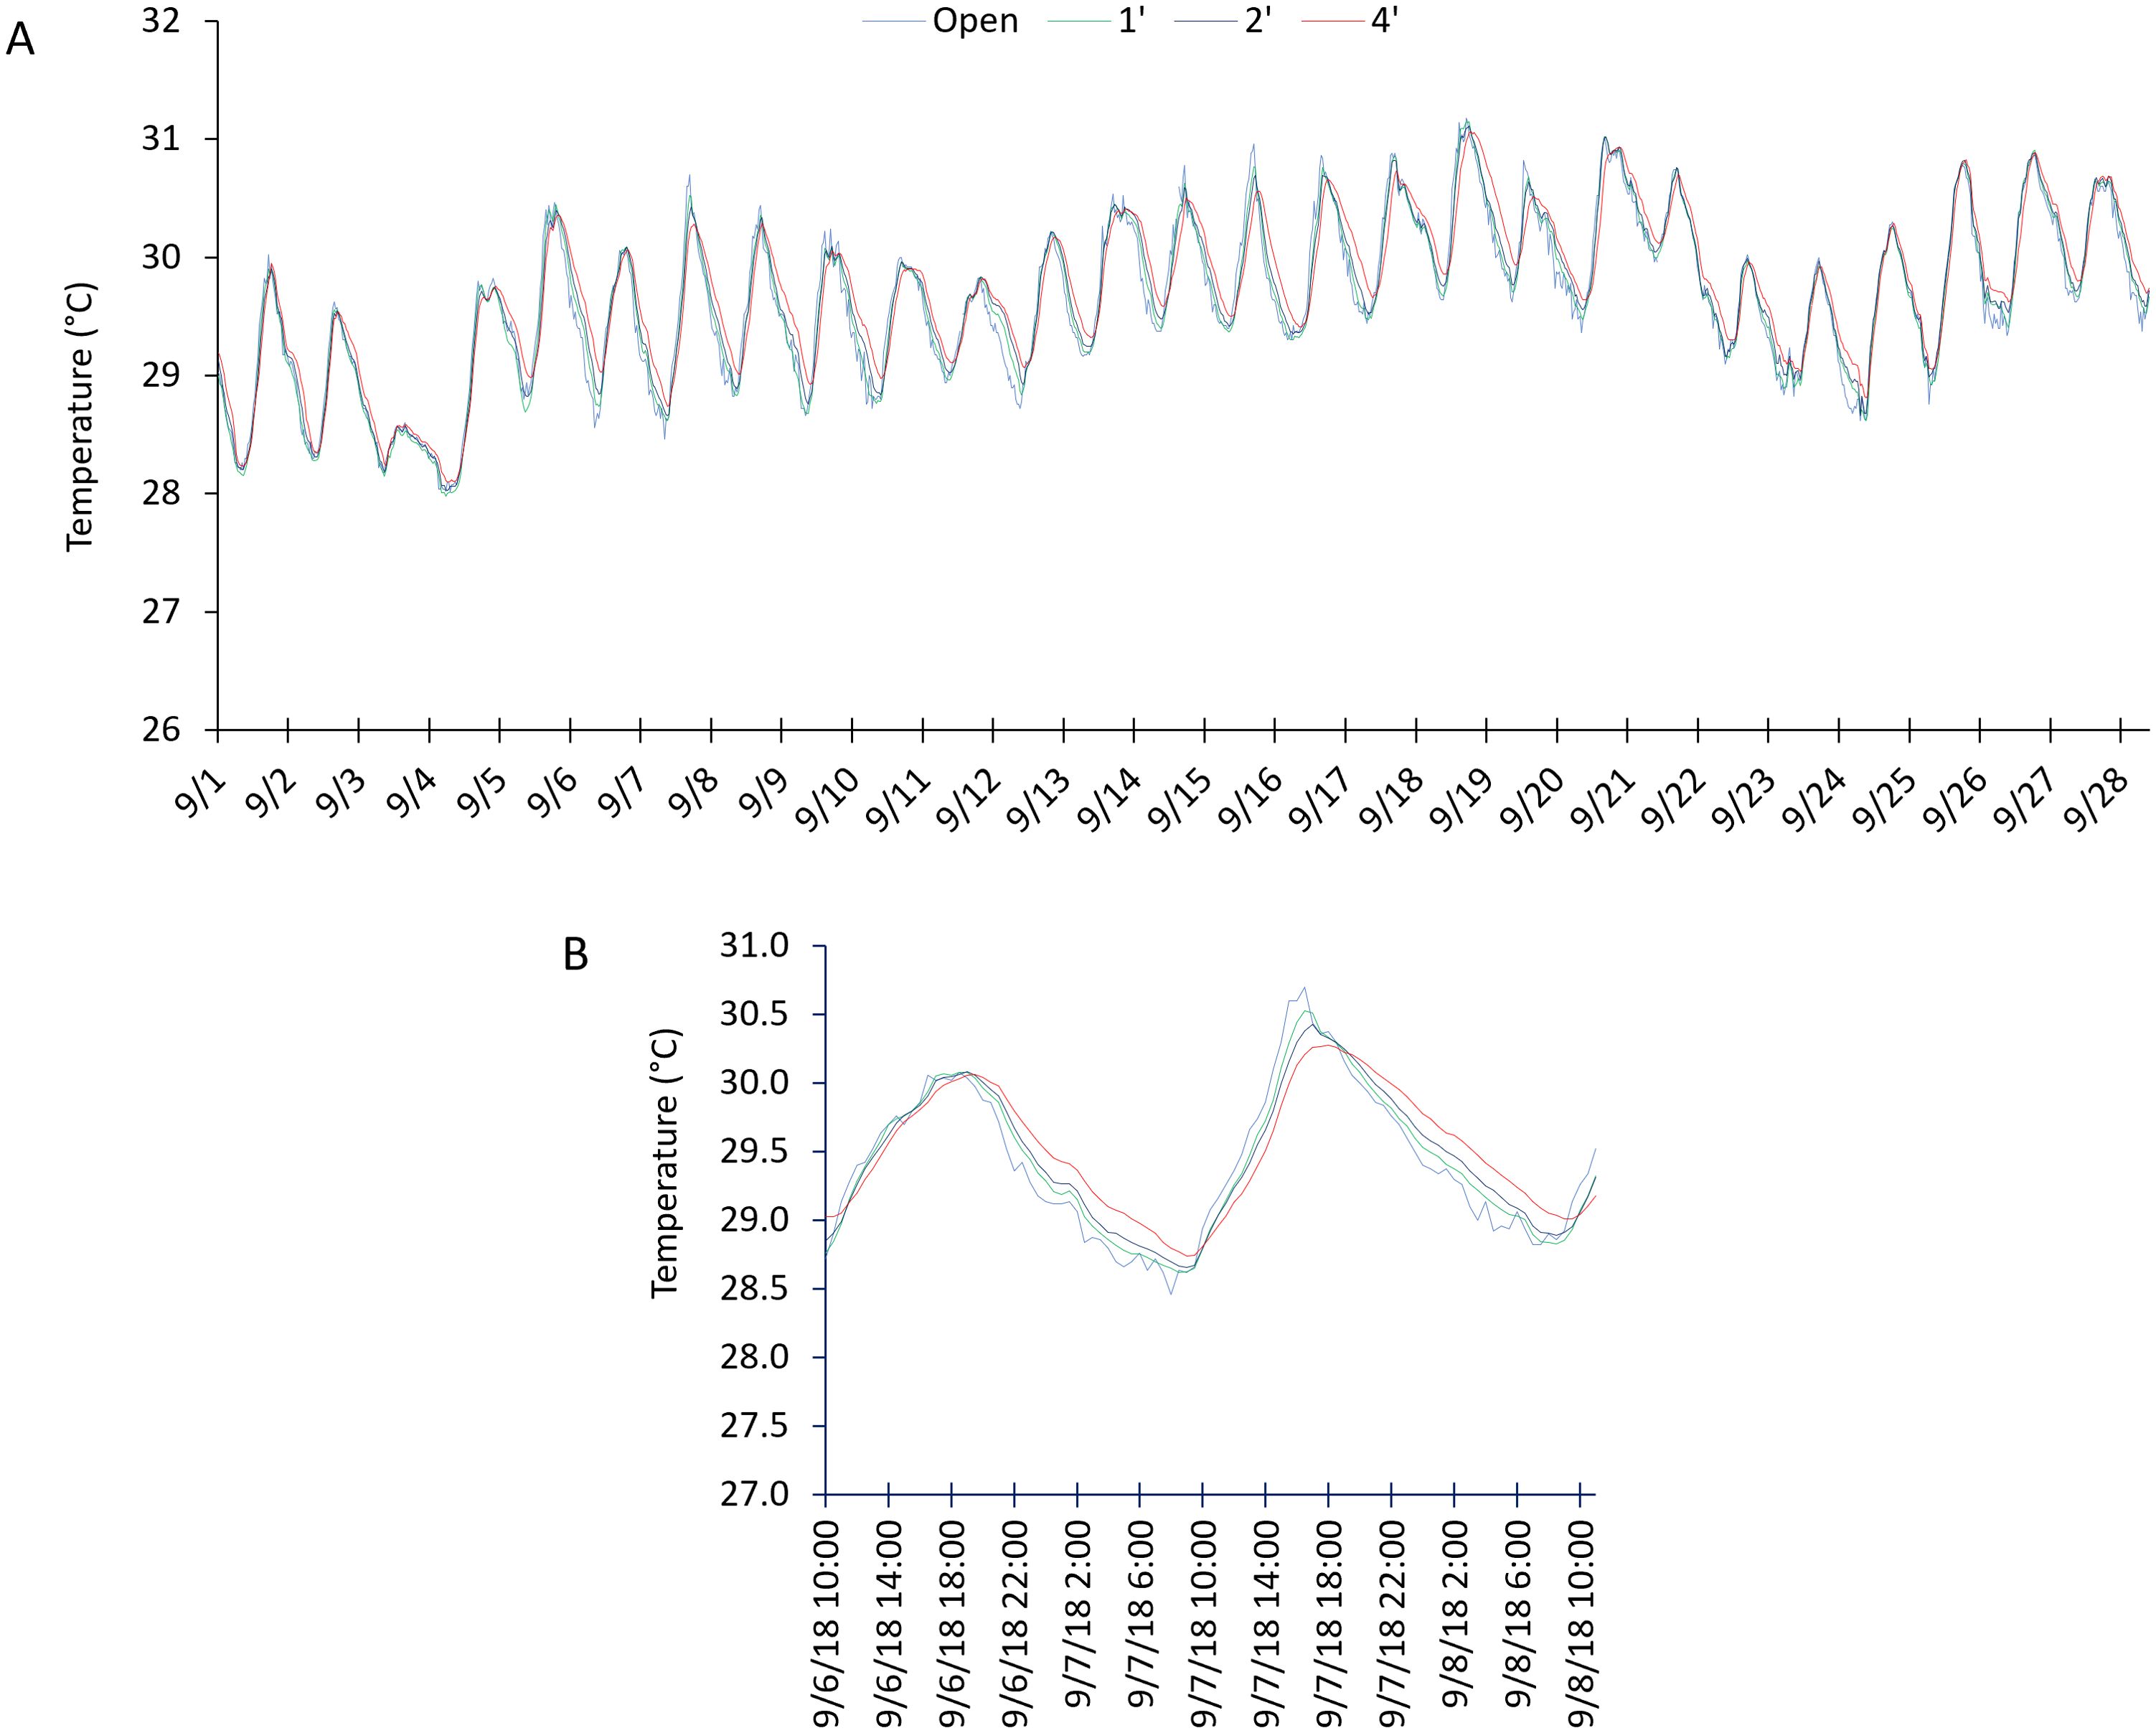
Figure 6. (A) Continuous temperature readings from the first month of immersion. (B) Shows a close up view of a subset of data highlighting the buffering of the bags during times of rapid change.
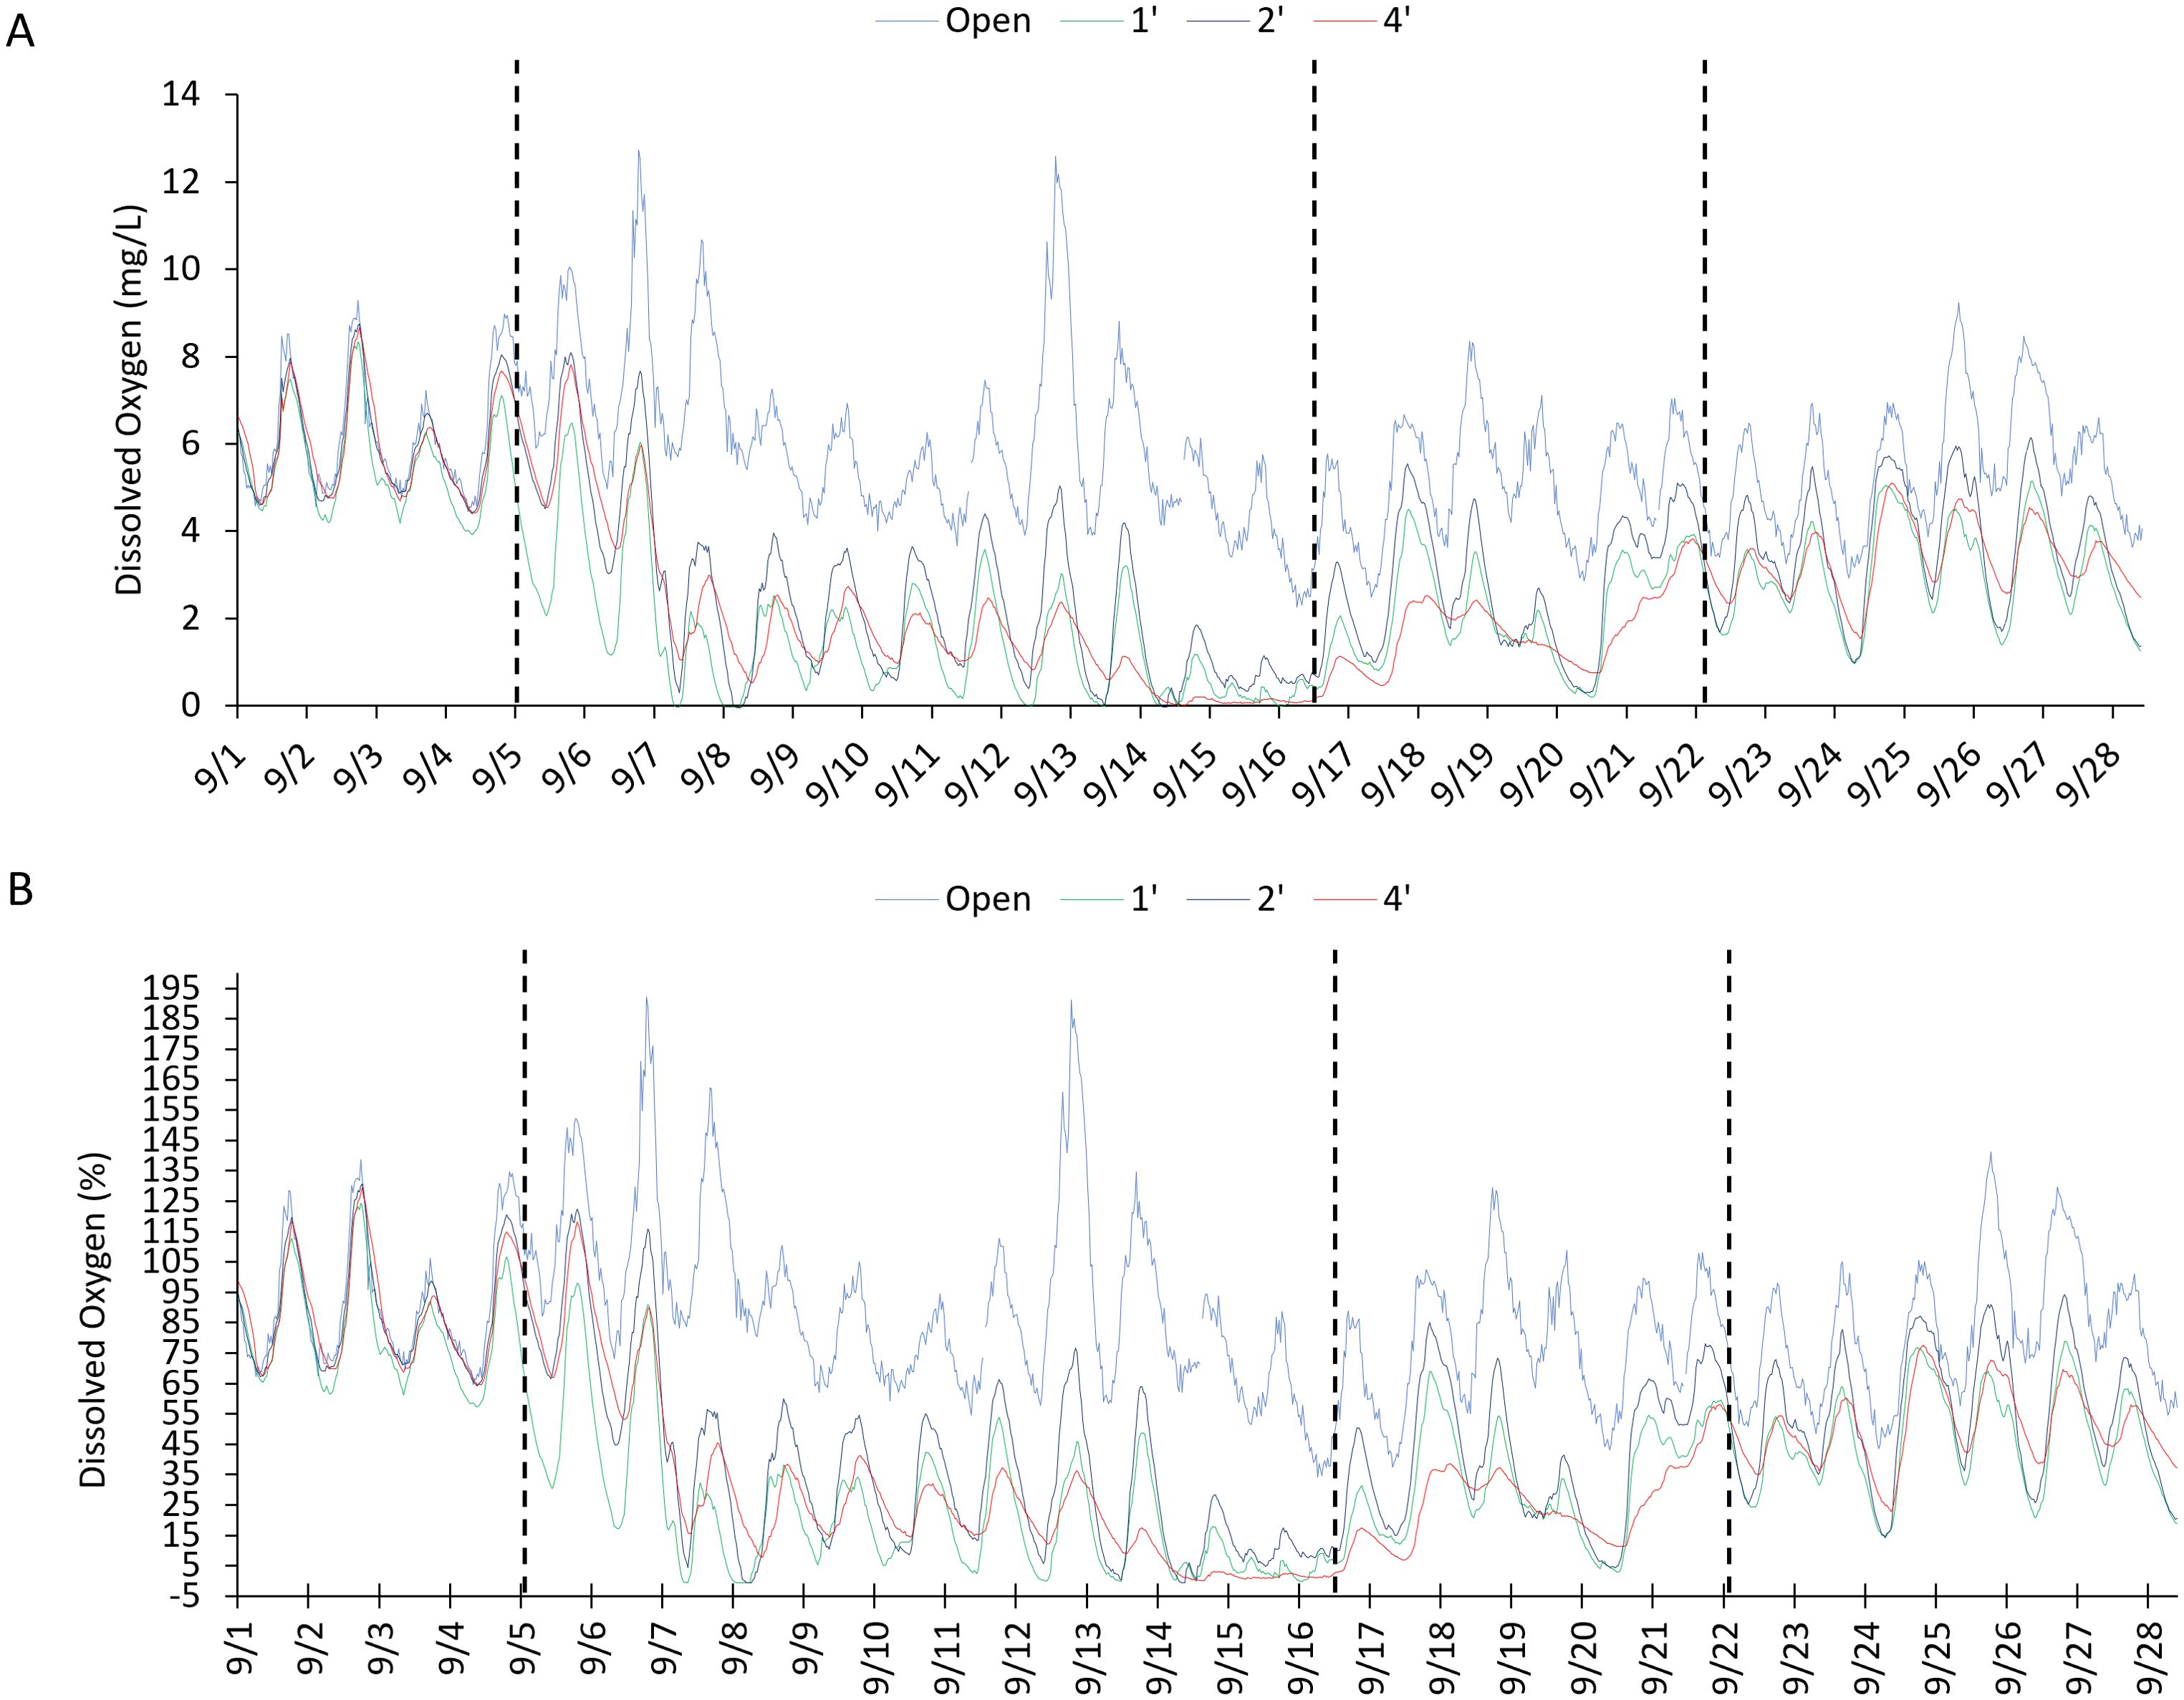
Figure 7. Continuous dissolved oxygen readings in mg/L (A) and percent (B) through the first month of immersion. Dotted lines indicate the different zones of dissolved oxygen as it settled into the long term pattern of lower readings in the bags.
4 Discussion
Best practice encourages reducing or preventing fouling to mitigate environmental impacts from transporting NIS and GHG emissions (Zabin et al., 2018; IMO, 2011; Bailey et al., 2020; Georgiades et al., 2020). Ralston and Pringle (2023) showed a novel encapsulation or wrapping method that protected surfaces from macrofouling for 13 months. In this experiment, bags ranging in size from 30.5 to 122 cm in diameter (66720 cm3 to 1.07 m3 enclosed volume) could protect inert PVC surfaces for 8 months and bronze surfaces for 9 months. The largest bags began accumulating macrofouling first, with the smaller bags never accumulating macrofouling. The results for the 1’ and 2’ bags were similar to the results seen in the original sleeves, which were about 2/3 of the size of the bags in this experiment (Ralston and Pringle, 2023).
As with the previous experiment, dissolved oxygen was always lower in the bags, regardless of size. Hypoxic and anoxic conditions have been shown to lower settlement rates of many invertebrates (Baker and Mann, 1992; Lagos et al., 2015; Jorissen and Nugues, 2021). Impacts on settlement have been seen even after conditions have returned to normoxic conditions or come out of the hypoxic range. This has been attributed to a larval response to cuing by biofilms that retain a record of prior low oxygen conditions (Cheung et al., 2014; Lagos et al., 2016). During formation, biofilm structure, composition and physiological activity is impacted by many factors, including DO (Antunes et al., 2019). Macrofouling larvae can sense changes in biofilms and may respond by settling or avoiding settlement based on biofilm characteristics (Dobretsov and Rittschof, 2020). In this experiment, DO varied and went through a cycling process where conditions became hypoxic and even anoxic for a time during initial deployment. This may have changed the biofilms, leaving a record of these detrimental, low-oxygen conditions. Biofilms were not explicitly examined in this experiment; therefore, no definitive statements can be made about the differences. However, visually, biofilms in the bags were thin and appeared different than those formed on the open controls.
Additional experiments have been conducted to examine the possible factors responsible for the non-fouling of the protected substrates. In addition to the changes in DO, pH and nutrient concentrations have been shown to vary between bagged and open samples. The bags do not exclude meroplanktonic larvae, nor do the biocides kill the larvae in the bag (Ralston et al., in prep). There are other potential cues and variables that vary between open and bagged treatments. This includes things such as light and water movement that would likely be decreased inside the bag (Abelson and Denny, 1997; Walters et al., 1999; Larsson et al., 2016; Wheeler et al., 2017). Competent larvae become negatively phototactic and often settle in dark or shaded areas (Rittschof et al., 1998; Ettinger-Epstein et al., 2008; Wheeler et al., 2017). Some species show a preference for lighted surfaces, contrary to the majority (Whalan et al., 2008). Flow could have many impacts on settlement and recruitment, including turbulence increasing the likelihood of contact with a surface, larval behavior at the surface and flow may mediate settlement cues or act as a settlement cue (Abelson and Denny, 1997; Larsson et al., 2016). Many organisms explore more or stay longer on surfaces under flow than static conditions (Walters et al., 1999).
5 Conclusions
Despite large differences in the volume of water enclosed by the bags and the spacing between antifouling fabric and protected surface, the technology protected inert PVC and propeller mimics for eight months to at least one year without any visible macrofouling. This result shows promise for real-world applications, where a bag or wrap may only be able to enclose a complex surface like a propeller or instrument with a large set-off distance.
Data availability statement
The original contributions presented in the study are included in the article/Supplementary Material. Further inquiries can be directed to the corresponding author.
Ethics statement
The manuscript presents research on animals that do not require ethical approval for their study.
Author contributions
ER: Conceptualization, Formal analysis, Funding acquisition, Methodology, Project administration, Supervision, Writing – original draft, Writing – review & editing. SP: Writing – original draft, Writing – review & editing.
Funding
The author(s) declare financial support was received for the research, authorship, and/or publication of this article. The authors declare that this study received funding from Biofouling Technologies, Inc. The funder was not involved in the study design, collection, analysis, interpretation of data, the writing of this article or the decision to submit it for publication.
Acknowledgments
We would like to acknowledge the inexhaustible field and lab support from Abe Stephens, Alex Colfer and colleagues at Florida Tech.
Conflict of interest
The authors declare that the research was conducted in the absence of any commercial or financial relationships that could be construed as a potential conflict of interest.
Publisher’s note
All claims expressed in this article are solely those of the authors and do not necessarily represent those of their affiliated organizations, or those of the publisher, the editors and the reviewers. Any product that may be evaluated in this article, or claim that may be made by its manufacturer, is not guaranteed or endorsed by the publisher.
Supplementary material
The Supplementary Material for this article can be found online at: https://www.frontiersin.org/articles/10.3389/fmars.2024.1472138/full#supplementary-material
References
Abelson A., Denny M. (1997). Settlement of marine organisms in flow. Annu. Rev. Ecol. Syst. 28, 317–339. doi: 10.1146/annurev.ecolsys.28.1.317
Antunes J., Leao P., Vasconcelos V. (2019). Marine biofilms: diversity of communities and of chemical cues. Envi. Microbiol. Rep. 11, 287–305. doi: 10.1111/1758-2229.12694
Bailey S., Brown L., Campbell M., Canning-Clode J., Carlton J., Castro N., et al. (2020). Trends in the detection of aquatic non-indigenous species across global marine, estuarine and freshwater ecosystems: a 50-year perspective. Biodiv. Res. 26, 1780–1797. doi: 10.1111/ddi.13167
Baker S., Mann R. (1992). Effects of hypoxia and anoxia on larval settlement, juvenile growth, and juvenile survival of the oyster Crassostrea virginica. Biol. Bull. 182, 265–269. Available online at: http://www.jstor.org/stable/1542120.
Balcombe P., Brierley J., Lewis C., Skatvedt L., Speirs J., Hawkes A., et al. (2019). How to decarbonize international shipping: options for fuels, technologies and policies. Energy Conv. Manage. 182, 72–88. doi: 10.1016/j.enconman.2018.12.080
Cheung S., Chan C., Po B., Li A., Leung J., Qiu J., et al. (2014). Effects of hypoxia on biofilms and subsequently larval settlement of benthic invertebrates. Mar. Poll. Bull. 85, 418–424. doi: 10.1016/j.marpolbul.2014.04.051
Dafforn K., Lewis J., Johnston E. (2011). Antifouling strategies: history and regulation, ecological impacts and mitigation. Mar. Poll. Bull. 62, 453–465. doi: 10.1016/j.marpolbul.2011.01.012
Davidson I., Brown C., Sytsma M., Ruiz G. (2009). The role of containerships as transfer mechanisms of marine biofouling species. Biofouling. 25, 645–655. doi: 10.1080/08927010903046268
Davidson I., Cahill P., Hinz A., Major R., Kluza D., Scianni C., et al. (2023). Biofouling occlusion of ships’ internal seawater systems: operational, economic, and biosecurity consequences. Biofouling 39, 410–426. doi: 10.1080/08927014.2023.2225411
Davidson I., Scianni C., Hewitt C., Everett R., Holm E., Tamburri M., et al. (2016). Mini-review: Assessing the drivers of ship biofouling management – aligning industry and biosecurity goals. Biofouling 32, 411–428. doi: 10.1080/08927014.2016.1149572
Davidson I., Smith G., Ashton G., Ruiz G., Scianni C. (2020). An experimental test of stationary lay-up periods and simulated transit on biofouling accumulation and transfer on ships. Biofouling 36, 455–466. doi: 10.1080/08927014.2020.1769612
de Souza T., Andrade J., Serrano R., Vidigal T., Viana E., Bastos A., et al. (2023). Energy efficiency analysis of pumping systems impacted by the golden mussel: a case study in the Brazilian Amazon. Energies 16, 1858. doi: 10.3390/en16041858
Dobretsov S., Rittschof D. (2020). Love at first taste: induction of larval settlement by marine microbes. Int. J. Mol. Sci. 21, 731. doi: 10.3390/ijms21030731
Ettinger-Epstein P., Whalan S., Battershill C., de Nys R. (2008). A hierarchy of settlement cues influences larval behavior in a coral reef sponge. Mar. Ecol. Prog. Ser. 365, 103–113. doi: 10.3354/meps07503
Farkas A., Degiuli N., Martic I. (2021). The impact of biofouling on the propeller performance. Ocean. Engr. 219, 108376. doi: 10.1016/j.oceaneng.2020.108376
Floerl O., Atalah J., Bugnot A., Chandler M., Dafforn K., Floerl L., et al. (2021). A global model to forecast coastal hardening and mitigate associated socioecological risks. Nature Sust. 4, 1060–1067. doi: 10.1038/s41893-021-00780-w
Floerl O., Inglis G. (2003). Boat harbour design can exacerbate hull fouling. Austral. Ecol. 28, 116–127. doi: 10.1046/j.1442-9993.2003.01254.x
Georgiades E., Kluza D., Bates T., Lubarsky K., Brunton J., Growcott A., et al. (2020). Regulating vessel biofouling to support New Zealand’s marine biosecurity system – a blue print for evidence-based decision making. Front. Mar. Sci. 19. doi: 10.3389/fmars.2020.00390
Hopkins G., Davidson I., Georgiades E., Floerl O., Morrisey D., Cahill P. (2021). Managing biofouling on submerged static artificial structures in the marine environment – assessment of current and emerging approaches. Front. Mar. Sci. 8. doi: 10.3389/fmars.2021.759194
IMO (2011). Guidelines for the control and management of ships’ biofouling to minimize the transfer of invasive aquatic species (London: Marine Environmental Protection Committee, International Maritime Organization, Annex 26, Resolution MEPC.207 (62), 25 pp.
IMO (2021). Fourth IMO GHG Study 2020 (London: International Maritime Organization, 2020). Available online at: https://wwwcdn.imo.org/localresources/en/OurWork/Environment/Documents/Fourth%20IMO%20GHG%20Study%202020%20-%20Full%20report%20and%20annexes.pdf.
Jorissen H., Nugues M. (2021). Coral larvae avoid substratum exploration and settlement in low-oxygen environments. Coral Reefs. 40, 31–39. doi: 10.1007/s00338-020-02013-6
Lagos M., White C., Marshall D. (2015). Avoiding low-oxygen environments: oxytaxis as a mechanism of habitat selection in a marine invertebrate. Mar. Ecol. Prog. Ser. 540, 99–107. doi: 10.3354/meps11509
Lagos M., White C., Marshall D. (2016). Biofilm history and oxygen availability interact to affect habitat selection in a marine invertebrate. Biofouling 32, 645–655. doi: 10.1080/08927014.2016.1178725
Larsson A., Granhag L., Jonsson P. (2016). Instantaneous flow structures and opportunities for larval settlement: barnacle larvae swim to settle. PloS One 11, e0158957. doi: 10.1371/journal.pone.0158957
Lejars M., Margaillan A., Bressy C. (2012). Fouling release coatings: a nontoxic alternative to biocidal antifouling Coatings. Chem. Rev. 112, 4347–4390. doi: 10.1021/cr200350v
Luoma E., Nevalainen L., Altarriba E., Helle I., Lehikoinen A. (2021). Developing a conceptual influence diagram for socio-eco-technical systems analysis of biofouling management in shipping – A Baltic Sea case study. Mar. Pol. Bull. 170, 112614. doi: 10.1016/j.marpolbul.2021.112614
Matos T., Pinto V., Sousa P., Martins M., Fernandez E., Henriques R., et al. (2023). Design and in situ validation of low-cost and easy to apply anti-biofouling techniques for oceanographic continuous monitoring with optical instruments. Sensors 23, 605. doi: 10.3390/s23020605
Miller A., Davidson I., Minton M., Steves B., Moser C., Drake L., et al. (2018). Evaluation of wetted surface area of commercial ships as biofouling habitat flux to the United States. Biol. Invasions. 20, 1977–1990. doi: 10.1007/s10530-018-1672-9
Ralston E., Gardner H., Hunsucker K., Swain G. (2022). The effect of grooming on five commercial antifouling coatings. Front. Mar. Sci. 9. doi: 10.3389/fmars.2022.836555
Ralston E., Pringle S. (2023). The use of tunable encapsulation for long-term fouling control. J. Mar. Sci. Engr. 11. doi: 10.3390/jmse11101947
Rittschof D., Forward R., Cannon G., Welch J., McClary M., Holm E., et al. (1998). Cues and context: larval responses to physical and chemical cues. Biofouling 12, 31–44. doi: 10.1080/08927019809378344
Sylvester F., Kalaci O., Leung B., Lacoursiere-Roussel A., Murray C., Choi F., et al. (2011). Hull fouling as an invasion vector: can simple models explain a complex problem? J. Appl. Ecol. 48, 415–423. doi: 10.1111/j.1365-2664.2011.01957.x
Vuong P., McKinley A., Kaur P. (2023). Understanding biofouling and contaminant accretion on submerged marine structures. Mat. Degr. 7, 50. doi: 10.1038/s41529-023-00370-5
Walters L., Miron G., Bourget E. (1999). Endoscopic observations of invertebrate larvae substratum exploration and settlement. Mar. Ecol. Prog. Ser. 182, 95–108. doi: 10.3354/meps182095
Weber F., Esmaeili N. (2023). Marine biofouling and the role of biocidal coatings in balancing environmental impacts. Biofouling 39, 661–681. doi: 10.1080/08927014.2023.2246906
Whalan S., Ettinger-Epstein P., Battershill C., de Nys R. (2008). Larval vertical migration and hierarchical selectivity of settlement in a brooding marine sponge. Mar. Ecol. Prog. Ser. 368, 145–154. doi: 10.3354/meps07573
Wheeler J., Luo E., Helfrich K., Anderson E., Starczak V., Mullineaux L. (2017). Light stimulates swimming behavior of larval eastern oysters Crassostrea virginica in turbulent flow. Mar. Ecol. Prog. Ser. 571, 109–120. doi: 10.3354/meps12106
Wu Y., Hua J., Wu D. (2022). Economic analysis of ship operation using a new antifouling strategy. Ocean. Engr. 266, 113038. doi: 10.1016/j.oceaneng.2022.113038
Keywords: antifouling, biofouling, encapsulation, recruitment, dissolved oxygen
Citation: Ralston E and Pringle S (2024) Investigation of the impact of increased size and volume of encapsulation for long-term fouling control. Front. Mar. Sci. 11:1472138. doi: 10.3389/fmars.2024.1472138
Received: 29 July 2024; Accepted: 25 November 2024;
Published: 16 December 2024.
Edited by:
Andrew James Manning, HR Wallingford, United KingdomReviewed by:
Matthew First, Naval Research Laboratory, United StatesSatheesh Sathianeson, King Abdulaziz University, Saudi Arabia
Copyright © 2024 Ralston and Pringle. This is an open-access article distributed under the terms of the Creative Commons Attribution License (CC BY). The use, distribution or reproduction in other forums is permitted, provided the original author(s) and the copyright owner(s) are credited and that the original publication in this journal is cited, in accordance with accepted academic practice. No use, distribution or reproduction is permitted which does not comply with these terms.
*Correspondence: Emily Ralston, ZXJhbHN0b25AZml0LmVkdQ==
 Emily Ralston
 Samantha Pringle