- 1College of Hydraulic Engineering, Zhejiang Tongji Vocational College of Science and Technology, Hangzhou, China
- 2State Key Laboratory of Satellite Ocean Environment Dynamics, Second Institute of Oceanography, Ministry of Natural Resources, Hangzhou, China
- 3School of Oceanography, Shanghai Jiao Tong University, Shanghai, China
- 4Southern Marine Science and Engineering Guangdong Laboratory, Zhuhai, China
This study investigated an extreme sea surface warming in the midlatitude western North Pacific (MLWNP) during the summer of 2012. The 2012 extreme event was characterized by warm sea surface temperature anomaly (SSTA) extending from the East/Japan Sea to central North Pacific. The SSTA box–averaged over the MLWNP (130–180°E, 33–50°N) in 2012 ranked as the third warmest in recent four decades, which has caused intense marine heatwaves in this region. During the summer of 2012, a positive Indian Ocean Dipole event co-occurred with El Niño, favoring anomalous moisture transport between the two basins that caused enhanced convection in the South China and Philippine Seas and western–to–central subtropical Pacific. The enhanced convective activities triggered two meridional atmospheric Rossby wave trains to form strong atmospheric blocking high–pressure systems in the MLWNP. This reduced the total cloud cover and surface wind speed, enhancing insolation and reducing the release of latent heat flux. In addition, the weakened wind strengthened the stratification and shoaled the mixed layer. As a result, the increased net heat flux into the ocean accompanied by a shallower mixed layer contributed to the upper ocean warming in the MLWNP. Meanwhile, the North Pacific was dominated by a negative phase of Pacific Decadal Oscillation (PDO), significantly contributing to warm SSTAs in the MLWNP in 2012. Consequently, the 2012 extreme warming in the MLWNP was the results of the combination of atmospheric Rossby waves and PDO. Our study highlighted the roles of high–frequency atmospheric teleconnection and low–frequency PDO in extreme sea surface warming in the MLWNP.
1 Introduction
Extremely hot events have increased in frequency and intensity under global warming (Amaya et al., 2020; Holbrook et al., 2019; Oliver et al., 2018). These hot extremes caused heatwaves over land and oceans (marine heatwaves, MHWs), severely affecting the human health, economy, marine ecosystem and fisheries (Gomes et al., 2024; Hayashi et al., 2022; Hong et al., 2023; Hua et al., 2023; Oliver et al., 2021; Perkins-Kirkpatrick and Lewis, 2020; Zhang et al., 2024). For example, the blob event of 2013–2015, the largest MHW in the northeastern Pacific, seriously affected the marine ecosystem and socio-economically important fisheries (Bond et al., 2015; Cavole et al., 2016; Smale et al., 2019). The unprecedented 2022 heatwaves swept across Europe and Asia: the United Kingdom and China experienced the warmest summer on record (Herrera-Lormendez et al., 2023; Li X. et al., 2023; Song et al., 2024). Moreover, the 2022 heatwaves over Europe and China caused the record–breaking Pakistan flood, resulting in over 30 million people homeless and economic losses of 30 billion dollars (Hong et al., 2023; Tang et al., 2023). Thus, it is necessary to understand the causes of hot extremes to enhance predictability and to minimize their adverse impacts.
In summer, the Indo–Northwest Pacific is a region of the warmest water (warm pool) among world’s oceans (Xie et al., 2016). Air–sea interactions over the warm pool play crucial roles in the Asian Summer Monsoon variability (Huang and Sun, 1992; Wang et al., 2000). For example, anomalous convective activities over the South China and Philippine Seas (SCPS) can trigger the Pacific–Japan (PJ) pattern, an atmospheric pattern that dominates the weather and climate variability over the East Asia and western North Pacific (WNP) during boreal summer (Kubota et al., 2016; Lee et al., 2020; Nitta, 1987; Xie et al., 2016). Since firstly discovered by Nitta (1987), the PJ teleconnection was recognized as an important trigger of the summer hot extremes over Korea–Japan and WNP (Kosaka and Nakamura, 2006; Noh et al., 2021, 2023; Wakabayashi and Kawamura, 2004; Yeo et al., 2019). In particular, Noh et al. (2023) highlighted the roles of atmospheric processes in the sea surface warming over the midlatitude WNP (MLWNP) and considered the PJ teleconnection as “atmospheric pathway” in the developing of MHWs in this region.
During July–September (JAS) of 2012, anomalous sea surface warming occurred in the MLWNP (Figure 1A). The sea surface temperature anomaly (SSTA) box–averaged over the MLWNP (130–180°E, 33–50°N) in 2012 was slightly lower than two leading extreme warming events of 2021–2022, and ranked as the third warmest in recent four decades. To date, the 2012 extreme warming event in the MLWNP was reported by only a few investigators (Du et al., 2022; Kawai et al., 2015; Miyama et al., 2021). For example, Miyama et al. (2021) studied the interannual variability of SST over the Oyashio region (143–147°E 40–43°N) and concluded that oceanic current and mesoscale eddy played important roles in the anomalous warming in the Oyashio region in recent years. Li et al. (2024) reported the co-occurrence of a positive Indian Ocean Dipole (pIOD) event and El Niño during the summer of 2012, which favored an anomalous cyclone accompanied by enhanced convection in the SCPS. As a companion paper of Li et al. (2024), this study investigated the cause of the extreme sea surface warming in the MLWNP during the summer of 2012. We showed that the air–sea interactions associated with the co-occurrence of pIOD and El Niño triggered atmospheric teleconnection that played an important role in forming the 2012 extreme warming in the MLWNP.
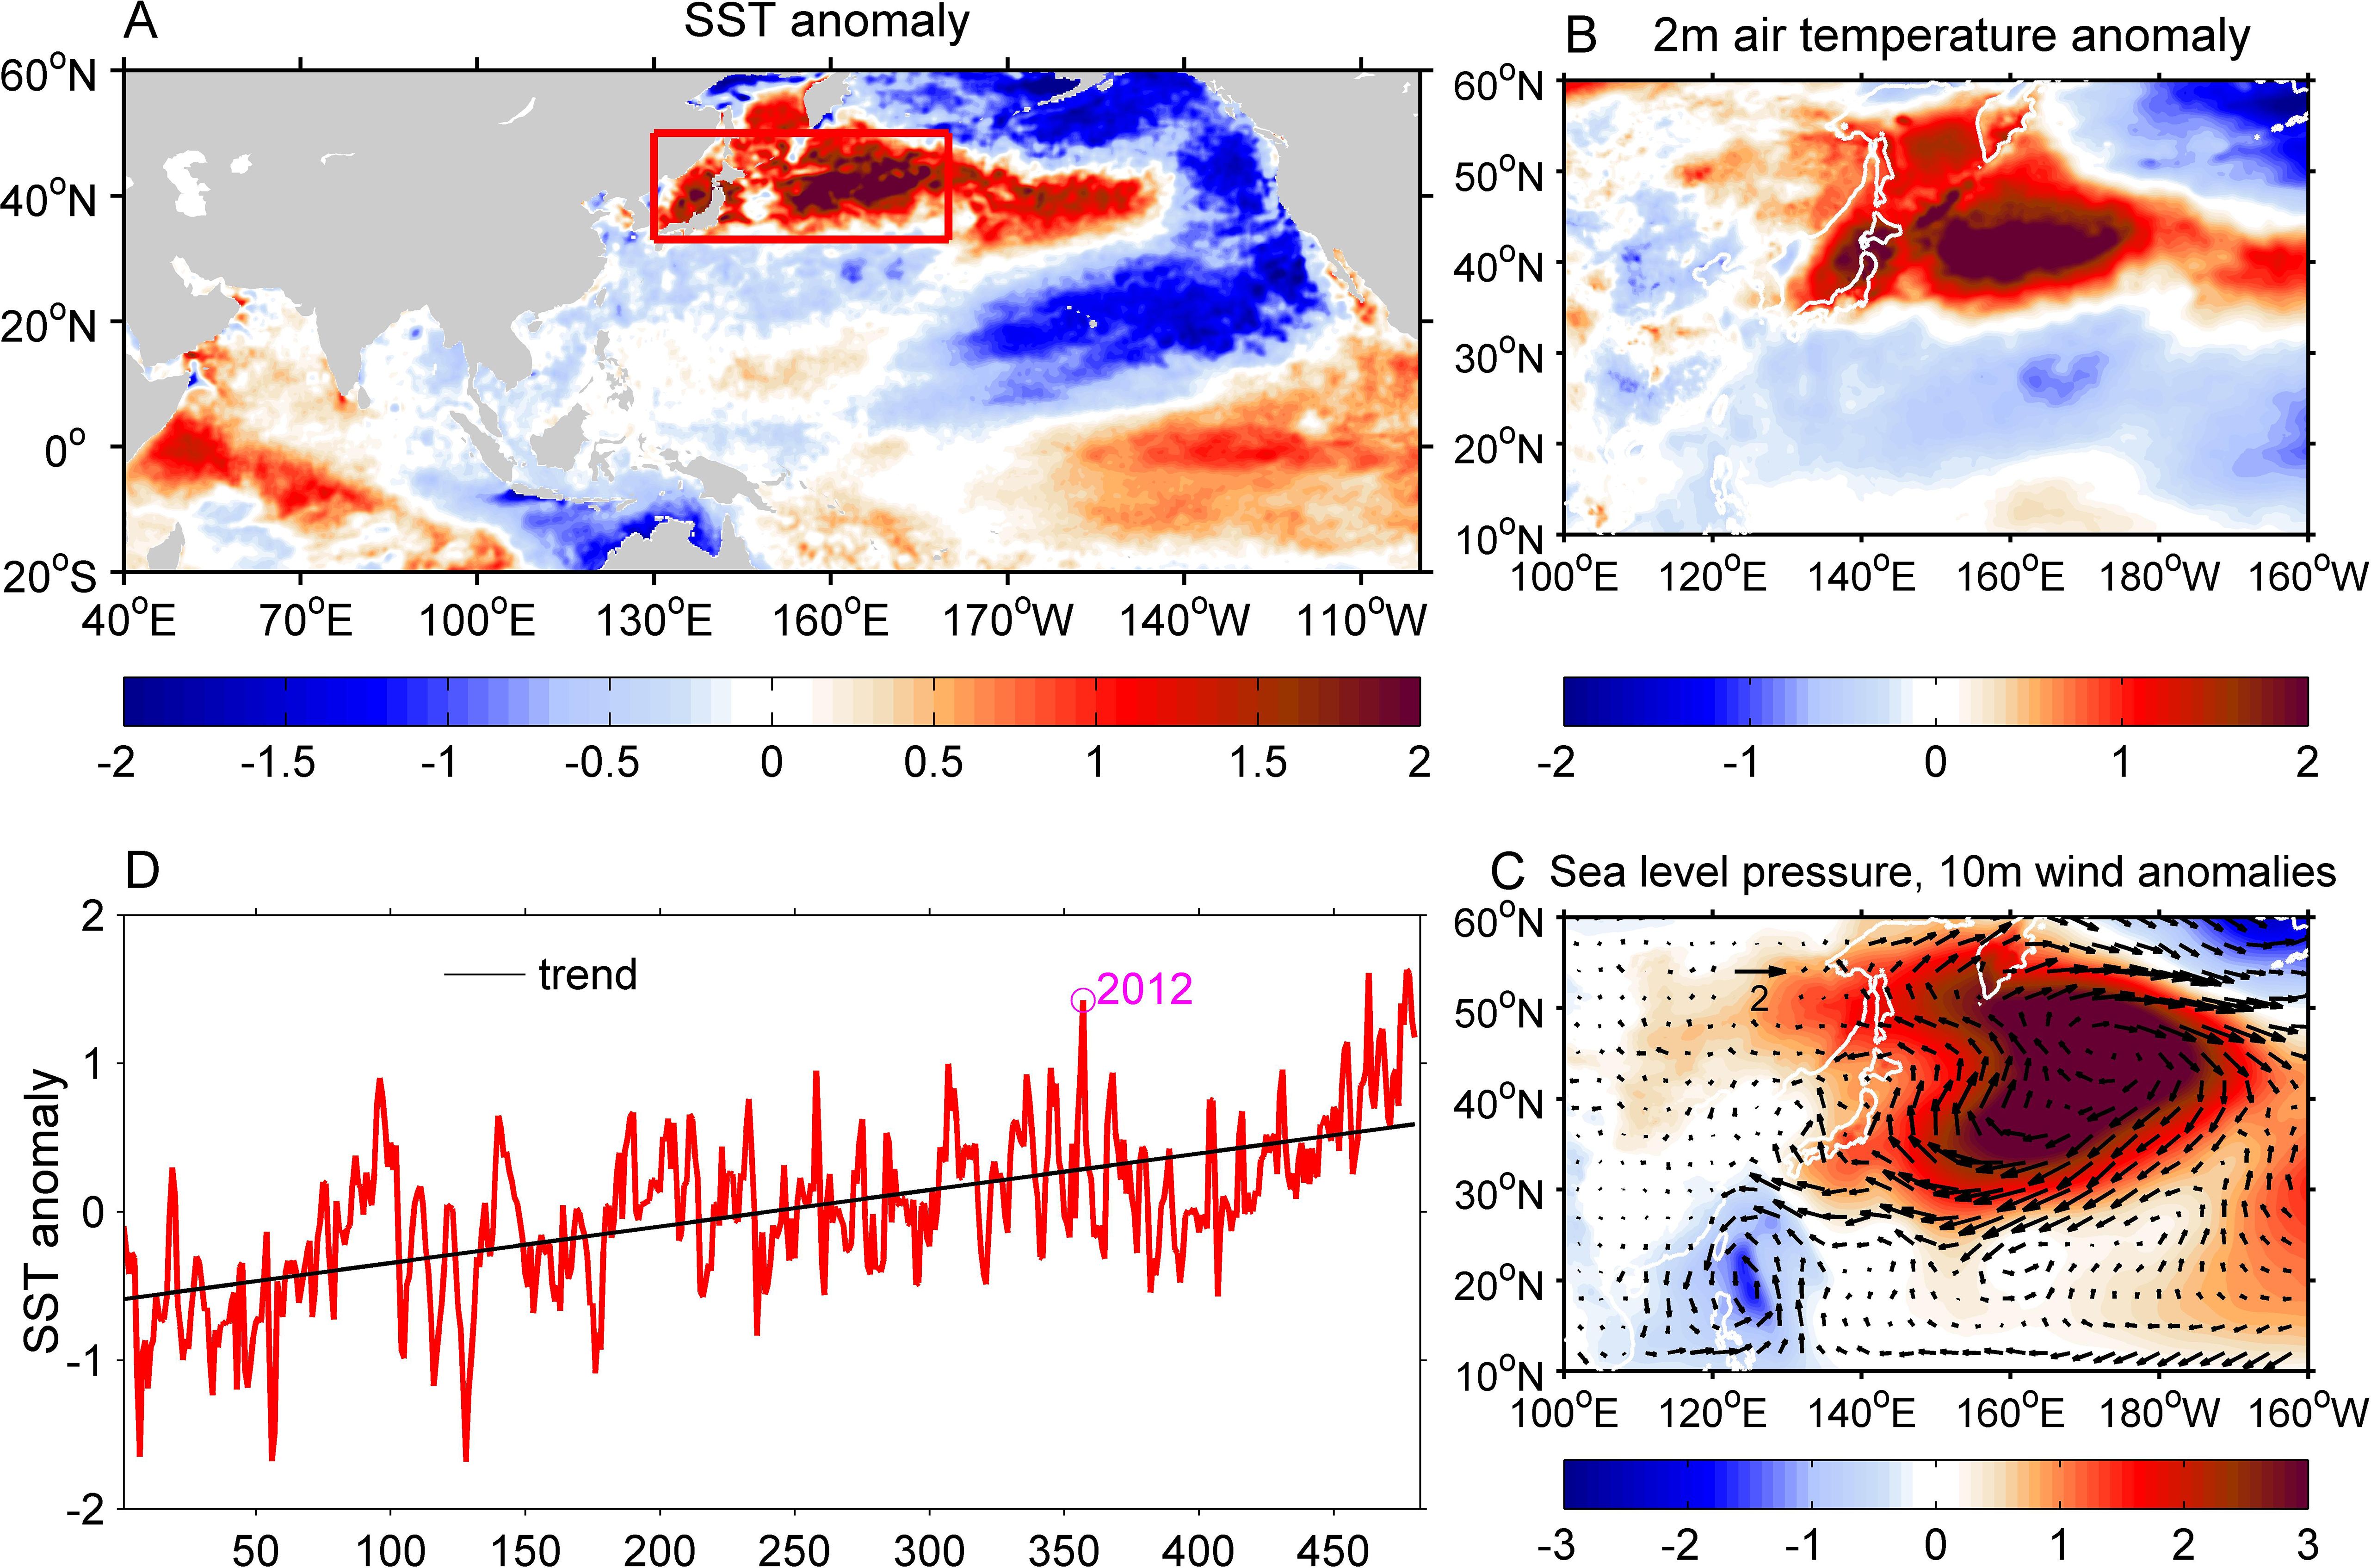
Figure 1. Anomalies of SST (A; units: °C), 2 m air temperature (B; units: °C), sea level pressure (C; shading, units: hPa) and 10 m wind (C; vectors, units: m/s) averaged during July–September of 2012. The red box (130–180°E, 33–50°N) highlights the extreme sea surface warming in the MLWNP. (D) Interannual variability of monthly SSTA box–averaged over the MLWNP during 1983–2022. The black line indicates the trend of SSTA and the purple circle represents the third warmest SSTA in September 2012.
The rest of this paper was organized as follows. In Section 2, we described the data and methods used in this study. In Section 3, various observational and reanalysis datasets were used to investigate the characteristics and trigger mechanisms of the extreme sea surface warming in the MLWNP during the summer of 2012. The main results in this study were discussed in Section 4, and a conclusion was provided in Section 5.
2 Materials and methods
2.1 Data
We used the 0.25°×0.25°, daily and monthly satellite SST from the National Oceanic and Atmospheric Administration Optimum Interpolation Sea Surface Temperature (OISST) High Resolution Dataset Version 2 (Reynolds et al., 2007). The monthly atmospheric reanalysis datasets, including 10 m winds, sea level pressure, 2 m air temperature, precipitation, vertically integrated water vapor, total cloud cover, surface heat fluxes (shortwave radiation, longwave radiation, latent heat flux and sensible heat flux), geopotential height, horizontal wind and pressure velocity (omega, ω) at pressure levels, were provided by the 0.25°×0.25° European Centre for Medium-Range Weather Forecasts ERA5 reanalysis (Hersbach et al., 2020). The monthly National Oceanic and Atmospheric Administration outgoing longwave radiation (OLR) data (Liebmann and Smith, 1996) were used to estimate the convective activities. We used the global, 0.25°×0.25° surface geostrophic current for 1993–2022 from the Copernicus Marine and Environment Monitoring Service (CMEMS). The CMEMS global gridded Level-4 data are produced using measurements from all available satellite altimeters. The 1°×1°, monthly global gridded Argo data (temperature and salinity) with 27 standard levels (0–2000 m) and temporal coverage from 2005 to 2020 were provided by International Pacific Research Center. For all variables (except the Argo dataset), the anomalies were derived by subtracting the monthly climatology from the data during 1983–2022.
2.2 Methods
2.2.1 PJ index
Followed the study of Yeo et al. (2019), we defined the PJ index as the differences between the 850 hPa geopotential height anomaly averaged over the region around Japan (130–160°E, 35–45°N) and SCPS (115–140°E, 15–25°N). The PJ events were selected based on ±0.75 standard deviation of the JJAS (June–September) PJ index, respectively. During a positive PJ event, high geopotential height anomaly occurred over the region around Japan and low geopotential height anomaly occurred in the SCPS (Kubota et al., 2016; Nitta, 1987). We used the JJAS 850 hPa geopotential height anomaly from the ERA5 reanalysis dataset during 1983–2022 to estimate the PJ index. According to these criteria, 34 positive PJ events and 40 negative PJ events were identified. For example, a strongest positive PJ event occurred in July 2018 and three positive PJ events occurred in June, August and September 2012 (Figure 2).
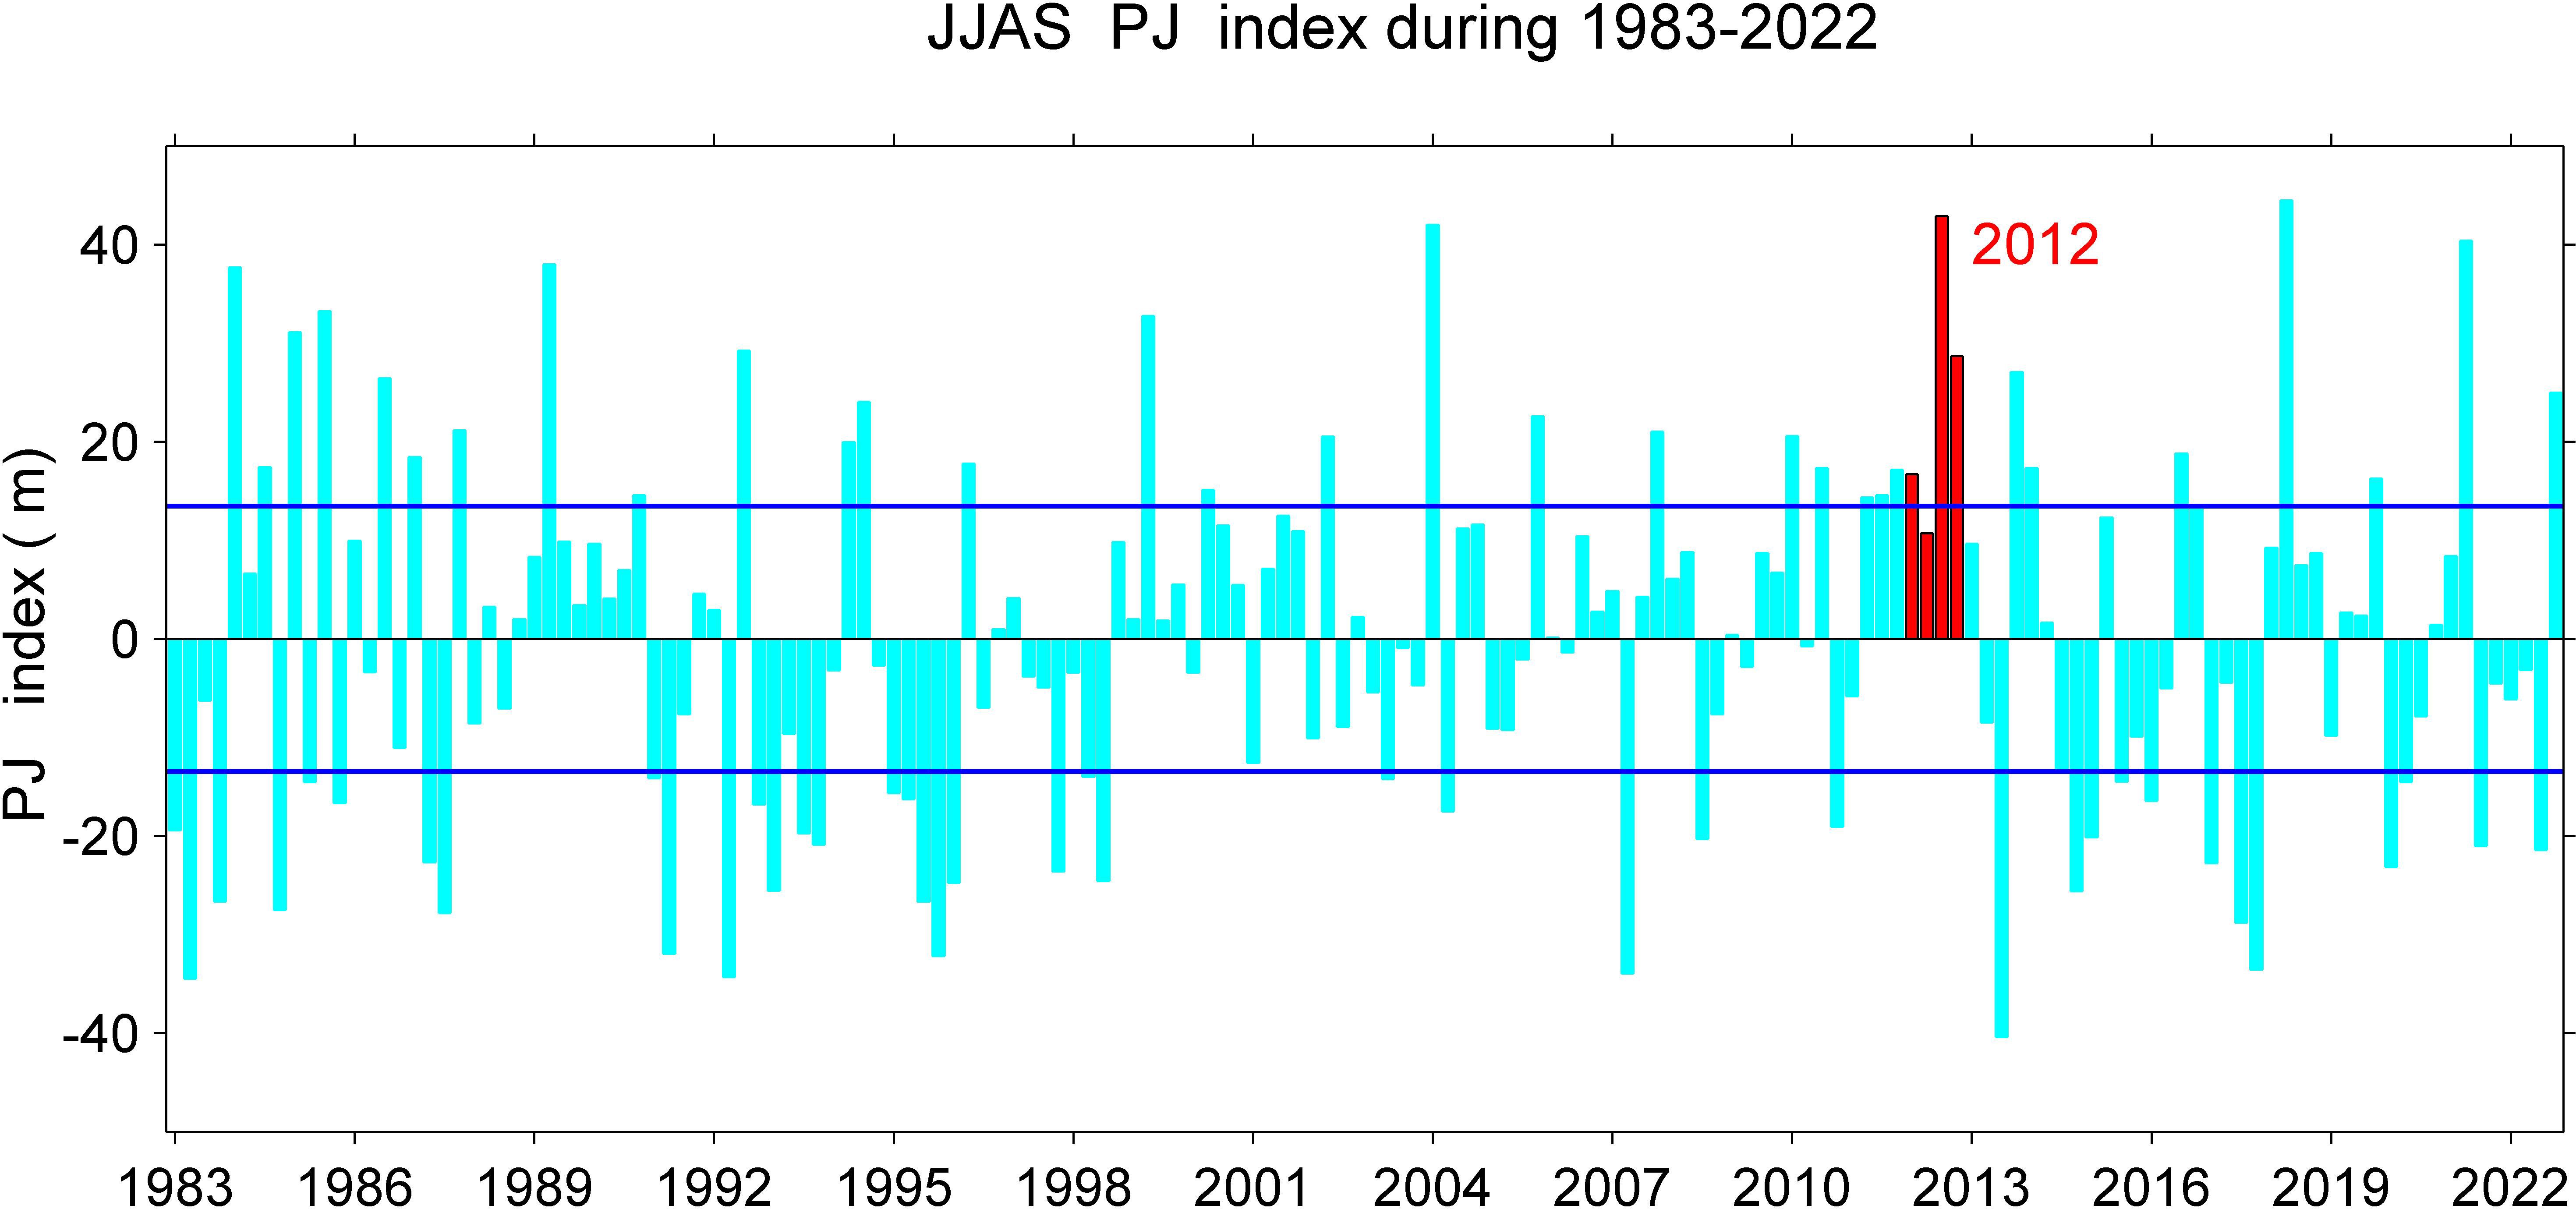
Figure 2. Interannual variability of JJAS PJ index during 1983–2022. The blue lines indicate the ±0.75 standard deviation of the JJAS PJ index to identify positive and negative PJ events, respectively. The red bars highlight the positive PJ index during JJAS of 2012.
2.2.2 Mixed layer heat budget
A mixed layer heat budget was estimated to determine the dominant processes responsible for 2012 extreme warming in the MLWNP region (Amaya et al., 2021):
Primes denote time anomalies and overbars represent time mean values. The mixed layer sea temperature and mixed layer depth H were derived from the 1°×1°, monthly Argo dataset from 2005 to 2020; The downward net heat flux Q (the sum of shortwave radiation, longwave radiation, latent heat flux, and sensible heat flux) was provided by the ERA5 reanalysis dataset; and denote the sea water density (1025 kg m-3) and specific heat capacity (3996 J kg-1 K-1), respectively; We used linear interpolation to regrid the net heat flux Q onto the 1°×1° grid of the Argo data, and derived the monthly anomaly by removing the climatology. Limited by the temporal coverage of the Argo data, the heat fluxes from 2005 to 2020 were used to derive their climatology states to estimate the mixed layer heat budget terms. As interpreted by Amaya et al. (2021), Equation 1 means that positive net heat flux anomaly over a thin climatological mixed layer (term II) and shoaling of mixed layer depth (term III) can contribute to upper ocean warming.
The mixed layer depth was calculated using the monthly three-dimensional Argo temperature and salinity. The definition of mixed layer depth was based on a variable density criterion (Kara et al., 2000; Li et al., 2021) as follows:
where is the density difference from the surface to the base of the mixed layer depth and , and are the surface values of sea temperature, salinity and pressure, respectively. is the surface density (kg/m3). The mixed layer depth was defined as the depth at which the density increase from the surface value is equal to the temperature decrease by (0.5°C) (Li Z. et al., 2023).
2.2.3 Wave activity flux
To analyze the propagation of Rossby wave energy, the horizontal wave activity flux was calculated using the formula (Takaya and Nakamura, 2001):
Where is the horizontal WAF vectors, the and denote latitude and longitude, respectively; the vector represents the climatological mean horizontal winds in zonal and meridional direction, respectively; indicates the anomaly of stream function; m is the Earth’s radius, and p=(pressure/1000 hPa).
2.2.4 Definition of MHWs
A MHW was defined as an anomalously warm event in which the SST is above the 90th percentile threshold for more than five days (Hobday et al., 2016). The threshold and climatology were derived from the daily OISST dataset during the period of 1983–2022. We described the MHWs characteristics by a set of specific metrics, including the duration (the total number of MHW days in each year), cumulative intensity (the integrated intensity over the duration of the event), and frequency (the total number of all MHW events in each year).
3 Results
3.1 Extreme sea surface warming in the MLWNP during 2012 summer
Figure 1A shows the spatial pattern of SSTA in the Indian Ocean and Pacific averaged during JAS of 2012. The SSTA showed striking regional features in the equatorial Pacific, tropical Indian Ocean and WNP, respectively. Warm SSTA occurred in the eastern equatorial Pacific and a zonal dipole pattern of SSTA was recognized in the tropical Indian Ocean. These features reflected the co-occurrence of a pIOD event and El Niño during the summer of 2012 as suggested by Li et al. (2024). In addition, warm SSTA occurred in the MLWNP and cold SSTA occurred in the subtropical WNP, forming a clear meridional dipole pattern. The 2 m air temperature anomaly showed a similar meridional dipole pattern in the WNP, particularly with high temperatures in the downstream of the Kuroshio–Oyashio Extension (KOE, 150–170°E, 37–45°N) (Figure 1B). These features indicated an organized PJ teleconnection pattern over the WNP during the summer of 2012. Nitta (1987) and Kubota et al. (2016) proposed that a positive PJ pattern was accompanied by cyclonic/anticyclonic surface anomalies over the tropical/midlatitude WNP. Figure 1C clearly showed a high sea level pressure anomaly associated with strong anticyclonic surface wind anomalies over the MLWNP. Such a strong anticyclone (high sea level pressure anomaly) spanned from the East/Japan Sea (EJS) to central North Pacific, forming atmospheric blocking high–pressure systems over the MLWNP. In addition, a low sea level pressure anomaly associated with cyclonic surface wind anomalies was recognized in the SCPS. These anomalies confirmed that a positive PJ teleconnection pattern occurred concurrently with the extreme sea surface warming in the MLWNP during the summer of 2012. The SSTA box–averaged over the MLWNP (130–180°E, 33–50°N) in September 2012 was slightly lower than that in July 2021 and September 2022 (Figure 1D), two leading hot extremes widely concerned in recent years (Du et al., 2022; Pak et al., 2022; Song et al., 2024).
3.2 Composite analysis
In the composite analysis of PJ events, the summer means June to September (JJAS). While, in 2012, we used July to September (JAS) to present summer because the extreme surface warming occurred primarily during this period. Figure 2 shows the interannual variability of JJAS PJ index estimated from the 850 hPa geopotential height anomaly based on the ERA5 reanalysis dataset. Strong positive PJ events were identified in 1984, 2004, 2012, 2018 and 2021, which were considered as triggers of the hot summers over Korea–Japan (Du et al., 2022; Kuroda and Setou, 2021; Nitta, 1987). In the following, these positive PJ events were used for composite analysis. Figure 3 shows the atmospheric anomalies in the WNP for composite positive PJ events (the 2012 PJ events were excluded). The 2 m air temperature anomaly clearly shows a meridional dipole pattern, particularly with warming over the MLWNP. This warming pattern extends from Korea to the KOE region with a warming center around north Japan (Figure 3A). Such a dipole pattern is due to the poleward propagations of atmospheric Rossby waves originated from the SCPS (Huang and Sun, 1992; Nitta, 1987; Noh et al., 2021; Xie et al., 2016). Figure 3B shows the wave activity flux vectors to characterize the propagations of atmospheric Rossby waves in the WNP. The direction and magnitude of the vectors represent the waveguide and group velocity of the Rossby waves, respectively. It is evident that the Rossby wave fluxes originate from the tropical WNP and propagate northeastward to the MLWNP. These Rossby waves are triggered by anomalously enhanced convective activities along with increased precipitation over the SCPS (Figures 3C, D). Guided by the southwesterly winds associated with the WNP Subtropical High, these Rossby waves propagate northeastward and profoundly affect the summer climate in the MLWNP. For example, influenced by these poleward Rossby waves, the MLWNP is characterized by high–geopotential (high–pressure) anomalies associated with anomalous anticyclonic circulation (Figure 3B). As a result, the high–pressure systems reduce the total cloud cover and enhance the insolation (Figures 3E, F), thereby leading to anomalous surface warming in this region. These results are consistent with the findings in previous studies (Kubota et al., 2016; Lee et al., 2020; Noh et al., 2023; Yeo et al., 2019).
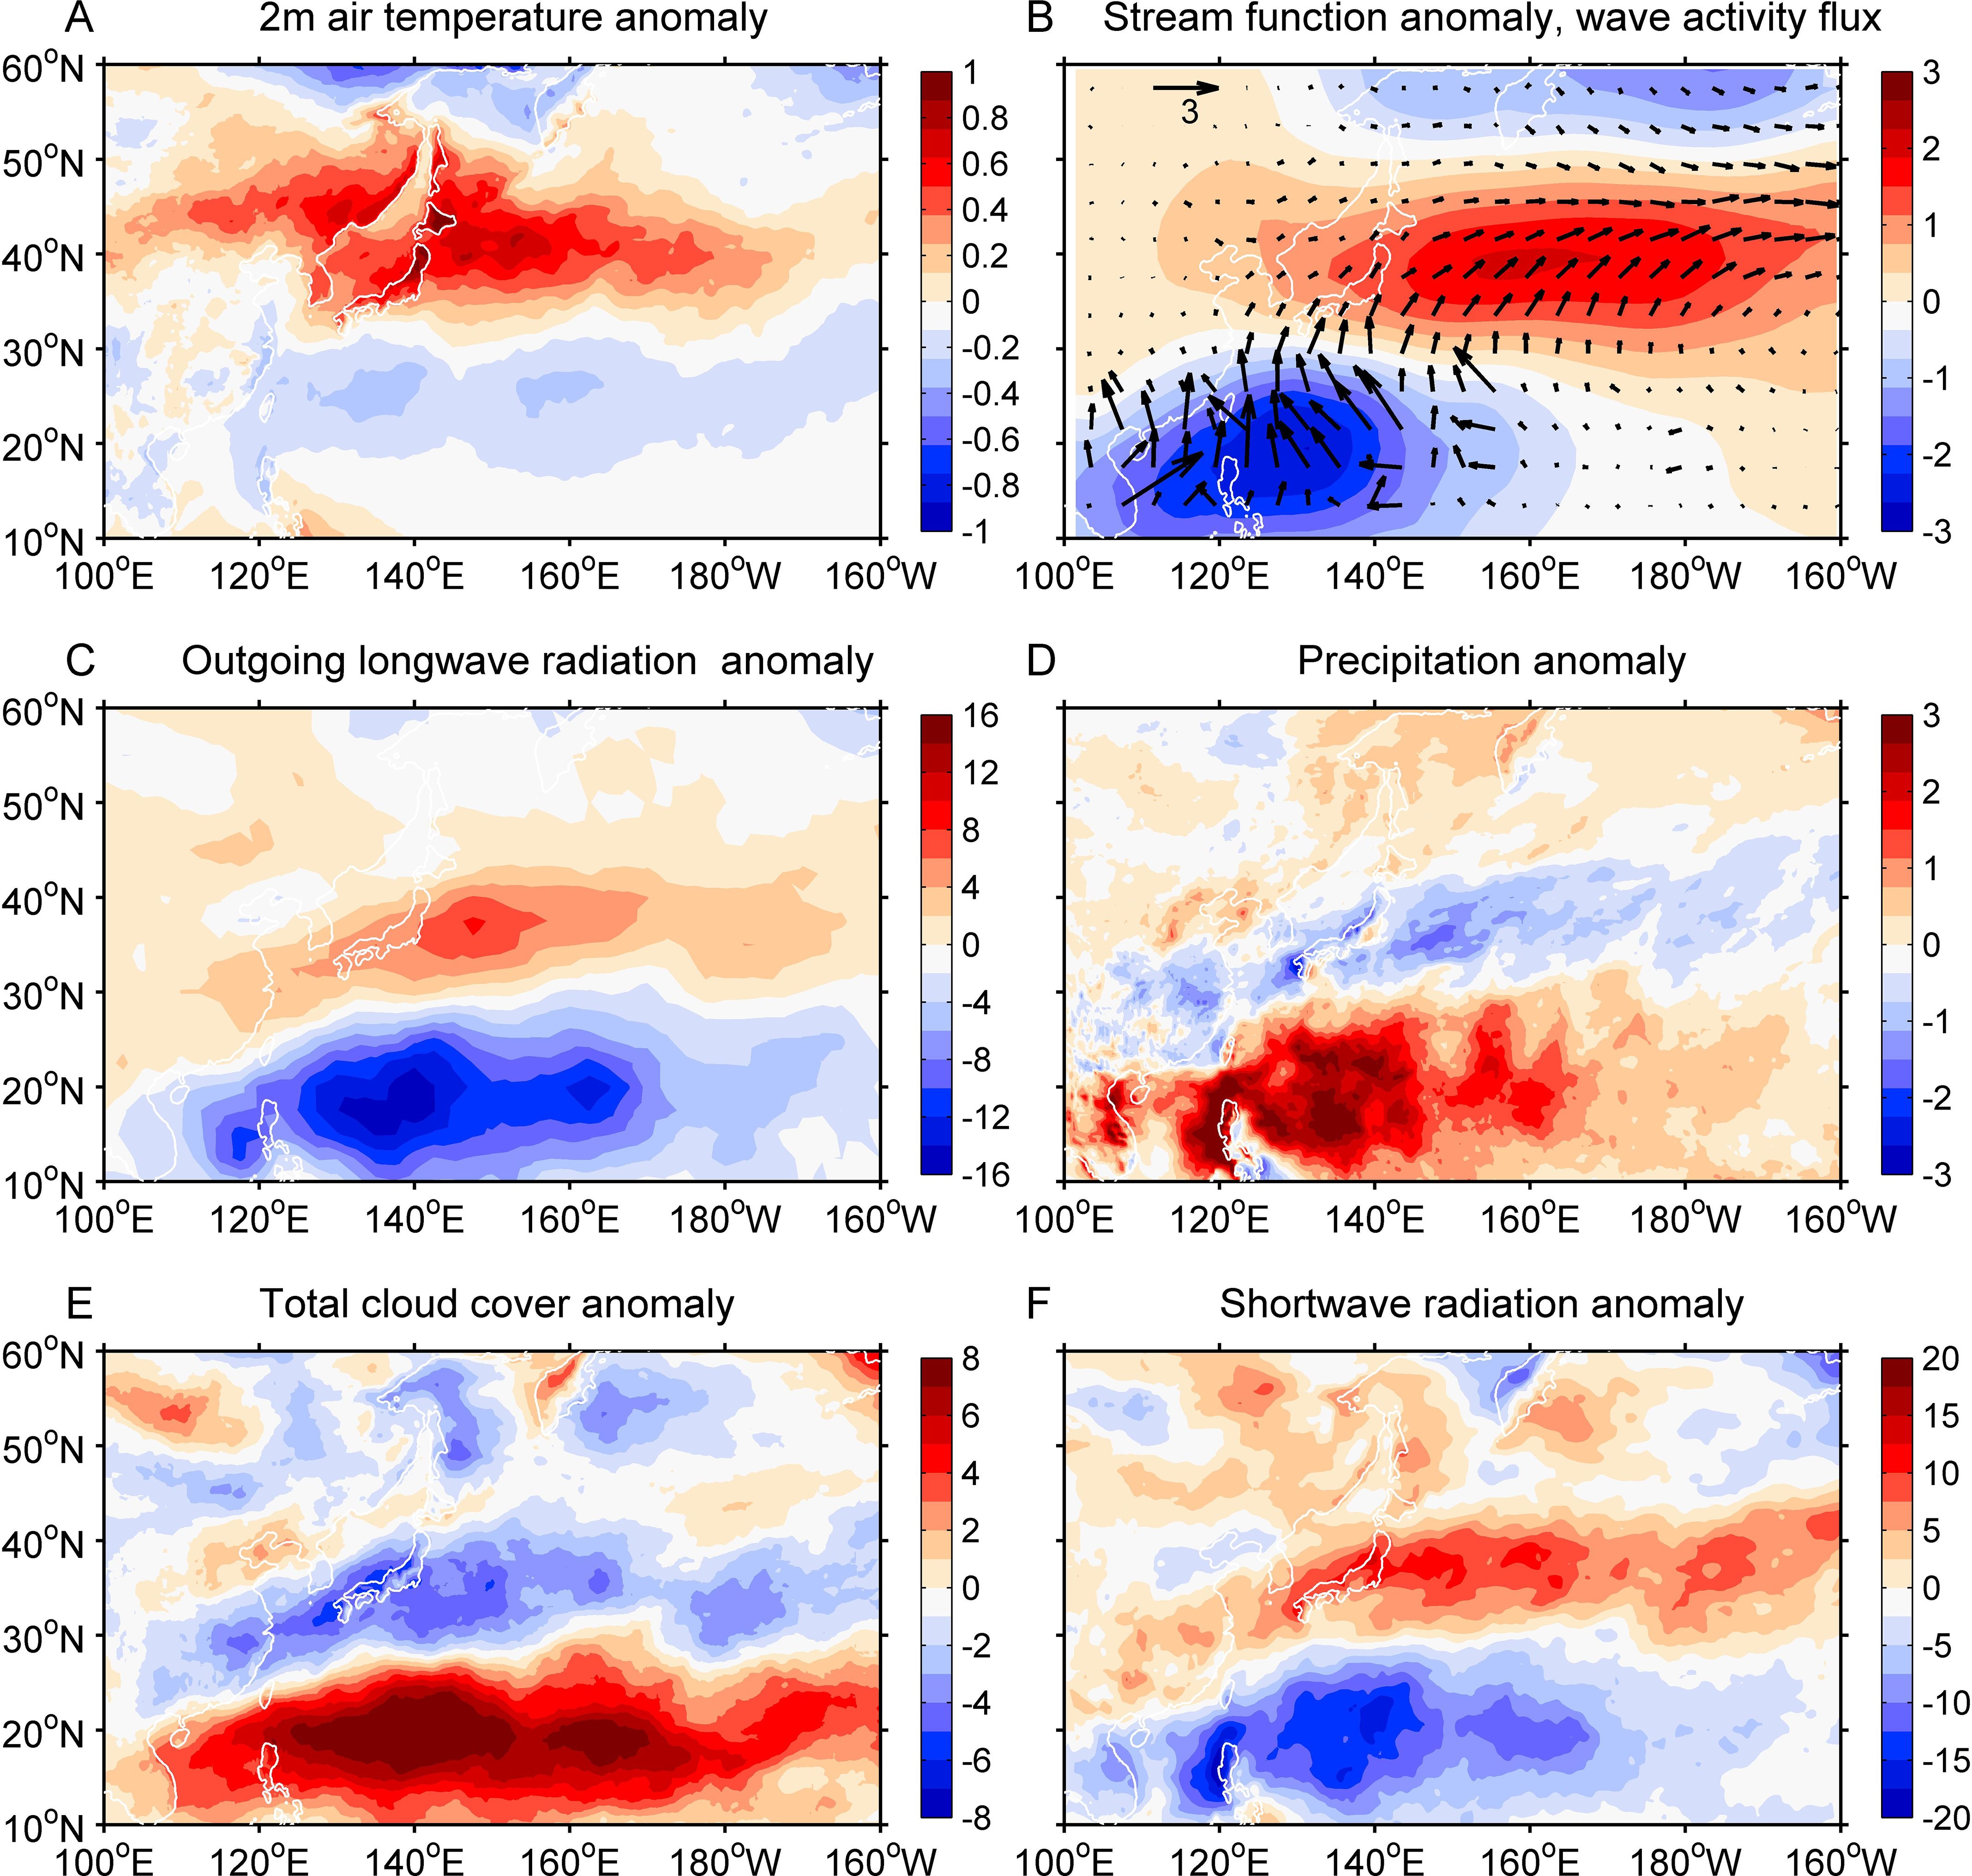
Figure 3. Composite of atmospheric anomalies for 34 positive PJ events during 1983–2022. (A) 2 m air temperature (°C), (B) 850 hPa stream function (106 m2 s-1), (C) outgoing longwave radiation (W/m2), (D) precipitation (mm/month), (E) total cloud cover (%) and (F) shortwave radiation (W/m2). In Panel B, the vectors represent the 850 hPa wave activity flux (m2 s-2) to characterize the meridional atmospheric Rossby waves originated from the SCPS.
3.3 Atmospheric teleconnection in the WNP during 2012 summer
3.3.1 Two meridional Rossby wave trains and their impacts on atmospheric conditions
Figure 4 shows the 850 hPa stream function anomaly and the estimated wave activity flux in the WNP to characterize the propagations of atmospheric Rossby waves during JAS of 2012. It was clearly that one Rossby wave train originated from the SCPS and propagated to Korea–Japan, which was consistent with that in the composite positive PJ events. On the other hand, another Rossby wave train originated from the western–to–central subtropical Pacific and propagated to the KOE region. This Rossby wave train was different from that in the composite positive PJ events (Figure 3B). Moreover, we found that these two meridional Rossby wave trains converged over the downstream of the KOE region, contributing to high–geopotential (high–pressure) anomalies over the MLWNP. In the following, we examined how the blocking high–pressure systems affected the atmospheric conditions in the MLWNP during the summer of 2012.
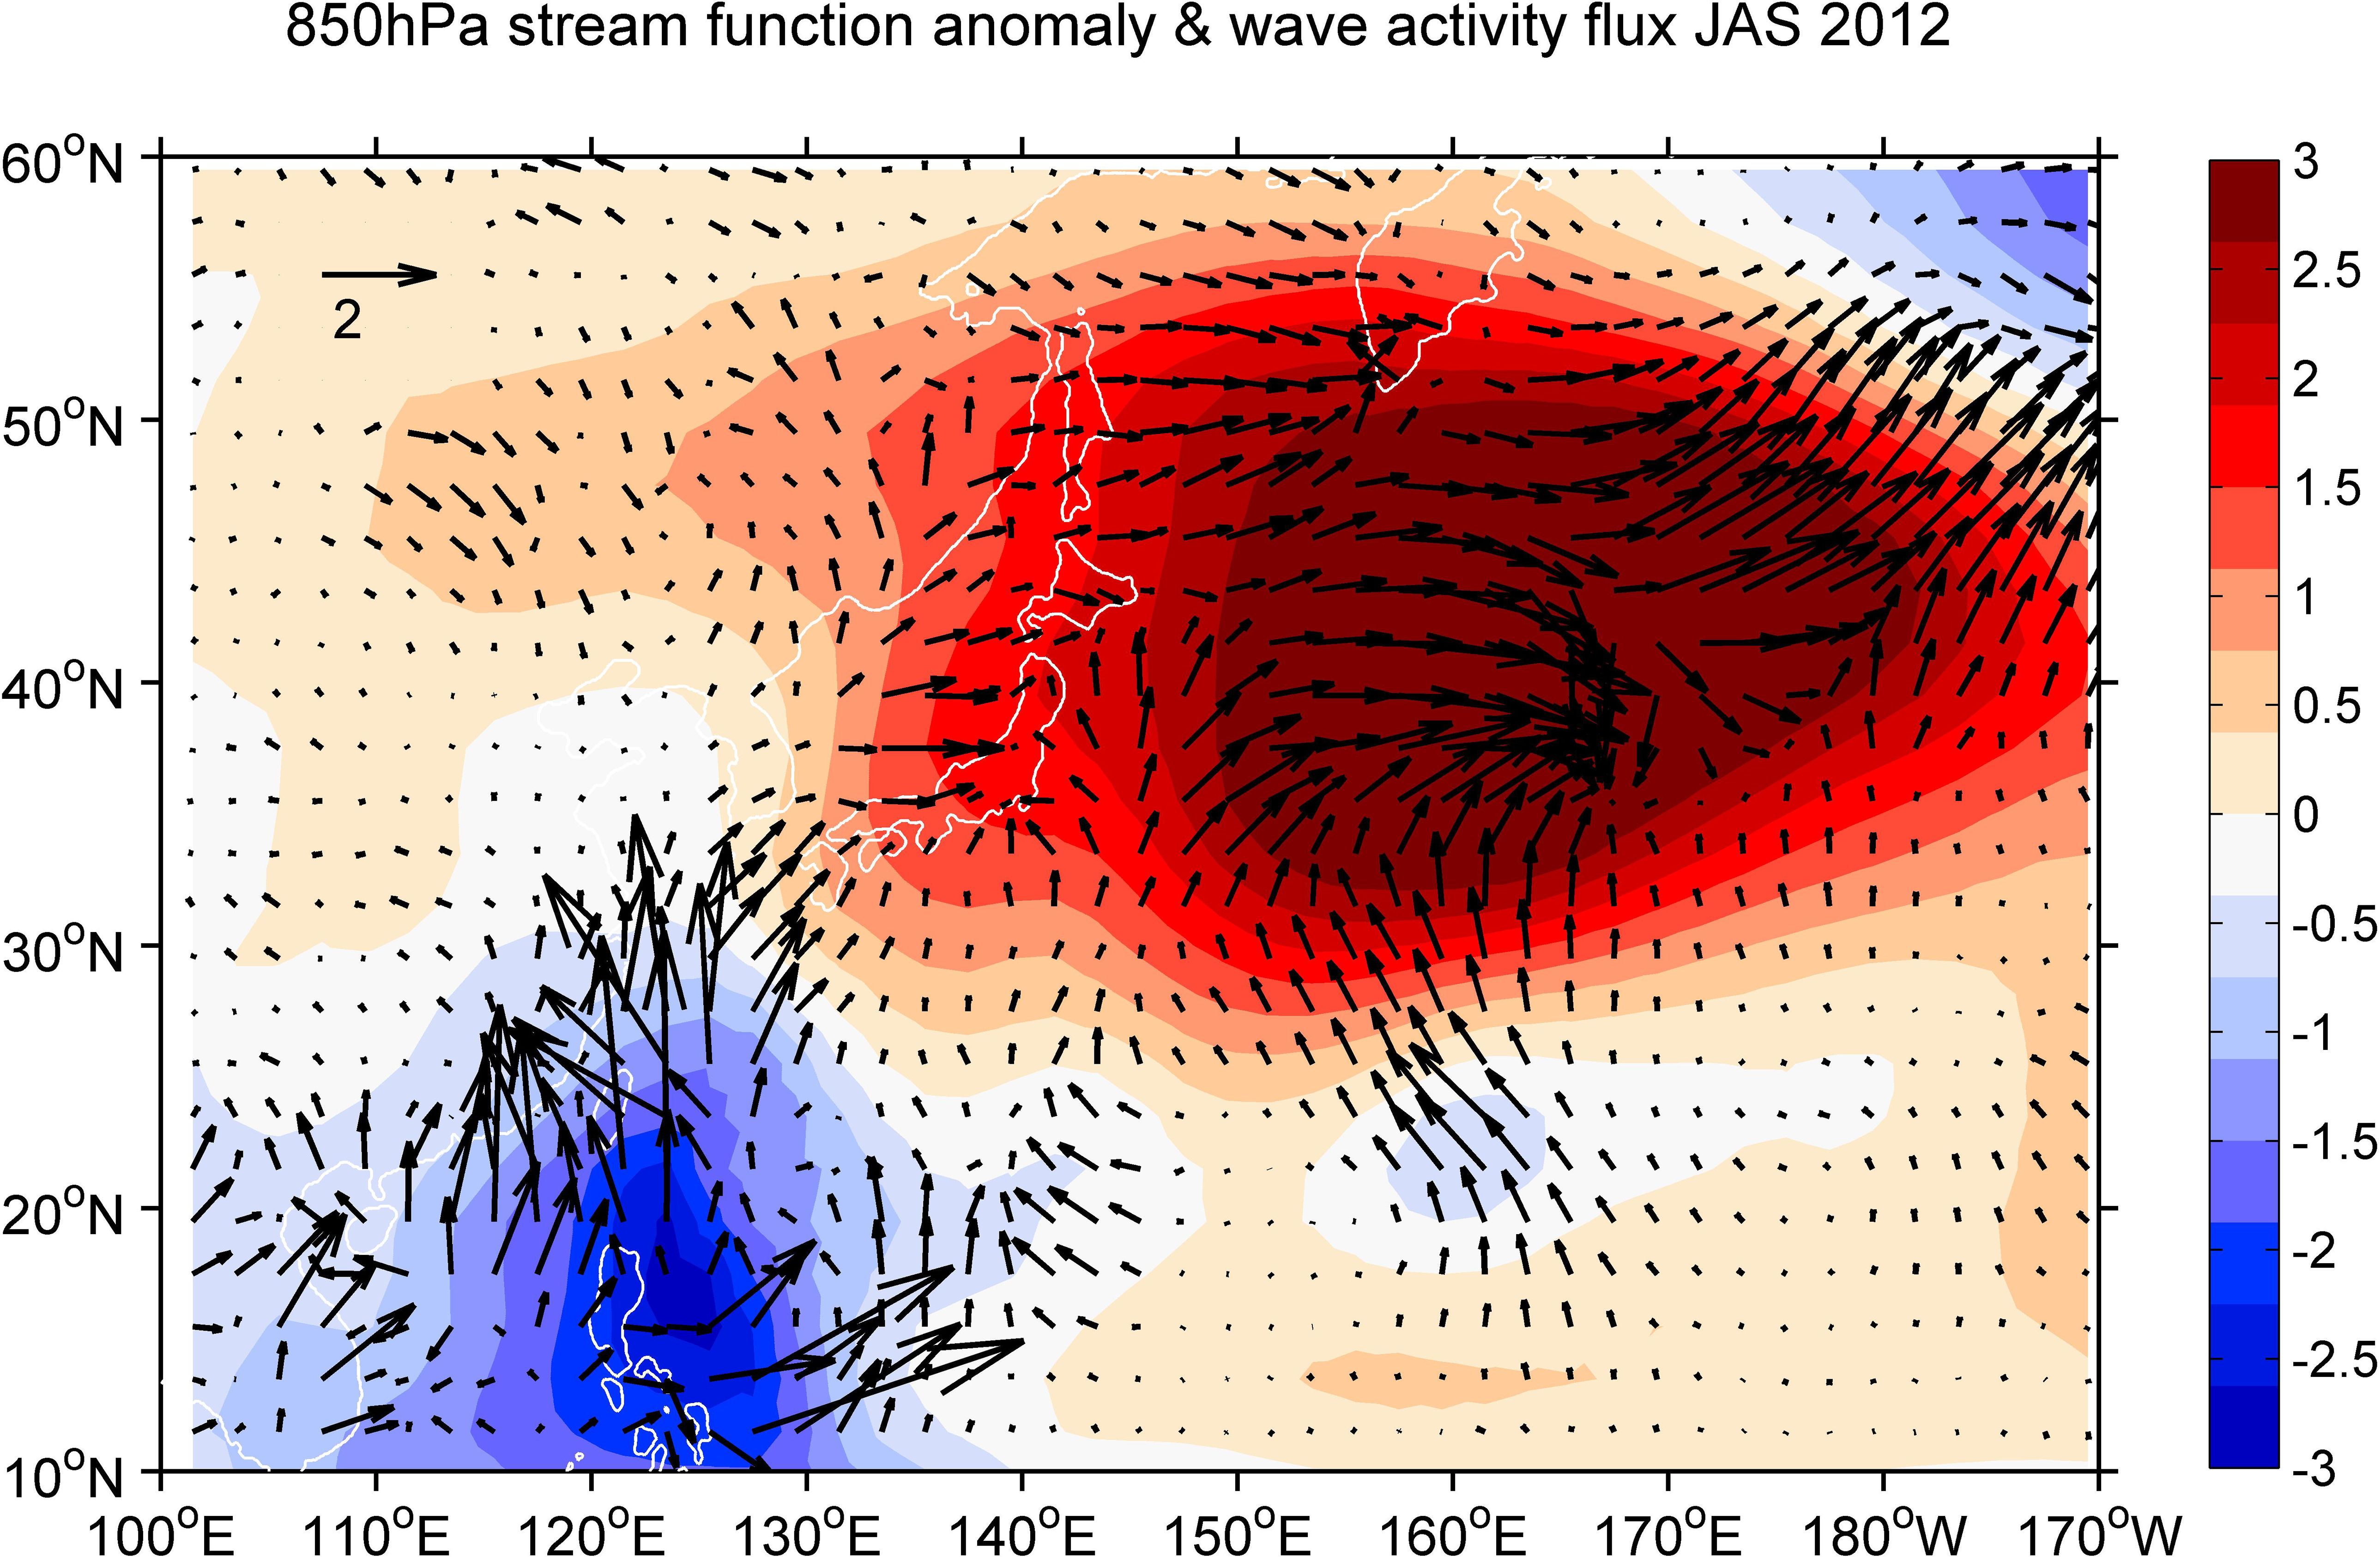
Figure 4. Two meridional atmospheric Rossby wave trains in the WNP during JAS of 2012: 850 hPa stream function anomaly (color, 106 m2 s-1) overlapped with the estimated wave activity flux (vector, m2 s-2).
We primarily focused on how the atmospheric conditions triggered the extreme sea surface warming in the MLWNP during the summer of 2012. Therefore, the central North Pacific was not concerned in this section although prominent features were also noted in this region. Figure 5 shows the anomalies of atmospheric variables (total cloud cover, 10 m wind speed and surface heat fluxes) in the WNP during JAS of 2012. It clearly showed that negative total cloud cover anomalies occurred in the MLWNP, and positive total cloud cover anomalies occurred over the SCPS (Figure 5A). These features were consistent with those in the composite positive PJ events (Figure 3E). The 10 m wind speed showed negative anomalies in the MLWNP and positive anomalies in the SCPS as well as the western–to–central subtropical Pacific (Figure 5B). This indicated that the surface wind speed was weakened in the MLWNP. From an overall view, the shortwave radiation and latent heat flux anomalies had much larger magnitudes than the longwave radiation and sensible heat flux anomalies in the WNP (Figures 5C–F). This suggested that the longwave radiation and sensible heat flux anomalies can roughly be omitted in the following analysis. The shortwave radiation anomaly showed a similar pattern as that of the total cloud cover anomaly: positive shortwave radiation anomalies were recognized over the band of 30–40°N in the MLWNP and negative shortwave radiation anomalies occurred over the SCPS (Figure 5C). This indicated that the reduced total cloud cover contributed to enhanced insolation into the MLWNP. The upward latent heat flux showed negative anomalies (< –20 W/m2) in the MLWNP, indicating less heat loss from the ocean to the air. The decreased latent heat flux was due to the weakened wind speed and drier air conditions in this region. As shown below, the enhanced shortwave radiation and reduced latent heat flux led to increased net heat flux in the MLWNP.
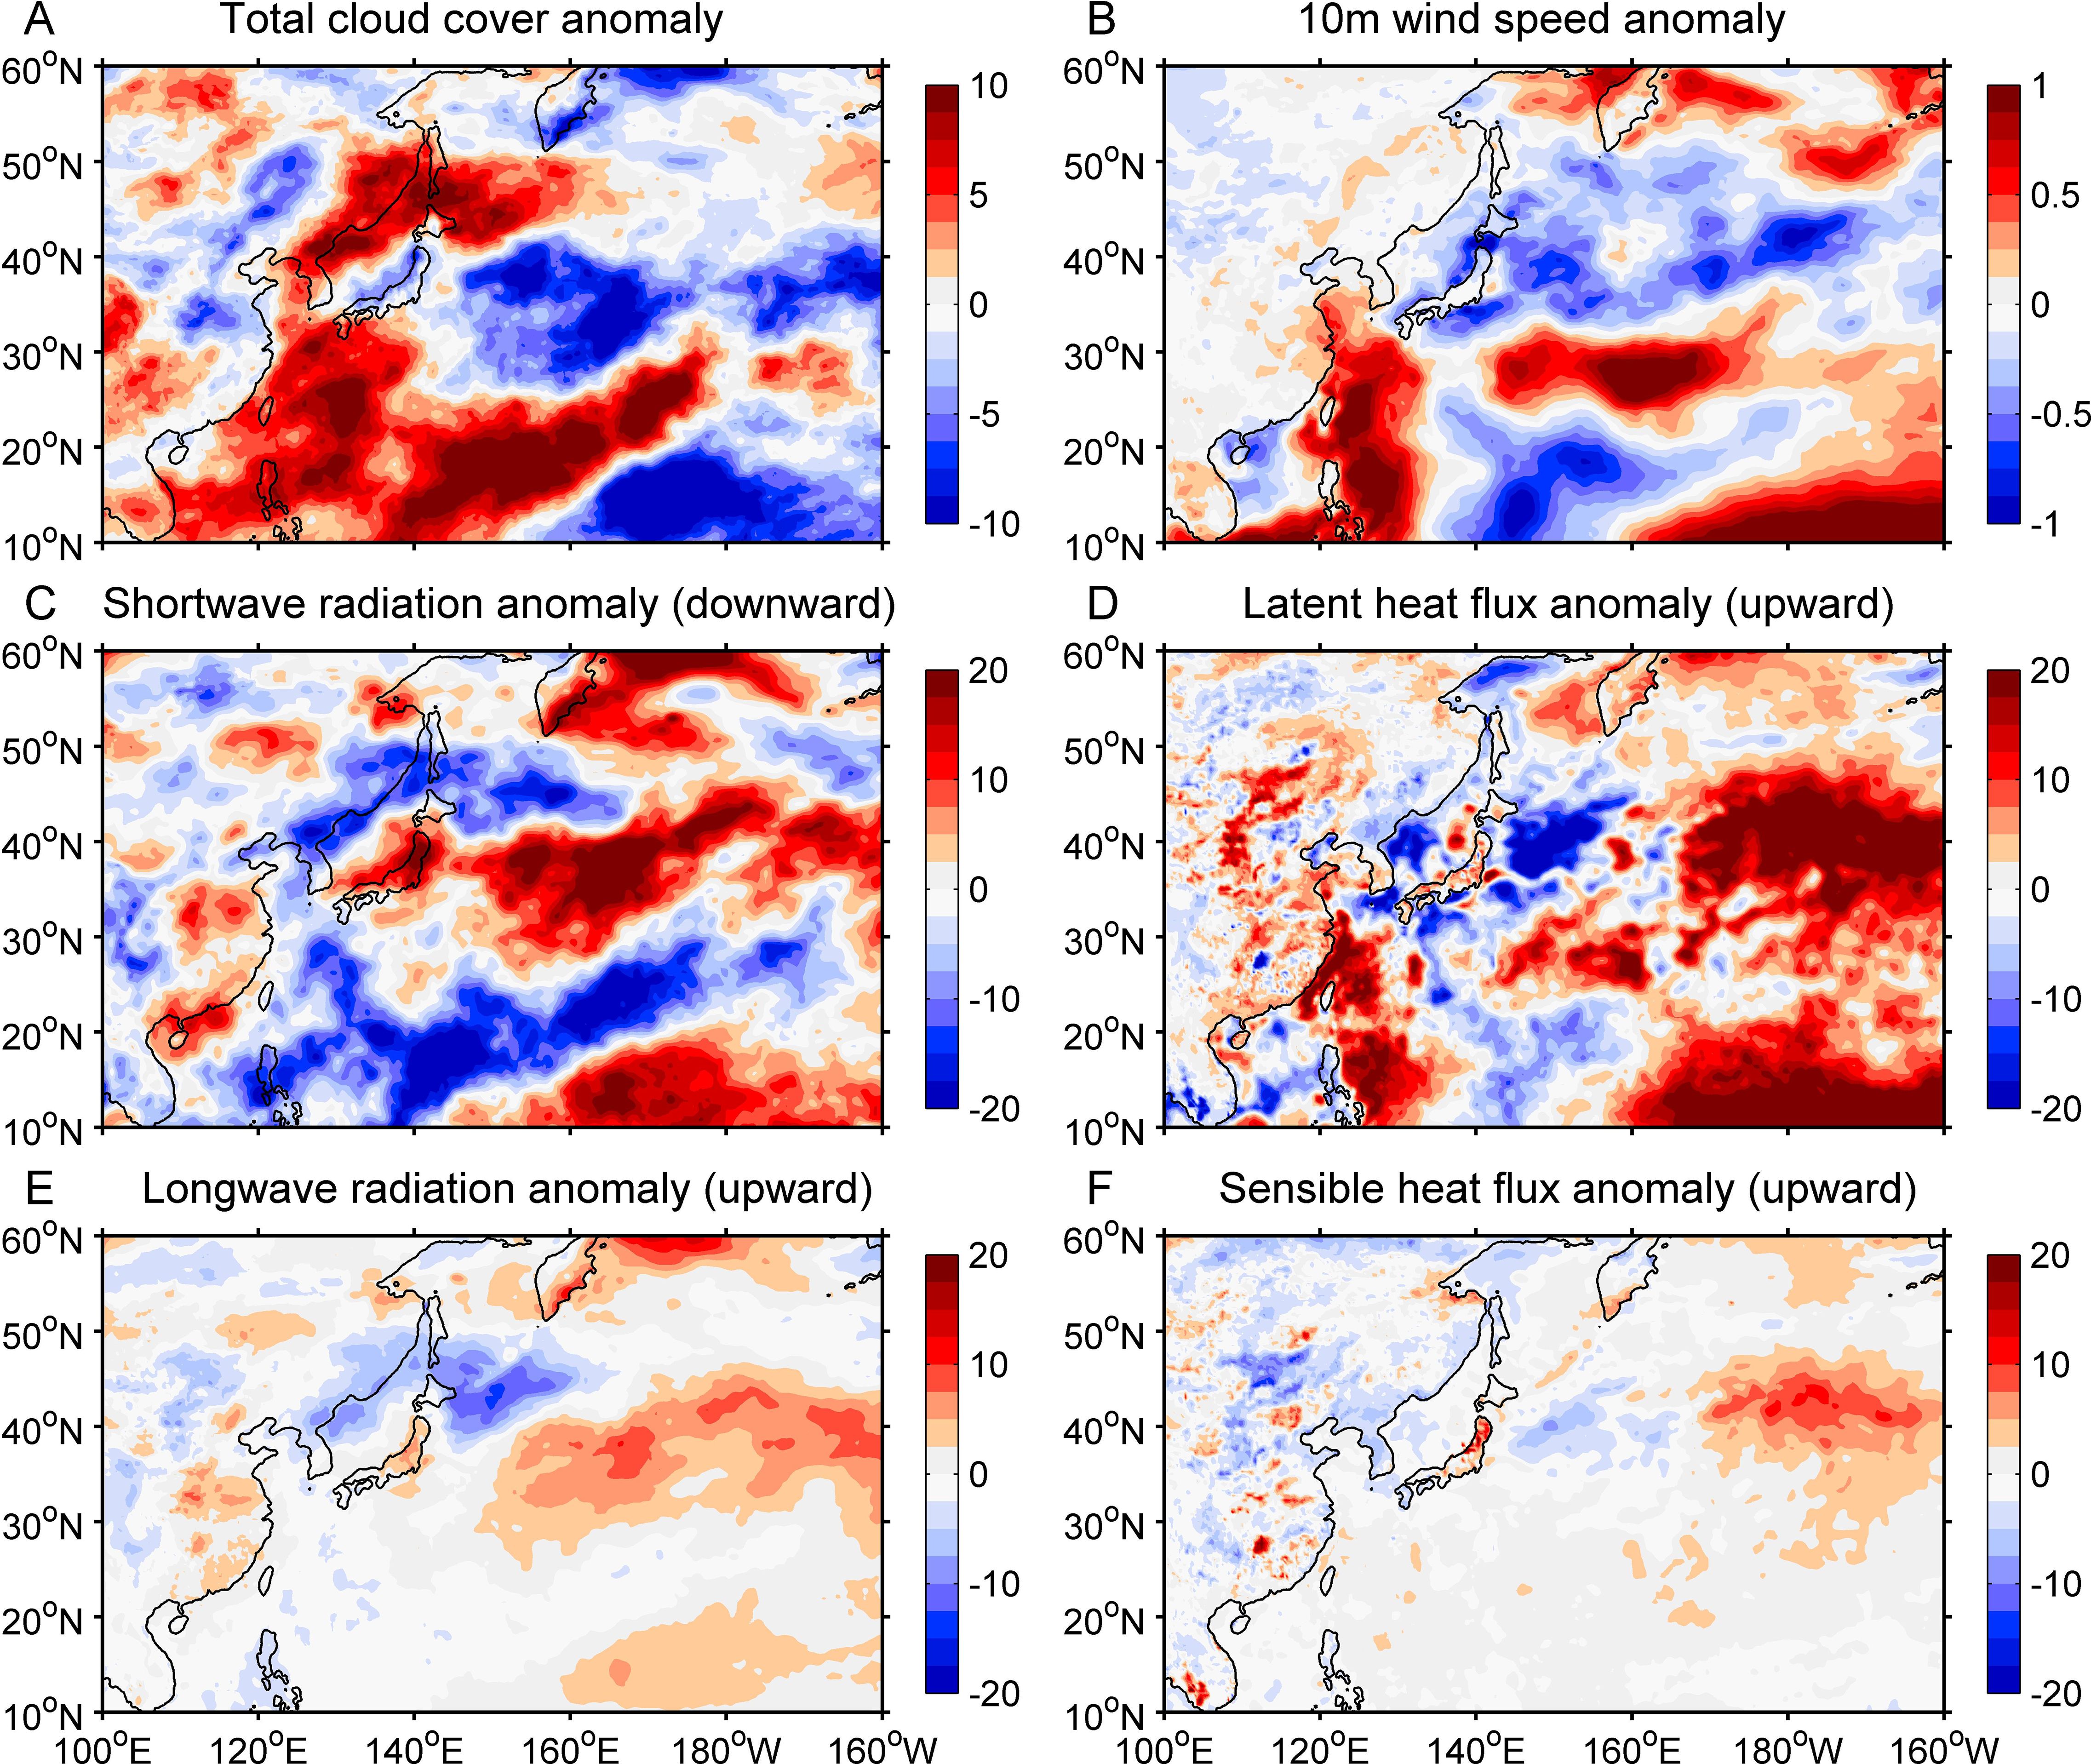
Figure 5. Anomalies of total cloud cover (A, %), 10 m wind speed (B, m/s), shortwave radiation (C), latent heat flux (D), longwave radiation (E), sensible heat flux (F) averaged during JAS of 2012. The unit of heat flux is W/m2.
3.3.2 Mixed layer heat budget during JAS of 2012
Figure 6A shows the SSTA averaged during JAS of 2012 based on the Argo data (2005–2020). It showed good agreements between the SSTA of Argo and OISST datasets in terms of the spatial pattern and magnitude (Figures 1A, 6A). In particular, the Argo data can well reproduce the extreme sea surface warming in the KOE region. We estimated the mixed layer depth H as well as the anomaly using the three-dimensional Argo temperature and salinity, and derived the mixed layer temperature anomaly (Figure 6B). As shown in Equation 1, positive can be contributed by increased net heat flux (positive ) and shoaling of mixed layer depth (negative ). The mixed layer depth anomaly averaged during JAS of 2012 clearly showed negative values in the KOE region (Figure 6C), suggesting shoaling of the mixed layer depth. In addition, the net heat flux anomaly showed positive values (> 30 W/m2) in the KOE region and negative values in the central North Pacific (Figure 6D). In the following, we estimated the mixed layer heat budget terms to examine the dominant processes responsible for the extreme warming in the MLWNP during the summer of 2012.
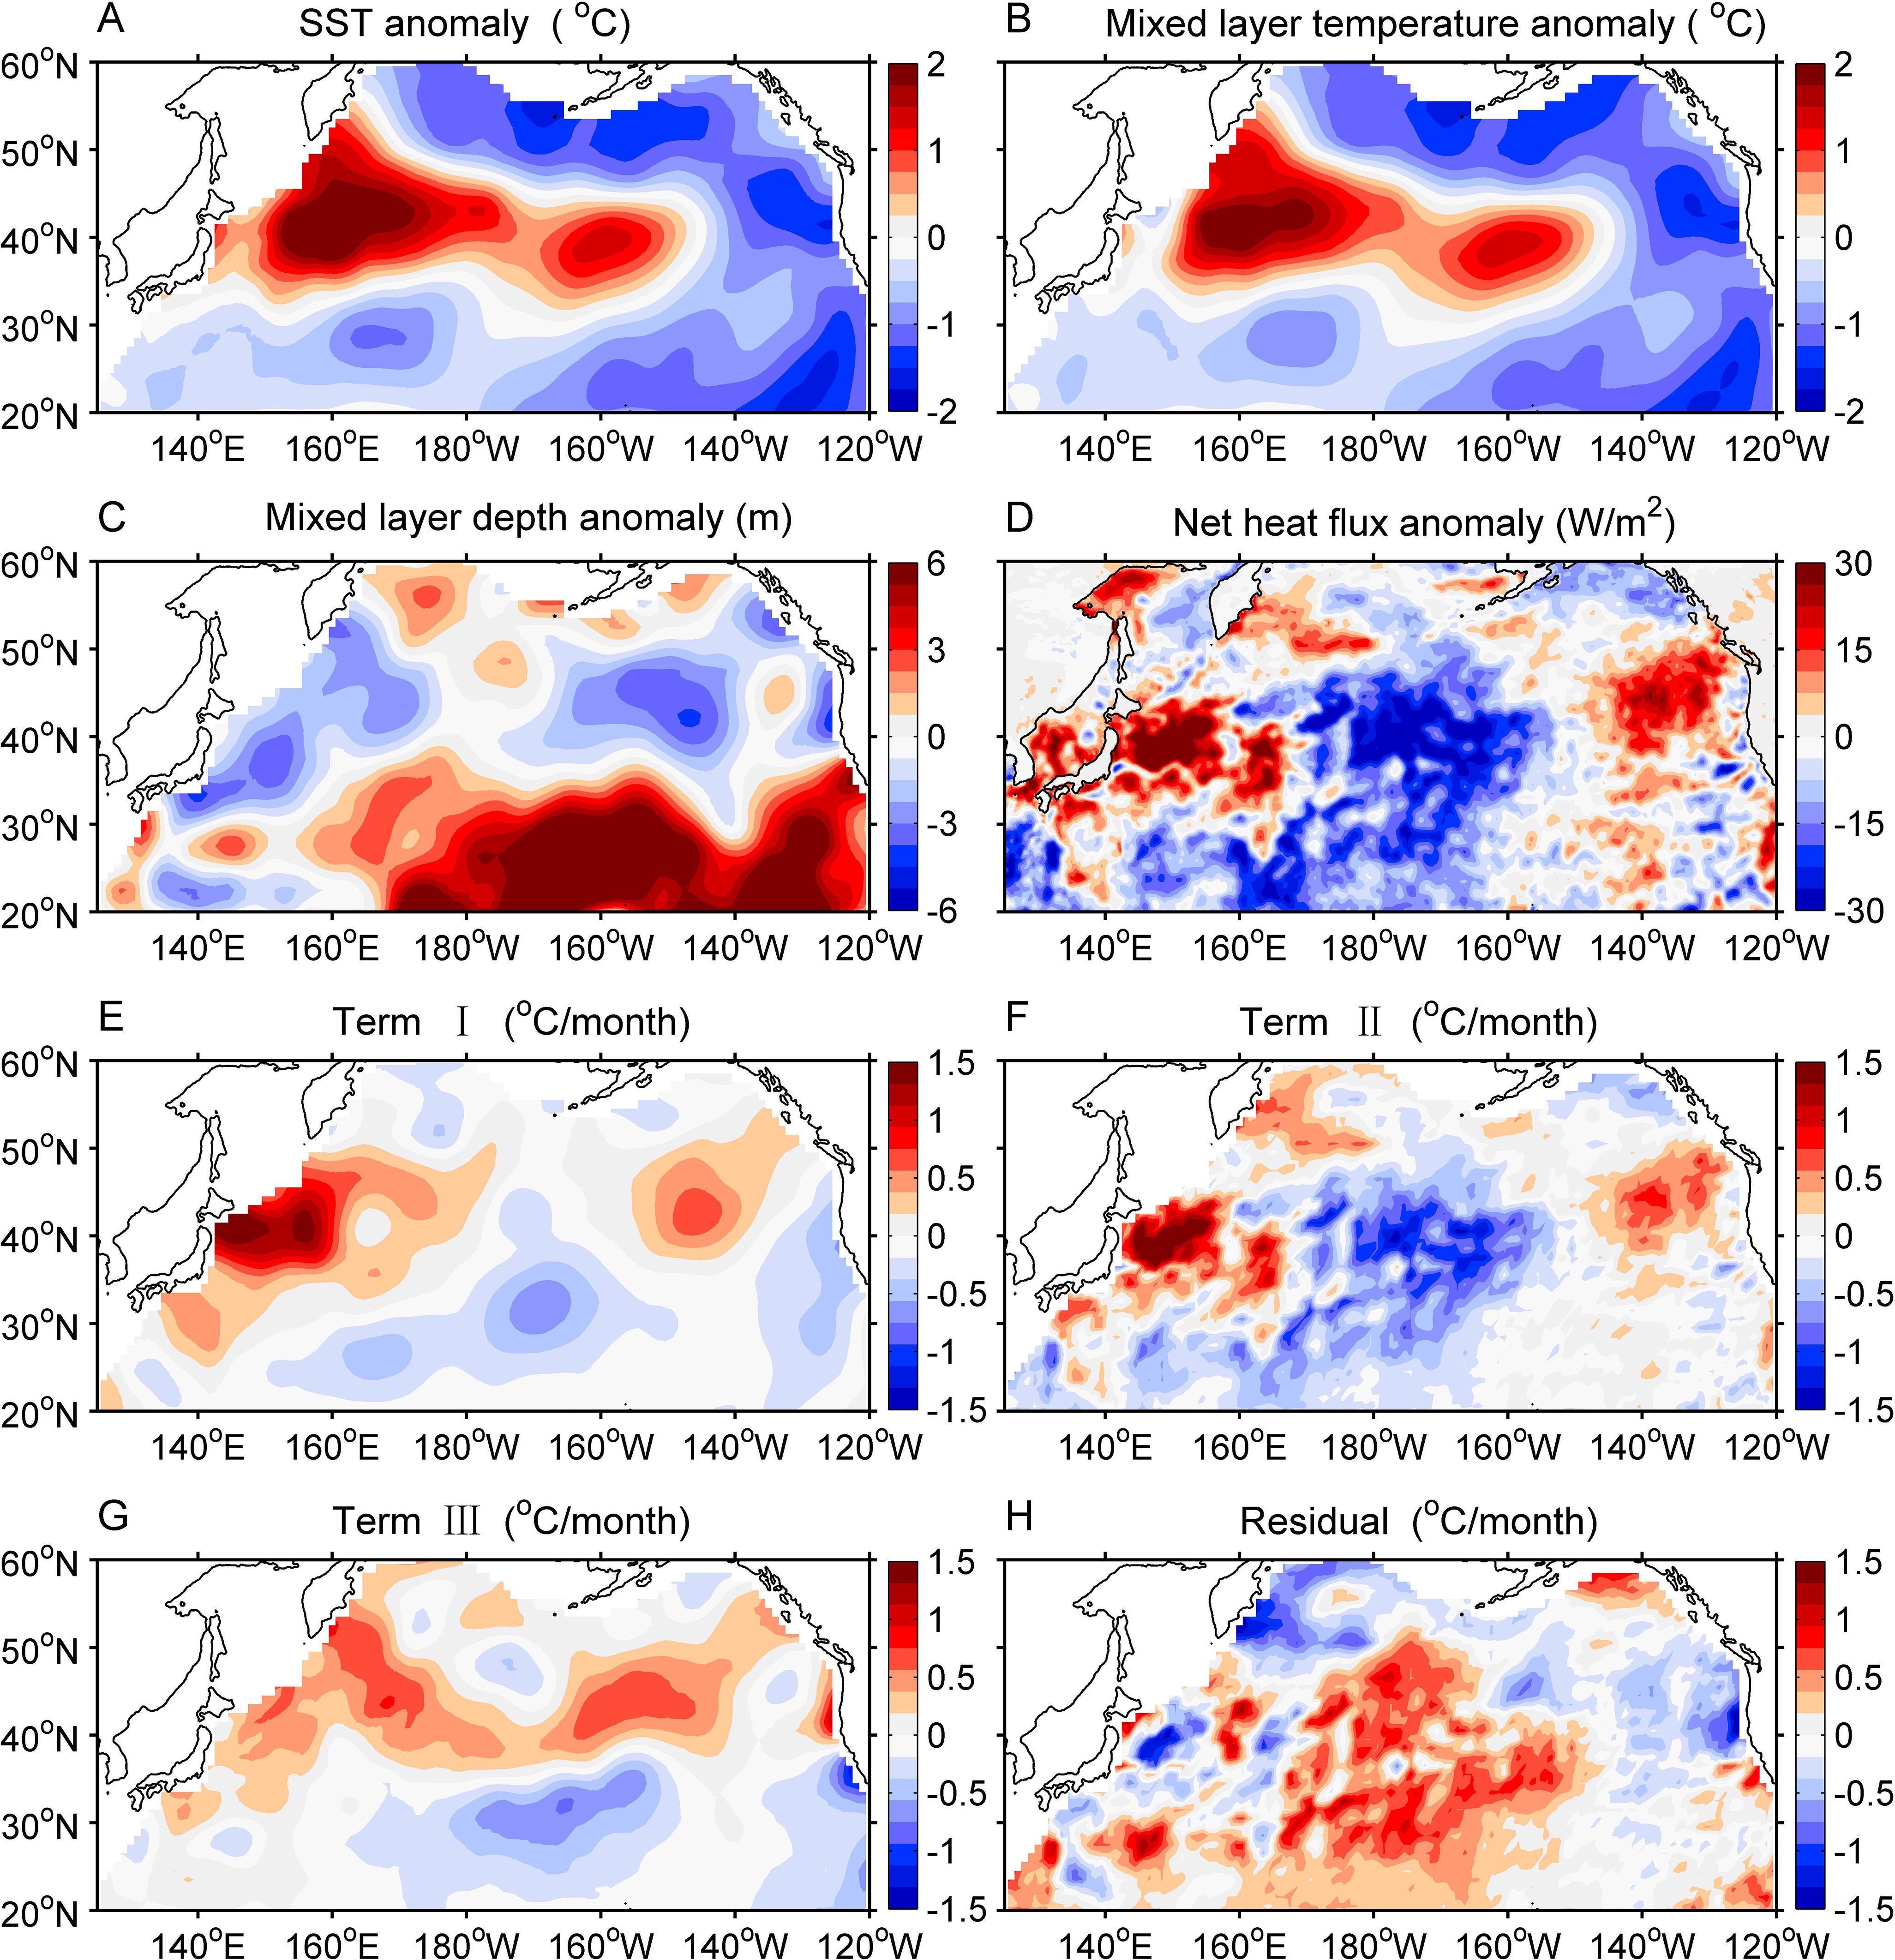
Figure 6. (A–D) Anomalies of SST, mixed layer temperature, mixed layer depth, and net heat flux. (E–H) Four terms in the mixed layer heat budget Equation 1. All spatial patterns were averaged during JAS of 2012.
The showed positive values (> 1.5°C/month) in the KOE region and negative values (< –0.5°C/month) in the central North Pacific (Figure 6E), suggesting warming and cooling in the two regions, respectively. Term II showed a very similar pattern as the net heat flux anomaly (Figures 6D, F): positive values occurred in the KOE region, and negative values occurred in the central North Pacific. This strongly reflected that increased (decreased) net heat flux contributed to anomalous warming (cooling) over a shallow mixed layer depth in the two regions, respectively. In contrast, term III showed a similar pattern as the mixed layer depth anomaly (Figures 6C, G): positive values extended from the KOE region to northeast Pacific, and negative values occurred in the central subtropical Pacific. This indicated that shoaling (deepening) of mixed layer depth also contributed to anomalous warming (cooling) in these regions. We now focused on the spatial patterns of term I, term II and term III in the MLWNP to quantify the roles of and in forming the anomalous warming during the summer of 2012. In the upstream of the KOE region, the increased net heat flux (positive ) and shoaling of mixed layer depth (negative ) contributed to significant mixed layer warming tendency ( > 0). In the downstream of the KOE, the negative cooled the mixed layer temperature anomaly, while was positive in this region. This reflected the negative contributed to positive that overwhelmed the cooling by negative . Figure 6H shows the spatial pattern of the residual between term I and term II, term III. From an overall view, the residual was small (negative values) in the KOE region and was relatively larger (positive values) in the central North Pacific. This indicated that other processes such as horizontal advection and vertical entrainment also played roles in forming the surface warming during the summer of 2012. Figure 7 shows the temporal evolution of these terms box–averaged over the region of 140–180°E, 35–50°N in 2012. The time series of term II and term III showed consistent temporal variations with term I. The seasonal (January-March, April-June, July-September, October-December) mean residual showed very small values during summer. This indicated the good efficiency of Equation 1 especially when the mean mixed layer is shallow during summer (Amaya et al., 2021).
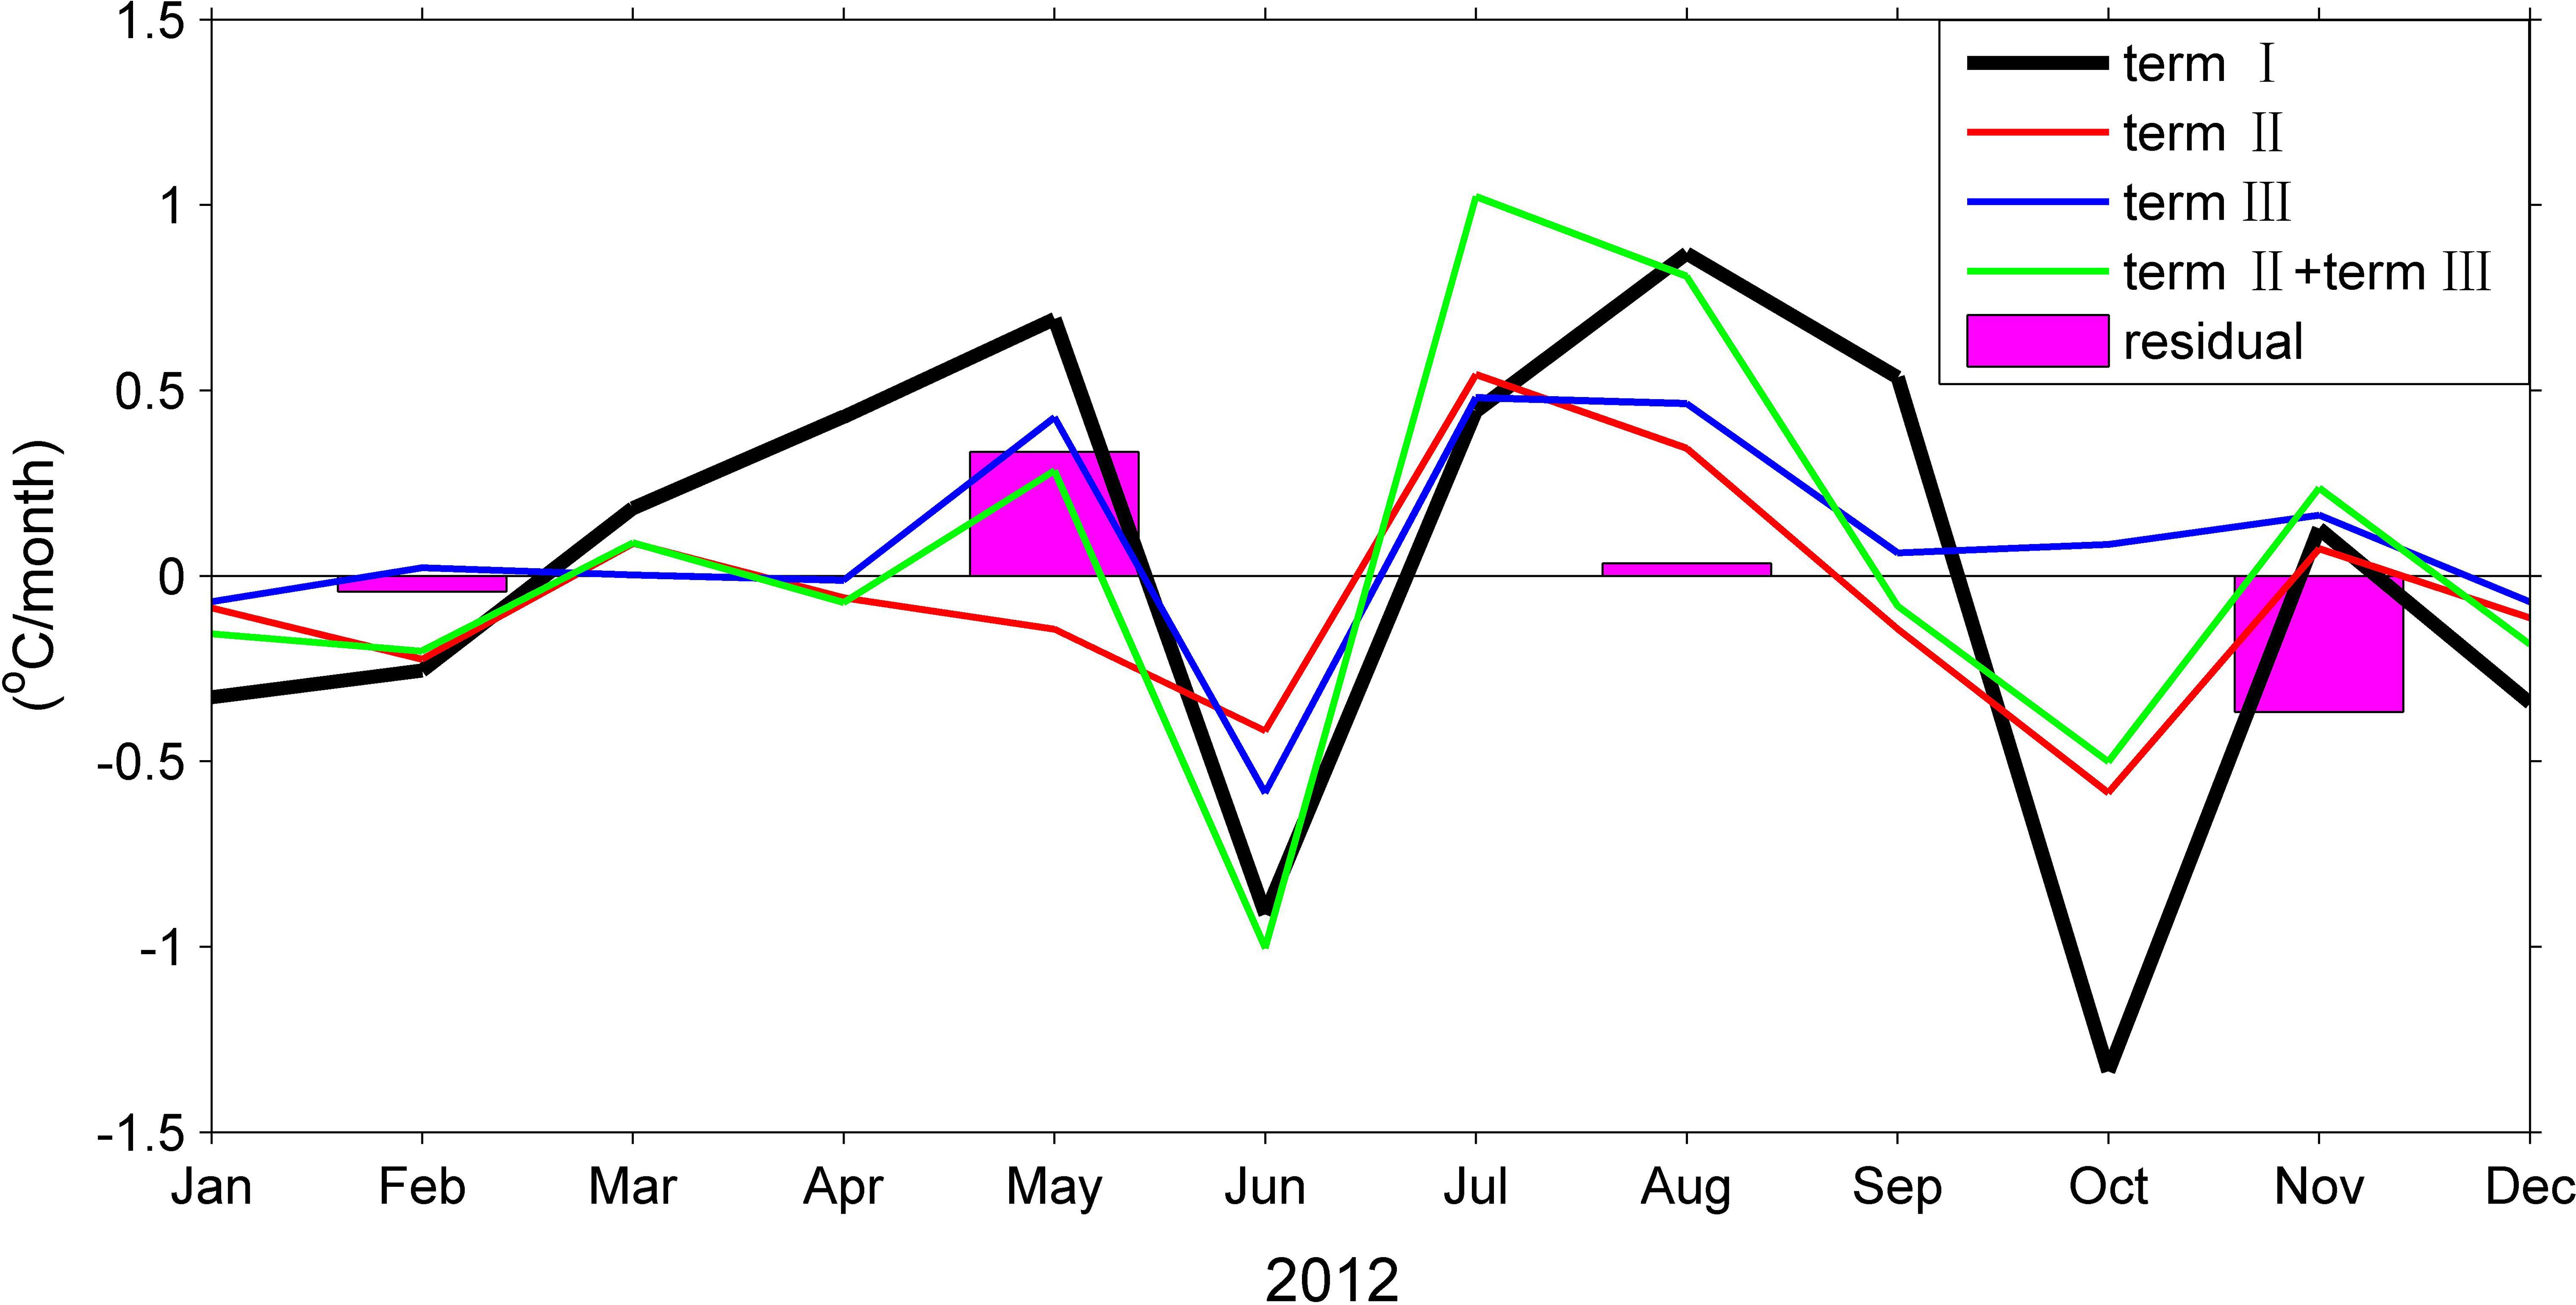
Figure 7. Monthly evolution of the mixed layer heat budget terms (lines) in 2012. All terms were box–averaged over the region of 140–180°E, 35–50°N. The bars represent the seasonal mean (January-March, April-June, July-September, October-December) residual.
3.3.3 Air–sea interactions in the Indo–West Pacific
Previous studies showed that PJ teleconnection associated with meridional atmospheric Rossby waves was triggered by anomalous convection over the western tropical Pacific (Huang and Sun, 1992; Kosaka and Nakamura, 2006; Lee and Lee, 2016; Nitta, 1987; Noh et al., 2023; Wang et al., 2000; Xie et al., 2016). As shown in Li et al. (2024), a strong pIOD event co-occurred with El Niño during the summer of 2012. In the following, we examined the air–sea interactions associated with the combination of the two events in 2012. In the tropical Indian Ocean, positive (negative) OLR (precipitation) anomalies were found over the eastern tropical Indian Ocean and Maritime Continent, and negative (positive) OLR (precipitation) anomalies were recognized over the western tropical Indian Ocean (Figures 8, 9C). This pattern reflected the influences of tropical Indian Ocean Walker Circulation associated with the pIOD 2012 (Figure 10C), which has been confirmed in the study of Li et al. (2024). In the equatorial Pacific, the atmospheric anomalies were complex and can be attributed to the phase transition of ENSO during 2011–2012. From October 2011 to February 2012, the 2011 La Niña induced enhanced Pacific Walker Circulation with an ascending branch over the western equatorial Pacific and a descending branch over the central equatorial Pacific (Figure 10A). Consequently, above normal precipitation (enhanced convection) was found over the Maritime Continent and western equatorial Pacific, and below normal precipitation (suppressed convection) was recognized over the central equatorial Pacific (Figure 9A). In the following months, the La Niña transited to El Niño and the Pacific Walker Circulation varied accordingly (Figures 9B, 10B).
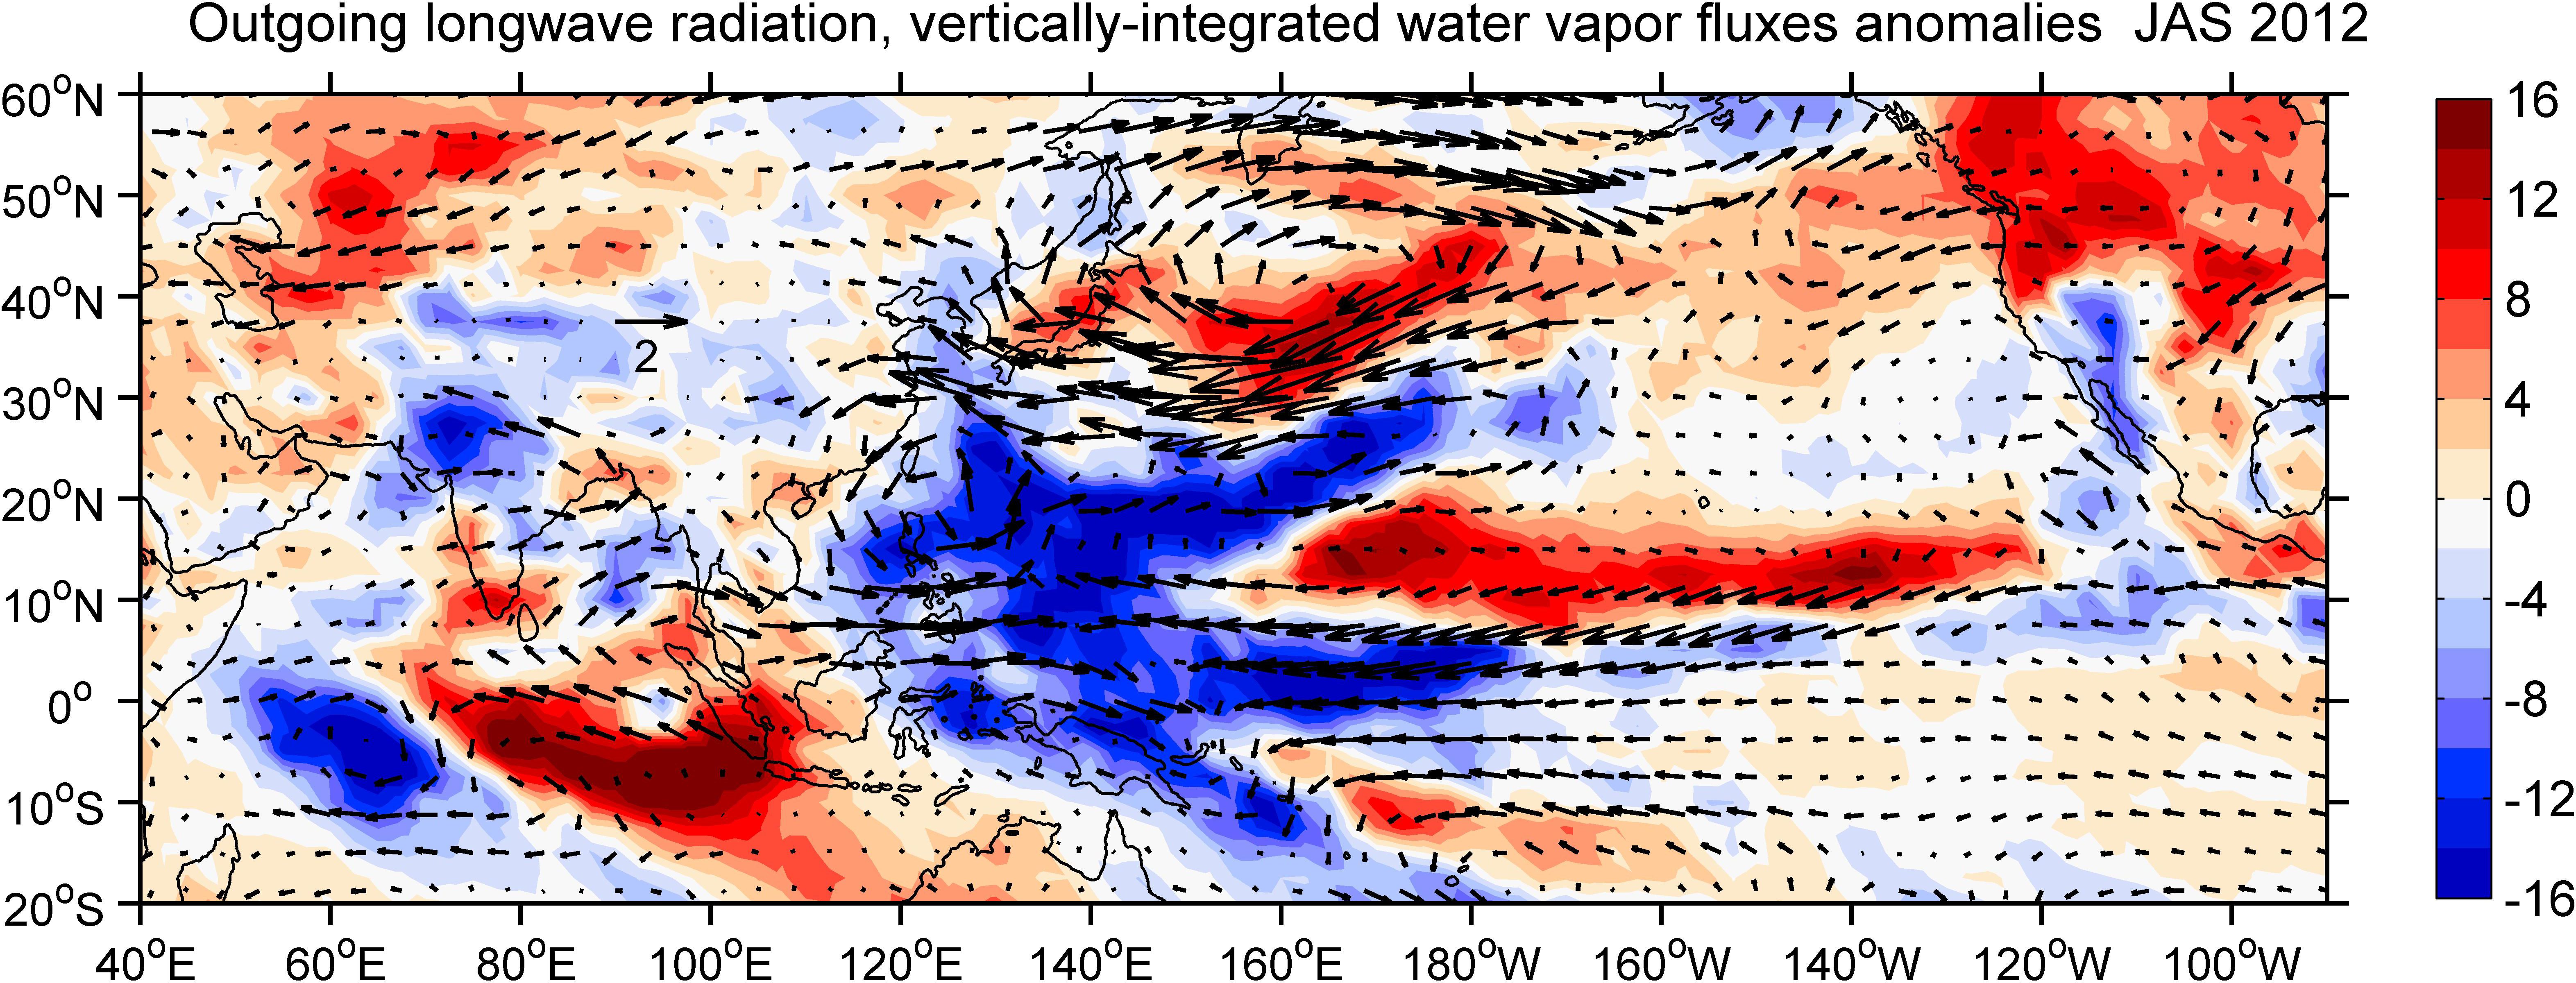
Figure 8. Anomalies of outgoing longwave radiation (color, W/m2) and vertically–integrated water vapor fluxes (vectors, 106 m2 s-1) during JAS of 2012.
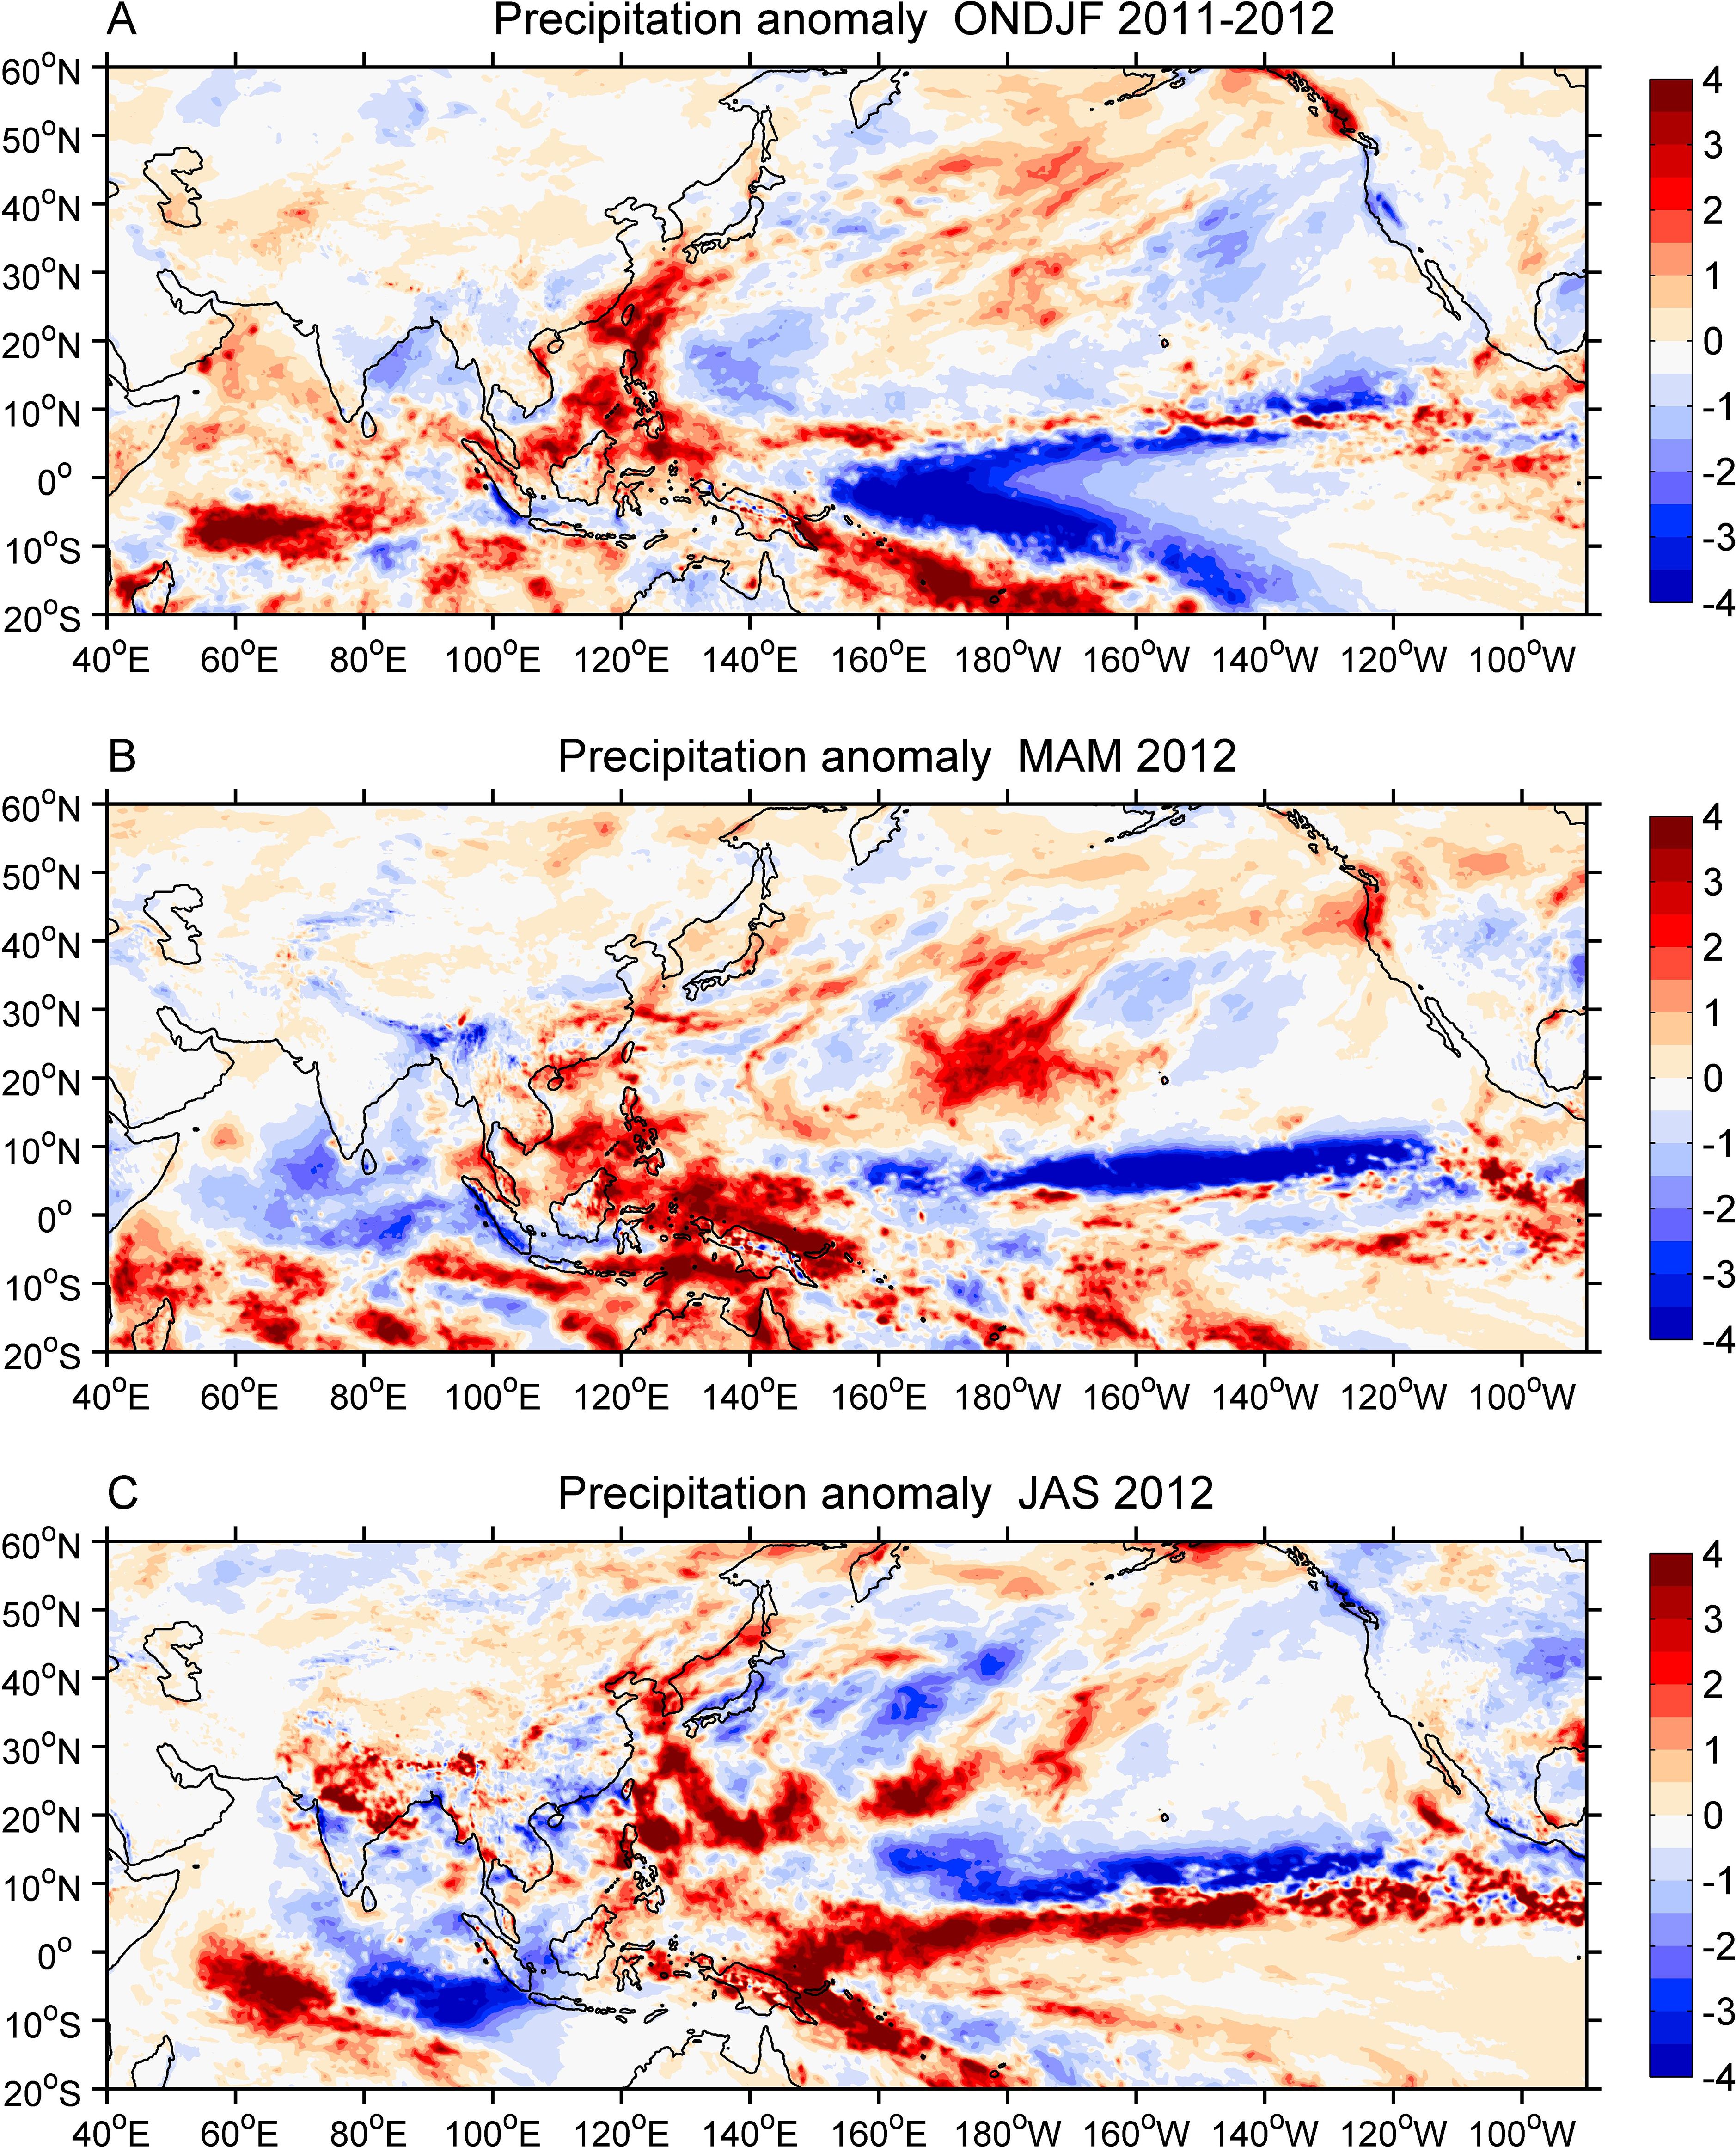
Figure 9. Anomalies of precipitation (mm/month) for (A) ONDJF 2011–2012, (B) MAM, and (C) JAS of 2012. ONDJF 2011–2012: October 2011 to February 2012, MAM: March–May, JAS: July–September.
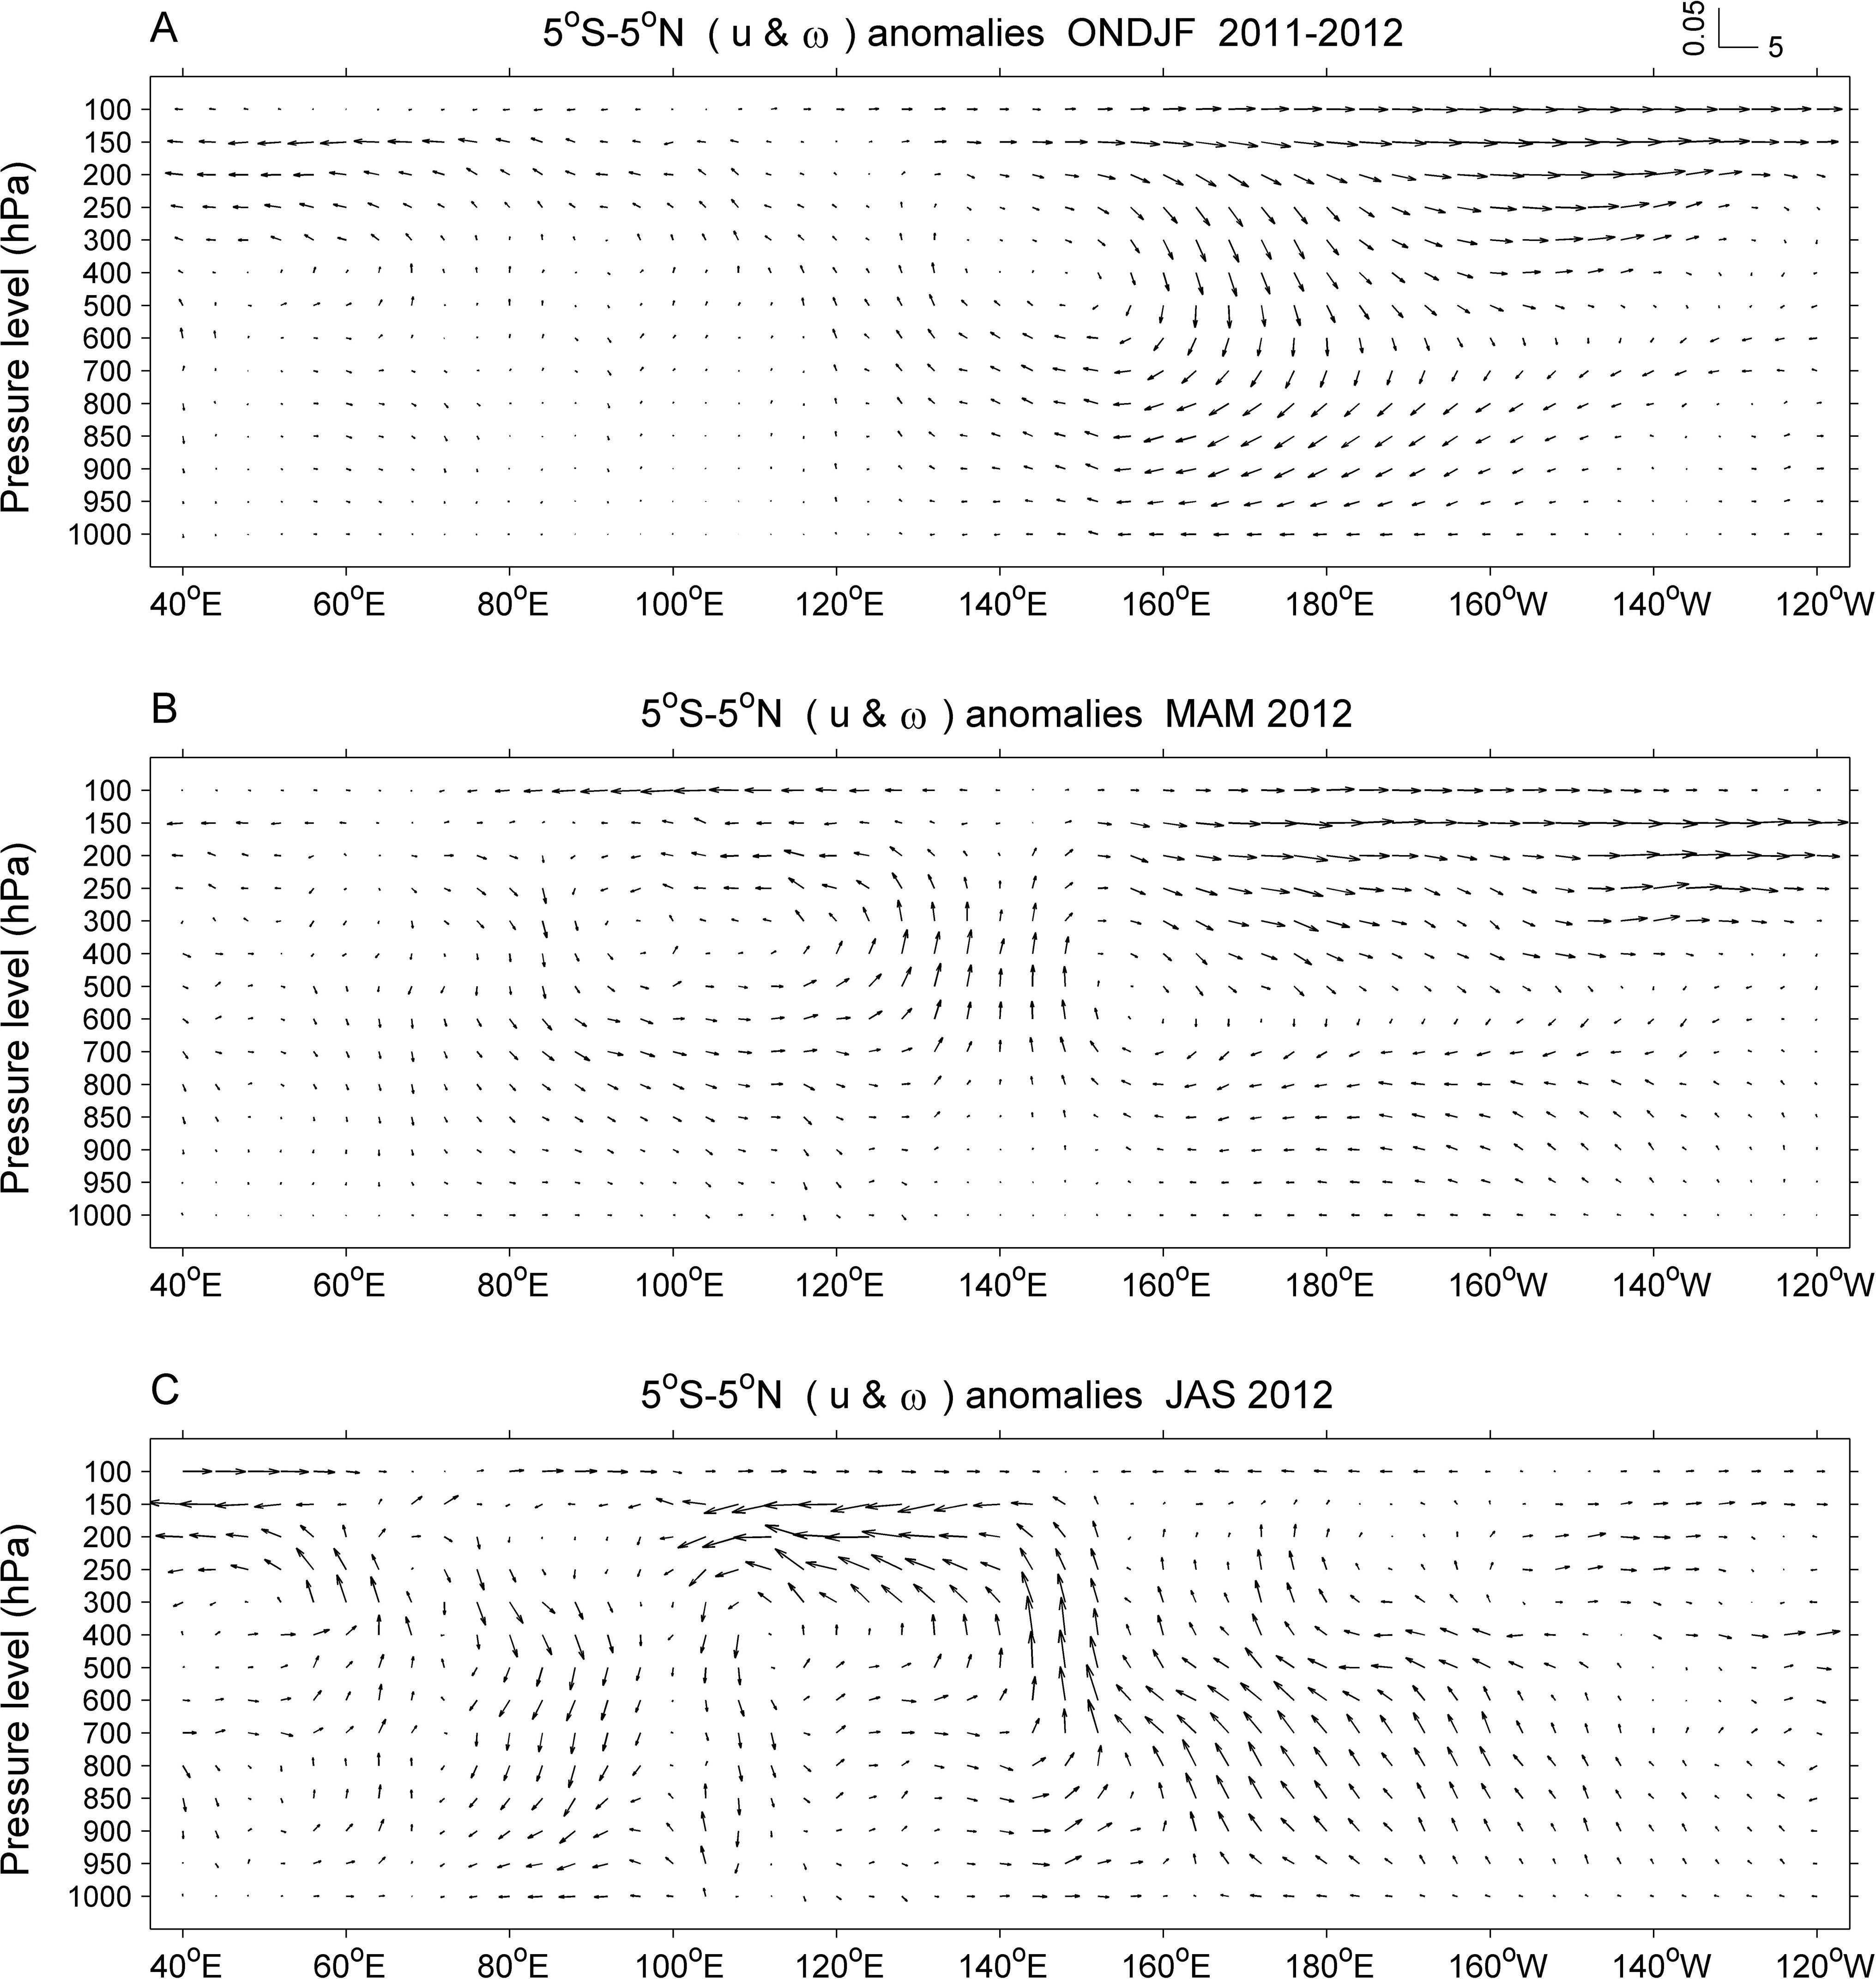
Figure 10. Longitude–pressure anomalies of zonal wind (m/s) and vertical pressure velocity (omega, Pa/s) averaged between 5°S–5°N for (A) ONDJF 2011–2012, (B) MAM, and (C) JAS of 2012. ONDJF 2011–2012: October 2011 to February 2012, MAM: March–May, JAS: July–September.
During the summer of 2012, the warm SSTA associated with El Niño weakened the descending branch of the Pacific Walker Circulation and an ascending branch occurred over the western equatorial Pacific. This ascending branch together with the descending branch over the eastern tropical Indian Ocean formed an organized Walker Circulation over the Indo–Western Pacific (Figure 10C). The vertically integrated water vapor fluxes clearly showed moisture transport from the eastern tropical Indian Ocean and western–to–central equatorial Pacific, which was caused by the Walker Circulation over the Indo–Western Pacific. The moistures transported from the two basins converged over the western equatorial Pacific, leading to above normal precipitation along with enhanced convection in this region (Figures 8, 9C). Moreover, the convergence of the moistures transport from the tropical Indian Ocean and equatorial Pacific influenced the WNP. It clearly showed that the convergence of the moistures formed a strong anomalous cyclone accompanied by above normal precipitation and enhanced convection in the SCPS, which was in agreement with the findings of Li et al. (2024). In addition, parts of the moistures were transported from the eastern Philippine Sea to the western–to–central subtropical Pacific, forming above normal precipitation and enhanced convection in this region. These results indicated that the co-occurrence of pIOD and El Niño induced air–sea interactions during the summer of 2012 that favored strong convection in the SCPS and western–to–central subtropical Pacific. These anomalous enhanced convective activities in the two regions further triggered two separate meridional atmospheric Rossby wave trains in the WNP.
3.4 Vertical structure and associated MHWs
The above analysis has confirmed the occurrence of an extreme sea surface warming over the MLWNP during the summer of 2012. In this section, we investigated the vertical structure of this extreme warming and the associated MHWs. The good agreements between the SSTA of the OISST and Argo datasets encouraged us to use the Argo data to explore the vertical structure of the 2012 extreme warming in this region (Figure 11). One striking feature was that the extreme warming in the KOE region weakened sharply with depth. For example, the sea temperature anomaly at 30 m level was much less warmer than that at the surface. This indicated that the 2012 extreme warming in the KOE region was characterized by a shallow depth of approximately 20 m. In addition, cold sea temperature anomaly was noticeable along the coasts of Kamchatka Peninsula and Kuril Islands at 50–200 m levels (Figures 11E–H). This indicated that the Oyashio as well as the extension may have played a role in carrying cold water to this region (Figure 12A). We argued that the role of oceanic circulation in the 2012 extreme warming in the KOE region cannot be omitted.
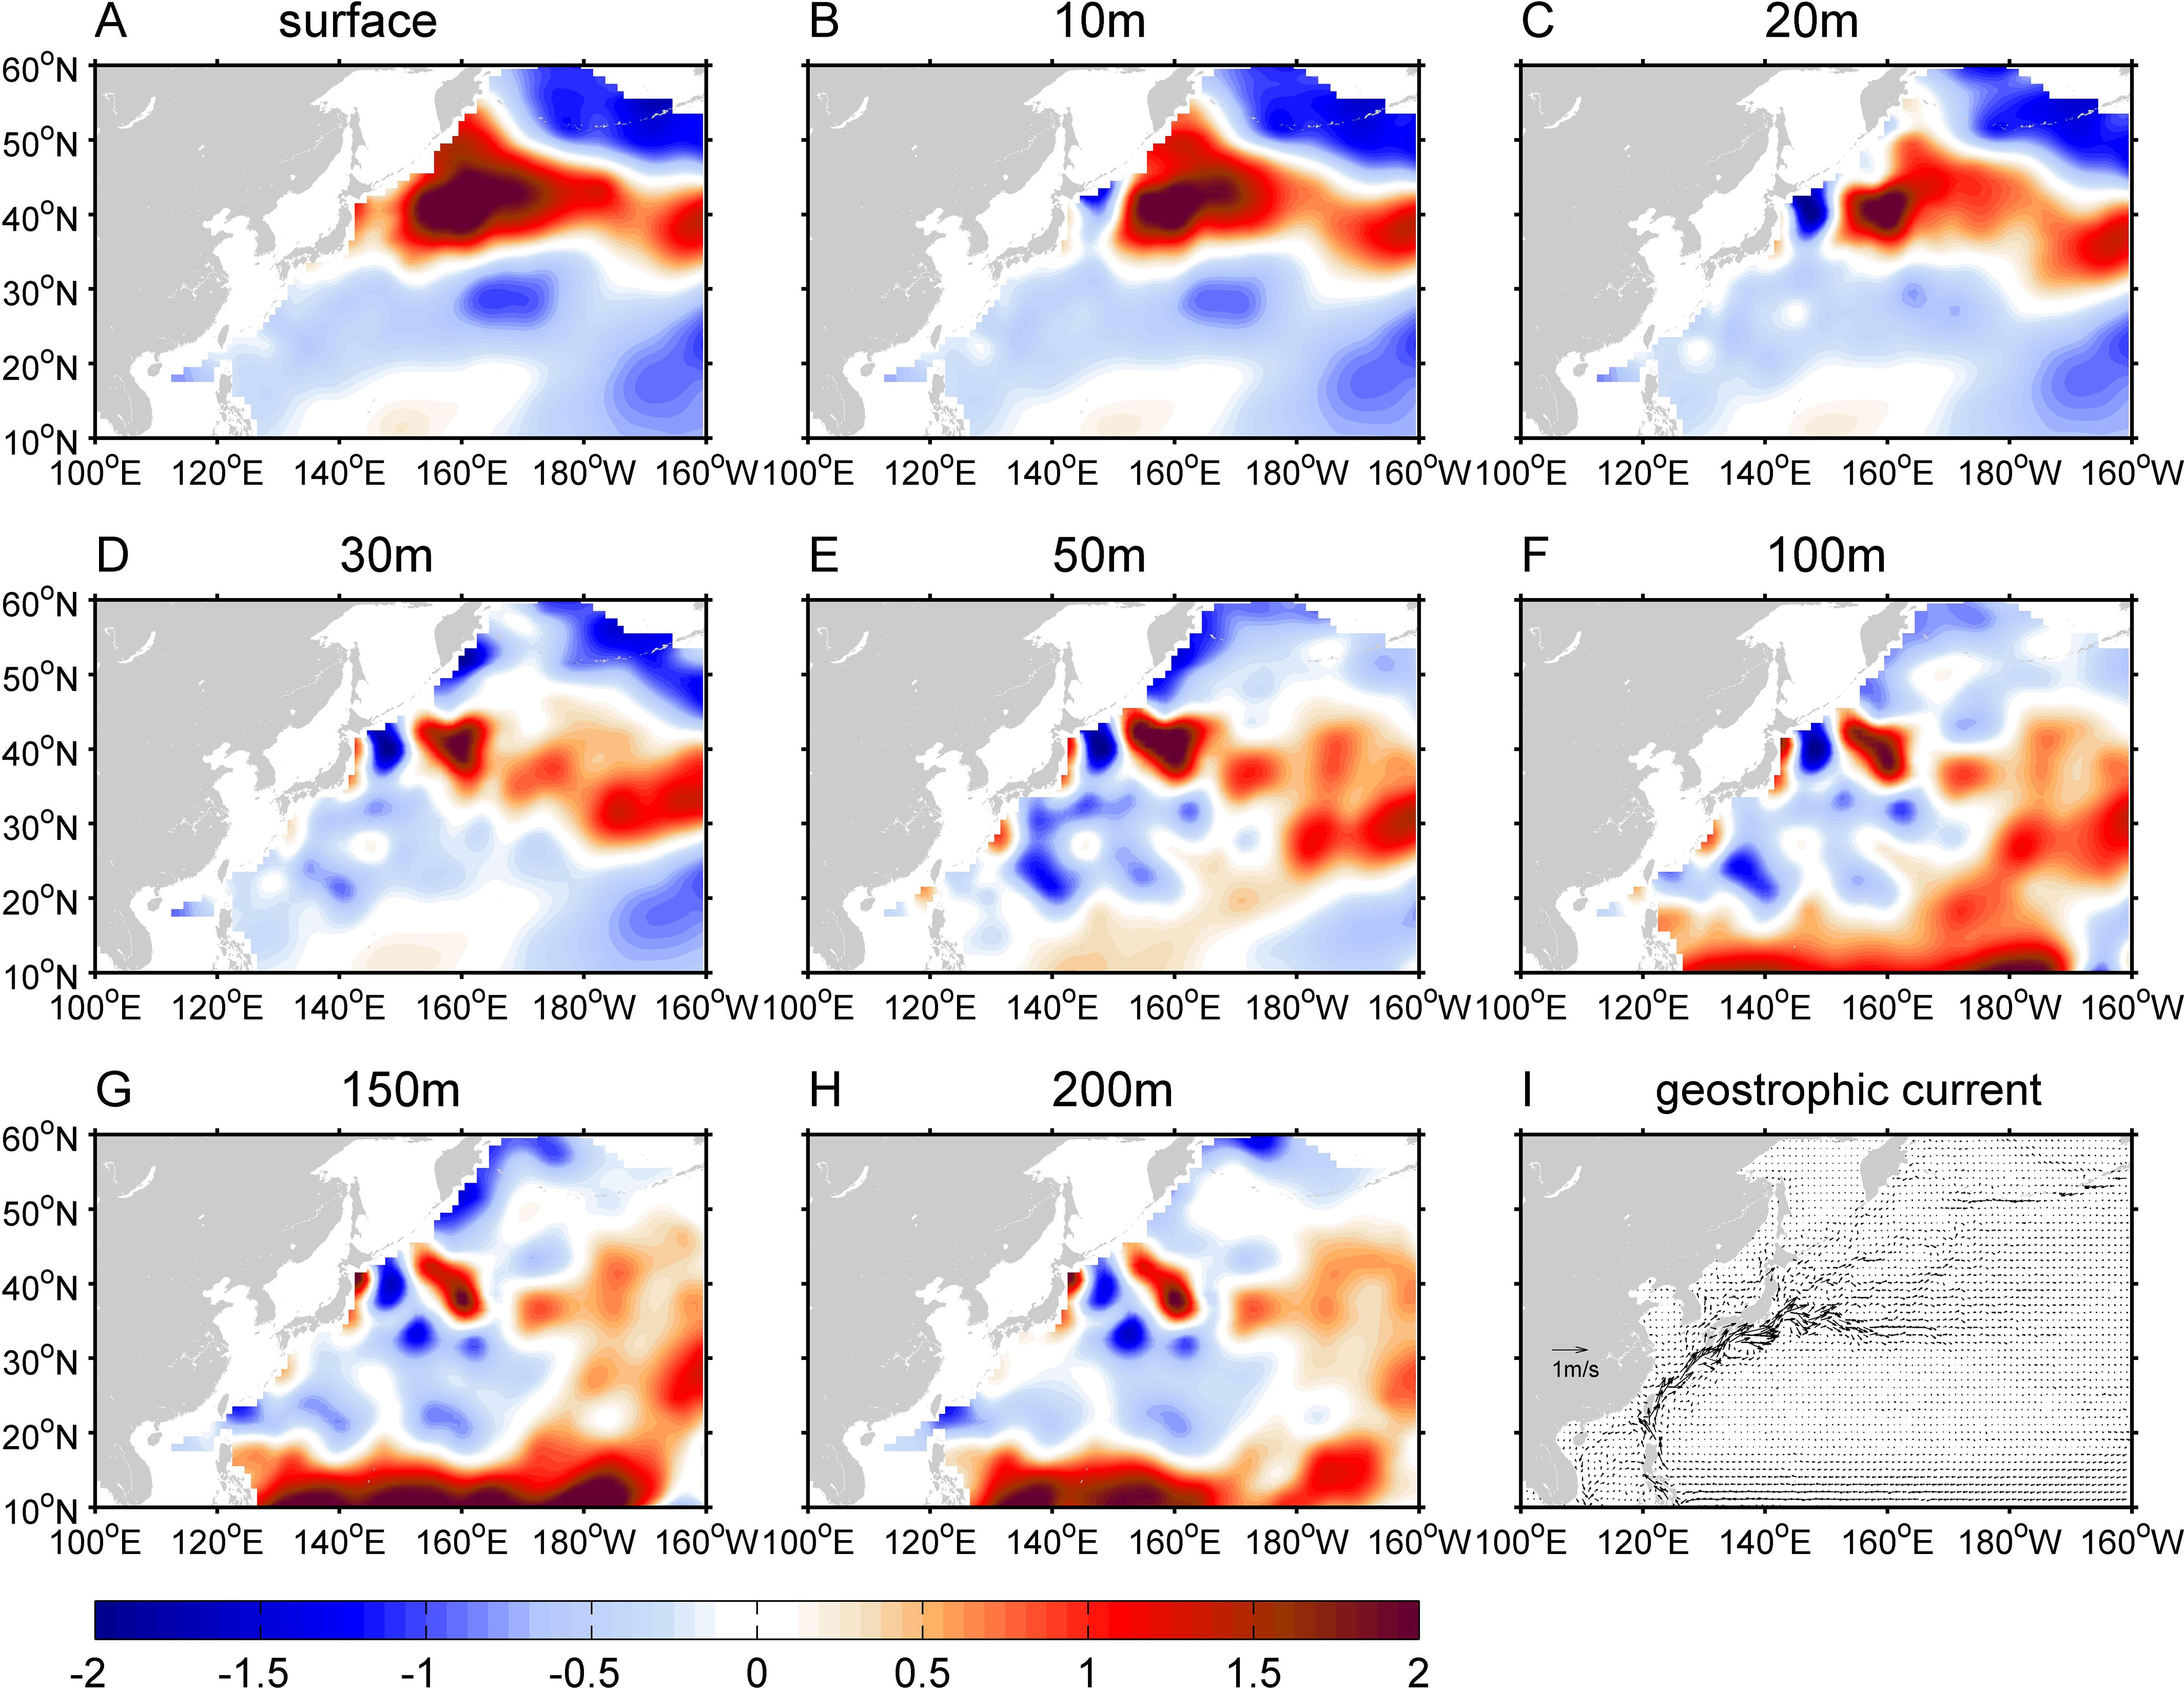
Figure 11. (A–H) Vertical structure of sea temperature anomaly (°C) during JAS of 2012 based on the Argo dataset. (I) Annual mean of surface geostrophic current based on the CMEMS data during 1993–2022.
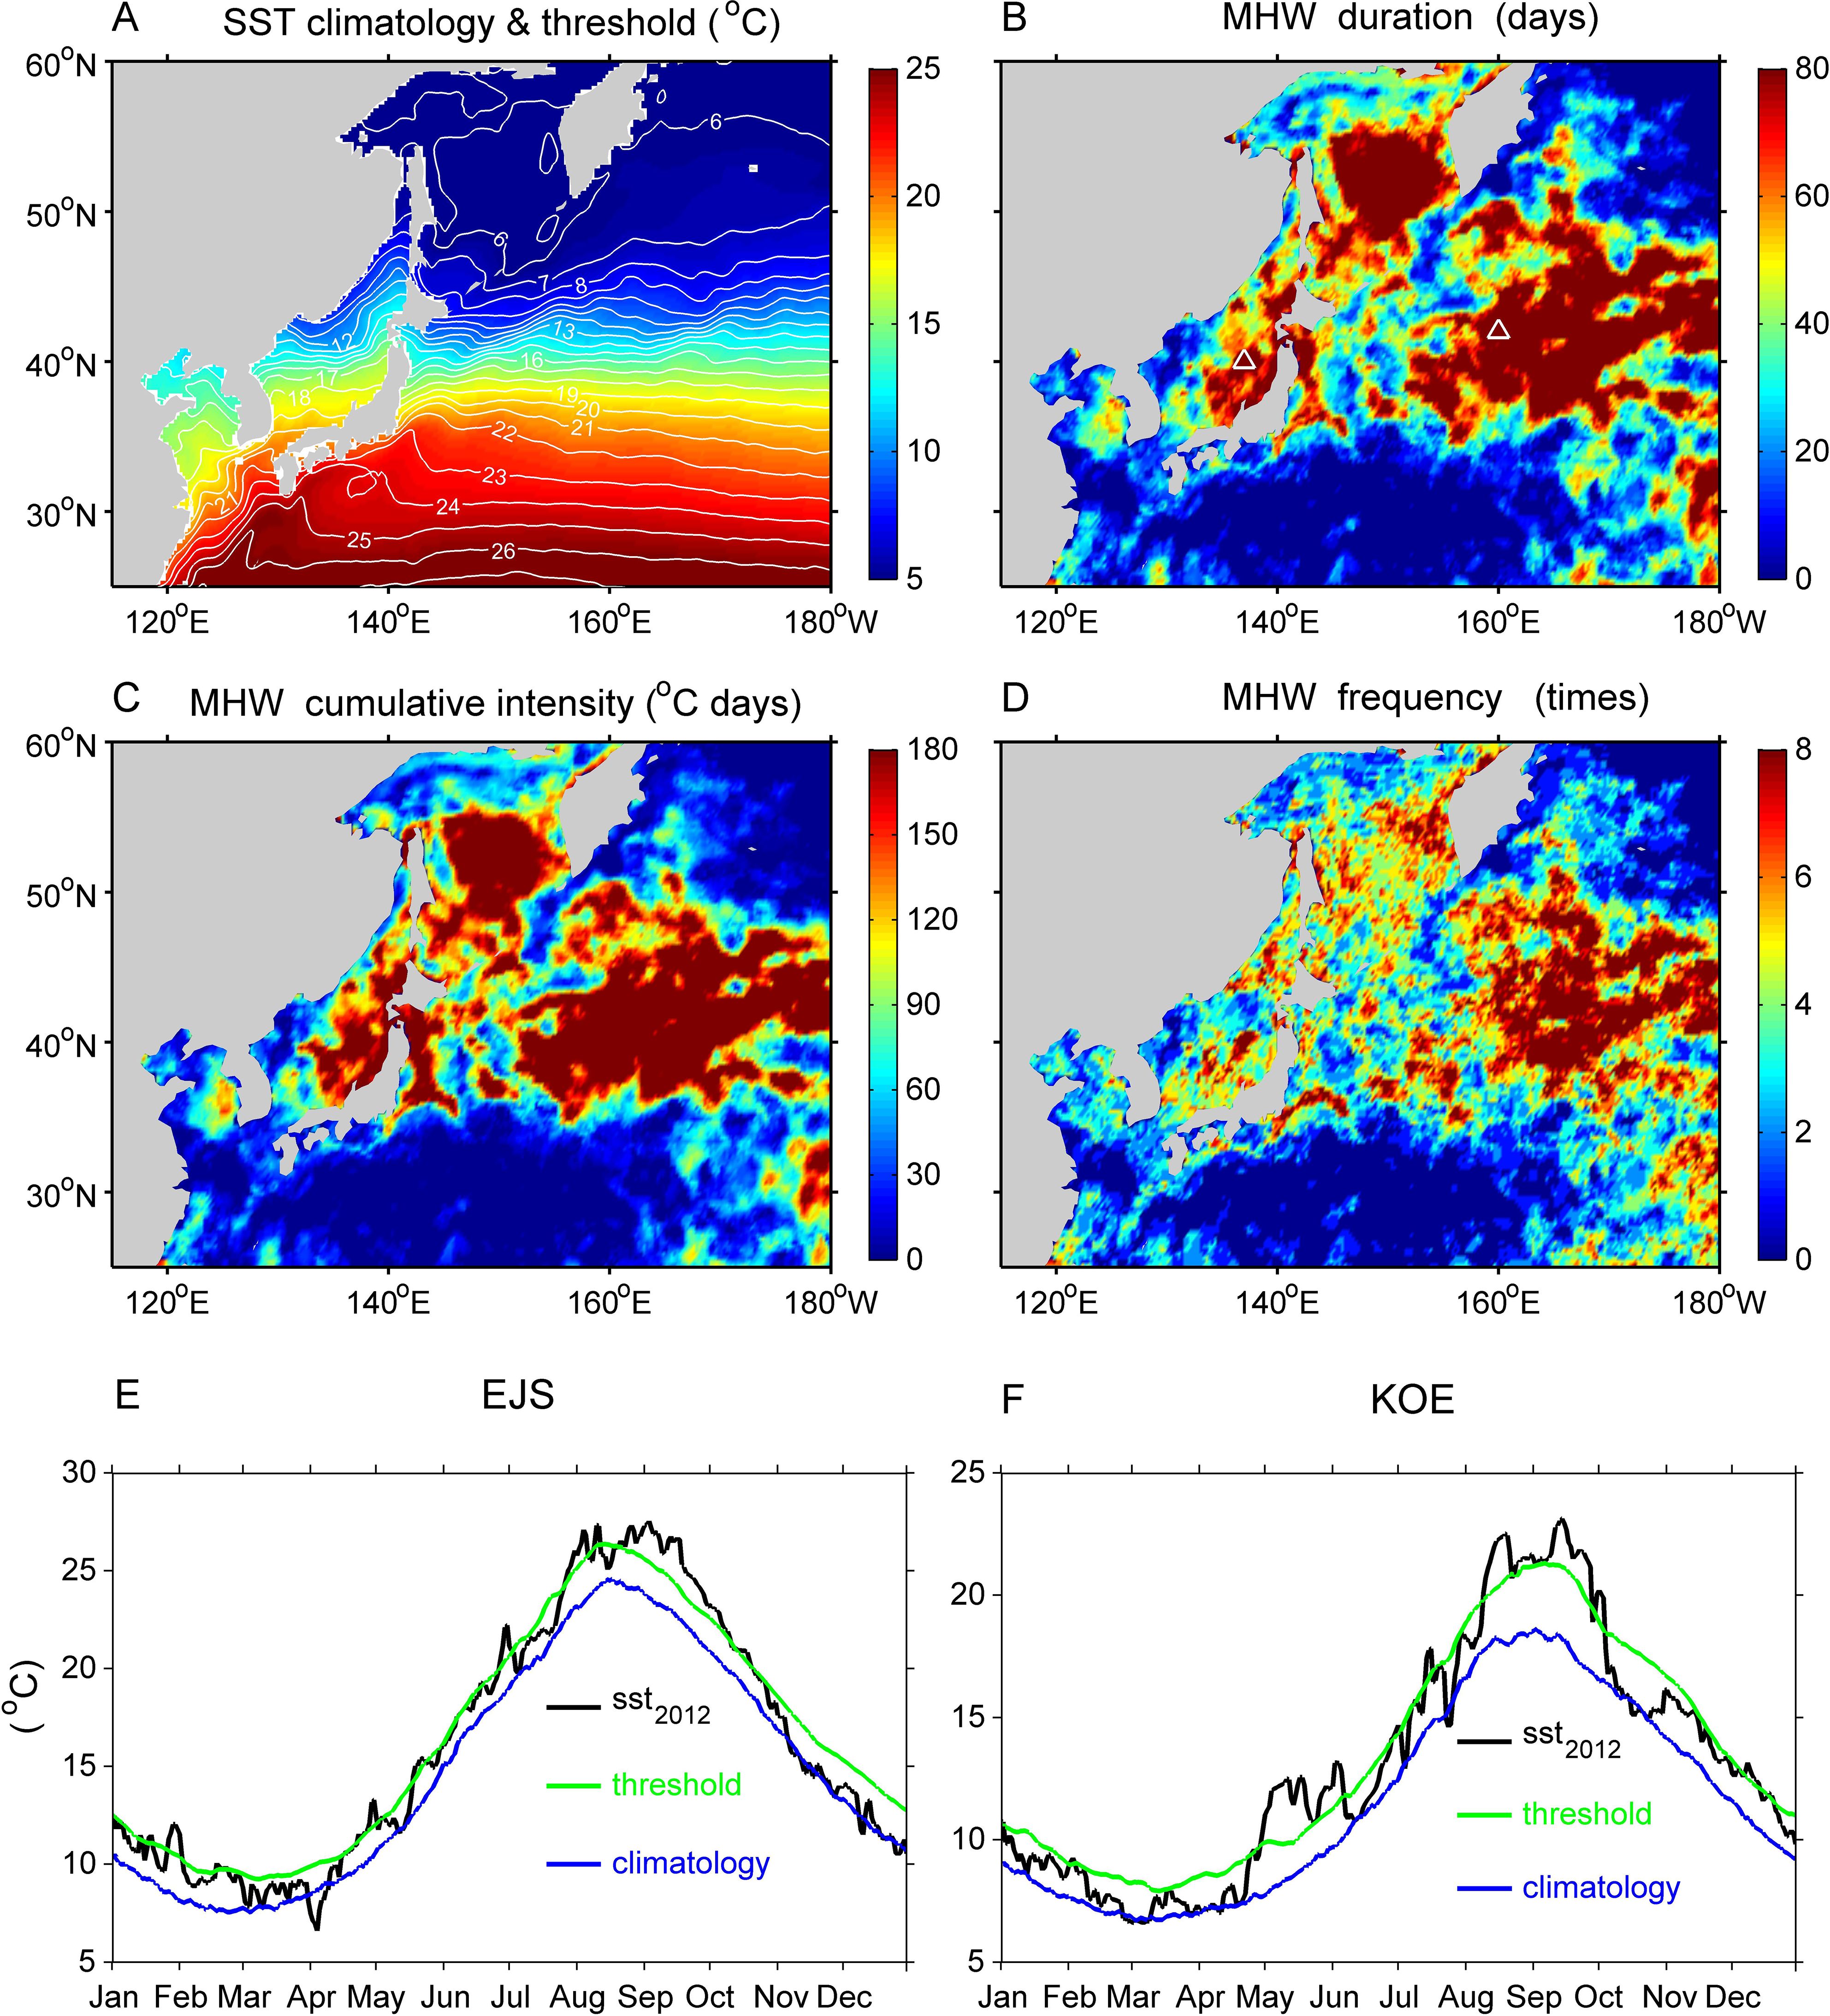
Figure 12. (A) Climatology SST (color) and the 90th percentile threshold (contour). MHW metrics in 2012: (B) duration, (C) cumulative intensity, (D) frequency. The white triangles indicate two 1°×1° boxes selected in the EJS (136–137°E, 39–40°N) and KOE (159–160°E, 41–42°N), respectively. Seasonally varying MHWs in 2012 in the two representative boxes in the EJS (E) and KOE (F). In the varying MHWs, the curves correspond to the SST (black), the 90th percentile seasonally varying threshold (green) and the climatology (blue).
We further examined the MHWs associated with the 2012 extreme sea surface warming in the MLWNP. Figure 12 shows the spatial patterns of MHW duration, cumulative intensity and frequency in the MLWNP in 2012. These metrics clearly confirmed the occurrences of MHWs in this region (Figures 12B–D). Spatially, intense MHWs occurred primarily in the regions of EJS and downstream of the KOE. Two 1°×1° boxes were selected in the EJS (136–137°E, 39–40°N) and downstream of the KOE (159–160°E, 41–42°N), respectively. We used the daily SST averaged over the two boxes to characterize the temporal variations of MHWs in these two boxes (Figure 12E). The time series of daily SST showed that prominent MHWs occurred primarily during JAS of 2012 for both boxes. Specifically, significant MHWs occurred in the KOE and persisted from early August to late September. This MHW event had a duration of 50 days, a maximum intensity of 4.9°C and a cumulative intensity of 178°C days.
4 Discussion
4.1 Roles of high–frequency atmospheric teleconnection
A review paper of Xie et al. (2016) concluded that meridional atmospheric Rossby waves associated with PJ teleconnection were responsible for the anomalous warming in the MLWNP during boreal summer. In the present study, our results showed that strong convective activities in the SCPS favored atmospheric Rossby waves to propagate northward to Korea–Japan, contributing to anomalous warm SSTA in regions around Japan (include the EJS and eastern Japan coastal areas) during the summer of 2012. These features were consistent with the typical PJ teleconnection in previous studies (Huang and Sun, 1992; Kosaka and Nakamura, 2006; Nitta, 1987; Noh et al., 2021, 2023; Wakabayashi and Kawamura, 2004; Yeo et al., 2019). Meanwhile, this study identified an atmospheric Rossby wave train that originated from the western–to–central subtropical Pacific and propagated poleward to the KOE region. The analysis indicated that this Rossby wave train was triggered by enhanced convection over the western–to–central subtropical Pacific. This Rossby wave train was different from that associated with the typical PJ teleconnection in which the convection is strong over the SCPS. The two meridional Rossby wave trains converged over the downstream of the KOE region, forming strong atmospheric blocking high–pressure systems over the MLWNP (Figure 4). The high–pressure systems reduced the amount of total cloud cover and increased insolation into the ocean (Figures 5A, C). In addition, the weakened wind speed and drier air conditions reduced the release of latent heat flux (Figures 5B, D, 9C). The enhanced shortwave radiation and decreased latent heat flux led to increased net heat flux into the MLWNP during the summer of 2012 (Figure 6D). Moreover, the weakened wind strengthened the stratification and shoaled the mixed layer. As a result, the increased net heat flux accompanied by a shallower mixed layer contributed to the extreme sea surface warming in the MLWNP during the summer of 2012 (Figures 6, 7).
Although such meridional atmospheric Rossby waves that originated from the western–to–central subtropical Pacific were uncommon, similar conditions were identified in August 2016. Figure 13 shows that strong convection in the western–to–central subtropical Pacific excited northward propagations of atmospheric Rossby waves, leading to blocking high–pressure systems accompanied by hot extremes in the MLWNP in August 2016. Our results supported the findings of Yeh et al. (2018) that atmospheric teleconnection originated from western–to–central subtropical Pacific contributed to the hot extremes over Korean Peninsula in August 2016. It was indicated from Figure 8 that the anomalous enhanced convection in the western–to–central subtropical Pacific was the results of air–sea interactions caused by the co-occurrence of a pIOD event and El Niño during the summer of 2012. However, the enhanced convection in the western–to–central subtropical Pacific was qualitatively described in the present work, and the formation mechanisms need to be quantitatively illustrated by numerical models in the future work. Based on these findings, we proposed that more attention should be paid to the convective forcing in the subtropical Pacific so as to monitor and predict hot extremes in East Asia and MLWNP.
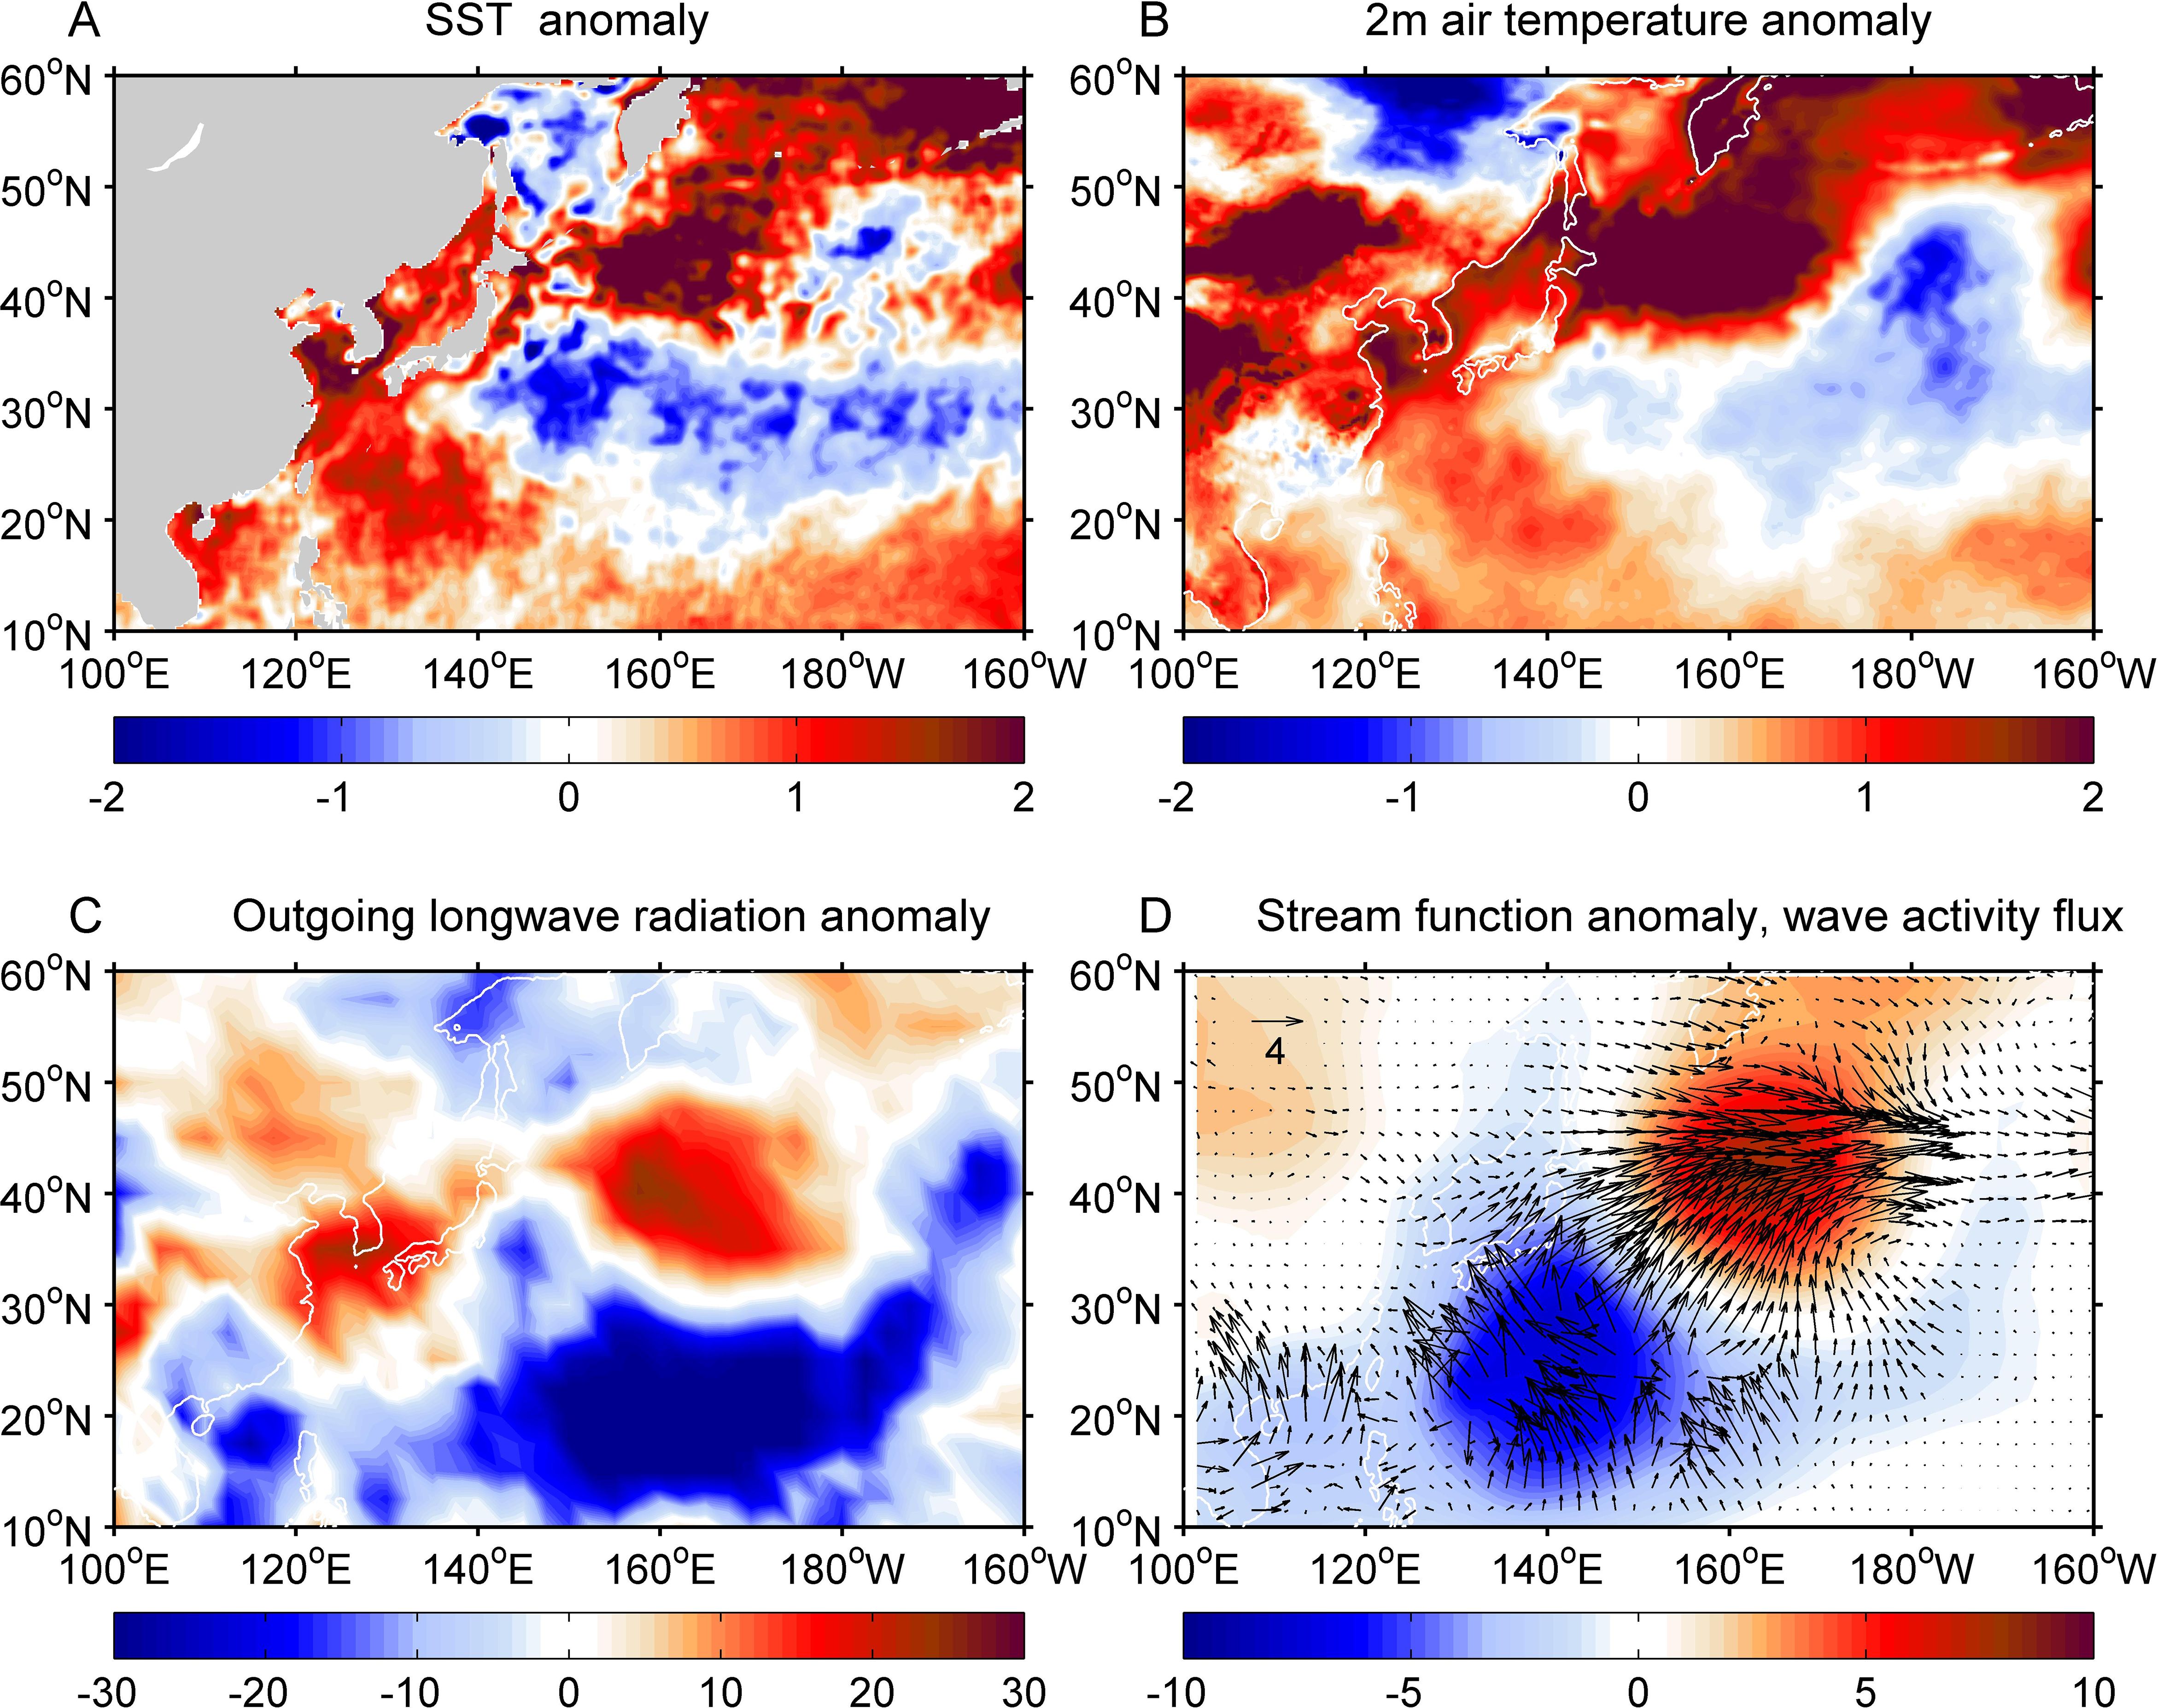
Figure 13. Oceanic and atmospheric anomalies for hot extremes in the MLWNP in August 2016. Anomalies of SST (A, °C), 2 m air temperature (B, °C) and outgoing longwave radiation (C, W m-2). (D) 850 hPa stream function (D, 106 m2 s-1). The vectors represent the estimated wave activity flux (m2 s-2) to characterize an atmospheric Rossby wave train originated from the western–to–central subtropical Pacific.
Previous studies indicated that El Niño–Southern Oscillation in the preceding year can trigger PJ teleconnection via Indo–western Pacific ocean capacitor (IPOC) effect (Du et al., 2009; Kubota et al., 2016; Xie et al., 2009, 2016; Yang et al., 2007). Our results showed that the atmospheric teleconnection in the WNP in 2012 was caused by the co-occurrence of a pIOD event and El Niño during the summer of that year. The air–sea interactions associated with the two events induced strong convection in the SCPS and western–to–central subtropical Pacific, which acted as sources of the two separate meridional atmospheric Rossby wave trains (Figures 4, 8). These results verified the speculation of Li et al. (2024) that strong cyclonic anomalies in the SCPS induced by the pIOD 2012 may affect the summer climate variability in the WNP. It was noted that 2011 was a La Niña year. According to the IPOC mechanism, an Indian Ocean Basin Mode (IOBM) warming pattern should have formed in spring and persisted to the summer of 2012. However, such an IOBM warming pattern was not recognized after the demise of the 2011 La Nina. Instead, the tropical Indian Ocean was characterized by a zonal dipole pattern: a pIOD event was initiated in spring and developed to peak phase during the summer of 2012 (Li et al., 2024). This indicated that the air–sea interactions over the Indo–Northwest Pacific during the summer of 2012 were different from the IPOC effect. Therefore, we cannot attribute the atmospheric teleconnection in the WNP during the summer of 2012 to the 2011 La Niña. El Niño/La Niña usually develops to peak phase during boreal winter. However, the 2012 El Niño peaked in summer, several months earlier than usual. As suggested by Li et al. (2024), the early peak of El Niño was very likely to trigger the concurrent 2012 pIOD event. The combination of the two events favored the air–sea interactions over the Indo–West Pacific, which was responsible for the atmospheric teleconnection in the WNP during the summer of 2012. Further works are necessary to investigate the phase transition of ENSO during 2011–2012.
4.2 Roles of global warming and low–frequency PDO
Hot extremes in the East Asia and WNP have increased under global warming (Laufkötter et al., 2020; Oliver et al., 2018, 2021; Perkins-Kirkpatrick and Lewis, 2020), leading to severe heatwaves over land and ocean in recent years (Holbrook et al., 2019; Noh et al., 2021; Yeh et al., 2018). The SSTA averaged over the MLWNP clearly showed a warming trend of 0.29°C per decade (Figure 1D). This indicated that the global warming may have played a role in the hot extremes in the MLWNP in recent years. Moreover, Pacific Decadal Oscillation (PDO) is the leading SSTA pattern in the Pacific poleward of 20°N, has been recognized as the most significant decadal variability in the North Pacific (Deser et al., 2010; Li et al., 2020; Mantua et al., 1997; Newman et al., 2016; Zhang et al., 1997). We further discussed the role of PDO in the 2012 extreme surface warming in the MLWNP. Following the method of Zhang et al. (1997), we performed an empirical orthogonal function analysis to the SSTA poleward 20°N in the Pacific based on the OISST dataset from 1983 to 2022. As shown in Figure 14, the PDO (leading empirical orthogonal function mode) is characterized by cold SSTAs in the MLWNP and central North Pacific, and by horseshoe-like warm SSTAs in the eastern North Pacific (Figure 14A). The PDO index showed negative values from 2007 to 2013, with particularly large values in 2012. This strongly indicated that the negative phase of PDO has significantly contributed to the 2012 extreme surface warming in the MLWNP.
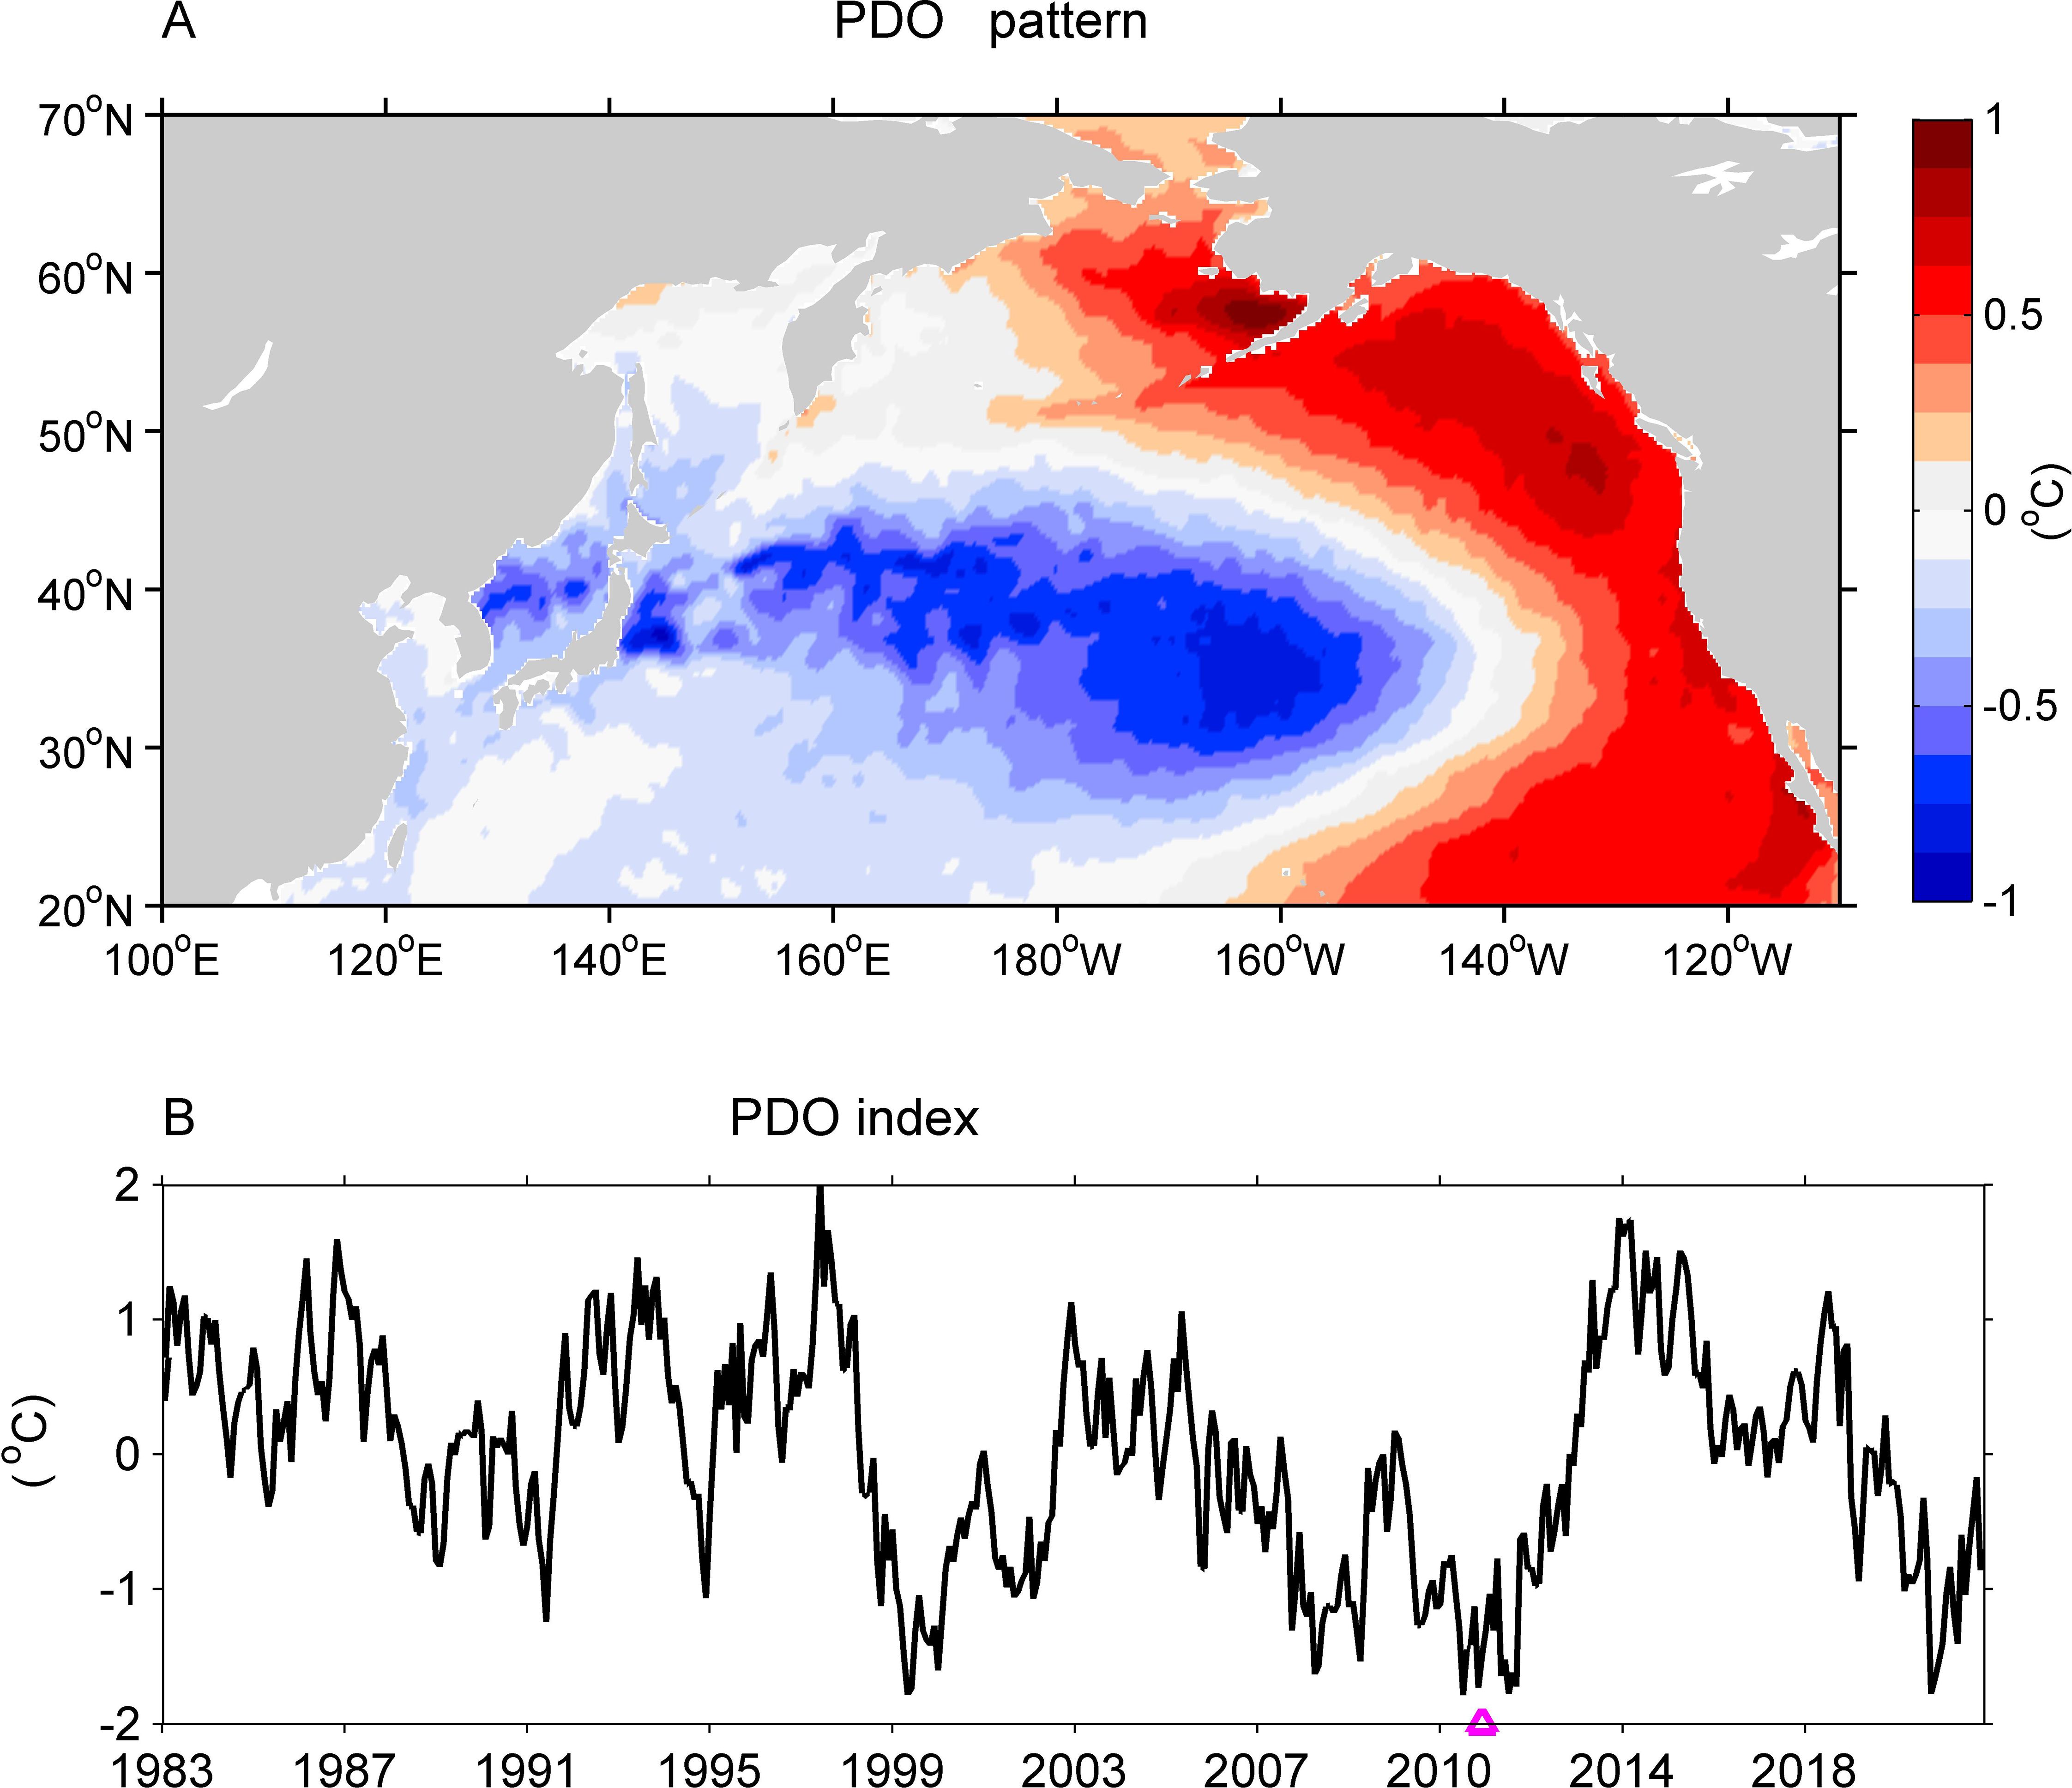
Figure 14. The Pacific Decadal Oscillation (PDO) based on OISST dataset from 1983–2022. Spatial pattern (A) and temporal variation (B) of the leading empirical orthogonal function mode of monthly SSTA in the Pacific poleward of 20°N. The purple triangle indicates the significant negative phase of PDO in 2012.
4.3 MWHs associated with the 2012 extreme warming
The metrics of duration, frequency and cumulative intensity confirmed the occurrences of MHWs over the MLWNP in 2012 (Figure 12). Spatially, intense MHWs occurred primarily in the regions of EJS and the downstream of KOE. Temporally, prominent MHWs features were recognized during August–September of 2012 for both regions. This indicated that these MHWs were associated with the extreme warming during the summer of 2012. The vertical structure of the sea temperature anomaly showed that the 2012 extreme warming was confined to a shallow depth of approximately 20 m (Figure 11), supporting the findings that the heat flux term anomaly played a dominant role in contributing to the extreme warming in the MLWNP. These results were consistent with the findings of several recent studies that atmospheric teleconnection was responsible for severe MHWs in the MLWNP (Du et al., 2022; Kuroda and Setou, 2021; Pak et al., 2022; Song et al., 2024). On the other hand, the oceanic circulation system in the KOE region is composed of Kuroshio, Oyashio and their extensions (Figure 11I), as well as abundant mesoscale eddies (Jing et al., 2019; Miyama et al., 2021; Qiu, 2000; Qu et al., 2000; Sasaki et al., 2020), which played important roles in the heat balance in this region (Kwon et al., 2010; Shan et al., 2020). Limited by the data availability, the contribution of horizontal advection and vertical mixing to the 2012 extreme warming was not quantified in the present work. In the future, high resolution air–sea coupled numerical models are needed to investigate the hot extremes in the NWP.
5 Conclusion
The East Asia and WNP have witnessed several hot extremes in recent years (Hua et al., 2023; Kuroda and Setou, 2021; Li X. et al., 2023; Song et al., 2024; Zhang et al., 2024). In this study, we investigated an extreme sea surface warming in the MLWNP during the summer of 2012. Using various observational and reanalysis datasets, the characteristics of the 2012 extreme warming were quantified and the oceanic–atmospheric processes responsible for this extremity were illustrated.
The 2012 extreme event in the MLWNP was characterized by warm SSTA extending from the EJS to central North Pacific, particularly with a warming center in the downstream of the KOE region (150–170°E, 37–45°N). The SSTA box–averaged over the MLWNP (130–180°E, 33–50°N) in 2012 ranked as the third warmest in recent four decades. The extreme sea surface warming caused intense MHWs in the regions of EJS and KOE, respectively. The analysis confirmed that the combination of atmospheric teleconnection and PDO was the cause of this extreme event. During the summer of 2012, the co-occurrence of a pIOD event and El Niño favored anomalous moisture transport between the two basins. This induced strong air–sea interactions over the Indo–West Pacific that caused enhanced convection in the SCPS and western–to–central subtropical Pacific, respectively. The enhanced convective activities in the SCPS triggered a Rossby wave train propagating poleward to Korea–Japan, which was identified as the typical PJ teleconnection pattern during boreal summer. The enhanced convective activities in the western–to–central subtropical Pacific triggered a Rossby wave train that propagated northward to the KOE region. These two Rossby wave trains converged over the downstream of the KOE region, forming atmospheric blocking high–pressure systems over the MLWNP. The high–pressure systems reduced the total cloud cover and surface wind speed. This enhanced the shortwave radiation and reduced the release of latent heat flux, causing increased net heat flux into the ocean in this region. In addition, the weakened wind speed strengthened stratification and led to shoaling of the mixed layer. As a result, the increased net heat flux accompanied by a shallower mixed layer contributed to the 2012 extreme sea surface warming in the MLWNP. Moreover, our results showed that the PDO exhibited a negative phase from 2007 to 2013, with a particularly large PDO index in 2012. Therefore, the PDO also contributed significantly to warm SSTAs in the MLWNP during the summer of 2012. This study highlighted the roles of high–frequency atmospheric teleconnection and low–frequency PDO in extreme sea surface warming in the MLWNP.
Data availability statement
The original contributions presented in the study are included in the article/supplementary material. Further inquiries can be directed to the corresponding author.
Author contributions
ZL: Writing – review & editing, Writing – original draft, Visualization, Conceptualization. GW: Writing – review & editing, Data curation, Conceptualization. CX: Writing – review & editing, Methodology, Formal analysis. JZ: Writing – review & editing, Formal analysis, Data curation. MW: Writing – review & editing, Software, Investigation. JS: Writing – review & editing, Software, Methodology. YS: Writing – review & editing, Methodology, Investigation, Funding acquisition, Formal analysis. XZ: Writing – review & editing, Writing – original draft, Visualization, Supervision, Conceptualization.
Funding
The author(s) declare financial support was received for the research, authorship, and/or publication of this article. This work was supported by the Natural Science Foundation of Zhejiang Province (LQ24D060008), the Scientific Research Foundation of Zhejiang Tongji Vocational College of Science and Technology (G20240117), the National Natural Science Foundation of China (41920104006), the Scientific Research Fund of the Second Institute of Oceanography, MNR (Grant JZ2001), the Innovation Group Project of the Southern Marine Science and Engineering Guangdong Laboratory, Zhuhai (No.311020004), the National Natural Science Foundation of China (42106035), the Scientific Research Fund of the Second Institute of Oceanography, MNR (Grant JG2306).
Conflict of interest
The authors declare that the research was conducted in the absence of any commercial or financial relationships that could be construed as a potential conflict of interest.
Publisher’s note
All claims expressed in this article are solely those of the authors and do not necessarily represent those of their affiliated organizations, or those of the publisher, the editors and the reviewers. Any product that may be evaluated in this article, or claim that may be made by its manufacturer, is not guaranteed or endorsed by the publisher.
References
Amaya D., Alexander M., Capotondi A., Deser C., Mantua N. (2021). Are long-term changes in mixed layer depth influencing north pacific marine heatwaves? Bull. Am. Meteorol. Soc. 102, S59–S66. doi: 10.1175/BAMS-D-20-0144.1
Amaya D., Miller J., Xie S., Kosaka Y. (2020). Physical drivers of the summer 2019 North Pacific marine heatwave. Nat. Commun. 11, 1903. doi: 10.1038/s41467-020-15820-w
Bond N., Cronin M., Freeland H., Mantua N. (2015). Causes and impacts of the 2014 warm anomaly in the NE Pacific. Geophys. Res. Lett. 42, 3414–3420. doi: 10.1002/2015GL063306
Cavole L., Demko A., Diner R., Giddings A., Koester A., Pagniello C., et al. (2016). Biological impacts of the 2013–2015 warm-water anomaly in the Northeast Pacific: Winners, losers, and the future. Oceanography 29, 273–285. doi: 10.5670/oceanog.2016.32
Deser C., Alexander M. A., Xie S. P., Phillips A. S. (2010). Sea surface temperature variability: Patterns and mechanisms. Annu. Rev. Mar. Sci. 2, 115–143. doi: 10.1146/annurev-marine-120408-151453
Du Y., Feng M., Xu Z., Yin B., Hobday A. (2022). Summer marine heatwaves in the Kuroshio-Oyashio extension region. Remote Sens. 14, 2980. doi: 10.3390/rs14132980
Du Y., Xie S., Huang G., Hu K. (2009). Role of air–sea interaction in the long persistence of el nio–induced North Indian ocean warming. J. Climate 22, 2023–2038. doi: 10.1175/2008JCLI2590.1
Gomes D., Ruzicka J., Crozier L., Huff D., Brodeur R., Steward J. (2024). Marine heatwaves disrupt ecosystem structure and function via altered food webs and energy flux. Nat. Commun. 15, 1988. doi: 10.1038/s41467-024-46263-2
Hayashi M., Shiogama H., Ogura T. (2022). The contribution of climate change to increasing extreme ocean warming around Japan. Geophys. Res. Lett. 49, e2022GL100785. doi: 10.1029/2022GL100785
Herrera-Lormendez P., Douville H., Matschullat J. (2023). European summer synoptic circulations and their observed 2022 and projected influence on hot extremes and dry spells. Geophys. Res. Lett. 50, e2023GL104580. doi: 10.1029/2023GL104580
Hersbach H., Bell B., Berrisford P., Hirahara S., Horanyi A., Muñoz-Sabater J., et al. (2020). The ERA5 global reanalysis. Q. J. R. Meteorol. Soc 146, 1999–2049. doi: 10.1002/qj.v146.730
Hobday A., Alexander L., Perkins S., Smale D., Straub S., Oliver E., et al. (2016). A hierarchical approach to defining marine heatwaves. Prog. Oceanogr. 141, 227–238. doi: 10.1016/j.pocean.2015.12.014
Holbrook N., Scannell H., Gupta A., Benthuysen J., Feng M., Oliver E., et al. (2019). A global assessment of marine heatwaves and their drivers. Nat. Commun. 10, 2624. doi: 10.1038/s41467-019-10206-z
Hong C., Huang A., Hsu H., Tseng W., Lu M., Chang C. (2023). Causes of 2022 Pakistan flooding and its linkage with China and Europe heatwaves. npj. Clim. Atmos. Sci. 6, 163. doi: 10.1038/s41612-023-00492-2
Hua W., Dai A., Qin M., Hu Y., Cui Y. (2023). How unexpected was the 2022 summertime heat extremes in the middle reaches of the Yangtze River? Geophys. Res. Lett. 50, e2023GL104269. doi: 10.1029/2023GL104269
Huang R., Sun F. (1992). Impacts of the tropical western Pacific on East Asian summer monsoon. J. Meteorol. Soc Japan Ser. II 70, 243–256. doi: 10.2151/jmsj1965.70.1B_243
Jing Z., Chang P., Shan X., Wang S., Wu L., Kurian J. (2019). Mesoscale SST dynamics in the Kuroshio-Oyashio extension region. J. Phys. Oceanogr. 49, 1339–1352. doi: 10.1175/JPO-D-18-0159.1
Kara A., Rochford P., Hurlburt H. (2000). An optimal definition for ocean mixed layer depth. J. Geophys. Res. 105, 16803–16821. doi: 10.1029/2000JC900072
Kawai Y., Miyama T., Iizuka S., Manda A., Yoshioka M., Katagiri S., et al. (2015). Marine atmospheric boundary layer and low-level cloud responses to the Kuroshio Extension front in the early summer of 2012: three-vessel simultaneous observations and numerical simulations. J. Oceanogr. 71, 511–526. doi: 10.1007/s10872-014-0266-0
Kosaka Y., Nakamura H. (2006). Structure and dynamics of the summertime Pacific–Japan teleconnection pattern. Q. J. R. Meteorol. Soc 132, 2009–2030. doi: 10.1256/qj.05.204
Kubota H., Kosaka Y., Xie S. (2016). A 117-year long index of the Pacific-Japan pattern with application to interdecadal variability. Int. J. Climatol. 36, 1575–1589. doi: 10.1002/joc.4441
Kuroda H., Setou T. (2021). Extensive marine heatwaves at the sea surface in the northwestern pacific ocean in summer 2021. Remote Sens. 13, 3989. doi: 10.3390/rs13193989
Kwon Y., Alexander M., Bond N., Frankignoul C., Thompson L. (2010). Role of the Gulf stream and Kuroshio–Oyashio systems in large-scale atmosphere–ocean interaction: a review. J. Climate 23, 3249–3281. doi: 10.1175/2010JCLI3343.1
Laufkötter C., Zscheischler J., Frlicher T. (2020). High-impact marine heatwaves attributable to human-induced global warming. Science 369. doi: 10.1126/science.aba0690
Lee S., Park M., Kwon M., Kim Y., Park Y. (2020). Two major modes of East Asian marine heatwaves. Environ. Res. Let. 15, 074008. doi: 10.1088/1748-9326/ab8527
Lee W., Lee M. (2016). Interannual variability of heat waves in South Korea and their connection with large-scale atmospheric circulation patterns. Int. J. Climatol. 36, 4815–4830. doi: 10.1002/joc.4671
Li X., Hu Z., Liu Y., Liang P., Jha B. (2023). Causes and predictions of 2022 extremely hot summer in East Asia. J. Geophys. Res.: Atmos. 128, e2022JD038442. doi: 10.1029/2022JD038442
Li Z., Lian T., Ying J., Zhu X., Papa F., Xie H., et al. (2021). The cause of an extremely low salinity anomaly in the Bay of Bengal during 2012 spring. J. Geophys. Res.: Oceans 126, e2021JC017361. doi: 10.1029/2021JC017361
Li Z., Long Y., Huang S., Xie H., Zhou Y., Yang B., et al. (2023). A large winter Chlorophyll–a bloom in the southeastern Bay of Bengal associated with the extreme Indian Ocean Dipole event in 2019. J. Geophys. Res.: Oceans 128. doi: 10.1029/2022JC018791
Li Z., Wu G., Xu C., Zhu X., Long Y. (2024). Summer marine heatwaves in the tropical Indian Ocean associated with an unseasonable positive Indian Ocean Dipole event 2012. Front. Mar. Sci. 11. doi: 10.3389/fmars.2024.1425813
Li S., Wu L., Yang Y., Geng T., Cai W., Gan B., et al. (2020). The Pacific decadal oscillation less predictable under greenhouse warming. Nat. Clim. Chang 10, 30–34. doi: 10.1038/s41558-019-0663-x
Liebmann B., Smith C. (1996). Description of a complete (interpolated) outgoing longwave radiation dataset. Bull. Am. Meteorol. Soc 77, 1275–1277. doi: 10.1175/1520-0477(1996)077<1255:EA>2.0.CO;2
Mantua N., Hare S., Zhang Y., Wallace J., Francis R. (1997). A Pacific interdecadal climate oscillation with impacts on salmon production. Bull. Am. Meteorol. Soc 78, 1069–1080. doi: 10.1175/1520-0477(1997)078<1069:apicow>2.0.co;2
Miyama T., Minobe S., Goto H. (2021). Marine heatwave of sea surface temperature of the oyashio region in summer in 2010–2016. Front. Mar. Sci. 7. doi: 10.3389/fmars.2020.576240
Newman M., Alexander M., Ault T., Cobb K., Deser C., Di Lorenzo E., et al. (2016). The Pacific decadal oscillation, revisited. J. Climate 29, 4399–4427. doi: 10.1175/JCLI-D-15-0508.1
Nitta T. (1987). Convective activities in the Tropical Western Pacific and their impact on the Northern Hemisphere Summer Circulation. J. Meteorol. Soc Japan Ser. II 65, 373–390. doi: 10.2151/jmsj1965.65.3_373
Noh E., Kim J., Jun S., Cha D., Park M., Kim J., et al. (2021). The role of the Pacific–Japan pattern in extreme heatwaves over Korea and Japan. Geophys. Res. Lett. 48, e2021GL093990. doi: 10.1029/2021GL093990
Noh E., Kim J., Jun S., Pak G., Kim J., Kim H. (2023). Atmospheric pathway of marine heatwaves over the Northwestern Pacific. Sci. Rep. 13, 22821. doi: 10.1038/s41598-023-49833-4
Oliver E., Benthuysen J., Darmaraki S., Donat M., Hobday A., Holbrook N., et al. (2021). Marine heatwaves. Annu. Rev. Mar. Sci. 13, 313–342. doi: 10.1146/annurev-marine-032720-095144
Oliver E., Donat M., Burrows M., Moore P., Smale D., Alexander L., et al. (2018). Longer and more frequent marine heatwaves over the past century. Nat. Commun. 9, 1–12. doi: 10.1038/s41467-018-03732-9
Pak G., Noh J., Park Y., Jin H., Park J. (2022). Governing factors of the record-breaking marine heatwave over the mid-latitude western North Pacific in the summer of 2021. Front. Mar. Sci. 9. doi: 10.3389/fmars.2022.946767
Perkins-Kirkpatrick S., Lewis S. (2020). Increasing trends in regional heatwaves. Nat. Commun. 11, 3357. doi: 10.1038/s41467-020-16970-7
Qiu B. (2000). Interannual variability of the Kuroshio Extension system and its impact on the wintertime SST field. J. Phys. Oceanogr. 30, 1486–1502. doi: 10.1175/1520-0485(2000)030<1486:IVOTKE>2.0.CO;2
Qu T., Mitsudera H., Qiu B. (2000). A climatological view of the Kuroshio/Oyashio system east of Japan. J. Phys. Oceanogr. 31, 2575–2589. doi: 10.1175/1520-0485(2001)031<2575:ACVOTK>2.0.CO;2
Reynolds R., Smith T., Liu C., Chelton D., Casey K., Schlax M. (2007). Daily high–resolution–blended analyses for sea surface temperature. J. Climate 20, 5473–5496. doi: 10.1175/2007jcli1824.1
Sasaki H., Kida S., Furue R., Aiki H., Taguchi B. (2020). A global eddying hindcast ocean simulation with OFES2. Geoscientific Model. Dev. 13, 3319–3336. doi: 10.5194/gmd-13-3319-2020
Shan X., Jing Z., Gan B., Wu L., Chang P., Ma X., et al. (2020). Surface heat flux induced by mesoscale eddies cools the Kuroshio-Oyashio extension region. Geophys. Res. Lett. 47, e2019GL086050. doi: 10.1029/2019GL086050
Smale D., Wernberg T., Oliver E., Thomsen M., Harvey B., Straub S., et al. (2019). Marine heatwaves threaten global biodiversity and the provision of ecosystem services. Nat. Clim. Change 9 306–312, (2019). doi: 10.1038/s41558-019-0412-1
Song Q., Wang C., Yao Y., Fan H. (2024). Unraveling the Indian monsoon’s role in fueling the unprecedented 2022 Marine Heatwave in the Western North Pacific. npj. Clim. Atmos. Sci. 7. doi: 10.1038/s41612-024-00645-x
Takaya K., Nakamura H. (2001). A formulation of a phase independent wave-activity flux for stationary and migratory quasigeostrophic eddies on a zonally varying basic flow. J. Atmos. Sci. 58, 608–627. doi: 10.1175/1520-0469(2001)058<0608:AFOAPI>2.0.CO;2
Tang S., Qiao S., Wang B., Liu F., Feng T., Yang J., et al. (2023). Linkages of unprecedented 2022 Yangtze River Valley heatwaves to Pakistan flood and triple-dip La Niña. npj. Clim. Atmos. Sci. 6. doi: 10.1038/s41612-023-00386-3
Wakabayashi S., Kawamura R. (2004). Extraction of major teleconnection patterns possibly associated with the anomalous summer climate in Japan. J. Meteorol. Soc Japan 82, 1577–1588. doi: 10.2151/jmsj.82.1577
Wang B., Wu R., Fu X. (2000). Pacific-East Asian teleconnection: how does ENSO affect East Asian climate? J. Climate 13, 1517–1536. doi: 10.1175/1520-0442(2000)013<1517:PEATHD>2.0.CO;2
Xie S., Hu K., Hafner J., Tokinaga H., Du Y., Huang G., et al. (2009). Indian Ocean capacitor effect on Indo–Western Pacific climate during the summer following El Niño. J. Climate 22, 730–747. doi: 10.1175/2008JCLI2544.1
Xie S., Kosaka Y., Du Y., Hu K., J. Chowdary J., Huang G. (2016). Indo–western Pacific ocean capacitor and coherent climate anomalies in post–ENSO summer: A review. Adv. Atmos. Sci. 33, 411–432. doi: 10.1007/s00376-015-5192-6
Yang J., Liu Q., Xie S., Liu Z., Wu L. (2007). Impact of the Indian Ocean SST basin mode on the Asian summer monsoon. Geophys. Res. Lett. 34, L02708. doi: 10.1029/2006GL028571
Yeh S., Won Y., Hong J., Lee K., Kwon M., Seo K., et al. (2018). The record-breaking heat wave in 2016 over South Korea and its physical mechanism. Monthly Weather Rev. 146, 1463–1474. doi: 10.1175/MWR-D-17-0205.1
Yeo S., Yeh S., Lee W. (2019). Two Types of heat wave in Korea associated with atmospheric circulation pattern. J. Geophys. Res.: Atmos. 124, 7498–7511. doi: 10.1029/2018JD030170
Zhang J., Chen H., Fang X., Yin Z., Hu R. (2024). Warming-induced hydrothermal anomaly over the Earth’s three Poles amplifies concurrent extremes in 2022. npj. Clim. Atmos. Sci. 7. doi: 10.1038/s41612-023-00553-6
Keywords: sea surface warming, midlatitude western north pacific, marine heatwave, atmospheric Rossby wave, Pacific Decadal Oscillation, atmospheric teleconnection
Citation: Li Z, Wu G, Xu C, Zhao J, Wang M, Sheng J, Shen Y and Zhu X-H (2024) The cause of an extreme sea surface warming in the midlatitude western North Pacific during 2012 summer. Front. Mar. Sci. 11:1471446. doi: 10.3389/fmars.2024.1471446
Received: 27 July 2024; Accepted: 18 October 2024;
Published: 08 November 2024.
Edited by:
Şükrü Beşiktepe, Dokuz Eylül University, TürkiyeReviewed by:
Gyundo Pak, Korea Institute of Ocean Science and Technology, Republic of KoreaMichael Adam Alexander, National Oceanic and Atmospheric Administration (NOAA), United States
Copyright © 2024 Li, Wu, Xu, Zhao, Wang, Sheng, Shen and Zhu. This is an open-access article distributed under the terms of the Creative Commons Attribution License (CC BY). The use, distribution or reproduction in other forums is permitted, provided the original author(s) and the copyright owner(s) are credited and that the original publication in this journal is cited, in accordance with accepted academic practice. No use, distribution or reproduction is permitted which does not comply with these terms.
*Correspondence: Xiao-Hua Zhu, eGh6aHVAc2lvLm9yZy5jbg==
 Zhiyuan Li
 Gangfeng Wu1
 Xiao-Hua Zhu