 Chong Huang
 Yaning Zhao1
 Hongshuo Zhang
- 1School of Management Science and Engineering, Shandong University of Finance and Economics, Jinan, China
- 2Institute of Marine Economy and Management, Shandong University of Finance and Economics, Jinan, China
With the promotion of marine power strategies and marine ecological civilization construction, marine green development has become an important issue. This study utilizes the mixed distance function Epsilon-based measure and the global Malmquist–Luenberger index model, which accommodates both radial and non-radial models, to evaluate the marine green total factor productivity (GTFP) across 11 coastal regions of China. The findings of this study are as follows. First, the marine GTFP showed a gradual increase in China’s coastal regions during the study period, with notable differences observed among the three primary marine economic circles. Second, technological advancement was the primary driver of the transformation of marine GTFP. Third, the distribution across the space pattern of marine GTFP tended to be concentrated continuously, which shows that the overall spatial distribution pattern of marine GTFP remained relatively stable. Fourth, there is no obvious σ convergence in a northern, eastern marine economic circle. Both absolute and conditional β convergence exists, indicating that the marine GTFP converged to their respective steady-state levels during the study period. This study can provide decision-making reference for accelerating the green growth and sustainable development of China’s marine economy.
1 Introduction
In the 21st century, the marine economy has emerged as a strategic linchpin in China’s pursuit of high-quality economic growth and serves as a vital reservoir for ensuring sustainable development (Wang and Wang, 2019; Liu et al., 2021; Feng et al., 2024). According to the China Marine Economy Statistical Bulletin, China’s gross ocean product (GOP) soared to 9.9097 trillion yuan by 2023, constituting 7.9% of the nation’s overall GDP. Following the directives of the 18th National Congress of the Communist Party of China (CPC), considerable efforts were made to propel the nation toward maritime prowess, a commitment reaffirmed in the 19th CPC National Congress report, which underscored the imperative of “balancing land-sea integration and hastening the advancement of maritime capabilities.” The national “Fourteenth Five-Year Plan (2021-2025)” and the 2035 Long-Range Objectives Outline further emphasized the need to “harmonize land-sea development, foster collaborative human-ocean interactions, and drive progress in marine ecological conservation, economic development, and the safeguarding of marine interests to accelerate the journey toward maritime prominence.” China’s marine economy is now at a pivotal juncture of transformation, and the realization of high-standard marine economic development is a linchpin for the nation’s maritime ambitions (Liu et al., 2017; Cao et al., 2021; Yin et al., 2022).
Nonetheless, as the marine economy progresses, issues surrounding marine environmental pollution and ecological deterioration have become increasingly acute, posing significant obstacles to its robust expansion of the marine economy (Sun et al., 2017; Ren et al., 2018; Ye et al., 2021). Green total factor productivity (GTFP), which focuses on environmental sustainability, serves as a vital metric for assessing the integrity and advancement of marine economic activities and offers insights into the holistic advancement of regional marine resources, environmental preservation, and economic prosperity (Xu et al., 2023; Chen et al., 2024). With the aim of promoting a marine ecological civilization in China, research on marine GTFP has received increasing attention in recent years to truly reflect the growth efficiency of China’s marine economy. The index selection of marine GTFP differs from traditional total factor productivity, which not only selects marine labor and marine capital elements but also reflects the dependence and sustainability of the marine economy on resources. Therefore, this study holds that the marine GTFP aims to introduce the unique resource factors and the energy factors that will affect the marine environment on the basis of the traditional marine capital and marine labor input factors and by undertaking comprehensive assessments and spatially heterogeneous analyses of marine GTFP, we can effectively chart the trajectory of the advancement of China’s superior oceanic economy.
The objective of this study is to address the following questions: What is the status of green development in China’s coastal regions? What is the dynamic change trend of marine GTFP? What is the spatiotemporal difference and spatial gravity shift law of marine GTFP during the study period? Have the marine green development levels in China’s three major marine economic circles reached their respective convergence states? To solve these problems, this study applied the Epsilon-based measure (EBM) approach and the global Malmquist–Luenberger (GML) index model to measure marine GTFP and analyze its spatial distribution pattern and convergence features of marine GTFP in China’s coastal regions.
The remainder of this paper is organized as follows. Section 2 provides the literature review and contributions. Section 3 explains the methodology. Section 4 describes the results analysis, which contains data resources and empirical results. Finally, Section 5 presents the main conclusions and policy suggestions. A flowchart of this study is shown in Figure 1.
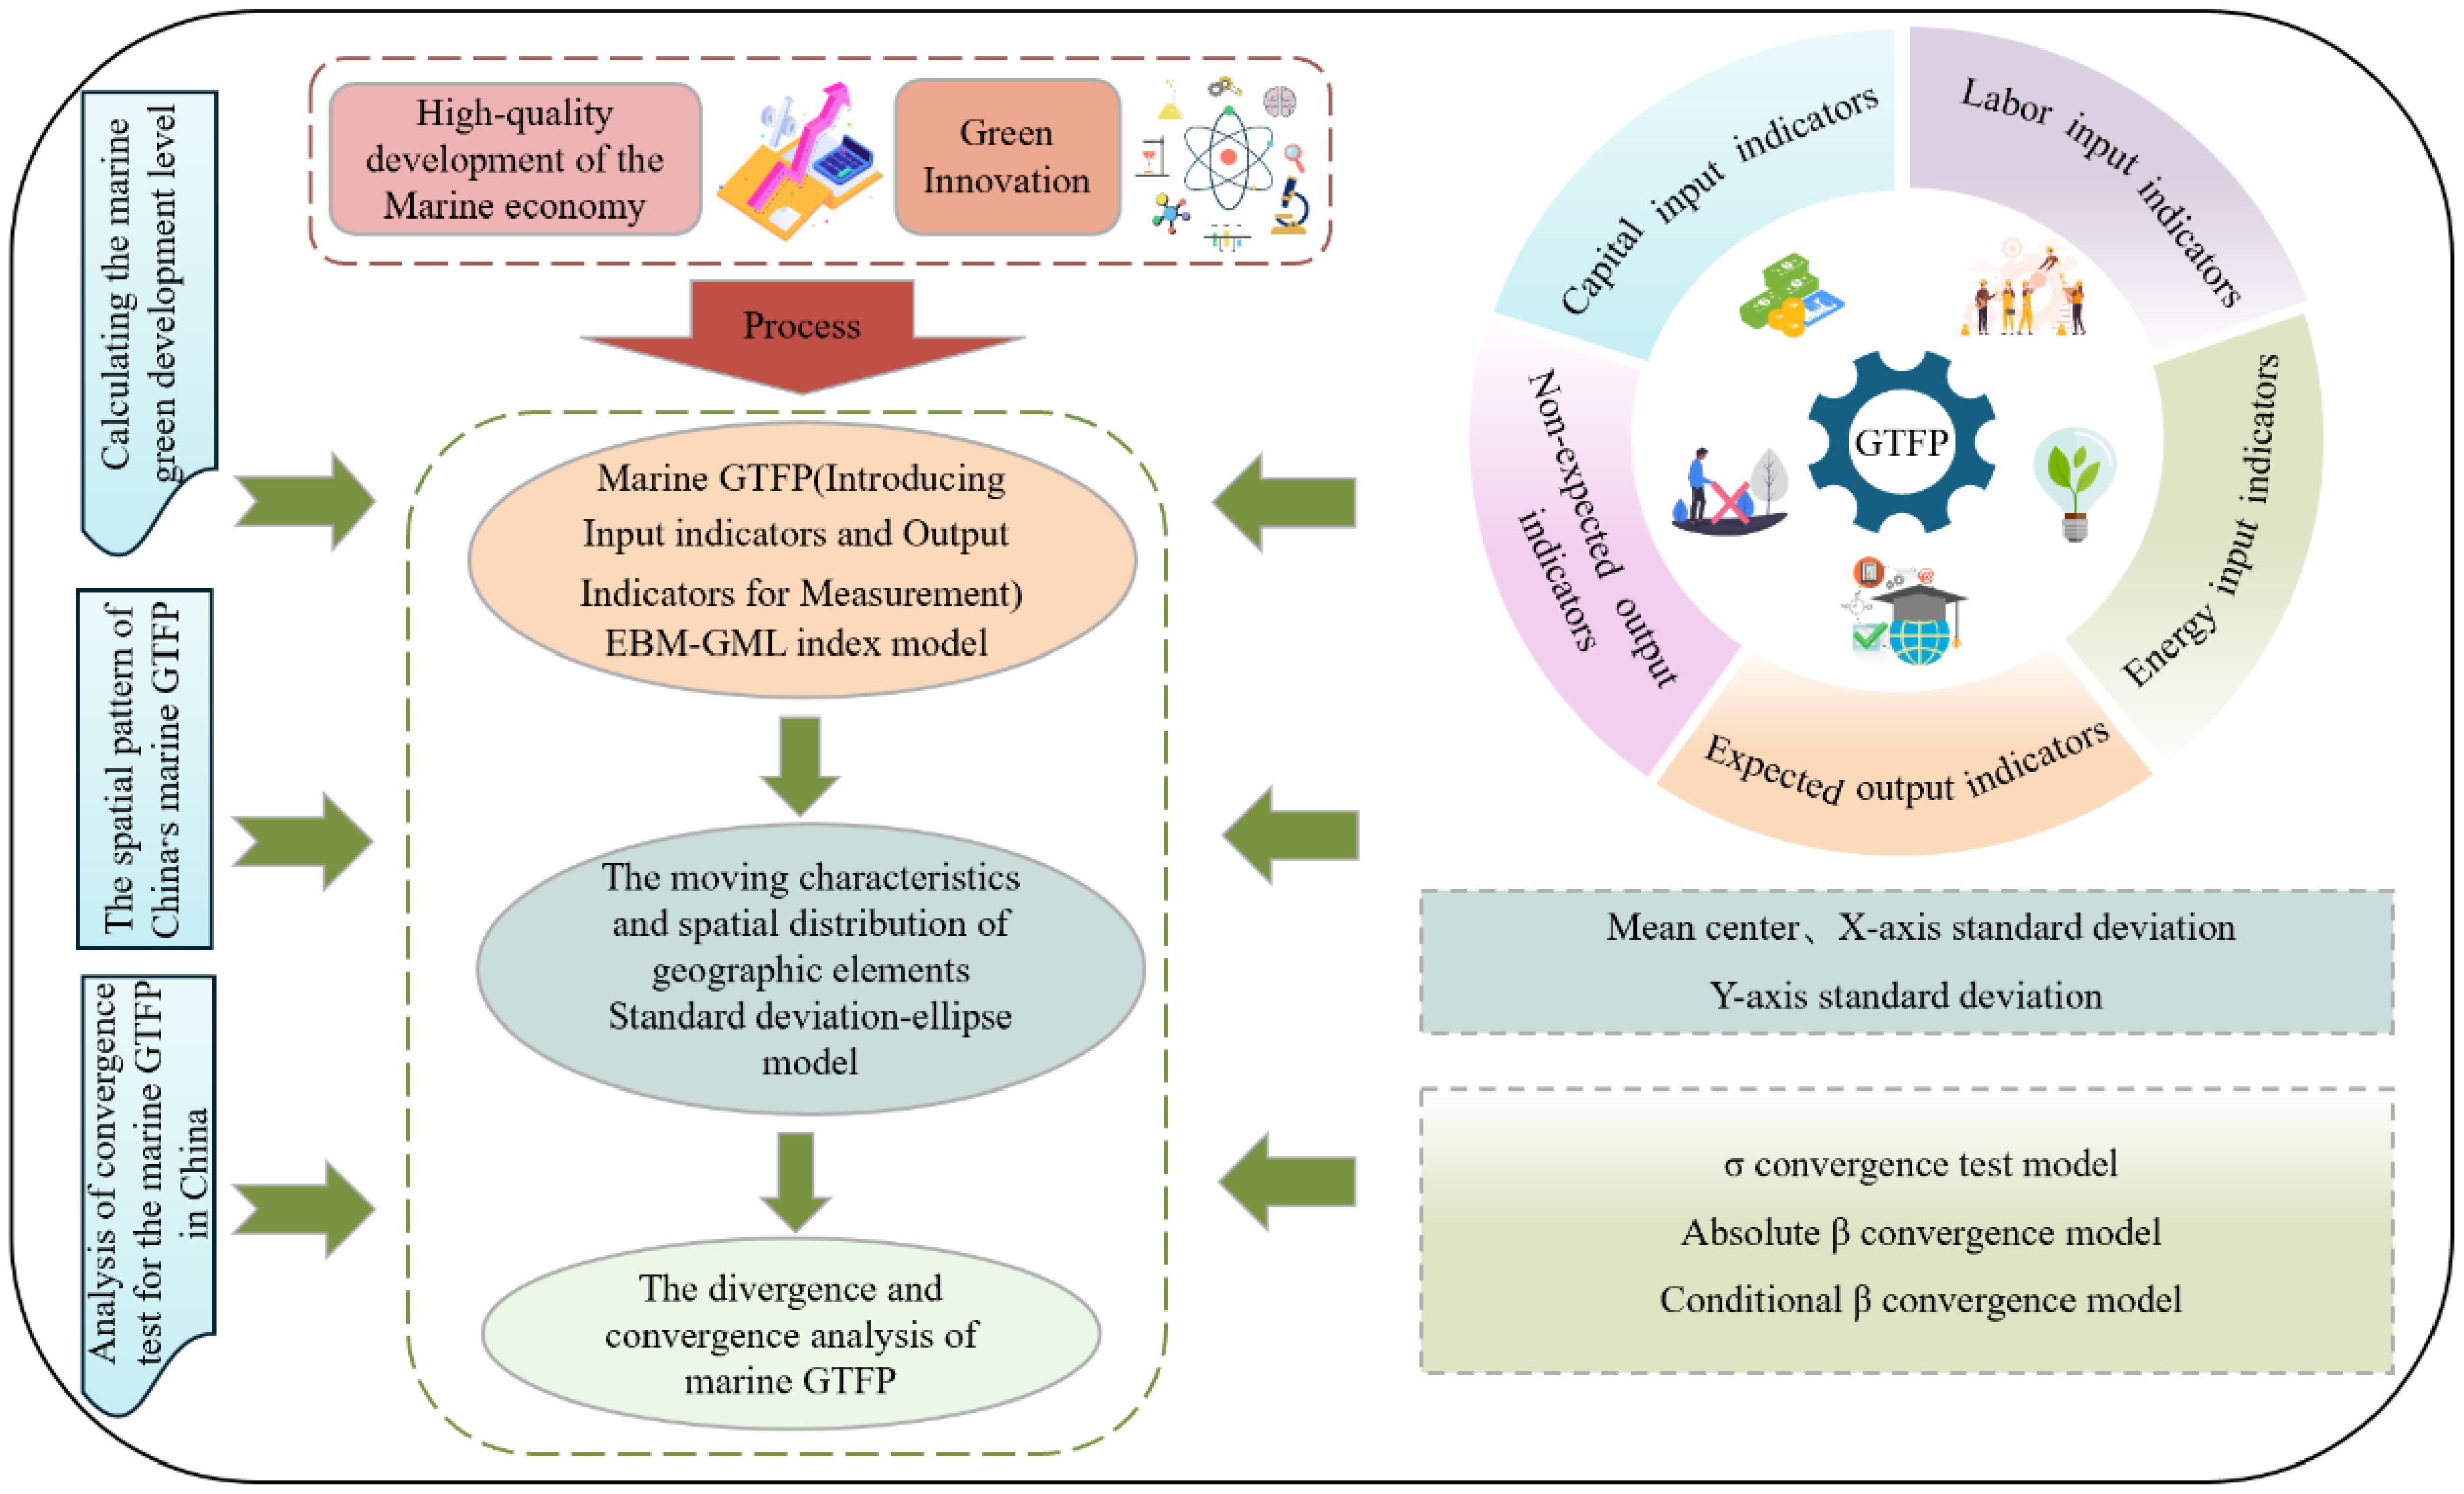
Figure 1. Flow chart.
2 Literature review
The advancement of a superior ocean economy is crucial for China’s enduring economic progress. By focusing on the comprehensive key points and processes of marine economic development, some studies aim to achieve a balanced supply-demand equilibrium at a higher level, ensuring the coordinated rapid growth of both the quantity and quality of the marine economy (Calel and Dechezleprêtre, 2016; Lin, 2020; Zheng et al., 2022; Jia et al., 2024). Driving development through total factor productivity (TFP) is central to realizing high-quality economic growth (Sheng et al., 2021), and some studies have employed TFP as a metric to gauge the quality of economic development (Ren and Ji, 2021; Qin et al., 2021). As environmental issues garner increasing attention amid economic development, scholars are endeavoring to refine the methods for calculating TFP. Currently, the methods for calculating GTFP primarily include the Solow residual and stochastic frontier methods. Among these, Solow (1957) is widely acknowledged as a pioneering figure, with the “Solow residual” theory particularly serving as a foundational theory for subsequent research.
Against the backdrop of resources and the environment becoming increasingly significant constraints on economic growth, GTFP, which integrates energy consumption and pollution emissions, is considered more scientifically robust in measuring the standard of economic expansion. Academics have suggested measures such as GTFP, which accounts for energy use and pollution emissions (Kumar, 2006; Wang et al., 2010; Chen and Qian, 2020). While TFP overlooks negative externalities such as environmental pollution, which affect the ocean economy, the enduring development of the ocean economy necessitates resource conservation and conservation of oceanic ecological systems. The GTFP also considers resource and environmental constraints, providing a more accurate reflection of the essence of high-standard growth in the maritime economy (Zhang et al., 2004a; Bolam et al., 2006; Shao et al., 2021).
Faced with the pressing challenge of severe ecological degradation in marine environments, embedding green development models more effectively in the high-standard transformation of the ocean economy has become a crucial objective of macroeconomic policy regulation (Islama and Shamsuddoha, 2018; Brunel, 2019; Zheng et al., 2020; Tomashuk et al., 2023). Scholars have conducted research on the high-quality and rapid development of the marine economy (Xu and Liu, 2023; Gao et al., 2024). Sun et al. (2023) constructed a “2 + 6+4” bi-directional multi-indicator comprehensive evaluation framework to measure the high-quality development of China’s Marine economy. Ji et al. (2024) used random forest regression and partial correlation graphs to reveal the drivers of high-quality marine economic development. Some scholars use the GTFP as an indirect measure of the high-standard growth of the ocean economy. Recognizing the significant differences among sectors within the ocean industry, Wang et al. (2021) employed the network data envelopment analysis (DEA) approach to assess marine production efficiency by decomposing complex processes to study the potential impact of each link on it. Zhao et al. (2021) utilized the slacks-based measure (SBM) model considering unwanted outputs to compute the efficiency of ocean economies in 20 coastal countries. In addition, they applied the Malmquist–Luenberger output efficiency model to analyze the dynamic variations in marine economic efficiency, with findings that offer insights that foster the enduring growth and resilience of the coastal economy.
Considering that innovative technologies may lead toward energy savings, pollution abatement, or increased economic production, Kang et al. (2020) conducted deviation and influencing factor analyses of technological advancements in the ocean economy. They employed the DEA-Malmquist model to quantify directional technological advancements and subsequently examined the elements contributing to directional biases in technological progress. Their study has significant guiding implications for the reduction in the maritime economy’s energy usage and pollution emissions and offers maritime insight into the growth of the European maritime economy. Zou et al. (2024) measured China’s marine green economy efficiency by using a two-stage network DEA model and analyzed the influencing factors through the panel Tobit model. Their findings are useful in identifying the operational characteristics of the marine green economy at different stages. Chen et al. (2023) used the SBM model and the GML index to discuss the Marine eco-efficiency of China’s coastal areas and its interregional technological gap. Yang et al. (2024) comprehensively used the entropy and analytic hierarchy process to determine the weights of each index. Then, they used TOPSIS to describe the relative performance level of Marine ecological civilization.
Building on the definition of the implications of high-standard growth in the ocean economy, some scholars have examined the extent of high-standard growth in the ocean economy through the construction of evaluation indicator systems. Guided by five development concepts based on the actual situation and development trends of China’s oceanic industry, Yu and Xing (2021) created a comprehensive system of indicators to assess China’s oceanic economic development status. They applied the integrated entropy weight method to evaluate the spatial and temporal characteristics of China’s maritime economic growth, leveraged spatial spillover effects to strengthen the comparative advantages of regions experiencing high-standard progress, and promoted cooperative efforts to advance high-standard growth of the oceanic industry. Based on the “New Development Philosophy,” Liu et al. (2020) developed an assessment framework for the high-standard growth of Jiangsu Province’s maritime economy in accordance with five key aspects: “innovation, coordination, green, openness, and sharing.” They used a linear weighting model to calculate the extent of high-standard processes in the ocean economy. Essentially, their study integrates the framework with the coupling coordination index model and kernel density estimation technique to investigate the evolutionary dynamics of high-standard growth in Jiangsu Province’s maritime economy. Yu et al., 2024 studied the tradeoff between economic expansion and environmental protection in the marine economy and found that an underdeveloped marine industrial structure in coastal provinces has a negative impact on the marine economy.
Compared with previous literature, the findings and contributions of the present study lie in the following four aspects. First, it measures the green development level of China’s coastal regions by utilizing the mixed distance function EBM-GML model, which accommodates both radial and non-radial models simultaneously. Second, the improvement in the technological progress level was the main driving force for the growth of marine GTFP during the study period. Third, centroid standard deviation ellipse-related parameters and spatial position transfer paths of the marine GTFP in China’s 11 coastal regions, which explored the spatial change characteristics of the marine green development level. Fourth, it used the α-convergence and β-convergence methods to explore the convergence feature, providing decision-making references for accelerating the high-quality development and green growth of China’s marine economy.
3 Methodology
3.1 Epsilon-based measure model
A basic characteristic of the conventional radial DEA patterns is that the input and output parameters must be altered to equivalent ratios. However, the conventional radial DEA model overlooks the influence of slack parameters when calculating efficiency values. Tone (2001) considered the effect of slack variables on correcting efficiency values and proposed the SBM model, which is a non-angular and non-radial model grounded in the measurement of slack variables. Nevertheless, this model also has shortcomings because the input and output variables in the actual manufacturing process may simultaneously possess radial and non-radial characteristics, leading to measurement deviations between the target and actual values.
When calculating function models that include non-desirable outputs, there is a non-radial connection between resources, energy usage, and pollutant emissions and a radial relationship between capital, labor, and economic output. This study adopts the EBM model (Tone and Tsutsui, 2010) to avoid these complexities, which is a mixed-distance function model that accommodates both radial and non-radial models simultaneously. Compared with other efficiency measurement models, the EBM model has the following advantages: (1) it contains slack variables in efficiency measurement, which effectively prevents the efficiency measurement result from exceeding the true efficiency benchmark, and (2) it considers the linear correlation among input factors, which prevents efficiency measurement results that are lower than the actual efficiency level. The mathematical expression for the EBM model is as follows:
where represents the optimal solution for efficiency; denotes the radial efficiency value; symbolizes the weight assigned to input indicators; denotes the weight allocated to desirable output indicators; symbolizes the weight assigned to non-desirable output indicators, satisfying ; represents the parameter that encompasses non-radial as well as radial efficiency values; if , the EBM model becomes the traditional input-focused CCR model; if , the EBM model becomes a non-radial, non-angular SBM model.
3.2 Global malmquist–luenberger index model
Based on the EBM mixed radial function model, the GML index model can be further constructed (Oh, 2010). The GML index model is primarily applicable for measuring changes in the productivity of green factors that contain undesirable outputs. The change in GTFP from period to period was calculated as follows:
The GML index comprises two parts: technical efficiency change (TEC) and technical change (TC).
represents the spatial metrics of the given timeframe , indicating the distance between the effective production frontier and the decision-making unit. If , it signifies an improvement in GTFP from period to period ; if , it signifies a decline in GTFP from period to period . The GML index can be subdivided into the TC and TEC indices. The TC index represents the degree to which decision-making units move toward the production frontier during adjacent periods. If this index exceeds 1, it signifies an advancement in green production technology. The TEC index represents the catching-up extent to which each decision-making unit approaches the production frontier from period to period . If this index exceeds 1, it signifies an improvement in green technical efficiency. TEC can be further articulated as the outcome of multiplying the index for pure technical efficiency change (PEC) by that for scale efficiency change (SEC). This study uses the EBM-GML model to calculate the marine GTFP of China’s coastal regions. The coexistence of radial and non-radial characteristics is considered, which can accurately reflect the green development level of China’s marine economy.
3.3 Standard deviation-ellipse model
Lefever proposed the standard deviation-ellipse model (Lefever, 1926), which analyzes the moving characteristics and spatial distribution of geographic elements in two-dimensional space. The key parameters for describing the relevant geographic elements are the mean center, movement distance, movement speed, minor axis, and major axis. The specific calculation formulae are as follows:
In the formulation, represents the decision-making units; x and y represent the positional offsets of each point from the central area; the spatial location of the geographic elements is denoted as ; represents the weight; represents the dispersion along the x-axis; represents that along the y-axis; the angle of the distribution pattern can be obtained according to the formula .
3.4 σ convergence test model
The σ convergence test model generally uses statistical indicators of dispersion to intuitively reflect the development gap of economic levels among different economies. In this study, the σ convergence can be understood as a process in which the discrete degree of marine green development in different coastal areas decreases continuously over time. The coefficient of variation method is used for the calculations. This can be calculated using (9).
3.5 Absolute β convergence model
In this study, natural logarithms are applied in the application of the absolute β convergence model, and the calculation formula is presented below:
and symbolize the GTFP of the ith province (municipality and autonomous areas) at the start and conclusion of a specific period, respectively. The ith province (municipality or autonomous area) is referred to as subscript i, the base year as subscript t, and the end year as subscript t+1. The average growth rate of the GTFP for the ith province (municipality, autonomous areas) is denoted by ; the intercept term is denoted by ; the growth rate coefficient is denoted by β; the stochastic error term is denoted by ui,t. When β is a negative value, absolute convergence is present.
3.6 Conditional β convergence model
Within the context of in terms of β convergence, additional factors influencing GTFP are incorporated to form conditional β convergence, which is then examined. Drawing on a review of relevant literature, this study incorporates four control variables into the absolute β convergence framework to derive the conditional β convergence model:
4 Result analysis
4.1 Calculation indicator selection of marine GTFP
4.1.1 Data sources
Considering data accessibility, we selected information from 11 coastal regions in China from 2006 to 2016 to calculate the degree of green development in the marine economy. This is because China’s “Eleventh Five-Year Plan” formally proposed power saving and emissions control in 2016, which was officially integrated into the constraints of China’s economic growth. The statistics used in the mathematical operations, including the input, expected output, and non-expected output factors, were chiefly sourced from the “China Ocean Statistical Yearbook,” “China Energy Statistical Yearbook,” “China Environmental Yearbook,” and “China Ocean Economic Statistical Bulletin” for the corresponding years.
4.1.2 Calculation indicators of marine GTFP
● Input indicators. Specifically cover labor, capital, and energy.
○ Labor input indicators. Regarding labor input, the number of persons employed by sea is chosen for measurement (Sun and Song, 2021), and data are from the “China Ocean Statistical Yearbook” for each year.
○ Capital input indicators. Marine investment stock was selected as the capital input. As there is no pertinent information on marine fixed-asset investments, this study follows Zhang et al. (2004b). Specifically, it calculates the capital stock of coastal provinces and municipalities using an ongoing inventory approach, with 2000 as the benchmark year. This was adjusted using the GOP-GDP ratio to obtain the marine capital stock for each province and municipality.
○ Energy input indicators. In terms of energy input, this study, referring to the most relevant studies, regards energy as an input element and uses the GOP-GDP ratio to convert the energy consumption of each coastal province and city. The unit is 10,000 tons of standard coal.
● Output indicators.
○ Expected output indicators. The GOP for each province and municipality is used as the measurement, and statistics are obtained from the “China Ocean Statistical Yearbook.”
○ Non-expected output indicators. Considering the principal aims proposed in the climate action and resource conservation scheme within China’s “Fourteenth Five-Year Plan,” and considering the existing environmental regulatory framework does not completely capture a single form of pollutants, the non-expected output primarily includes the following forms: industrial waste gas, industrial wastewater, and industrial solid waste. The following basic data were selected: marine industrial wastewater discharge, solid waste, sulfur dioxide emissions, and carbon dioxide emissions. These were calculated using the proportion of ocean production value to the local production value to obtain the final calculated data.
4.1.3 Impact indicators of marine GTFP
This study selected four other control indicators that affect marine GTFP: economic development level (Economy), marine industrial structure (Industry), level of openness (Open), and environmental regulation (Regulation). The GOP per capita represents the degree of economic development, the added value of the marine tertiary industry/added value of the marine secondary industry represents the marine industrial structure, the level of openness is the ratio of regional import and export volumes to GDP, and investment in industrial pollution control/GOP represents environmental regulation.
Descriptive statistics of the variables is shown in Table 1.
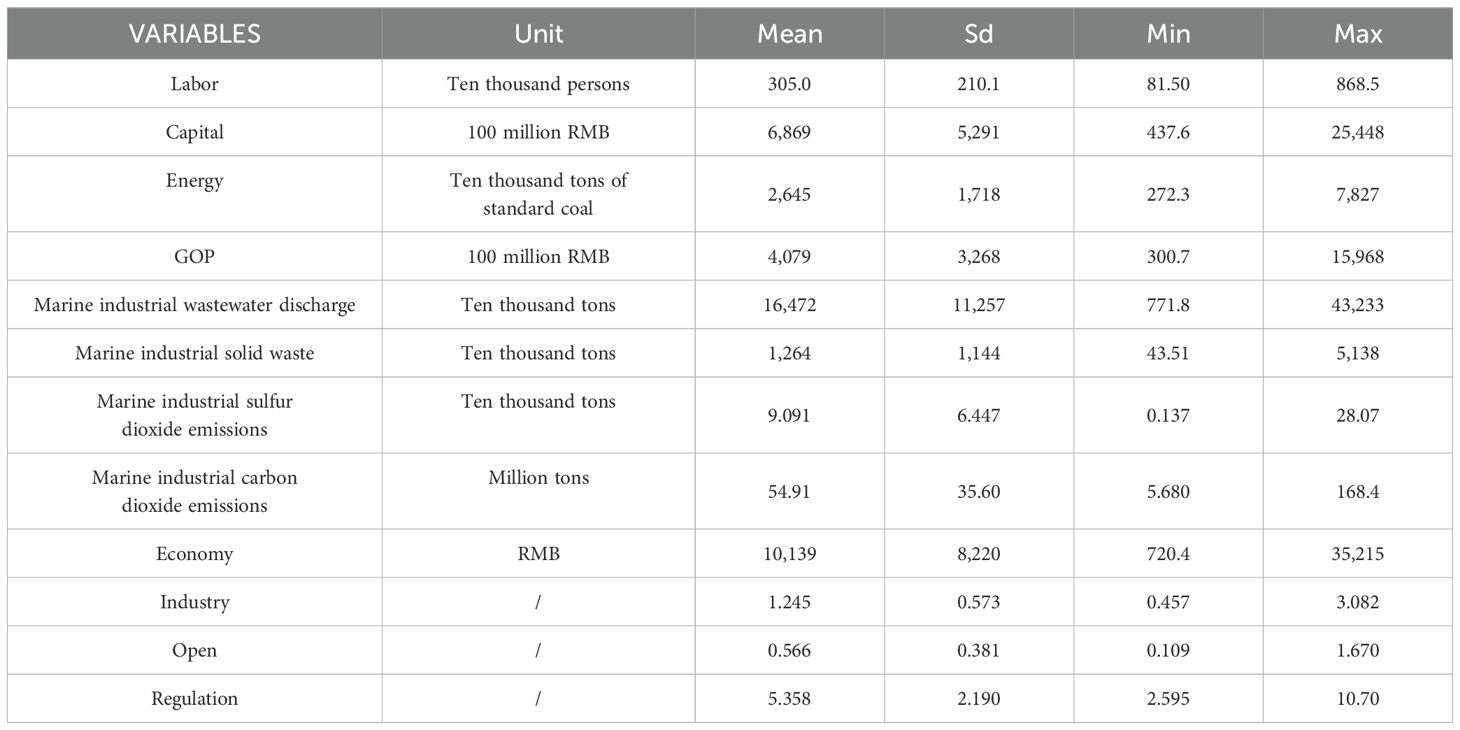
Table 1. Descriptive statistical analysis of the indicators.
4.2 Estimation of marine GTFP based on the EBM-GML index model
In this study, a hybrid radial EBM-GML productivity index model was employed for estimation. The calculated results represent the marine GTFP from time t to t+1. Moreover, this study calculated the marine GTFP for different coastal regions of China from 2007 to 2016. The findings are presented in Table 2 and Figures 2 and 3.
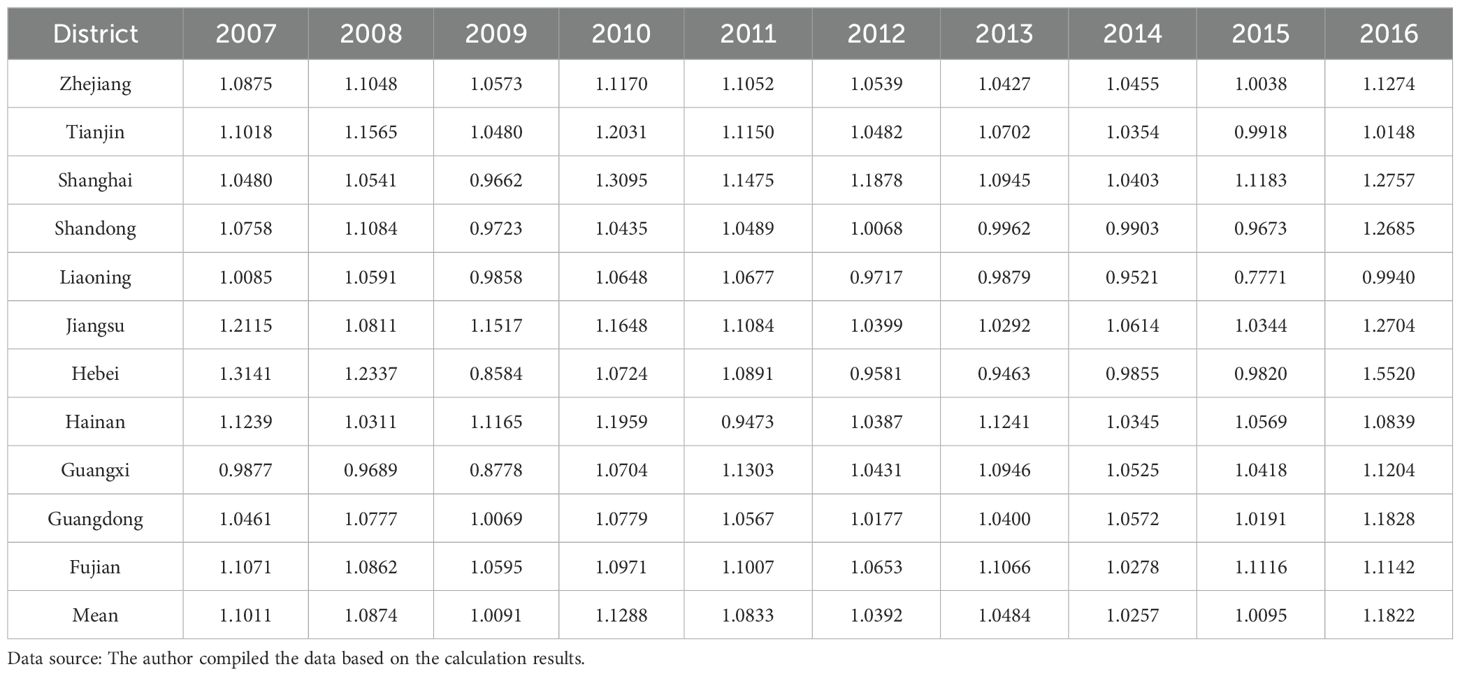
Table 2. Marine GTFP of 11 coastal regions in China from 2007 to 2016.
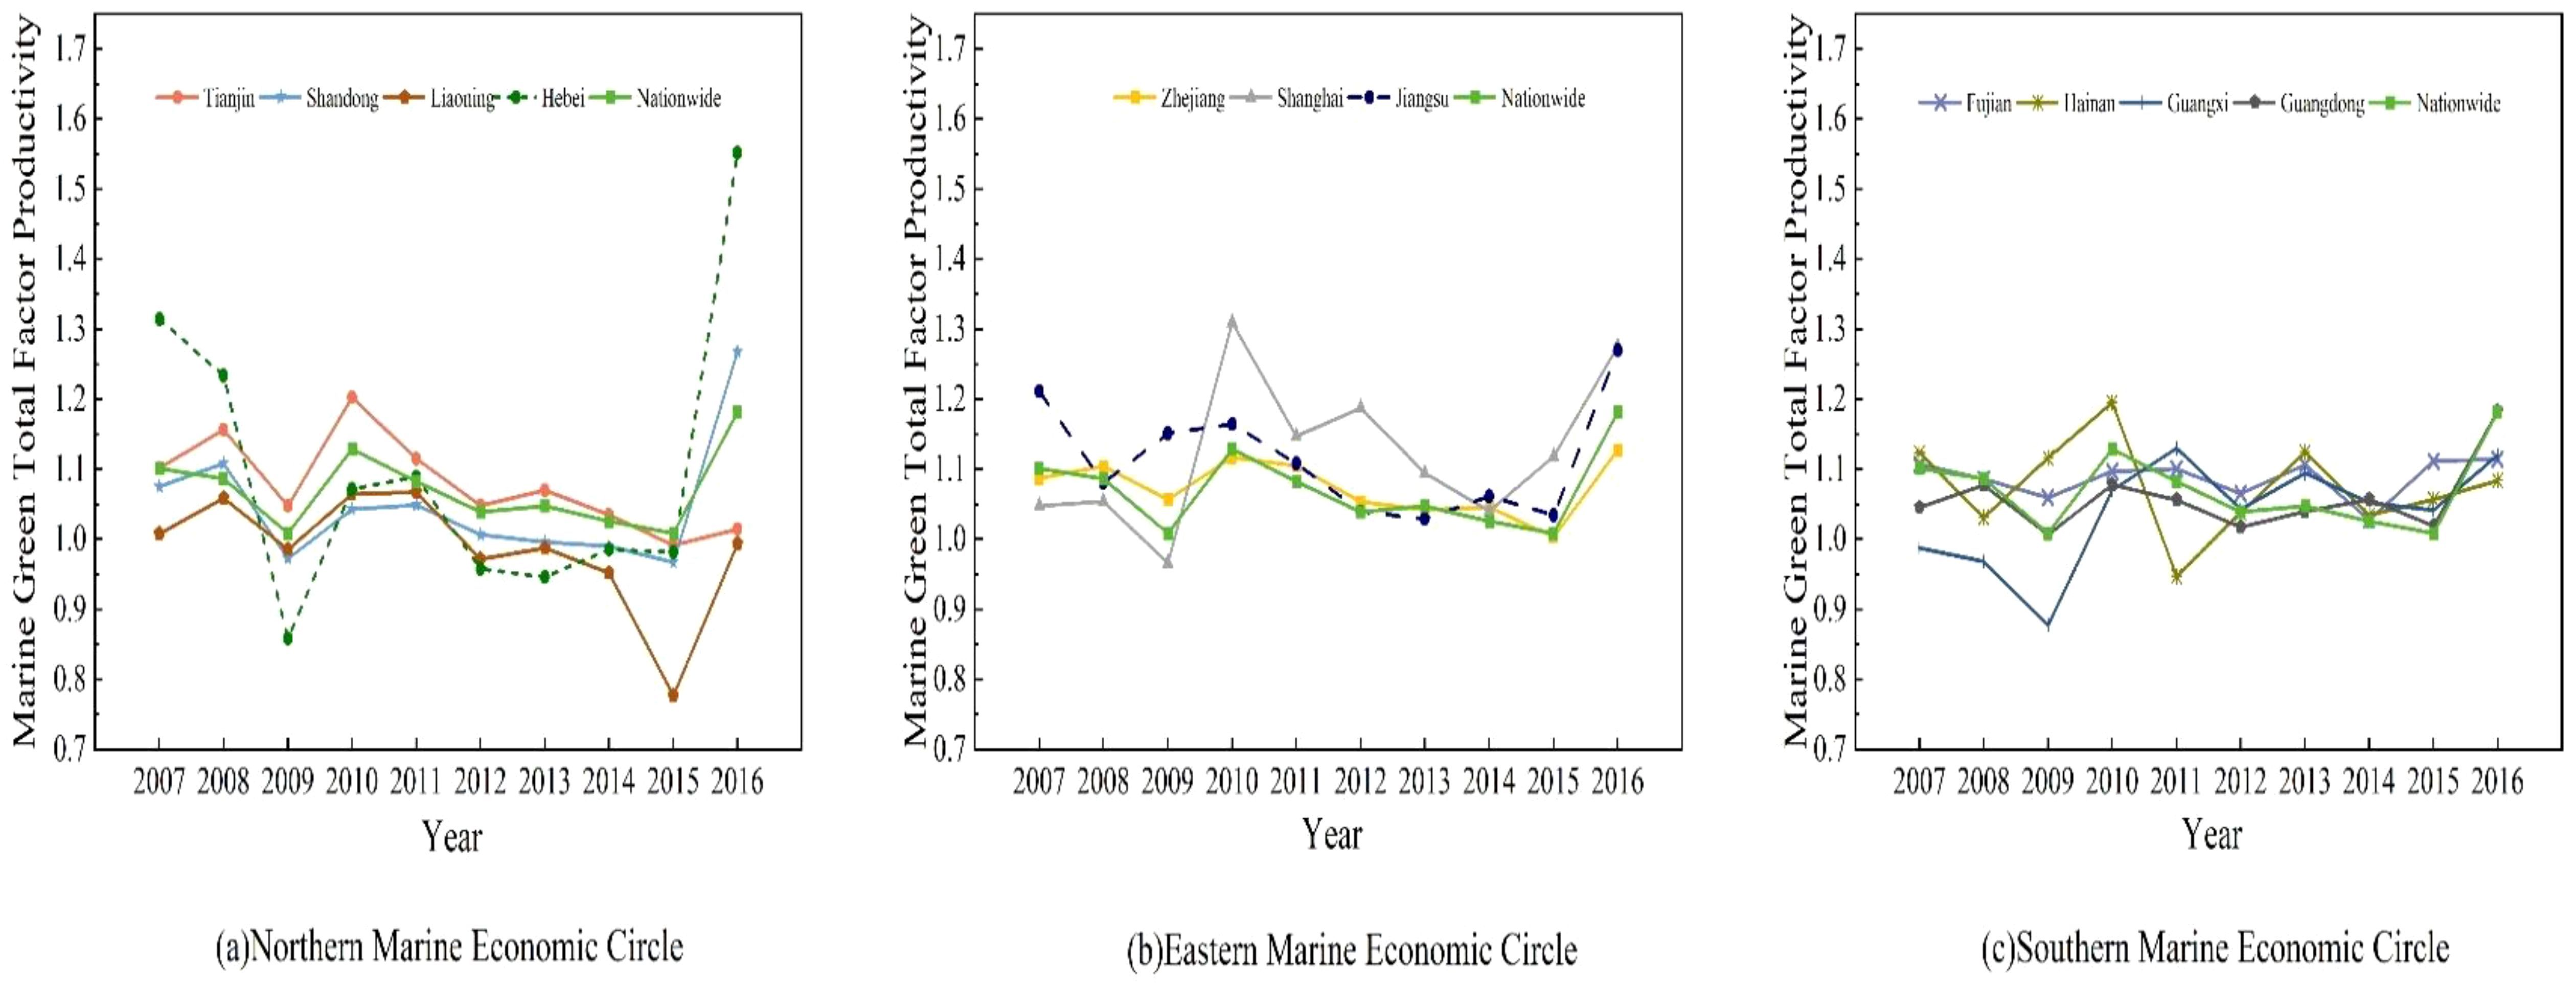
Figure 2. Trend of China’s marine GTFP from 2007 to 2006. (A) Trend of marine GTFP in Northern Marine Economic Circle. (B) Trend of marine GTFP in Eastern Marine Economic Circle. (C) Trend of marine GTFP in Southern Marine Economic Circle.
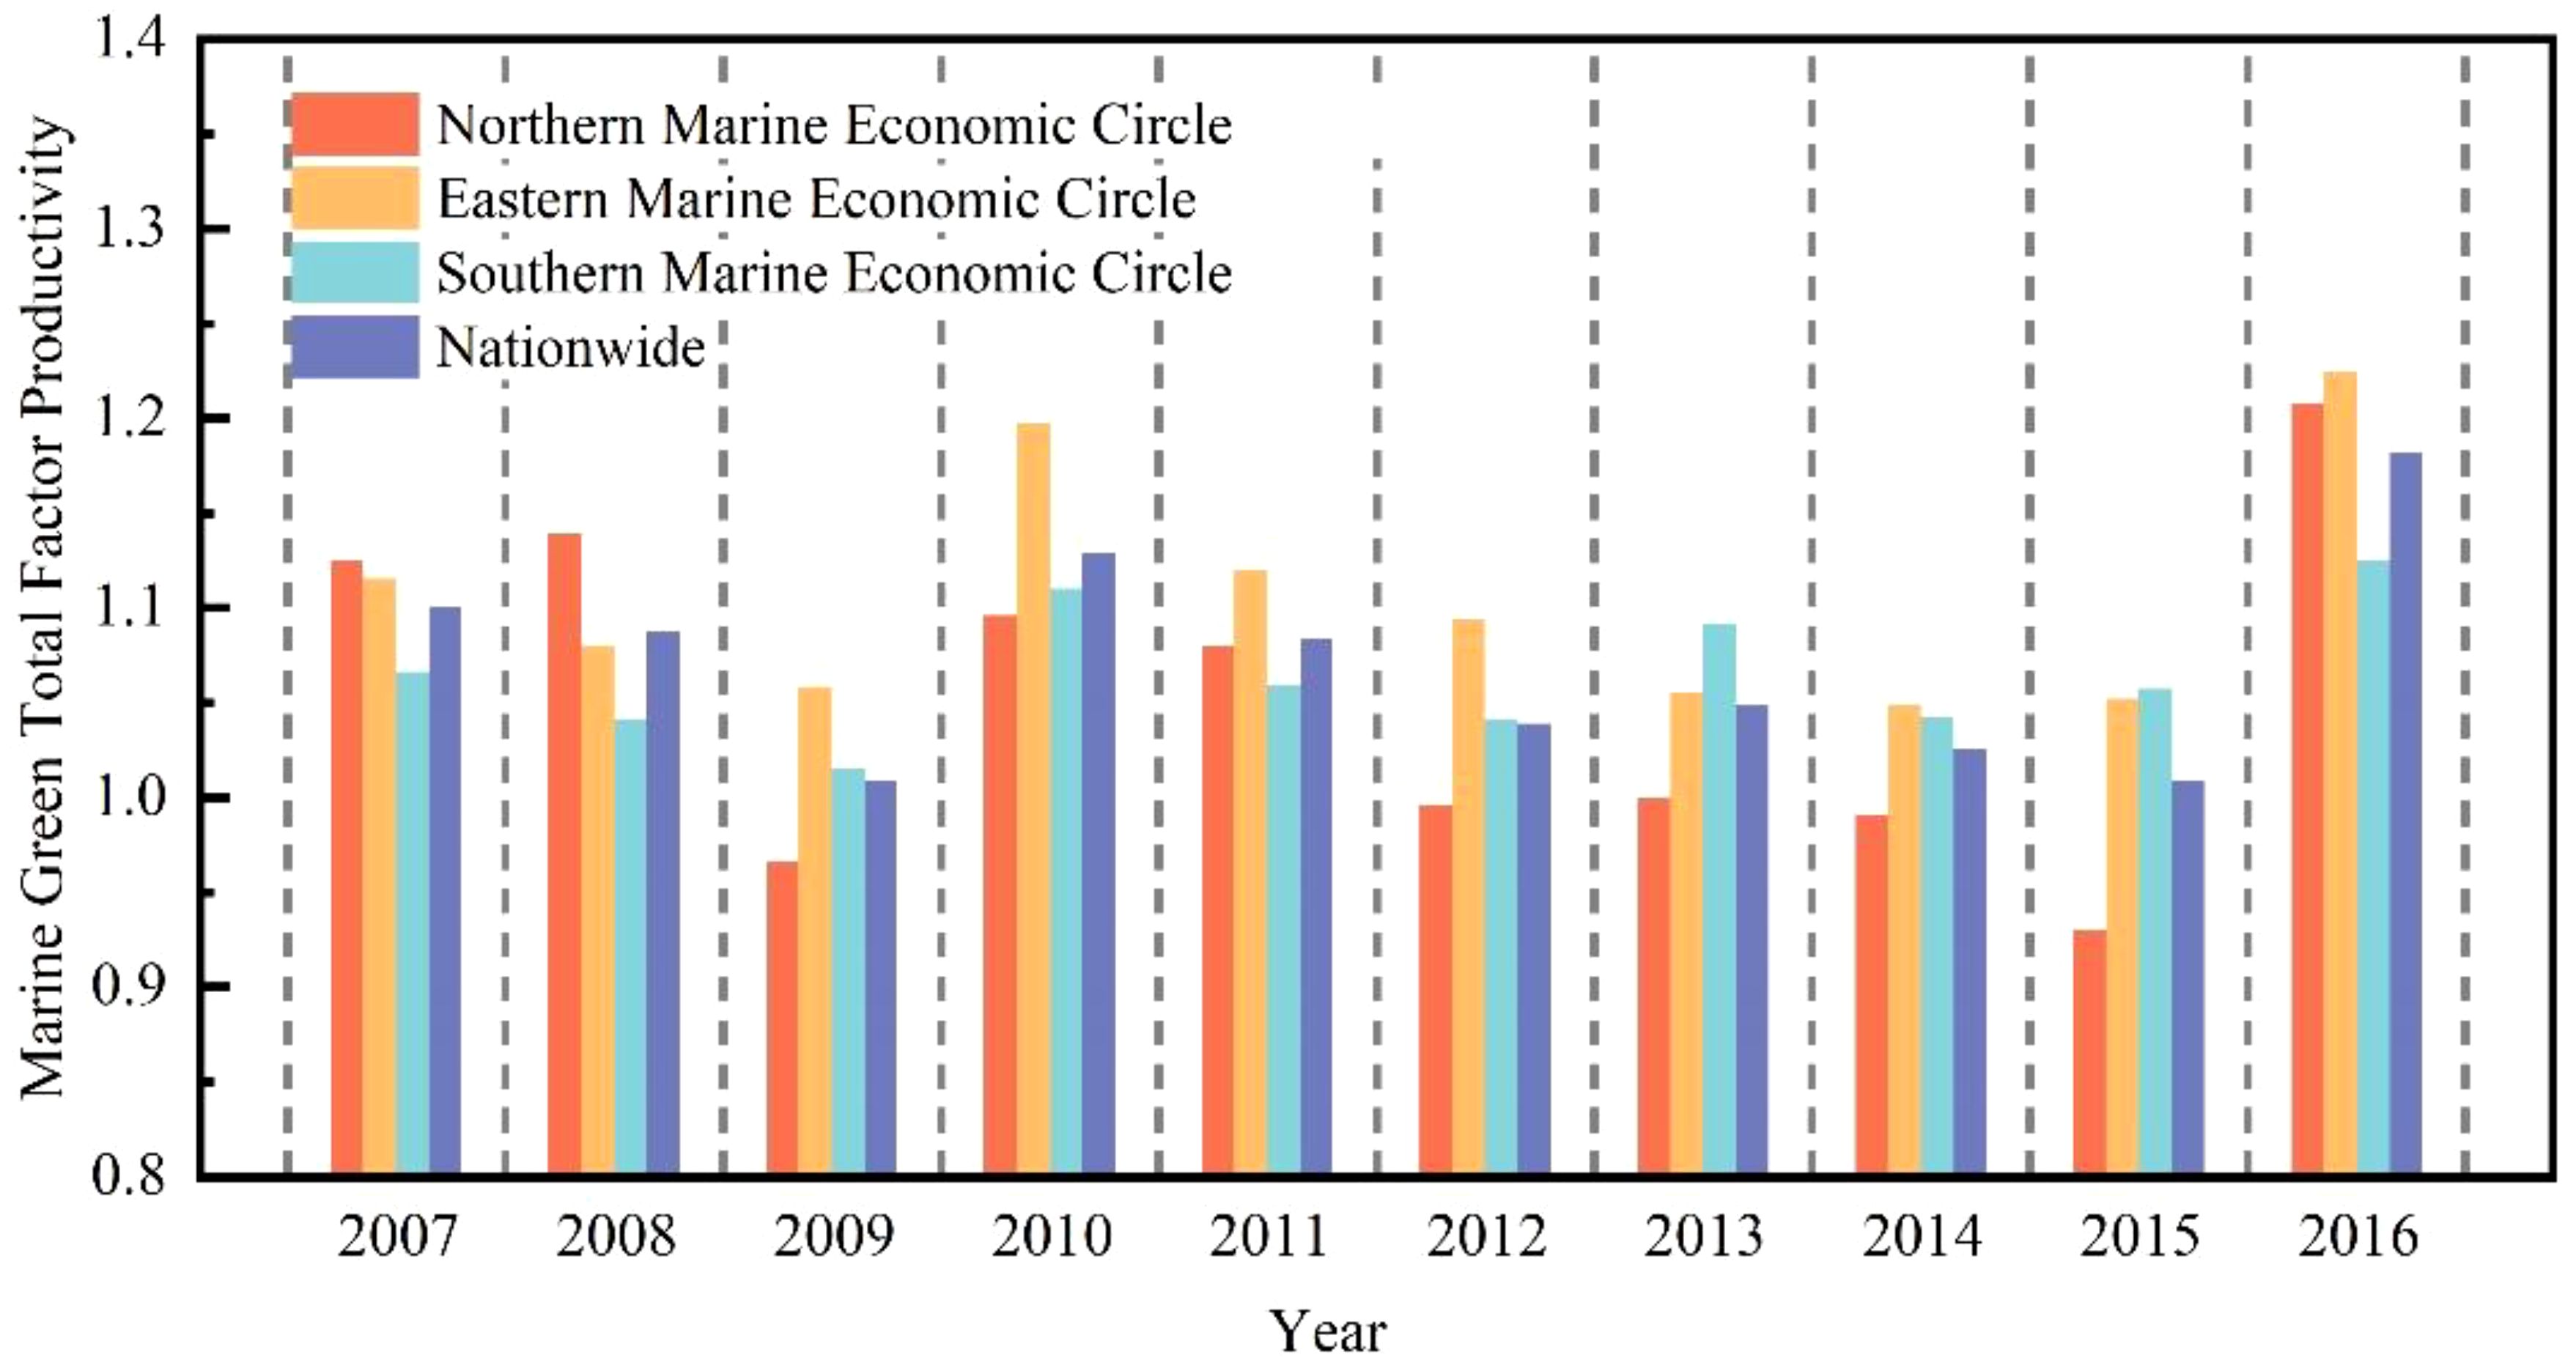
Figure 3. Comparison of the average Marne GTFP of the three marine economic circles from 2007 to 2016.
The results (Table 2) show that the overall average marine GTFP of the 11 coastal regions of China increased from 1.1011 in 2007 to 1.1822 in 2016. Throughout the study period, the average comprehensive marine GTFP of the 11 coastal regions of China was 1.0715. The present state of low-level development in China’s green marine sector is undergoing transformation. China is gradually moving away from a low-quality, extensive, and outward-oriented model of marine economic growth and transitioning toward a high-quality, intensive, and efficient model. The quality and efficiency of China’s marine economy are becoming increasingly evident.
To obtain more thorough insight into the dynamic changes in the marine GTFP of the 11 coastal regions and primary marine economic circles in China, this study presents a trend chart of the marine GTFP in the 11 coastal regions of China from 2007 to 2016 (Figure 2) and a comparative chart of the average marine GTFP in the three major marine economic circles (Figure 3).
As depicted in Figure 2, the marine GTFP levels in the 11 coastal regions of China exhibited distinct phase characteristics, reflecting an overall trend of fluctuating increase. From 2007 to 2009, the marine GTFP declined slowly, decreasing from 1.1011 in 2007 to 1.0091 in 2009 (a decline of 8.35%). This indicates that, under the adverse effects of the 2008 financial crisis, China’s main green productivity experienced a certain impact, displaying a noticeable downward trend. In 2010, marine green productivity recovered to 1.1288. From 2011 to 2015, the marine GTFP in most of China’s coastal regions declined to varying degrees. The main reasons for this were that China was in the “Twelfth Five-Year Plan,” and there was increased pressure to reorientate the ocean industry composition and enhance transformation. Some ocean industries face issues, such as overcapacity and degradation of the oceanic ecological environment. In 2016, China introduced the “Maritime power strategy,” explicitly stating that the growth of the marine economy is a key direction for China’s future economic growth. This emphasizes the need to strengthen the extraction and application of marine resources, foster marine industry, and protect the oceanic ecological environment.
Consequently, the comprehensive marine GTFP increased to 1.1822 in 2016. The 19th National Congress of the CPC proposed accelerating the establishment of an ecological civilization by placing higher requirements on environmental pollution control. It has made important deployments to advance the establishment of an ecological civilization and accelerate the development of marine power. Entering the “Thirteenth Five-Year Plan” period, with the introduction of the economic and social development concepts of “innovation, coordination, green, openness, and sharing,” China’s marine economy has evolved into a more advanced form, with optimized division of labor and a more rational structure. China’s marine GTFP is a significant milestone.
Looking at the marine economic circles of China (Figure 3), the regions with the highest average yearly growth rates of comprehensive marine GTFP are the eastern, southern, and northern marine economic circles. The comprehensive marine GTFP of the eastern marine economic circle increased from 1.1156 in 2007 to 1.2245 in 2016 and exhibited a fluctuating trend during the study period. The average marine GTFP was 1.1047, with a yearly growth rate of 0.94%. The marine GTFP of the southern marine economic circle increased from 1.0662 in 2007 to 1.1253 in 2016 and remained stable throughout the study period. The average marine GTFP was 1.0650, with a yearly growth rate of 0.54%. The marine GTFP of the northern marine economic circle increased from 1.1251 in 2007 to 1.2073 in 2016, with an average value of 1.0531.
4.3 Decomposition analysis of China’s marine GTFP
The variation and decomposition trends in the comprehensive marine GTFP for the 11 coastal regions and three primary marine economic circles in China from 2007 to 2016 are displayed in (Table 3; Figure 4). From 2007 to 2016, the overall growth rate of the marine GTFP in the 11 coastal regions of China reached approximately 7.15%. Specifically, technological progress consistently displays an upward trend, with a mean rate of increase of 7.98%, whereas the average decrease in technological efficiency was 0.86%. These results suggest that technological advancement is the key element influencing the comprehensive variation in marine GTFP. Technological advances stimulated the comprehensive development of marine GTFP. Concurrently, the trends in the changes of absolute technical efficiency and economies of scale efficiency have constrained the rise in comprehensive marine green productivity, with rates of increase of -0.19% and -0.67% in turn. The empirical results suggest that variations in scale efficiency have a greater adverse effect on China’s marine GTFP.
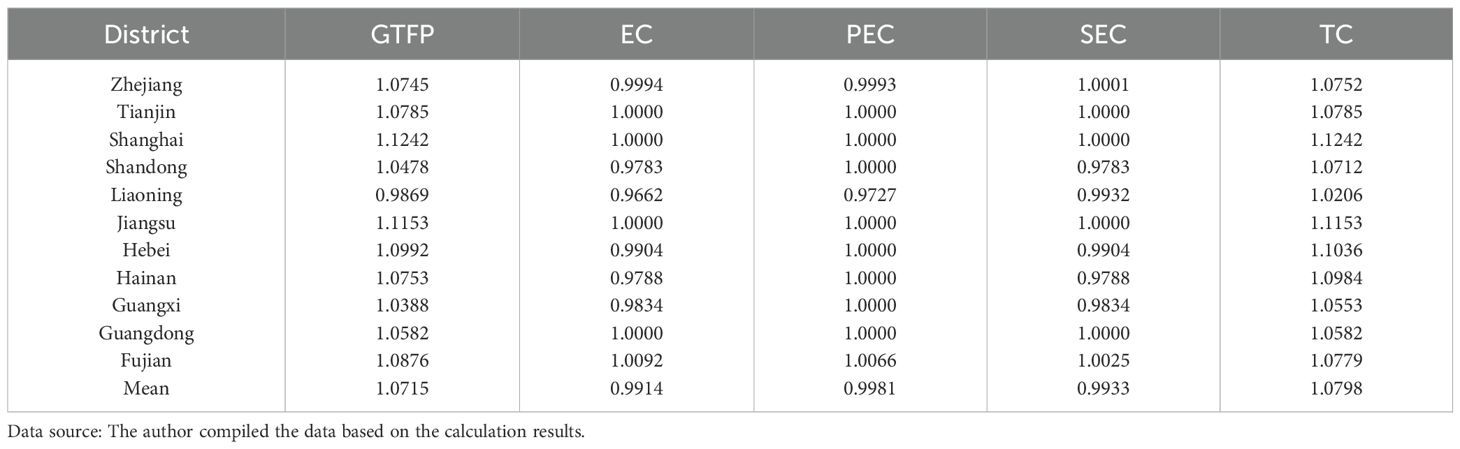
Table 3. Marine GTFP and its decomposition in 11 coastal regions of China from 2007 to 2016.
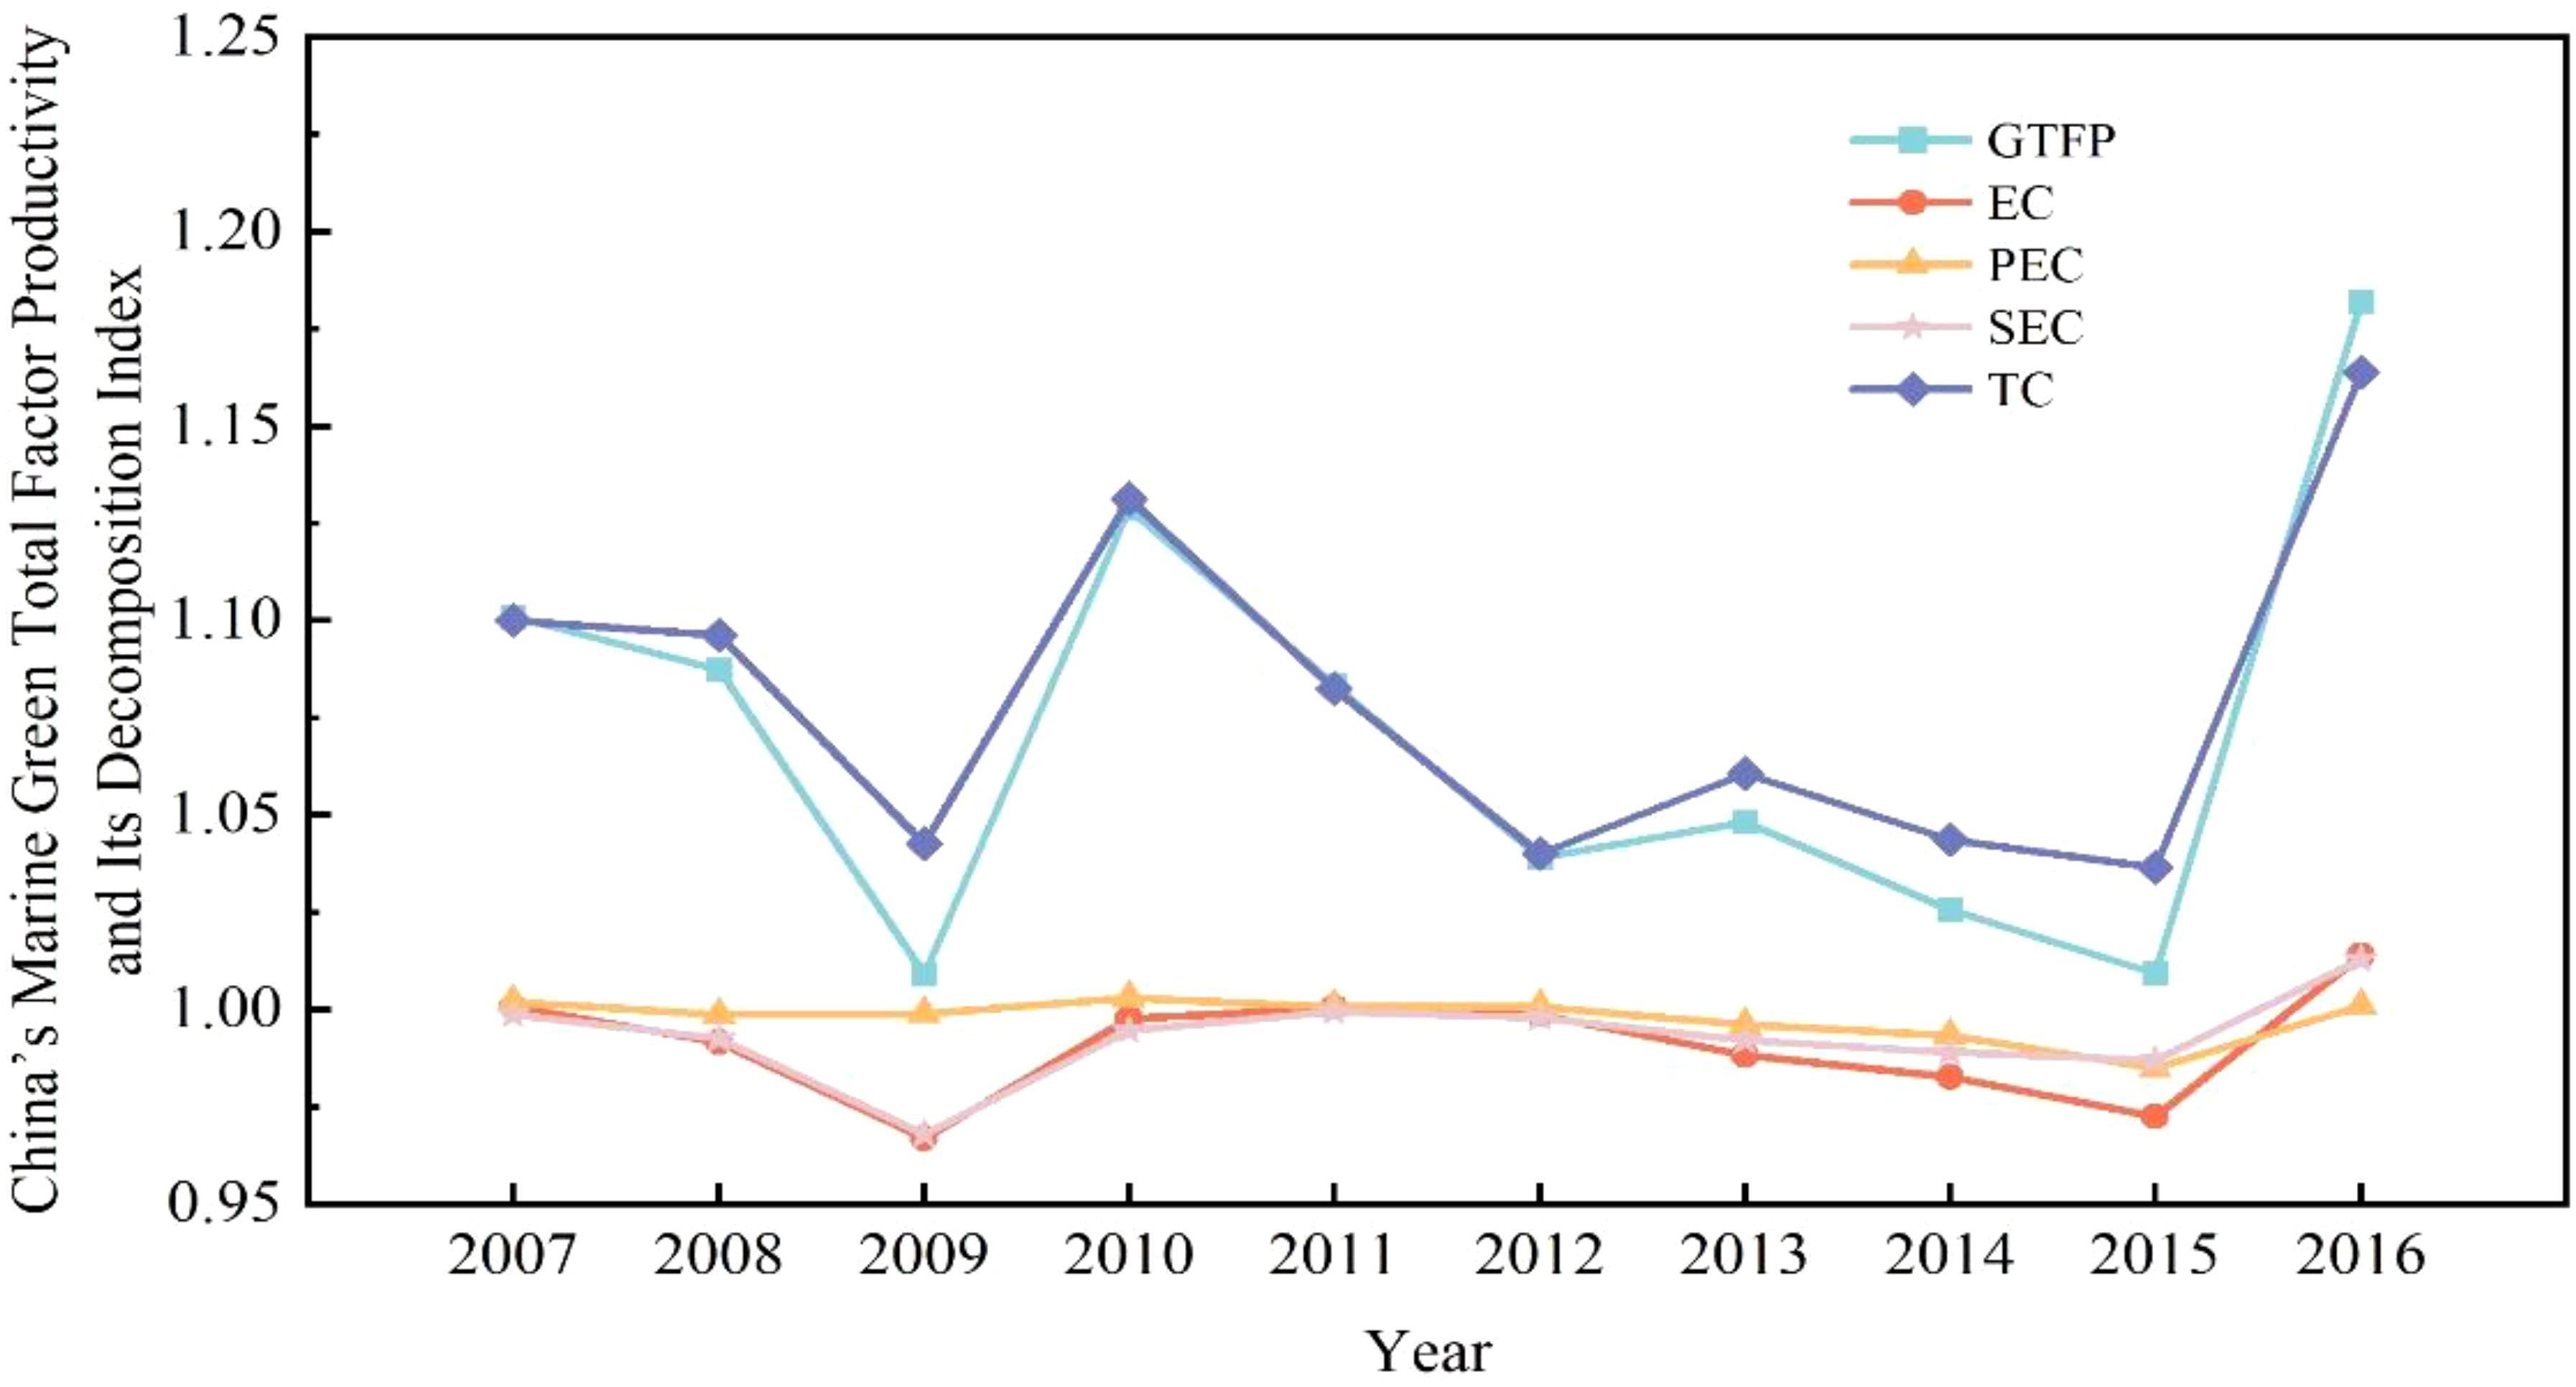
Figure 4. Changes in China’s marine GTFP and its decomposition index from 2007 to 2016.
Table 3 presents the variation patterns of the comprehensive marine GTFP in the 11 coastal regions of China from 2007 to 2016, along with the differences between the regions. Approximately half of the provinces had comprehensive marine GTFP values exceeding the national average. These include the Zhejiang, Tianjin, Shanghai, Jiangsu, Hebei, Fujian, and Hainan provinces. Hebei and Tianjin are provinces of the northern marine economic circle that surpass the national average. The growth levels of the other provinces in the northern marine economic circle were below average, primarily because of technological progress, a decline in absolute technical efficiency, and a decrease in economies of scale. In the eastern marine economic circle, the comprehensive marine GTFP of all provinces exceeded the national average. The mean rate of increase in the marine green comprehensive productivity in Shanghai was 11.00%, whereas that in Jiangsu was 11.50%. Fujian and Hainan surpassed the national average in the southern marine economic circle, whereas Guangxi and Guangdong experienced negative growth. The main reason for this was a decline in technological efficiency. Through a longitudinal analysis of the comprehensive marine GTFP in the 11 coastal regions of China, it was evident that the marine GTFP in all 11 coastal regions remained above one throughout the duration of the study, indicating rapid growth in the degree of marine green development.
4.4 Spatial pattern of China’s marine GTFP
To more directly reflect the regional characteristics of the marine GTFP in China, this study adopted ArcGIS software to draw the evolution of the spatial pattern of the marine GTFP of China in 2007, 2010, 2013, and 2016 using the natural breakpoint method. The results are shown in Figure 5.
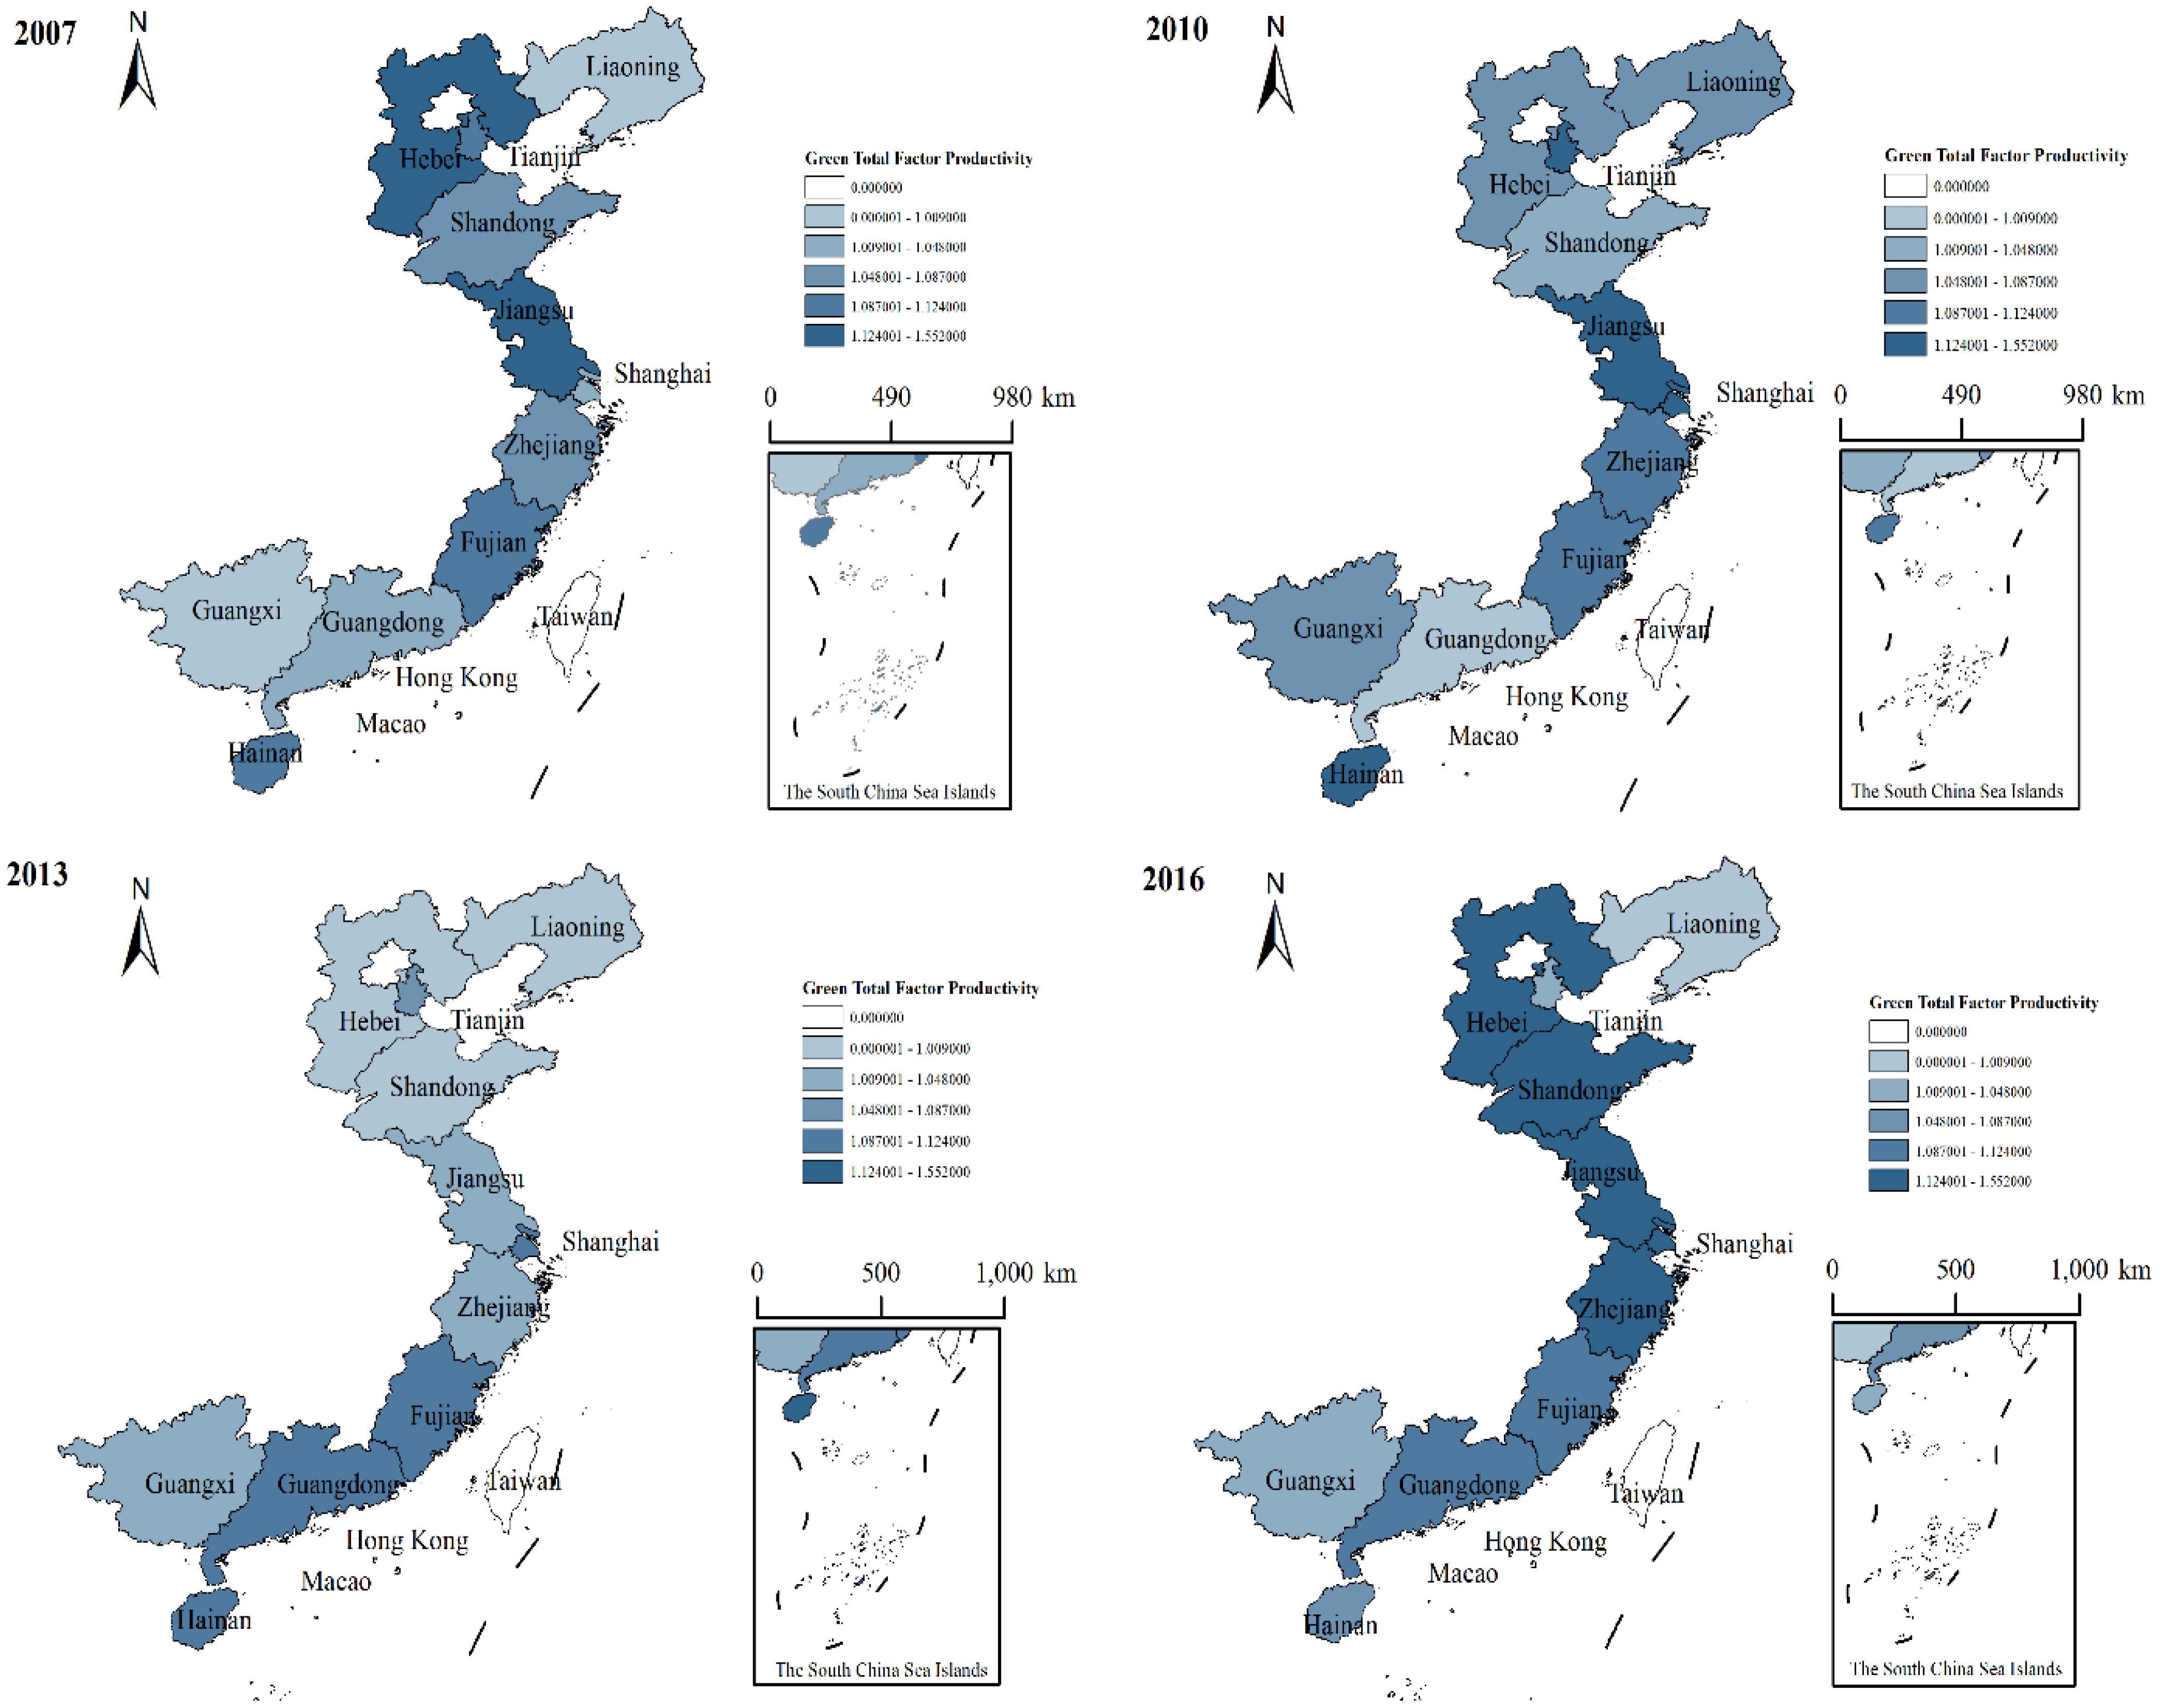
Figure 5. Evolution of spatial pattern of marine GTFP in coastal regions.
As depicted in Figure 5, the marine GTFP increased in most provinces, which indicates that the green transformation and upgrading of China’s marine economy have been accelerating, and new achievements have been made in the high-quality development of the marine economy. From 2007 to 2010, the marine GTFP in Zhejiang, Tianjin, Shanghai, Liaoning, Hainan, Guangxi, and Guangdong exhibited an upward trend. From 2010 to 2013, the marine GTFP in Guangxi and Fujian showed a smooth increase, whereas those in the other nine coastal regions showed a decreasing trend. From 2010 to 2016, the marine GTFP increased significantly in most coastal provinces. In general, the results show that China has greatly improved the utilization rate of marine resources, with almost no over-exploitation or utilization during the study period. This also indicates that China’s marine economic development has shifted to high-quality development, and efforts should be made to control energy consumption and shift toward the use of clean energy in the future.
Combined with regional analysis, the three marine economic circles in China show significant differences. In the eastern region, marine GTFP increased, whereas it was relatively stable in the northern and southern regions. This indicates that the initiative and consciousness of implementing the concept of green innovation in our eastern marine economic circle have been significantly enhanced, with more attention paid to the formation of culture and green values, and that actively promoting environmental governance can form an environmental protection linkage. The rational allocation of resources has further improved the level of marine GTFP. In the process of economic development in the northern and southern marine economic circles, great efforts have been made to introduce advanced green technologies and related industries in the eastern regions. In the process of green economic development, the late-developing advantage of northern and southern marine economic circles is gradually becoming obvious.
4.5 Center of gravity transfer path and standard deviation ellipse analysis of China’s marine GTFP
Marine GTFP data were calculated based on the EBM-GML index model, and the center-of-gravity standard deviation ellipse-related parameters and spatial position transfer paths of the marine GTFP in 11 coastal regions of China from 2007 to 2016 were calculated. The geographic center of efficiency depicts the distribution of marine GTFP intensity across 11 coastal provinces in China. Additionally, the standard deviation ellipse provides insights into the spatial spread of the marine GTFP across these coastal regions. The shift in the center of gravity reflects the shift in spatial distribution, which has great significance for exploring the spatiotemporal evolution of the marine GTFP in China.
Based on an examination of the distribution and shifts of the gravitational center for the marine GTFP (see Table 4; Figure 6), the gravitational center of the marine GTFP in 11 coastal regions of China varied from 116.635° E to 116.776° E and 30.817° N to 31.294° N from 2007 to 2016, indicating that the marine GTFP in the 11 coastal regions of China remained spatially stable throughout the study period. From the standard deviation of the ellipse parameters from 2007 to 2016, the variation range of the major half-axis of the ellipse was 1201.902–1234.915 km, and the variation range of the shorter half-axis was 408.905–415.054. The corresponding space for the orientation angle of the standard deviation ellipse was 19.704° to 21.027°. Throughout the study, the standard deviation ellipse range of each characteristic time point exhibited a path of initial expansion, followed by a slow decline, suggesting that the spatial distribution pattern of the marine GTFP in the 11 coastal areas of China is constantly tending toward concentration.
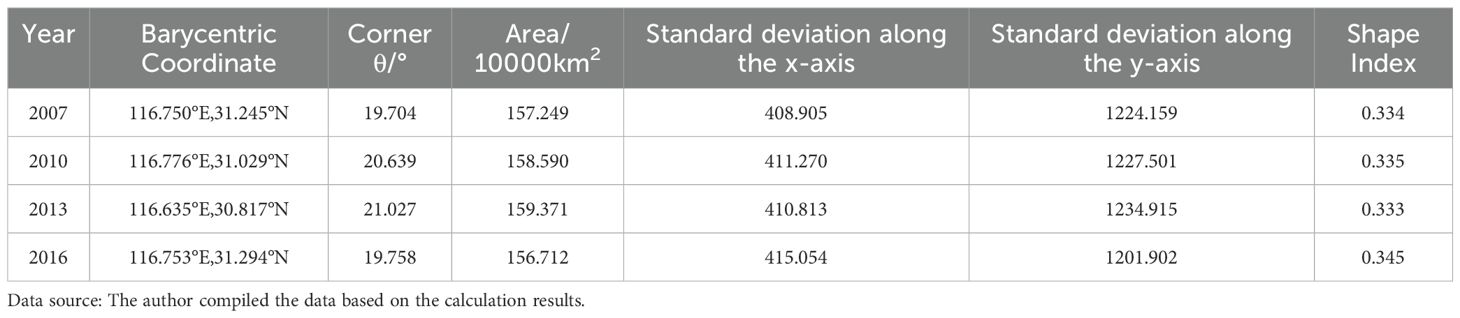
Table 4. Standard deviation ellipse parameters of the spatial distribution pattern of marine GTFP in 11 coastal regions of China from 2007 to 2016.

Figure 6. Standard deviation ellipse and center of gravity transfer path of China’s marine GTFP.
Compared with the expansion of the standard deviation ellipse, the form index of the standard deviation ellipse aligns with the variation in the expanse of the ellipse, demonstrating a tendency to diverge from a circular shape. This suggests an uneven distribution of the marine GTFP across the 11 coastal regions of China in the east-west and north-south directions. This imbalance became particularly evident during the initial phase of the investigation (2007–2010). The extent of the major axis expanded from1224.159 km in 2007 to 1227.501 km in 2010; the length of the minor axis expanded from 408.905 km in 2007 to 411.270 km in 2010; and the elliptical rotation angle increased and became increasingly circular. In the intermediate and later phases of the study (2010–2016), the length of the major half-axis first increased and then decreased, whereas that of the minor half-axis decreased and then increased. The fluctuation amplitude of the elliptical rotation angle was relatively narrow, suggesting that the overall spatial distribution pattern of the marine GTFP in the 11 coastal regions of China was relatively stable (Gai et al., 2018).
4.6 Analysis of convergence test for the marine GTFP in China
The divergence and convergence of the marine GTFP in China were analyzed using a convergence test. In this study, the dynamic evolution trend of the GTFP differences among coastal provinces in China was analyzed in accordance with the empirical findings of the convergence test. The convergence of the analysis findings shows that introducing a series of ocean policies in China helps narrow the gap in the GTFP of the ocean among provinces. Similarly, the lack of convergence in test results indicated a growing gap between some undeveloped and more developed provinces in the current marine policy environment. In order to conduct a more thorough analysis of the regional disparities in the GTFP of the 11 coastal regions of China, this study uses a convergence test to investigate the characteristics and origins of regional disparities in marine GTFP in 11 coastal regions of China.
4.6.1 σ Convergence test
As shown in Table 5, only the southern circle has σ convergence, while there is no σ convergence in the northern, eastern economic circle, and the whole country during the study period. According to the calculation results, the national and northern economic circles show a fluctuating state of decline-rise-decline-rise, whereas the eastern economic circle fluctuates significantly. The results show that the difference in the marine GTFP in the southern circle gradually disappears over time. In contrast, the difference in the marine GTFP in the northern economic circle, eastern economic circle, and the entire country always exists. As for the three marine economic circles, the mean standard deviation of marine GTFP in the northern economic circle was the largest (0.0810), followed by the eastern (0.0535) and southern economic circles (0.0478), suggesting that the internal regional disparity in marine GTFP in the northern economic circle was greater than that in the eastern and southern marine economic circles.
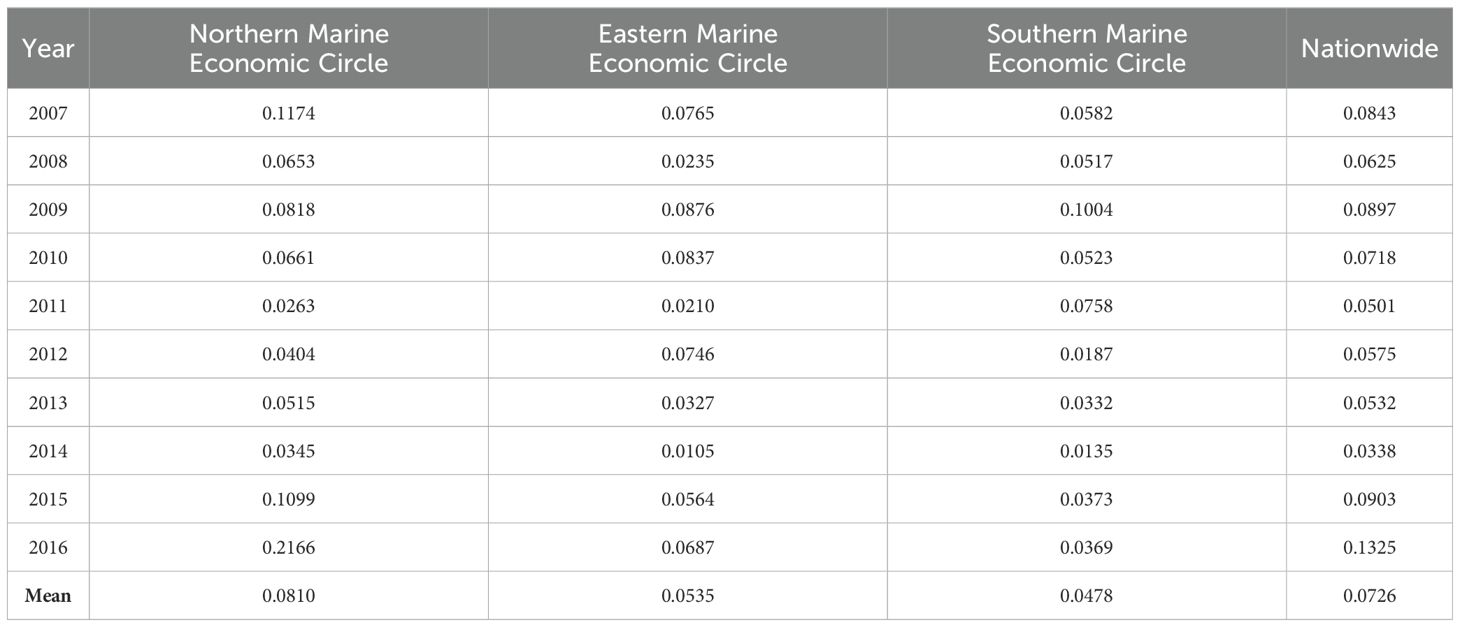
Table 5. China and the Northern, Eastern, and Southern marine economic circles σ convergence value.
4.6.2 Absolute β convergence test
The absolute β convergence test can further confirm whether the marine GTFP in 11 coastal regions of China approaches a consistent and uniform level, that is, whether the provinces with comparatively undeveloped marine GTFP have a “catch-up effect” on developed provinces. There is a negative correlation between the expansion rate of the marine GTFP and that of the primary stage. The value lower than zero shows the absolute β convergence, indicating that the rates of increase in the provinces with undeveloped initial levels are larger and higher than that of the more developed provinces, forming a catch-up effect, and the two are likely to ultimately converge toward a consistent and uniform level.
Before the empirical analysis, the panel model is evaluated using the Hausman test, and the comprehensive importance of the conformance outcomes of the regression equation is further analyzed. The estimation outcomes of absolute β convergence of GTFP in 11 coastal regions of China are presented in Table 6. The overall significance in the eastern economic circle, the southern economic circle, and the northern economic circle was judged with the random utility model, while the general significance in the whole country was judged with the regular effect model. The corresponding β values of each region were negative, suggesting that the absolute β convergence of marine GTFP exists across the entire nation and three marine economic circles. The findings indicate that the marine GTFP in the 11 coastal regions of China can increase relatively synchronously and that the internal differences gradually disappear over time (Zhao et al., 2023). Viewed through the lens of regional variations, the calculated parameters for the three marine economic circles are all negative and highly significant, indicating that the disparity in the growth of the marine GTFP within the same area is progressively narrowing and that all regions of the three marine economic circles can achieve the same steady-state growth rate in the marine GTFP.

Table 6. Absolute β convergence test.
4.6.3 Analysis of conditional β convergence test
Conditional β convergence tests whether the convergence of marine GTFP in 11 coastal regions of China approaches their steady-state levels under the respective characteristic systems of different regions. Similarly, the panel data were first analyzed using the Hausman test to ascertain the selection of the model, and a significance analysis of the fitting results was conducted. Table 7 presents the results.
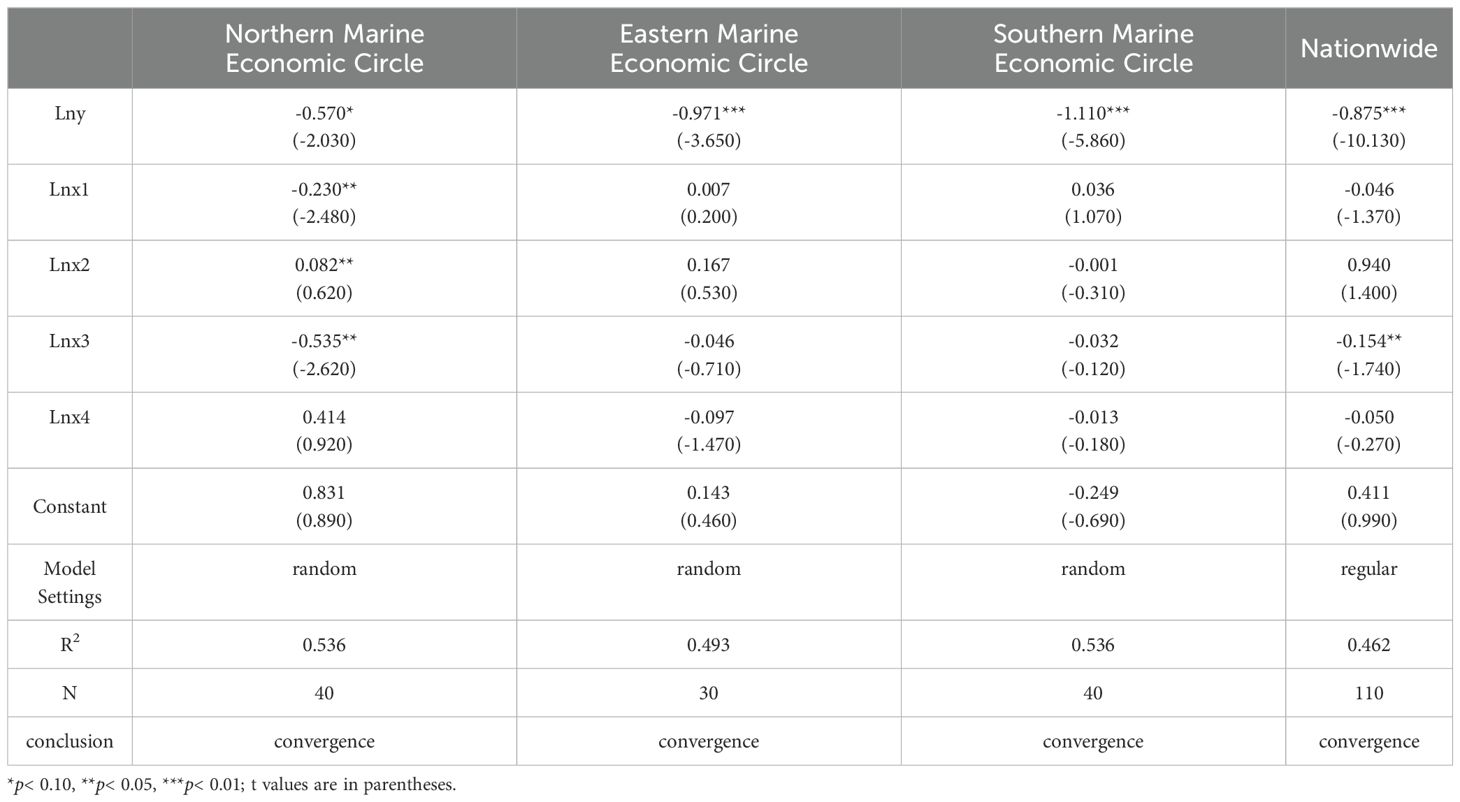
Table 7. Conditional β convergence test.
The results reveal that the conditional β convergence coefficients of the three marine economic circles and the whole country were significantly negative, which suggests that the marine GTFP in 11 coastal regions of China gradually tends to their own steady-state levels over time, showing certain conditional convergence characteristics. The economic development coefficients of the eastern and southern marine economic circles are positive, suggesting that an increase in the percentage of marine GDP positively affects marine GTFP growth. The marine industrial structure parameters are notably positive within the northern marine economic circle; however, they are not significant in the eastern and southern economic circles, suggesting that the 11 coastal regions of China need to further enhance the degree of marine green development by rationally enhancing the marine industrial structure.
The parameter for the level of openness was notably negative within the northern marine economic circle and nationwide, indicating that an enhancement in the degree of openness was not beneficial for the advancement of China’s marine green development level. The environmental regulation coefficients for the eastern, southern, and nationwide regions were negative. This suggests that the rate of convergence of the marine economy’s GTFP decelerates through environmental governance investment, which does not contribute to the advancement of China’s marine economy towards greater environmental sustainability.
4.7 Robustness test
The robustness testing is very important for the rationality of the model design. Therefore, we replaced the interpreted variable to perform a standard regression robustness test in our study. We used the SBM-GML model to recalculate the marine GTFP of China’s coastal regions, the results are consistent with the estimates above, which confirmed the robustness of our study.
The σ convergence test recveals that the σ coefficient of China’s marine GTFP shows a trend of”down-up-down”, which indicates that China’s marine GTFP shows the characteristics of periodic convergence and divergence. The σ coefficient of the southern marine economic circle has the largest decrease and the strongest convergence, which is basically consistent with the results of 4.6.1.
The absolute β convergence test shows that the estimated coefficients of the three marine economic circles and the nationwide are significantly negative,the estimated coefficients are -1.234, -0.346, -0.849, -0.973 of the northern,eastern, southern economic circle and nationwide respectively, the estimates were highly consistents with regession analysis and reveals the absolute β convergence of marine GTFP exists during the study period. The conditional β convergence tests indicates that he estimated coefficients are -1.284, -0.606, -0.958, -0.980 of the northern,eastern, southern economic circle and nationwide respectively,which significantly negative at the 1% level. Meanwhile, the control variables coefficients were little difference from the results of the baseline regression. It is concluded that the empirical results obtained in this study are extremely stable.(Note: Due to the limitation of space, the estimated results of the robustness test are omitted and can be obtained from the author).
5 Conclusion and recommendation
5.1 Conclusion
In addition to promoting maritime power strategies and marine ecological civilization, China attaches great importance to marine green development. This study uses the EBM-GML model to calculate the marine GTFP of China’s coastal regions, which reflects the change in factor allocation and utilization efficiency in the marine economy under multi-period dynamic conditions. The findings of this study are summarized as follows.
1. The marine GTFP in the 11 coastal regions of China increased from 1.1011 in 2007 to 1.1822 in 2016. The average marine GTFP value was 1.0715, showing an overall gradual improvement.
2. Improvement in the technological progress level is the main driving force for the growth of marine GTFP, with a mean increase rate of 7.98% and a mean decrease in technical efficiency of 0.86%.
3. The spatial distribution patterns of the marine GTFP tended to be concentrated continuously, suggesting that the overall spatial distribution pattern of the marine GTFP in China remained relatively stable during the study period.
4. There is no obvious σ convergence in the northern, eastern marine economic circle. There is absolute and conditional β convergence in all coastal regions of China, indicating that the marine GTFP across the entire nation and the three marine economic circles converged to their respective steady-state levels during the study period.
5.2 Recommendations
Based on the aforementioned results, this study makes the following policy recommendations.
1. The government should accelerate innovation in marine scientific and technological research, as well as boost the green and superior growth of the marine economy. Actively promoting the thorough fusion of marine innovation chains and industrial chains is driven by the industrialization of high and new technologies; vigorously developing new marine technologies, processes, models, and types of businesses; optimizing the institutional environment for innovation in marine scientific and technological research; and strengthening the top-level overall planning of marine science and technology innovation.
2. The government should facilitate the transformation of the marine economy from extensive to green and intensive development. This can be achieved by strengthening the dynamic surveillance and precursory alerting for marine industry operations; optimizing the allocation of cluster pollution emissions; encouraging the research, development, and promotion of marine green technologies; and forming a green marine industry development system for advanced and applicable technology, continuous protection of resources, and a friendly natural environment in line with carbon reduction environmental targets.
3. The government should facilitate the coordinated advancement of the regional marine economy and foster the construction of a new model of international engagement with internal and external linkages and mutual aid between land and sea. This can be achieved by deepening international exchanges, introducing and learning foreign high and new technologies, taking China as the main body of the cycle, promoting domestic and international double cycles, carrying out mutual development and rational allocation of the capital stock of the marine economy, and promoting the growth of marine GTFP from the level of technological progress.
4. Local governments must set environmental constraint targets according to circumstances, their own marine oceanic advancements, the present state of marine resources, and the environment. The government should continuously optimize the combination of environmental regulation tools and fully exploit the function of ecological regulations during the eco-friendly transition of the marine economy.
Data availability statement
Publicly available datasets were analyzed in this study. This data can be found here: China Marine Statistical Yearbook (2007-2017) (https://www.mnr.gov.cn/), China Energy Statistical Yearbook (2007-2017) (https://www.stats.gov.cn/), China Environmental Statistical Yearbook (2007-2017) (https://www.stats.gov.cn/) and China Ocean Economic Statistical Bulletin (2007-2017) (https://www.nmdis.org.cn/). Further inquiries can be directed to the corresponding author.
Author contributions
CH: Conceptualization, Formal analysis, Funding acquisition, Supervision, Writing – original draft, Writing – review & editing. YZ: Data curation, Methodology, Writing – original draft. KY: Conceptualization, Supervision, Writing – review & editing. HZ: Software, Visualization, Writing – original draft.
Funding
The author(s) declare financial support was received for the research, authorship, and/or publication of this article. This study was supported by the National Social Science Foundation General Projects of China (grant no.23BGL031).
Conflict of interest
The authors declare that the research was conducted in the absence of any commercial or financial relationships that could be construed as a potential conflict of interest.
Publisher’s note
All claims expressed in this article are solely those of the authors and do not necessarily represent those of their affiliated organizations, or those of the publisher, the editors and the reviewers. Any product that may be evaluated in this article, or claim that may be made by its manufacturer, is not guaranteed or endorsed by the publisher.
References
Bolam S. G., Rees H. L., Somerfield P., Smith R., Clarke K. R., Warwick R. M., et al. (2006). Ecological consequences of dredged material disposal in the marine environment: A holistic assessment of activities around the England and Wales coastline. Mar. pollut. Bull. 52, 415–426. doi: 10.1016/j.marpolbul.2005.09.028
Brunel C. (2019). Green innovation and green Imports: Links between environmental policies, innovation, and production. J. Environ. Manag 248, 109290. doi: 10.1016/j.jenvman.2019.109290
Calel R., Dechezleprêtre A. (2016). Environmental policy and directed technological change: Evidence from the European carbon market. Rev. Econ. Stat. 98, 173–191. doi: 10.1162/REST_a_00470
Cao Y. Q., Tian K. W., Mao Z. Q. (2021). A study on the influence of marine environmental regulation on total factor productivity: Empirical analysis based on data from 11 coastal provinces and cities in China. J. Chin. Stud. 24, 1–22. doi: 10.20288/JCS.2021.24.1.1
Chen X., Qian W. W. (2020). Effect of marine environmental regulation on the industrial structure adjustment of manufacturing industry: An empirical analysis of China’s eleven coastal provinces. Mar. Policy 113 103797. doi: 10.1016/j.marpol.2019.103797
Chen Y. F., Zhang R., Miao J. F. (2023). Unearthing marine ecological efficiency and technology gap of China’s coastal regions: A global meta-frontier super SBM approach. Ecol. Indic 147, 109994. doi: 10.1016/j.ecolind.2023.109994
Chen Y. S., Sun Z. F., Zhou Y. W., Yang W. L., Ma Y. (2024). Can the regulation of the coastal environment facilitate the green and sustainable development of the marine economy? Ocean Coast. Manegemet 254, 107203. doi: 10.1016/j.ocecoaman.2024.107203
Feng M., Guan H., Wang Y., Liu Y. (2024). Research on the impact mechanism of scientific and technological innovation on the high-quality development of the marine economy. Front. Mar. Sci. 11. doi: 10.3389/fmars.2024.1341063
Gai M., Zhu J. M., Sun C. Z., Sun K. (2018). Spatio-temporal evolution and influencing factors of marine economic efficiency in coastal areas of China. Resour. Sci. 40, 1966–1979. doi: 10.18402/resci.2018.10.06
Gao L., Cai D., Zhao Y., Yan H. (2024). A tripartite evolutionary game for marine economy green development with consumer participation. Environ. Dev. Sustain. 26, 4197–4228. doi: 10.1007/s10668-022-02879-2
Islama M. M., Shamsuddoha M. (2018). Coastal and marine conservation strategy for Bangladesh in the context of achieving blue growth and sustainable development goals (SDGs). Environ. Sci. Policy 87, 45–54. doi: 10.1016/j.envsci.2018.05.014
Ji J., Chi Y., Yin X. (2024). Research on the driving effect of marine economy on the high-quality development of regional economy – Evidence from China’s coastal areas. Reg. Stud. Mar. Sci. 74, 103550. doi: 10.1016/j.rsma.2024.103550
Jia D., Liu X., Guan X., Guo J., Zhang S., Li H., et al. (2024). Spatio-temporal differences and simulation studies of the carbon budget from fisheries in the northern marine economic circle of China. Front. Mar. Sci. 11. doi: 10.3389/fmars.2024.1393659
Kang W. L., Zou Y. K., Wang L., Liu X. M. (2020). Measurements and factors of biased technological progress in China’s marine economy. Pol. J. Environ. Stud. 29, 4109–4122. doi: 10.15244/pjoes/118747
Kumar S. (2006). Environmentally sensitive productivity growth: A global analysis using Malmquist–Luenberger index. Ecol. Econ 56, 280–293. doi: 10.1016/j.ecolecon.2005.02.004
Lefever D. W. (1926). Measuring geographic concentration by means of the standard deviational ellipse. Am. J. Sociology 32, 88–94. doi: 10.1086/214027
Lin Y. Q. (2020). Coupling analysis of marine ecology and economy: Case study of Shanghai, China. Ocean Coast. Manag 195, 105278. doi: 10.1016/j.ocecoaman.2020.105278
Liu B., Long R. Y., Zhu C. G., Sun X. X., Pan K. Y. (2020). Evaluation of high-quality development level of marine economy in Jiangsu province. Economic Geogr. 40, 104–113.
Liu B. Q., Xu M., Wang J., Xie S. M. (2017). Regional disparities in China’s marine economy. Mar. Policy 82, 1–7. doi: 10.1016/j.marpol.2017.04.015
Liu P. D., Zhu B. Y., Yang M. (2021). Has marine technology innovation promoted the high-quality development of the marine economy? –Evidence from coastal regions in China. Ocean Coast. Manage. 209, 11. doi: 10.1016/j.ocecoaman.2021.105695
Oh D. H. (2010). A global Malmquist-Luenberger productivity index. J. Productivity Anal. 34, 183–197. doi: 10.1007/s11123-010-0178-y
Qin L. G., Xu M., Juan T., Li S. S. (2021). Environmental regulation and green total factor productivity: Evidence from China’s marine economy. Pol. J. Environ. Stud. 30, 5117–5131. doi: 10.15244/pjoes/136010
Ren W. H., Ji J. Y. (2021). How do environmental regulation and technological innovation affect the sustainable development of marine economy: New evidence from China’s coastal provinces and cities. Mar. Policy 128, 104468. doi: 10.1016/j.marpol.2021.104468
Ren W. H., Ji J. Y., Chen L., Zhang Y. (2018). Evaluation of China’s marine economic efficiency under environmental constraints—an empirical analysis of China’s eleven coastal regions. J. Clean. Prod 184, 806–814. doi: 10.1016/j.jclepro.2018.02.300
Shao Q. L., Guo J. J., Kang P. (2021). Environmental response to growth in the marine economy and urbanization: A heterogeneity analysis of 11 Chinese coastal regions using a panel vector autoregressive model. Mar. Policy 124, 104350. doi: 10.1016/j.marpol.2020.104350
Sheng X., Lu B. B., Yue Q. D. (2021). Impact of sci-tech finance on the innovation efficiency of China’s marine industry. Mar. Policy 133, 104708. doi: 10.1016/j.marpol.2021.104708
Solow R. M. (1957). Technical change and the aggregate production. Rev. Econ. Stat. 39, 312–320. doi: 10.2307/1926047
Sun K., Ji J. W., Li L. D., Zhang C., Liu J. F., Fu M. (2017). Marine fishery economic efficiency and its spatiotemporal differences based on undesirable outputs in China. Resour. Sci. 39, 2040–2051.
Sun C., Wang L., Zou W., Zhai X. (2023). The high-quality development level assessment of marine economy in China based on a “2+6+4“ framework. Ocean Coast. Manage. 244, 106822. doi: 10.1016/j.ocecoaman.2023.106822
Sun C. Z., Song X. F. (2021). Total factor productivity of marine economy in China inthe era of digital economy. Prog. Geogr. 40, 1983–1998. doi: 10.18306/dlkxjz.2021.12.001
Tomashuk I., Baldynyuk V., Boltovska L. (2023). Green economy as a factor of sustainable development. Balt. J. Econ. Stud. 9, 194–206. doi: 10.30525/2256-0742/2023-9-3-194-206
Tone K. (2001). A slacks-based measure of efficiency in data envelopment analysis. Eur. J. Operation Res. 130, 498–509. doi: 10.1016/S0377-2217(99)00407-5
Tone K., Tsutsui M. (2010). An epsilon-based measure of efficiency in DEA: A third pole of technical efficiency. Eur. J. Operation Res. 207, 3, 1554–1563. doi: 10.1016/j.ejor.2010.07.014
Wang B., Wu Y., Yang P. (2010). Environmental efficiency and environmental total factor productivity growth in China’s regional economies. Econ. Res. J. 13, 213–234.
Wang S. H., Lu B. B., Yin K. D. (2021). Financial development, productivity, and high-quality development of the marine economy. Mar. Policy 130, 104553. doi: 10.1016/j.marpol.2021.104553
Wang Y. X., Wang N. (2019). The role of the marine industry in China’s national economy: An input-output analysis. Mar. Policy 99, 42–49. doi: 10.1016/j.marpol.2018.10.019
Xu T., Dong J. X., Qiao D. (2023). China's marine economic efficiency: A meta-analysis. Ocean Coast. Manegemet 239, 106633. doi: 10.1016/j.ocecoaman.2023.106633
Xu S., Liu Y. (2023). Research on the impact of carbon finance on the green transformation of China’s marine industry. J. Clean. Prod. 418, 138143. doi: 10.1016/j.jclepro.2023.138143
Yang Y., Liu D. W., Xu R., Li Z. N., Shi C. W., Zhu X. D., et al. (2024). Full title: The performance evaluation of marine ecological civilization construction (MECC): A case study of coastal cities in Jiangsu Province, China. Ocean Coast. Manage. 254, 107174. doi: 10.1016/j.ocecoaman.2024.107174
Ye F., He Y. X., Yi Y., Quan Y. B., Deng Y. C. (2021). Promotion of environmental regulation on the decoupling of marine economic growth from marine environmental pollution—based on interprovincial data in China. J. Environ. Plan. Manag 87, 106522. doi: 10.1080/09640568.2021.1932771
Yin K., Zhang K., Huang C. (2022). Institutional supply, market cultivation, and the development of marine strategic emerging industries. Mar. Policy. 139, 105045. doi: 10.1016/j.marpol.2022.105045
Yu L., Guo Z., Ji J. (2024). Environmental regulation and marine economic resilience: An institutional synergy perspective. Mar. pollut. Bulletin. 205, 116643. doi: 10.1016/j.marpolbul.2024.116643
Yu H. J., Xing L. L. (2021). Analysis of the spatiotemporal differences in the quality of marine economic growth in China. J. Coast. Res. 37, 589–600. doi: 10.2112/JCOASTRES-D-20-00102.1
Zhang Y. G., Dong L. J., Yang J., Wang S. Y., Song X. R. (2004a). Sustainable development of marine economy in China. Chin. Geogr. Sci. 14, 308–313. doi: 10.1007/s11769-004-0033-z
Zhang J., Wu K. J., Zhang J. P. (2004b). Estimation of China's inter-provincial physical capital stock: 1952-2000. Economic Res. 10), 35–44.
Zhao L. S., Hu R., Sun C. Z. (2021). Analyzing the spatial-temporal characteristics of the marine economic efficiency of countries along the Maritime Silk Road and the influencing factors. Ocean Coast. Manag 204, 105517. doi: 10.1016/j.ocecoaman.2021.105517
Zhao X., Jia Z. X., Ding L. L. (2023). Spatial heterogeneity of green total factor productivity of China’s marine economy from a multidimensional perspective. Resour. Sci. 45, 609–622. doi: 10.18402/resci.2023.03.11
Zheng H., Zhang L., Zhao X. (2022). How does environmental regulation moderate the relationship between foreign direct investment and marine green economy efficiency: An empirical evidence from China’s coastal areas. Ocean Coast. Manag 219, 173–191. doi: 10.1016/j.ocecoaman.2022.106077
Zheng H., Zhang J. C., Zhao X., Mu H. R. (2020). Exploring the affecting mechanism between environmental regulation and economic efficiency: New evidence from China’s coastal areas. Ocean Coast. Manag 189, 105148. doi: 10.1016/j.ocecoaman.2020.105148
Keywords: marine green total factor productivity, marine economy, EBM-GML index, center of gravity-standard deviation ellipse, convergence
Citation: Huang C, Zhao Y, Yin K and Zhang H (2024) The pattern evolution and spatial heterogeneity of green development level of China’s marine economy. Front. Mar. Sci. 11:1466494. doi: 10.3389/fmars.2024.1466494
Received: 18 July 2024; Accepted: 16 August 2024;
Published: 05 September 2024.
Edited by:
Song Ding, Zhejiang University of Finance and Economics, ChinaReviewed by:
Hua Yang, Jiangsu University, ChinaYuanrui Liu, Zhengzhou University, China
Sun Caizhi, Liaoning Normal University, China
Yufeng Chen, Zhejiang Normal University, China
Copyright © 2024 Huang, Zhao, Yin and Zhang. This is an open-access article distributed under the terms of the Creative Commons Attribution License (CC BY). The use, distribution or reproduction in other forums is permitted, provided the original author(s) and the copyright owner(s) are credited and that the original publication in this journal is cited, in accordance with accepted academic practice. No use, distribution or reproduction is permitted which does not comply with these terms.
*Correspondence: Hongshuo Zhang, emhhbmdob25nc2h1b0BtYWlsLnNkdWZlLmVkdS5jbg==; Kedong Yin, eWlua2Vkb25nc2R1ZmVAMTI2LmNvbQ==