 Haotian Li1Alan Ningyuan Xu2
 Zaibao Yang1
 Yanli Lei1,3,4,5*Jiaxin Chen1
 Zifeng Zhan1
 Kuidong Xu1Tiegang Li6*Shangwei Xie7
- 1Laboratory of Marine Organism Taxonomy and Phylogeny, Qingdao Key Laboratory of Marine Biodiversity and Conservation, Institute of Oceanology, Chinese Academy of Sciences, Qingdao, China
- 2Department of Applied Biology and Chemical Technology, The Hong Kong Polytechnic University, Hong Kong, China
- 3Laboratory for Marine Biology and Biotechnology, Qingdao Marine Science and Technology Center, Qingdao, China
- 4Southern Marine Science and Engineering Guangdong Laboratory (Zhuhai), Zhuhai, China
- 5University of Chinese Academy of Sciences, Beijing, China
- 6Key Laboratory of Marine Sedimentology and Environmental Geology, First Institute of Oceanography, MNR, Qingdao, China
- 7Nanji Islands National Marine Nature Reserve Administration, Wenzhou, China
The Nanji Islands, designated as one of China’s national nature reserves, are renowned for their abundant microalgal resources. Changes in microalgae can serve as indicators of marine environmental shifts. Despite this significance, the absence of comprehensive historical records on microalgal diversity has limited the evaluation of marine environmental protection efforts. This study addresses this gap by analyzing surface sediments and sediment cores from the Nanji Islands, utilizing 210Pb dating and employing environmental DNA (eDNA) technology to trace historical shifts in the molecular diversity of microalgae. Chloroplast gene fragments were amplified using rbcL primers, and 210Pb dating determined the deepest sediment layer (78-80 cm) to date back to 1994. From the 70-72 cm layer to the 60-62 cm layer, the number of microalgal reads increased rapidly from 27,716 to 65,143, signifying enhanced abundance over the 10 years following the establishment of the nature reserve. This was followed by a deceleration in microalgal abundance growth over the subsequent 20 years, potentially reflecting variations in primary production of microalgae. Concurrently, the rise in operational taxonomic units (OTUs) and the Margalef index suggest a boost in microalgal diversity, which may be attributed to improvements in the marine environment. The microalgal community composition has shifted from a dominance of Dinoflagellata and Streptophyta to a predominance of Bacillariophyta, the change in phosphate would be one of the impact factors worth noting. This study provides foundational data on the historical changes in microalgae in the Nanji Islands and serves as a reference for exploring the relationship between environmental conditions and microalgal dynamics.
1 Introduction
Global warming has precipitated a crisis of rapid global biodiversity loss, necessitating the urgent development of innovative and efficient methods for biodiversity assessment (Vitousek, 1994). As integral components of biodiversity, plants—and particularly microalgae—play a fundamental role in maintaining the primary productivity of the marine ecosystem, accounting for approximately 40% of marine plant life (Moreno-Garrido, 2008). Moreover, microalgae can lead to Harmful Algal Blooms (HABs), posing grave risks to marine life, human health, and the global economy, as well as contributing to air pollution and ecological damage (Hallegraeff, 1993; Landsberg, 2002). Such blooms are often induced by rapid environmental changes in marine conditions, including precipitation, temperature, light intensity, salinity, and nutrients (Errera et al., 2008; Hambright et al., 2014). Consequently, shifts in marine microalgae community can serve as sensitive indicators of environmental changes.
The foundation of any biodiversity assessment is taxonomic composition (Ruppert et al., 2019). Traditional methods for identifying microalgae rely on detailed morphological examination, typically requiring trained phycologists and microscopy. However, since many microalgae do not leave effective records in marine sediments, it is challenging to trace historical changes in microalgal populations through morphological studies alone. This limitation hinders the effective use of microalgae communities as indicators of marine environmental shifts. Environmental DNA (eDNA)-based molecular approaches offer a promising alternative for biodiversity assessments (Beng and Corlett, 2020). Extracting eDNA from soil samples (Taberlet et al., 2012) allows for the simultaneous collection of DNA from multiple individuals and taxa, bypassing lengthy and costly field sampling processes. This non-invasive and non-destructive method is particularly effective in detecting rare or difficult-to-collect taxa (Alsos et al., 2018; Carrasco-Puga et al., 2021; Hartvig et al., 2021). eDNA-based surveys provide rapid assessments and monitoring of biodiversity changes in specific regions, which is essential for understanding ongoing biodiversity loss and marine environmental shifts. Soil eDNA has proven successful in identifying current and past biodiversity (Yoccoz et al., 2012) and reconstructing past environmental changes (Rawlence et al., 2014), offering insights into “hidden diversity” (Jørgensen et al., 2012; Parducci et al., 2013). The historical variation revealed by eDNA have been widely reported (Alsos et al., 2016; Armbrecht et al., 2022; De Schepper et al., 2019; Garcés-Pastor et al., 2022). Nevertheless, the application of soil eDNA for exploring historical changes in marine microalgal diversity is still in its infancy, presenting significant knowledge gaps (Ariza et al., 2023).
The Nanji Islands, located at the southern end of the East China Sea, represent a convergence zone for the Zhejiang Coastal Current and the Taiwan Warm Current. The numerous islands and capes in this region induce intense mixing of upper and lower seawater, fostering upwellings that lead to excellent water quality, abundant food sources, and favorable hydrological and climatic conditions. Consequently, this area boasts high biodiversity with a complex faunal composition. Prior to the establishment of the nature reserve, the Nanji Islands experienced significant human activity, including the artificial cultivation and processing of algae, fish, and shellfish. These activities introduced pollution and environmental stress (Yang et al., 1994; Li et al., 2017). However, there is a notable lack of historical records detailing the environmental impacts on the Nanji Islands, with baseline data on marine microalgae being particularly scarce. Therefore, new methods are urgently needed to address this information gap. Since the establishment of the Nanji Islands Nature Reserve in 1990, there has been heightened public and governmental interest in the environmental changes occurring in this region.
To assess changes in microalgal diversity in the Nanji Islands over recent decades, we collected surface sediment samples from various stations (Daleidao, Houjishan, Huokunao, and Mazuao) and sediment core samples from Huokunao. The molecular diversity of microalgae was analyzed using eDNA data. Combining with 210Pb dating, this study presents, for the first time from an eDNA perspective, the historical changes in microalgal diversity in the Nanji Islands, providing foundational data for the region. These findings are significant for developing informed environmental protection measures for the Nanji Islands.
2 Materials and methods
2.1 Sample collection
From May 9 to May 13, 2022, a field investigation was conducted on the Nanji Islands (121°01’-121°06’E, 27°27’-27°30’N), focusing on four coves: Guoxingao, Mazouao, Dashaao, and Huokunao (Chinese transliterated names). Huokunao, characterized by predominantly muddy sediment, was selected as the target station for core sampling based on its sediment characteristics. In alignment with the local tidal schedule, the low tide period was chosen to collect gravity cores from Huokunao using PVC tubes with diameters of 90 mm and 110 mm, along with a rubber mallet. Two sediment cores, HKA01 (70 cm) and HKA02 (80 cm), were successfully retrieved. Additionally, surface sediment samples were collected from the intertidal zone at the Mazuao (MZA) and Huokunao (HKA) stations, as well as from the shallow continental shelf areas of Houjishan (HJS) and Daleidao (DLD), which were designated as reference stations (Figure 1). This strategic and comprehensive sampling approach was designed to yield a robust dataset for analyzing historical changes in marine microalgal diversity.
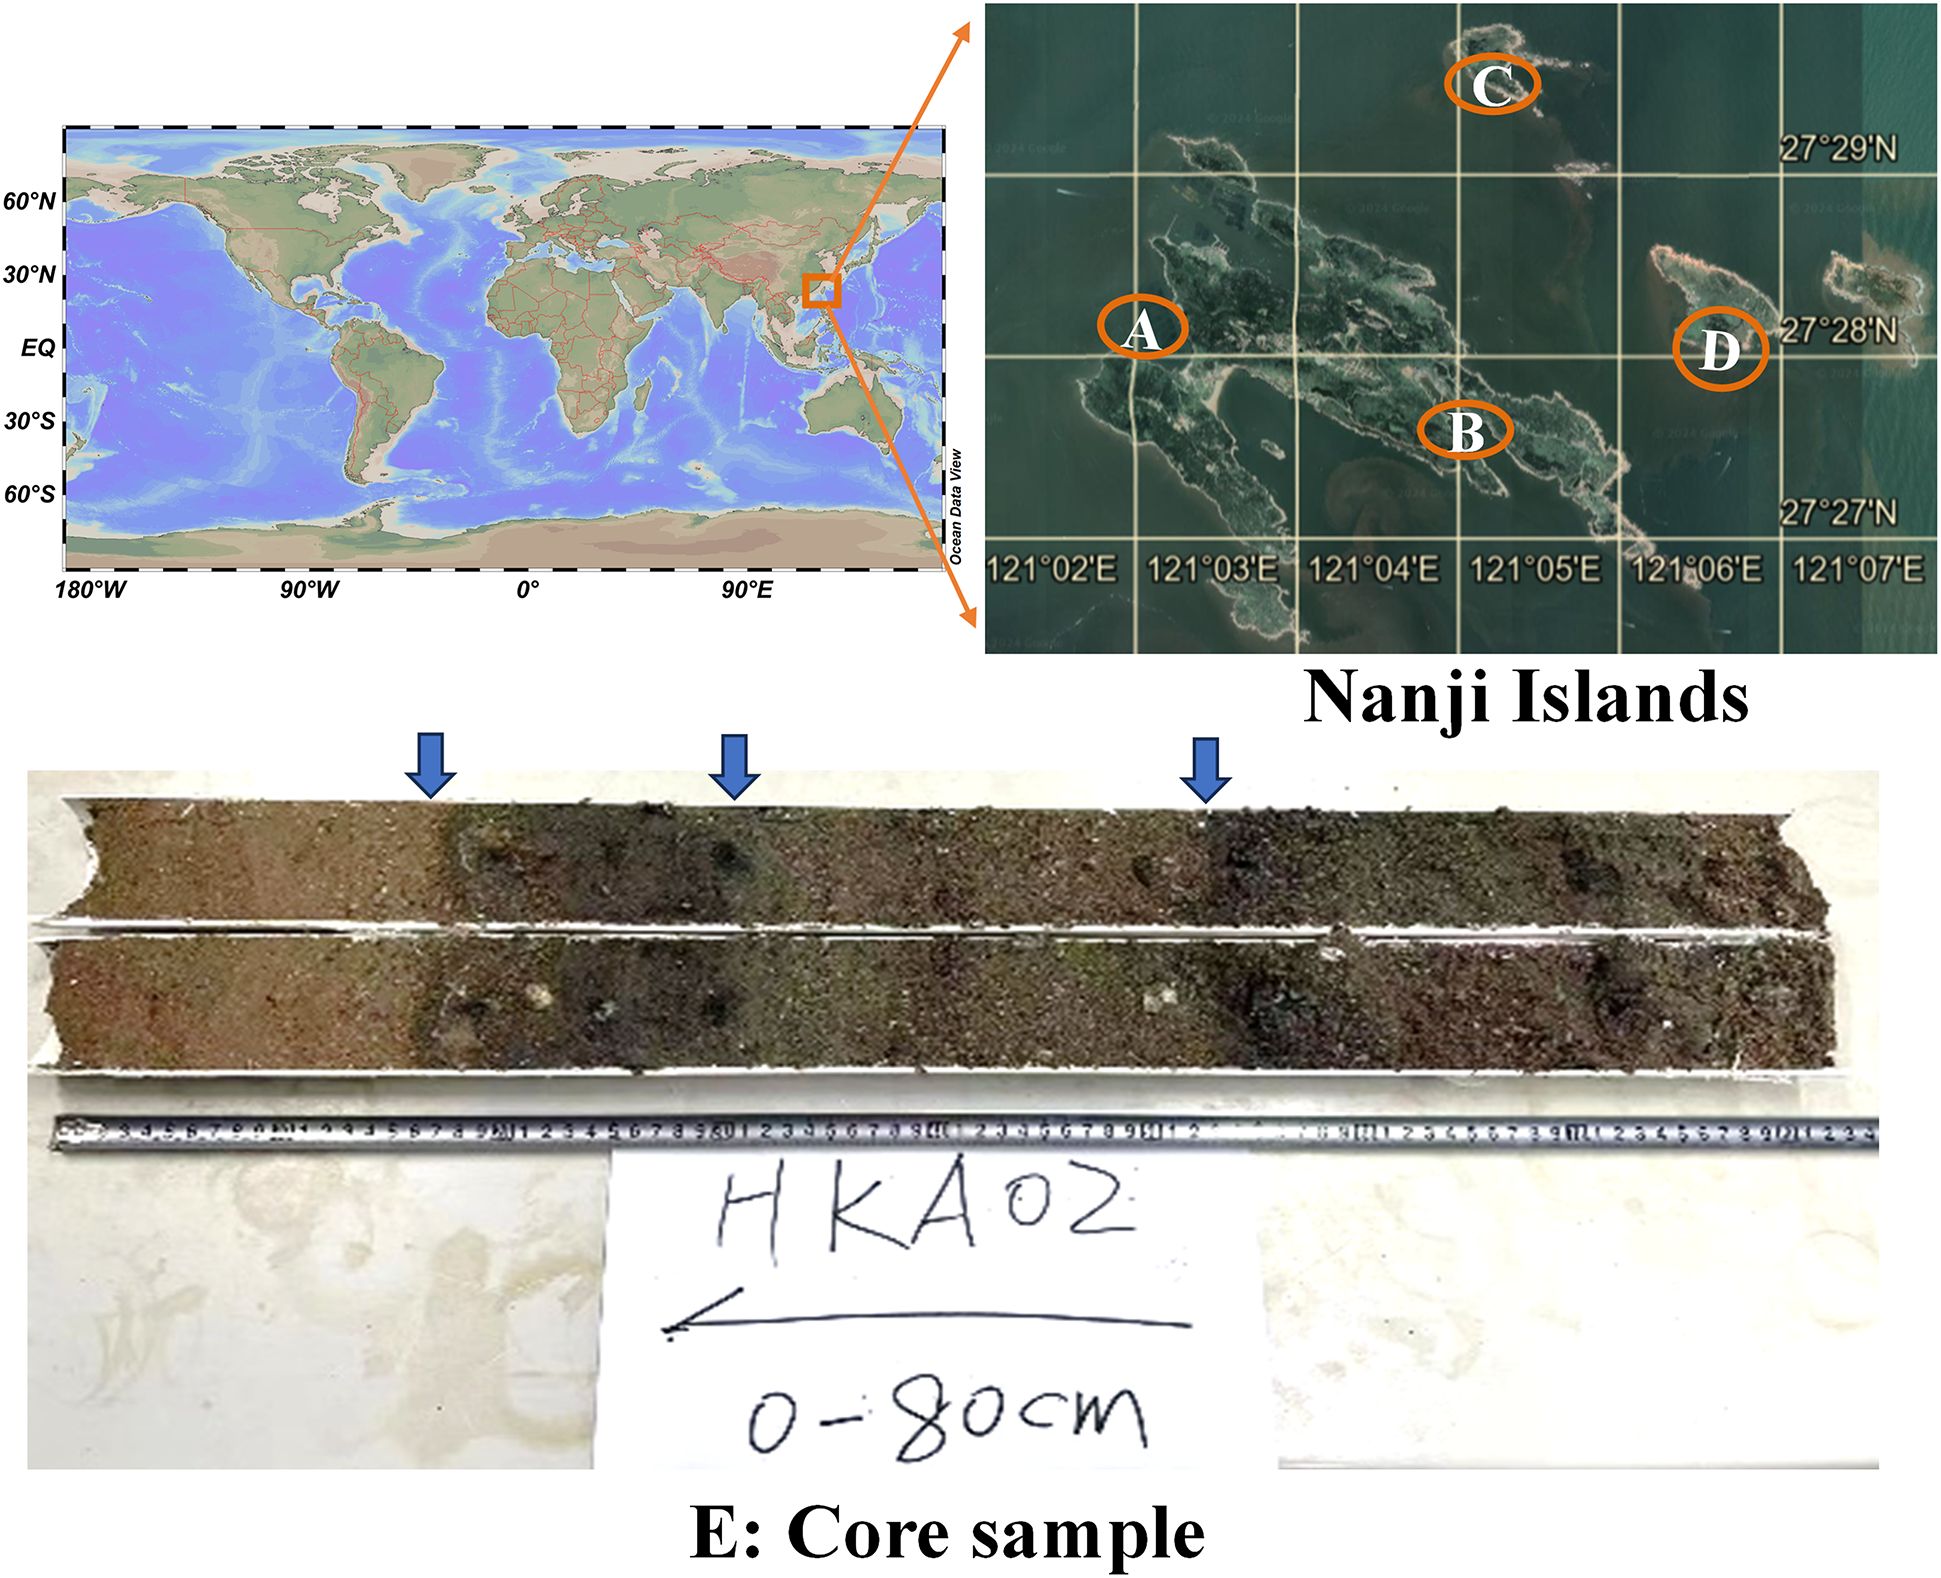
Figure 1. Surface sampling stations of Nanji Islands and the core sample from the Hunkunao station. The surface sampling stations included (A) Mazuao station (MZA); (B) Huokunao station (HKA); (C) Daleidao station (DLD); (D) Houjishan station (HJS).
2.2 Sample treatment
2.2.1 Sample splitting
After field sampling, the collected sediment cores underwent careful processing and preparation for subsequent analysis. Using an angle grinder, the PVC pipes containing the cores were split open vertically. Sterilized clean iron wire was used to carefully split the HKA01 and HKA02 cores. Upon visual inspection, core HKA01 displayed chaotic sedimentary layers, whereas core HKA02 exhibited well-stratified layers. Therefore, HKA02 was chosen for further investigation (Figure 1E). The lithology of core HKA02 was divided into four distinct sections with no signs of bioturbation: 0 ~ 16 cm was brown sandy; 16 ~ 30 cm was dark gray clay; 30 ~ 54 cm was dark brown silty; 54 ~ 80 cm was gray sandy silty. Using a ruler, the core samples were systematically subsampled using a sterilized scraper, with a 2 cm stratification standard. This meticulous sampling process resulted in a total of 40 discrete samples from core HKA02. The unsampled HKA01 core was carefully wrapped in plastic and stored at -20°C (Haier; Haier Freezer; BC/BD-829HEZ; 2105*860*905 mm; 829 L; China) alongside the HKA02 samples for potential future analysis.
2.2.2 Age dating
To establish the chronology of the sediment core, samples from three distinct depth intervals (10-12 cm, 30-32 cm, and 78-80 cm) were selected for 210Pb dating. The samples were dried in a drying oven to remove any moisture content and then ground in an agate mortar to a fine 100-mesh particle size, ensuring a homogeneous sample for subsequent analysis. The prepared samples were sent to the Public Technology Center of the Institute of Oceanology, Chinese Academy of Sciences, for 210Pb dating measurements. The analysis was conducted using the 920-8 alpha spectrometer produced by EG&G Ortec (USA), which has an instrument resolution of FW = 19 Kev.
2.2.3 Anti-contamination processing
To ensure data integrity and minimize the risk of contamination throughout the experimental process, the researchers implemented a comprehensive set of anti-contamination measures: (1) Personal Protective Equipment (PPE): Researchers wore protective clothing, masks, gloves, and rubber boots to maximum body coverage during the experiment. Strict adherence to PPE protocols helped prevent the introduction of extraneous DNA or contaminants. (2) Sterilization of Materials and Instruments: All experimental materials and instruments were thoroughly sterilized at high temperature and pressure. This rigorous sterilization process eliminated the possibility of cross-contamination from previous samples or external sources. (3) Sampling Tool Disinfection: Sampling tools were disinfected and sealed before and after each sampling event. This meticulous handling of the sampling equipment prevented the introduction of any contaminants during the field collection of the sediment cores and surface sediments. (4) Dedicated Laboratory Spaces: DNA extraction experiments were carried out in a dedicated laboratory, while the PCR amplification procedures were conducted in a separate laboratory. This spatial separation minimized the risk of DNA contamination from the laboratory environment. (5) Blank and Negative Controls: Appropriate blank and negative control samples were included throughout the experiment to detect and rule out any potential DNA contamination from the laboratory or reagents used.
2.2.4 eDNA processing
Environmental DNA (eDNA) was extracted from the sediment samples using the MoBio PowerSoil DNA Extraction Kit, which is designed to efficiently isolate high-quality DNA from complex soil and sediment matrices. To target marine microalgal diversity, specific primers were used to amplify the chloroplast rbcL gene via polymerase chain reaction (PCR) (Bradley et al., 2007). The primer information and detailed PCR amplification procedures are provided in Table 1. The 50 μL PCR reaction mixture consisted of the following components: 25 μL of high-fidelity enzyme (2×TransTaq HiFi PCR SuperMix), 1 μL each of forward and reverse primers (10 μM), 17 μL of DDH2O, and 6 μL of the extracted eDNA template. Throughout the entire eDNA processing workflow, appropriate blank and negative control samples were included to monitor and rule out any potential contamination.
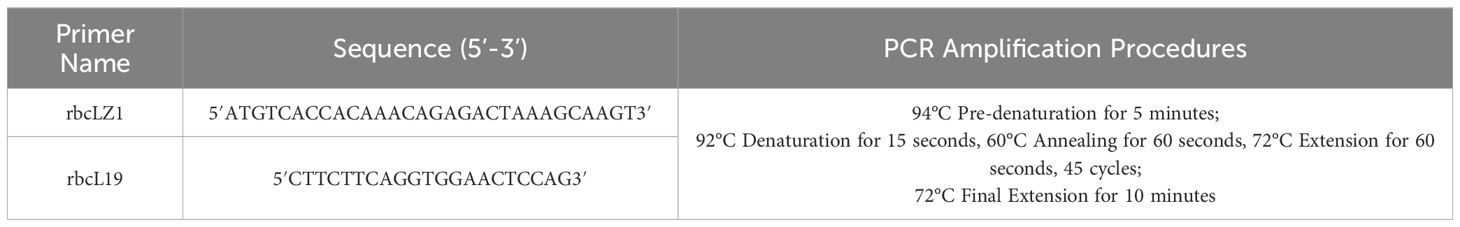
Table 1. Primer information and PCR amplification procedures for samples from the Nanji Islands.
The PCR amplicons with clear target bands were selected for subsequent sequencing, which was conducted at Novogene, a leading genomics service provider. The raw sequencing data obtained from the Illumina HiSeq platform contained some interfering information. To ensure more accurate and reliable analysis results, a series of quality control measures were implemented on the sequencing data: First, the sequencing data was demultiplexed into individual samples based on the unique barcode and primer sequences. The barcode and primer sequences were then trimmed from the raw reads. FLASH (V1.2.7) (Magoč and Salzberg, 2011) was used to assemble the trimmed sequences for each sample, generating the “Raw tags”. According to the quality control procedures of QIIME (V1.9.1) (Caporaso et al., 2010) and Usearch (v11.0.667) (Edgar, 2013), the Raw tags were further filtered to remove chimeric sequences and low-quality reads, resulting in high-quality effective data. The unoise3 non-clustering denoising method was employed to generate operational taxonomic units (OTUs) from the high-quality sequences. Notably, there was no specific clustering threshold in OTU generation, as the UNOISE algorithm does not rely on a pre-defined clustering cutoff. Instead, it uses an error-correction approach to denoise the sequence data and identify accurate biological sequences (Edgar, 2016). The representative OTU sequences were compared against the NCBI database using BLAST (V2.7.1) to obtain the taxonomic information for each OTU, yielding an average identity value of 96.47%. Unassigned OTUs were labeled as “Unknown” and treated as “Other” in subsequent analyses (Supplementary Tables 1, 2).
2.3 Statistic analysis
The sequencing data were normalized based on the sample with the smallest amount of data. This normalization step ensured that diversity analyses were conducted on a comparable basis across all samples. To analyze alpha diversity indices, such as the Shannon-Wiener and Margalef index, the normalized OTU table data was used. The data was further standardized by resampling to the minimum number of OTUs observed across the samples. This additional step guaranteed that the diversity metrics were calculated on a consistent basis, ensuring that diversity metrics were calculated consistently for meaningful comparisons. The alpha diversity indices were calculated using the “alpha_diversity.py” command in QIIME software (Caporaso et al., 2010). Figures depicting sampling stations were generated using Ocean Data View software (version 5.6.2) and combined with other components using Microsoft PowerPoint (version 2022). Microalgal community plots were created in Origin software (version 2021). To determine the average sedimentation rate, the study employed the Constant Initial Concentration (CIC) model (Wan, 1997). The calculation formula is as follows:
Where v is the sedimentation rate. 210Pbex(0) is the excess 210Pb activity concentration at the surface. 210Pbex(h) is the excess 210Pb activity concentration at depth ℎ. γ is the decay constant of 210Pb. h is the depth of the sediment.
3 Results
3.1 Data review
As shown in Table 2, the high-throughput eDNA sequencing generated a total of 1,443,961 raw sequences, with an average of 120,330 sequences per sample. The 0-2 cm layer sample from the Huokunao (HKA) station had the highest number of raw sequences, reaching 139,073. After sequence assembly, quality filtering to remove low-quality reads, and the elimination of chimeric sequences, a total of 1,303,331 high-quality, non-chimeric sequences remained. The average effective rate of the sequencing data was 90.25%, indicating a robust and reliable dataset for further analysis.
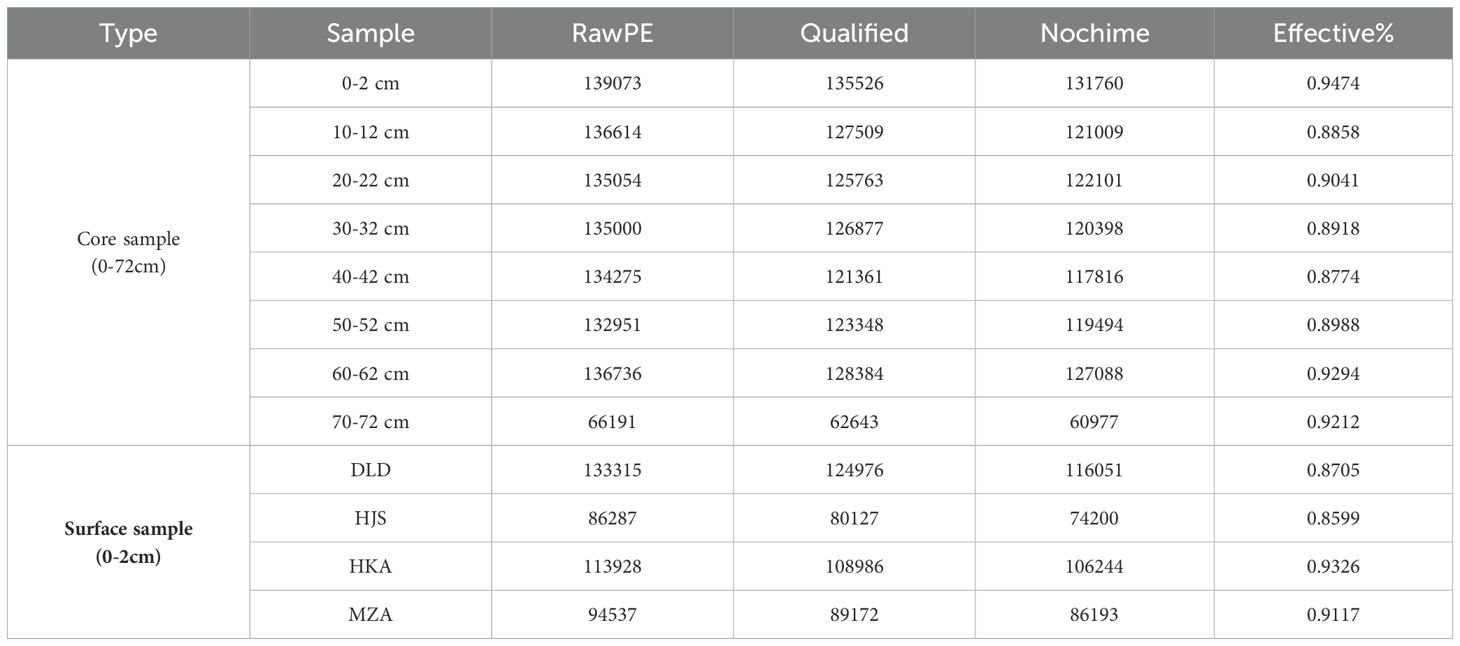
Table 2. Statistical summary of the basic eDNA sequencing data information for the different layers (0-72 cm) of the sediment core from Huokunao (HKA) station, as well as the surface sediments from Daleidao (DLD), Houjishan (HJS), Huokunao (HKA), and Mazuao (MZA) stations.
3.2 Chronological information
Based on 210Pb dating, age data for different sediment layers, including 0-2 cm, 10-12 cm, 30-32 cm, and 78-80 cm layers, were obtained (Table 3). Using formula (1) for calculation, sedimentation rates at different layers were determined. The sedimentation rate between 30 and 80 cm layer was the highest, reaching 2.83 cm/year. The sedimentation rate for the 0-10 cm layer was the lowest at 1.19 cm/year. Additionally, the sedimentation rate for the 10-30 cm layer was 2.55 cm/year. The estimated ages of the sediment layers were as follows: the deepest layer dated to 1994, the 10-12 cm layer to 2014, and the 30-32 cm layer to 2010. Assuming constant sedimentation rates across different intervals, the ages of other layers of the core sample were calculated based on known depths: the 20-22 cm layer was estimated to be from 2012, the 50-52 cm layer from 2004, the 60-62 cm layer from 2000, and the 70-72 cm layer from 1997.
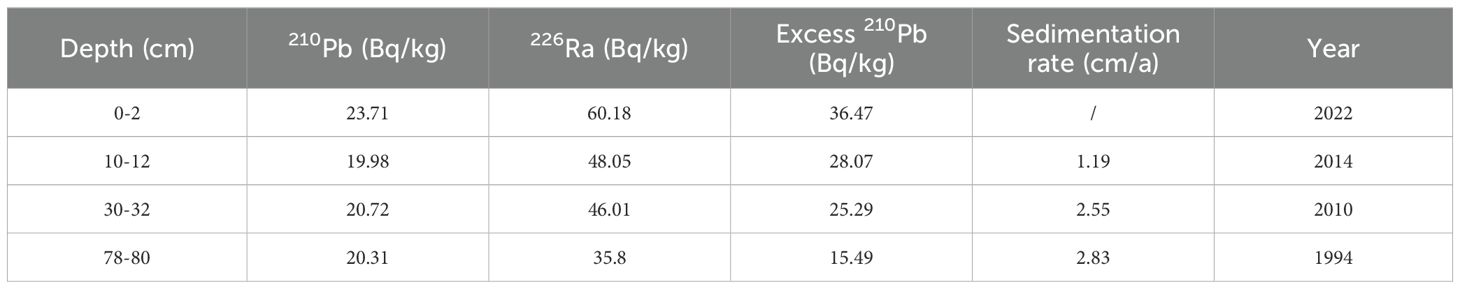
Table 3. Information on 210Pb dating of intertidal sediment cores from Huokunao station.
3.3 Microalgae community parameters
After comparing with the NCBI nt database, a total of 623,197 reads were annotated at the species level. The average number of reads for the different layers of the Huokunao sediment core was 45,882, which was lower than that of the surface sediment samples from DLD, HJS, HKA, and MZA (Table 4).
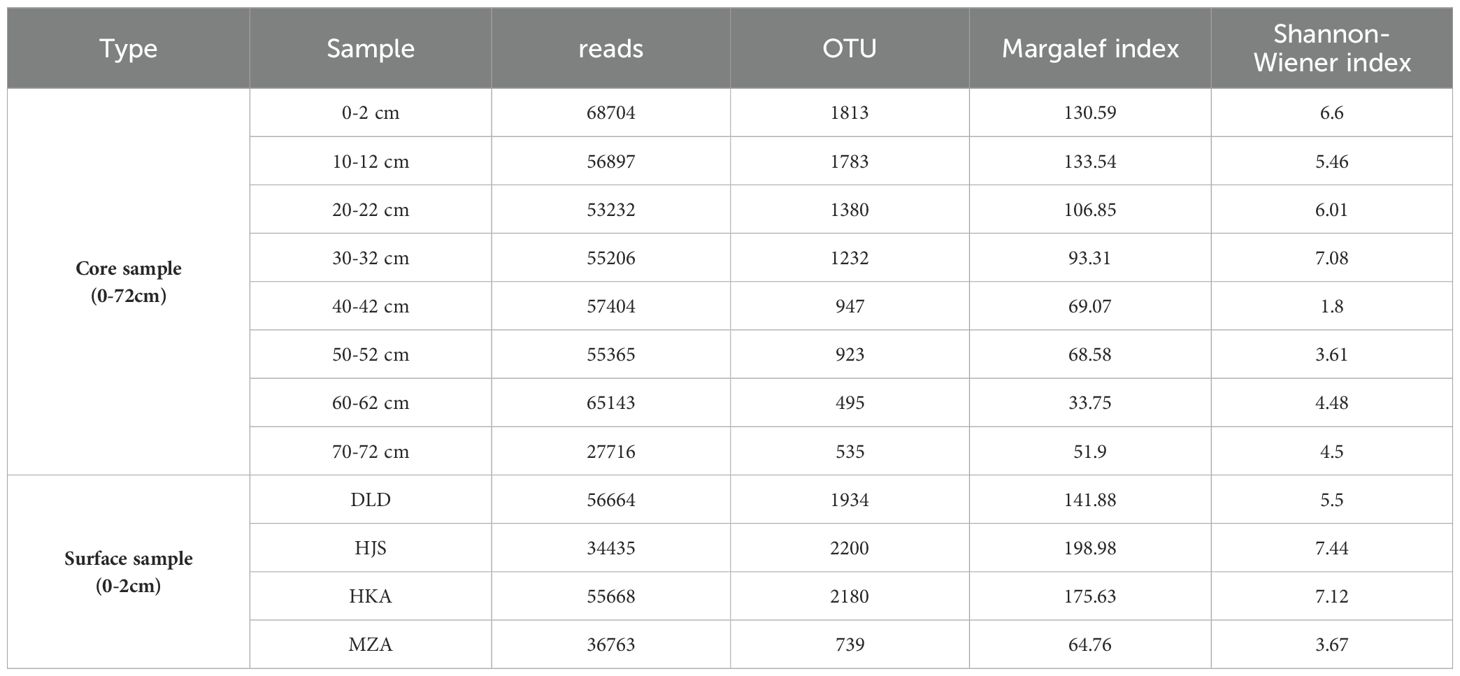
Table 4. The changes in read number, OTU number, Margalef index, and Shannon-Wiener index for the different layers (0-72 cm) of the Huokunao (HKA) sediment core, as well as the surface sediments from Daleidao (DLD), Houjishan (HJS), Huokunao (HKA), and Mazuao (MZA) stations.
3.3.1 Surface sediment samples
Among the surface sediment samples collected from DLD, HJS, HKA, and MZA stations, the DLD station exhibited the highest read number, with 56,664 reads. Conversely, the HJS station recorded the lowest read number. However, the OTU count, Margalef index, and Shannon-Wiener index were highest at the HJS station, with values of 2,180, 175.63, and 7.12, respectively (Table 4). In contrast, these indices were lowest at the MZA station.
3.3.2 Sediment core samples (0 -72 cm)
For the Huokunao sediment core samples, microalgal read counts exhibited an increasing trend from deeper layers to surface layers. Both the OTU number and Margalef index of the microalgal community also showed a consistent upward trend, peaking in the surface layer samples—OTUs peaked at 1,813 in the 0-2 cm layer, while the Margalef index reached a peak of 133.54 in the 10-12 cm layer. The minimum values for both indices were observed in the 60-62 cm layer (Figure 2). The Shannon-Wiener index, though fluctuating overall, demonstrated an increasing trend as sediment depth decreased, with its minimum value of 1.80 recorded in the 40-42 cm layer.
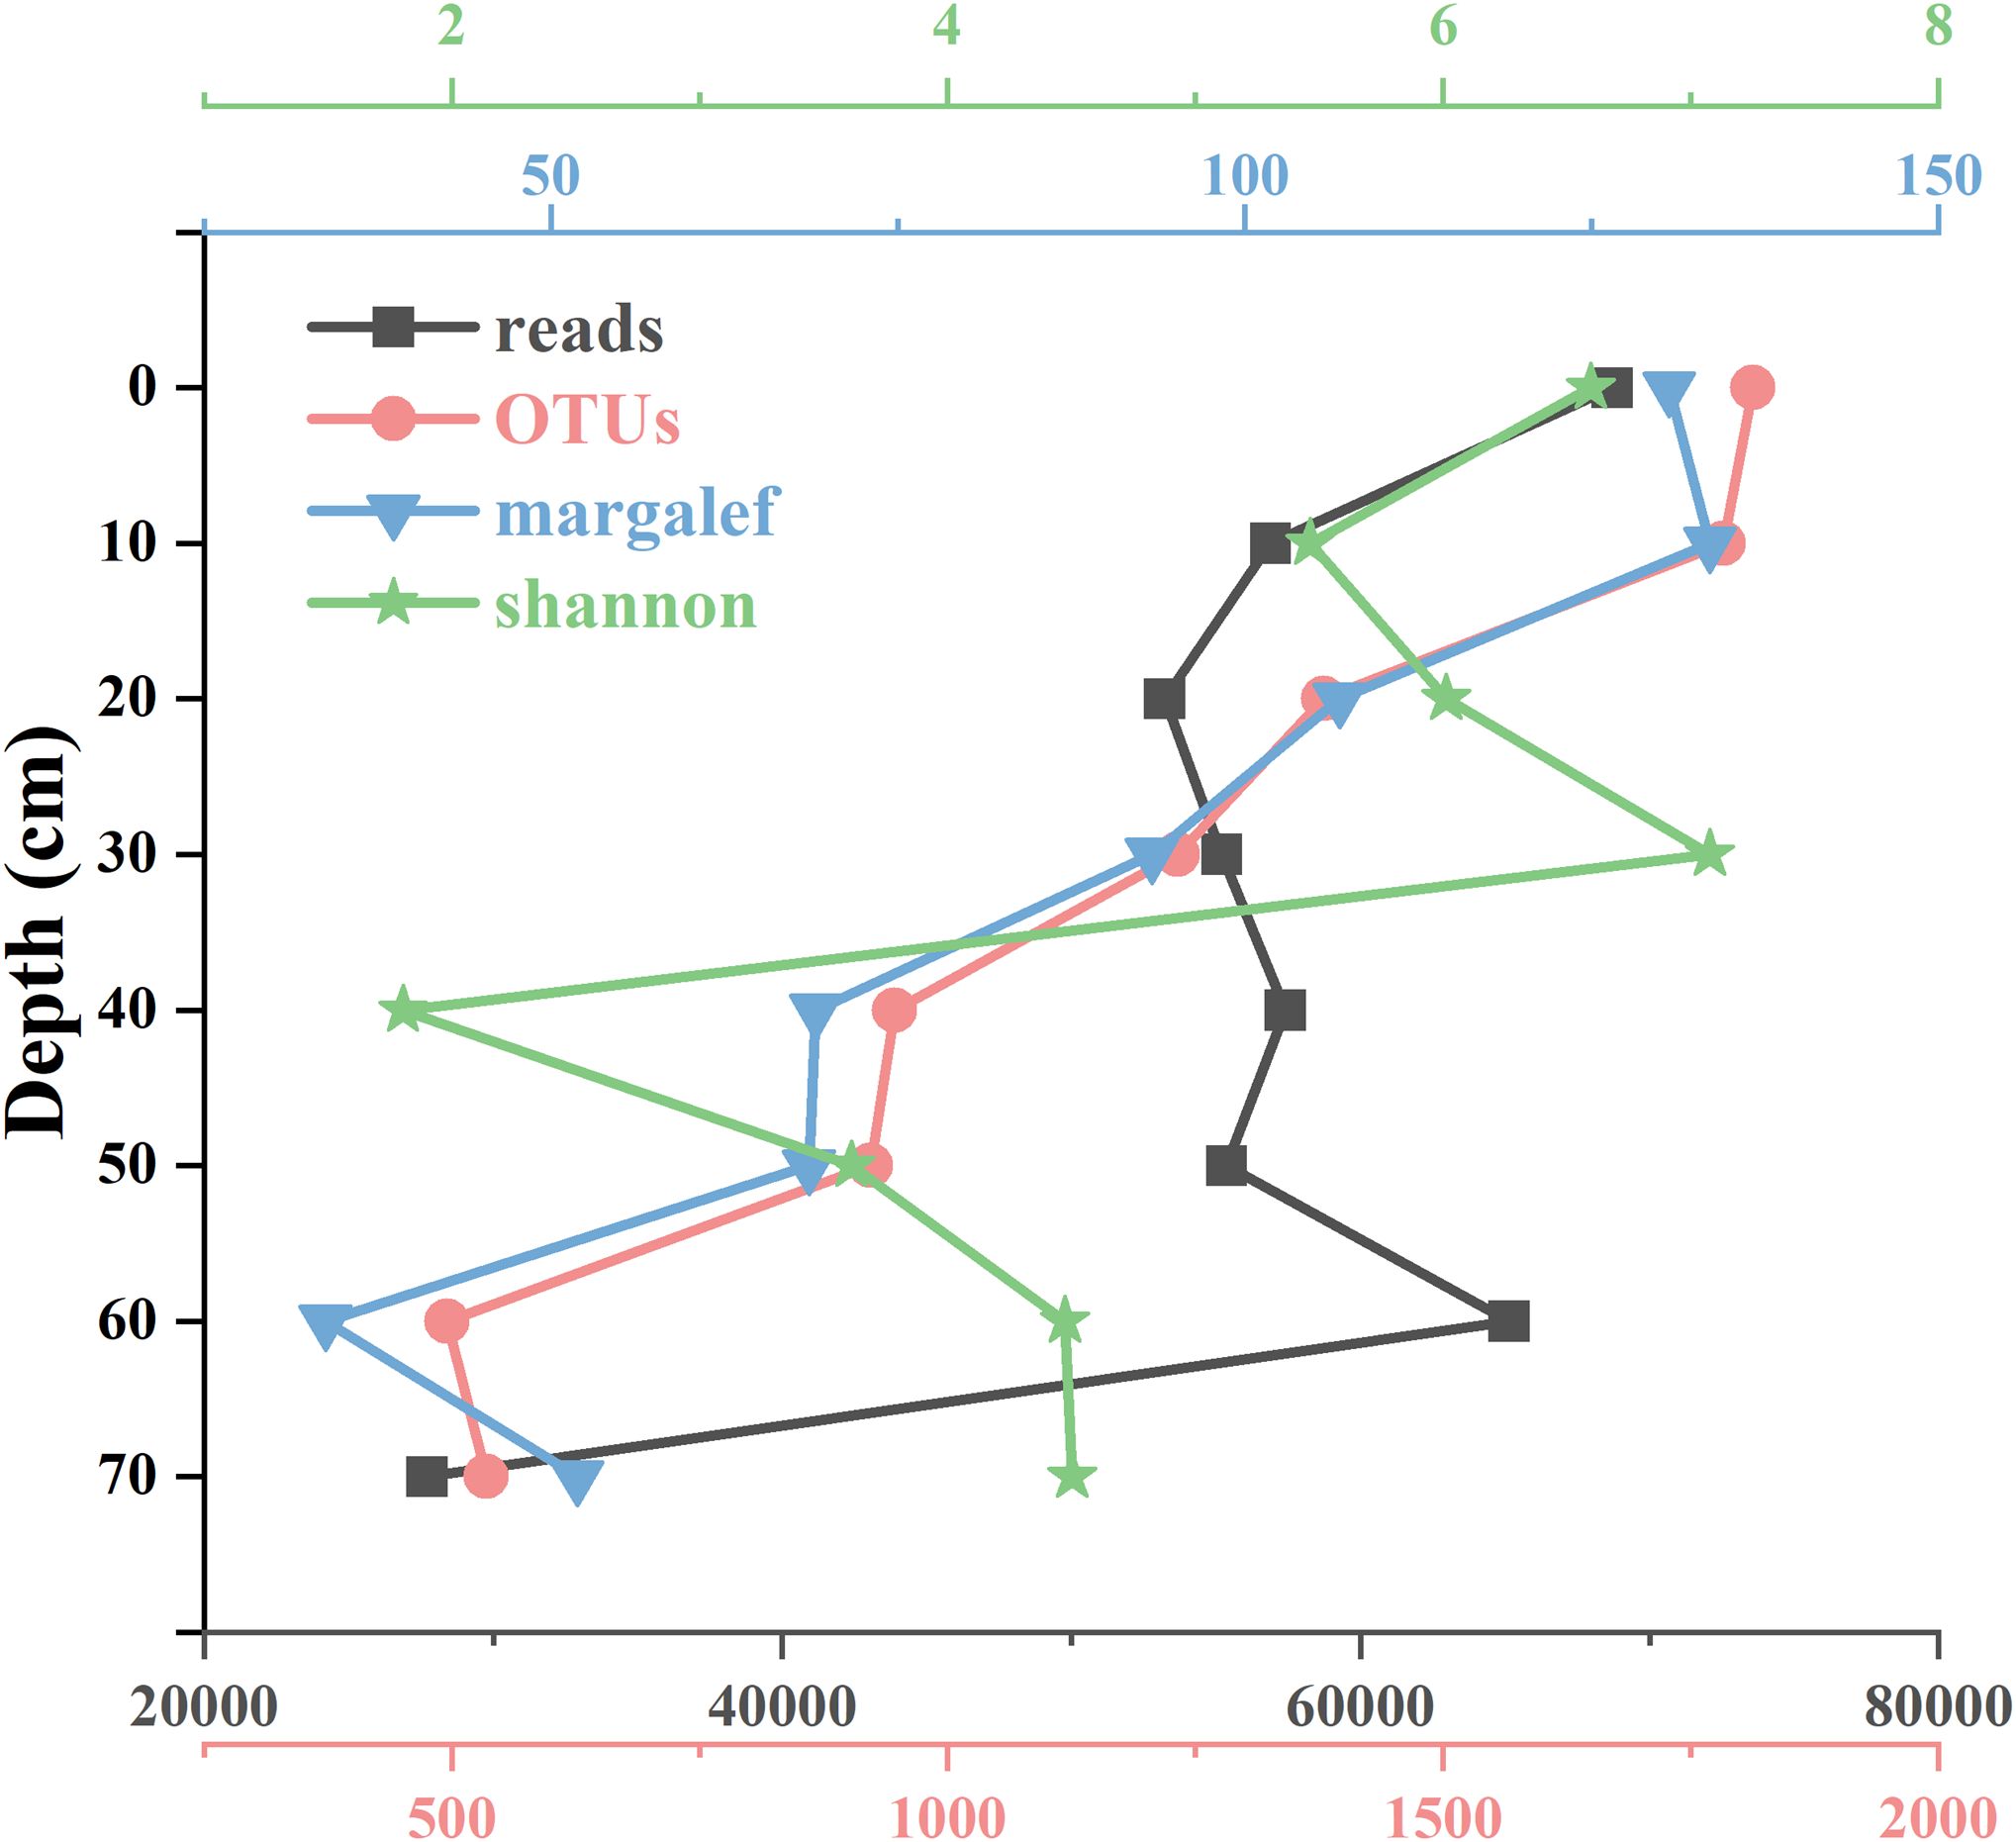
Figure 2. Microalgal community parameters at different depth layers of the Huokunao sediment core (0-72 cm), including the number of reads, number of OTUs, Margalef index, and Shannon-Wiener index.
3.4 Microalgae community composition
3.4.1 Surface sediment samples
The microalgal community compositions varied among the surface sediment samples from different stations. Bacillariophyta was the most abundant microalgae phylum at the DLD, HJS, and HKA stations, accounting for 67.62%, 55.39%, and 46.32% respectively, followed by Dinoflagellata and Chlorophyta. However, at the MZA station, Dinoflagellata emerged as the predominant group, accounting for 91.07%, followed by Streptophyta (Table 5). Comparisons with the NCBI nt database annotated a total of 552 species. Among these, Alexandrium pacificum, Thalassiosira profunda, Odontella sp. TN-2014, Bacillariophycidae sp. TN-2014, and Navicula cryptocephala each accounted for more than 5% of the reads and are considered dominant species (Table 6). Specifically, A. pacificum was the most abundant microalgae at the DLD, HJS, and MZA stations, while N. cryptocephala was the most abundant species in the surface sediment sample from the HKA station.
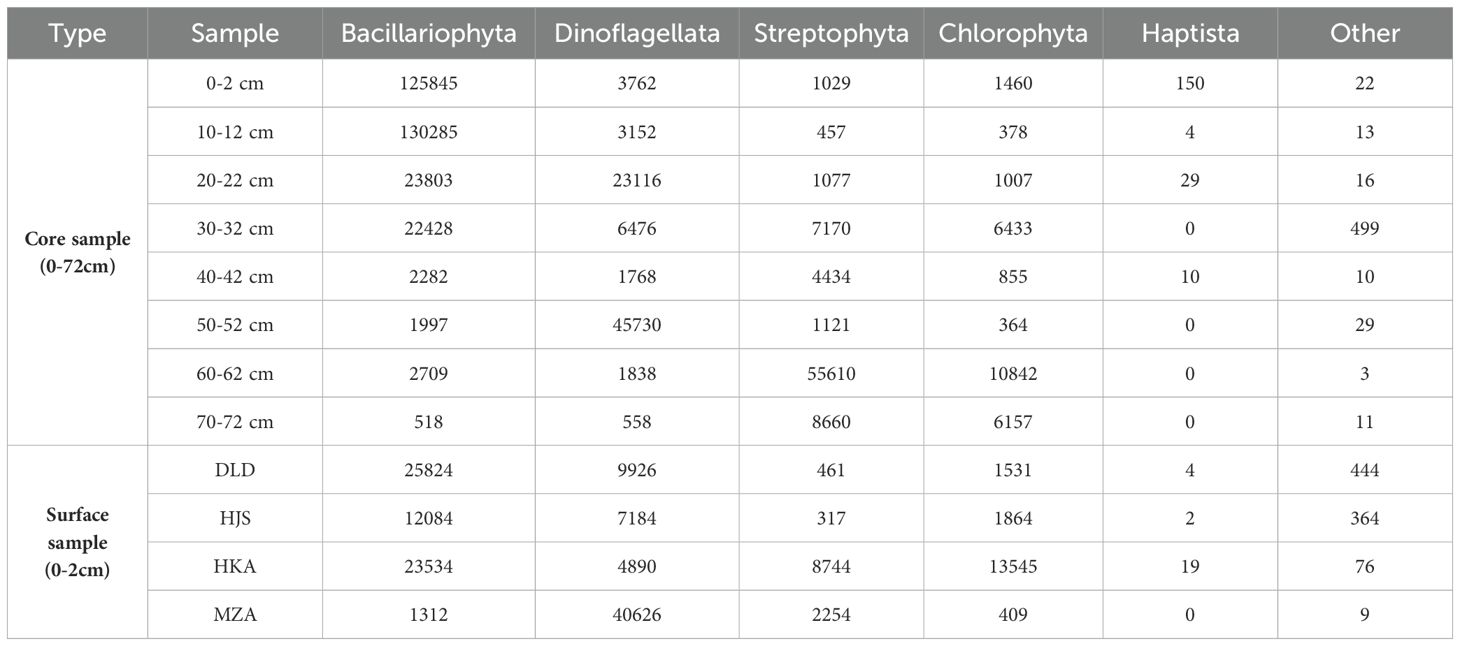
Table 5. The read number of microalgae phyla in different layers (0-72 cm) of the Huokunao (HKA) sediment core, as well as the surface sediments from Daleidao (DLD), Houjishan (HJS), Huokunao (HKA), and Mazuao (MZA) stations.
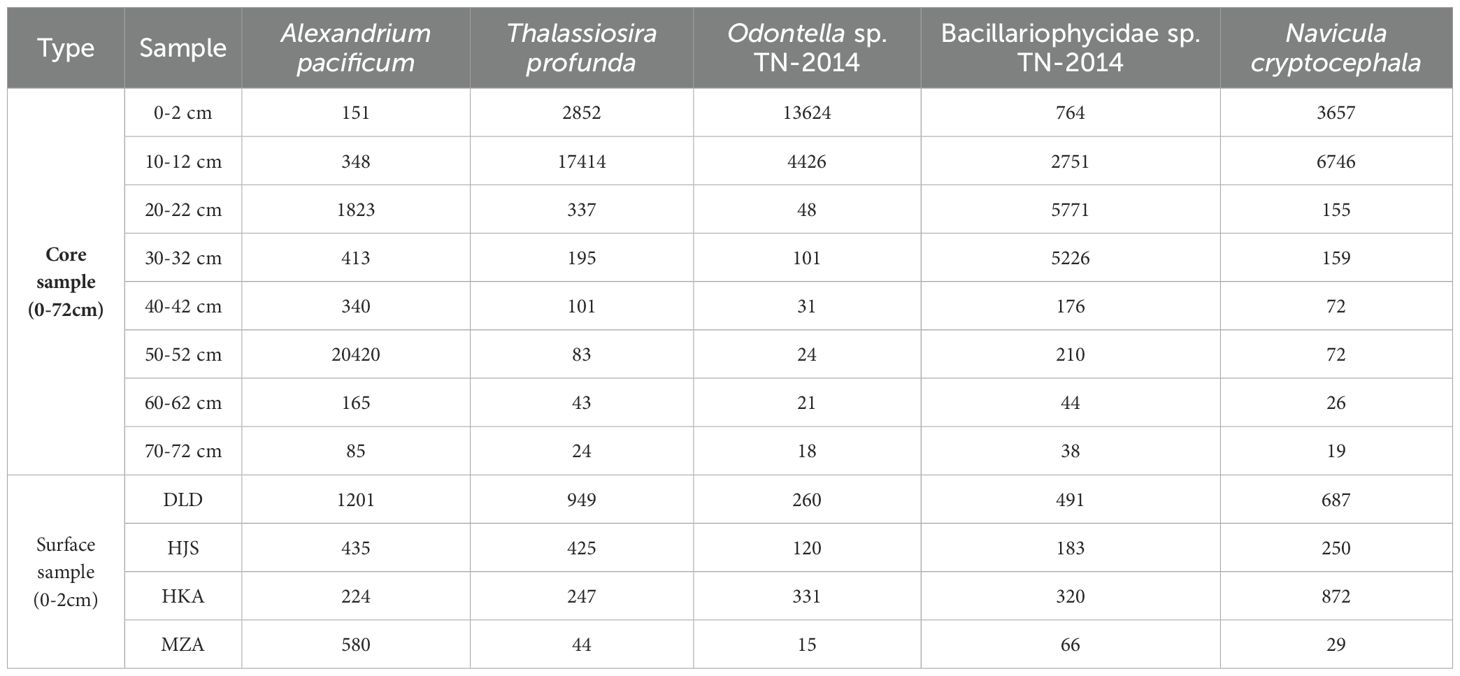
Table 6. Reads information of dominant microalgal species in different layers (0-72 cm) of the Huokunao (HKA) sediment core, as well as the surface sediments from Daleidao (DLD), Houjishan (HJS), Huokunao (HKA), and Mazuao (MZA) stations.
3.4.2 Sediment core samples (0 -72 cm)
As detailed in Table 5, Bacillariophyta was the most annotated microalgal phylum, with 372,621 reads accounting for 56.50% of the total reads. This phylum peaked in the 10-12 cm layer of the Huokunao sediment core. The next two dominant groups were Dinoflagellata and Streptophyta, which accounted for 22.60% and 13.85%, respectively. Chlorophyta accounted for 6.80%, while Haptista and other minor microalgal phyla made up less than 1%. As sediment depth decreased, the read number of Bacillariophyta increased, reaching a maximum at the 10-12 cm layer, while the read number of other microalgal phyla decreased (Figure 3, left). However, the number of OTUs for both Bacillariophyta and other microalgal groups increased with decreasing sediment depth (Figure 3, right).
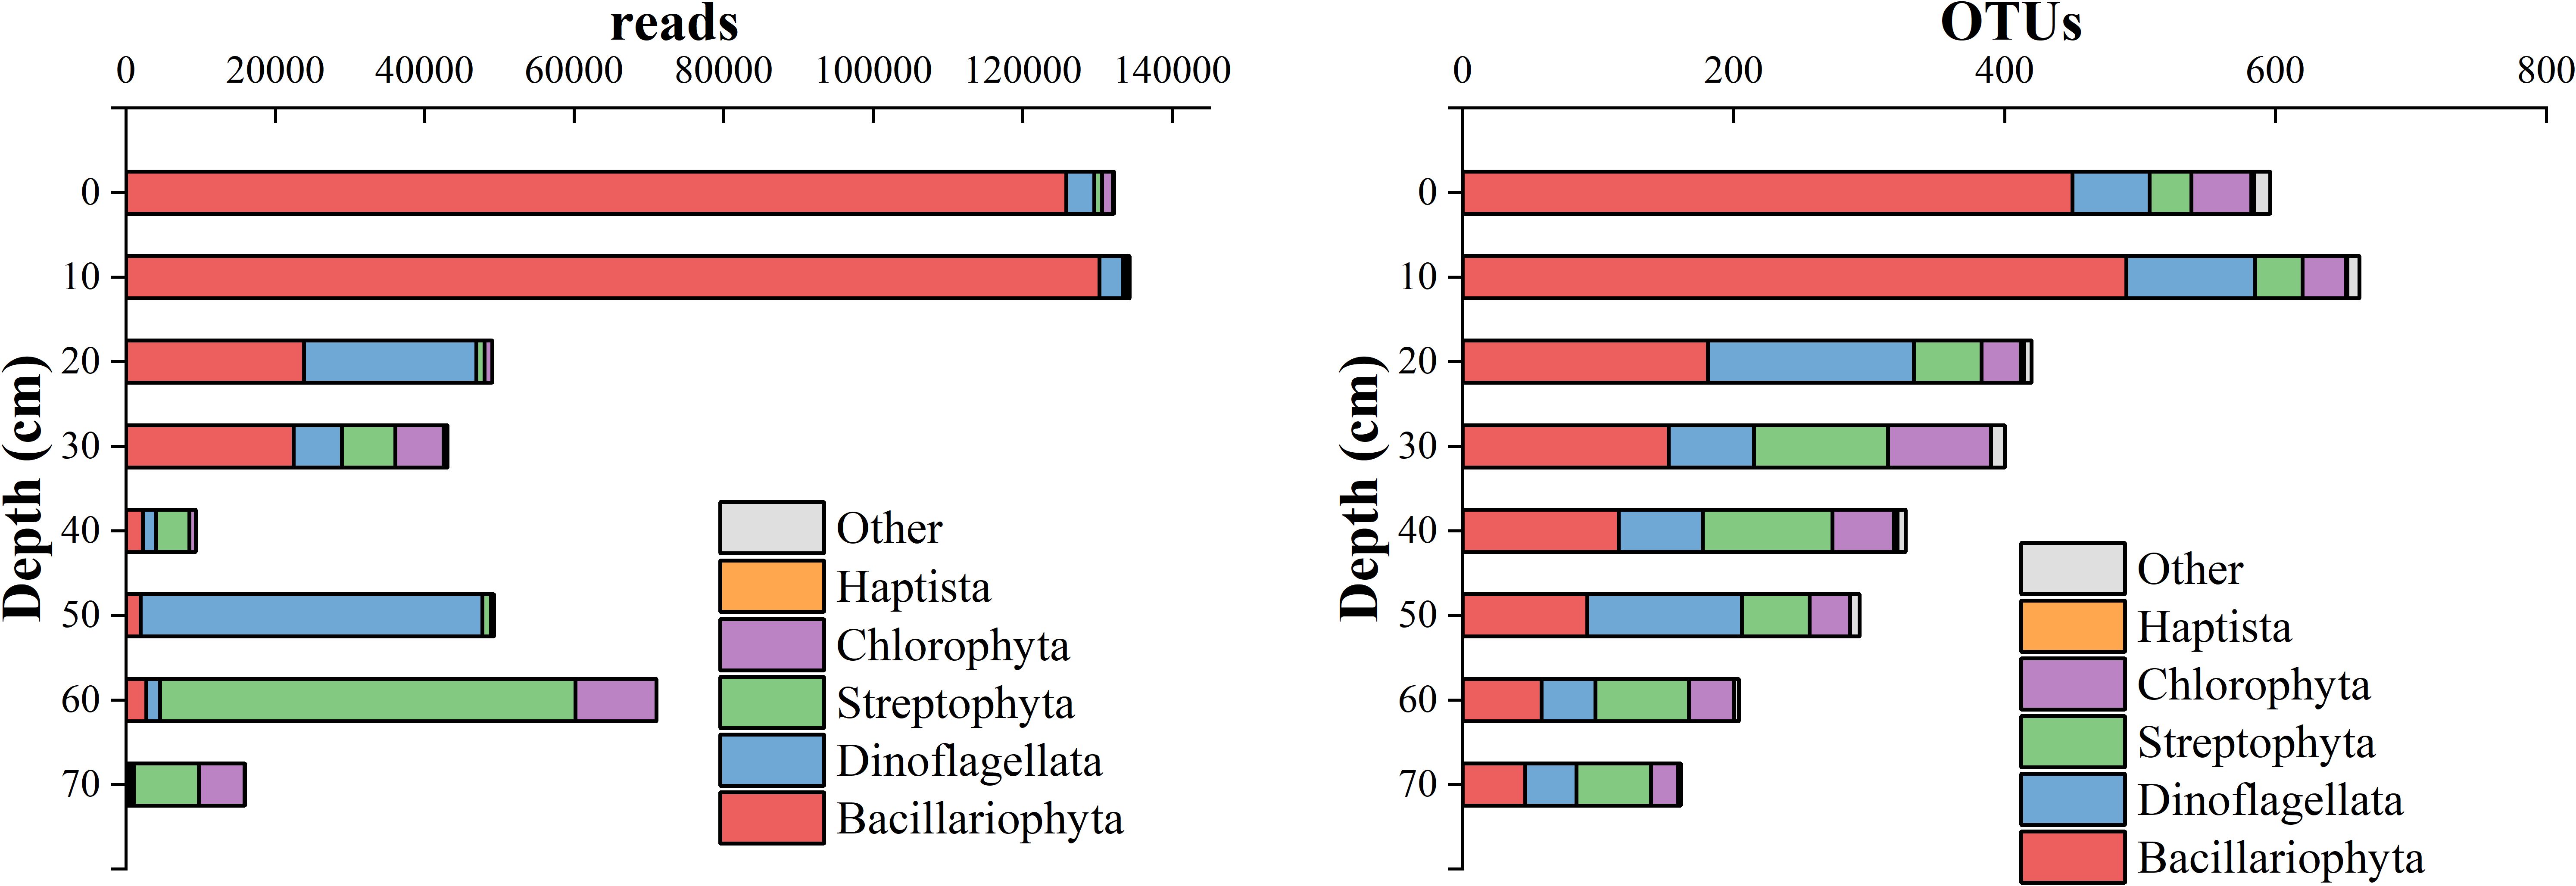
Figure 3. The changes in reads (left) and OTUs (right) of different microalgal phyla along the depth of the Huokunao sediment core.
A. pacificum was the species with the highest number of reads, accounting for 10.57% of the total reads. In the Huokunao sediment core samples, A. pacificum reached its maximum read count in the 50-52 cm layer, significantly higher than in other layers. Reads of T. profunda, accounting for 9.17%, gradually increased with decreasing sediment depth, showing an upward trend. Odontella sp. TN-2014 and N. cryptocephala accounted for 7.68% and 5.14% of the reads respectively, reaching their maximum values in the surface 0-2 cm layer or the 10-12 cm layer.
4 Discussion
On September 30, 1990, the State Council of China officially approved the establishment of five marine nature reserves, including the Nanji Islands. Renowned for their rich biodiversity, particularly in mollusks and algae, the Nanji Islands have earned the nickname “Mollusk and Algae Kingdom.” This exceptional biodiversity has attracted considerable attention from the scientific community. Researchers have conducted surveys on coralline algae (Tang et al., 2014), benthic diatoms (Li et al., 2017), and phytoplankton (Li et al., 2010) in the Nanji Islands, revealing the biodiversity characteristics from various perspectives and across different biological groups.
4.1 Changes in microalgal community of core sample (0-72 cm)
The average Shannon-Wiener index obtained in this study exceeds 5, indicating a high level of microalgal diversity. Since the establishment of the nature reserve, sporadic reports on microalgae investigations in the Nanji Islands have been published (Wang and Zhu, 1998; Li et al., 2017), making it challenging to study historical environment changes in the region through microalgae community. The microalgal communities in Guoxingao, Dashaao, and Shangmaan of the Nanji Islands are primarily dominated by diatoms, accounting for more than 90% of the community (Wang and Zhu, 1998). Li et al. (2017) provided detailed accounts of the benthic diatom community in the intertidal zone of the Nanji Islands in 2013-2014 and compared these data with pre-reserve establishment surveys. They observed an increase in diatom diversity, with the number of families rising by 7, and significant increases in the number of genera and species—from 29 genera and 55 species to 49 genera and 120 species—indicating a rise in the diversity of diatom communities.
Previous studies primarily relied on morphological data, which limited the comparative analysis of changes in the molecular diversity of microalgae. In this study, we utilized 210Pb dating to obtain age data for sediment layers at depths of 0-2 cm, 10-12 cm, 30-32 cm, and 78-80 cm (Table 1). By integrating sediment depth information, we estimated sedimentation ages, finding that the deepest sediment layer corresponded to 1994. The chronological information from the core samples was continuous, suggesting no significant disturbance occurred. From the 70-72 cm layer to the 60-62 cm layer, the number of microalgal reads increased rapidly from 27,716 to 65,143 (Figure 2). Although the number of eDNA reads cannot exactly correspond to the absolute abundance of organisms due to various factors (Barnes et al., 2014; Gardes and Bruns, 1993; Milivojević et al., 2021), the trend in read counts correlates with changes in abundance, indicating a potential increase during this period. Although definitive quantitative relationships between microalgae abundance and primary productivity are not well-established due to factors such as temperature (Grant, 1986), light intensity (Gómez et al., 2009), nutrition type (Zhang et al., 1998), many studies have reported a linkage between microalgae biomass (abundance) and primary productivity (Barranguet et al., 1998; Gilbert, 1991; Vuppaladadiyam et al., 2018; Chatterjee, 2014). Research indicates that peaks in microalgae primary productivity often coincide with peaks in biomass (Gilbert, 1991), and a positive correlation exists between biomass and primary production rates (Vuppaladadiyam et al., 2018). Therefore, the observed rapid increase in microalgae reads during this period indicates a rise in microalgae abundance, potentially linked to enhanced primary productivity over the subsequent 10 years following the establishment of the nature reserve. Furthermore, we observed a relatively slow growth in the number of reads during the 0-60 cm layer, suggesting a possible deceleration in microalgal productivity growth over the subsequent 20 years. However, it is important to consider that DNA degradation may introduce bias in the eDNA data analysis from core samples of varying ages, as the degree and proportion of eDNA degradation increase over time (Handt et al., 1994; Lindahl, 1993). In this study, DNA degradation was observed but did not significantly affect the results. There was no notable difference in the total raw sequences among the layers, except for the 70-72 cm layer (Table 2). The deeper layer (60-62 cm) exhibited the second highest read count of microalgae (Table 4). Changes in microalgal phyla and species did not appear to be influenced by DNA degradation (Figures 3, 4), likely due to the relatively short and recent age of the core samples. Analyzing changes in different microalgae groups revealed that the increase in read numbers primarily stemmed from the Bacillariophyta group. Meanwhile, the ratios of Dinoflagellata and Streptophyta decreased, indicating a shift in the microalgae community from being dominated by Dinoflagellata and Streptophyta to predominantly Bacillariophyta following the establishment of the nature reserves (Figure 3). Zhou et al. (2017) studied the seasonal succession of Dinoflagellata and Bacillariophyta, finding that phosphate is the most critical factor for the decline of diatom blooms and the succession from diatom to dinoflagellate blooms, with increased temperatures favoring dinoflagellate growth. Although annual succession differs from seasonal patterns, the impact of phosphate remains significant. After the establishment of the nature reserve, reduced human activity likely contributed to a decline in terrigenous phosphates, which may explain the increase in Bacillariophyta. The Margalef index initially decreased but subsequently showed a stable upward trend, while the OTU numbers of groups such as Bacillariophyta, Dinoflagellata, Streptophyta, and Chlorophyta all increased (Figure 3). This indicates an improvement in the biodiversity of microalgae in the Nanji Islands, suggesting that the marine environment has benefited from the establishment of the protected area. This finding aligns with Li et al. (2017), who reported an increase in diatom taxa following the establishment of the protected area. Although no direct correlation between microalgae diversity and environmental quality changes has been reported, biodiversity loss is often linked to global climate change (Blois et al., 2010; Buisson et al., 2013; Thuiller et al., 2005). Thus, the establishment of nature reserves and the subsequent improvement of the local environment provide a reasonable explanation for the enhancement of local biodiversity.
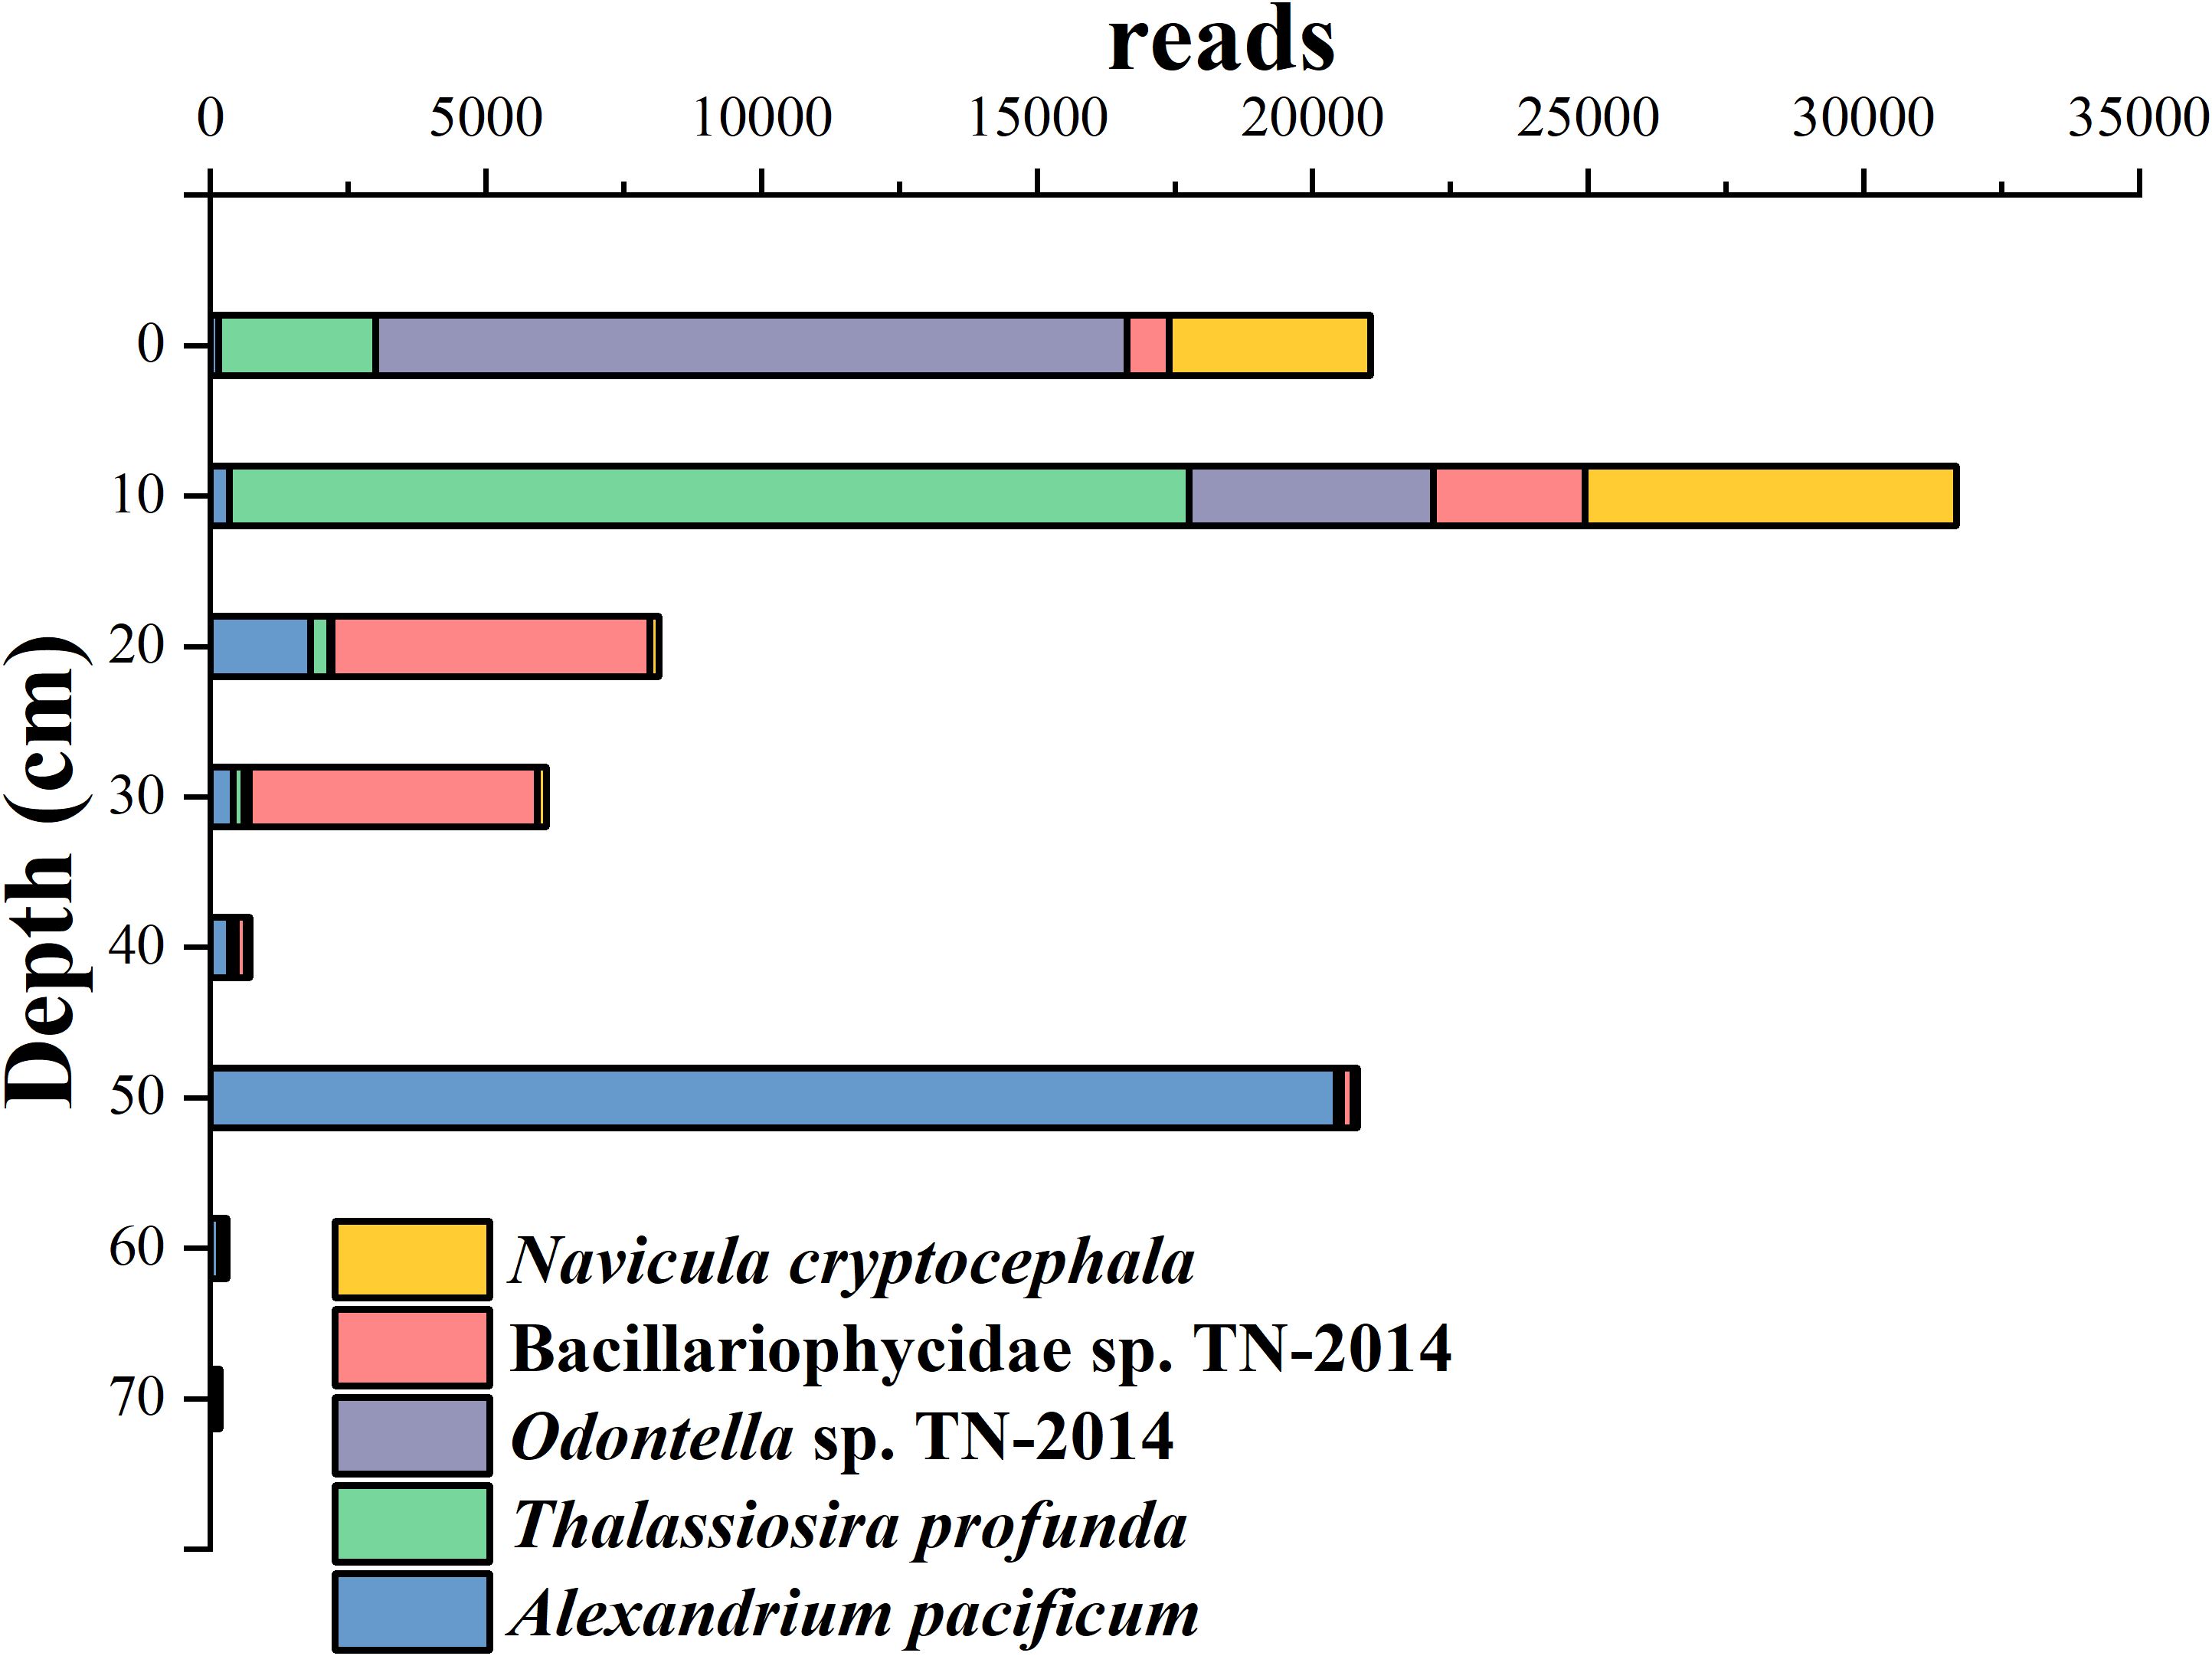
Figure 4. The stacked bar chart of the dominant microalgal species reads along the depth of the Huokunao sediment core.
4.2 Validation of red tides
Microalgae species annotations were obtained through comparisons with the NCBI nt database. Among the identified species, Alexandrium pacificum exhibited the highest read proportion, reaching 10.57%. This species belongs to the genus Alexandrium, many of whose members produce potent algal toxins, including paralytic shellfish toxins (PST) and spirolides. The massive proliferation of Alexandrium species pose serious threats to human health, ecosystems, and the mariculture industry (Anderson et al., 2012). Eutrophication and harmful algal blooms are significant marine environmental issues in China’s coastal areas, especially near the Yangtze River Estuary (Zhou et al., 2008; Wang and Wu, 2009). A. pacificum is widely distributed in the Bohai Sea, Yellow Sea, and East China Sea (Dai et al., 2020; Gao et al., 2015). Significant blooms of this species have been reported in the South China Sea, coastal areas near the Yangtze River Estuary in the East China Sea, and the northern part of the Yellow Sea (Song et al., 2009; Wang et al., 2011). In this study, the read number of A. pacificum was exceptionally high in the 50-52 cm layer of the Huokunao sediment core, far exceeding its read numbers in other layers (Figure 4). Assuming a constant sedimentation rate, the sedimentation age of the 50-52 cm layer was estimated to be around the 2000s. Previous research has documented Alexandrium red tide events in China’s coastal areas, noting seven Alexandrium-related red tide events in the Zhejiang region between 2002 and 2003, with a cumulative area exceeding 1000 km², including three events near Nanji Islands and surrounding waters in Wenzhou, Zhejiang (Liang et al., 2019). The outbreaks of Alexandrium-related red tides in the Nanji Islands and adjacent sea areas likely contributed to the accumulation of Alexandrium DNA in the sediment core, as reflected in the high read abundance at this sediment layer. This confirms the validation role of microalgal eDNA in studying marine red tide events and other environmental changes.
4.3 Problems and reflections
The Huokunao intertidal area in Nanji islands was previously the site of the Nanji town government, resulting in relatively dense human activity in the past. Terrestrial pollutants, such as domestic sewage, frequently entered this marine environment. In this study, freshwater species like Navicula cryptocephala were detected. Similarly, N. phylleptosoma, N. arenaria, N. cancellate, and N. perminuta were identified as dominant species in this area in other studies (Li et al., 2017), indicating significant influence from terrigenous material input. Additionally, prior to the establishment of the protected area in 1990, a fish meal factory was built near Huokunao, with effluents from the factory affecting the area (Yang et al., 1994). Consequently, the Huokunao area has been significantly impacted by human activities, leading to a moderate degree of environmental pollution (Chen et al., 2016; Li et al., 2017). Frequent human activities may have led to a complex sedimentary environment, potentially disturbing the sedimentary sequence and complicating the acquisition of orderly sediment samples—this represents one potential sources of error in our dating study. Furthermore, the 210Pb dating method used in this study assumes that measured excess 210Pb activity increases with depth in sediment samples (Wan, 1997; Xia and Xue, 2004). However, historical human activities on Huokunao may have introduced pollution-related issues, leading to an excessive input of allochthonous 210Pb, which could bias the dating results. Additionally, repeated tidal fluctuations in the Huokunao intertidal area may have caused disturbances in the sedimentary environment, affecting data accuracy. Regarding the eDNA research in this study, the use of high-throughput sequencing can be influenced by primer bias, leading to significant differences in the sequencing data (Pawlowski and Lecroq, 2010). Moreover, the target fragments obtained through high-throughput sequencing are generally relatively short, limiting the genetic information they contain (Ujiié and Ishitani, 2016). Currently, assessing the absolute information of species using metabarcoding or eDNA data remains challenging. Factors such as rDNA copy number (Milivojević et al., 2021), DNA degradation (Barnes et al., 2014), and experimental bias (Gardes and Bruns, 1993) may introduce further biases. The species annotation in this study was based on the NCBI database, which, while aiming to provide high-quality data, may vary due to the diversity of data sources. Some data may have undergone rigorous verification and quality control, while others may be less reliable. Additionally, the breadth and complexity of the bioinformatics field may result in missing or incomplete data for certain microalgae groups or species, limiting the application of eDNA technology in evaluating and researching microalgal molecular diversity. A specialized database for microalgae and plants is needed in the future.
5 Conclusion
This study collected sediment samples from stations such as Daleidao, Houjishan, Huokunao, and Mazuao in Nanji Island, employing eDNA technology combined with 210Pb dating to reveal the historical changes in microalgal diversity in the Nanji islands region:
(1) The number of microalgal reads increased rapidly from the 70-72 cm layer to the 60-62 cm layer, indicating a significant rise in abundance during the 10 years following the establishment of the Nanji Islands Nature Reserve. This was followed by a slowdown in growth over the subsequent 20 years. (2) Simultaneously, the number of OTUs and the Margalef index increased, suggesting an improvement in microalgal diversity. The establishment of the protected area may have contributed to the enhanced environment and increased species diversity in the Nanji islands region. (3) The entire microalgal community underwent succession, transitioning from dominance by Dinoflagellata and Streptophyta to dominance by Bacillariophyta. This shift could be attributed to environmental changes, particularly related to phosphates.
Data availability statement
The original contributions presented in the study are publicly available. This data can be found here: NCBI, PRJNA1136642.
Ethics statement
The manuscript presents research on animals that do not require ethical approval for their study.
Author contributions
HL: Writing – review & editing, Writing – original draft, Visualization, Methodology, Investigation, Formal analysis, Data curation. AX: Writing – original draft, Methodology, Investigation, Data curation. ZY: Writing – original draft, Methodology, Investigation. YL: Writing – review & editing, Supervision, Project administration, Funding acquisition. JC: Writing – original draft, Methodology, Investigation. ZZ: Writing – original draft, Investigation. KX: Writing – original draft, Project administration. TL: Writing – review & editing, Funding acquisition. SX: Writing – original draft, Project administration.
Funding
The author(s) declare financial support was received for the research, authorship, and/or publication of this article. This work received financial supports from the following projects: Laoshan Laboratory (No. LSKJ202204900); National Science Foundation of China (No. U1906211); the Strategic Priority Research Program of the Chinese Academy of Sciences (No. XDB42000000); Science and Technology Program of Nanji Islands National Marine Nature Reserve Administration (No. NJKJ-2021-006).
Acknowledgments
The authors would like to express their sincere gratitude to the members of the Foraminiferal Diversity and Global Change Research Group at the Institute of Oceanology, Chinese Academy of Sciences (including Li Qingxia, Dong Shuaishuai, etc.) for their assistance in the collection and sub-sampling of the sediment core samples.
Conflict of interest
The authors declare that the research was conducted in the absence of any commercial or financial relationships that could be construed as a potential conflict of interest.
Publisher’s note
All claims expressed in this article are solely those of the authors and do not necessarily represent those of their affiliated organizations, or those of the publisher, the editors and the reviewers. Any product that may be evaluated in this article, or claim that may be made by its manufacturer, is not guaranteed or endorsed by the publisher.
Supplementary material
The Supplementary Material for this article can be found online at: https://www.frontiersin.org/articles/10.3389/fmars.2024.1466434/full#supplementary-material
References
Alsos I. G., Lammers Y., Yoccoz N. G., Jørgensen T., Sjögren P., Gielly L., et al. (2018). Plant DNA metabarcoding of lake sediments: How does it represent the contemporary vegetation. PloS One 13, e0195403. doi: 10.1371/journal.pone.0195403
Alsos I. G., Sjögren P., Edwards M. E., Landvik J. Y., Gielly L., Forwick M., et al. (2016). Sedimentary ancient DNA from Lake Skartjørna, Svalbard: Assessing the resilience of arctic flora to Holocene climate change. Holocene. 26, 627–642. doi: 10.1177/0959683615612563
Anderson D. M., Alpermann T. J., Cembella A. D., Collos Y., Masseret E., Montresor M. (2012). The globally distributed genus Alexandrium: Multifaceted roles in marine ecosystems and impacts on human health. Harmful Algae 14, 10–35. doi: 10.1016/j.hal.2011.10.012
Ariza M., Fouks B., Mauvisseau Q., Halvorsen R., Alsos I. G., de Boer H. J. (2023). Plant biodiversity assessment through soil eDNA reflects temporal and local diversity. Methods Ecol. Evol. 14, 415–430. doi: 10.1111/2041-210X.13865
Armbrecht L., Weber M. E., Raymo M. E., Peck V. L., Williams T., Warnock J., et al. (2022). Ancient marine sediment DNA reveals diatom transition in Antarctica. Nat. Commun. 13, 5787. doi: 10.1038/s41467-022-33494-4
Barnes M. A., Turner C. R., Jerde C. L., Renshaw M. A., Chadderton W. L., Lodge D. M. (2014). Environmental conditions influence eDNA persistence in aquatic systems. Environ. Sci. Technol. 48, 1819–1827. doi: 10.1021/es404734p
Barranguet C., Kromkamp J., Peene J. (1998). Factors controlling primary production and photosynthetic characteristics of intertidal microphytobenthos. Mar. Ecol. Prog. Ser. 173, (117–(126. doi: 10.3354/meps173117
Beng K. C., Corlett R. T. (2020). Applications of environmental DNA (eDNA) in ecology and conservation: opportunities, challenges and prospects. Biodiversity Conserv. 29, 2089–2121. doi: 10.1007/s10531-020-01980-0
Blois J. L., McGuire J. L., Hadly E. A. (2010). Small mammal diversity loss in response to late-Pleistocene climatic change. Nature. 465, 771–774. doi: 10.1038/nature09077
Bradley B. J., Stiller M., Doran-Sheehy D. M., Harris T., Chapman C. A., Vigilant L., et al. (2007). Plant DNA sequences from feces: potential means for assessing diets of wild primates. Am. J. Primatology 69, 699–705. doi: 10.1002/ajp.20384
Buisson L., Grenouillet G., Villéger S., Canal J., Laffaille P. (2013). Toward a loss of functional diversity in stream fish assemblages under climate change. Glob. Change. Biol. 19, 387–400. doi: 10.1111/gcb.12056
Caporaso J. G., Kuczynski J., Stombaugh J., Bittinger K., Bushman F. D., Costello E. K., et al. (2010). QIIME allows analysis of high-throughput community sequencing data. Nat. Methods 7, 335–336. doi: 10.1038/nmeth.f.303
Carrasco-Puga G., Díaz F. P., Soto D. C., Hernández-Castro C., Contreras-López O., Maldonado A., et al. (2021). Revealing hidden plant diversity in arid environments. Ecography 44, 98–111. doi: 10.1111/ecog.05100
Chatterjee A. (2014). Role of benthic microalgae in a coastal zone: biomass, productivity and biodiversity [M] (Brest: Université de Bretagne occidentale-Brest).
Chen X., Chen W., Cai H., Xu K. (2016). Spatiotemporal distribution of species diversity and community structure of ciliates in intertidal sandy sediments of Huokunao beach, Nanji Islands. Mar. Sci. 40, 82–93.
Dai L., Geng H.-X., Yu R.-C., Liu Y., Zhao J.-Y., Wang J.-X., et al. (2020). Distribution of Alexandrium pacificum cysts in the area adjacent to the Changjiang River estuary, China. Mar. pollut. Bull. 156, 111206. doi: 10.1016/j.marpolbul.2020.111206
De Schepper S., Ray J. L., Skaar K. S., Sadatzki H., Ijaz U. Z., Stein R., et al. (2019). The potential of sedimentary ancient DNA for reconstructing past sea ice evolution. ISME J. 13, 2566–2577. doi: 10.1038/s41396-019-0457-1
Edgar R. C. (2013). UPARSE: highly accurate OTU sequences from microbial amplicon reads. Nat. Methods 10, 996–998. doi: 10.1038/nmeth.2604
Edgar R. C. (2016). UNOISE2: improved error-correction for Illumina 16S and ITS amplicon sequencing. bioRxiv. 081257.
Errera R. M., Roelke D. L., Kiesling R. L., Brooks B. W., Grover J. P., Schwierzke L., et al. (2008). Effect of imbalanced nutrients and immigration on Prymnesium parvum community dominance and toxicity: results from in-lake microcosm experiments. Aquat. Microbial Ecol. 52, 33–44. doi: 10.3354/ame01199
Gao Y., Yu R.-C., Chen J.-H., Zhang Q.-C., Kong F.-Z., Zhou M.-J. (2015). Distribution of Alexandrium fundyense and A. pacificum (Dinophyceae) in the Yellow Sea and Bohai Sea. Mar. pollut. Bull. 96, 210–219. doi: 10.1016/j.marpolbul.2015.05.025
Garcés-Pastor S., Coissac E., Lavergne S., Schwörer C., Theurillat J.-P., Heintzman P. D., et al. (2022). High resolution ancient sedimentary DNA shows that alpine plant diversity is associated with human land use and climate change. Nat. Commun. 13, 6559. doi: 10.1038/s41467-022-34010-4
Gardes M., Bruns T. D. (1993). ITS primers with enhanced specificity for basidiomycetes - application to the identification of mycorrhizae and rusts. Mol. Ecol. 2, 113–118. doi: 10.1111/j.1365-294X.1993.tb00005.x
Gilbert N. S. (1991). Primary production by benthic microalgae in nearshore marine sediments of Signy Island, Antarctica. Polar Biol. 11, 339–346. doi: 10.1007/BF00239026
Gómez I., Wulff A., Roleda M. Y., Huovinen P., Karsten U., Quartino M. L., et al. (2009). Light and temperature demands of marine benthic microalgae and seaweeds in polar regions. Botanica Marina 52, 593–608. doi: 10.1515/BOT.2009.073
Grant J. (1986). Sensitivity of benthic community respiration and primary production to changes in temperature and light. Mar. Biol. 90, 299–306. doi: 10.1007/BF00569142
Hallegraeff G. M. (1993). A review of harmful algal blooms and their apparent global increase. Phycologia. 32, 79–99. doi: 10.2216/i0031-8884-32-2-79.1
Hambright K. D., Easton J. D., Zamor R. M., Beyer J., Easton A. C., Allison B. (2014). Regulation of growth and toxicity of a mixotrophic microbe: implications for understanding range expansion in Prymnesium parvum. Freshw. Sci. 33, 745–754. doi: 10.1086/677198
Handt O., Höss M., Krings M., Pääbo S. (1994). Ancient DNA: methodological challenges. Experientia. 50, 524–529. doi: 10.1007/BF01921720
Hartvig I., Kosawang C., Kjær E. D., Nielsen L. R. (2021). Detecting rare terrestrial orchids and associated plant communities from soil samples with eDNA methods. Biodiversity Conserv. 30, 3879–3901. doi: 10.1007/s10531-021-02279-4
Jørgensen T., Haile J., Möller P., Andreev A., Boessenkool S., Rasmussen M., et al. (2012). A comparative study of ancient sedimentary DNA, pollen and macrofossils from permafrost sediments of northern Siberia reveals long-term vegetational stability. Mol. Ecol. 21, 1989–2003. doi: 10.1111/j.1365-294X.2011.05287.x
Landsberg J. H. (2002). The effects of harmful algal blooms on aquatic organisms. Rev. Fish Sci. 10, 113–390. doi: 10.1080/20026491051695
Li Y., Chen W., Cai H., Sun Z., Xu K. (2017). Spatio-temporal variation of benthic diatom diversity and community structure in a sandy intertidal zone of the Nanji Islands, China. Biodiversity Sci. 25, 981–989. doi: 10.17520/biods.2017052
Li Y., Li H., Lv S., Jiang T., Xiao Y., Chen S. (2010). Species diversity and distribution of phytoplankton in Nanji islands national nature reserve. Acta Hydrobiologica Sin. 34, 618–628. doi: 10.3724/issn1000-3207-2010-3-618-g
Liang Y., Li D., Yao J., Jin W., Gong C., Liu R. (2019). Progresses in investigation and research on phycotoxins and toxic microalgaes in the coastal waters of China. Oceanologia Limnologia Sin. 50, 511–524.
Lindahl T. (1993). Instability and decay of the primary structure of DNA. Nature. 362, 709–715. doi: 10.1038/362709a0
Magoč T., Salzberg S. L. (2011). FLASH: fast length adjustment of short reads to improve genome assemblies. Bioinformatics 27, 2957–2963. doi: 10.1093/bioinformatics/btr507
Milivojević T., Rahman S. N., Raposo D., Siccha M., Kucera M., Morard R. (2021). High variability in SSU rDNA gene copy number among planktonic foraminifera revealed by single-cell qPCR. ISME Commun. 1. doi: 10.1038/s43705-021-00067-3
Moreno-Garrido I. (2008). Microalgae immobilization: Current techniques and uses. Bioresource Technol. 99, 3949–3964. doi: 10.1016/j.biortech.2007.05.040
Parducci L., Matetovici I., Fontana S. L., Bennett K. D., Suyama Y., Haile J., et al. (2013). Molecular- and pollen-based vegetation analysis in lake sediments from central Scandinavia. Mol. Ecol. 22, 3511–3524. doi: 10.1111/mec.12298
Pawlowski J., Lecroq B. (2010). Short rDNA barcodes for species identification in foraminifera. J. Eukaryotic Microbiol. 57, 197–205. doi: 10.1111/j.1550-7408.2009.00468.x
Rawlence N. J., Lowe D. J., Wood J. R., Young J. M., Churchman G. J., Huang Y.-T., et al. (2014). Using palaeoenvironmental DNA to reconstruct past environments: progress and prospects. J. Quaternary Sci. 29, 610–626. doi: 10.1002/jqs.2740
Ruppert K. M., Kline R. J., Rahman M. S. (2019). Past, present, and future perspectives of environmental DNA (eDNA) metabarcoding: A systematic review in methods, monitoring, and applications of global eDNA. Global Ecol. Conserv. 17, e00547. doi: 10.1016/j.gecco.2019.e00547
Song H. W., Lee S., Park Y. K., Woo S. Y. (2009). Quantitative sasang constitution diagnosis method for distinguishing between tae-eumin and soeumin types based on elasticity measurements of the skin of the human hand. Evidence-Based Complementary Altern. Med. 6. doi: 10.1093/ecam/nep097
Taberlet P., Coissac E., Hajibabaei M., Rieseberg L. H. (2012). Environmental DNA. Mol. Ecol. 21, 1789–1793. doi: 10.1111/j.1365-294X.2012.05542.x
Tang Y., Liao Y., Shou L., Zeng J., Gao A., Chen Q., et al. (2014). Influence of coralline algae on biodiversity of macrobenthic community in intertidal zone of Nanji Islands. Biodiversity Sci. 22, 640–648. doi: 10.3724/SP.J.1003.2014.13240
Thuiller W., Lavorel S., Araújo M. B., Sykes M. T., Prentice I. C. (2005). Climate change threats to plant diversity in Europe. Proc. Nat. Acad. Sci. 102, 8245–8250. doi: 10.1073/pnas.0409902102
Ujiié Y., Ishitani Y. (2016). Evolution of a planktonic foraminifer during environmental changes in the tropical oceans. PloS One 11, e0148847. doi: 10.1371/journal.pone.0148847
Vitousek P. M. (1994). Beyond global warming. Ecol. Global Change. Ecology. 75, 1861–1876. doi: 10.2307/1941591
Vuppaladadiyam A. K., Prinsen P., Raheem A., Luque R., Zhao M. (2018). Microalgae cultivation and metabolites production: a comprehensive review. Biofuels Bioproducts Biorefining 12, 304–324. doi: 10.1002/bbb.1864
Wang J., Wu J. (2009). Occurrence and potential risks of harmful algal blooms in the East China Sea. Sci. Total Environ. 407, 4012–4021. doi: 10.1016/j.scitotenv.2009.02.040
Wang X., Zhu G. (1998). Discussion on the relationship between benthic algae and environment in intertidal zone of Nanji Islands. Environ. pollut. Prev. 20, 36–38.
Wang Z.-H., Nie X.-P., Jiang S.-J., Zhao J.-G., Cao Y., Zhang Y.-J., et al. (2011). Source and profile of paralytic shellfish poisoning toxins in shellfish in Daya Bay, South China Sea. Mar. Environ. Res. 72, 53–59. doi: 10.1016/j.marenvres.2011.04.007
Xia W., Xue B. (2004). The 210Pb and 137Cs chronological meansurement on sedimentation rate of Xiaolongwan, Jiling. Quaternary Sci. 24, 124–125.
Yang X., Zhang J., Ye X., Wei L. (1994). Evaluation of environmental quality of intertidal zone in Nanji Islands Nature Reserve. J. Mar. Sci. 02), 70–76.
Yoccoz N. G., Bråthen K. A., Gielly L., Haile J., Edwards M. E., Goslar T., et al. (2012). DNA from soil mirrors plant taxonomic and growth form diversity. Mol. Ecol. 21, 3647–3655. doi: 10.1111/j.1365-294X.2012.05545.x
Zhang Q., Gradinger R., Spindler M. (1998). Dark survival of marine microalgae in the high Arctic (Greenland Sea). Polarforschung 65, 111–116.
Zhou M.-j., Shen Z.-L., Yu R.-C. (2008). Responses of a coastal phytoplankton community to increased nutrient input from the Changjiang (Yangtze) River. Continental Shelf Res. 28, 1483–1489. doi: 10.1016/j.csr.2007.02.009
Keywords: Nanji Islands Nature Reserve, eDNA, marine microalgae, molecular diversity, environmental indicators
Citation: Li H, Xu AN, Yang Z, Lei Y, Chen J, Zhan Z, Xu K, Li T and Xie S (2024) Assessing the changes in marine microalgae diversity in the Nanji Islands Nature Reserve over the past decades using sediment eDNA. Front. Mar. Sci. 11:1466434. doi: 10.3389/fmars.2024.1466434
Received: 18 July 2024; Accepted: 28 August 2024;
Published: 24 September 2024.
Edited by:
Meivelu Moovendhan, Saveetha Medical College & Hospital, IndiaCopyright © 2024 Li, Xu, Yang, Lei, Chen, Zhan, Xu, Li and Xie. This is an open-access article distributed under the terms of the Creative Commons Attribution License (CC BY). The use, distribution or reproduction in other forums is permitted, provided the original author(s) and the copyright owner(s) are credited and that the original publication in this journal is cited, in accordance with accepted academic practice. No use, distribution or reproduction is permitted which does not comply with these terms.
*Correspondence: Yanli Lei, bGVpeWFubGlAcWRpby5hYy5jbg==; Tiegang Li, dGdsaUBmaW8ub3JnLmNu