 Weiye Yu
 Pu Guo2
 Zhan Lian
- 1Institute of Marine Science, Guangdong Provincial Key Laboratory of Marine Disaster Prediction and Prevention, Shantou University, Shantou, China
- 2Marine Environmental Engineering Center, South China Sea Institute of Oceanology, Chinese Academy of Sciences, Guangzhou, China
- 3DHI A/S, Hørsholm, Denmark
- 4Southern Marine Science and Engineering Guangdong Laboratory (Zhuhai), Zhuhai, China
Introduction: Offshore wind farms (OWFs) generate extensive wind wakes in their leeward areas, which can induce marine upwelling and downwelling. These processes significantly affect marine stratification and ecosystems, leaving detectable patterns on the sea surface.
Materials and Methods: By utilizing MODIS data, we analyzed six representative OWFs worldwide to identify these wake signatures.
Result: Notably, we observed pronounced signatures near an OWF located in the coastal waters of Jiangsu Province, China. Conversely, no coherent wake signatures were detected at other selected European and Chinese OWFs.
Discussion: This absence may be attributed to inactive upwelling, weak marine stratification, unsteady wind directions, and land-sea distribution. This research offers a fresh perspective on the environmental impacts of OWFs and, for the first time, underscores the potential of global gridded satellite dataset in detecting OWF-induced wind wake signatures.
1 Introduction
The urgent need to reduce fossil fuel consumption and address climate change has accelerated the exploration and expansion of wind energy (Pryor et al., 2020; Dai et al., 2015). Offshore wind energy, in particular, has experienced a dramatic increase in installed capacity over recent decades, with forecasts suggesting continued exponential growth (Freeman et al., 2019). China and Europe, leading the offshore wind market, account for nearly 90% of global offshore wind installations (GWEC, 2023).
Operational offshore wind farms (OWFs) have been documented to exert substantial environmental impacts within their surrounding areas (Galparsoro et al., 2022; Li et al., 2022), through mechanisms such as turbine-atmosphere-marine interactions (Dorrell et al., 2022; Lee et al., 2022; Raghukumar et al., 2023), noise and chemical pollution (van der Molen et al., 2014; van den Berg, 2004), and visual intrusiveness (Saidur et al., 2011; Wolsink, 2007). Specifically, OWFs reduce wind speed in their downwind zones, creating wind wakes (Bärfuss et al., 2021; Christiansen and Hasager, 2005; Maas and Raasch, 2022). More importantly, the extensive scale and dense configuration of offshore turbines, along with the reduced surface roughness at the air-sea interface, amplify the scale of OWF wind wakes, allowing them to extend over considerable distances (up to 101 km) (Platis et al., 2018).
The wind wake effect serves as a critical link between the impacts of OWFs on marine dynamics and ecological systems (Lian et al., 2022). The length scale of the wakes is sufficient to induce ocean responses governed by geophysical fluid dynamics. According to Ekman’s theory, the altered wind speeds at the edges of broad OWF wind wakes can trigger pronounced vertical ocean movements (Broström, 2008). The resulting upwelling and downwelling form part of a dipole structure beneath the wind wakes of OWFs. The dipole interacts with the horizontal wind-forced Ekman transport, ultimately preserving net upwelling (Figure 1) (Liu et al., 2023). These artificially induced upwellings are instrumental in elevating nutrient-rich water to the surface and ventilating the lower layers, thereby playing a vital role in regulating marine ecosystems (Pan et al., 2016; Daewel et al., 2022).
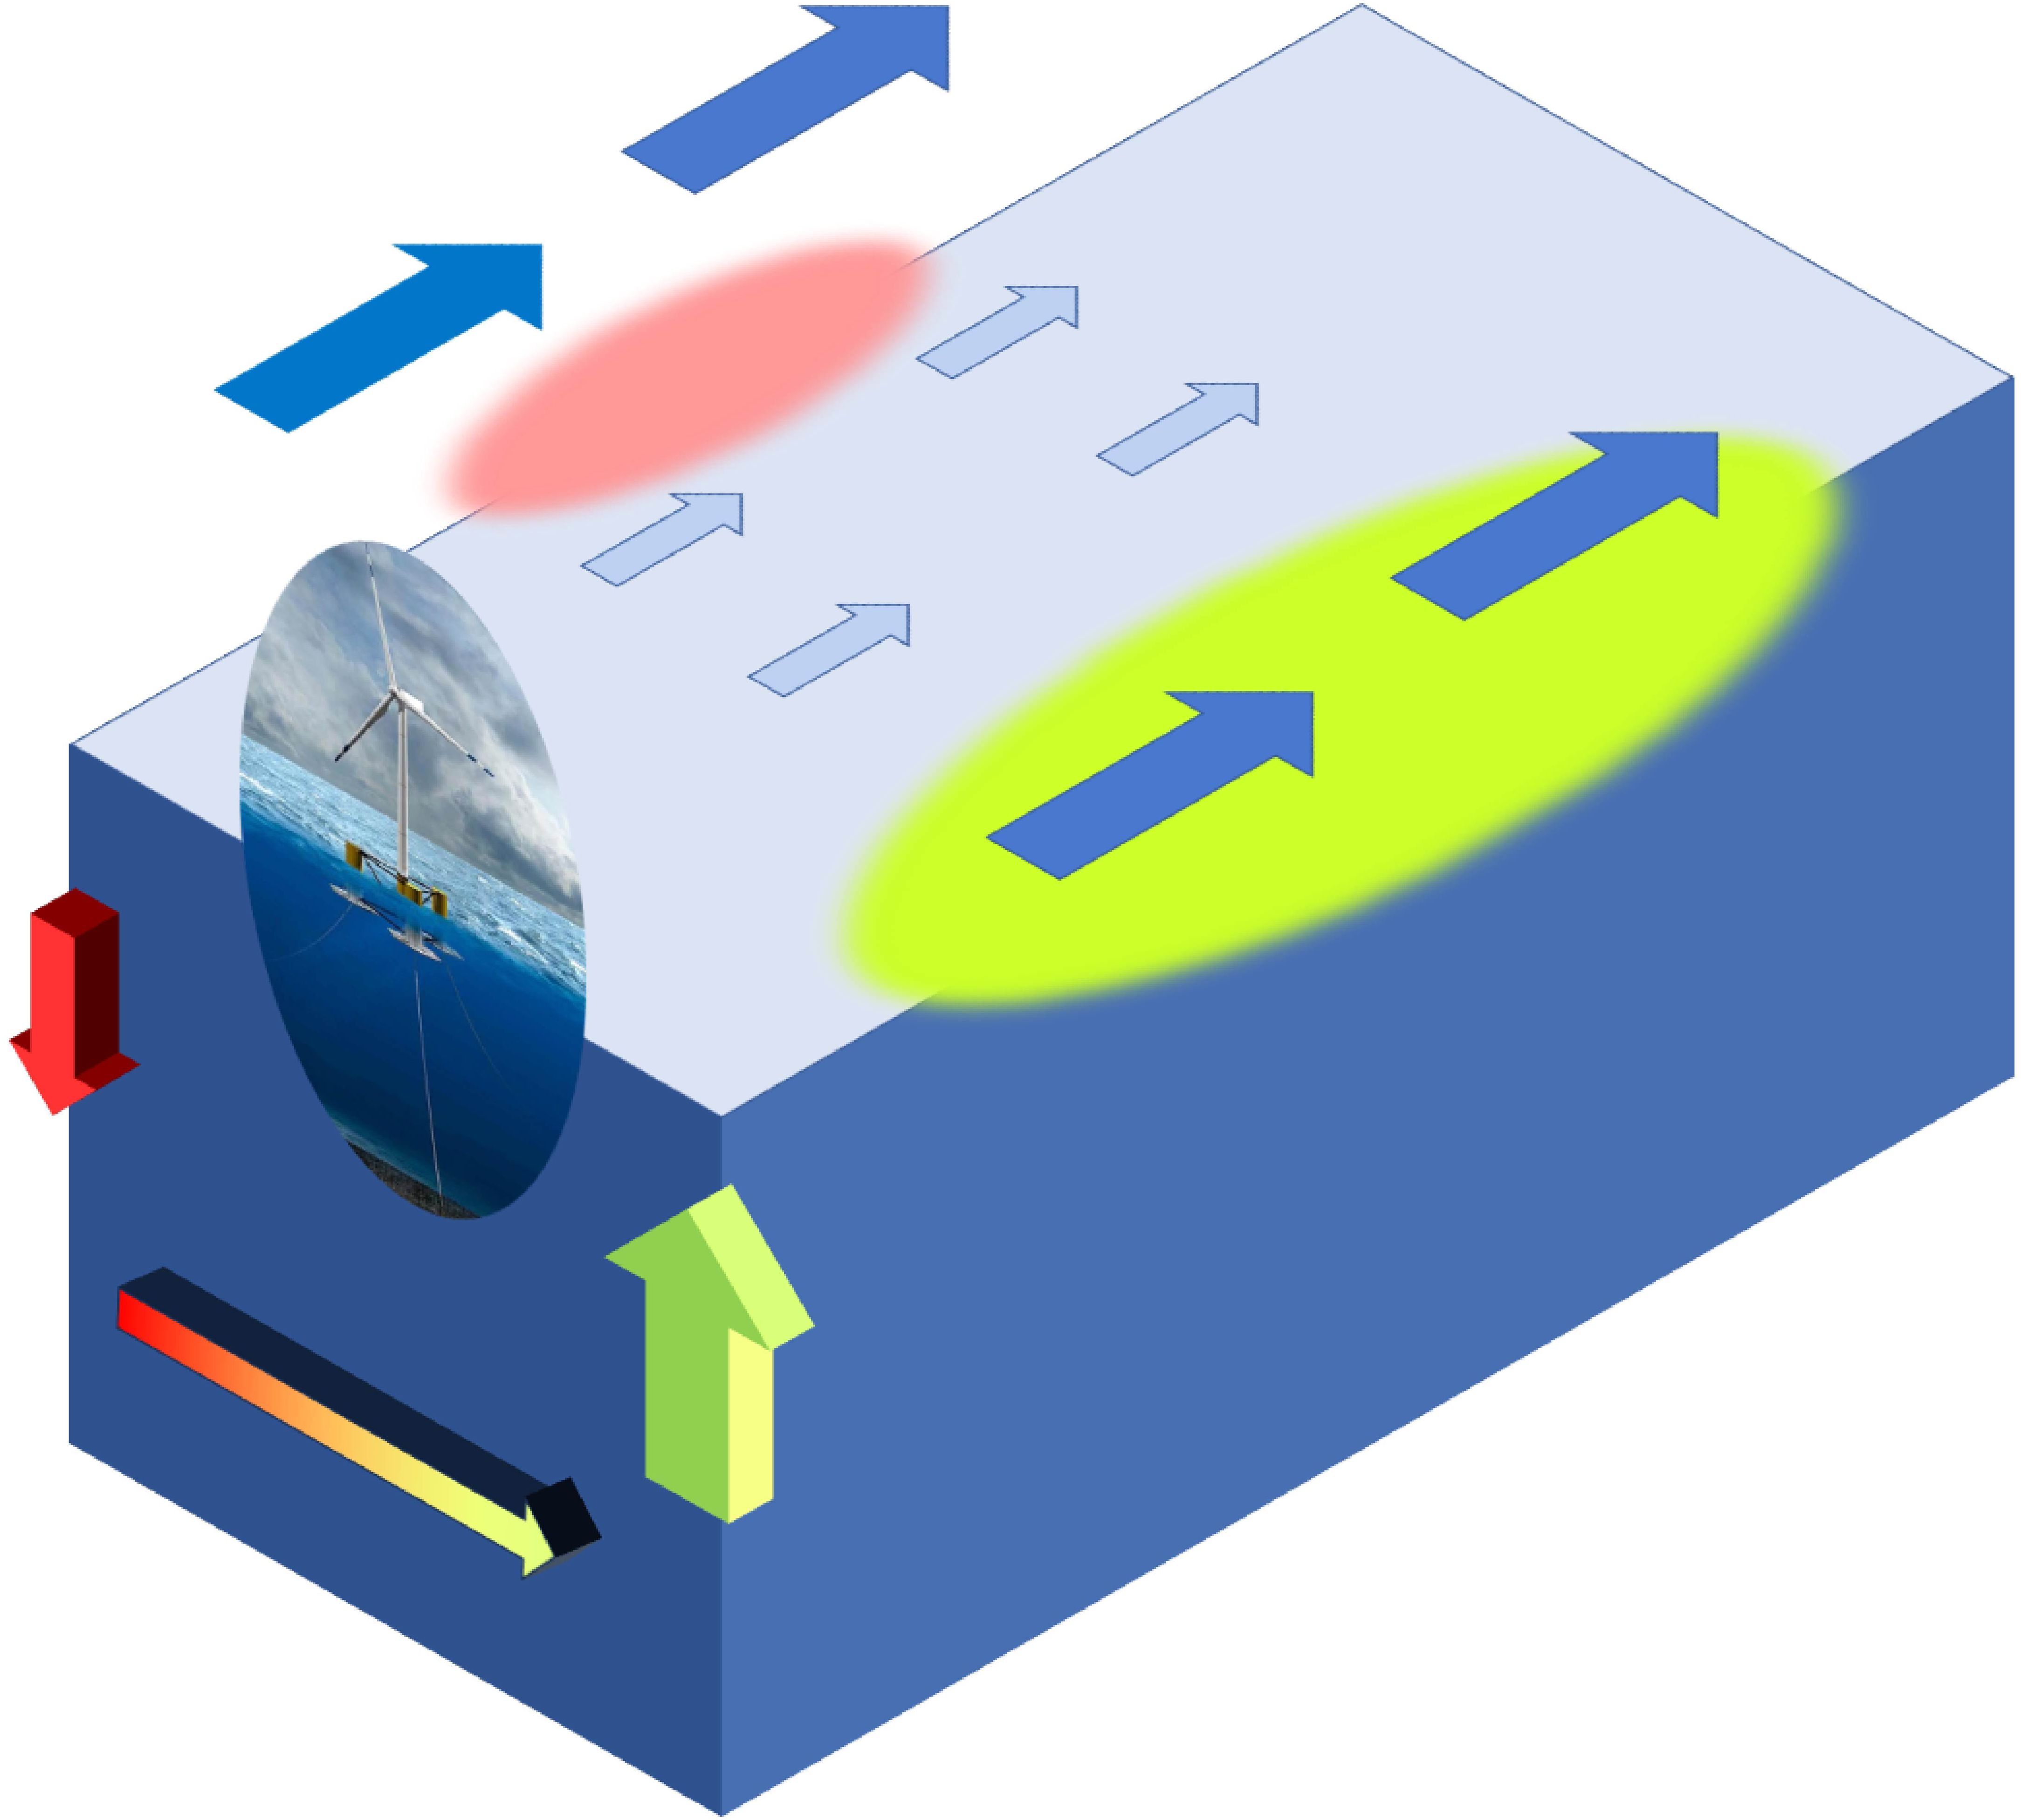
Figure 1. Schematic Diagram for the Mechanism of Marine Vertical Response to the Wind Wakes on the Leeward Side of a Wind Turbine. The blue arrows indicate wind stress. The wind stress outside the wind turbine is undisturbed and large, but it is small behind the wind turbine due to the energy extraction. The green and red arrows represent the upwelling and downwelling currents, respectively.
The vertical movements induced by wind wakes are likely to affect sea surface temperatures (SST) and chlorophyll-a concentrations (SSCHL), leaving detectable traces on the sea surface in the leeward regions of OWFs. Despite their direct reflection of OWFs’ environmental impacts, these signatures have yet to be explored through observational studies. Prior research has focused on wind wakes’ characteristics and their terrestrial impacts (Siedersleben et al., 2018; Aitken et al., 2014; Zhou et al., 2012; Schneemann et al., 2020). While OWFs could potentially result in surface warming due to reduced wind speed and sensible heat fluxes within turbine arrays, this effect is less pronounced for large offshore turbines with hubs positioned far from the surface (Golbazi et al., 2022). Numerical simulations have identified a dipole structure in the ocean beneath the wind wakes of OWFs, characterized by alternating upwelling and downwelling, in agreement with geophysical theories (Christiansen et al., 2022a; Paskyabi and Fer, 2012). This dipole, observed through high-resolution temperature/salinity transects conducted by towing vehicles (Floeter et al., 2022), is expected to interact with the ambient dynamic system, including tidal currents, marine stratification, and other factors (Liu et al., 2023; Christiansen et al., 2022b).
The Moderate Resolution Imaging Spectroradiometer (MODIS) products for SST and SSCHL, offering a 1 km spatial resolution (Dunstan et al., 2018), present an opportunity to detect the OWF-induced wind wake signatures on the sea surface. However, the precision of MODIS data in accurately capturing these characteristics remains a subject for investigation. Furthermore, the variability of these signatures under different air-sea conditions has not been fully understood. To address these gaps, we have selected six representative OWFs globally and utilized MODIS data to assess the OWF-induced wind wake imprints on the sea surface during the boreal summer following the OWFs’ establishment. Additionally, We analyzed the background atmospheric and marine conditions to elucidate the variations in the detected imprints.
The organization of this paper is as follows: Section 2 outlines the data and methodologies employed. Section 3 describe the detected signatures. Section 4 devoted to the analysis and discussion of the underlying mechanisms of the signature difference. The paper concludes with Section 5, which presents our final conclusions.
2 Materials and methods
2.1 Selection of offshore wind farms
For the purpose of detecting wind wake signatures on their adjacent sea surfaces, we selected six OWFs, shown in Figure 2. The locations of offshore wind turbines discussed in this paper are derived from the Global Offshore Wind Farm (GOWF) dataset, which is based on time-series images from Sentinel-1 SAR (Zhang et al., 2021). Each of these OWFs has been operational for a minimum of five years, ensuring that sufficient satellite data is available for detecting wind wake signatures. The critical configurations of each OWF are listed in Table 1. Notably, OWFs A and B have the largest total installed capacities in the world. In particular, OWF B is a typical deep-water OWF, situated at a depth of approximately 40 meters. OWF C features an exceptionally high number of turbines, with more than 200 installed. OWF D is notable for being the world’s first large-scale clustered OWF. OWFs E and F, recently developed by China, are located on the broad and shallow continental shelf. OWF E is situated in relatively offshore waters, more than 20 km from the coastline, whereas OWF F is near the coastline. Moreover, the turbines in OWF F are closely packed, which may potentially reduce the formation of wind wakes (Amaral and Castro, 2017).
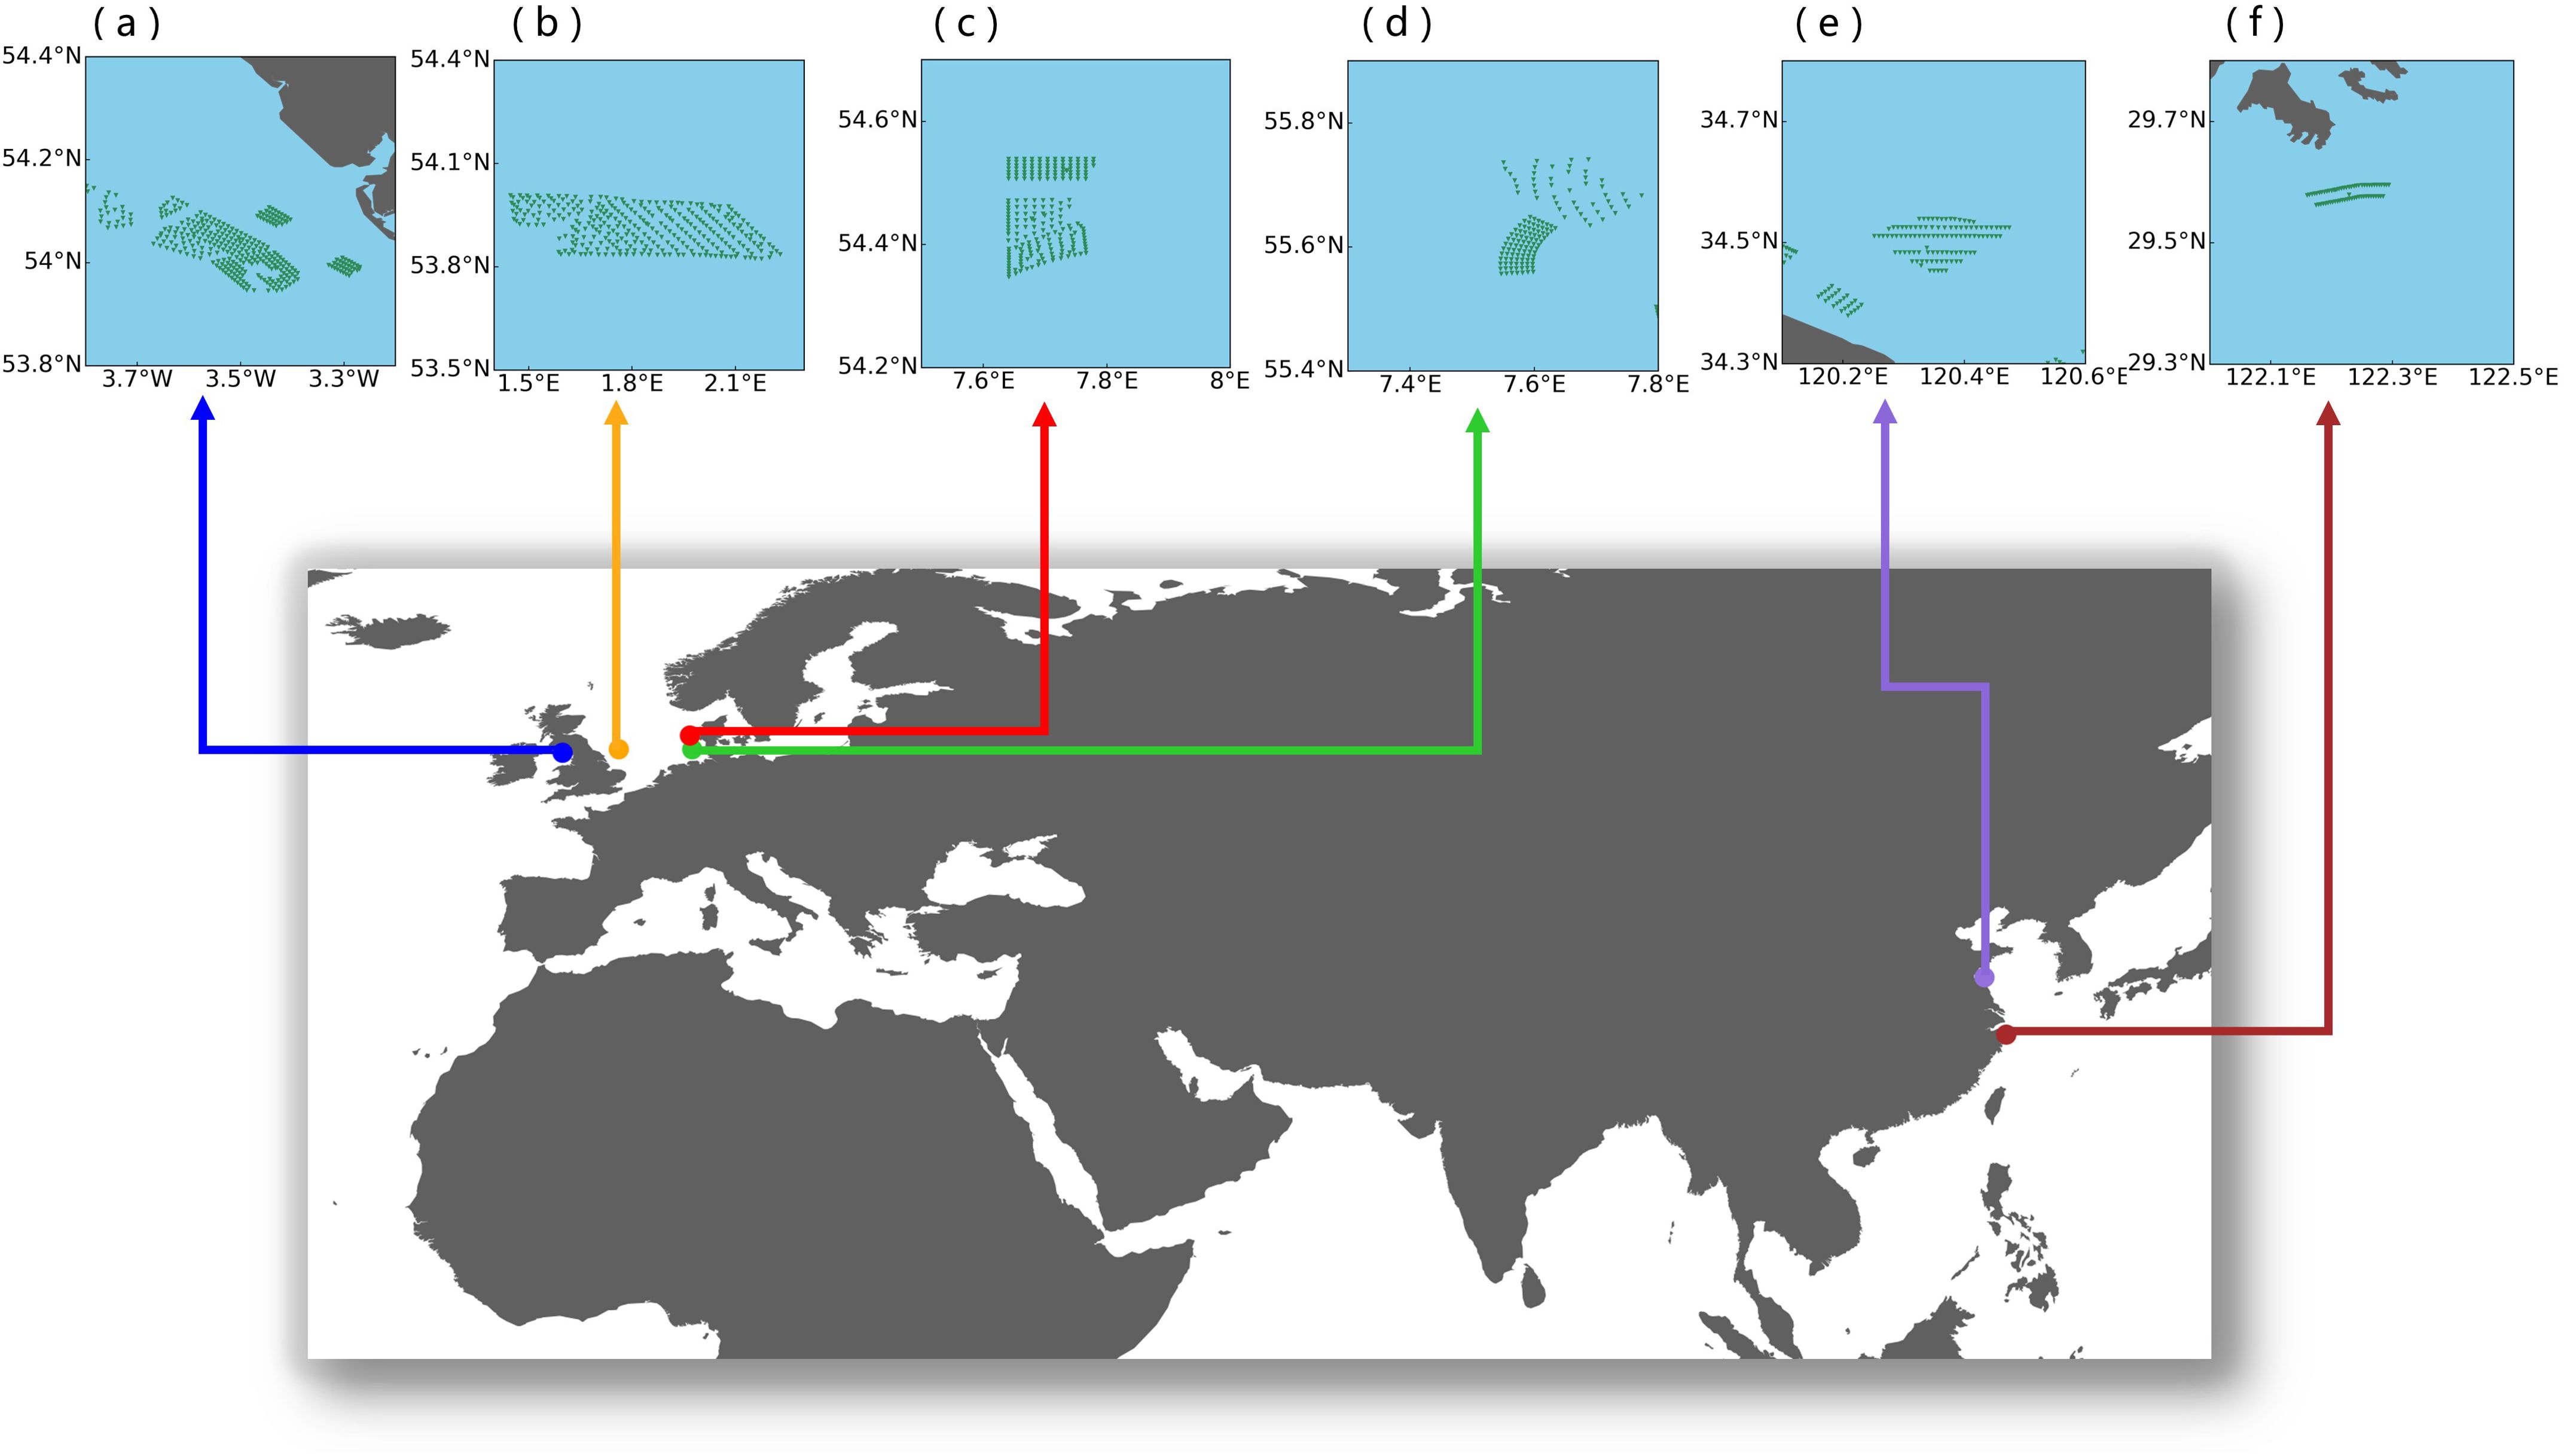
Figure 2. Overview of Study Areas. The locations of each OWFs are indicated by color dots on a panorama map. The positions of individual wind turbines within the OWFs are depicted by green triangles in panel (A–F).
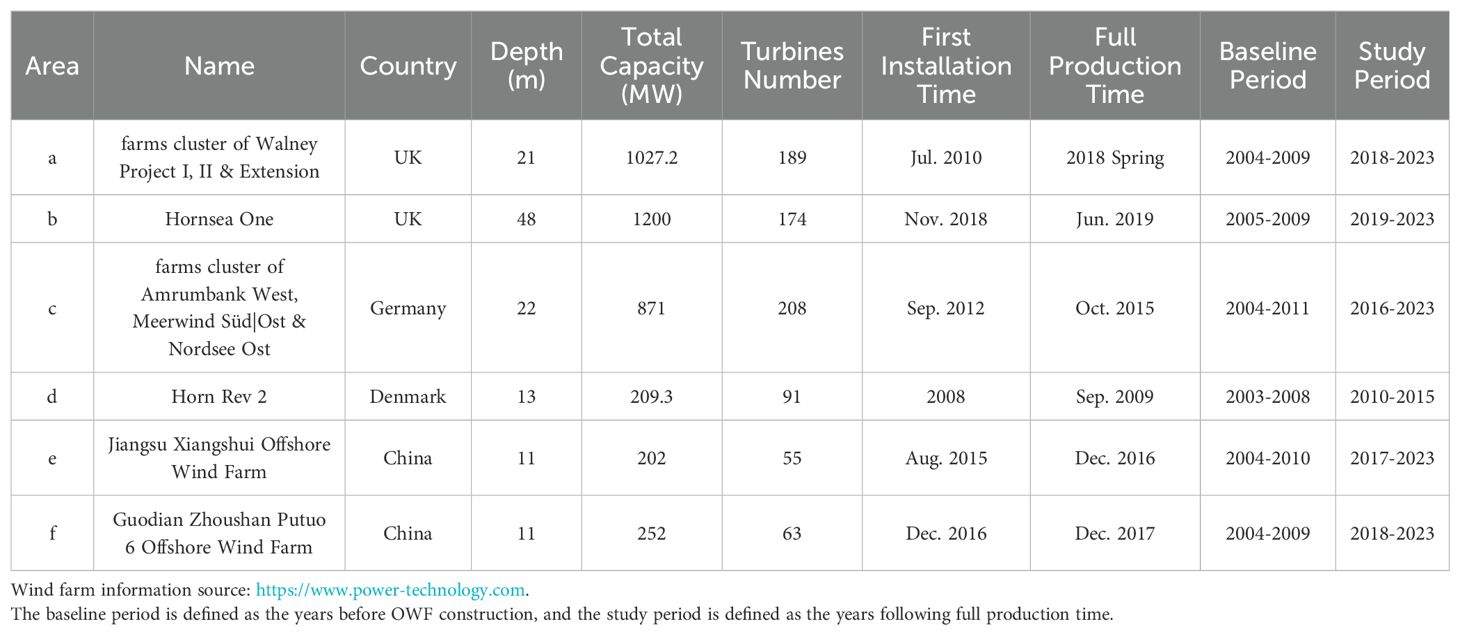
Table 1. Critical sonfigurations of All OWFs.
The bathymetry data around all OWFs were obtained from general bathymetric chart of the oceans (GEBCO 2024, https://www.gebco.net/data_and_products/gridded_bathymetry_data/). The gridded data has a spatial resolution of 1/240°.
2.2 Satellite data & quality control
The remote sensing data used in this study were obtained from the MODIS sensors on board the Aqua and Terra satellites. These satellites follow sun-synchronous orbits and pass over the Earth’s surface approximately twice a day. The SST and SSCHL data with a resolution of 1 km at the L2 level of MODIS were downloaded from NASA’s website (https://oceancolor.gsfc.nasa.gov/cgi/browse.pl). Subsequently, the SSCHL and SST images were interpolated onto a regular grid with a spatial resolution of 0.01°. Only SST data points identified as “good” and “best” in terms of quality were included in this study, while SSCHL data points flagged as “HIGLINT” (excessive sun glint reflectance) and “STRAYLIGHT” (probable stray light contamination) were excluded.
2.3 Detection of wind wake signatures
Initially, to remove interannual variations and long-term trends, spatial averages of SST and SSCHL within each study region were excluded. This approach focused exclusively on the detailed spatial patterns of SST and SSCHL surrounding the OWFs. Subsequently, two periods were selected for analysis: the baseline period, defined as the years prior to OWF construction, and the study period, defined as the years subsequent to reaching full production capacity. As demonstrated in Table 1, the baseline and study periods differ among OWFs. The OWF-induced wind wake signatures are characterized by the differences between SST and SSCHL anomalies averaged from the baseline and study periods. If the marine is vertically homogeneous, upwelling and downwelling would have negligible impacts on the sea surface; therefore, our investigation was confined to the boreal summer months (June, July, and August), when the marine environment in the target areas exhibits seasonal stratification (Carpenter et al., 2016; Hao et al., 2012).
3 Results
3.1 Variability of wind wake signatures among OWFs
Figures 3, 4 display the SST and SSCHL anomalies in the vicinities of the six OWFs following their installations. Generally, significant signatures on the sea surface proximal to the OWFs are not observed, except for OWF E (Figures 3E, 4E), which is situated in the nearshore waters of Jiangsu Province, China. This OWF exhibits notable decreases in SST and increases in SSCHL within its leeward areas. The synchronous anomalies in SST and SSCHL suggest that the wind wake may induce significant cooling here, consequently enhancing marine productivity. The maximum SST reduction beneath the wind wakes of OWF E reaches up to 0.5 °C, with the corresponding SSCHL increasing by nearly 10 mg·m-3, an order of magnitude greater than the positive SSCHL anomalies observed around other OWFs.
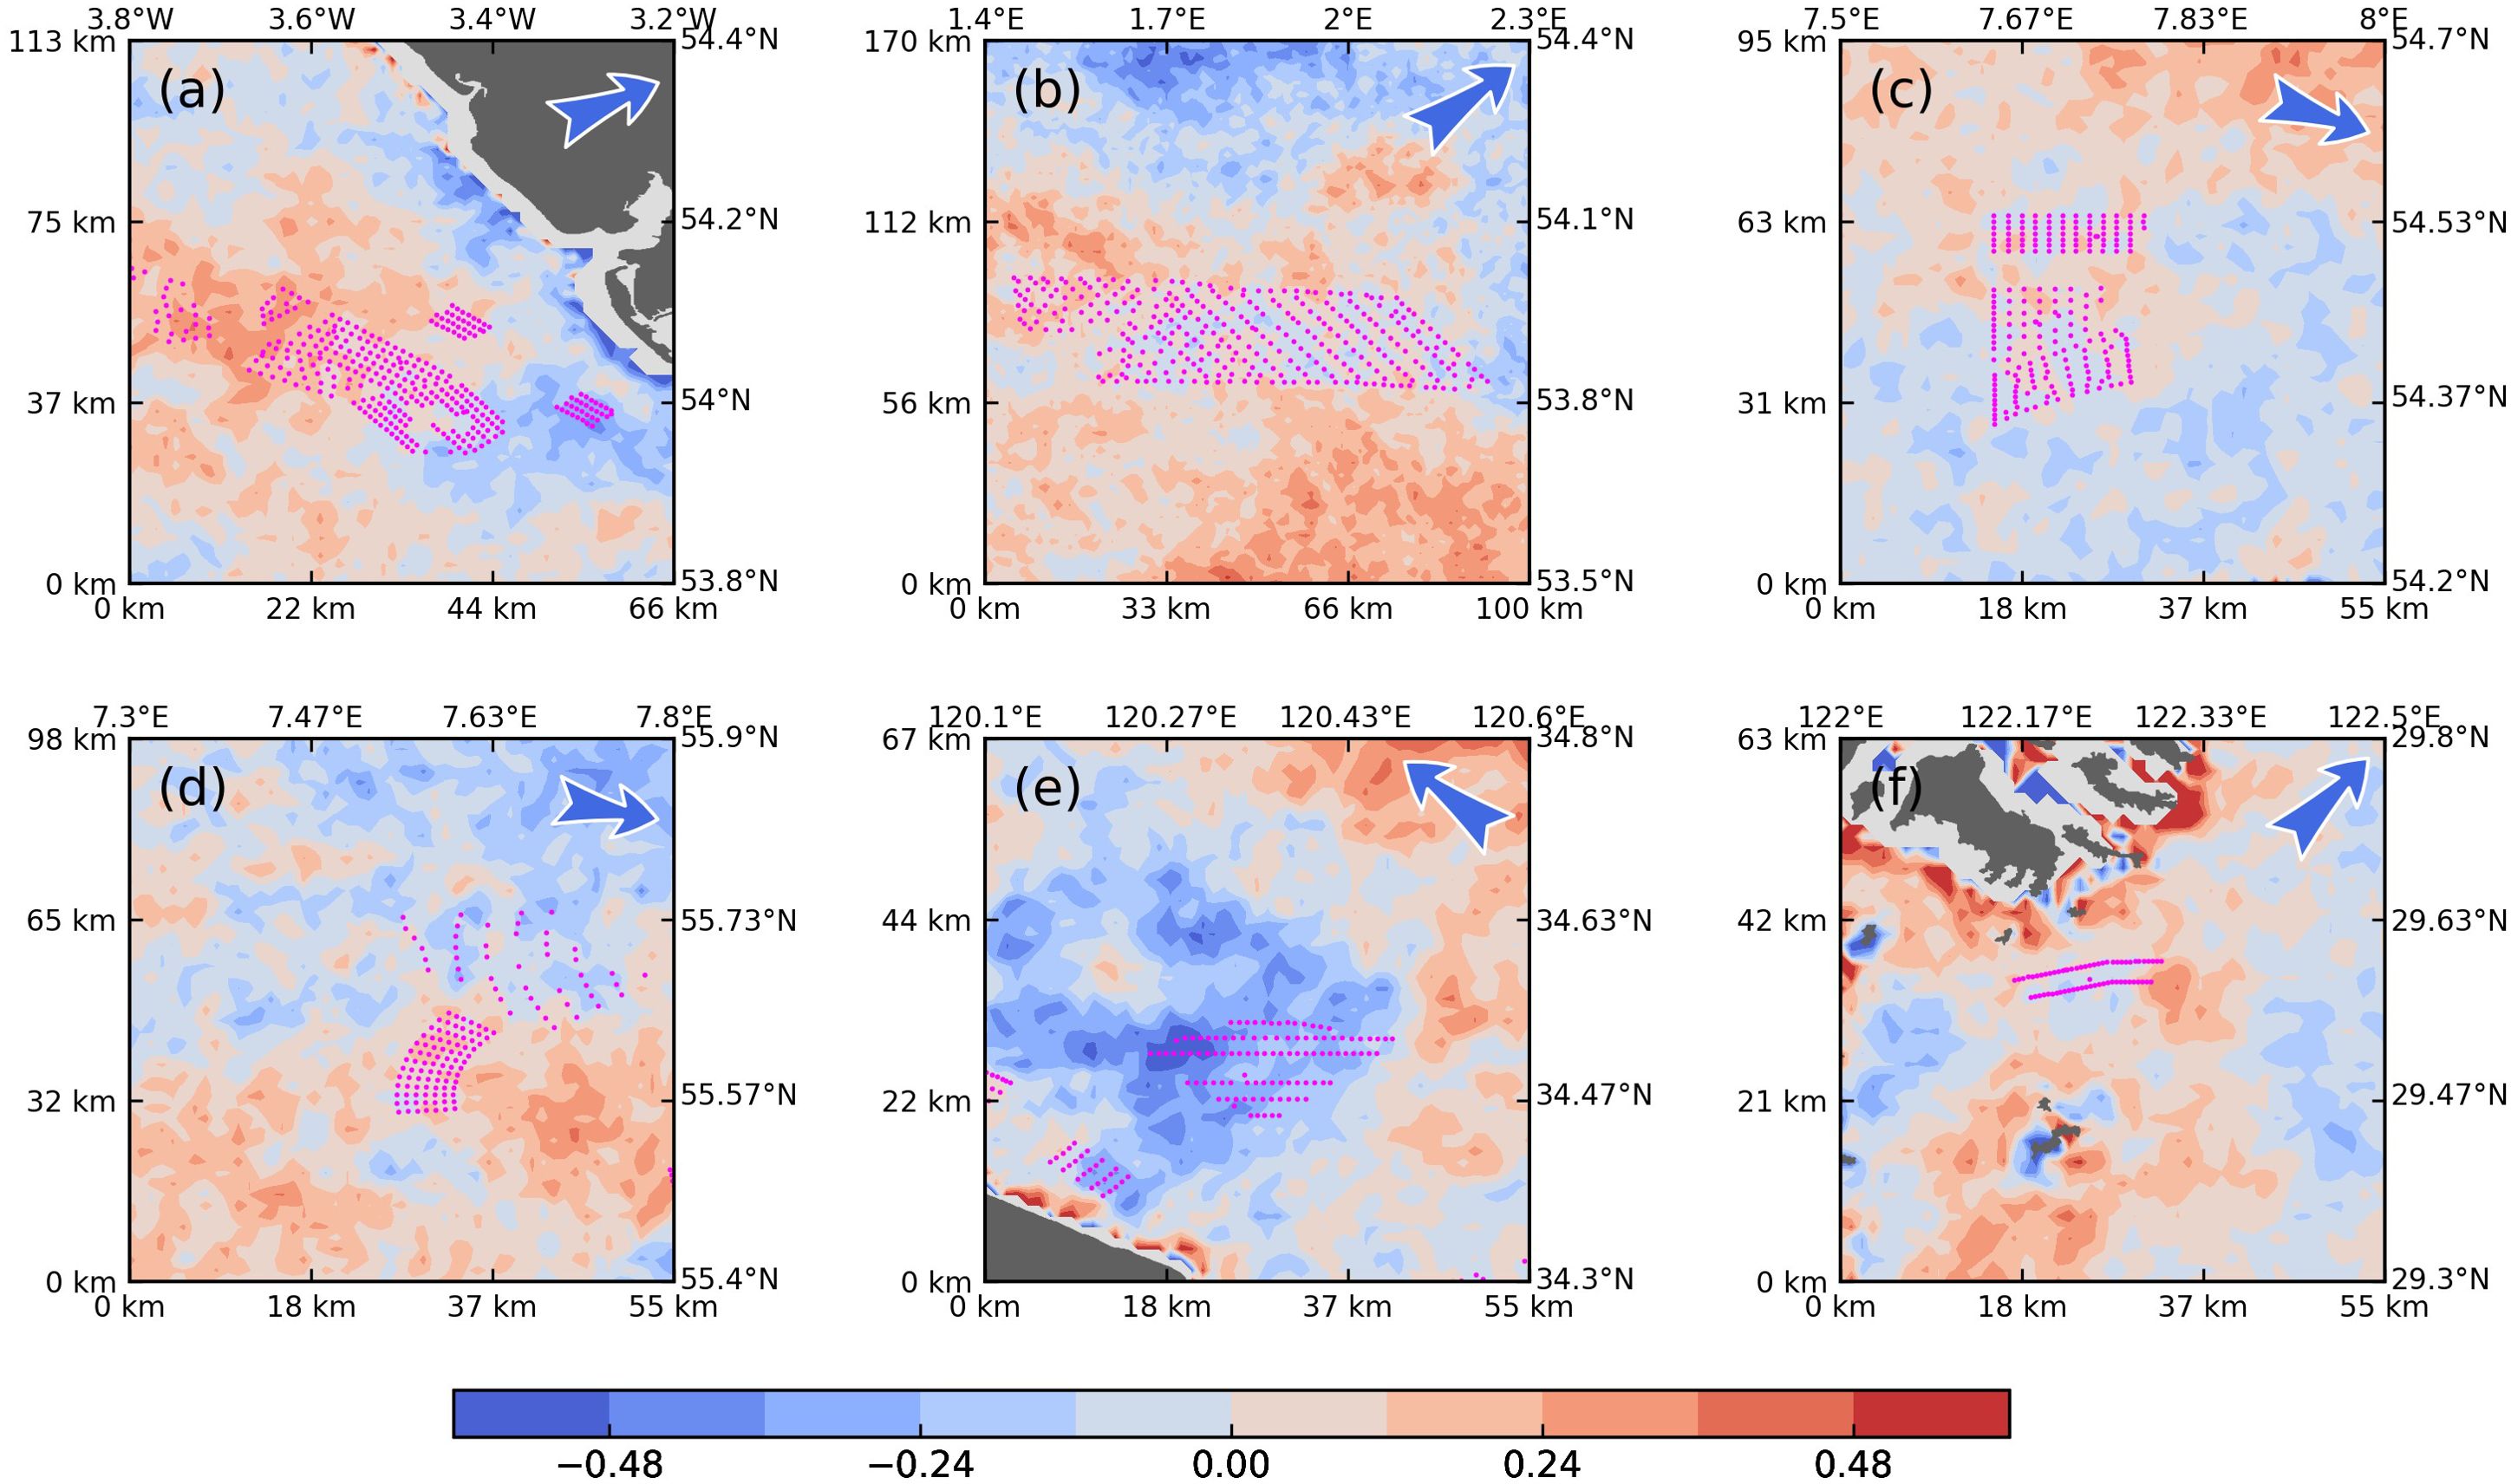
Figure 3. Anomalies of SST (°C, A–F) in the Study Periods Relative to the Baseline Periods in the Vicinities of the Six OWFs. Missing data is depicted as gray, and land is marked in white. The positions of the wind turbines are indicated by pink dots. Arrows in the top left corners of each panel represent the prevailing wind directions during the boreal summer.
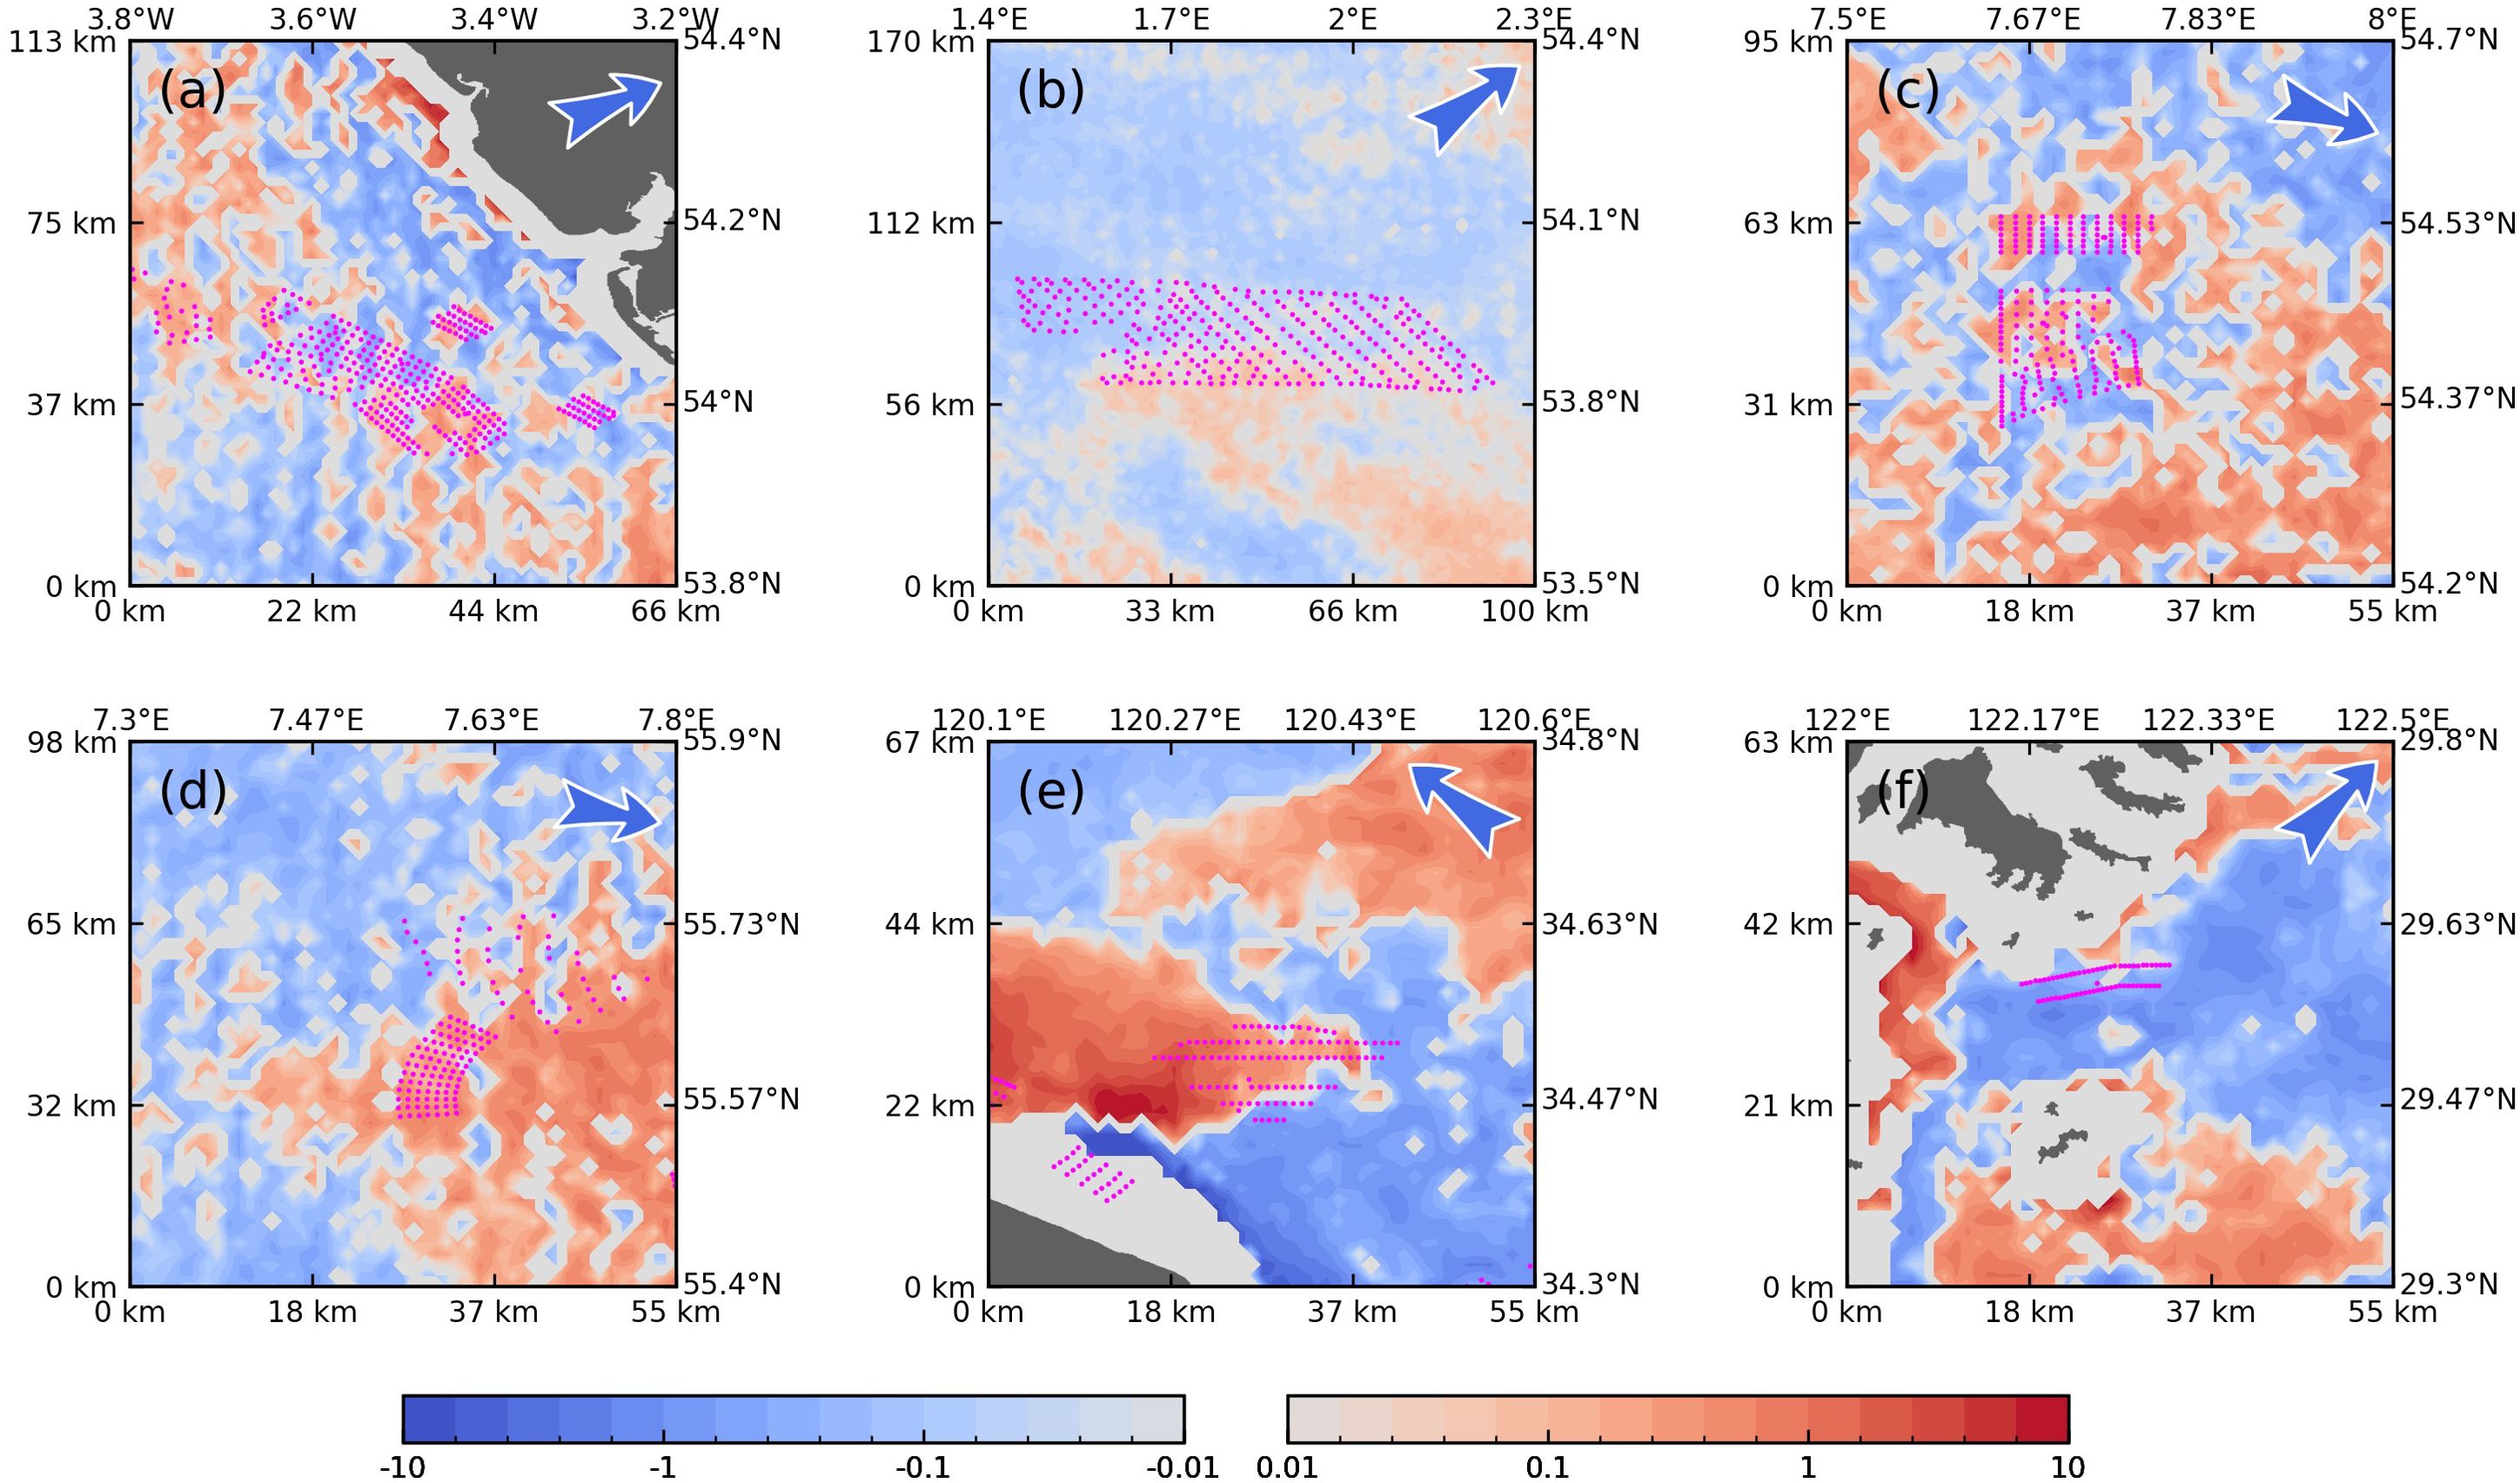
Figure 4. Anomalies of SSCHL (mg·m-3 in logarithmic coordinates, A-F) in the Study Periods Relative to the Baseline Periods in the Vicinities of the Six OWFs. Missing data is depicted as gray, and land is marked in white. The positions of the wind turbines are indicated by pink dots. Arrows in the top left corners of each panel represent the prevailing wind directions during the boreal summer.
Conversely, the spatial patterns of SST and SSCHL anomalies associated with other OWFs exhibit relative spatial irregularity and are challenging to distinguish from stochastic changes within the ocean-atmosphere system. Specifically, in very nearshore waters, such as the areas southwest of OWF E and north of OWF F, the accuracy of MODIS data diminishes (Darecki and Stramski, 2004), rendering the anomalies less reliable in these regions.
3.2 Regulations of the observed variability of wind wake signatures
3.2.1 Theoretical vertical velocity and heat flux
To investigate why the wind wake signatures are only observed around OWF E, we calculated the theoretical maximum vertical seawater velocity (V) and the corresponding vertical heat flux (FH), following Broström’s methodology (2008). This approach disregards all processes with short time scales (), such as internal gravity waves and geostrophic adjustment process, as well as temporal changes in wind forcing. Thus, V is roughly given by:
where is a function of , the exact form of which is provided by the numerical solution from Broström (2008). Here, , with representing the wind stress deficit (20% in this study) within the wakes, is the reduced gravity, is the density difference between the upper and lower ocean layers, f is the Coriolis parameter, and L is the length scale of OWFs (10 km in this study), perpendicular to the wind direction. Climatological mean wind stress from ERA5 (https://cds.climate.copernicus.eu/cdsapp#!/dataset/reanalysis-era5-single-levels) and marine stratification conditions from WOA 2023 (https://www.ncei.noaa.gov/products/world-ocean-atlas) were used to estimate V and FH for each OWF during boreal summer. FH is expressed by:
where represents the vertical gradience of seawater temperature within thermoclines.
Theoretical estimations, as seen in Table 2, indicate that, jointly regulated by V and , the FH values for OWF D, E, and F are obviously higher than those for other OWFs. This suggests that, according to geophysical fluid dynamic theory, wind wake signatures of SST and SSCHL are expected to be prominent in the leeward regions of OWFs D to F.
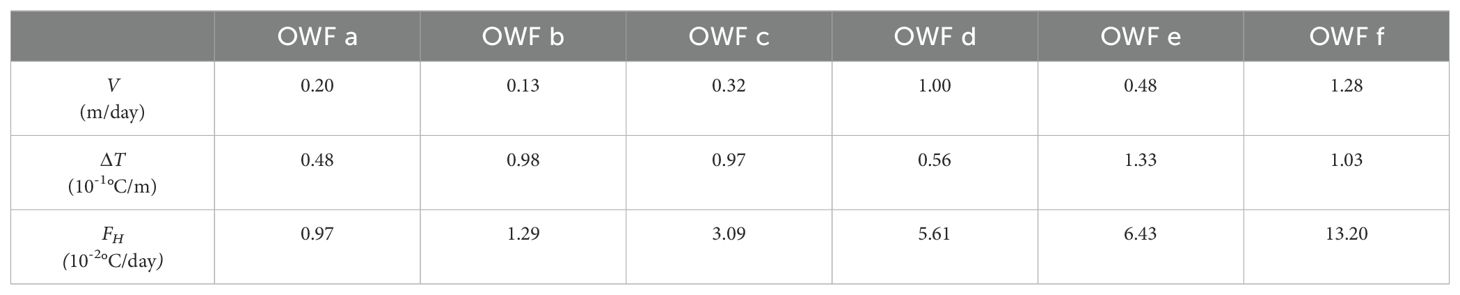
Table 2. Theoretical V and FH Among All OWFs.
3.2.2 Stability of wind directions
The stability of wind directions may significantly influence the maintenance of OWF-induced wind wake signatures in SST and SSCHL. Fluctuating wind directions can lead to an unsteady vertical marine response, making it difficult to sustain noticeable SST and SSCHL anomalies beneath the variable wind wakes.
To assess the impact of wind stability, we analyzed the occurrence probability of wind vectors at all six OWFs (Figure 5), using hourly wind data from ERA5 during the study periods of each OWF. The analysis revealed that wind vectors at OWF E (Figure 5E) are densely arranged in the northwestern quadrant, indicating a predominance of southeast winds. More importantly, the high maximum occurrence probability (>2%) and compactness of wind vectors concentrated in the northwestern quadrant at OWF E imply greater temporal stability, with steady southeast winds, compared to the other OWFs. In contrast, the dispersed occurrence probabilities of wind vectors at OWFs A to D suggest variable wind forces, which are less conducive to the development of wind wake signatures on the sea surface downwind of these OWFs.
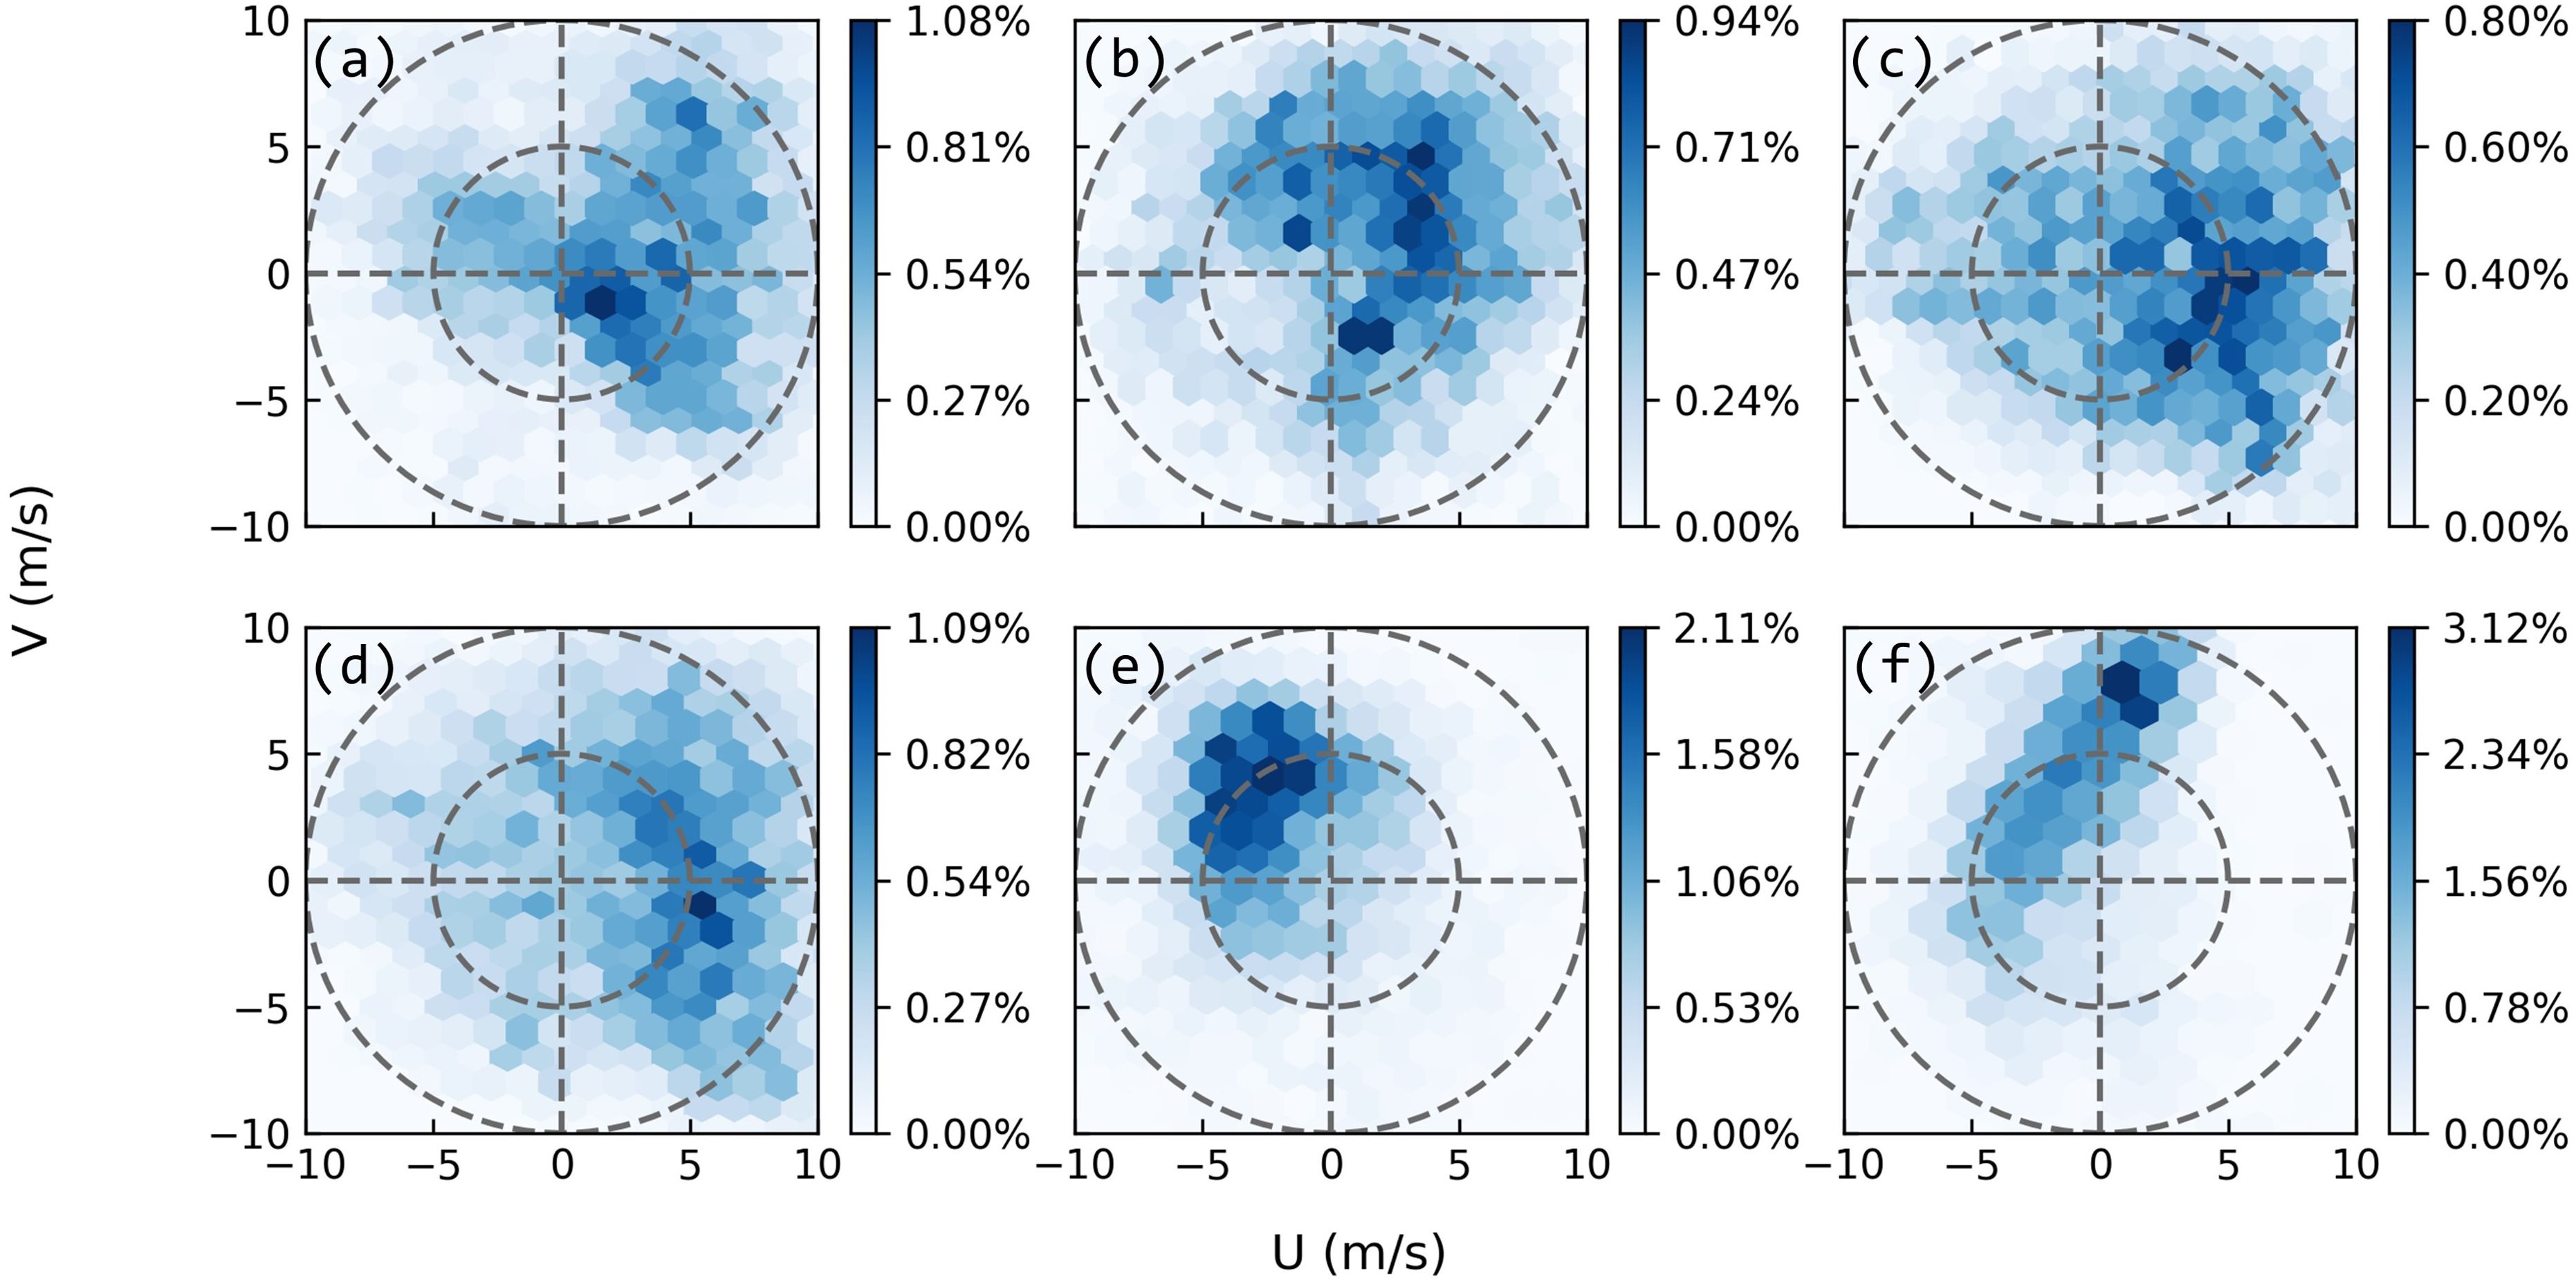
Figure 5. update: Occurrence Probability (%, A–F) of Wind Vectors at the Six OWFs.
3.2.3 Length scales of wind wakes
Short-length wind wakes are less effective in stimulating upwelling or downwelling beneath the wakes due to the inapplicability of Ekman transport theory in non-geostrophic movements, such as those induced by wind shear with short length scales. The roughness of air-sea boundary layer affects the length scales of wind wakes leeward of OWFs. At OWF F, the presence of an island to the north may increase air-sea interface roughness in the leeward area, thereby shortening the wind wake length scale. Moreover, the compact arrangement of wind turbines within OWF F likely reduces the extent of wind wakes, rendering wind wake signatures undetectable in its vicinity.
4 Discussions
4.1 Temporal evolutions of SST and SSCHL anomalies within the wake regions
To depict temporal evolutions of SST and SSCHL anomalies (SSTA and SSCHLA) within the six wake regions (the rectangles with black dashed lines as edges in Figure 6), we calculated the annual SSTA and SSCHLA averaged within the rectangles (Figures 7, 8). Consistent with the horizontal distributions of SSTA and SSCHLA, only the SSTA (Figure 7E) and SSCHLA (Figure 8E) around OWF E synchronously exhibit a decrease and increase, respectively, after the operation of the OWF, as indicated by the red dashed lines in the figures. On one hand, this result further suggests the existence of wake upwelling-driven signatures around OWF E. On the other hand, after OWF E began operations, the synchronous trends of SSTA and SSCHLA are significant compared with the associated inter-annual variations, indicating that these phenomena differ markedly from natural temporal fluctuations. Additionally, we focused exclusively on SSTA and SSCHLA during boreal summers (June, July, and August), ensuring that seasonality does not impact the detected signatures.
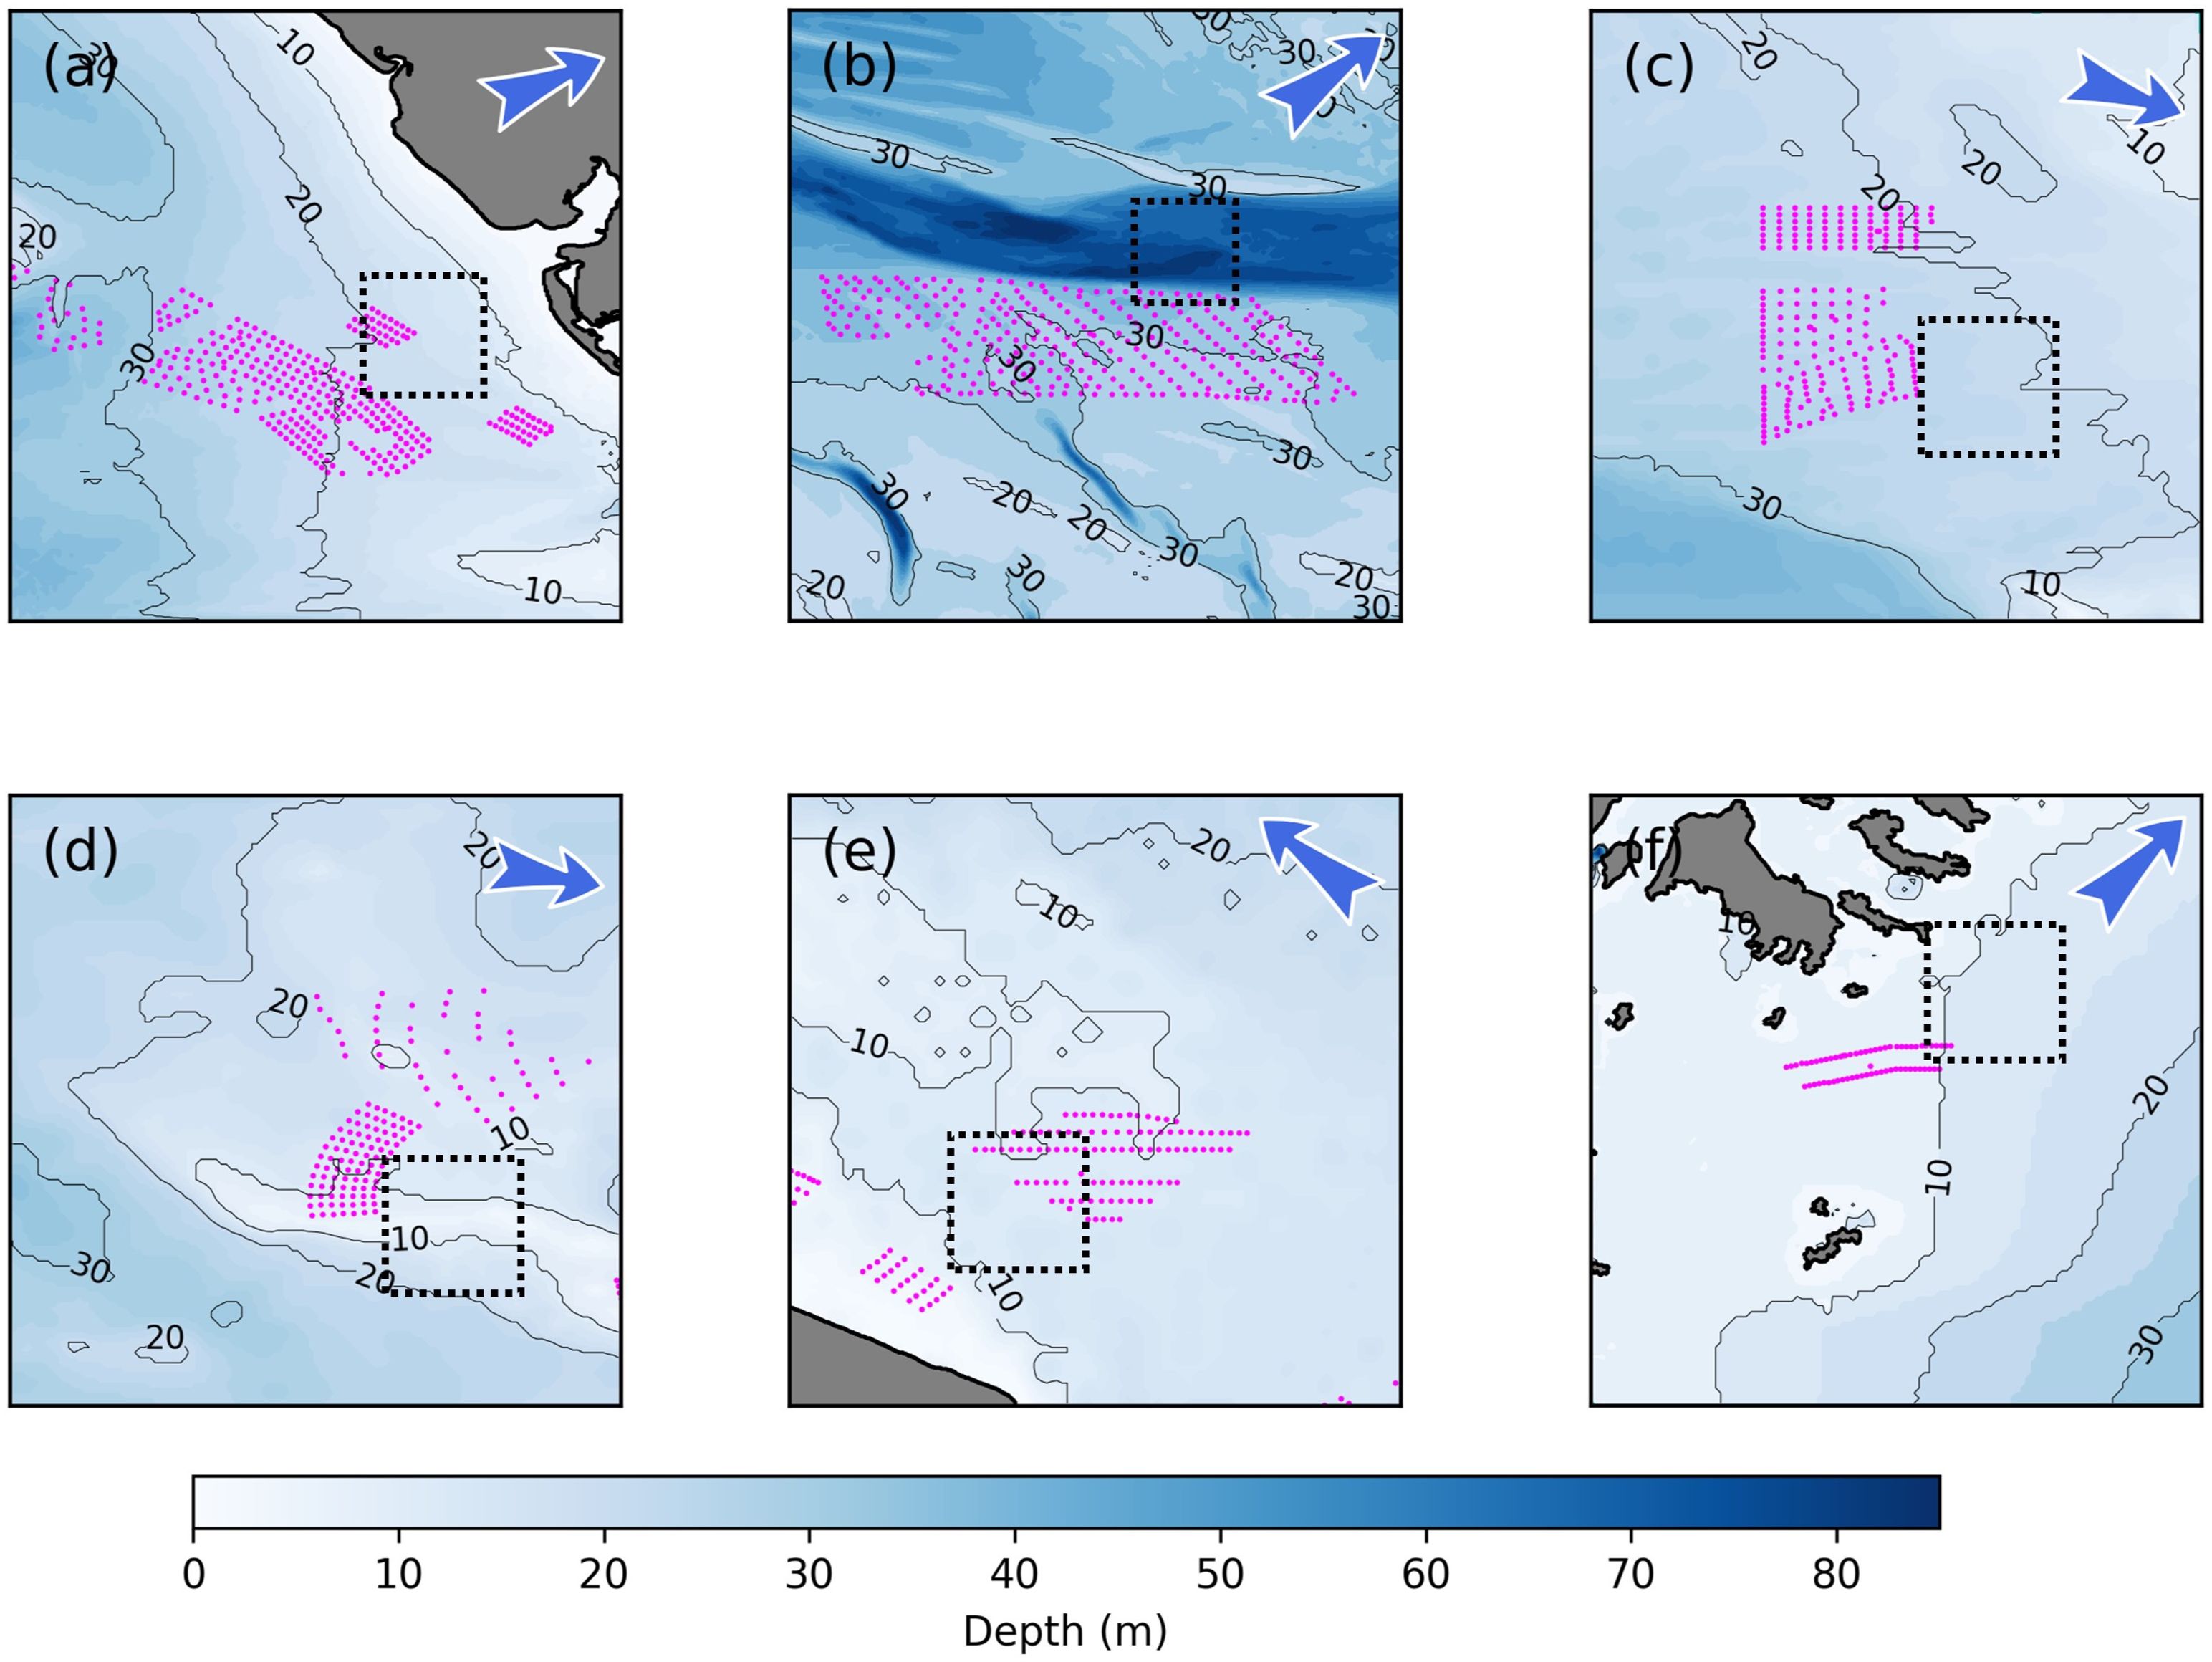
Figure 6. Topography around the Six OWFs (A–F). The rectangles with black dashed lines as edges indicate the potential wake regions. The SST and SSCHL anomalies within the regions are spatially averaged to investigate the corresponding temporal evolutions.
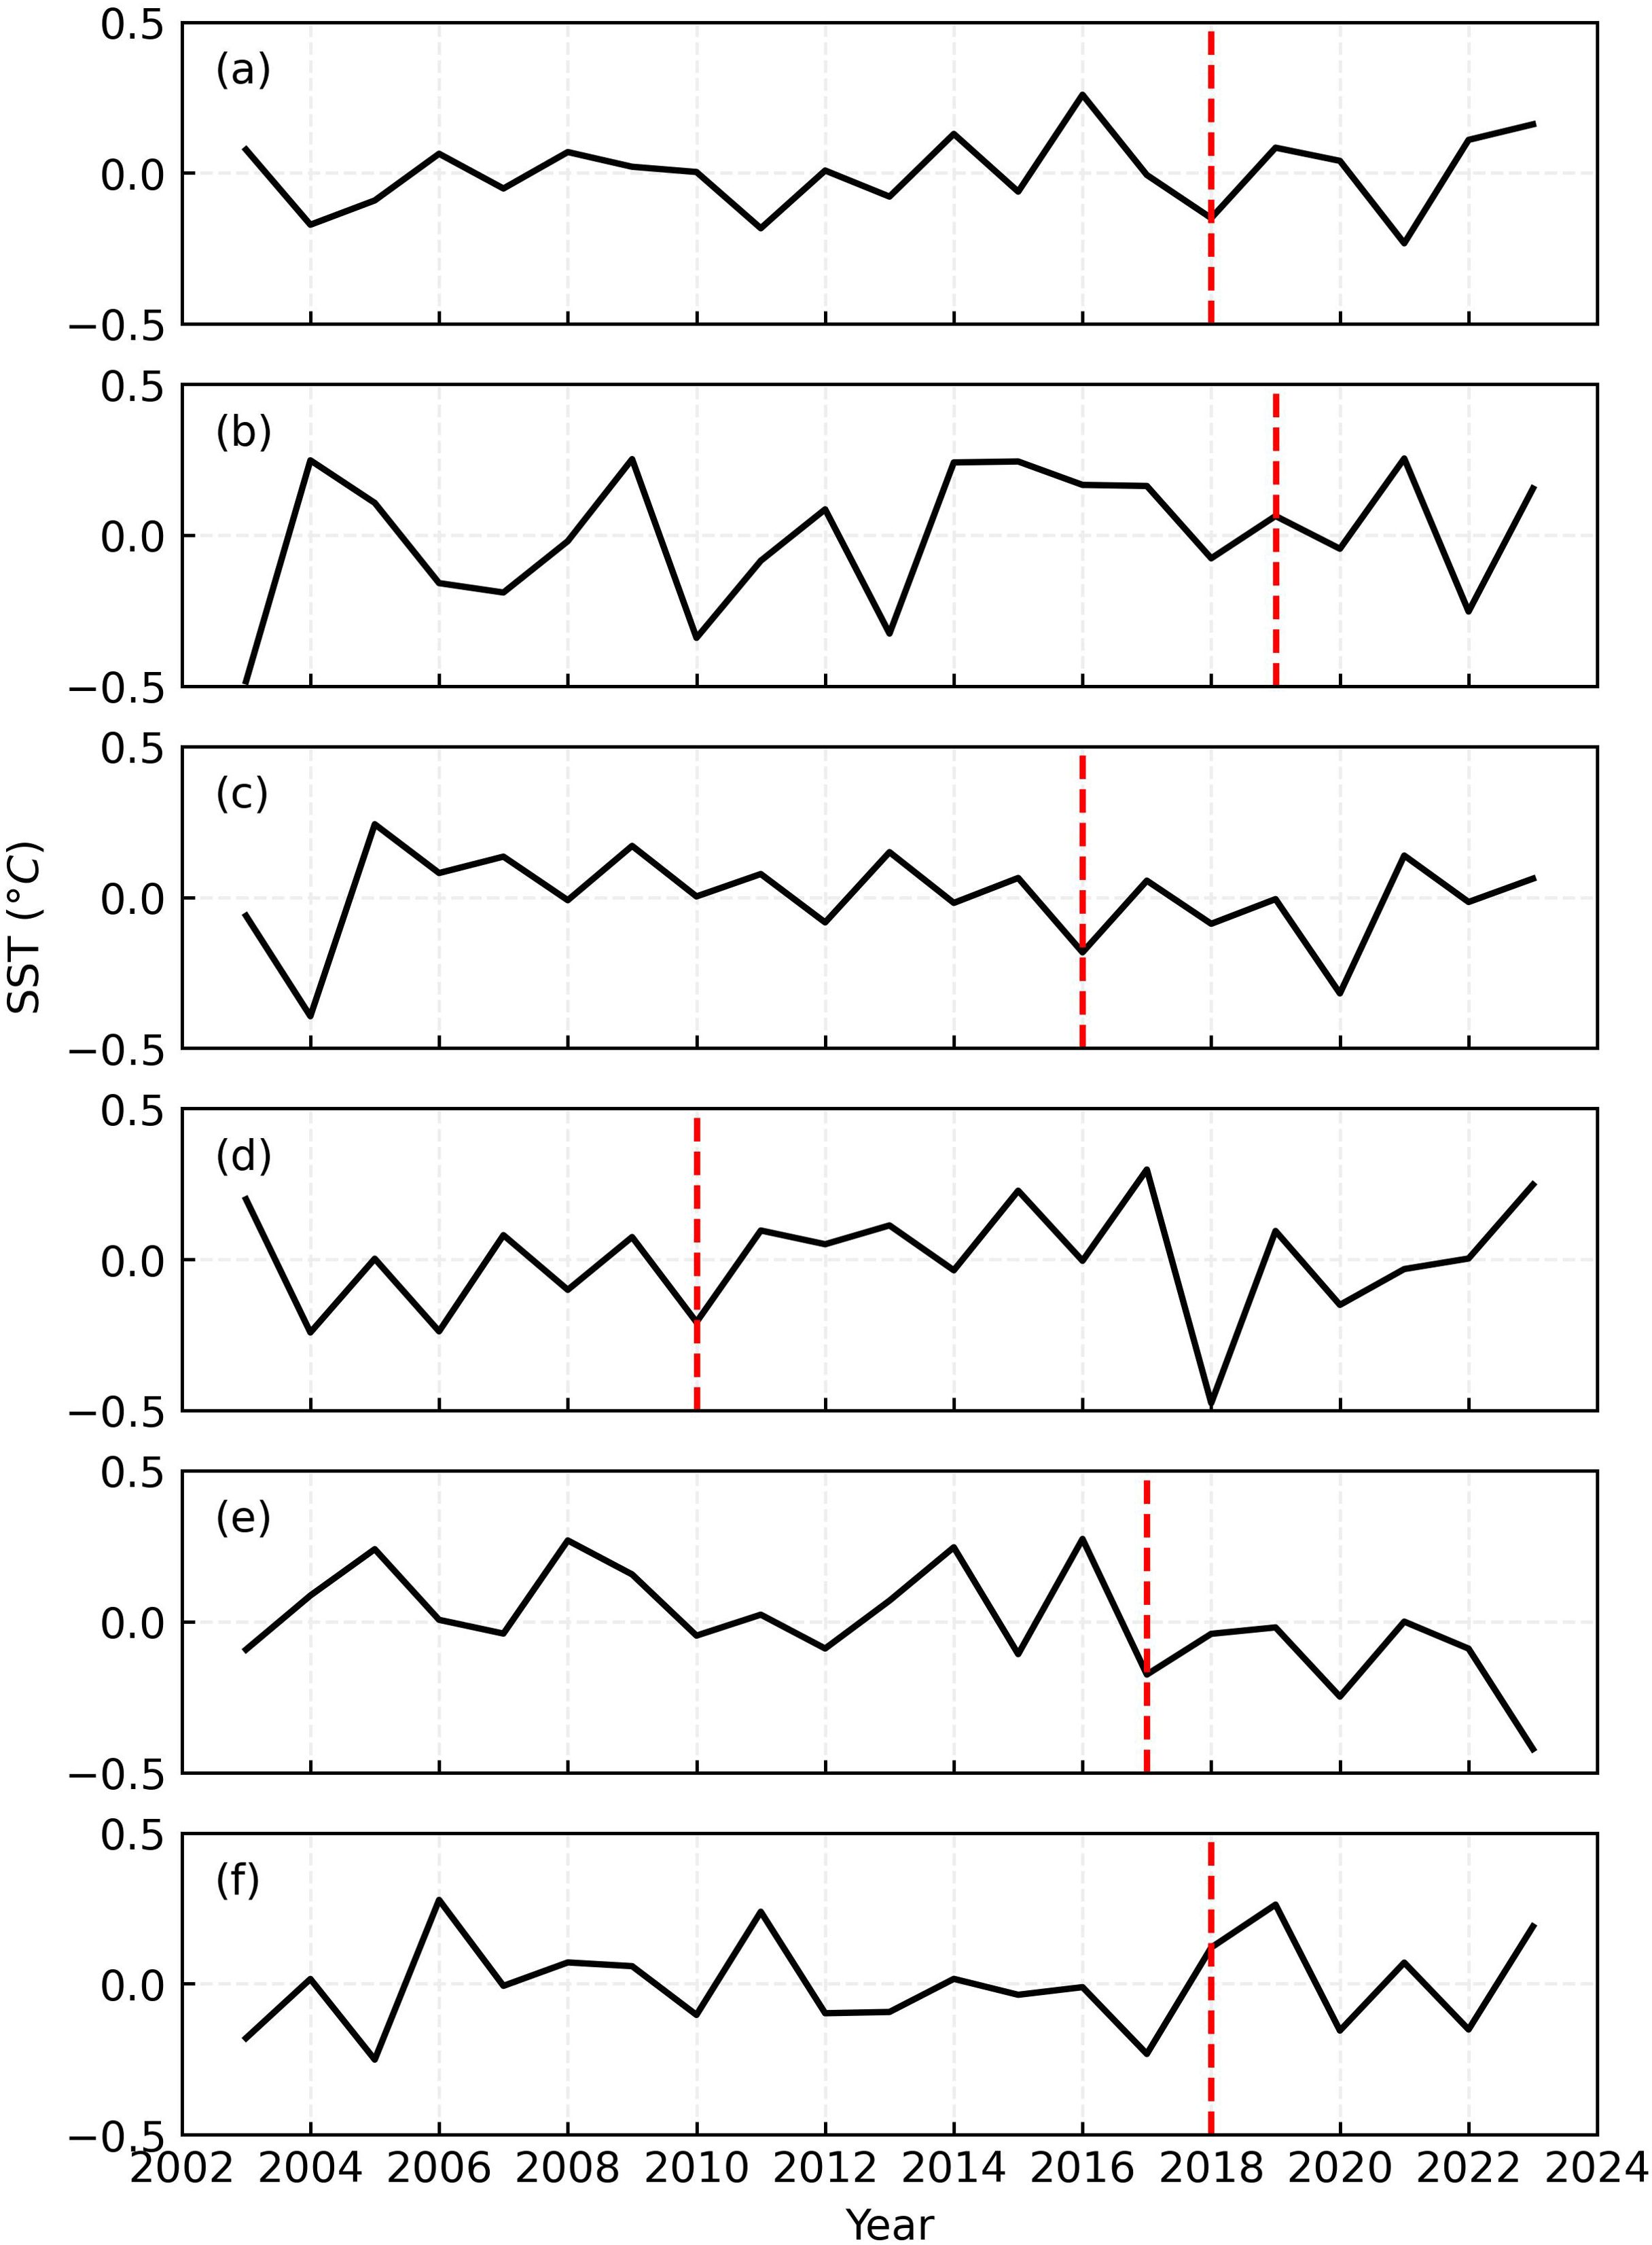
Figure 7. Temporal Evolution of SST Anomalies (°C, A-F) within the Wake Regions of the Six OWFs. The red dashed lines indicate the operations of all OWFs.
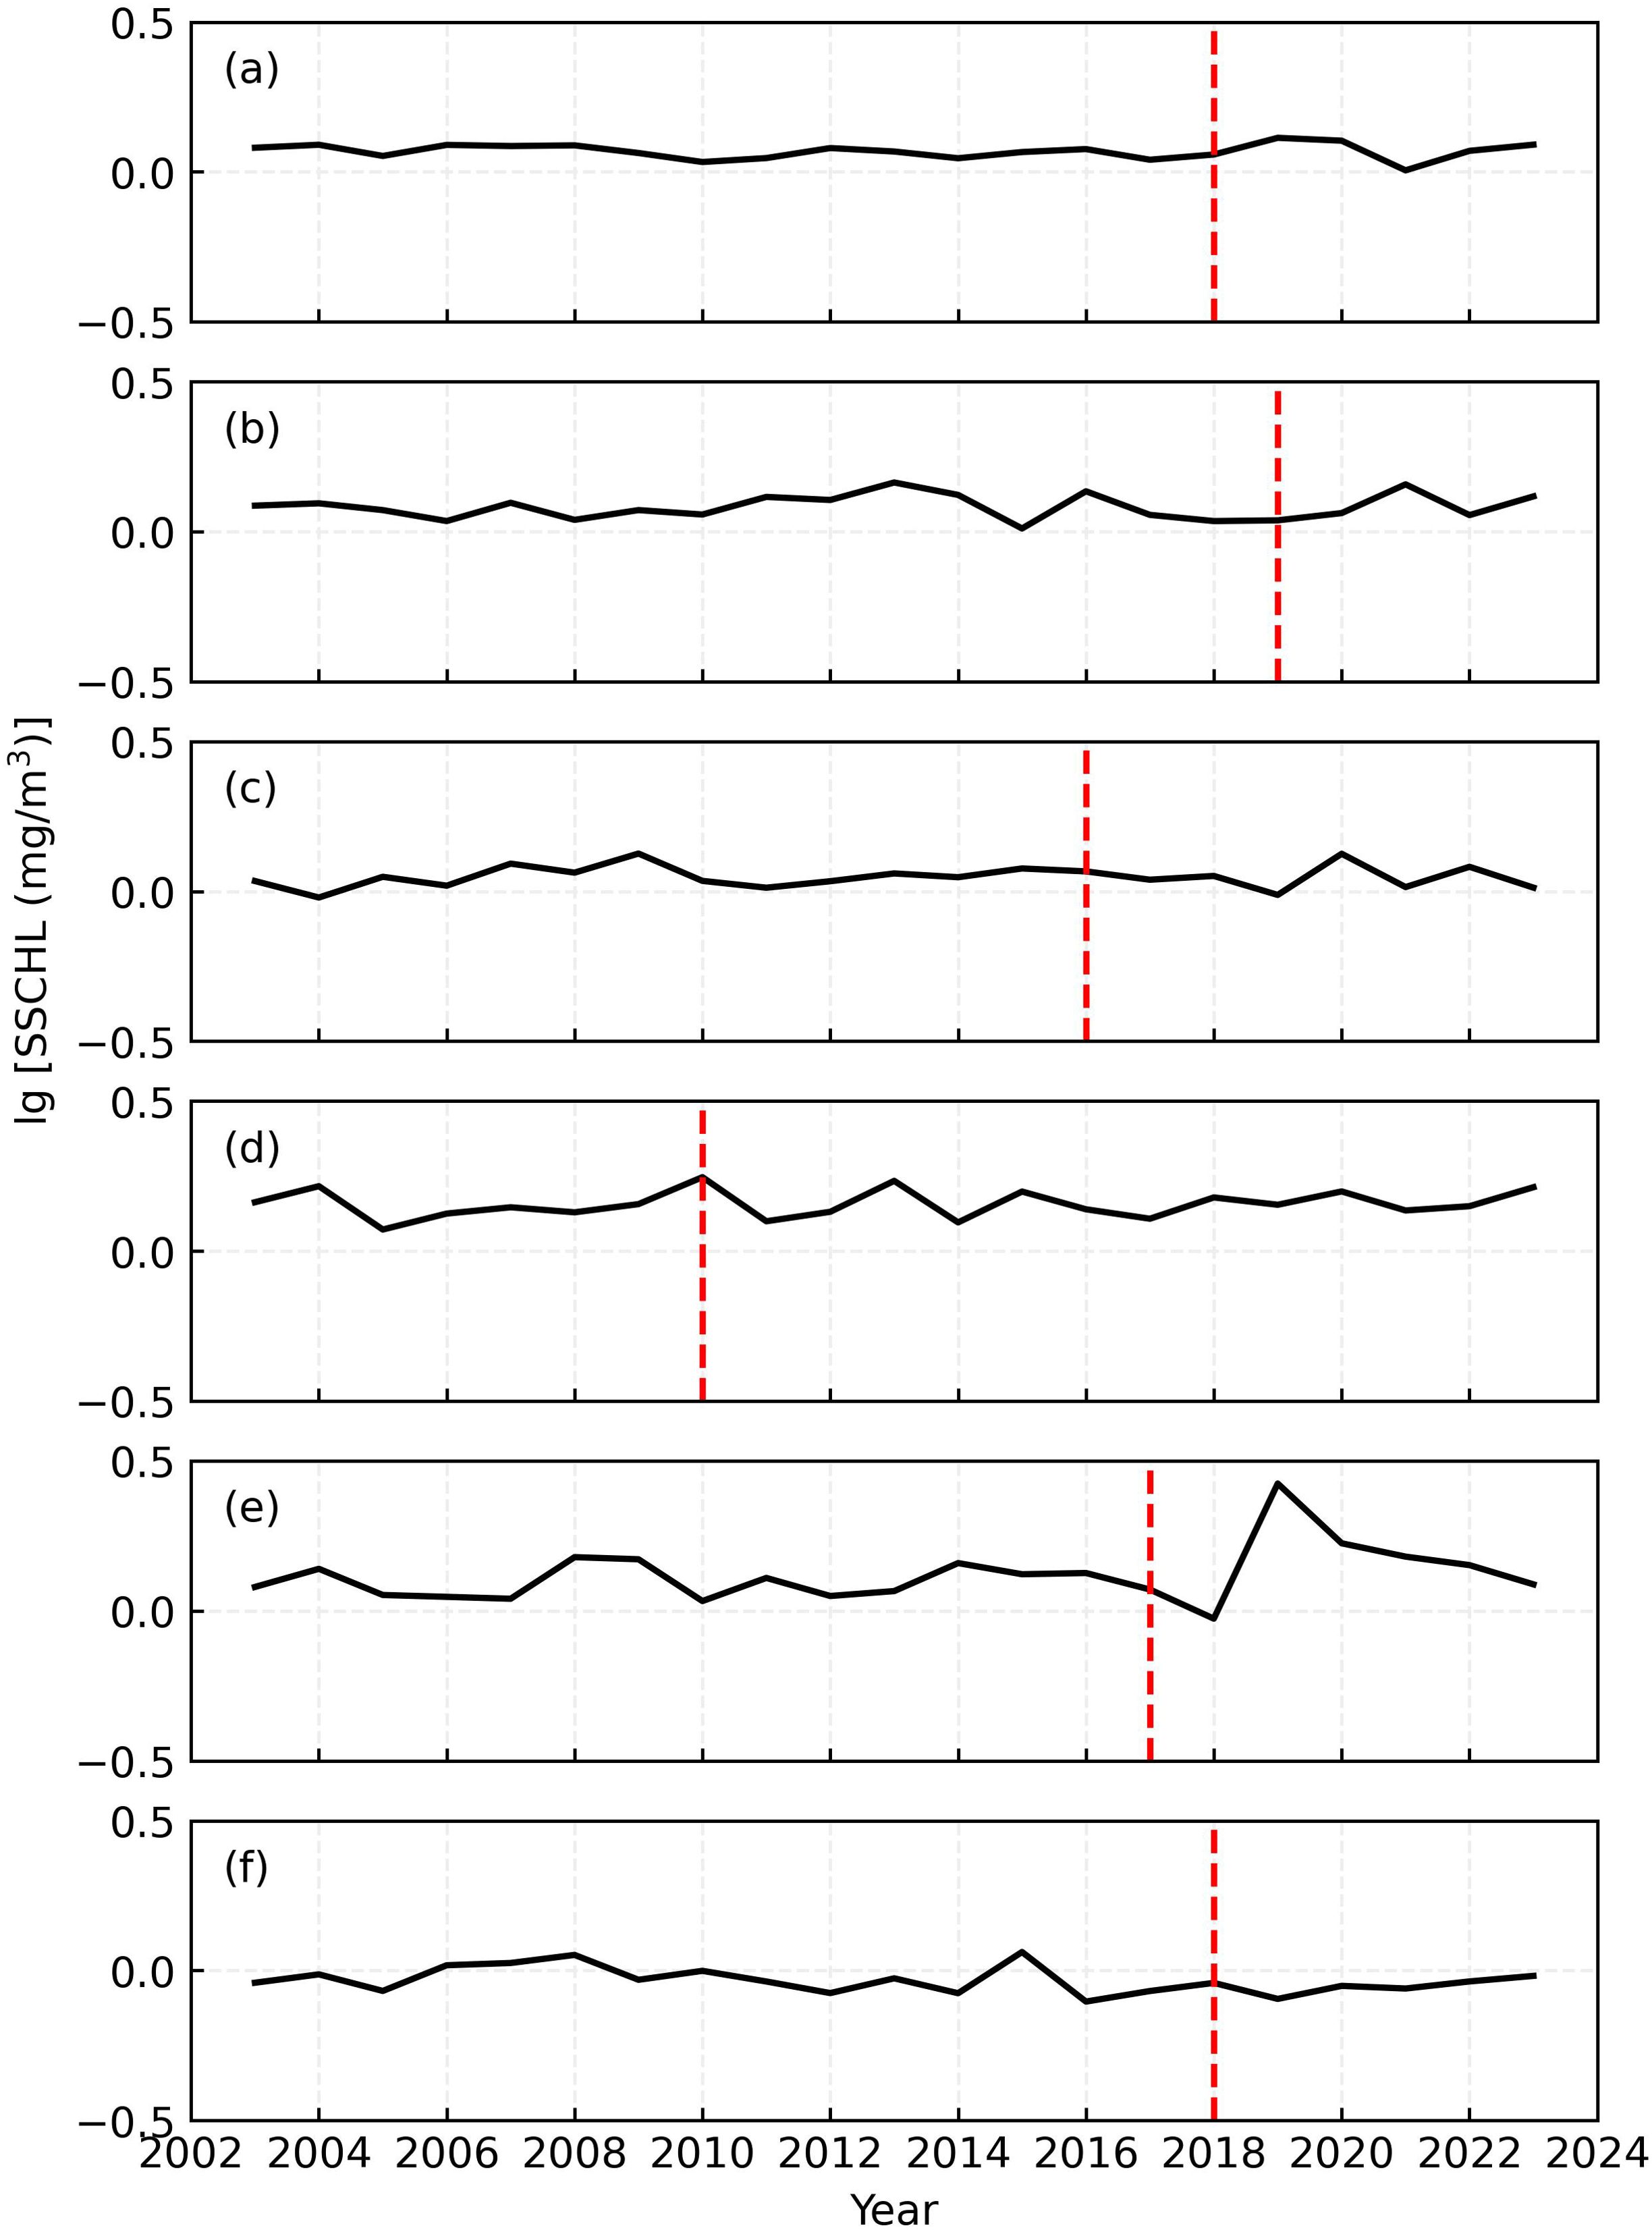
Figure 8. Temporal Evolution of SSCHL Anomalies (mg·m-3, A-F) within the Wake Regions of the Six OWFs. The red dashed lines indicate the operations of all OWFs.
4.2 Other effects on wind wake signatures
This paper focused on the upwelling effect on the formation of wind wake signatures due to several key reasons. Firstly, the upwelling effect is closely connected to marine dynamics and ecological responses. The simultaneous occurrence of sea surface cooling and marine fertilization underscores the profound impacts of upwelling. This result highlights the potential influences of OWF on the adjacent marine systems. Therefore, the design and planning layout of OWFs should consider the upwelling driven by wind wakes and balance their potential benefits and risks.
Secondly, the upwelling governed signatures generally exhibit larger magnitudes compared to other effects. For example, air-sea heat flux changes induced by wind wakes also play a role in regulating SST. However, according to Golbazi et al. (2022), the average cooling is -0.06 K, which is much less than the observed SST cooling around OWF E. More importantly, the air-sea heat flux effect only works on marine dynamic, and has negligible ecological influences. Thus, the importance of this effect is less significant than that of upwelling-regulated wind wake signatures on the sea surface.
Thirdly, the signatures controlled by wake-induced upwelling typically cover larger spatial scales than those driven by marine mixing variations. The mixing fluctuations are caused by offshore wind infrastructures. Enhanced mixing is anticipated due to horizontal shear generated by the flow past the infrastructure. The mixing variations are complex, and currently, research on high Reynolds number stratified flow past vertical structures is limited (Dorrell et al., 2022). For relatively low Reynolds number flows, laboratory experiments and fully resolved numerical simulations reveal that an offshore turbine may produce a downstream wake with a length scale of 102~103 m. This scale is much less than that of the upwelling-regulated signatures and is indiscernible based on the MODIS product, which has a horizontal resolution of 1 km.
Lastly, topographic and advection effects play a less important role in regulating wind wake-induced upwelling. Although water depth and background currents influence the paths and intensities of coastal upwellings (Hu and Wang, 2016), these effects mainly impact basin scale or regional scale (>103 km) upwellings. In the context of this paper, the upwellings are induced by wind wakes with scales on the order of 102 km. As shown in Figure 6, the water depth around all OWFs exhibit minimal horizontal variations within this length scale. Moreover, numerical simulations conducted by Liu et al. (2023) reveal that the maximum velocity of the upwellings induced by wind wakes is in agreement with the theoretical estimations used in this paper, even in very shallow regions. These regions have an original distance between the bottom of mixed layers and the seabed of less than 10 m. Therefore, we believe that the theoretical V and FH listed in Table 2 adequately explain the formation of wind wake signatures on the sea surface.
5 Conclusions
Significant SST reductions and SSCHL elevations were observed adjacent to the Xiangshui OWF, Jiangsu Province, China (Figures 3E, 4E). These wind wake signatures are agreement with geophysical fluid dynamic theory and demonstrate the capability of MODIS data to detect the impacts of OWF-induced wind wakes on the sea surface leeward of OWFs.
Satellite observations have not detected coherent SST or SSCHL structures on the sea surface in the leeward regions of the other target OWFs. Firstly, the absence of wind wake signatures form OWF A, B, and C might be attributed to the combined regulation of inactive triggered upwelling and weak vertical seawater temperature gradients. Secondly, the constantly changing wind directions at OWF A to D may hinder the formation of significant seawater property anomalies necessary for wind wake signatures around these OWFs. Lastly, land obstructions in the leeward of OWF F potentially disrupt the impacts of wind wakes on sea surface.
This paper used data from ERA5 and WOA 2023 to estimate the contributions from upwellings to the signatures on the sea surface. Although the theoretical results have been validated by fine-scale numerical simulations (Liu et al., 2023; Broström, 2008), the estimation lacks detailed features of the signatures due to the coarse resolutions of the two gridded datasets and climatological nature of WOA 2023. Comprehensive in-situ surveys, including radar meteorological observations, high-sampling-rate marine measurements (such as those conducted by towed vehicles or gliders), and marine ecological records, are needed to be coordinated and deployed at certain typical OWFs.
In summary, multiple environmental factors potentially influence OWF-induced wind wake signatures. A comprehensive global investigation of these signatures and their associated environmental effects is essential, necessitating a combination of satellite data and in-situ observations.
Data availability statement
The original contributions presented in the study are included in the article/supplementary material. Further inquiries can be directed to the corresponding author.
Author contributions
WY: Data curation, Formal analysis, Methodology, Resources, Software, Validation, Visualization, Writing – original draft. PG: Data curation, Methodology, Validation, Writing – original draft, Writing – review & editing. JD: Resources, Validation, Writing – review & editing. ZL: Conceptualization, Funding acquisition, Investigation, Project administration, Supervision, Writing – original draft, Writing – review & editing.
Funding
The author(s) declare financial support was received for the research, authorship, and/or publication of this article. This work was supported by Guangdong Basic and Applied Basic Research Foundation (grant number 2022A1515240024); STU Scientific Research Foundation for Talents (grant number NTF21009).
Conflict of interest
Author JD was employed by company DHI A/S.
The remaining authors declare that the research was conducted in the absence of any commercial or financial relationships that could be construed as a potential conflict of interest.
Publisher’s note
All claims expressed in this article are solely those of the authors and do not necessarily represent those of their affiliated organizations, or those of the publisher, the editors and the reviewers. Any product that may be evaluated in this article, or claim that may be made by its manufacturer, is not guaranteed or endorsed by the publisher.
References
Aitken M. L., Banta R. M., Pichugina Y. L., Lundquist J. K. (2014). Quantifying wind turbine wake characteristics from scanning remote sensor data. J. Atmospheric Oceanic Technol. 31, 765–787. doi: 10.1175/JTECH-D-13-00104.1
Amaral L., Castro R. (2017). Offshore wind farm layout optimization regarding wake effects and electrical losses. Eng. Appl. Artif. Intell. 60, 26–34. doi: 10.1016/j.engappai.2017.01.010
Bärfuss K., Schulz-Stellenfleth J., Lampert A. (2021). The impact of offshore wind farms on sea state demonstrated by airborne liDAR measurements. J. Mar. Sci. Eng. 9, 644. doi: 10.3390/jmse9060644
Broström G. (2008). On the influence of large wind farms on the upper ocean circulation. J. Mar. Syst. 74, 585–591. doi: 10.1016/j.jmarsys.2008.05.001
Carpenter J. R., Merckelbach L., Callies U., Clark S., Gaslikova L., Baschek B. (2016). Potential impacts of offshore wind farms on North Sea stratification. PLoS One 11, e0160830. doi: 10.1371/journal.pone.0160830
Christiansen N., Daewel U., Djath B., Schrum C. (2022a). Emergence of large-scale hydrodynamic structures due to atmospheric offshore wind farm wakes. Front. Mar. Sci. 9. doi: 10.3389/fmars.2022.818501
Christiansen N., Daewel U., Schrum C. (2022b). Tidal mitigation of offshore wind wake effects in coastal seas. Front. Mar. Sci. 9. doi: 10.3389/fmars.2022.1006647
Christiansen M., Hasager C. (2005). Wake effects of large offshore wind farms identified from satellite SAR. Remote Sens. Environ. 98, 251–268. doi: 10.1016/j.rse.2005.07.009
Daewel U., Akhtar N., Christiansen N., Schrum C. (2022). Offshore wind farms are projected to impact primary production and bottom water deoxygenation in the North Sea. Commun. Earth Environ. 3, 292. doi: 10.1038/s43247-022-00625-0
Dai K., Bergot A., Liang C., Xiang W.-N., Huang Z. (2015). Environmental issues associated with wind energy – A review. Renewable Energy 75, 911–921. doi: 10.1016/j.renene.2014.10.074
Darecki M., Stramski D. (2004). An evaluation of MODIS and SeaWiFS bio-optical algorithms in the Baltic Sea. Remote Sens. Environ. 89, 326–350. doi: 10.1016/j.rse.2003.10.012
Dorrell R. M., Lloyd C. J., Lincoln B. J., Rippeth T. P., Taylor J. R., Caulfield C.-C. P., et al. (2022). Anthropogenic mixing in seasonally stratified shelf seas by offshore wind farm infrastructure. Front. Mar. Sci. 9. doi: 10.3389/fmars.2022.830927
Dunstan P. K., Foster S. D., King E., Risbey J., O’Kane T. J., Monselesan D., et al. (2018). Global patterns of change and variation in sea surface temperature and chlorophyll a. Sci. Rep. 8, 14624. doi: 10.1038/s41598-018-33057-y
Floeter J., Pohlmann T., Harmer A., Möllmann C. (2022). Chasing the offshore wind farm wind-wake-induced upwelling/downwelling dipole. Front. Mar. Sci. 9. doi: 10.3389/fmars.2022.884943
Freeman K., Frost C., Hundleby G., Roberts A., Valpy B., Holttinen H., et al. (2019). Our energy, our future: How offshore wind will help Europe go carbon-neutral. Ed. Walsh C. (Brussels, Belgium: BVG Associates Limited).
Galparsoro I., Menchaca I., Garmendia J. M., Borja Á., Maldonado A. D., Iglesias G., et al. (2022). Reviewing the ecological impacts of offshore wind farms. NPJ Ocean Sustainability 1, 1. doi: 10.1038/s44183-022-00003-5
Golbazi M., Archer C. L., Alessandrini S. (2022). Surface impacts of large offshore wind farms. Environ. Res. Lett. 17, 064021. doi: 10.1088/1748-9326/ac6e49
Hao J., Chen Y., Wang F., Lin P. (2012). Seasonal thermocline in the China Seas and northwestern Pacific Ocean. J. Geophysical Res. Oceans 117 (2), 1–14. doi: 10.1029/2011JC007246
Hu J., Wang X. H. (2016). Progress on upwelling studies in the China seas. Rev. Geophysics 54, 653–673. doi: 10.1002/2015RG000505
Lee T.-Y., Wu Y.-T., Kueh M.-T., Lin C.-Y., Lin Y.-Y., Sheng Y.-F. (2022). Impacts of offshore wind farms on the atmospheric environment over Taiwan Strait during an extreme weather typhoon event. Sci. Rep. 12, 823. doi: 10.1038/s41598-022-04807-w
Li C., Mogollón J. M., Tukker A., Steubing B. (2022). Environmental impacts of global offshore wind energy development until 2040. Environ. Sci. Technol. 56, 11567–11577. doi: 10.1021/acs.est.2c02183
Lian Z., Liu K., Yang T. (2022). Potential influence of offshore wind farms on the marine stratification in the waters adjacent to China. J. Mar. Sci. Eng. 10, 1872. doi: 10.3390/jmse10121872
Liu K., Du J., Larsén X. G., Lian Z. (2023). Spatiotemporal variations of ocean upwelling and downwelling induced by wind wakes of offshore wind farms. J. Mar. Sci. Eng. 11, 2020. doi: 10.3390/jmse11102020
Maas O., Raasch S. (2022). Wake properties and power output of very large wind farms for different meteorological conditions and turbine spacings: a large-eddy simulation case study for the German Bight. Wind Energ. Sci. 7, 715–739. doi: 10.5194/wes-7-715-2022
Pan Y., Fan W., Zhang D., Chen J., Huang H., Liu S., et al. (2016). Research progress in artificial upwelling and its potential environmental effects. Sci. China Earth Sci. 59, 236–248. doi: 10.1007/s11430-015-5195-2
Paskyabi M. B., Fer I. (2012). Upper ocean response to large wind farm effect in the presence of surface gravity waves. Energy Proc. 24, 245–254. doi: 10.1016/j.egypro.2012.06.106
Platis A., Siedersleben S. K., Bange J., Lampert A., Bärfuss K., Hankers R., et al. (2018). First in situ evidence of wakes in the far field behind offshore wind farms. Sci. Rep. 8, 2163. doi: 10.1038/s41598-018-20389-y
Pryor S. C., Barthelmie R. J., Bukovsky M. S., Leung L. R., Sakaguchi K. (2020). Climate change impacts on wind power generation. Nat. Rev. Earth Environ. 1, 627–643. doi: 10.1038/s43017-020-0101-7
Raghukumar K., Nelson T., Jacox M., Chartrand C., Fiechter J., Chang G., et al. (2023). Projected cross-shore changes in upwelling induced by offshore wind farm development along the California coast. Commun. Earth Environ. 4, 116. doi: 10.1038/s43247-023-00780-y
Saidur R., Rahim N. A., Islam M. R., Solangi K. H. (2011). Environmental impact of wind energy. Renewable Sustain. Energy Rev. 15, 2423–2430. doi: 10.1016/j.rser.2011.02.024
Schneemann J., Rott A., Dörenkämper M., Steinfeld G., Kühn M. (2020). Cluster wakes impact on a far-distant offshore wind farm's power. Wind Energ. Sci. 5, 29–49. doi: 10.5194/wes-5-29-2020
Siedersleben S. K., Lundquist J. K., Platis A., Bange J., Bärfuss K., Lampert A., et al. (2018). Micrometeorological impacts of offshore wind farms as seen in observations and simulations. Environ. Res. Lett. 13, 124012. doi: 10.1088/1748-9326/aaea0b
van den Berg G. P. (2004). Effects of the wind profile at night on wind turbine sound. J. Sound Vibration 277, 955–970. doi: 10.1016/j.jsv.2003.09.050
van der Molen J., Smith H. C. M., Lepper P., Limpenny S., Rees J. (2014). Predicting the large-scale consequences of offshore wind turbine array development on a North Sea ecosystem. Continental Shelf Res. 85, 60–72. doi: 10.1016/j.csr.2014.05.018
Wolsink M. (2007). Wind power implementation: The nature of public attitudes: Equity and fairness instead of ‘backyard motives’. Renewable Sustain. Energy Rev. 11, 1188–1207. doi: 10.1016/j.rser.2005.10.005
Zhang T., Tian B., Sengupta D., Zhang L., Si Y. (2021). Global offshore wind turbine dataset. Sci. Data 8, 191. doi: 10.1038/s41597-021-00982-z
Keywords: offshore wind farm, upwelling, sea surface signature, remote sensing, MODIS
Citation: Yu W, Guo P, Du J and Lian Z (2024) Detecting offshore wind farm-induced wind wake signatures on sea surface using MODIS data. Front. Mar. Sci. 11:1465634. doi: 10.3389/fmars.2024.1465634
Received: 16 July 2024; Accepted: 26 August 2024;
Published: 11 September 2024.
Edited by:
Chunyan Li, Louisiana State University, United StatesReviewed by:
Han Zhang, Ministry of Natural Resources, ChinaSimone Cosoli, University of Western Australia, Australia
Copyright © 2024 Yu, Guo, Du and Lian. This is an open-access article distributed under the terms of the Creative Commons Attribution License (CC BY). The use, distribution or reproduction in other forums is permitted, provided the original author(s) and the copyright owner(s) are credited and that the original publication in this journal is cited, in accordance with accepted academic practice. No use, distribution or reproduction is permitted which does not comply with these terms.
*Correspondence: Zhan Lian, emhhbmxpYW5Ac3R1LmVkdS5jbg==