 Mingen Liang
 Suijie Zhu1,2,3
- 1School of Ocean Engineering and Technology, Sun Yat-Sen University, Guangzhou, China
- 2Southern Marine Science and Engineering, Guangdong Laboratory (Zhuhai), Zhuhai, China
- 3Guangdong Province Engineering Research Center of Coasts, Islands and Reefs, Sun Yat-Sen University, Guangzhou, China
The propagation and dissipation of typhoon-induced surface waves are vital to morphological evolution and related engineering within coastal and estuarine regions. An observation system was operated during Typhoon Higos, and TELEMAC–TOMAWAC numerical modeling was performed for Typhoons Hagupit, Hato, and Higos along the central coast of Guangdong and the Pearl River Estuary in China to explore variations in wave propagation and dissipation during typhoons. The results showed that wind waves were dominant before typhoon landfall, and the intense wind waves dissipated rapidly during typhoon decay, while they could stay longer within the estuarine regions. Landward wave propagation had a tendency to convert from being convergence-dominated to being dissipation-dominated with the morphological change and tended to converge at the mouth-bar region. Within the estuarine regions, waves dissipated more rapidly at the prismatic estuary than at the bell-shaped bays due to the limited width and rapid contraction of the outlet. Moreover, the track and scale of typhoons had critical effects on the generated wave field, and they dominated the intensity, propagation, and dissipation of the overall wave field. Specifically, typhoons with broader scales and longer moving tracks within the coastal regions of Guangdong Province enhanced the wind–wave interaction and induced a stronger and wider wave field, despite that their typhoon intensities were comparable (i.e., Hagupit vs. Hato). Furthermore, waves generated by compact and regular cyclone structures dissipated more strongly along the moving track of typhoons (i.e., Hato and Higos). Except for typhoons directly attacking the Pearl River Estuary, waves within the estuarine regions tended to dissipate/converge when located on the right/left side of the moving track of typhoons.
1 Introduction
Typhoon-induced surface waves are a critical factor affecting the morphological evolution of coastal and estuarine regions as well as related engineering. The impacts of typhoons on coastal areas are continuously intensifying in association with climate change (Emanuel, 1987; Knutson et al., 2010). Therefore, elucidating the propagation and dissipation of typhoon-induced surface waves within coastal and estuarine regions is essential.
The movement and strength of the typhoons vary significantly spatially and temporally in short time periods. Therefore, the composition and distribution of typhoon-induced waves exhibit spatial and temporal differences as well. Within the coastal regions, the wind wave component increased as typhoons approached (Xu et al., 2005). The maximum wave height mainly occurred on the right side of the typhoon track, whereas the maximum wind speed and wave height occurred with a time lag due to the wave propagation (Peng et al., 2023; Wu et al., 2023). As waves propagate landward, the complex morphological features at the coastal regions enhance the evolution of wave propagation. For example, Yin et al. (2019) showed that the storm wave heights reduced significantly when waves propagated through the shallow elongated ebb shoal at the outlets of Deben Estuary, UK. Cheng et al. (2015) declared that the waves penetrating the bay attenuated rapidly beyond the narrow mouth of Tillamook Bay, USA, while the inner part of the bay lacked wave action due to its far distance from the outer sea regions and limited fetch for wind wave generation.
Furthermore, the features of typhoon-induced wave fields within the estuarine regions are influenced by multiple factors. First, intense winds during typhoons are the driving force of the related wave fields. The wind field features, including local wind composition and the fetch scale for wind–wave interaction, directly dominated the spatial distribution and temporal evolution of typhoon-induced waves (Xie et al., 2018). The regulation processes of wave propagation during typhoons vary from those under normal weather conditions. Manchia and Mulligan (2022) found that deep-water wave processes, including wind input, white capping, and quadruplet wave interactions, dominated the wave action balance, whereas shallow-water wave processes such as bottom friction were negligible in Onslow Bay and its adjacent shelf areas (10–100-m depths) in the USA during Hurricanes Florence and Isaias. Mengual et al. (2022) found that the depth-limited wave breaking over the ebb shoal was enhanced under the storm condition, leading to a reduction of the shoreward wave height in the Tagus Estuary of Portugal. The interaction processes between the waves and other hydrodynamic processes also influence the wave features. Luo et al. (2021) discussed the interacting mechanism between storm surges and waves in the near-shore regions of the Pearl River Estuary, including the water level regulating the modulations in wave height, and the sharp depth decrease-induced wave breaking contributed to the wave setup. Gong et al. (2018) indicated that the interaction between the waves and landward flow reduced the significant wave height and postponed the peak wave height inside the Modaomen Estuary, China. Moreover, the external procedures, including the anthropogenic events and the global warming-induced sea level rise, have potential impacts on the typhoon-induced wave field. Zhang et al. (2023) simulated the impacts of the land reclamation conducted from 1990 to 2020 within the Pearl River Estuary on the maximum significant wave heights during typhoons; their results showed that the change rate induced by reclamation ranged from −40% to 14% under the Typhoon Mangkhut scenario in different regions. Yin et al. (2017) discussed the influences of sea level rise on the typhoon-induced wave field, indicating that the increasing sea level reduced the wave dissipation due to the breaking locations of waves shifting shoreward in the Pearl River Estuary. Furthermore, Fairchild et al. (2021) explored the attenuation of wetlands to the local wave, and estuary-scale surge reduced 8% of flooding intensity near the wave-exposed estuary mouths along the coast of Wales, UK.
The wave fields varied when different typhoons attacked (Pan and Liu, 2015). The intensity of the typhoon-induced wave field had a positive correlation with the typhoon strength (Lyddon et al., 2019; Zhang et al., 2023), whereas the influences of typhoon path on the hydrodynamic processes were mainly concentrated on storm surges and saltwater intrusion. Du et al. (2020) explored the smaller angle between the typhoon tracks and coastline as well as the slower moving speed that induced higher storm surges in the Pearl River Estuary. Hashimura and Takikawa (2012) simplified 13 typhoon paths based on the previous typhoons and estimated the path that induced serious storm surges along the coastal regions located in the Kumamoto Prefecture, Japan. Wang et al. (2024) compared the simulated storm surges under three representative typhoon scenarios in the Yangtze River Estuary, China, and concluded that the occurring regions of maximum storm surges related to the typhoon path while the typhoon intensity was more critical to the storm surge rise. Pan et al. (2018) indicated that the typhoon landing on the west side of Modaomen Estuary induced strong landward salt flux transportation due to the northwestward wind, contributing to the rise of water level. Thus, the regulation of typhoon tracks and scale to the generated wave field as well as the dominant typhoon characteristic factors to wave intensity, propagation, and dissipation remains unclear.
Guangdong Province is located in southern China, with a long latitudinal coastline along the South China Sea (SCS). The Pearl River Estuary (PRE) forms the central part of the coastline, consisting of two bell-shaped bays and a prismatic-shaped estuary (Figure 1). From the offshore to the coast, the bathymetry of the sea and the configuration and morphology of the estuaries changed greatly, which affected the wave propagation and dissipation significantly. Studies on the propagation and dissipation of surface waves within this area have generally been conducted under normal weather conditions (Wang et al., 2006; Wei et al., 2020) or have focused on the influence of the wave–current interaction (Luo et al., 2021), reclamation (Zhang et al., 2023), and sea level rise (Yin et al., 2017) on the wave field under typhoon conditions. Thus, typhoon-specific observations were conducted in the prismatic-shaped Modaomen Estuary during Typhoon Higos, and a numerical model covering the central coast of Guangdong and the PRE during Typhoons Hagupit, Hato, and Higos was constructed based on the TOMAWAC wave module in the TELEMAC–MASCARET modeling system. The main objectives of the present study were to examine spatial and temporal variations in the propagation and dissipation of typhoon-induced surface waves within a large coastal region containing multiple estuaries and to analyze the impacts of different typhoon characteristic factors on the propagation and dissipation of typhoon-induced waves. Of the typhoons selected, Hagupit and Hato followed different tracks and had similar intensity, whereas Hato and Higos followed similar tracks and had different intensities (Figure 1A), allowing for comparative analyses of the effects of typhoons with various tracks, scales, and intensities on surface waves.
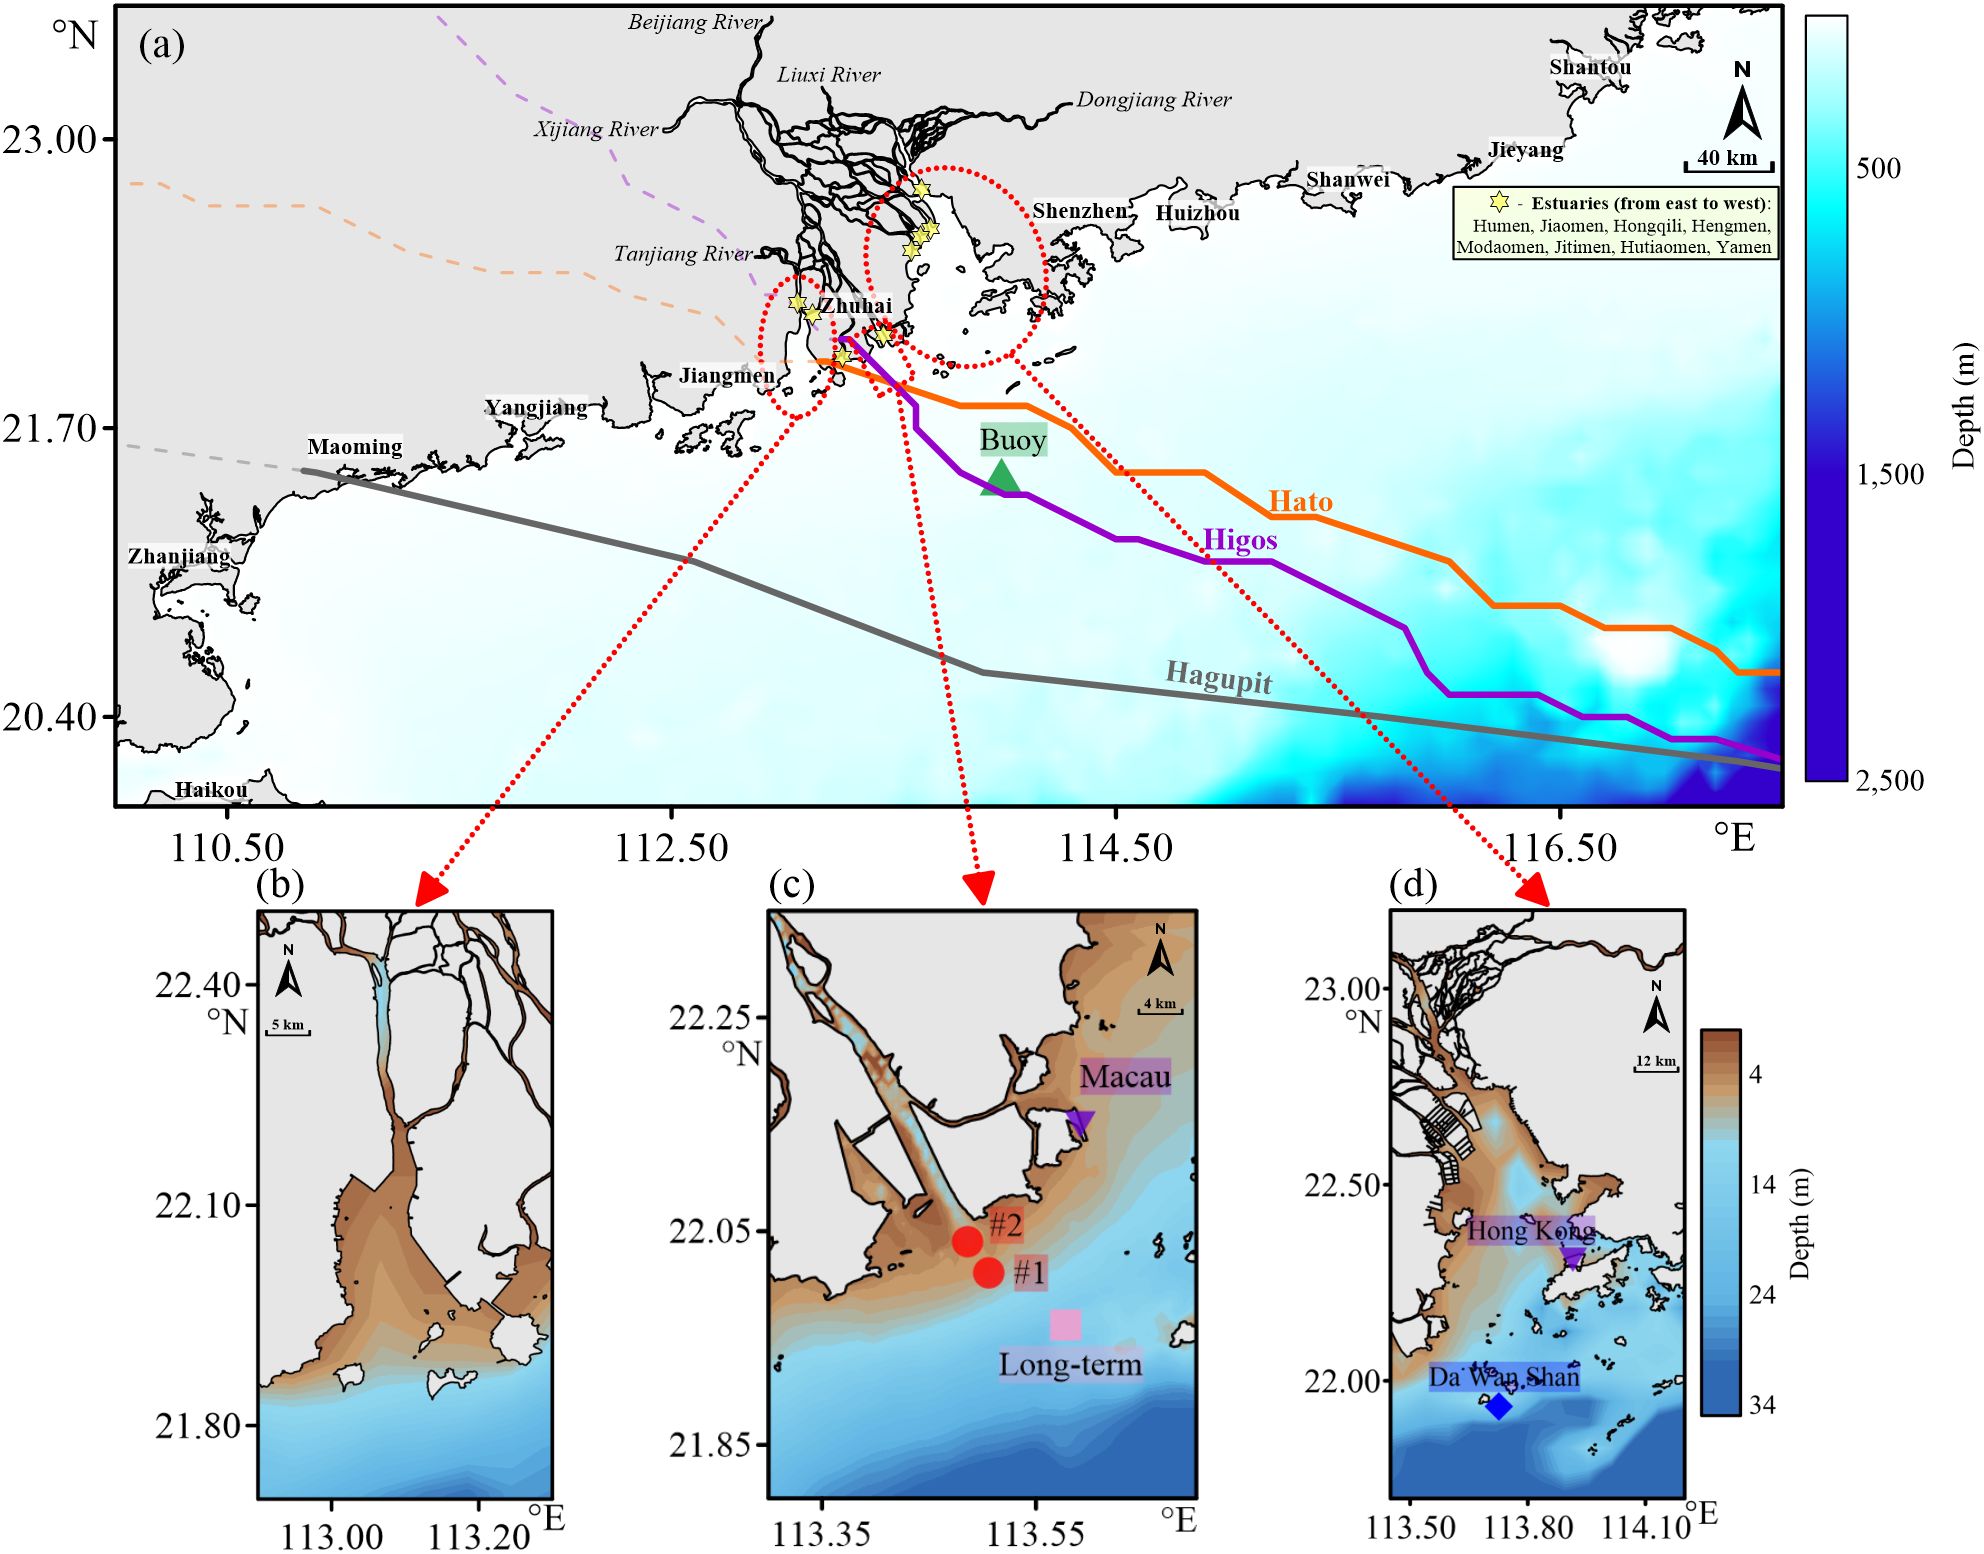
Figure 1. Locations of the study area, observation stations, and typhoon tracks. (A) Coastal region of Guangdong Province. (B) Huangmaohai Bay. (C) Modaomen Estuary. (D) Lingding Bay.
2 Study area
The Pearl River Delta consists of the Xijiang, Dongjiang, and Beijiang deltas and is connected to the SCS through eight estuaries (Figure 1A). Four estuaries in the east enter the SCS through the bell-shaped Lingding Bay (LDY) (Figure 1D), and two estuaries in the west enter the SCS through a smaller bay named Huangmaohai (HMH) (Figure 1B), whereas the Modaomen (Figure 1C) and Jitimen Estuaries directly enter the sea. Based on a long-term wave station (Figure 1C) deployed in the outer part of Modaomen Estuary (ME) from September 2015 to July 2016 (no typhoon directly affected the study area during this period), the ranges of significant wave height, wave period, and wave direction were 0.12–1.48 m, 1.30–5.90 s, and 23.00°–360.00° (clockwise from north), with mean values of 0.49 m, 2.32 s, and 205.10°, respectively.
The SCS is a major site of tropical cyclone activity, with an average of 12 cyclones per year; of these, 54.52% have wind speeds greater than 33 m/s (Le et al., 2021). From 1949 to 2008, 5.7 typhoons made direct landfall in the PRE each year, making the PRE one of the main typhoon landing areas in the world (Pan et al., 2018). Thus, the central coast of Guangdong and the PRE are affected by typhoons with high frequency and intensity. Based on data recorded by the National Meteorological Centre of China, the maximum wind speeds and landing times of Typhoons Hagupit, Hato, and Higos were 50 m/s, 52 m/s, and 35 m/s on 06:45 September 24, 2008 (GMT+8), 12:50 August 23, 2017, and 06:00 August 19, 2020, respectively. The typhoon tracks are shown in Figure 1A, with Hagupit making landfall in Maoming, while Hato and Higos both landed in Zhuhai.
3 Data and methods
3.1 Field observation
Field observations were conducted from 14:00 August 18, 2020, to 10:30 August 20, 2020, during Typhoon Higos. Two instrumented stations were deployed on the south (#1) and north (#2) sides of the mouth-bar region in the ME (Figure 1C). Acoustic wave and current (AWAC) measurements were taken to determine the significant wave height, wave period, and wave direction, with the sampling period and the number of observations per period set to 30 min and 1,024, respectively. The tidal effect from the observed data by the AWAC was removed by reducing the observed tide level at each sampling period based on Geng et al. (2014). The cross-zero method was applied to calculate the significant wave heights and wave periods. In addition, hourly significant wave height and wave direction data recorded at a long-term buoy station (Figure 1A) were collected for analysis.
3.2 Wave composition analysis
The wave steepness is used to evaluate variations in wave conditions (Thompson and Reynolds, 1976). During wave propagation, the condition of the wave field can be described in terms of wave composition, including wind waves, swells, and immature swells. The wave steepness can be calculated as follows:
where δ is the wave steepness, is the significant wave height, L is the wavelength calculated using the wave dispersion equation, T is the significant wave period, k is the wavenumber, and h is the water depth. According to Thompson et al. (1984), represents wind waves, represents swell, and represents immature swell conditions.
3.3 Wave dissipation rate
When waves propagate into coastal and estuarine regions, depth limitation causes enhanced bottom friction, leading to the dissipation of the wave. Based on Kang and Di Iorio (2006), the dissipation rate induced by bottom friction was calculated from the energy conservation equation of steady-state waves:
where F is the energy flux, E is the total wave energy, is the wave group velocity, and is along the direction of wave propagation. Although Equations 2 and 3 neglect the contributions of other wave dissipation processes, these calculations include observed wave information and reflect the temporal variation of wave dissipation. Thus, integrating Equation 2 along the direction of wave propagation x,
where <> represents the spatial mean, θ is the angle between the wave propagation direction and the line connecting two observation stations, and is the distance between the two stations. Equation 4 can be rewritten as
where the subscripts o and i represent the outer and inner locations, respectively.
As for the observation station where wave period information was not collected, the component F in Equation 5 is replaced by E because the evolution of wave energy was directly associated with the variation of wave height under the major effect of wave transformation (Pruszak et al., 2008). Thus, the wave energy dissipation rate was calculated as follows:
Moreover, Normalized Dissipation Rate (NDR) is proposed to explore the relatively dominant variation of the wave dissipation and convergence processes between the analytical points and was calculated as follows:
where and are respectively the positive and negative temporal integration results of dissipation rate at each profile. Therefore, NDR closer to 1 or −1 means dissipation- or convergence-dominant, respectively.
3.4 Model description
Numerical simulations were performed using the TELEMAC–MASCARET modeling system (www.opentelemac.org), which was developed by the Laboratoire national d’Hydraulique et Environnement (LNHE), a research department of Électricité de France (EDF). The TELEMAC system is an integrated modeling tool that includes free-surface hydrodynamics, sediment transport, water quality, and wave and groundwater flow modules in which simulation is conducted based on the finite element method, and the model domain is discretized in the form of an unstructured grid. This system is suitable for coastal and estuarine environments with irregular and complex geometries. In this study, we used the TELEMAC wave module TOMAWAC for simulation.
3.4.1 Wave module
The TOMAWAC wave module uses the wave energy density direction spectrum function N to represent a random wave and simulates the wave field using the governing equation of propagation:
where is the direction vector of the spatial location based on the Cartesian coordinate system, is the wavenumber vector after the discretization of the directional spectrum, is the direction of wave propagating, and t is simulation time. Q represents the source terms governing wave propagation and dissipation, including wind-driven (Janssen, 1989, 1991; Snyder et al., 1981; Yan, 1987) and white-capping dissipation (Cavaleri et al., 2007; Janssen, 1991; Komen et al., 1984; van der Westhuysen et al., 2007), bottom friction dissipation (Bouws and Komen, 1983; Hasselmann et al., 1973), depth-induced breaking dissipation (Battjes and Janssen, 1978; Izumiya and Horikawa, 1984; Roelvink, 1993; Thornton and Guza, 1983), non-linear transfers between frequencies (Gagnaire-Renou et al., 2010; Hasselmann, 1962, 1963; Hasselmann and Hasselmann, 1985a; Hasselmann et al., 1985b; Lavrenov, 2001; Tolman, 2004), triad interaction (Becq, 1998; Eldeberky and Battjes, 1995), and wave blocking (Hedges et al., 1985; van der Westhuysen, 2012). are related to the conditions of waves and currents, as follows:
where U is the current vector and σ is the natural or relative angular frequency.
3.4.2 Typhoon model
An appropriate model that can reproduce the wind and barometric pressure fields of a typhoon is vital to the numerical simulation of typhoon conditions. The barometric pressure was calculated using the Jelesnianski model (Jelesnianski, 1965):
where r is the distance from the simulation point to the typhoon center. , where is the standard barometric pressure of 1,010.30 hPa, is the barometric pressure at the typhoon center, and is the maximum radius of the typhoon, calculated as follows (Ou et al., 2002):
where (°) and (m/s) are the latitude and moving speed of the typhoon center, respectively.
The empirical wind field was calculated based on the Jelesnianski model (Jelesnianski, 1966):
where and are the moving and rotating wind components, respectively. The total empirical wind speed composed of and is transformed into X and Y directions based on the Cartesian coordinate system (Powell et al., 2003; Tian and Zhang, 2021; Willoughby, 1990), as follows:
where is a factor for converting wind speed to the value at 10-m height, is a factor for converting the speed at 10-m height to the top boundary layer of the atmosphere, and is the angle of incidence based on the same positive axis as the Cartesian coordinate system and calculated counterclockwise.
Generally, empirical calculation of the typhoon wind field leads to underestimation of the wind speed around the typhoon structure, whereas the wind field obtained from the reanalysis dataset underestimates the central wind speed of the typhoon. Thus, a mixing calculation was performed to remodel the typhoon wind field (Carr and Elsberry, 1996):
where and are wind speeds obtained from The National Centers for Environmental Prediction (NCEP) Climate Forecast System Reanalysis (CFSR), λ is a weighting factor, and n is a correction factor to minimize error (n = 6, 9, and 9 for Typhoons Hagupit, Hato, and Higos, respectively).
3.4.3 Model setup
The model grid and computational domain are presented in Figure 2. The unstructured grid had spatial resolution ranging from 5,000 m in the offshore region to 50 m in the upper river area. The computational domain encompassed 85% of the coastline of Guangdong Province, with upper boundaries at the upstream rivers and an open boundary extending 200 km from the ME. Based on the observed seasonal wave characteristics (Lu et al., 2020), the input wave parameters at the open boundary were set as fixed values (southwesterly wave with Hs = 1.0 m, T = 5 s).
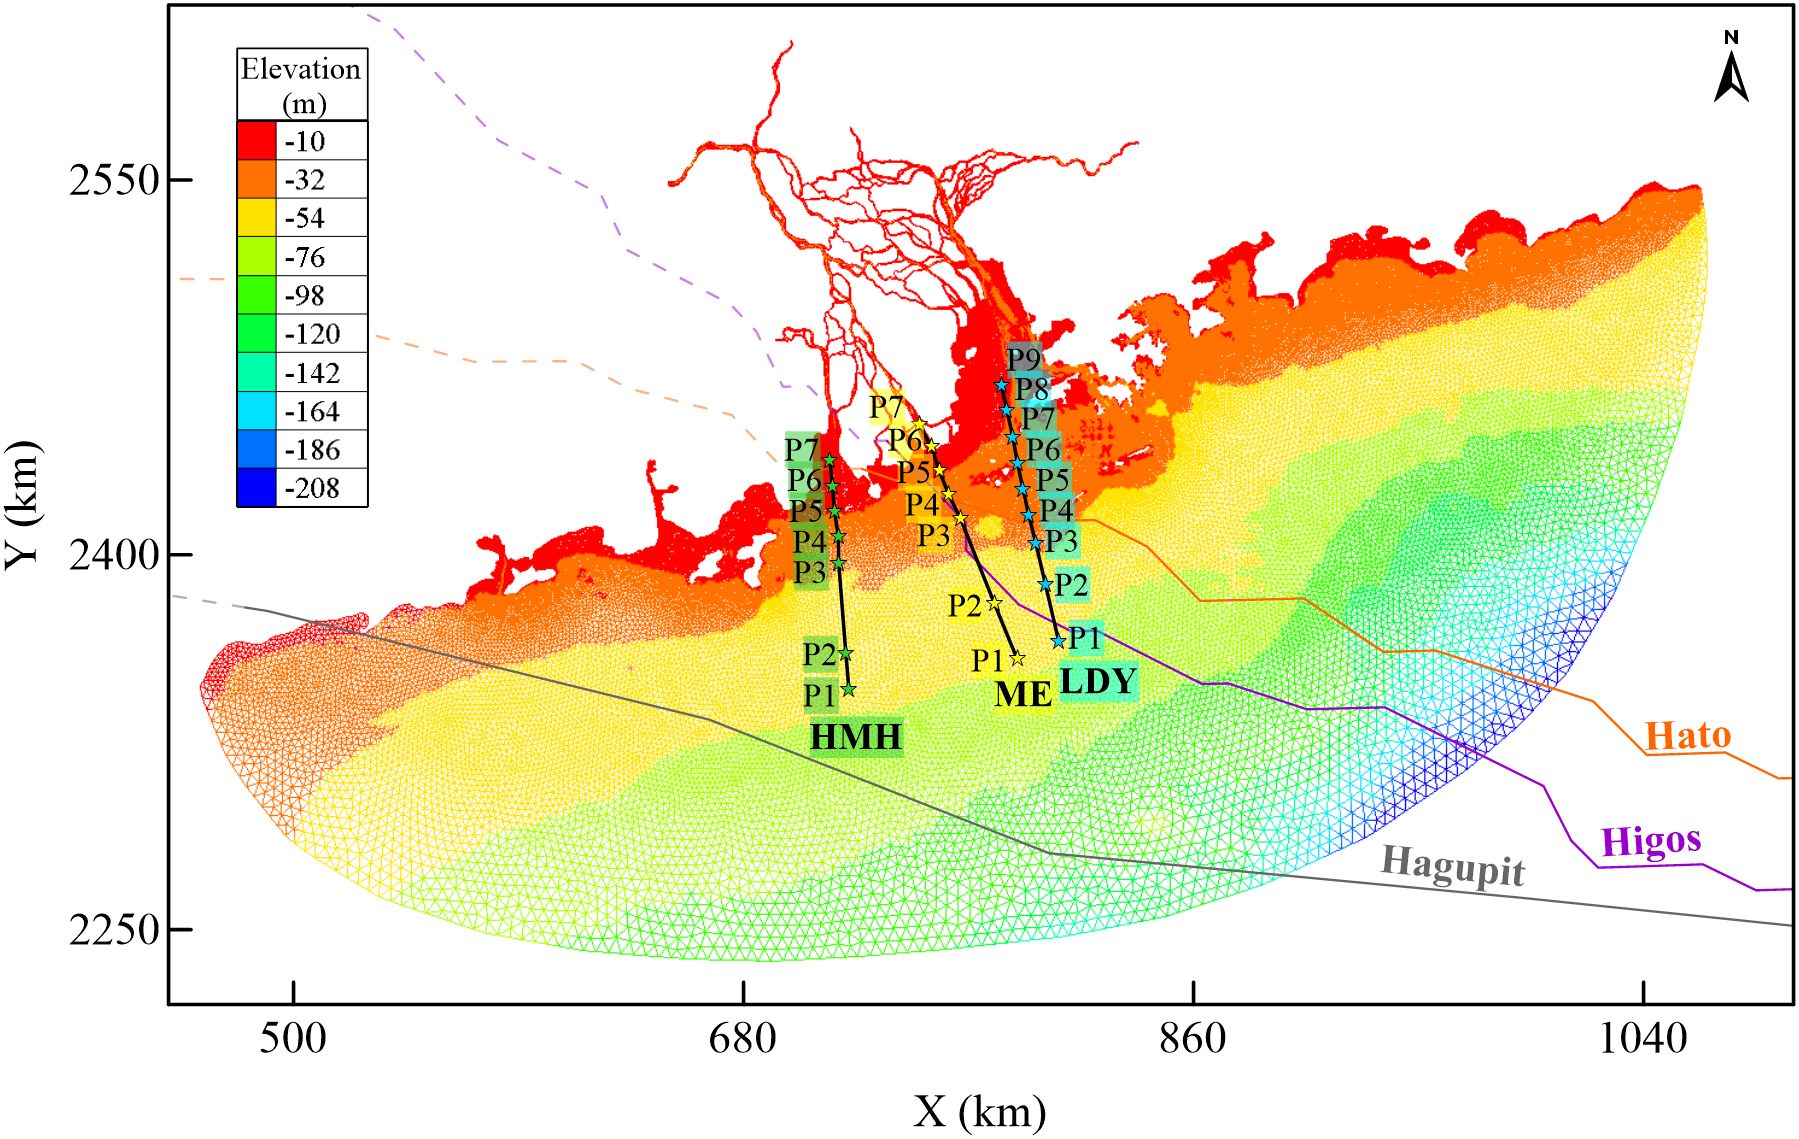
Figure 2. Computational grid and analytical profiles.
The computed time step was 60 s, and the total computation period was 8 days, from 4 days before landfall to 3 days after landfall. The computational setup ensured the stability and applicability of the model.
3.4.4 Model validation
Three parameters were used to evaluate the model performance. The first is the correlation coefficient (r) between the modeled and observed data, which measures the linear relationship between the two values. The second is the root mean square error (RMSE), which can evaluate the relative error between the modeled and observed values. The third is the model skill score (ss), which is a dimensionless value obtained after the standard deviation normalization of the modeled values (Matte et al., 2017; Willmott et al., 1985). These parameters were calculated as follows:
where and are the modeled and observed values, respectively, and is the number of data used for validation. Better simulation results are indicated by and ss values closer to 1 and lower RMSE values.
Validated data for the wind field at Hong Kong and Macau stations were collected from the National Centers for Environmental Information (NCEI) (Figure 1). The validation results and temporal comparisons are shown in Figures 3A–L. Generally, the wind speed simulation results were satisfactory, with , , and RMSE ranging from 1.80 to 3.20 m/s. The wind direction was in accordance with the general trend of observations. Thus, the selected typhoon model is applicable.
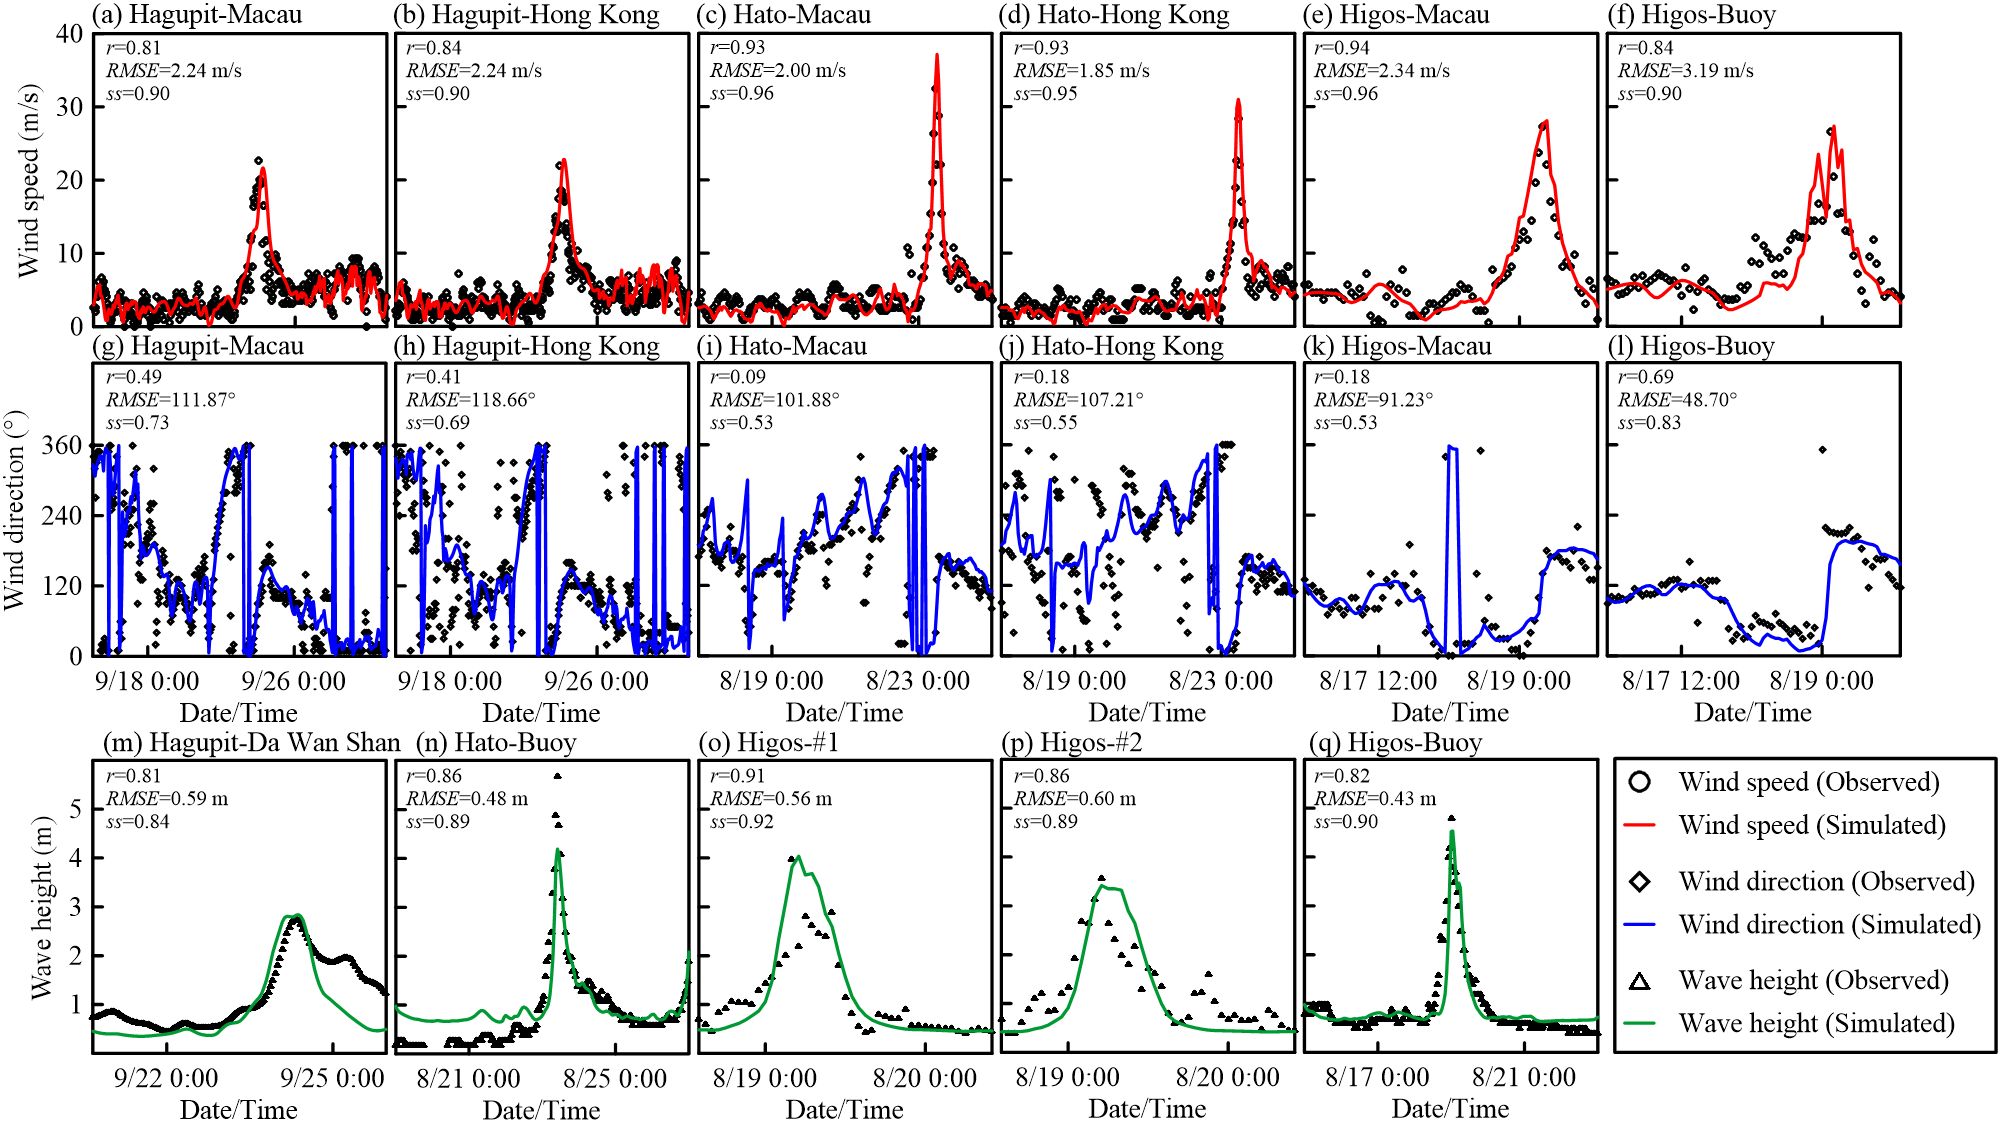
Figure 3. Comparison of simulated and observed wind speed (A–F), wind direction (G–L), and wave height (M–Q).
The wave field data were validated based on the observations collected during the selected typhoons (Figure 1). The resulting validation parameters and temporal comparisons are shown in Figures 3M–Q. The simulation results for wave height were acceptable, with , , and RMSE ranging from 0.43 to 0.60 m. Thus, the model was appropriate for the analysis of wave propagation and dissipation during typhoons.
4 Observation results for Typhoon Higos
4.1 Characteristics of the observed waves
Wave heights at all stations increased significantly during the typhoon, showing patterns similar to wind speed, but with differing peak times (Figures 4A, B). Wave height increased sharply as the typhoon approached, reaching maxima of 4.80 m, 3.98 m, and 3.69 m on August 19, 2020, at 00:00, 04:00, and 05:30 at the buoy station, station #1, and station #2, respectively. Wind speed reached maxima of 26.60 m/s and 27.30 m/s on August 19 at 02:00 and 06:00 at the buoy and Macau stations, respectively. Thus, wave height peaked before wind speed. The time of peak wave height was 2 h earlier than the time of peak wind speed at the buoy station. At stations #1 and #2, the peak wave height occurred 2 h and 0.5 h earlier, respectively, than the time of maximum wind speed at the Macau meteorological station within the ME.
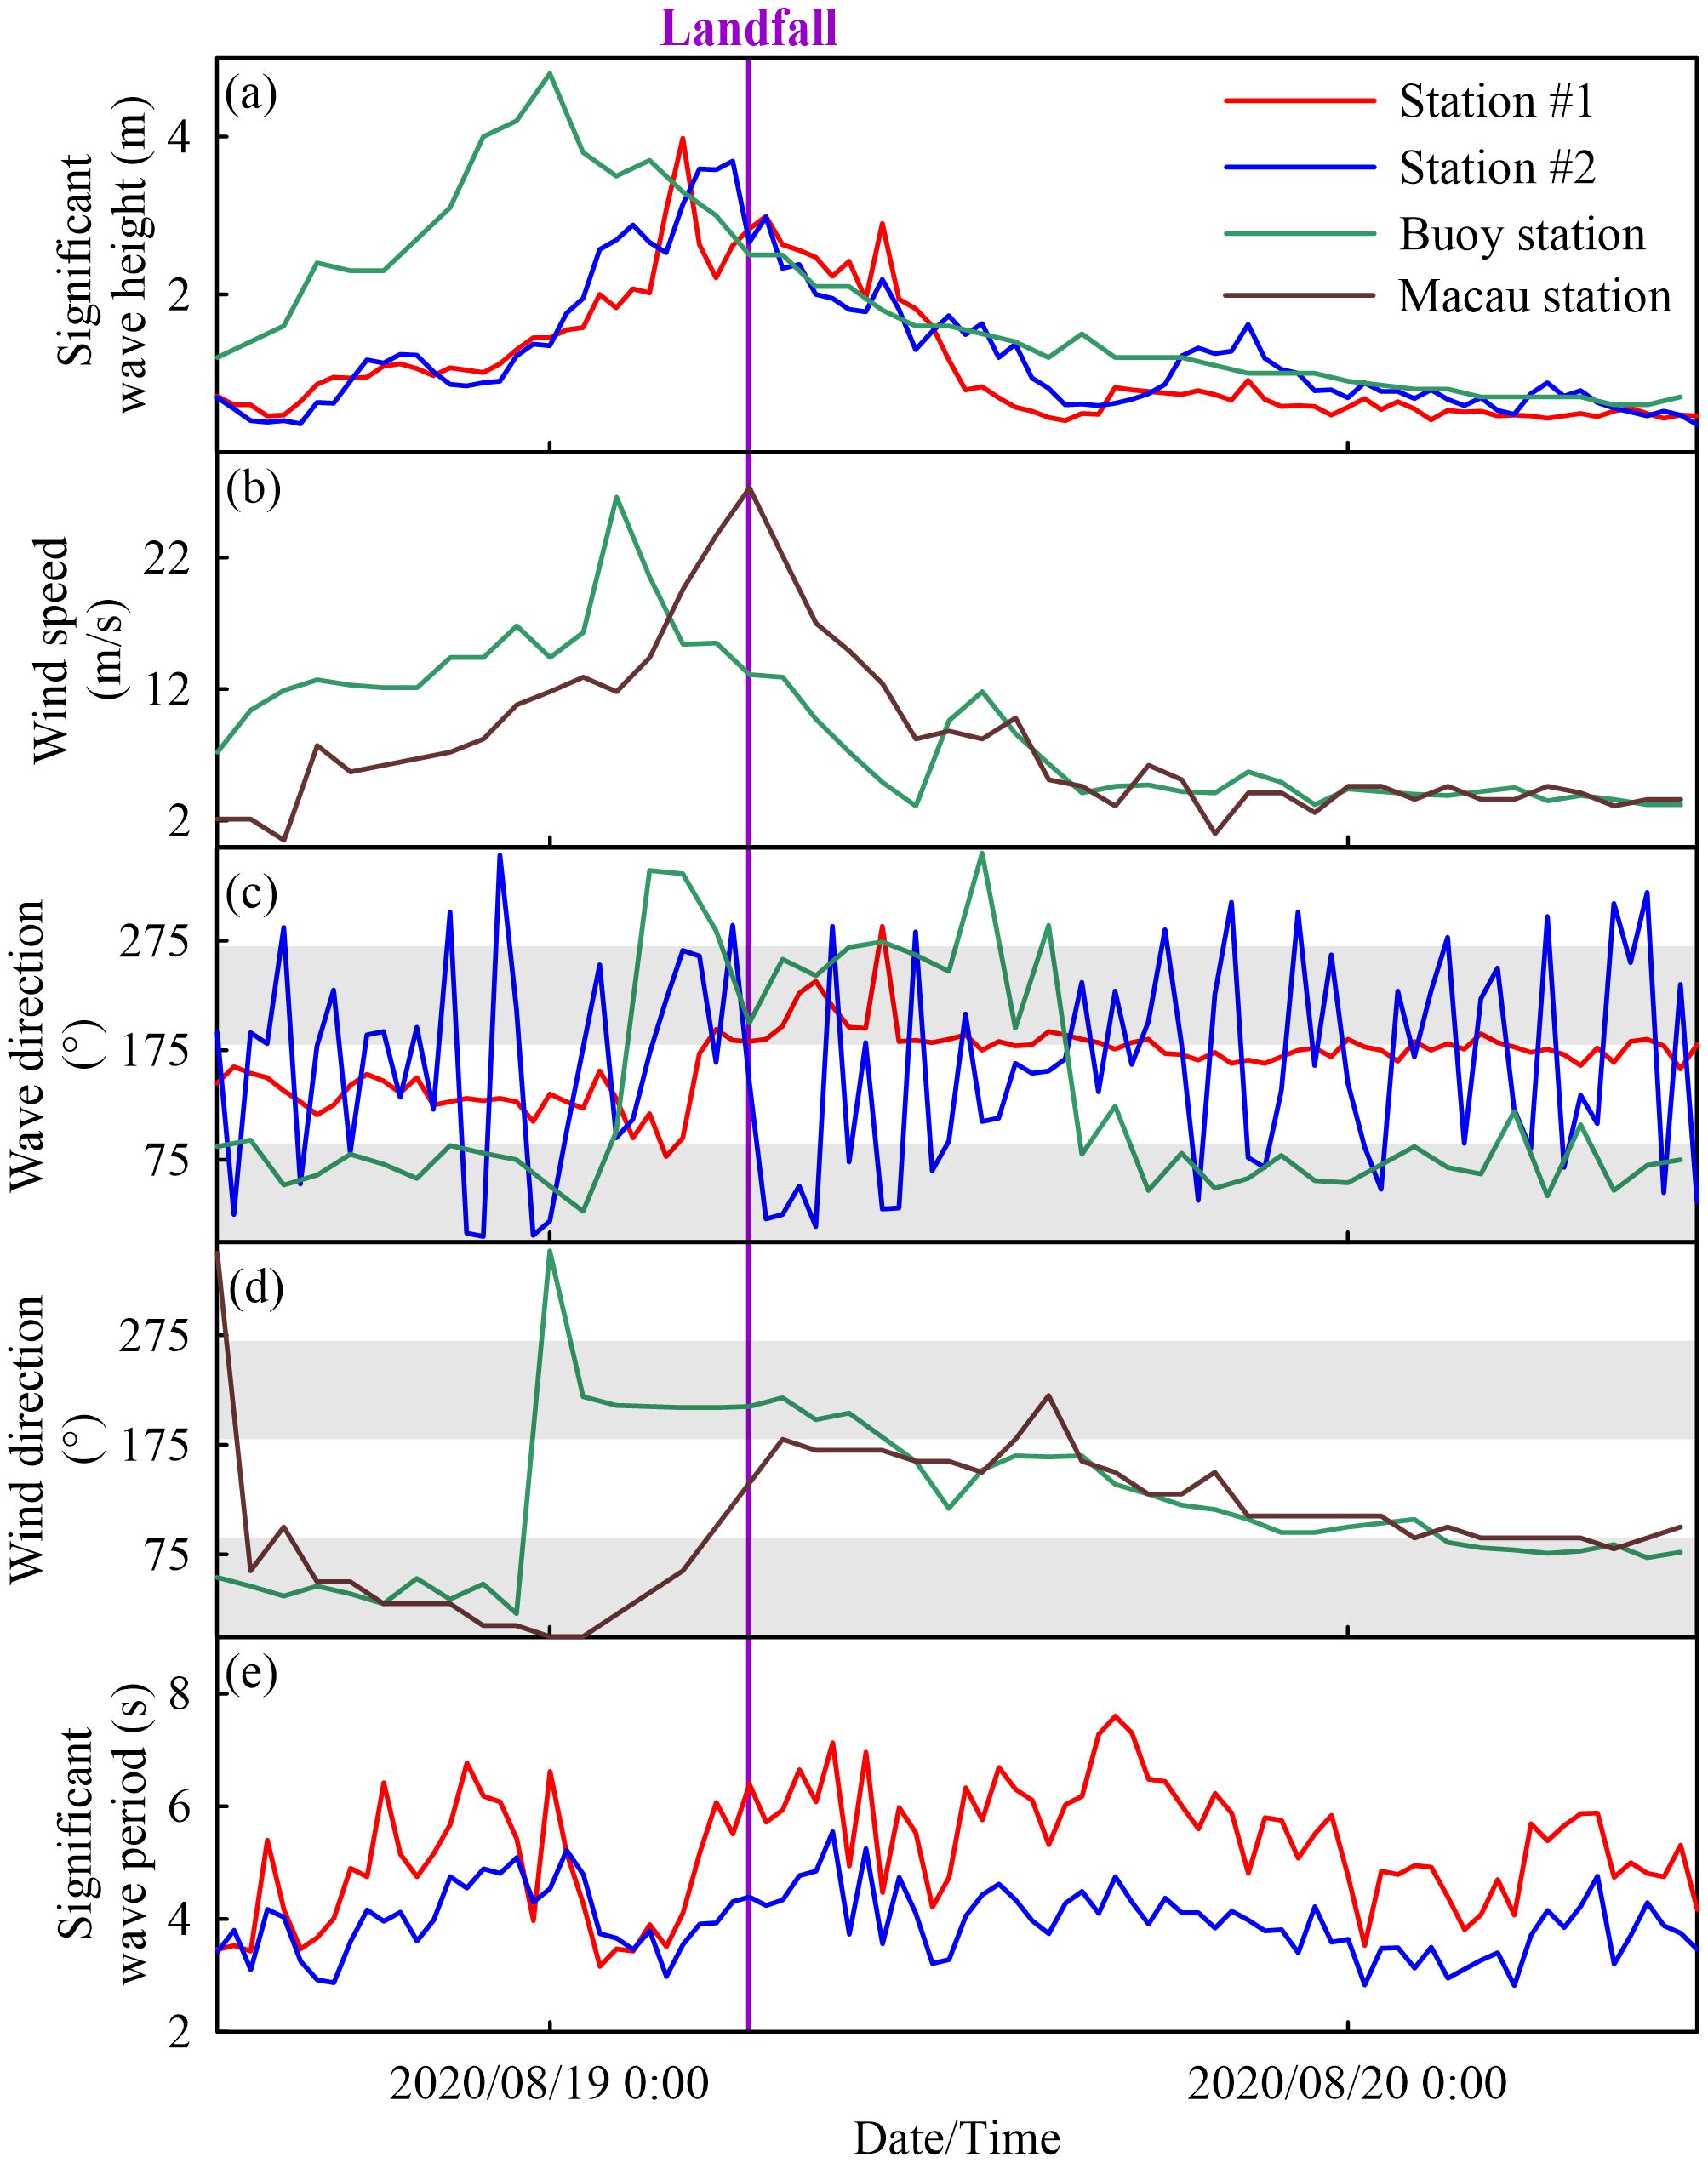
Figure 4. Time series of observation results during Typhoon Higos. (A) Significant wave height, (B) Wind speed, (C) Wave direction, (D) Wind direction, (E) Significant wave period.
The wave and wind directions corresponded to the typhoon cyclone structure, and their fluctuations increased landward (Figures 4C, D). The wave direction captured at station #2 fluctuated strongly due to mouth-bar disturbance driven by the presence of an obstacle at the entry of the estuary. In contrast, the data captured at the buoy station and station #1 were relatively stable. However, the wave direction shifted significantly when the wind speed increased rapidly from 16.3 m/s and 14.4 m/s to its maximum at the buoy station and Macau station, respectively. Specifically, the wind and wave directions both shifted from northeastern to northwestern at the buoy station, while the wave direction shifted from southeastern to southern at station #1 with the wind direction transitioning from northeastern to southern at Macau station. The transition trend indicated that the directions of wind and wave vectors were comparable in this period due to the enhancement of wind force. With the typhoon decaying, the wind directions at both stations gradually transitioned to the east in the counterclockwise direction. The wave direction presented another shift from northwestern back to northeastern on August 19 at 15:00 at the buoy station, while the wave vectors remained in the south at station #1. Thus, the forcing intensity of wind to wave changes with typhoon movement; the significant transition of wind and wave directions aligned with the approach of typhoon cyclone structure. Moreover, the recovery period of wave direction was longer at the outlet of ME than in the open sea.
The temporal variation in the wave period had no apparent regularity but showed similar trends at stations #1 and #2 (Figure 4E). The average wave periods were 5.19 s and 3.96 s at stations #1 and #2, respectively, indicating a landward attenuation of the wave period. The wave period at stations #1 and #2 shortened during the peak wave height, which could be caused by the strong wave current interaction due to the current having a regulated effect on the wave period during typhoons (Cui et al., 2012).
4.2 Variation in wave composition
Wind waves were the dominant component of waves while the typhoon approached at both stations (Figure 5A). The wave steepness sharply increased from 0.043 and 0.041 to 0.171 and 0.187 at stations #1 and #2, respectively, indicating enhanced instability of wave structure and the wind waves composing the wave field in the mouth-bar region of ME under the intense typhoon wind force. After the typhoon landfall, the wave composition remained wind wave-dominant at station #2, while the composition gradually transitioned to immature swell dominance at station #1. With the wind force continuously decaying, the wave steepness showed a declining trend, reducing to 0.019 and 0.066 on August 19 at 12:30 (i.e., 6.5 h after typhoon landfall) at stations #1 and #2, respectively. Subsequently, the wave steepness at station #1 remained below 0.025, while the value at station #2 stayed above 0.025. The decreased in wave steepness indicated a rapid decay of the intense wind wave component and the reappearance of the swell component in the coastal regions. Moreover, the spatial variation of wave composition pointed out that the wind waves persisted longer within the mouth-bar region compared to its outer area.
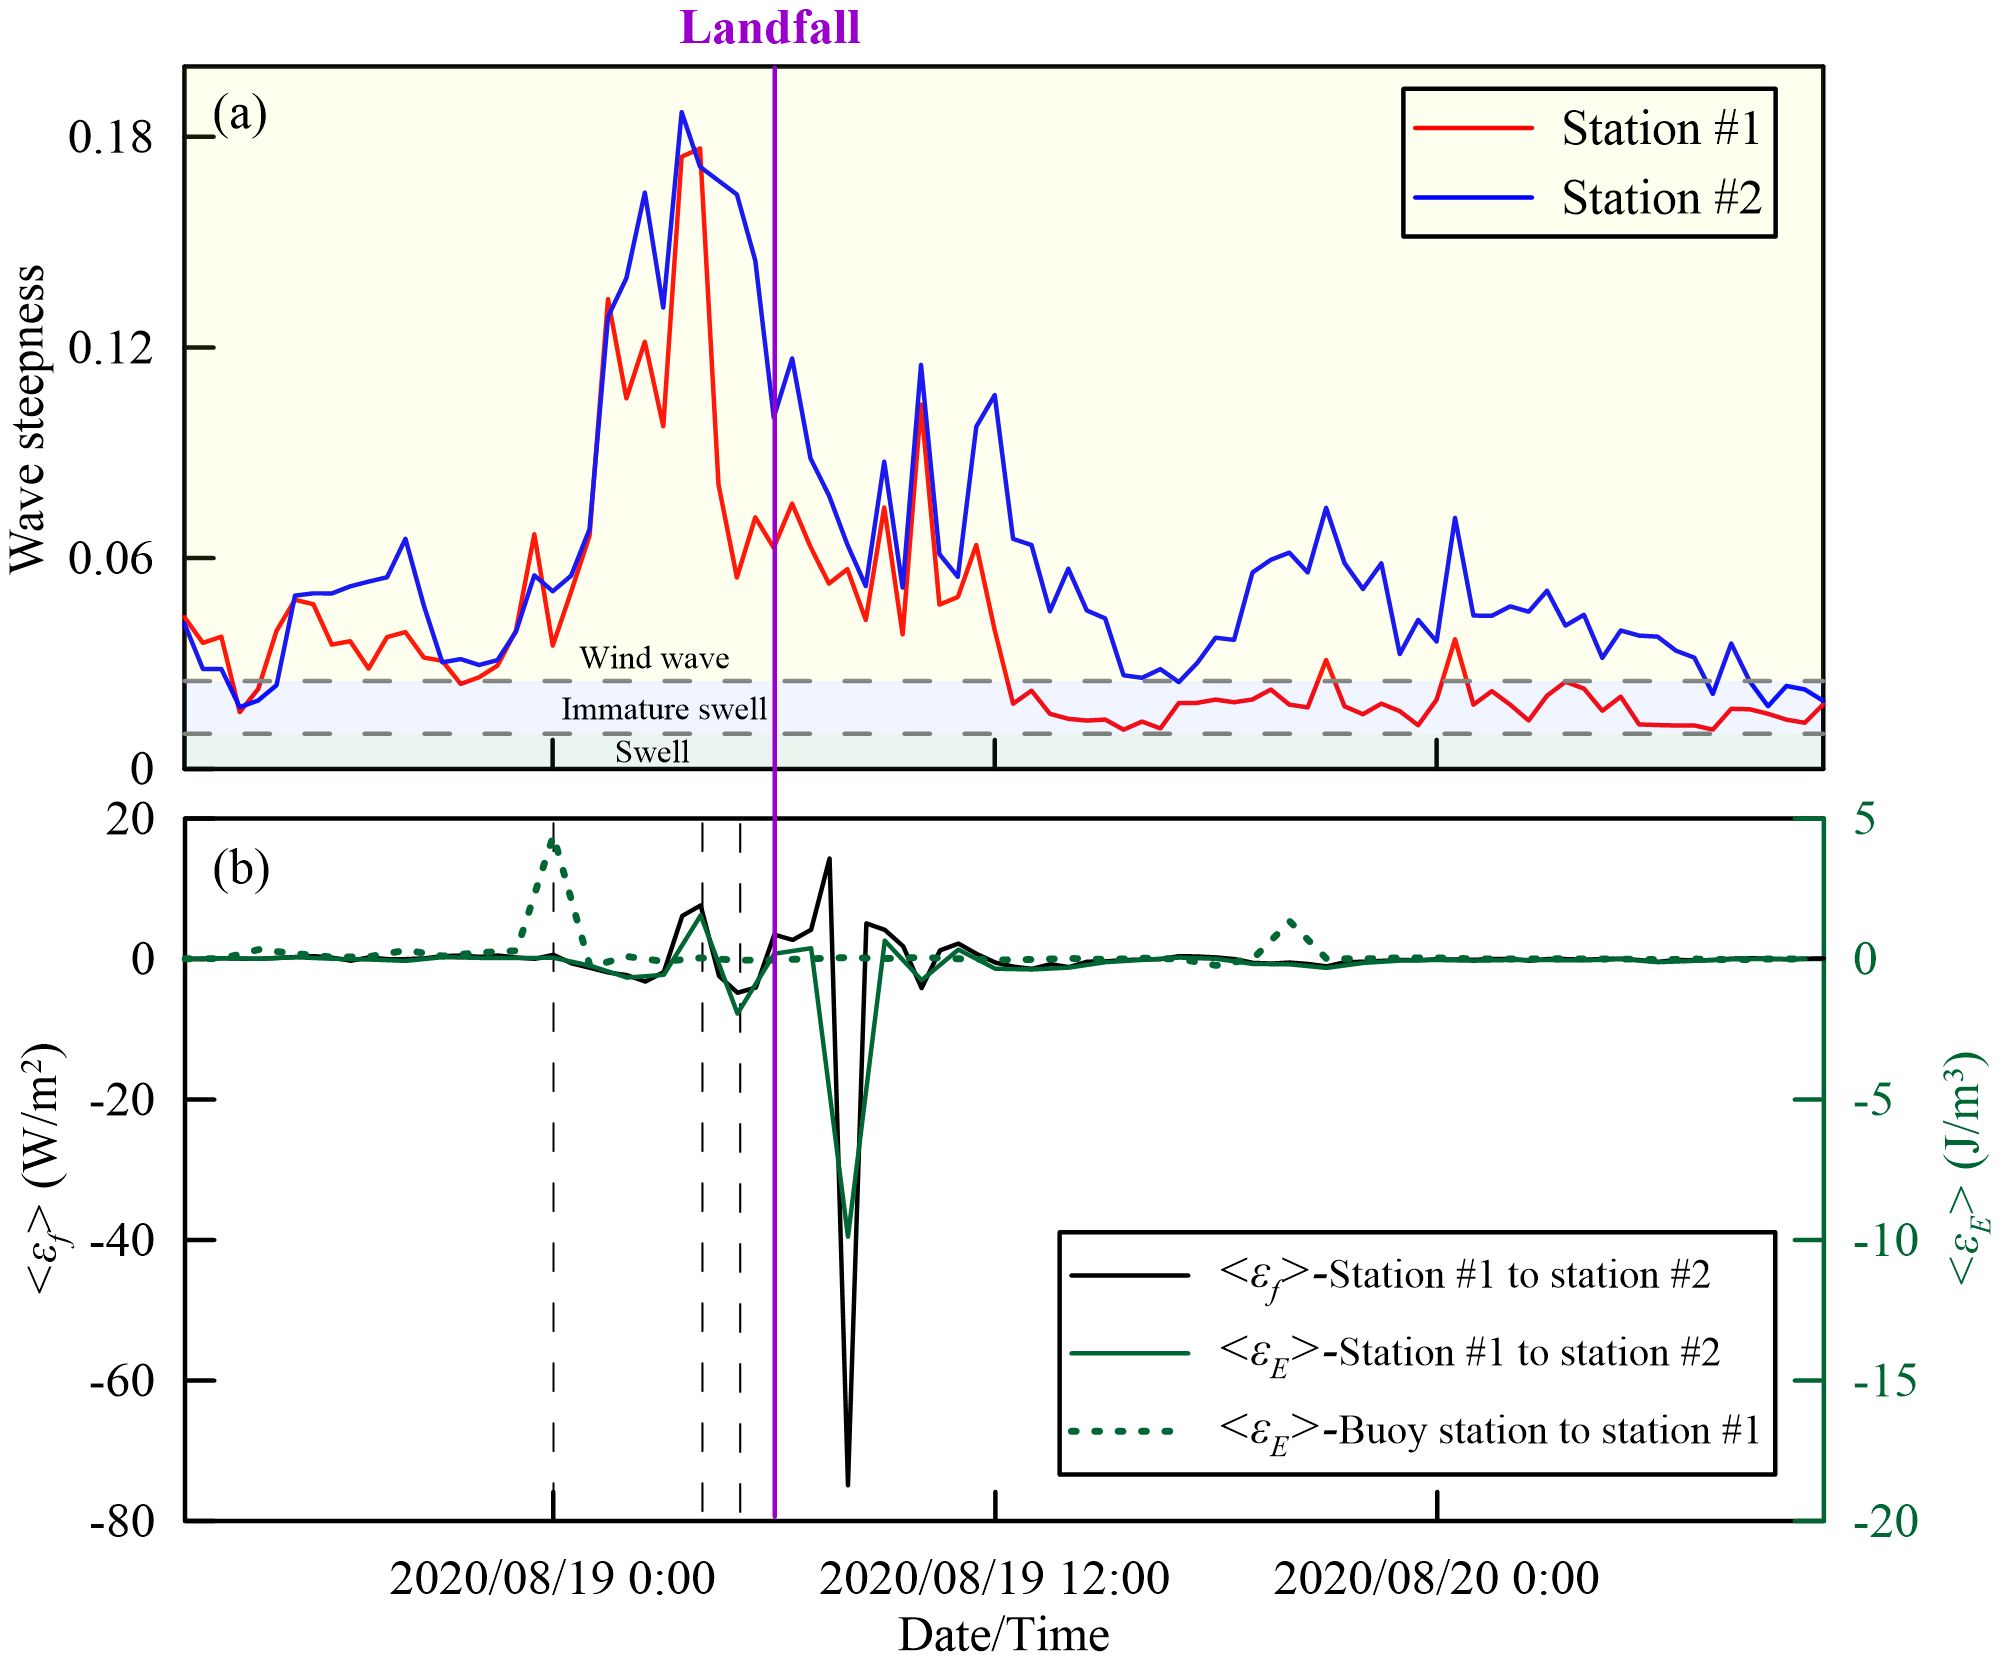
Figure 5. Time series of (A) wave steepness and (B) wave dissipation rate during Typhoon Higos. Gray dotted lines represent the time when the wave heights reached the peak at buoy station and stations #1 and #2.
4.3 Variation in wave dissipation and convergence
The intensity of wave dissipation and convergence increased as the typhoon approached (Figure 5B). The absolute value of the dissipation rate from the buoy station to station #1 increased from August 18 at 15:00 to August 19 at 01:00, with wave height reaching its maximum on August 19 at 00:00 at the buoy station. The absolute value of the dissipation rate from station #1 to station #2 increased from August 19 at 00:00 to August 19 at 14:30, with wave height reaching the maxima on August 19 at 04:00 and 05:00 at stations #1 and #2, respectively. Thus, the dissipation rate increased with the intensification of the wave field, which resulted from the approach of a typhoon.
Wave propagation from the buoy station to station #1 was dominated by the dissipation process (Figure 5B). The wave energy dissipation rate reached its maxima of 4.40 J/m3 when the wave height was the highest at the buoy station. The temporal integration of the wave energy dissipation rate was 7.17 J·h/m3, indicating that the positive component was much larger than the negative component (Table 1). Thus, wave dissipation dominated the wave propagation from the open sea to the outer region of the mouth bar in ME.
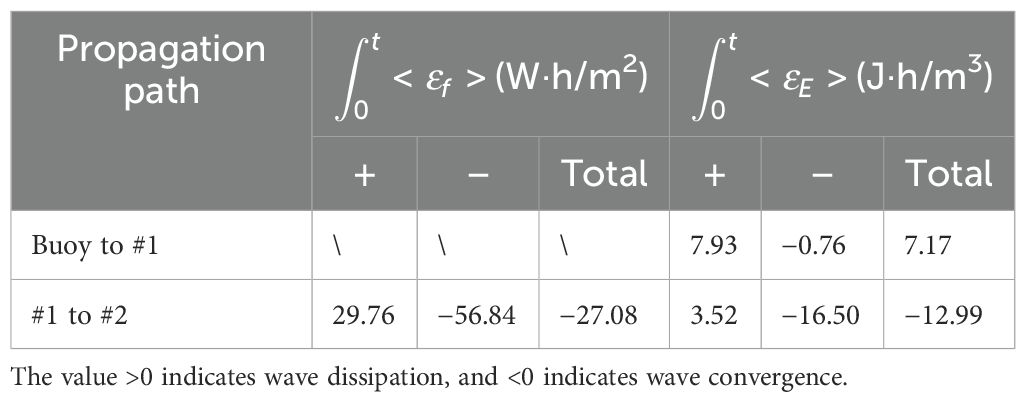
Table 1. Temporal integration of wave dissipation rate between observation stations.
Wave propagation from station #1 to #2 was alternately dominated by the processes of dissipation and convergence (Figure 5B). When the wave height at station #1 reached its maximum, wave dissipation dominated the wave propagation with a dissipation rate of 7.64 W/m2. When the wave height at station #2 reached its maximum, wave convergence dominated the wave propagation, and the dissipation rate was −4.79 W/m2. After the typhoon landfall, the fluctuations of dissipation rate gradually weakened and remained in negative values as the typhoon decayed. The temporal integrals of the wave dissipation rates and wave energy dissipation rates were −27.08 W·h/m2 and −12.99 J·h/m3, respectively, demonstrating that the negative components were greater than the positive components (Table 1). Thus, wave propagation within the mouth-bar region was dominated by wave convergence, and enhancement of both wave dissipation and convergence occurred during typhoons.
5 Numerical simulation results
5.1 Wind field
Simulated wind fields during Typhoon Hagupit are shown in Figures 6A–H. The wind field before the typhoon landfall contained two regions of high wind speed, which coincided with the movement of the typhoon center. The maximum spatial area with wind speeds >20 m/s occurred on September 24, 2008, at 03:00 (3.75 h before typhoon landfall), covering the coastal areas from Jiangmen to Huizhou, and wind speed gradually decreased from west to east. Wind direction corresponded to the typhoon cyclone structure before landfall, while the study area was dominated by onshore wind after landfall.
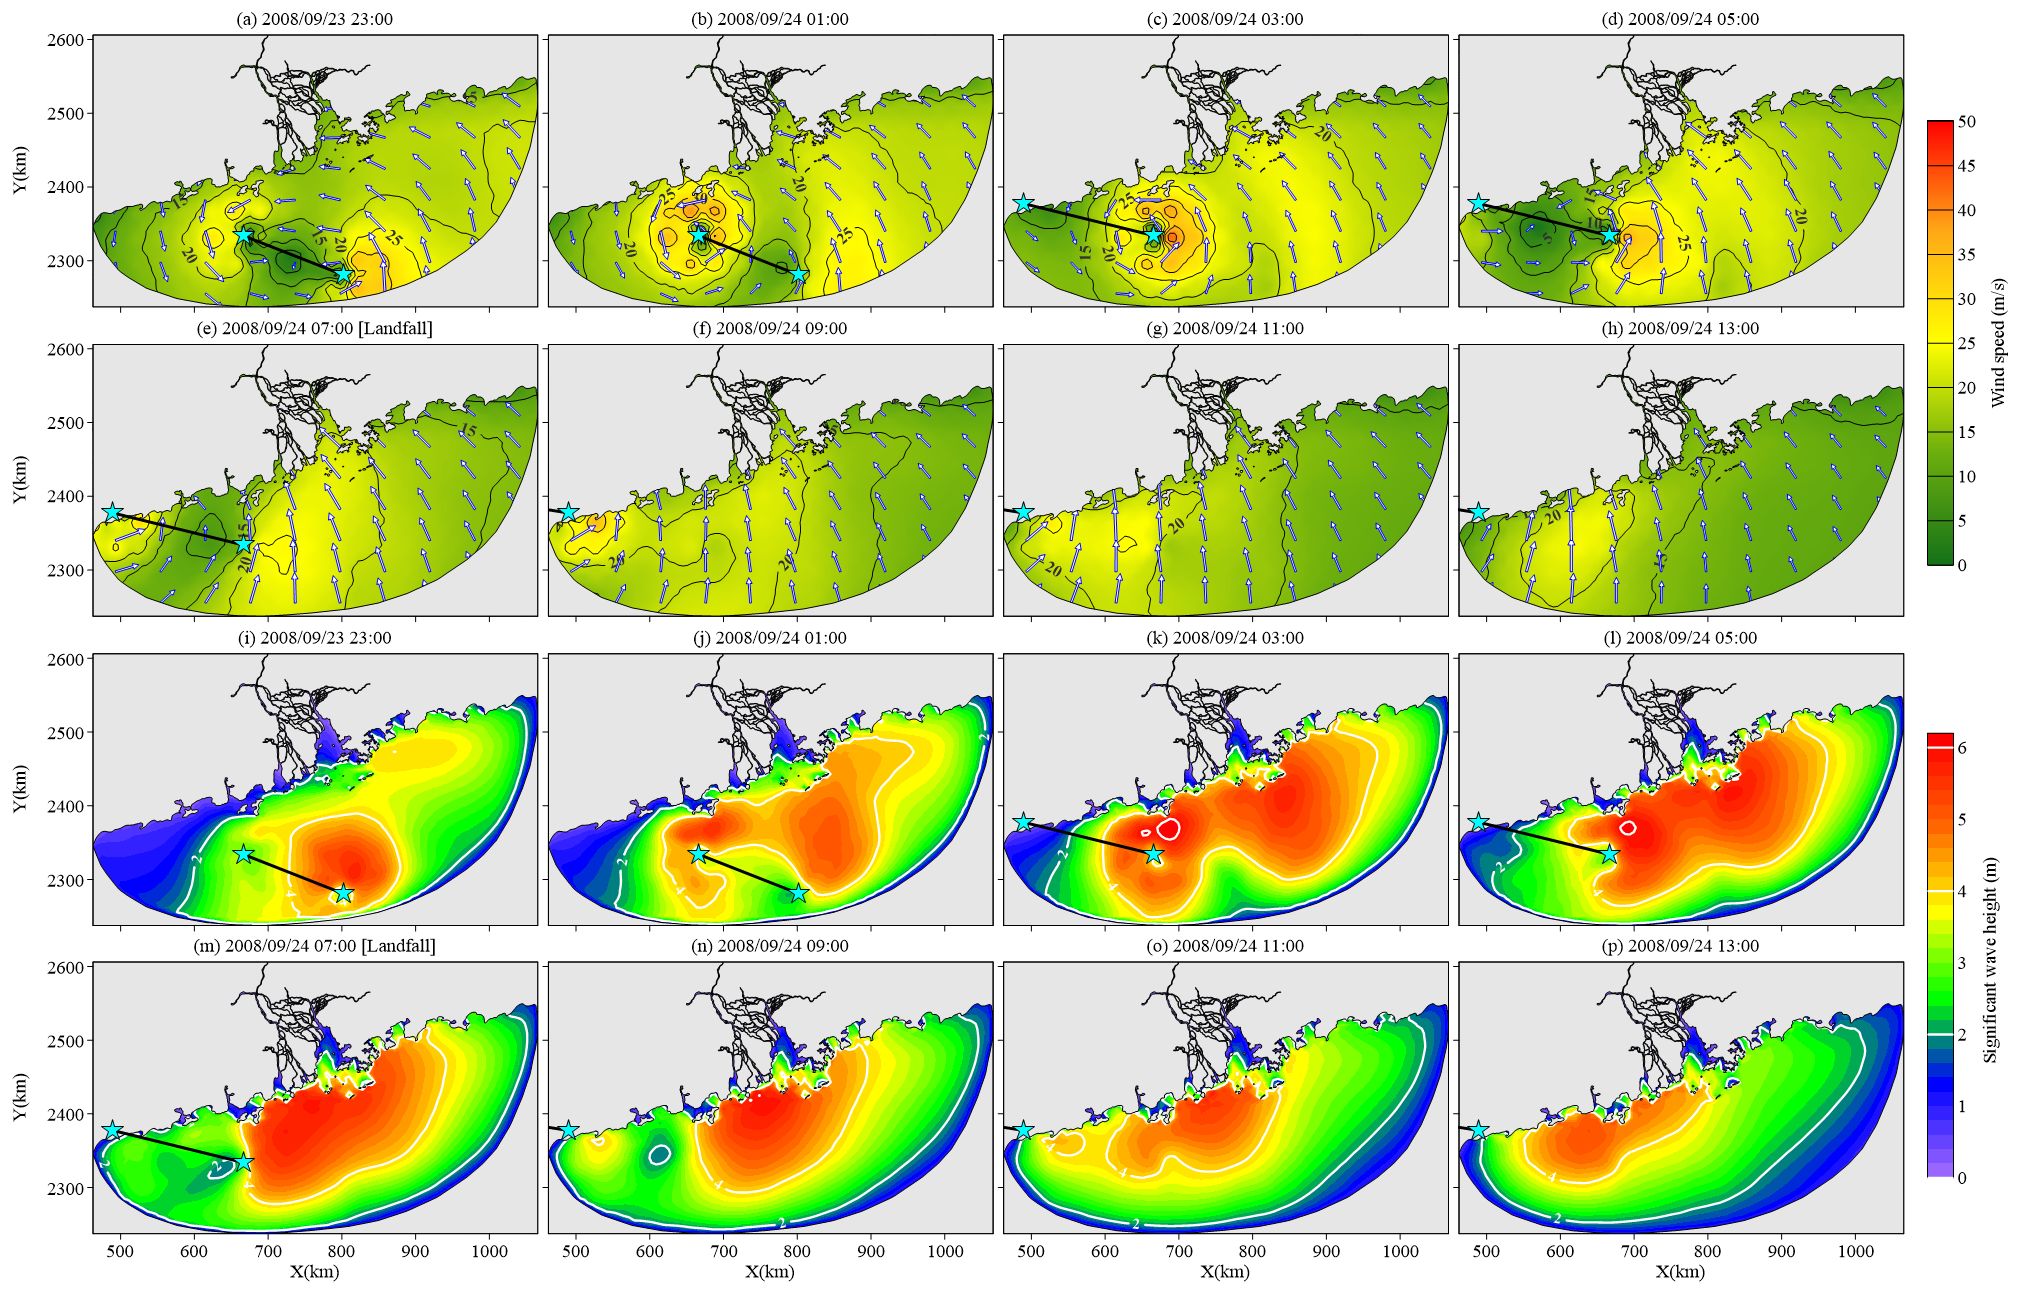
Figure 6. (A–H) Simulated wind field and (I–P) simulated wave field at 2-h intervals during Typhoon Hagupit. Vectors represent wind direction. Panels (E, M) represent the results closest to the landing time. Blue stars indicate the location of the typhoon center; lines between a pair of stars indicate transition of the typhoon between those points.
Simulated wind fields during Typhoon Hato are shown in Figures 7A–H. The wind fields contained one region of high wind speed, which was located near the typhoon center and rotated counterclockwise. The maximum spatial area with wind speeds over 20 m/s occurred on August 23, 2017, at 09:00 (3.83 h before typhoon landfall), covering the coastal regions from Zhuhai to Shenzhen, with wind speed gradually decreasing from the typhoon center to the outer bands. Wind direction corresponded to the typhoon cyclone structure prior to landfall, whereas the western part of the study area was dominated by offshore and longshore winds, while the eastern part of the study area was dominated by onshore wind after landfall.
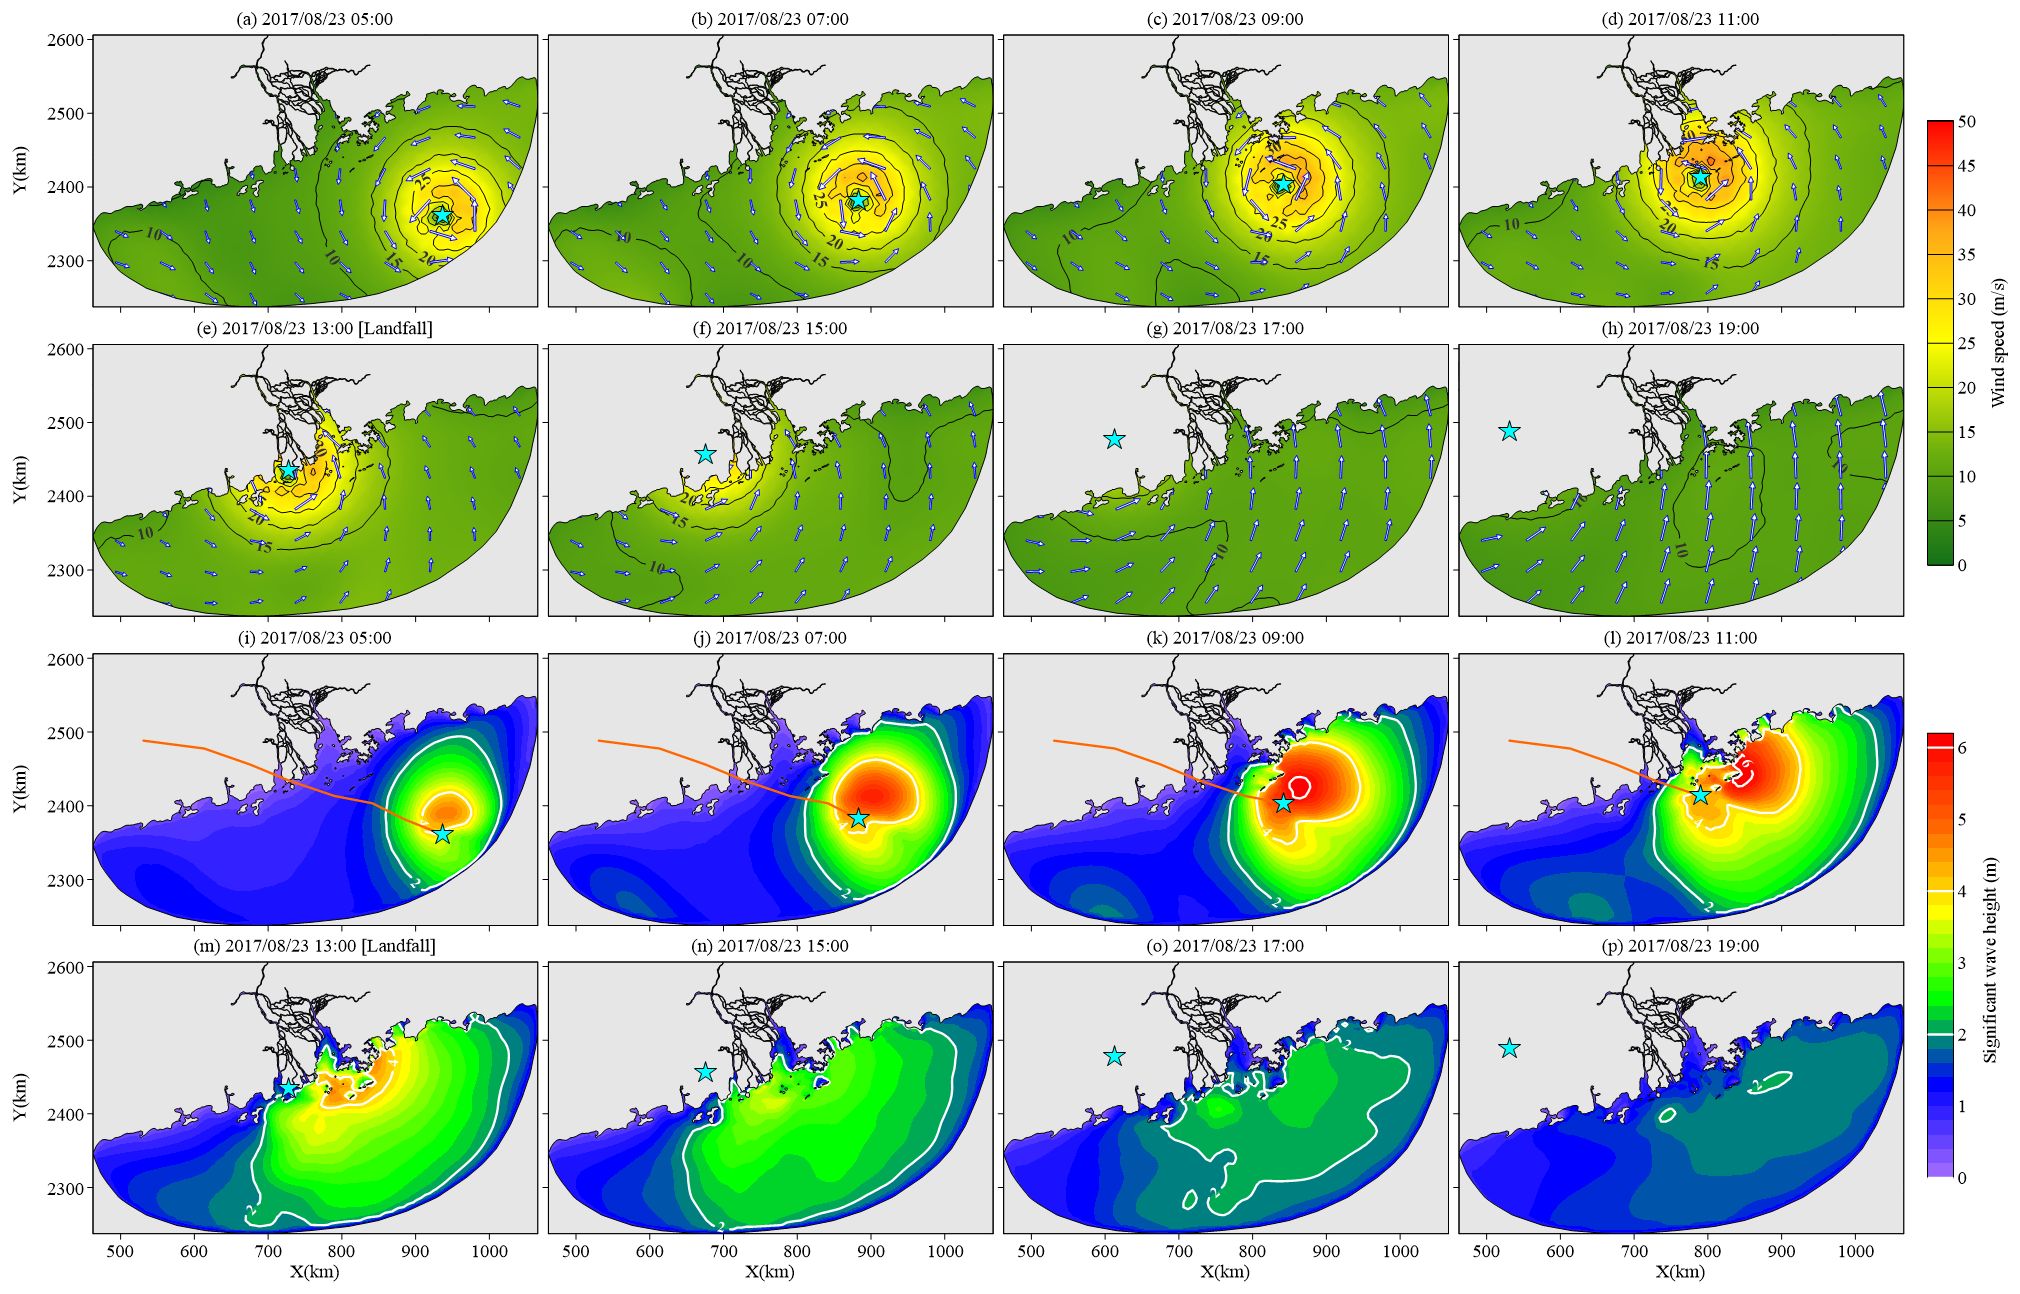
Figure 7. (A–H) Simulated wind field and (I–P) simulated wave field at 2-h intervals during Typhoon Hato. Vectors represent wind direction. Panels (E, M) represent the results closest to the landing time. Blue stars indicate the location of the typhoon center, and the orange lines indicate the typhoon tracks.
Simulated wind fields during Typhoon Higos are shown in Figures 8A–H. Their characteristics were similar to those during Typhoon Hato due to their similar tracks and landing locations. However, the maximum value of wind speed and the scale of typhoon cyclone structures were smaller than those during Hato due to the weaker intensity of Higos. Specifically, the maximum spatial area of the region with wind speeds over 20 m/s occurred on August 19, 2020, at 02:00 (4 h before typhoon landfall), covering the coastal region from Zhuhai to Hong Kong and with wind speed gradually decreasing from the typhoon center to the outer bands.
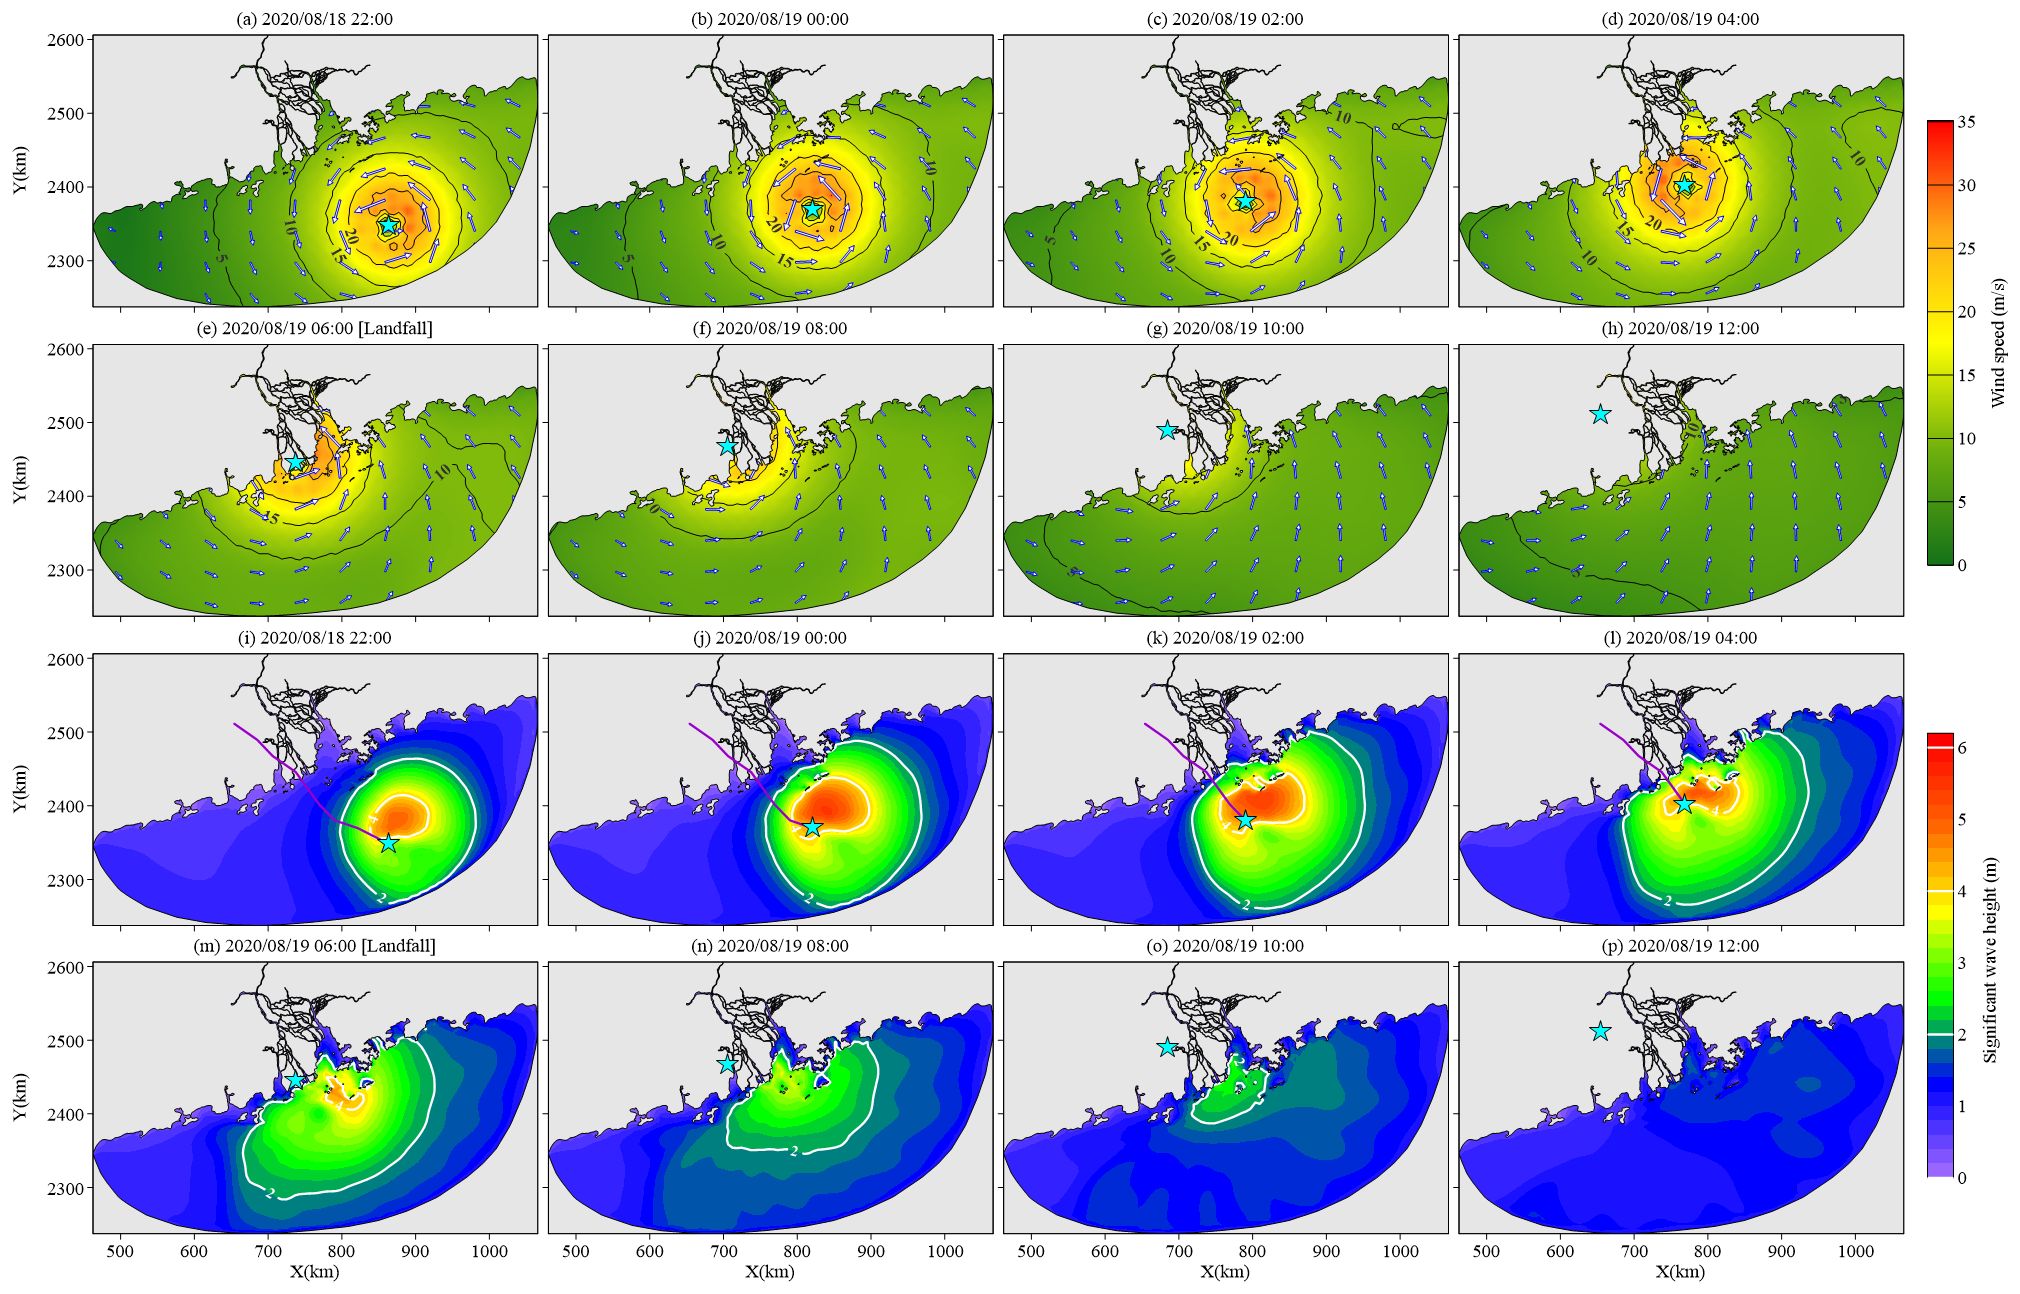
Figure 8. (A–H) Simulated wind field and (I–P) simulated wave field at 2-h intervals during Typhoon Higos. Vectors represent wind direction. Panels (E, M) represent the results closest to the landing time. Blue stars indicate the location of the typhoon center, and purple lines indicate the typhoon tracks.
5.2 Wave steepness
Typhoon-induced surface waves were predominantly composed of wind waves. The region with values exceeding 0.025 occupied over 99.37%, 99.82%, and 97.42% of the total study area at the landfall time of Typhoons Hagupit (Figure 9C), Hato (Figure 9G), and Higos (Figure 9K), respectively.
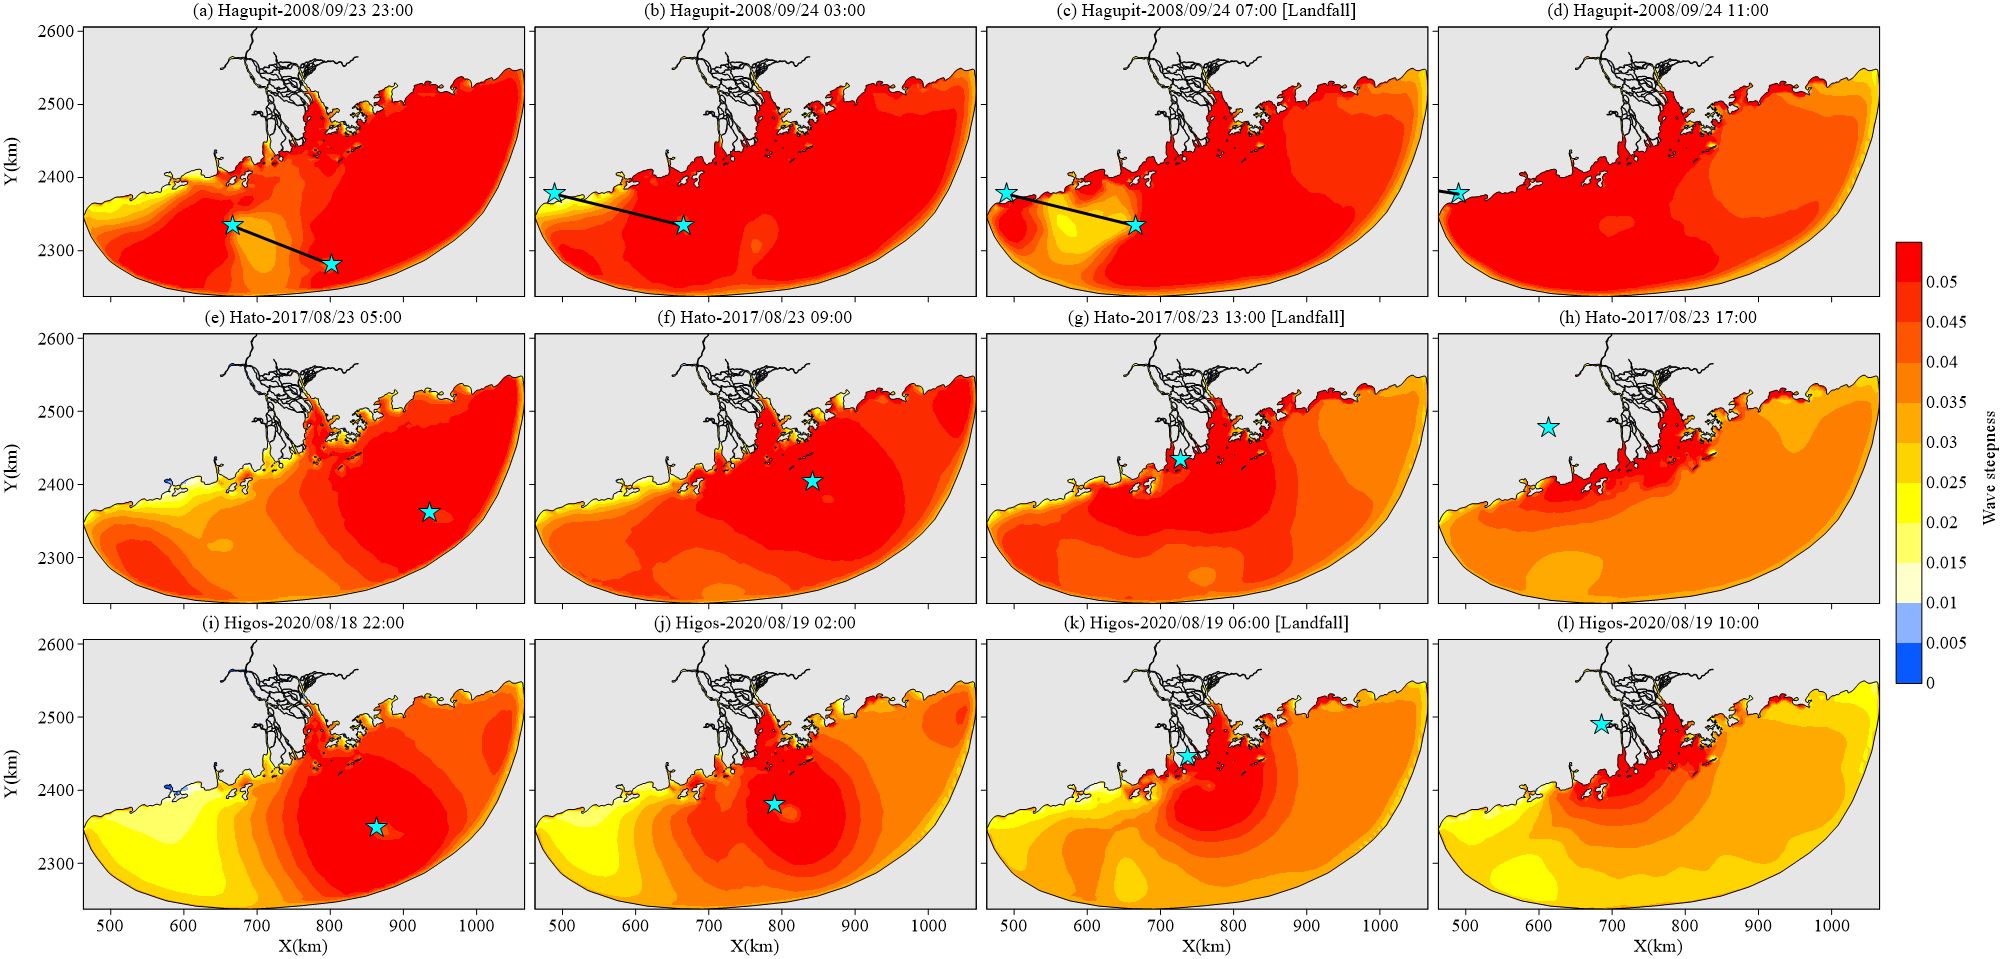
Figure 9. Simulated wave steepness at 4-h intervals during Typhoons (A–D) Hagupit, (E–H) Hato, and (I–L) Higos. Panels (C, G, K) represent the results closest to the landing time. Blue stars indicate the location of the typhoon center; lines between a pair of stars indicate transition of the typhoon between those points.
During Typhoon Hagupit, the region with wave steepness lower than 0.025 corresponded to the outer band of typhoon cyclone structures (Figures 9A–C), which were in lower wind speed before typhoon landfall (Figures 6A–E); subsequently, the values gradually weakened with typhoon decaying (Figure 9D). During Typhoon Hato, the wave steepness at the coastal areas from Jiangmen to Maoming was lower than 0.025 and gradually increased as the typhoon approached, while the values remained in high intensity in the rest of the study area (Figures 9E–G); then, the values decayed more rapidly in the open sea than in the estuarine regions after typhoon landfall (Figure 9H). During Typhoon Higos, the region with a wave steepness lower than 0.025 covered the coastal and offshore regions from Jiangmen to Zhanjiang, with values showing an increasing tendency before typhoon landfall (Figures 9I–K); subsequently, the values decreased after typhoon landfall, whereas the estuarine regions had higher values than the open sea (Figure 9L).
5.3 Wave height and energy distribution
Wave energy was calculated through the wave height, indicating that the temporal and spatial variations of wave height directly reflect the wave energy evolution within the study area during typhoons. The spatial extension of typhoon-induced wave fields coincided with the disturbance area of high wind speeds and the intense wave field located at the east side of the typhoon center (Figures 6I–P, 7I–P, 8I–P). The maximum wave heights within the study area were 5.74 m, 5.59 m, 6.39 m, 6.14 m, 5.88 m, 6.06 m, 5.68 m, and 5.28 m; 4.75 m, 5.79 m, 6.16 m, 6.49 m, 5.11 m, 3.84 m, 2.65 m, and 2.12 m; and 4.93 m, 5.47 m, 5.38 m, 5.23 m, 4.97 m, 3.75 m, 2.78 m, and 1.77 m sequentially at the simulated time during Typhoons Hagupit, Hato, and Higos, respectively (Figures 6I–P, 7I–P, 8I–P). The results were in positive correlation with the temporal variations of the highest typhoon wind speed, whereas the values of Hato were overall higher than those of Higos and comparable with Hagupit’s results before typhoon landfall and then reduced more rapidly when typhoons decayed.
The simulated wave fields during Typhoon Hagupit are shown in Figures 6I–P. Two regions of intense wind speed induced two regions of high wave height and then gradually merged as the typhoon moved landward. The maximum area with wave heights >2 m extended from the coastal regions of Maoming to Jieyang and covered over 79% of the coastline of Guangdong Province. Wave energy dissipations were centrally radiated, and the spatial dissipations were sharper toward the shore compared with those toward the open sea. Beyond that, the complex typhoon structures (Figures 6A–H) induced irregular wave fields, indicating that the spatial regularity of wave energy was changing with no apparent trend.
In contrast, the typhoon structures of Hato and Higos were regular and compact (Figures 7I–P, 8I–P). The induced wave fields were approximately circular, and their spatial expansions were smaller than those during Hagupit (Figures 6I–P, 7I–P, 8I–P). The region of wave heights >2 m kept expanding and covered over 45% and 30% of the coastline of Guangdong Province during Hato and Higos, respectively, while the significantly intense wave fields (i.e., wave height >4 m) had a slighter expansion and shifted corresponding to the typhoon movement. Along the moving tracks of typhoons, the waves propagated farther on their east sides and induced the non-negligible risks of intense waves attacks on the eastern coast of Guangdong, even though the typhoons did not directly make landfall in this region. Moreover, the wave height maintained two regions with high values within the offshore area of ME after Hato’s landfall (Figure 7N), the inner one located at the mouth-bar region and the second one located on the southwestern side of Da Wan Shan islands. The maximum wave heights in the inner and outer regions were 3.84 m and 3.59 m, respectively. In contrast, the wave field only maintained one region in high wave energy at the mouth-bar region of ME after Higos’s landfall, and the maximum wave height was 3.49 m (Figure 8N).
6 Discussion
6.1 Impacts of estuarine configuration and morphology change on wave propagation and dissipation
The PRE contains multiple estuarine configurations, mainly including the bell-shaped bays (i.e., LDY and HMH) and a prismatic estuary upstream into the mainstream of the Xijiang River (i.e., ME) (Figure 1). In addition, the morphological changes from the open sea to the estuarine regions had critical effects on wave propagation and induced wave dissipation and convergence. Thus, three analytical profiles were set up in the central part of LDY, ME, and HMH, starting from the 50-m isobaths, with analysis points inside the 30-m isobaths spaced equally (Figures 2, 10A). The NDR was calculated from 12 h before the typhoon landfall to 12 h after landfall (Figure 10B), and the temporal variation of wave dissipation rate of each profile is shown in Figure 11.
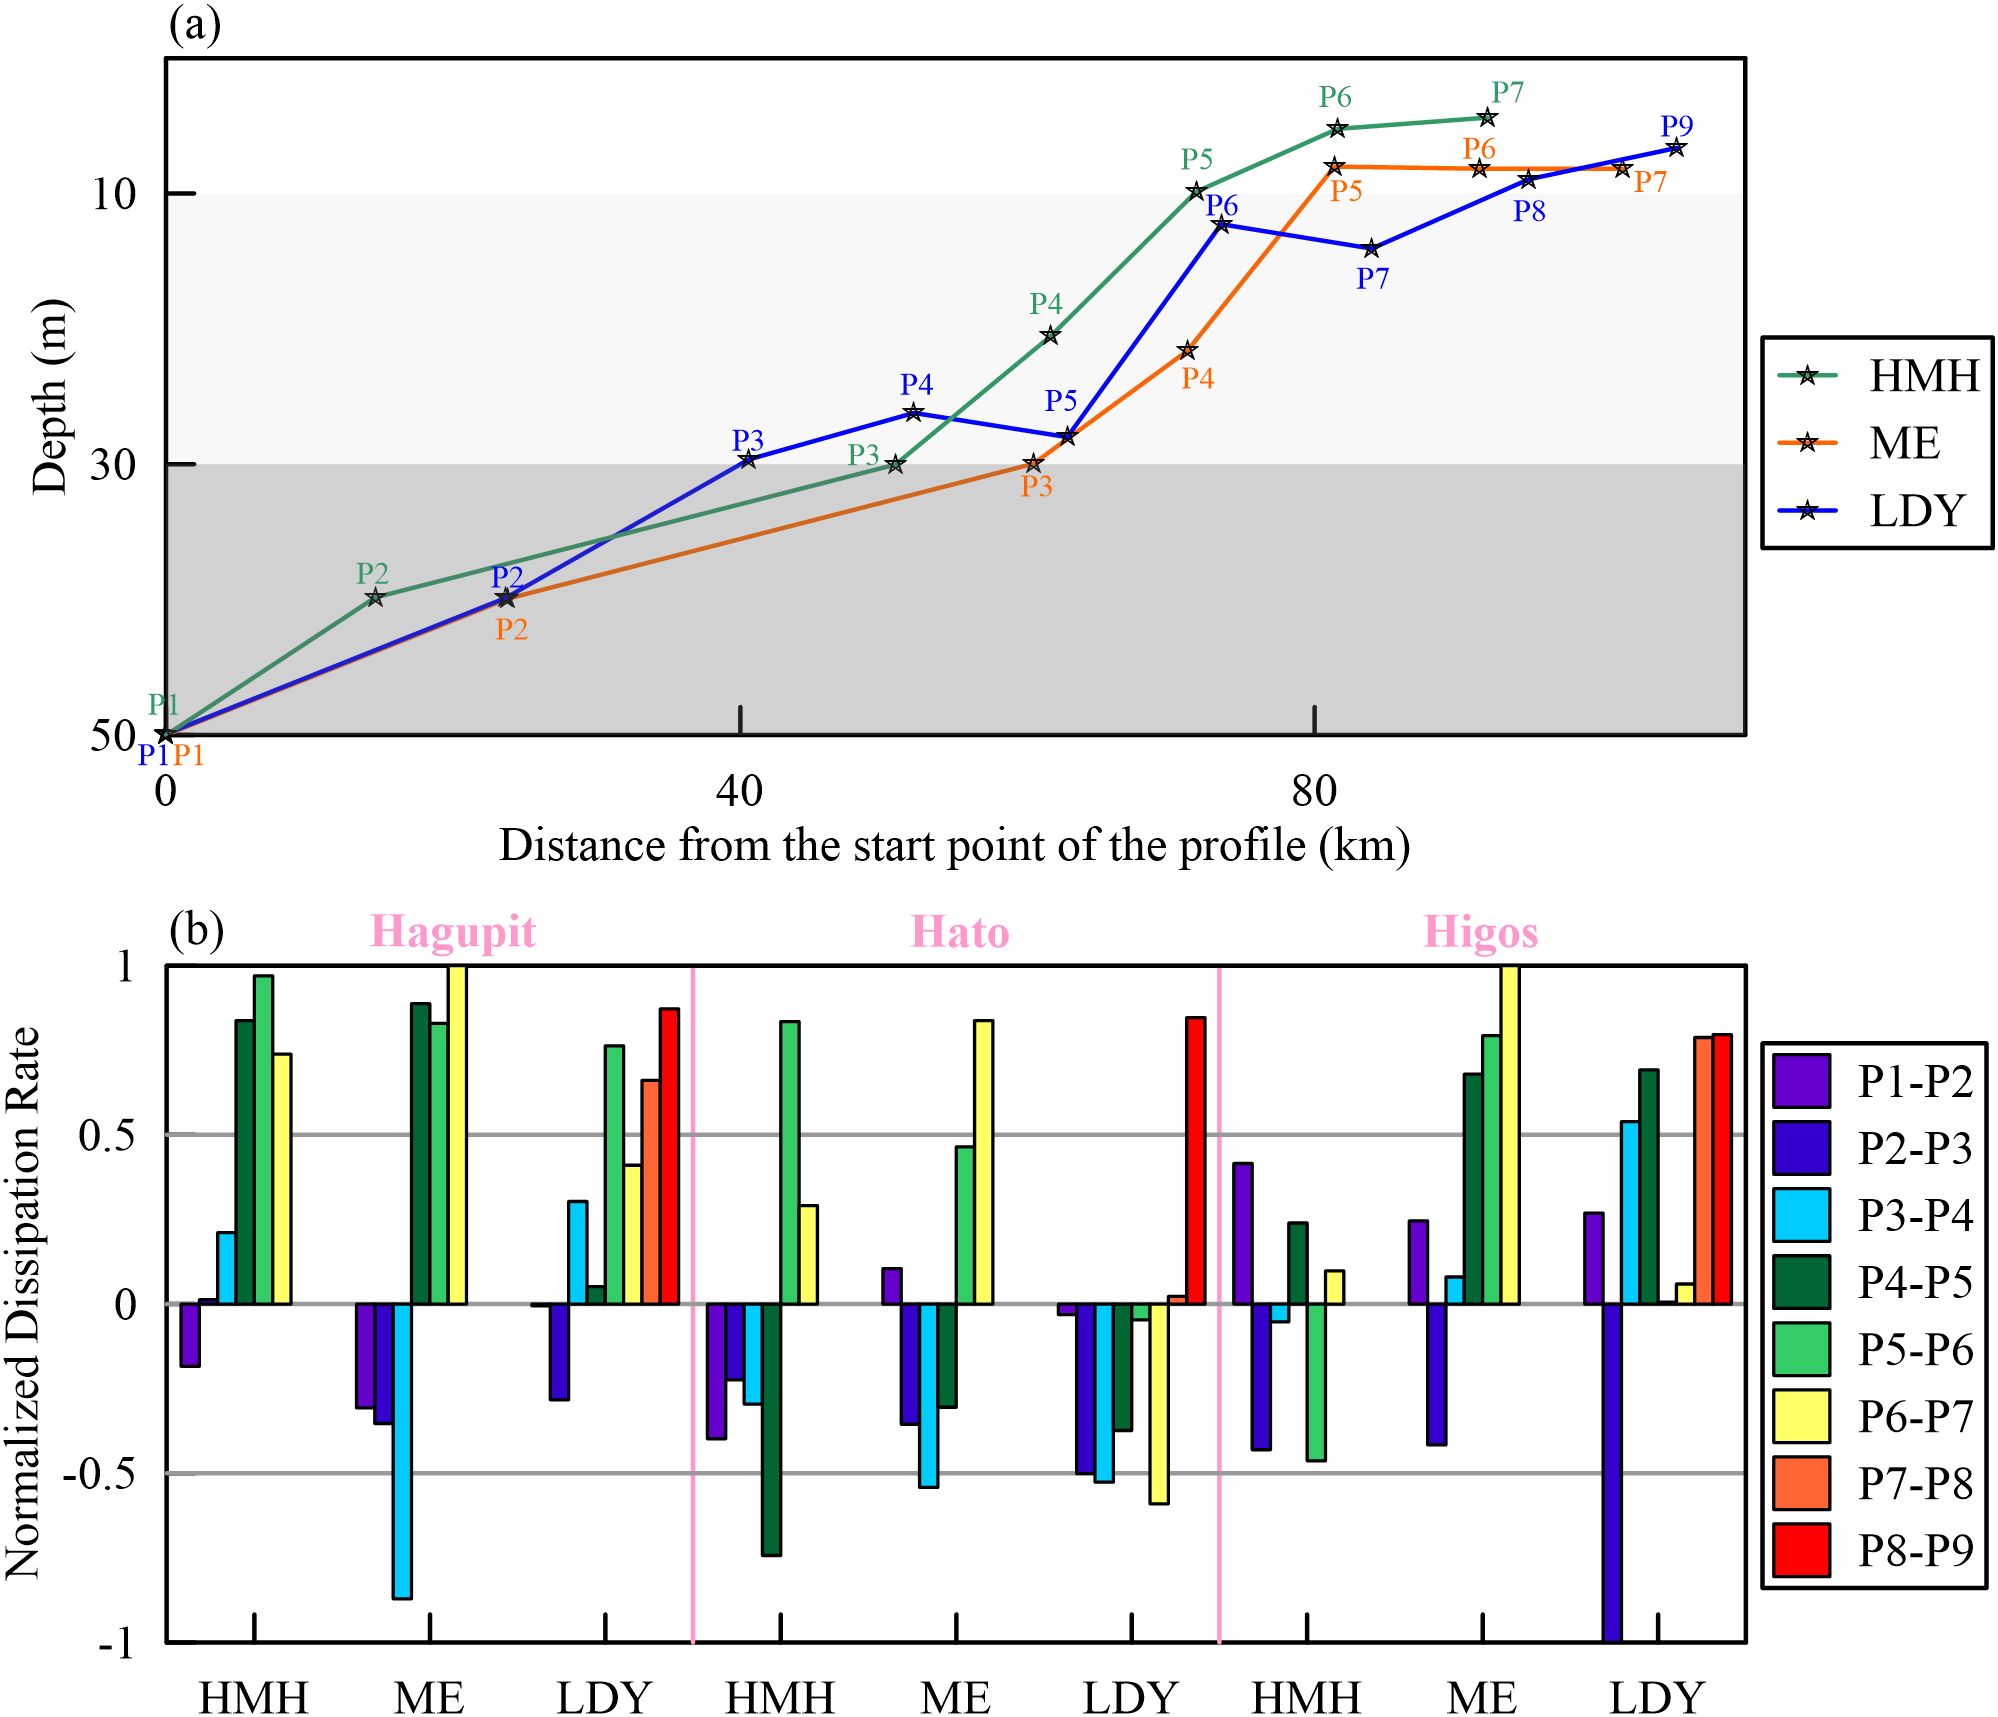
Figure 10. (A) Depth along the analytical profiles. (B) Results of Normalized Dissipation Rate between the analytical points.
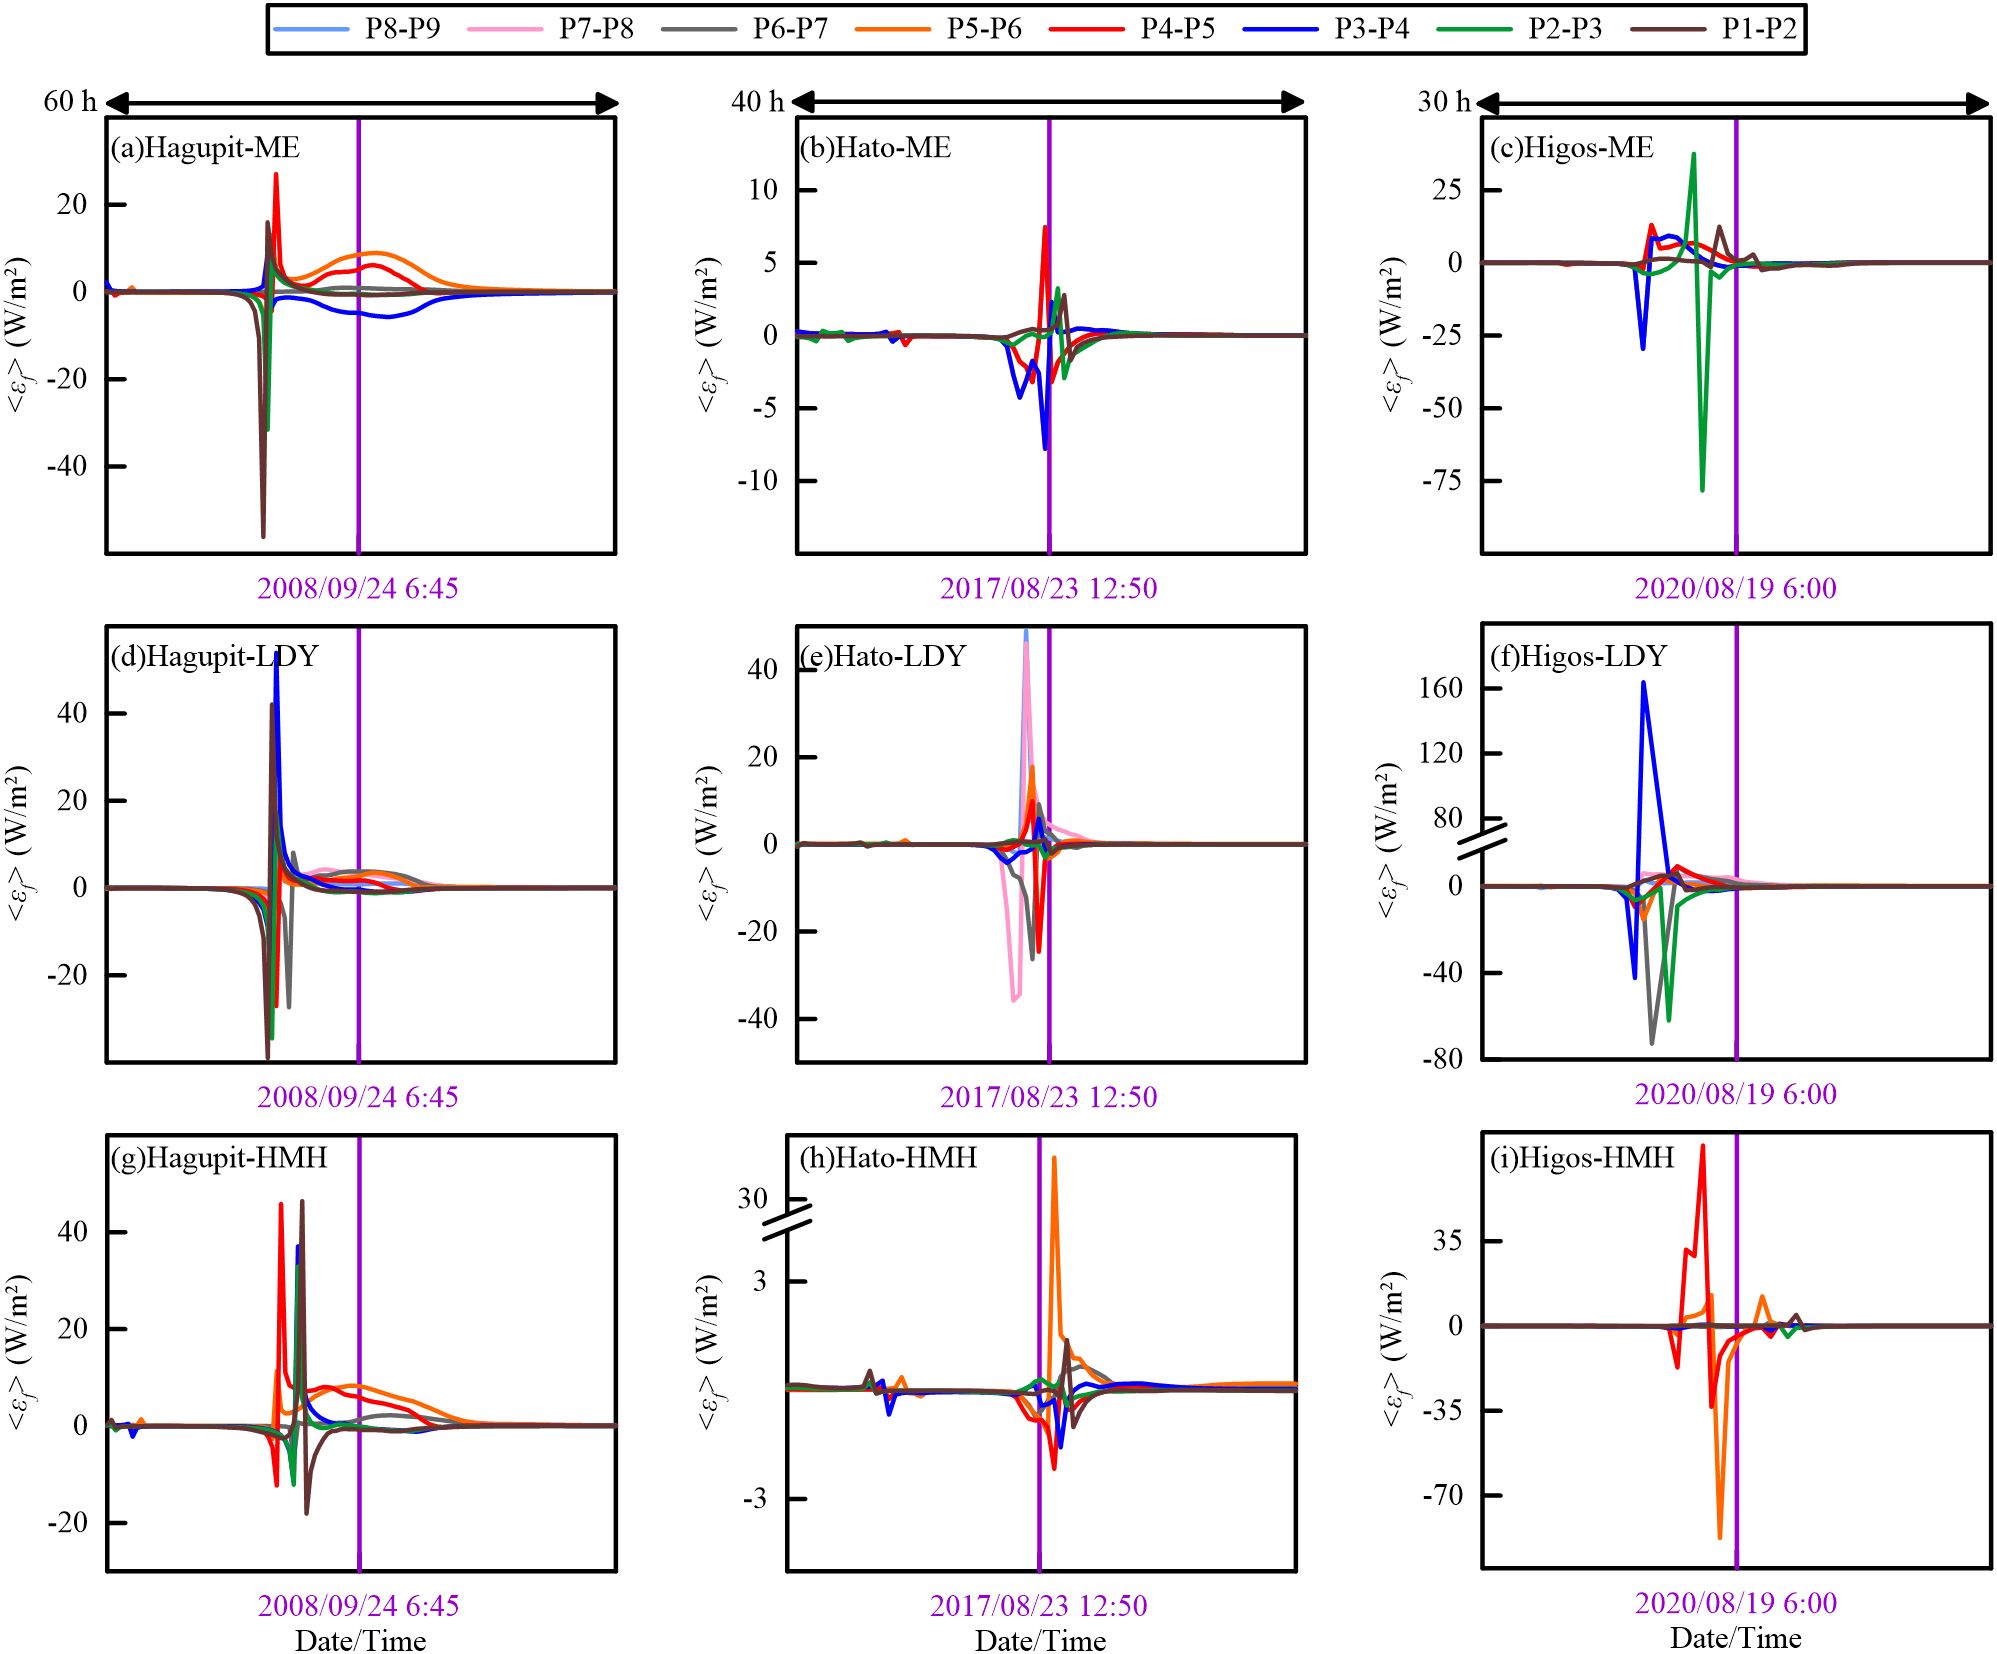
Figure 11. Time series of wave dissipation rate along the analytical profiles ((A–C) ME, (D–F) LDY, (G–I) HMH). Purple lines represent the time of typhoon landfall.
The wave propagation and dissipation varied among the estuarine regions. First, the waves directly attacked ME with high intensity, while LDY and HMH prevented the intense waves from propagating into the other estuaries. The maximum wave heights at the time of landfall were 0.72 m, 1.05 m, 0.85 m, 0.72 m, 2.75 m, 1.47 m, 0.28 m, and 0.26 m; 0.74 m, 0.97 m, 0.95 m, 0.84 m, 1.41 m, 1.11 m, 0.52 m, and 0.64 m; and 0.46 m, 0.67 m, 0.66 m, 0.61 m, 1.80 m, 1.50 m, 0.29 m, and 0.33 m at the outlet of the estuaries from east to west during Typhoons Hagupit, Hato, and Higos, respectively (Figures 1A, 6I–P, 7I–P, 8I–P). Second, the upstream expansions of intense waves were stronger at LDY and HMH than at ME, pointing out that the wide outlets and gradual contraction of the bell-shaped bays were conducive to the landward propagation of typhoon waves. The farthest upstream extensions of the 1-m isoline of wave height were 4.95 km, 65.48 km, and 26.73 km at 4 h after Hagupit’s landfall (Figure 6O); 4.92 km, 69.97 km, and 33.60 km at 2 h after Hato’s landfall (Figure 7N); and 4.84 km, 67.62 km, and 27.72 km at 4 h after Higos’s landfall (Figure 8O) at ME, LDY, and HMH, respectively, indicating that the maximum upstream propagating distances within the bell-shaped bays could be tens of times greater than those within a prismatic estuary during typhoons. The results also pointed out that the typhoon-induced waves kept propagating upstream after the typhoon landfall. Third, the wave heights were larger in the western part of LDY and HMH, which were mainly induced by the blocking effect of islands located on the southeast side of the bays. In contrast, the waves were under similar conditions on both sides of ME (Figures 6I–P, 7I–P, 8I–P). Furthermore, the spatial variation of wave steepness indicated that the intense wind wave component dissipated more slowly in the estuarine regions than in the offshore regions (Figures 9D, H, L).
The landward wave propagation changed significantly during typhoons. First, the amplitudes of wave dissipation and convergence significantly increased with typhoons approaching and decreased rapidly after landfall along the analytical profiles (Figures 5B, 11). Second, the temporal variation of shifted from being convergence-dominated to being dissipation-dominated at almost all profiles, indicating the intense wave propagation was a short-term change (Figure 11).
In addition, the morphological changes from the deep offshore areas to the shallow coastal regions influence the overall trend of wave-propagated variation. Wave energy evolution had a tendency to convert from being convergence-dominated to being dissipation-dominated when the wave propagated toward the PRE. The NDR gradually converted to being positively dominated within the 30-m isobaths, and the transition depths at profiles HMH, ME, and LDY were between 9.86 m and 30.02 m, 8.01 m and 29.96 m, and 14.07 m and 29.64 m during the selected typhoons, respectively (Figure 10B), indicating that the depth-limited dissipation gradually enhanced due to the wind wave–bottom interactions (Dolgikh et al., 2013). Moreover, wave heights had an increasing tendency toward the mouth-bar region due to the interaction between wave, jet spreading, and bottom friction under normal weather conditions (Nardin et al., 2013). Likewise, waves tend to converge as they pass through the mouth-bar region during typhoons (Figure 5B), and the wave heights remained relatively high after typhoon landfall (Figures 7N, 8N). Nonetheless, the dominant processes of wave propagation between each analytical point showed inconsistency during the selected typhoons (Figures 10B, 11), which were related to the uniqueness of each typhoon-induced wave field based on the unstable typhoon intensity, track, and scale.
6.2 Response of wave intensity, propagation, and dissipation to different typhoon characteristic factors
Typhoons are extreme weather events with unpredictable track, speed, intensity, and scale before generation. In this study, the track of Hagupit covered nearly the whole coastal region of Guangdong, whereas Hato and Higos had tracks covering only the central and eastern coastal regions (Figure 1A). The maximum wind speed of both Hagupit and Hato was over 50 m/s, and that of Higos was only 35 m/s. Thus, the typhoons selected for analysis are sufficiently representative for discussion of the dominant typhoon-related factors affecting the intensity, propagation, and dissipation of the generated wave field.
6.2.1 Impacts of the typhoon intensity on the wave intensity
Li et al. (2020) noted that an increase in typhoon intensity induced an increase in maximum significant wave height. The maximum wind speed and wave height recorded during Typhoons Hagupit, Hato, and Higos were 50 m/s and 6.39 m, 52 m/s and 6.49 m, and 35 m/s and 5.47 m, respectively, specifying the positive correlation between the maximum of typhoon wind speed and the induced strongest wave height (Figures 6–8). However, in terms of the spatial distribution of intense waves, the ratio of the maximum area of disturbed wave field (wave height >2 m) during Typhoons Hagupit, Hato, and Higos was 2.37:1.65:1 (Figure 12), while the ratio of the maximum wind speed was 1.43:1.49:1. The results showed that the disturbance area of the wave field during typhoons with similar tracks and cyclone structures was proportional to typhoon intensity, whereas Hagupit and Hato induced diverse wave fields despite their comparable maximum wind speed.
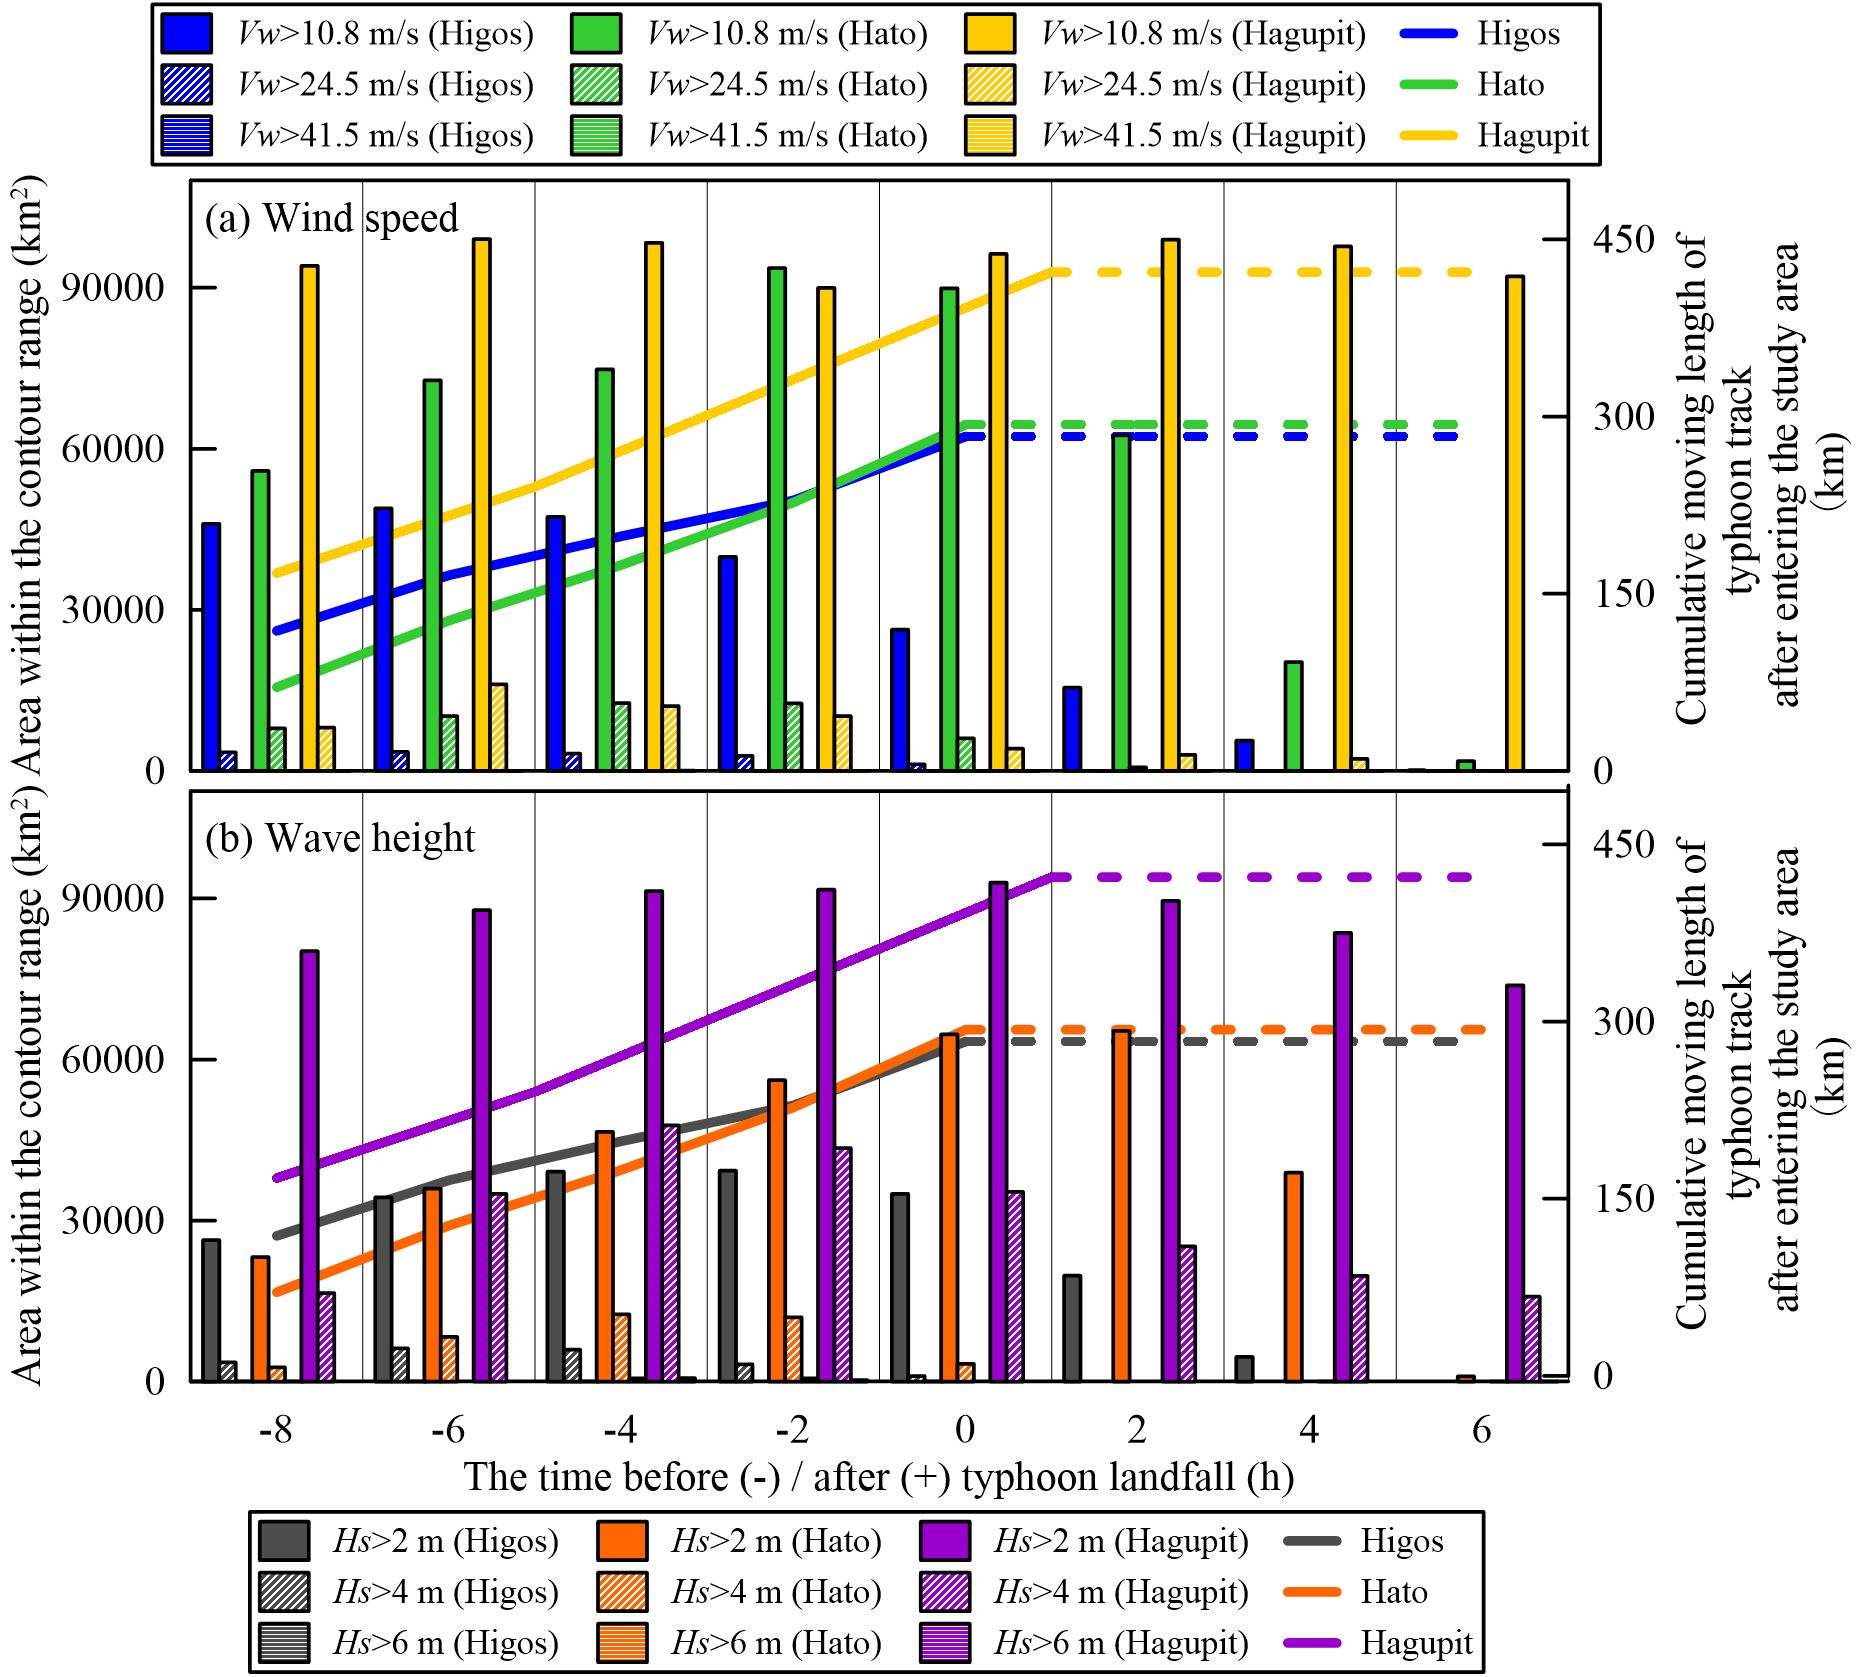
Figure 12. Time series of the area enclosed by the contours of (A) wind speed and (B) wave height (bar graphs based on the left Y-axis). Cumulative length of the typhoon tracks after entering the study area (line graphs based on the right Y-axis).
6.2.2 Impacts of the typhoon tracks and scale on wave intensity
The scale of Typhoon Hagupit was broader than that of Typhoon Hato (Figures 6A–H, 7A–H), inducing the differences between their generated wave fields (Figures 6I–P, 7I–P, 12). Wei and Hsieh (2018) demonstrated that typhoons with different tracks exhibited different interactions between typhoon structures and local topography, resulting in variations in their wave fields. The area of the wind speed over 10.8 m/s and 24.5 m/s increased from 55,871.91 km2 to 93,643.96 km2 and from 7,911.12 km2 to 12,630.84 km2, respectively, before Hato’s landfall, while the value fluctuated between 89,973.64 km2 and 99,048.82 km2 within the 10.8-m/s contour and increased from 8,073.30 km2 to 16,126.59 km2 and then decreased to 10,186.28 km2 within the 24.5-m/s contour during Hagupit’s approach (Figure 12). The results showed that the disturbed areas of typhoon structures of Hagupit were broader than those of Hato, inducing a significant difference between the range of typhoon-induced wave fields (Figures 6, 7). Moreover, the ratio of the maximum cumulative length of the typhoon tracks within the study area during Typhoons Hagupit and Hato was 1.44:1 (Figure 12), which was in positive correlation with the ratio of the maximum area of a disturbed wave field. The results verified that the longer distance of typhoon movement within the study area contributes to the interaction of wind and wave, further indicating that the typhoon tracks and scale were more prominent to the generated wave field compared to the typhoon intensity.
6.2.3 Impacts of the typhoon characteristic factors on wave propagation and dissipation
The regularity and moving track of typhoon structure dominated the wave propagation and dissipation within the PRE and its offshore regions. Typhoon Hagupit crossed nearly the whole coastal regions of Guangdong Province with an irregular typhoon structure, causing disturbance across a wide range of coastal areas, and the propagation and dissipation of waves within the coastal regions showed no apparent spatial pattern and were widely disturbed by the typhoon (Figures 1A, 6). In contrast, the cyclone structures of Typhoons Hato and Higos were regular and compact (Figures 7, 8). They crossed the central and eastern coastal regions of Guangdong Province, which disturbed smaller ranges of the wave fields within the study area. Therefore, the intense wave fields were approximately circular. Furthermore, the differences between the expanding and moving tendencies of the regions in different wave intensities directly induced the spatial variation of wave energy dissipation (Figures 7I–P, 8I–P). The expansion areas of the regions with wave heights >2 m and >4 m were 41,496.10 km2 and 9,864.56 km2, and 12,936.13 km2 and 2,620.17 km2 during Typhoons Hato and Higos, respectively (Figures 12, 7I–M, 8I–M), indicating that the occupied range of lower wave intensity broadened more significantly. Otherwise, the regions with wave height >4 m shifted corresponding to the movement of the typhoons and the wave height dissipated rapidly when the typhoons moved away, while the landward migrations of the region with wave height >2 m were limited by the obstruction of the shoreline since 5.83 h and 6 h before the landfall of Typhoons Hato and Higos, respectively (Figures 7I–M, 8I–M). Thus, with the continuous movement of significantly intense wave fields (i.e., wave height >4 m) toward the landing destination, wave energy tended to dissipate more intensely along the typhoon tracks.
The dominant process of overall wave propagation from coastal regions to the PRE is related to the typhoon tracks as well. Feng et al. (2011) and Mellor (2003) observed that an intense wave-induced radiation stress occurred on the right side of a typhoon track due to the sharp decrease in wave height in this region, indicating the wave energy tended to dissipate. First, the PRE and its adjacent coastal region located on the right side of Hagupit’s track (Figure 2) and the total integration results of were dominated by positive values along all the analytical profiles during Hagupit (Table 2), indicating the dominant role of wave dissipation. Second, the LDY and HMH were located on the right and left sides of Higos’s track, respectively (Figure 2), while the ME was directly attacked. The total integration results of were dominated by positive and negative values along the analytical profiles of LDY and HMH, respectively. Third, Hato’s track crossed the PRE (Figure 2), and the total integration results of had no apparent regularities in any of the profiles (Table 2). Thus, wave propagation from the coastal regions to the PRE was dominated by wave dissipation/convergence if the estuaries were located on the right/left side of the typhoon, except for those directly attacked.
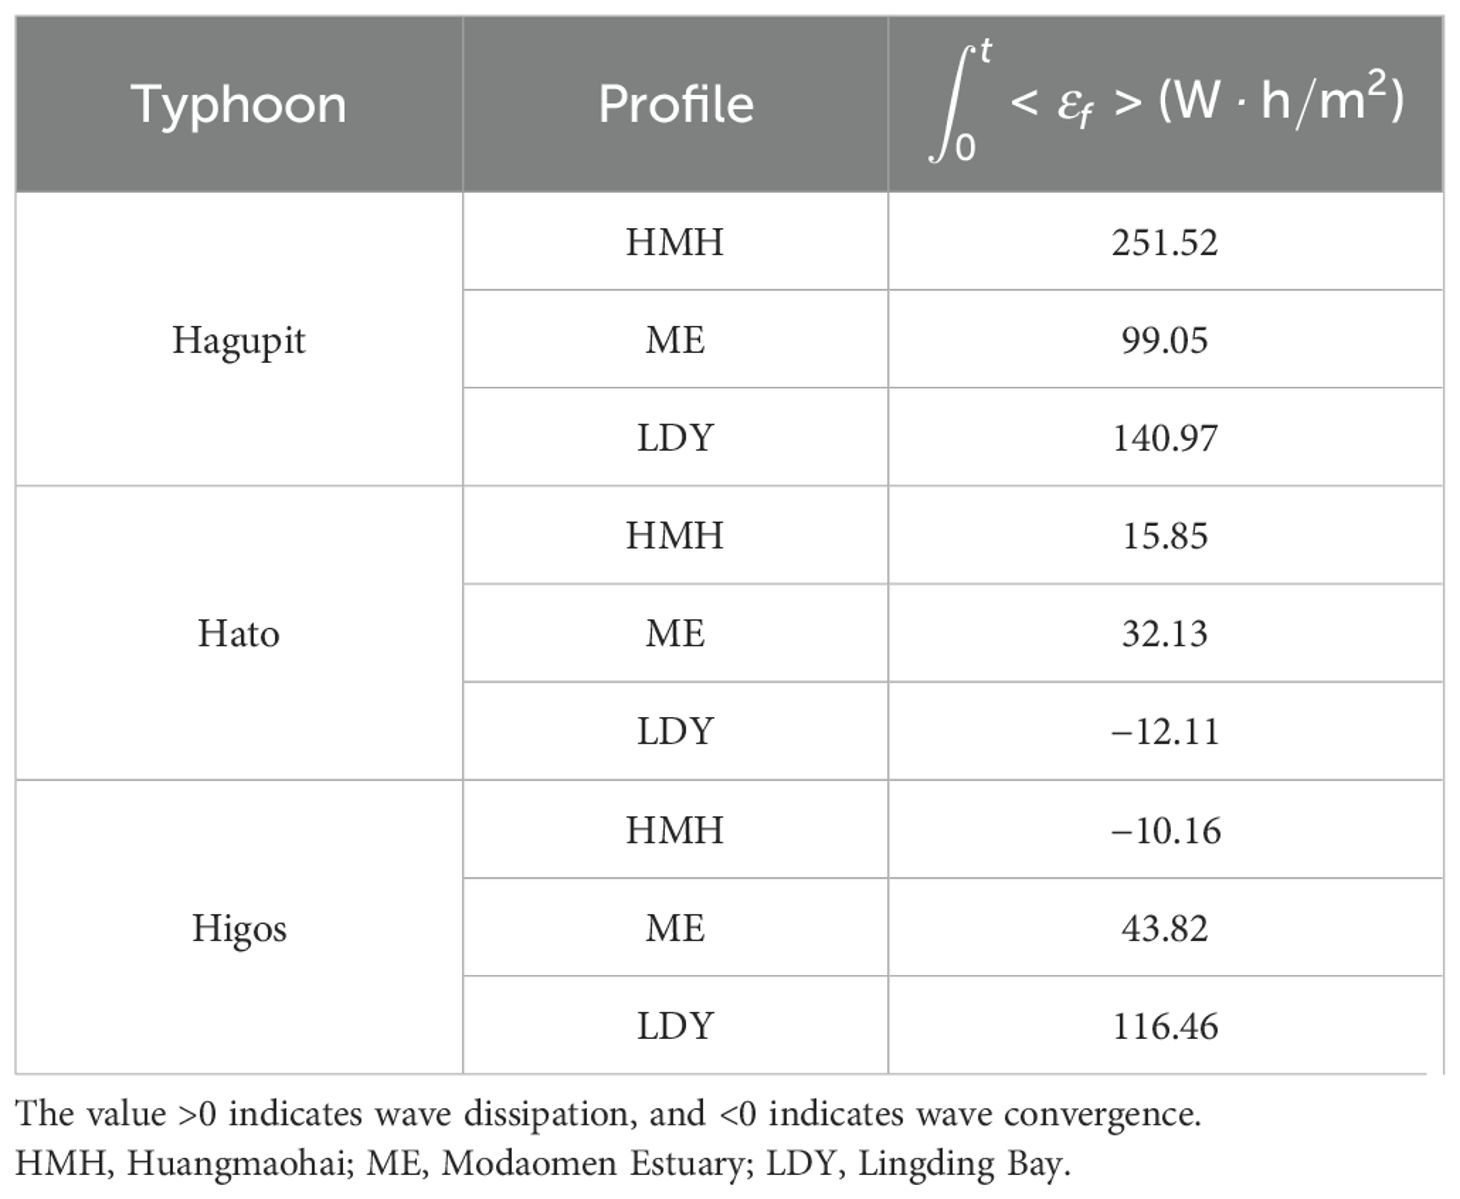
Table 2. Temporal integration of wave dissipation rate along selected profiles.
7 Conclusion
The main findings of this study are summarized as follows.
1. Under the intense force of the typhoon wind field, wind waves were the dominant components prior to the typhoon landfall. The intense wind waves dissipated rapidly with the typhoon decaying, whereas it stayed longer within the estuarine regions than in the open sea.
2. The distributions of wave fields are related to the typhoon structures. First, a typhoon in compact and regular cyclone structure (i.e., Hato and Higos) induced a wave field that was approximately circular, and the generated wave field dissipated more strongly along the typhoon tracks than in the other directions due to the significantly intense wave field (i.e., wave height >4 m) shifted, corresponded to the movement of the typhoons. In contrast, typhoons in complex structures and large scale (i.e., Hagupit) induced a complex wave field with less regularity.
3. Wave energy evolution is significantly affected by the estuarine configuration and the morphological changes within the coastal regions. First, the rapid contraction and the narrow width of the estuarine outlet contribute to the wave dissipation. Second, the wave energy tends to transition from being convergence-dominated to being dissipation-dominated due to the enhanced depth-limited wind wave–bottom interaction with the wave propagation landward. In addition, waves tend to converge within the mouth-bar region of ME based on its morphological features.
4. Typhoon tracks and scale played a more critical role in wave intensity, propagation, and dissipation than typhoon intensity.
5. Except for the typhoons directly attacking the PRE, waves within the estuarine regions tend to dissipate/converge when it is located on the right/left side of the moving track of the typhoons.
Data availability statement
The original contributions presented in the study are included in the article/supplementary material. Further inquiries can be directed to the corresponding author.
Author contributions
ML: Conceptualization, Data curation, Writing – original draft. SZ: Conceptualization, Writing – review & editing. HQ: Data curation, Writing – review & editing. LJ: Writing – review & editing.
Funding
The author(s) declare financial support was received for the research, authorship, and/or publication of this article. This study is supported by Southern Marine Science and Engineering Guangdong Laboratory (Zhuhai) (SML2023SP220) and Marine Economic Development Special Program of Guangdong Province (Six Major Marine Industries): Research and Demonstration of Critical Technologies for Comprehensive Prevention and Control of Natural Disaster in Offshore Wind Farms, China (Grant No. 29 (2023)).
Conflict of interest
The authors declare that the research was conducted in the absence of any commercial or financial relationships that could be construed as a potential conflict of interest.
Publisher’s note
All claims expressed in this article are solely those of the authors and do not necessarily represent those of their affiliated organizations, or those of the publisher, the editors and the reviewers. Any product that may be evaluated in this article, or claim that may be made by its manufacturer, is not guaranteed or endorsed by the publisher.
References
Battjes J. A., Janssen J. P. F. M. (1978). Energy loss and set-up due to breaking random waves. Coastal Engineering., 569–587. doi: 10.1061/9780872621909.034
Becq F. (1998). Extension de la modelisation spectrale des etats de mer vers le domaine cotier. (Thése de doctorat). Université de Toulon.
Bouws E., Komen G. J. (1983). On the balance between growth and dissipation in an extreme depth-limited wind-sea in the Southern North Sea. J. Phys. Oceanogr. 13, 1653–1658. doi: 10.1175/1520-0485(1983)013<1653:OTBBGA>2.0.CO;2
Carr L. E., Elsberry R. L. (1996). Models of tropical cyclone wind distribution and beta-effect propagation for application to tropical cyclone track forecasting. Monthly Weather Rev. 125, 3190–3209. doi: 10.1175/1520-0493(1997)125<3190:MOTCWD>2.0.CO;2
Cavaleri L., Alves J. H. G. M., Ardhuin F., Babanin A., Banner M., Belibassakis K., et al. (2007). Wave modelling – The state of the art. Prog. Oceanogr. 75, 603–674. doi: 10.1016/j.pocean.2007.05.005
Cheng T. K., Hill D. F., Read W. (2015). The contributions to storm tides in Pacific Northwest Estuaries: Tillamook Bay, Oregon, and the December 2007 storm. J. Coast. Res. 31, 723–734. doi: 10.2112/JCOASTRES-D-14-00120.1
Cui H., He H. L., Liu X. H., Yi L. (2012). Effect of oceanic current on typhoon-wave modeling in the East China Sea. Chin. Phys. B. 21, 109201. doi: 10.1088/1674-1056/21/10/109201
Dolgikh G. I., Budrin S. S., Dolgikh S. G., Ovcharenko V. V., Plotnikov A. A., Chupin V. A., et al. (2013). Dynamics of wind waves during propagation over a shelf of decreasing depth. Doklady Earth Sci. 447, 1322–1326. doi: 10.1134/s1028334x12120021
Du M., Hou Y., Hu P., Wang K. (2020). Effects of typhoon paths on storm surge and coastal inundation in the Pearl River Estuary, China. Remote Sens. 12 (11), 1851. doi: 10.3390/rs12111851
Eldeberky Y., Battjes J. A. (1995). Parameterization of triad interactions in wave energy models. Proc Coastal Dynamic. 95, 140–148.
Emanuel K. (1987). The dependence of hurricane intensity on climate. Nature. 326, 483–485. doi: 10.1038/326483a0
Fairchild T. P., Bennett W. G., Smith G., Day B., Skov M. W., Möller I., et al. (2021). Coastal wetlands mitigate storm flooding and associated costs in estuaries. Environ. Res. Lett. 16, 074034. doi: 10.1088/1748-9326/ac0c45
Feng X., Yin B., Yang D., William P. (2011). The effect of wave-induced radiation stress on storm surge during Typhoon Saomai, (2006). Acta Oceanologica Sin. 30, 20–26. doi: 10.1007/s13131-011-0115-6
Gagnaire-Renou E., Benoit M., Forget P. (2010). Ocean wave spectrum properties as derived from quasi-exact computations of nonlinear wave-wave interactions. J. Geophysical Res.: Oceans. 115, C12058. doi: 10.1029/2009JC005665
Geng B. l., Zhang C. h., Wen X. h., Shen X. m. (2014). A method to remove tide effect for wave observation data by AWAC (in Chinese). J. Waterway Harbor. 35, 99–104. doi: 10.3969/j.issn.1005-8443.2014.02.002
Gong W., Chen Y., Zhang H., Chen Z. (2018). Effects of wave–current interaction on salt intrusion during a typhoon event in a highly stratified estuary. Estuaries Coasts. 41, 1904–1923. doi: 10.1007/s12237-018-0393-8
Hashimura R., Takikawa K. (2012). Forecasting of damage level of maritime structures caused by typhoon 9918 based on improved CP method. APCBEE Proc. 1, 272–278. doi: 10.1016/j.apcbee.2012.03.044
Hasselmann K. (1962). On the non-linear energy transfer in a gravity-wave spectrum Part 1. General theory. J. Fluid Mechanics. 12, 481–500. doi: 10.1017/S0022112062000373
Hasselmann K. (1963). On the non-linear energy transfer in a gravity wave spectrum Part 2. Conservation theorems; wave-particle analogy; irrevesibility. J. Fluid Mechanics. 15, 273–281. doi: 10.1017/S0022112063000239
Hasselmann K., Barnett T. P., Bouws E., Carlson H. C., Cartwright D. E., Enke K., et al. (1973). Measurements of wind-wave growth and swell decay during the Joint North Sea Wave Project (JONSWAP). Deutschen Hydrographischen Z. 8, 12.
Hasselmann S., Hasselmann K. (1985a). Computations and parameterizations of the nonlinear energy transfer in a gravity-wave spectrum. Part I: A new method for efficient computations of the exact nonlinear transfer integral. J. Phys. Oceanogr. 15, 1369–1377. doi: 10.1175/1520-0485(1985)015<1369:CAPOTN>2.0.CO;2
Hasselmann S., Hasselmann K., Allender J. H., Barnett T. P. (1985b). Computations and parameterizations of the nonlinear energy transfer in a gravity-wave specturm. Part II: parameterizations of the nonlinear energy transfer for application in wave models. J. Phys. Oceanogr. 15, 1378–1391. doi: 10.1175/1520-0485(1985)015<1378:CAPOTN>2.0.CO;2
Hedges T. S., Anastasiou K., Gabriel D. (1985). Interaction of random waves and currents. J. Waterway Port Coastal Ocean Eng. 111, 275–288. doi: 10.1061/(ASCE)0733-950X(1985)111:2(275
Izumiya T., Horikawa K. (1984). Wave energy equation applicable in and outside the surf zone. Coast. Eng. J. 27, 119–137. doi: 10.1080/05785634.1984.11924382
Janssen P. A. E. M. (1989). Wave-induced stress and the drag of air flow over sea waves. J. Phys. Oceanogr. 19, 745–754. doi: 10.1175/1520-0485(1989)019<0745:WISATD>2.0.CO;2
Janssen P. A. E. M. (1991). Quasi-linear theory of wind-wave generation applied to wave forecasting. J. Phys. Oceanogr. 21, 1631–1642. doi: 10.1175/1520-0485(1991)021<1631:QLTOWW>2.0.CO;2
Jelesnianski C. P. (1965). A numerical calculation of storm tides induced by a tropical storm impinging on a continental shelf. Monthly Weather Rev. 93, 343–358. doi: 10.1175/1520-0493(1993)093<0343:Ancos>2.3.Co;2
Jelesnianski C. P. (1966). Numerical computations of storm surges without bottom stress. Monthly Weather Rev. 94, 379–394. doi: 10.1175/1520-0493(1966)094<0379:Ncossw>2.3.Co;2
Kang K., Di Iorio D. (2006). Depth- and current-induced effects on wave propagation into the Altamaha River Estuary, Georgia. Estuarine Coast. Shelf Sci. 66, 395–408. doi: 10.1016/j.ecss.2005.09.008
Knutson T. R., McBride J. L., Chan J., Emanuel K., Holland G., Landsea C., et al. (2010). Tropical cyclones and climate change. Nat. Geosci. 3, 157–163. doi: 10.1038/ngeo779
Komen G. J., Hasselmann S., Hasselmann K. (1984). On the existence of a fully developed wind-sea spectrum. J. Phys. Oceanogr. 14, 1271–1285. doi: 10.1175/1520-0485(1984)014<1271:OTEOAF>2.0.CO;2
Lavrenov I. V. (2001). Effect of wind wave parameter fluctuation on the nonlinear spectrum evolution. J. Phys. Oceanogr. 31, 861–873. doi: 10.1175/1520-0485(2001)031<0861:EOWWPF>2.0.CO;2
Le M. D., Vlasova G., Nguyen D. T. T. (2021). Distribution features of the typhoons in the South China Sea. Russian J. Earth Sci. 21, 1–8. doi: 10.2205/2020es000746
Li A., Guan S., Mo D., Hou Y., Hong X., Liu Z. (2020). Modeling wave effects on storm surge from different typhoon intensities and sizes in the South China Sea. Estuarine Coast. Shelf Sci. 235, 106551. doi: 10.1016/j.ecss.2019.106551
Lu Y., Wang G., Wang D., Wang X. (2020). Statistical analysis of the waves measured at fixed points in the Northern South China Sea in summer (in Chinese). Coast. Eng. 39, 213–223. doi: 10.3969/j.issn.1002-3682.2020.03.007
Luo Z., Huang B., Chen X., Tan C., Qiu J., Huang G. (2021). Effects of wave–current interaction on storm surge in the Pearl River estuary: A case study of super typhoon Mangkhut. Front. Mar. Sci. 8. doi: 10.3389/fmars.2021.692359
Lyddon C. E., Brown J. M., Leonardi N., Plater A. J. (2019). Increased coastal wave hazard generated by differential wind and wave direction in hyper-tidal estuaries. Estuarine Coast. Shelf Sci. 220, 131–141. doi: 10.1016/j.ecss.2019.02.042
Manchia C. M., Mulligan R. P. (2022). Hurricane wind-driven surface waves on a narrow continental shelf and exposed coast. Continental Shelf Res. 237, 104681. doi: 10.1016/j.csr.2022.104681
Matte P., Secretan Y., Morin J. (2017). Hydrodynamic modeling of the St. Lawrence fluvial estuary. I: model setup, calibration, and validation. J. Waterway Port Coastal Ocean Eng. 143 (5). doi: 10.1061/(asce)ww.1943-5460.0000397
Mellor G. (2003). The three-dimensional current and surface wave equations. J. Phys. Oceanogr. 33, 1978–1989. doi: 10.1175/1520-0485(2003)033<1978:TTCASW>2.0.CO;2
Mengual B., Bertin X., Place F., Pezerat M., Coulombier T., Mendes D., et al. (2022). Wave-current interactions at the Tagus Estuary Mouth (Portugal) under storm wave conditions. Ocean Model. 175 , 102035. doi: 10.1016/j.ocemod.2022.102035
Nardin W., Mariotti G., Edmonds D. A., Guercio R., Fagherazzi S. (2013). Growth of river mouth bars in sheltered bays in the presence of frontal waves. J. Geophysical Res.: Earth Surface. 118, 872–886. doi: 10.1002/jgrf.20057
Ou S. H., Liau J. M., Hsu T. W., Tzang S. Y. (2002). Simulating typhoon waves by SWAN wave model in coastal waters of Taiwan. Ocean Eng. 29, 947–971. doi: 10.1016/S0029-8018(01)00049-X
Pan M. J., Kong J., Luo Z. Y., Lv Z. J. (2018). Influence of typhoon path on salt water intrusion in the modaomen waterway, China. J. Coast. Res. 85, 936–940. doi: 10.2112/si85-188.1
Pan Z., Liu H. (2015). Numerical study of typhoon-induced storm surge in the Yangtze estuary of China using a coupled 3D model. Proc. Eng. 116, 849–854. doi: 10.1016/j.proeng.2015.08.373
Peng J., Mao M., Xia M. (2023). Dynamics of wave generation and dissipation processes during cold wave events in the Bohai Sea. Estuarine Coast. Shelf Sci. 280, 108161. doi: 10.1016/j.ecss.2022.108161
Powell M., Vickery P., Reinhold T. (2003). Reduced drag coefficient for high wind speeds in tropical cyclones. Nature. 422, 279–283. doi: 10.1038/nature01481
Pruszak Z., Szmytkiewicz P., Ostrowski R., Skaja M., Szmytkiewicz M. (2008). Shallow-water wave energy dissipation in a multi-bar coastal zone. Oceanologia. 50, 43–58.
Roelvink J. A. (1993). Dissipation in random wave groups incident on a beach. Coast. Eng. 19, 127–150. doi: 10.1016/0378-3839(93)90021-Y
Snyder R. L., Dobson F. W., Elliott J. A., Long R. B. (1981). Array measurements of atmospheric pressure fluctuations above surface gravity waves. J. Fluid Mechanics. 102, 1–59. doi: 10.1017/S0022112081002528
Thompson W. C., Nelson A. R., Sedivy D. G. (1984). Wave group anatomy of ocean wave spectra. Coast. Eng. Proc. 1, 45. doi: 10.9753/icce.v19.45
Thompson W. C., Reynolds F. M. (1976). Ocean wave statistics from FNWC spectral analysis. Coast. Eng. Proc. 1, 13. doi: 10.9753/icce.v15.13
Thornton E. B., Guza R. T. (1983). Transformation of wave height distribution. J. Geophysical Res.: Oceans. 88, 5925–5938. doi: 10.1029/JC088iC10p05925
Tian Z., Zhang Y. (2021). Numerical estimation of the typhoon-induced wind and wave fields in Taiwan Strait. Ocean Eng. 239, 109803. doi: 10.1016/j.oceaneng.2021.109803
Tolman H. L. (2004). Inverse modeling of discrete interaction approximations for nonlinear interactions in wind waves. Ocean Model. 6, 405–422. doi: 10.1016/j.ocemod.2003.09.002
van der Westhuysen A. J., Zijlema M., Battjes J. A. (2007). Nonlinear saturation-based whitecapping dissipation in SWAN for deep and shallow water. Coast. Eng. 54, 151–170. doi: 10.1016/j.coastaleng.2006.08.006
van der Westhuysen A. J. (2012). Spectral modeling of wave dissipation on negative current gradients. Coast. Eng. 68, 17–30. doi: 10.1016/j.coastaleng.2012.05.001
Wang J., Kuang C., Cheng S., Fan D., Chen K., Chen J. (2024). The responses of storm surges to representative typhoons under wave–current interaction in the Yangtze River estuary. J. Mar. Sci. Eng. 12 (1), 90. doi: 10.3390/jmse12010090
Wang C. H., Wai W. H. O., Li Y. S., Chen Y. (2006). Modelling of the wave-current interaction in the Pearl River Estuary. J. Hydrodynamics Ser. B. 18, 159–165. doi: 10.1016/s1001-6058(06)60047-4
Wei C. C., Hsieh C. J. (2018). Using adjacent buoy information to predict wave heights of typhoons offshore of Northeastern Taiwan. Water. 10 (12), 1800. doi: 10.3390/w10121800
Wei X., Wu C., Cai S., Zhan W. (2020). Long-term morphodynamic evolution of the Pearl River Delta from the perspective of energy flux and dissipation changes. Quaternary Int. 553, 118–131. doi: 10.1016/j.quaint.2020.05.047
Willmott C. J., Ackleson S. G., Davis R. E., Feddema J. J., Klink K. M., Legates D. R., et al. (1985). Statistics for the evaluation and comparison of models. J. Geophysical Res. 90 (C5), 8995–9005. doi: 10.1029/JC090iC05p08995
Willoughby H. E. (1990). Gradient balance in tropical cyclones. J. Atmospheric Sci. 47, 265–274. doi: 10.1175/1520-0469(1990)047<0265:Gbitc>2.0.Co;2
Wu Y., Dou S., Fan Y., Yu S., Dai W. (2023). Research on the influential characteristics of asymmetric wind fields on typhoon waves. Front. Mar. Sci. 10. doi: 10.3389/fmars.2023.1113494
Xie X., Li M., Ni W. (2018). Roles of wind-driven currents and surface waves in sediment resuspension and transport during a tropical storm. J. Geophysical Res.: Oceans. 123, 8638–8654. doi: 10.1029/2018JC014104
Xu F. M., Will P., Zhang J. L., Song Z. Y., Bechara T. (2005). Simulation of typhoon-driven waves in the Yangtze estuary with multiple-nested wave models. China Ocean Eng. 19, 613–624.
Yan L. (1987). An improved wind input source term for third generation ocean wave modelling. Scientific report WR-No 87-8, De Bilt, The Netherlands.
Yin Y., Karunarathna H., Reeve D. E. (2019). A computational investigation of storm impacts on estuary morphodynamics. J. Mar. Sci. Eng. 7 (12), 421 doi: 10.3390/jmse7120421
Yin K., Xu S., Huang W., Xie Y. (2017). Effects of sea level rise and typhoon intensity on storm surge and waves in Pearl River Estuary. Ocean Eng. 136, 80–93. doi: 10.1016/j.oceaneng.2017.03.016
Keywords: Pearl River Estuary, typhoon track, typhoon intensity, wave propagation, wave dissipation
Citation: Liang M, Zhu S, Qiu H and Jia L (2024) Propagation and dissipation of typhoon-induced surface waves along the Pearl River Estuary. Front. Mar. Sci. 11:1463214. doi: 10.3389/fmars.2024.1463214
Received: 11 July 2024; Accepted: 19 August 2024;
Published: 20 September 2024.
Edited by:
Yang Yang, Nanjing Normal University, ChinaReviewed by:
Mei Xuefei, East China Normal University, ChinaLiqin Zuo, Nanjing Hydraulic Research Institute, China
Bo Hong, South China University of Technology, China
Copyright © 2024 Liang, Zhu, Qiu and Jia. This is an open-access article distributed under the terms of the Creative Commons Attribution License (CC BY). The use, distribution or reproduction in other forums is permitted, provided the original author(s) and the copyright owner(s) are credited and that the original publication in this journal is cited, in accordance with accepted academic practice. No use, distribution or reproduction is permitted which does not comply with these terms.
*Correspondence: Liangwen Jia, amlhbHdlbkAxMjYuY29t