 Zezhou Zou1
 Xiaofan Zhang
- 1School of Economics, Ocean University of China, Qingdao, China
- 2Institute of Marine Development, Ocean University of China, Qingdao, China
To alleviate the pressure of economic development on the marine environment, the Marine Ecological Compensation (MEC) has become a major policy tool for the Chinese government to reconcile the contradiction between economic development and the marine environment. In this paper, we propose a novel two-stage bargaining game data envelopment analysis (DEA) model to evaluate the performance of MEC under the cooperative structure. The proposed model considers the link between marine economic development (MED) and marine environmental protection (MEP). Meanwhile, the equivalent form, Nash equilibrium solution, sensitivity and stability of the model are as well documented to further analyze MED and MEP. Eventually, a case study of 30 coastal cities in China serves to verify the practicable effectiveness of the foregoing model combined with numerical simulation and support key insights as below: (i) According to the results evaluated by the decentralized DEA model, we find that if one party of MED and MEP takes priority, the efficiency score of the other party will be severely affected; (ii) the evaluation results of sensitivity and stability demonstrate that inputs and outputs have different impact degrees on the efficiency scores of MED and MEP, which provide directions for improving the efficiency of both systems; (iii) The proposed model addresses the limitation of the conventional two-stage DEA model that cannot handle uncertain variables, thus revealing the influence of uncertainty on MEC efficiency. The compelling evidence presented in the case study solidifies the effectiveness of the proposed model, establishing its promising prospects for application in evaluating the performance of DMUs with a two-stage structure.
1 Introduction
Marine economic development (MED) refers to ocean-related economic activities, which include the exploitation and utilization of oceanic resources, the dynamic or static use of marine space, and the related industries that provide services and support for the above. With the rapid growth of China’s marine economy, from 2012 to 2021, China’s gross ocean product increased from 5.0 trillion yuan to 9.0 trillion yuan, becoming a new catalyst of China’s economic growth. In the process of rapid development of marine economy, activities such as overexploitation of resources and direct discharge of industrial and agricultural wastewater into the sea have also led to serious deterioration of the marine ecosystem, necessitating immediate attention to marine ecological protection (MEP) (Chen et al., 2022). The Chinese government has dedicated substantial endeavors towards rehabilitating the deteriorating coastal ecosystem Liu and Yang (2020). In order to guarantee the enduring progress of the marine economy and marine ecology, the Chinese government has attached great importance to marine ecological compensation (MEC) in recent years and made the MEC as an institutional arrangement for the protection of marine ecology. Marine ecological compensation refers to the system and mechanism arrangement to realize the restoration of marine ecological damage and environmental protection in the utilization of marine resources (Jiang et al., 2019b). There are gaps in existing researches on MEC. The research hot spots mainly include the policy formulation and application research of compensation methods, compensation legislation, compensation standards and so on. In the process of implementing MEC, the central and local governments have invested huge amounts of funds and resources which have improved the marine ecological environment. An inevitable question is whether the resource allocation of the MEC is effective. As far as we are aware, limited studies exist that address the performance evaluation of MEC (Jiang et al., 2019b; Jiang and Faure, 2022).
Data Envelopment Analysis (DEA), as pioneered by Charnes et al. (1978), represents a robust framework for evaluating the relative efficiency of decision-making units (DMUs) consisting of multiple inputs and outputs, has found extensive application across diverse practical problem settings accompanied by the utilization of diverse extended model structures. MED has exhibited a continuous increase in efficiency, the rapid expansion has brought forth a plethora of challenges that impinge upon the efficiency of MEP (Ren et al., 2023). Consequently, when evaluating the efficiency of MEC, we can’t regard MEC as a ‘black box’ and resort to conventional DEA methodologies. Upon reviewing the extant literature, employing the convention two-stage DEA model may lead to multiple solutions. Hence, we present a novel two-stage DEA model rooted in the principles of Nash bargaining game theory, ensuring unique and mutually acceptable solutions for both parties involved.
And yet, as highlighted in Rao et al. (2014) and Shi et al. (2020), the treatment of missing data emerges as another critical concern demanding attention. For instance, the assessment of MEP efficiency often incorporates the measurement of the area of coastal waters with excellent and good water quality, a pivotal indicator. While this data is readily available in the local government yearbooks of most coastal cities, the exception lies in Shanghai, which is an indispensable research target that cannot be overlooked. To mitigate this uncertainty, numerous DEA models have been proposed, represent but not exclusive models are focused on the fuzzy DEA models (Sengupta, 1992; Tavana et al., 2018), stochastic DEA models (Zhou et al., 2017), and uncertain DEA models (Wen et al., 2014; Lio and Liu, 2018; Jiang et al., 2020; Wu and Sheng, 2022).
The main goal of this research endeavor is to measure the performance of MEC in 30 coastal cities of China with a novel two-stage bargaining game DEA model, and the contributions are presented as follows. In light of the foregoing, MED and MEP are the two most crucial aspects for evaluating MEC performance, and they are interdependent (Liu and Yang, 2020). Should the government place disproportionate emphasis on marine ecological conservation, the inevitable consequences thereof are poised to significantly influence on the course of maritime economic development. Likewise, too much emphasis on MED will cause the degradation of the natural habitat. Hence, when evaluating the efficiency of MEC, it becomes imperative to take into account the interdependence between the MED subsystem and the MEP subsystem within MEC. Therefore, when evaluating the relative performance of MEC, we need to highlight how to deal with the interplay relationship between MED and MEP. This elucidates the rationale behind our introduction of a novel Nash bargaining game DEA model under a collaborative framework, aiming to discern the most mutually acceptable resolution for both subsystems. The conventional two-stage DEA models suffer from the issue of non-unique optimal solutions, so how can the efficiency scores of each stage be determined uniquely to ensure mutual acceptance? The Nash solution derived from the proposed model is both Pareto-optimal and unique, signifying that both parties are motivated to accept this solution. An additional challenge that needs to be addressed is how to handle the uncertain data of DMUs? The proposed model encompasses the assessment of data integrity for decision-making units, considering the incorporation of uncertain data either partially or entirely. Furthermore, the equivalent form and Nash equilibrium solution of the proposed model are presented as well. The results obtained from the suggested methodology appear more recognizable and acceptable than the decentralized decision model. Since the efficiency scores measured by DEA model only reveal the relative efficiency of the target decision making unit (DMUo), which makes it difficult for decision maker to propose specific measures to improve the efficiency of the target DMUoby re-allocating ecological compensation resources. Therefore, we further analyzed the sensitivity and stability of the proposed model to finish off this issue.
In sum, this paper proposes a novel two-stage bargaining game DEA model to evaluate the performance of MEC in coastal cities of China. This model integrates the link between MED and MEP, addresses the limitation of handling uncertain variables in conventional two-stage DEA models, and provides insights into the sensitivity and stability of various inputs and outputs affecting MEC efficiency.
The manuscript is structured accordingly: Section 2 commences with a review of existing works in the related field. In section 3, a novel Nash bargaining game DEA model is constructed. The performance of MEC in 30 coastal cities of China is evaluated in section 4, followed by an analysis of the proposed model’s sensitivity and stability. Finally, we present some conclusions and policy implications.
2 Literature review
2.1 Marine ecological compensation
Marine ecological compensation stems from the domain of ecological compensation, which falls under the umbrella of ecological economic studies. As a multidimensional research subject, ecological compensation endeavors to devise suitable compensatory mechanisms by incorporating a diverse range of disciplinary perspectives, including ecology, economics, sociology, and institutional economics (Pan et al., 2017). The research on ‘marine ecological compensation’ commenced relatively later in China (Jiang et al., 2019b).
The scientific evaluation for the efficiency of MEC holds paramount importance in fostering the advancement of sustainable development. The efficiency of MEC serves as a vital gauge to reflect the relative effectiveness of current ecological compensation measures, and from which we can then provide scientific suggestions for the allocation of ecological compensation resources. Pagiola (2005) proposed the framework of performance evaluation of ecological compensation from the perspective of ecological compensation efficiency, seeing broad implementation in the field of forest, watershed, and grassland (Sun and Li, 2021). Yet, there is little research on performance evaluation of MEC. It is well known that economic development and environmental protection are interdependent. With the rapid development of the marine economy, the coastal waters are polluted more and more seriously, leading to a marked decline in the environmental quality of coastal regions (Chen et al., 2022). The deterioration of the marine ecology in turn restricts the sustainable development of the marine economy. Therefore, many scholars have integrated the effects of both when evaluating the efficiency of the marine economy or marine ecology, thus deriving the concepts of marine green economic efficiency, marine ecological-economic efficiency, and marine circular economic efficiency (Ding et al., 2020; Gao et al., 2022). For example, considering environmental constraints, Ren et al. (2018) analyzed the effectiveness of marine economic activities in Chinese coastal zones utilizing the global Malmquist-Luenberger productivity index framework. Ding et al. (2020) introduced the game DEA model to measure the performance of the marine circular economy.
At present, research related to MEC is mainly focused on theoretical and applied studies. However, without understanding the operational efficiency of the MEC, it is impossible to effectively supervise, evaluate and provide feedback on the performance of the MEC. To further enhance the efficiency of MEC is even more unavailable. Few studies have attempted to evaluate the performance of ecological compensation in marine-related fields. By drawing on indicators from previous literature, Levrel et al. (2012) attempted to analyze issues such as what type of MEC should be used and how to evaluate the performance of MEC. Liu and Zhu (2014) evaluated China’s legislation on MEC through an in-depth examination of the Bohai oil spill event. Shi et al. (2020) merged the SBM method with the DEA-Malmquist approach to evaluate the efficiency of MEC in 11 coastal provinces in China. Cao and Wang (2022) evaluated the performance of MEC policy, grounded in the application of entropy methodology and the utilization of the quasi-experimental approach. Jiang and Faure (2022) measured the efficiency of MEC from the perspective of law and economics, aiming to assess the congruence of implemented regulations with economic principles in addressing marine ecological harm resulting from offshore drilling activities. In addition it cannot be ignored that some crucial data are difficult to collect, which makes the evaluation results somewhat flawed (Levrel et al., 2012; Shi et al., 2020).
2.2 Bargaining game DEA
In numerous instances, DMUs are structured around a two-stage system that incorporates intermediate variables, with the outputs of the first stage either partially or entirely funneling into the second stage as inputs. Such system may possess a sequential structure, a parallel structure, or a mixture of both, which are collectively referred to as network structures, and the DEA model that deals with such network structures is called a network DEA model (Färe and Grosskopf, 2000). Yet, possible discrepancies emerging from the intermediate variables between the two successive stages cannot be tackled by using the standard DEA approach (Du et al., 2011). To resolve particular conflict, Kao and Hwang (2008) suggested considering the series relationship of the processes within the whole system. However, Kao and Hwang’s method still cannot secure unique efficiency decomposition. Liang et al. (2006) introduced the decentralized DEA model or non-cooperative game DEA model which served to examine the performance of each member in the supply chain. The fundamental concept behind this model revolves around maximizing the leader’s performance at first, and then maximize the follower’s performance while ensuring the leader’s performance maximization. Afterward, Liang et al. (2008) introduced the notion of a collaborative game, envisaging the two stages as respective participants in the game. Under the cooperative scenario, two players in the game jointly decide the optimal weight of a group of intermediate outputs to enhance the system’s efficiency optimally. Outcomes yielded via conventional two-stage DEA approaches might not meet the approval of DMUs in that the results are usually more favorable to one party, which makes it unacceptable to the other party.
Recently, bargaining game DEA has attracted more and more attention. By integrating bargaining game into DEA, a Pareto solution can be reached, thereby rendering the outcome more agreeable to all DMUs. As Lozano et al. (2019) summarized, these ideas have been focused on finding common weights for all DMUs (Wu et al., 2009; Wang and Li, 2014; Omrani et al., 2015), decomposing the efficiencies of DMUs with complex structures (Du et al., 2011; Zhou et al., 2013; Hinojosa et al., 2016; Wu et al., 2017a) and handling different input-output specifications (Yang and Morita, 2013). Specifically, Wu et al. (2009) enhanced the methodology for assessing cross-efficiency, employing the CCR efficiency score as the maximum threshold of the efficiency interval and the cross-efficiencies to establish the minimum limit. Subsequently, Du et al. (2011) introduced a model grounded in bargaining game theory for analyzing two-stage network configurations. Zhou et al. (2013) introduced a DEA model based on the principles of bargaining games, aimed at realizing an impartial outcome for each process, concurrently sustaining the system efficiency constant. Wang and Li (2014) addressed the challenge of multiple solution outcomes in the cross-efficiency model by utilizing the CCR efficiency score as the upper threshold and establishing the mean of cross-efficiencies as the lower benchmark. Hinojosa et al. (2016) extended the efficiency decomposition method to a multi-stage system by leveraging the Nash game approach. Lozano et al. (2019) advanced the application of the bargaining game methodology in calculating DEA targets. Yu et al. (2023) used the proposed DEA-based Nash bargaining model wherein its novelty lies in incorporating weakly disposable undesirable outputs to evaluate airlines’ performance. Lozano (2023) proposed a centralized DEA model which is based on bargaining approach for efficiency assessment and target setting with fixed-sum variables.
2.3 Uncertain DEA models
The DEA models mentioned above assume the data to be crisp. Nevertheless, numerous instances arise wherein solely uncertain data can be attained, prompting investigators to broaden optimization techniques in coping with uncertainty (Omrani et al., 2022). Despite the considerable efforts made to tackle imprecise data with the DEA models, the exploration of uncertainty within two-stage DEA approaches still remain relatively limited (Zhou et al., 2017). To tackle the issue of uncertainty, Kao and Liu (2011) adopted a novel approach by integrating fuzzy theory as a mechanism to confront this formidable challenge. Tavana et al. (2018) assessed the operational performance of 60 Saman Bank branches in Iran through employing a two-stage fuzzy DEA approach.
In addition to the fuzzy hypothesis, many studies in recent years have demonstrated that the uncertainty theory based on belief degree introduced by Liu (2007) proves also to be suitable for addressing the uncertainties, consequently yielding accurate and credible outcomes. For instance, Wen et al. (2014) constructed a DEA approach under uncertain environments based on uncertainty measures followed by deeply discussed in (Wen et al., 2015, 2017). Then, Lio and Liu (2018) introduced an uncertainty DEA approach by taking the expected value of efficiency. Nejad and Hadigheh (2017) introduced another DEA model aimed at attaining the maximum credibility level that a given DMU is deemed efficient. Jiang et al. (2019a) put forth a model of DEA under uncertainty to gauge scale efficiency and further identified specific scale efficiency states in Jiang et al. (2020). Pourmahmoud and Bagheri (2021) presented a fundamental two-stage framework tailored to handle uncertain scenarios. Wu and Sheng (2022) used the Malmquist productivity index under the uncertain environment to measure the temporal dynamics of DMU efficiency.
Despite the existence of relevant uncertain network DEA models for handling uncertain variables, the issue of non-uniqueness in optimal solutions persists as a challenge within these models. Therefore, it is necessary to propose a mechanism that decomposes efficiency to address this concern. Within this research, a novel uncertain two-stage DEA approach based on Nash bargaining theory is developed, which effectively resolves this issue. Furthermore, the Nash solution obtained is unique and Pareto optimal.
3 Problem description and model construction
3.1 Problem description
The disorderly development of the marine economy has posed a serious threat to the marine ecological environment, which has forced the Chinese government annually to allocate huge ecological compensation funds to restore the marine ecosystem. With the practice of MEC, it’s essential to clarify the effectiveness of MEC measures for resource allocation in the future.
MEP is closely related to MED (Kangas and Ollikainen, 2019). On the one hand, the undesirable intermediates, such as wastewater, solid waste, etc., produced in the process of MED have negative impacts on MEP. Alternatively, the development of the marine economy provides more compensation funds for marine ecological governance. If the government overemphasizes the protection of marine ecology, it may affect the MED. Likewise, too much emphasis on MED will cause environmental ecosystem degradation. Thus, when evaluating the efficiency of MEC, it is necessary to comprehensively consider the link between MED and MEP (Cao and Wang, 2022). Furthermore, as pointed out in the literature (Rao et al., 2014; Shi et al., 2020), how to deal with the missing data is another issue that needs to be addressed.
3.2 Uncertain leader-follower DEA models
Consider a system that consists of two stages. Here, one might view the initial phase as a MED system, while the subsequent stage constitutes an MEP system. In alignment with the notation system employed in the works of Chen and Zhu (2004) and Du et al. (2011), we posit a scenario comprising n DMUs, wherein each DMU, designated as DMUj(j = 1,2,…,n), manages m inputs for the first stage, indicated as (i = 1,2,…,m), alongside yielding D + G outputs from this stage, symbolized collectively as (d = 1,2,…,D) and (g = 1,2,…,G) which we term as desirable intermediate measures and undesirable intermediate measures separately. Part of the desirable intermediate measures, say , subsequently serving as the inputs for the stage 2. The second stage yields s outcomes, represented symbolically as (r = 1,2,…,s).
DEFINITION 1. For each DMUj (j = 1,2,…,n), , , , and denote the uncertain variables with a given belief degree α, which represent the values of , and respectively, where , and are the inverse uncertainty distributions of , and , respectively.
Numerous prior investigations have delved into the efficiency of DMUs with two stage structures, incorporating undesired outputs into their analyses. By way of example, Lozano and Gutiérrez (2011) through a distance approach to deal with undesirable intermediate outputs for evaluating the airport operation. Seiford and Zhu (2002) and Wu et al. (2016) suggested treating the undesirable intermediate outputs as negative terms which mean that they should be decreased in the first stage. Besides, the outputs deemed undesirable function as desirable inputs for the second stage. To ascertain the overall efficiency of dual-stage network configurations considering undesirable intermediate outputs, we merge both stages through a weighted mean of the efficiency scores from stages one and two as depicted below:
where β1 and β2 symbolize the proportionality factors for sub-DMUs in the first and second stages correspondingly, with the condition that β1 + β2 = 1. And Im,Os,BD and BG represent the collections of inputs, outputs, desirable intermediate measures and undesirable intermediate measures separately. Here, the , , are sets of uncertain inputs, intermediate measures and outputs of the j-th DMU with given α and the , , ≥ 0 are the variable weights to be determined by the solution of this problem.
Model (1) constitutes a nonlinear programming problem, posing challenges for direct resolution. With β1 held constant, the model (1) can be converted into linear programming via methodologies introduced by Liang et al. (2006) and Lim and Zhu (2013), employing a dual ‘Charnes-Cooper’ transformation (Charnes and Cooper, 1962) strategy in concert for addressing fractional components within their respective models. Subsequently, Guo et al. (2017) enhanced this approach to efficiently derive the overall efficiency score. Specifically, let , and , , , . The model (1) can be recast as the subsequent model
Then, let , , , , . Model (2) can be adapted into the following alternate model
The upper bound of can be figured out in two steps. Firstly, let . The efficiency pertaining to the secondary stage can be obtained. Subsequently, the efficiency score for stage 1 can be determined with the second stage efficiency constant at , i.e.,
According to uncertainty theory, the model (4) corresponds to the subsequent model
where , , , , , , , , , , , and , , , are the inverse uncertainty distributions of , , , , , , , , , , , and , , , , respectively.
According to models (1-5) and the work of Guo et al. (2017), is constrained in . For the fixed , the model (1) may henceforth be addressed througha sequential application of linear programming techniques by searching for the optimal value of within . Treat as the parameter, the model (3) can then be solved by using the following algorithm.
I: Let be the lower bound of , and as the upper bound. Let .
II: Solve the model (3). Attain the optimal value . If , then go to vi. Or else, let , or in a general format , go to III.
III: Let . Back to II.
IV: Ascertain the optimal value .
When the Algorithm stops, the supreme optimum of the model (3) can be obtained.
However, Chen and Zhu (2004); Liang et al. (2006), and Guo et al. (2017) have indicated that the assurance of a unique optimal solution for model (1) is not provided, hence implying that the decomposition of the overall efficiency for target DMUo is not inherently singular either.
In the scenario where the initial stage acts as the leader and the subsequent stage as the follower, the efficiency score for stage 1 can be derived as
Based on uncertainty theory and “Charnes-Cooper” transformations, the model (6) can be transformed into the subsequent optimization formulation by using the same techniques illustrated above.
The performance measure for the second stage can subsequently be achieved, i.e., . Similarly, when the stage 1 and stage 2 of the target DMUoare the follower and leader accordingly, we can obtain by solving the following model
The fractional model (8) can be transformed into the succeeding optimization program
The performance measure for the first stage can consequently be derived, i.e., Note that if and only if . If and , then stage efficiency and are uniquely determined by model (1). If or , model (1) exists various decompositions of efficiency. Then, stage efficiency’s upper and lower constraints can be derived through implementation of the models spanning (6) to (9).
3.3 Efficiency decomposition for uncertain DEA bargaining game model
When there exist alternative efficiency decompositions, if one stage of the target DMUois given priority, the efficiency score of another stage may be seriously affected, making the result sometimes unacceptable to the dominated stage, particularly in cases where there is no clear dominance between the two stages of each DMU (Chu et al., 2020). Therefore, we introduce a novel bargaining game DEA approach for further decomposing the efficiency to make the results more acceptable to both parties. Here, we take it as Scenario 3. Then, an efficiency decomposition bargaining problem can be expressed as
Next, we figure out the efficiency decomposition score for each stage. According to Nash bargaining theory, the efficiency decomposition for each stage can be attained by addressing the following formulated issue
Next, we examine the impact of adjusting measurement parameters on efficiency, aiming to facilitate the most straightforward enhancement of DMU efficiency amidst constraints imposed by limited resources, technology, and other factors.
The initial exposition of DEA sensitivity analysis, as elucidated by Charnes et al. (1984), delved into the examination of variations in a singular output. This pioneering work was succeeded by a sequence of scholarly contributions on sensitivity analysis by Charnes and Neralić (1990), elucidating the establishment of adequate conditions that uphold operational efficiency. The alternative facet of DEA sensitivity analysis involves the presumption of simultaneous proportional alterations in all inputs and outputs pertaining to a specific Decision Making Unit (DMU), with pertinent investigations detailed in Seiford and Zhu (1998).
Suppose that and represent the selected variable sets, and S1 and S2 are the unselected variable sets. The general sensitivity and stability for the proposed model can be articulated as:
Model (12) can be solved as the model (11).
When the target DMUois inefficient, i.e., the overall efficiency score θˆo< 1, we aspire to determine the smallest radial extent, henceforth labeled the ‘stability radius’ of DMUo, within which the recently considered DMUobecomes operationally efficient. The model is set forth as:
When the target DMUo is efficient, i.e., the overall efficiency score = 1, we aspire to ascertain the utmost diameter, herein designated as the ‘stability radius’ of the DMUo, within which the DMUo persists in its state of optimality. The model is accordingly delineated as follows:
When the algorithm stops, Δ1 represents the minimal radius such that the new DMUo becomes efficient. If Δ2 = 0, this means that any adverse variation will make the efficient target DMUobecome inefficient. If Δ2 > 0, then the target DMUowill remain efficient provided that the variation of each input and output in the first stage and the second stage is within and respectively.
4 Empirical analysis
Under the cooperative structure, we above propose a novel two-stage bargaining game DEA approach to make the result more acceptable for both stages. This approach encompasses not only the consideration of unexpected outputs but also the ability to handle uncertain variables. As delineated in the problem description section, the performance evaluation of MED and MEP is a typical two-stage efficiency assessment problem, compounded by the presence of unexpected outputs and data gaps within the evaluation metrics. Consequently, our proposed model can effectively resolves the challenges encountered in MED and MEP efficiency evaluation.
4.1 Indicators selection for MED and MEP measurement
MED is regarded as the first stage, succeeded by MEP as the second stage. Concerning the evaluation indicators, we refer to the relevant literature on ecological compensation, marine economic performance evaluation, and marine environmental performance evaluation (Wu et al., 2017b; Ding et al., 2020; Gao et al., 2022) to construct the evaluation system for MEC. Ocean-related employed personnel (Ding et al., 2020; Yan et al., 2022), the area of waters with established rights (Wu et al., 2017b; Gao et al., 2022), and the investment in marine fixed assets (Ding et al., 2020; Gao et al., 2022) are selected as the inputs for MED. The input X2 represents the input of marine resources. For marine fixed assets investment, the perpetual inventory approach (Goldsmith, 1951) is employed to estimate the annual capital stocks of each region (taking the capital stock data of 30 coastal cities in 2009 as the base year). The particular computation procedure is outlined as
where Ki,tand Ki,t−1 denote the accumulation of capital in coastal cities in the t-th and (t − 1)-th phases respectively, δi,t, Ii,tand Pi,tdenote the depreciation ratio, total investment and price indices of investment in fixed assets for the i coastal city during the t-th time interval, severally.
Gross ocean product (Ding et al., 2020; Gao et al., 2022) and the industrial wastewater discharged directly into the sea (Yan et al., 2022) are expected and unexpected outputs for MED. Moreover, these two outputs are also the inputs of MEP. The investment of marine compensation funds is obtained by the product of the gross ocean product and the ratio of environmental contamination mitigation to the gross domestic product.
The area of coastal waters with excellent and good water quality and marine biodiversity index (Wu et al., 2017b; Gao et al., 2022) are selected as ultimate outputs. As mentioned, for Shanghai, the data concerning the area of coastal waters with excellent and good water quality is not available from the relevant yearbooks. Therefore, we treat it as the uncertain observation. For the process of uncertain data, please refer to Liu (2007). Specification of the inputs and outputs metrics is provided in Table 1.
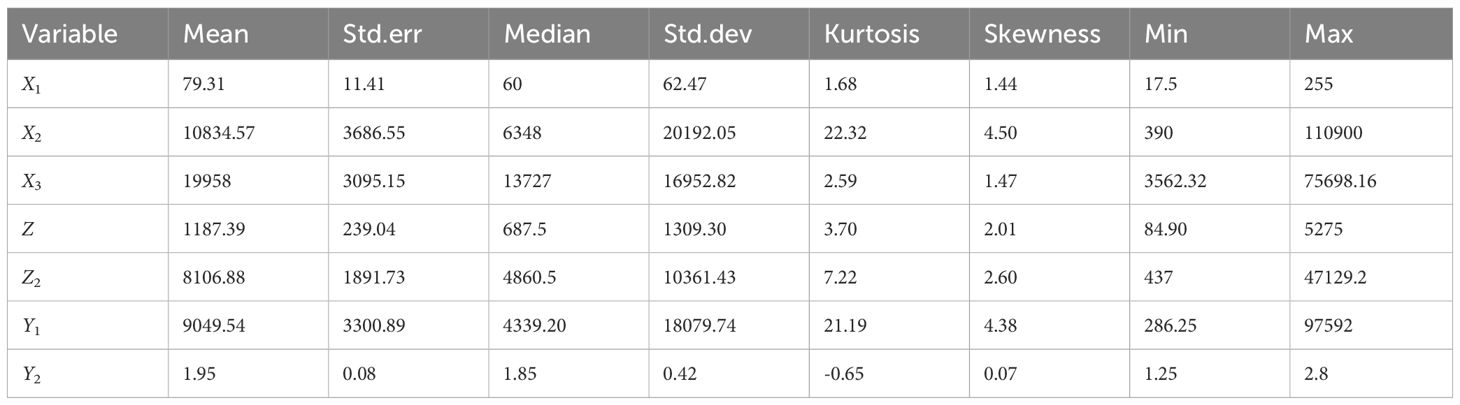
Table 1. The descriptive statistical characteristics of variables.
4.2 Region selection and data sources
We selected 30 coastal cities in China as research samples. The specific locations are shown in Figure 1. The data of ocean-related employed personnel come from China Marine Statistical Yearbook 2021. Since the specific number of ocean-related employed personnel is no longer published starting from 2016, we use a regression method to predict this number and treat it as an uncertain variable. The related data of investment in marine fixed assets come from China Statistical Yearbook on Environment 2021 and China Statistical Yearbook (2012-2021). The data of gross ocean product, the area of waters with established rights, the area of coastal waters with excellent and good water quality, the industrial wastewater discharged directly into the sea, and marine biodiversity index come from statistical yearbooks of coastal cities, relevant government websites and so on. Some index data are obtained by comprehensive processing according to statistical yearbook data. Due to the presence of missing data, we employed uncertainty theory to address the issue. Owing to constraints on the length of the manuscript, the detailed methodology is explicated in the work by Liu (2007).

Figure 1. Locations of 30 coastal cities in China.
4.3 Efficiency results and discussion
Firstly, we employ the additive DEA model (1) for ascertaining the overall efficiency of the target DMUo. Then, by solving the models (6-9) , and are set as breakdown points of stage 1 and stage 2 respectively. Finally, we use the proposed model to re-measure the performance of MED and MEP. In addition, for comparison, the decentralized DEA model (Jiang et al., 2021) is employed for gauging the efficacy of DMUs within the non-cooperative game structure. For the convenience of analysis, Scenario 1 and Scenario 2 are recorded when the first stage is dominant and the second stage is dominant respectively. The evaluation results are shown in Table 2.
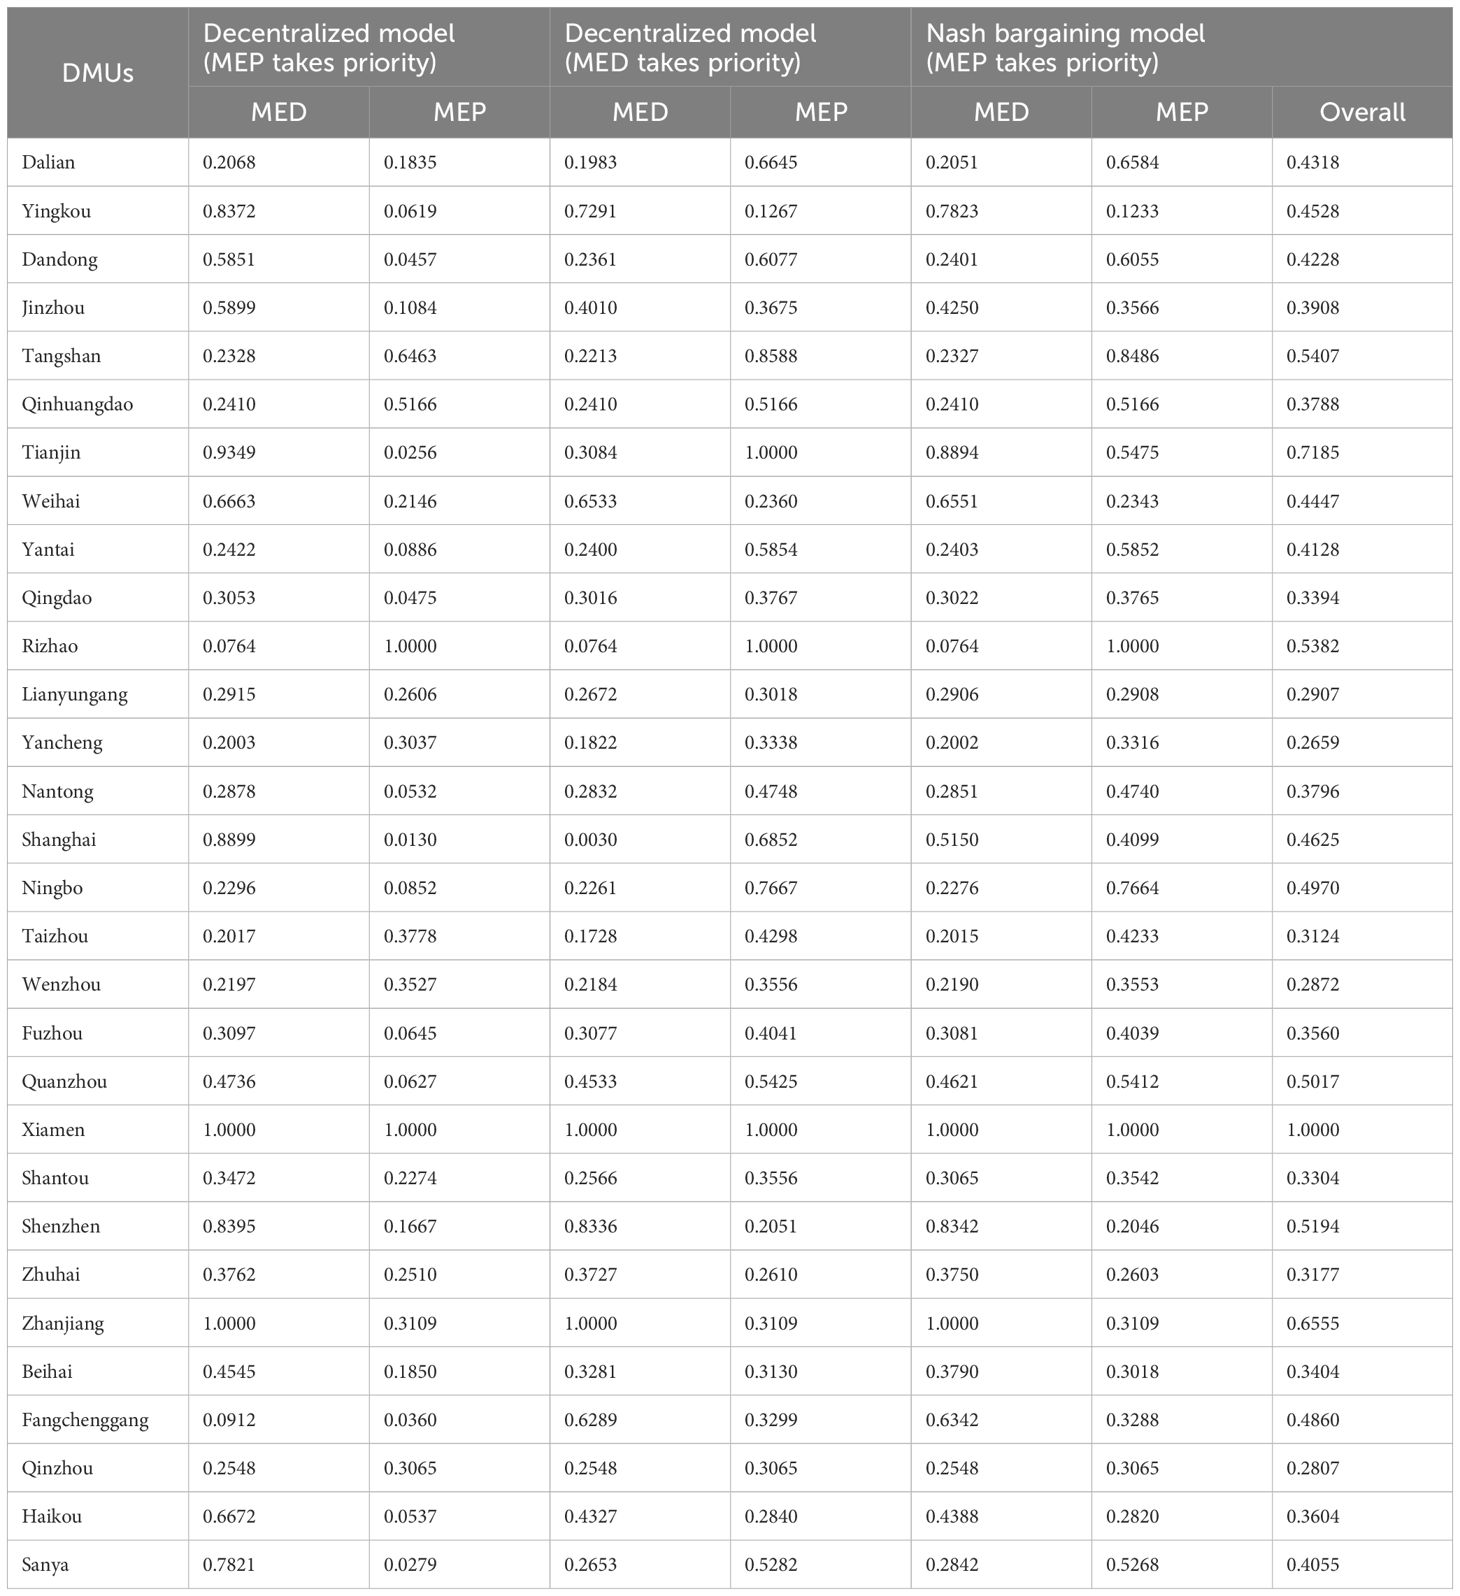
Table 2. Efficiency scores of MED and MEP in coastal cities of China evaluated by decentralized model and Nash bargaining DEA model.
From Table 2, Figures 2, 3, some detailed results are generated as follows.

Figure 2. Comparison of the efficiency rankings of MED under three different scenarios.

Figure 3. Comparison of the efficiency rankings of MEP under three different scenarios.
1) It can be seen from Table 2, Figures 2, 3 that the highest average MED efficiency score is observed in Scenario 1, while the lowest is observed in Scenario 2. The highest average MEP efficiency score is observed in Scenario 2, while the lowest is observed in Scenario 1. For instance, from a micro-level perspective, when the first stage is dominant, Dalian’s efficiency score for MED is 0.2068, while the efficiency score for MEP is 0.1835. Conversely, when the second stage prevails, the MED efficiency score decreases to 0.1983, and the MEP efficiency score escalates to 0.6645. This discrepancy arises because Scenario 1 (resp. Scenario 2) fails to consider the interdependence between stages, leading to potential overestimation of results. Notably, the rankings obtained from Scenario 1 and Scenario 2 exhibit significant alterations compared to Scenario 3. For instance, Qingdao and Tianjin, experience a decline in rankings of over 20 positions, highlighting the tendency of Scenario 1 and Scenario 2 to overestimate efficiency in specific regions.
2) According to the efficiency scores obtained from Scenario 1, Xiamen and Zhanjiang are effective in terms of MED when MED takes priority (i.e., here it can be interpreted as prioritizing MED compared to MEP). Rizhao and Xiamen are effective as for MEP. When MEP is prioritized, Xiamen and Zhanjiang remain effective in MED, and Tianjin, Rizhao, and Xiamen are effective in terms of MEP. In conformity with the efficiency scores measured by the decentralized models, it’s obvious that when one party takes priority, it may affect the efficiency score of the other party.
3) Moreover, compared with the results garnered from decentralized models, the results (as shown in Table 2 in columns 6-8) derived from the novel Nash bargaining game DEA model demonstrate that approximately 80% of provinces are positioned between Scenario 1 and Scenario 2 rankings. This signifies that under Scenario 3, the proposed model effectively measures MEC efficiency with precision, skillfully avoiding both overestimation and underestimation.
4.4 Sensitivity and stability analysis of MED
For the sake of realizing the sustainable development of the ocean, we must consider the relationship between MED and MEP in a holistic manner. The model we proposed above is committed to finding the most acceptable solution, rather than simply pursuing the maximization of MED efficiency and ignoring MEP or vice versa. Now, we try to probe the influence on the efficiency of DMUs by changing some variables. Generally speaking, to make the DMU reach an effective state, the conventional practice strives for input reduction and output escalation. And this paper also follows this line of thinking for research. Firstly, we examine scenarios involving modification of a single input or output variable. Taking Qingdao as an example, Figure 4 vividly demonstrates how a change of input or output shapes the efficiency score pertaining to the respective stage. From Figure 4, it is not difficult to find that: (i) the sensitivities of MED and MEP are varies to inputs and outputs; (ii) Figure 4D once again shows that there is a negative correlation between MED and MEP for the desirable intermediate measure; (iii) Figure 4E reveals that there is a positive correlation between MED and MEP for the undesirable intermediate measure; (iv) when the input (such as X1, X2, X3, etc.) is reduced to a certain extent, the efficiency score of the corresponding stage may reach 1.000, whereas the overall efficiency score of the target DMUomay cannot reach 1.000.
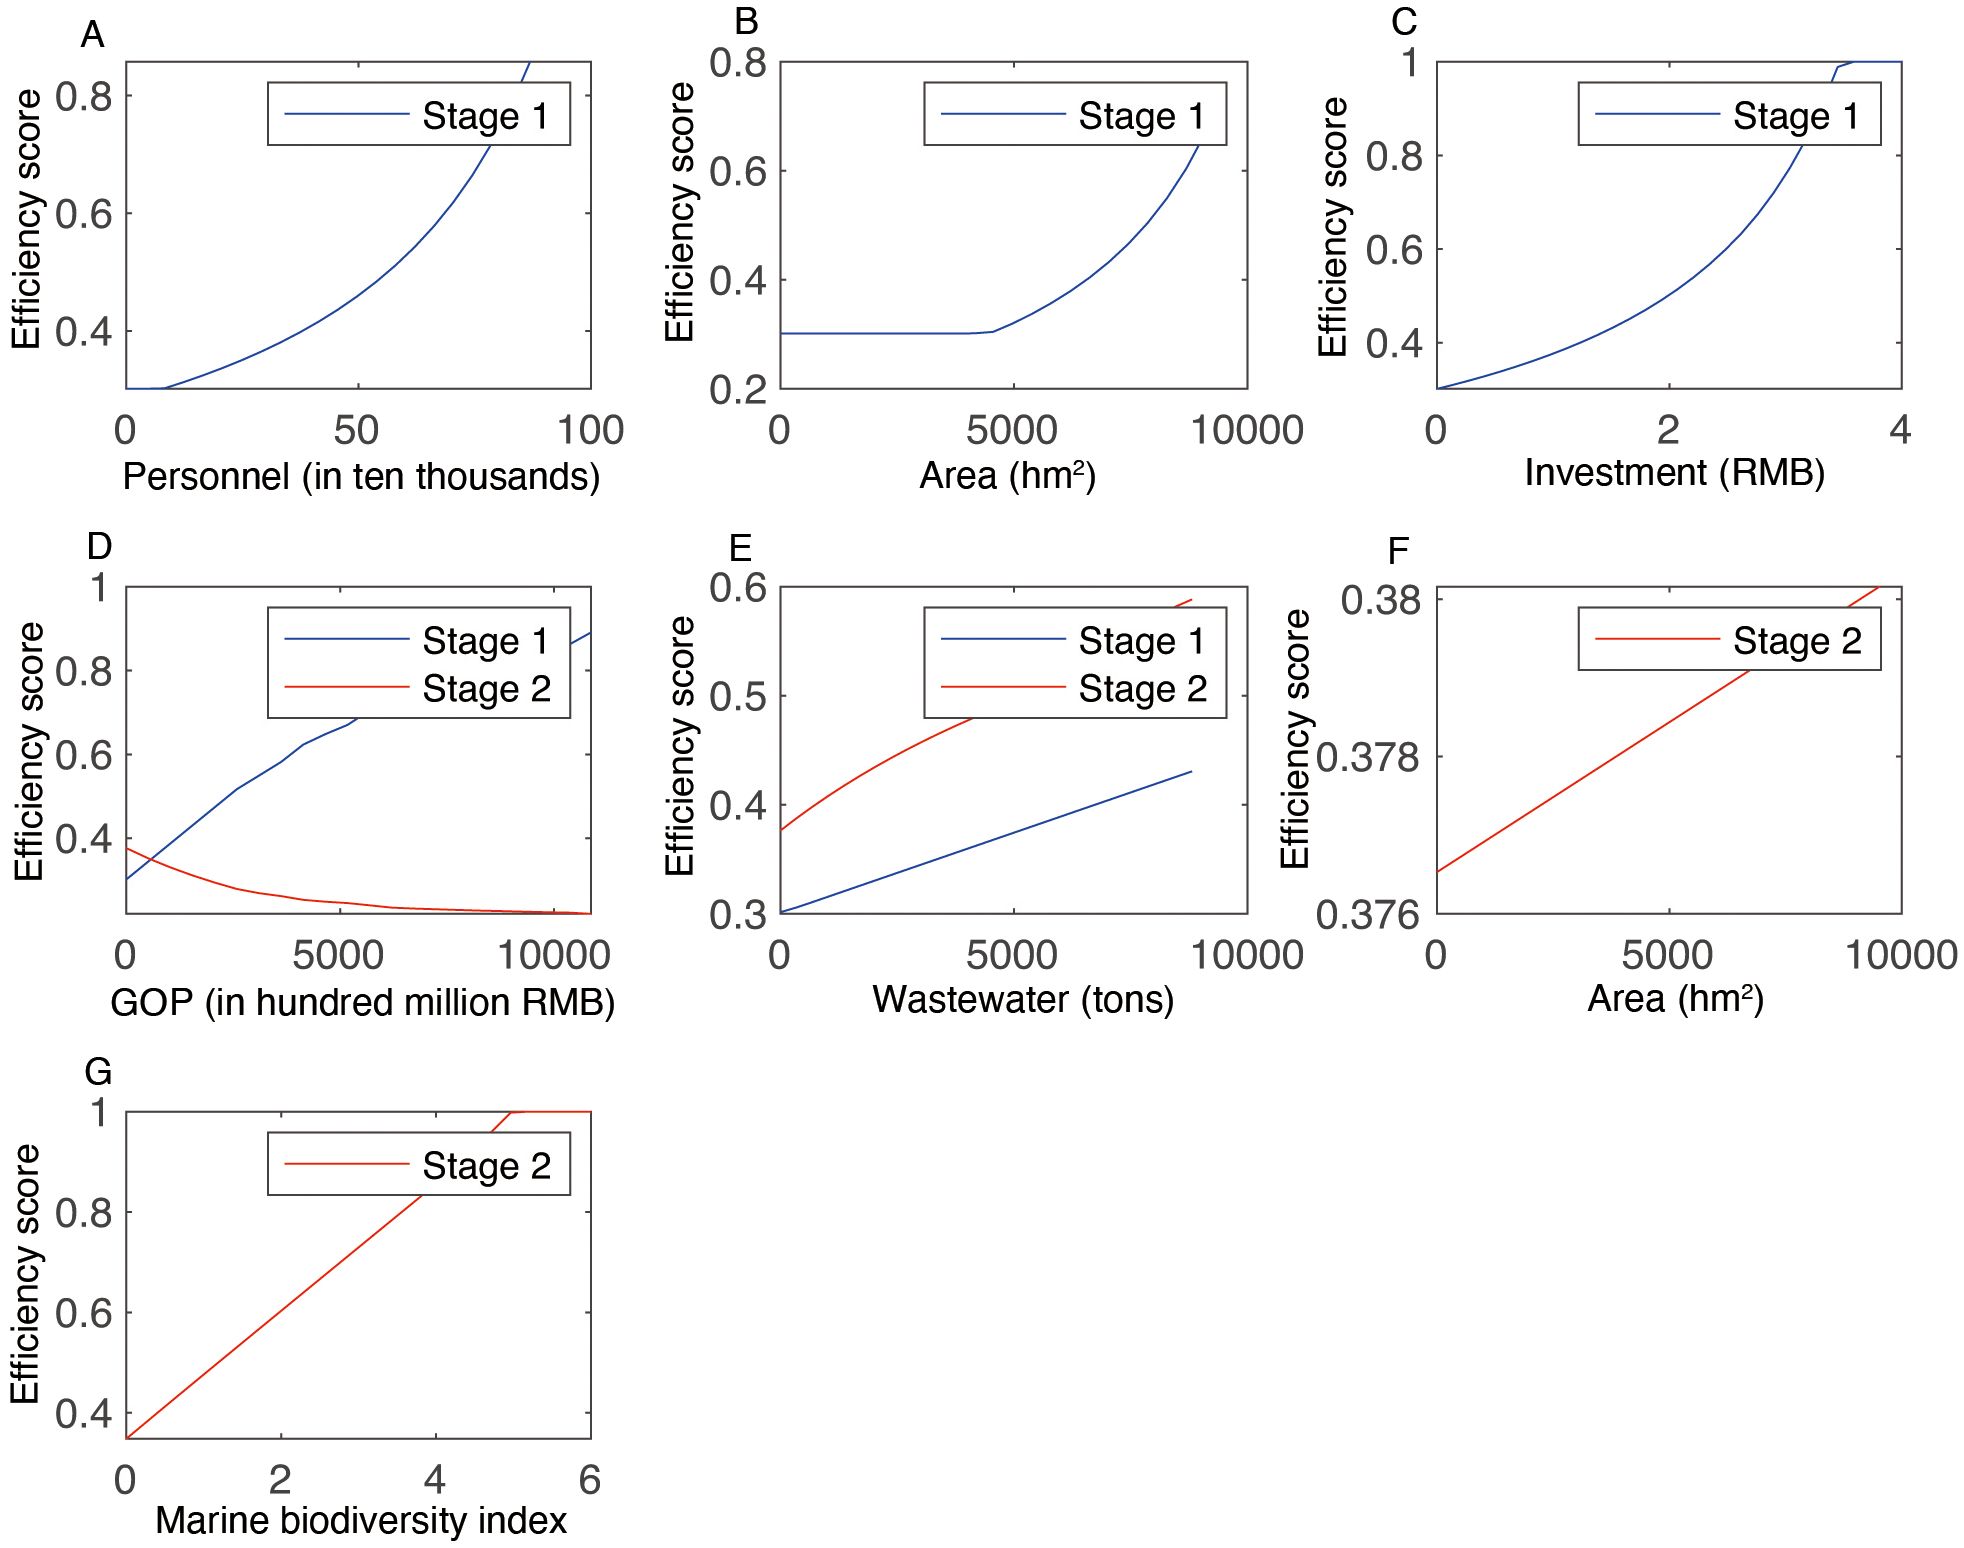
Figure 4. The influence of input and output changes on the efficiency score of Qingdao. (A) Ocean-related employed personnel (Ten thousand). (B) The area of waters with established rights. (C) Marine fixed assets investment. (D) Gross ocean product of marine economy. (E) Wastewater discharged directly into the sea. (F) The area of coastal waters with excellent and good water quality. (G) Marine biodiversity index.
The area of water with established right refers to the sea area of the project that has been approved by the government to obtain the entitlement to utilize the maritime zone. The more area of water with established right, the wider the ocean space for marine economic activities such as mariculture and ship navigation. However, after analyzing the sensitivity of X2 to MED, we found that most coastal cities in China have relatively low utilization of sea area. As shown in Figure 5, the MED efficiency scores of Weihai, Fuzhou, Yantai, Dalian and Yancheng are almost unchanged when the reduction is within 10,000 hm2. This implies that the local governments have considerable distance yet to traverse in terms of ocean utilization.
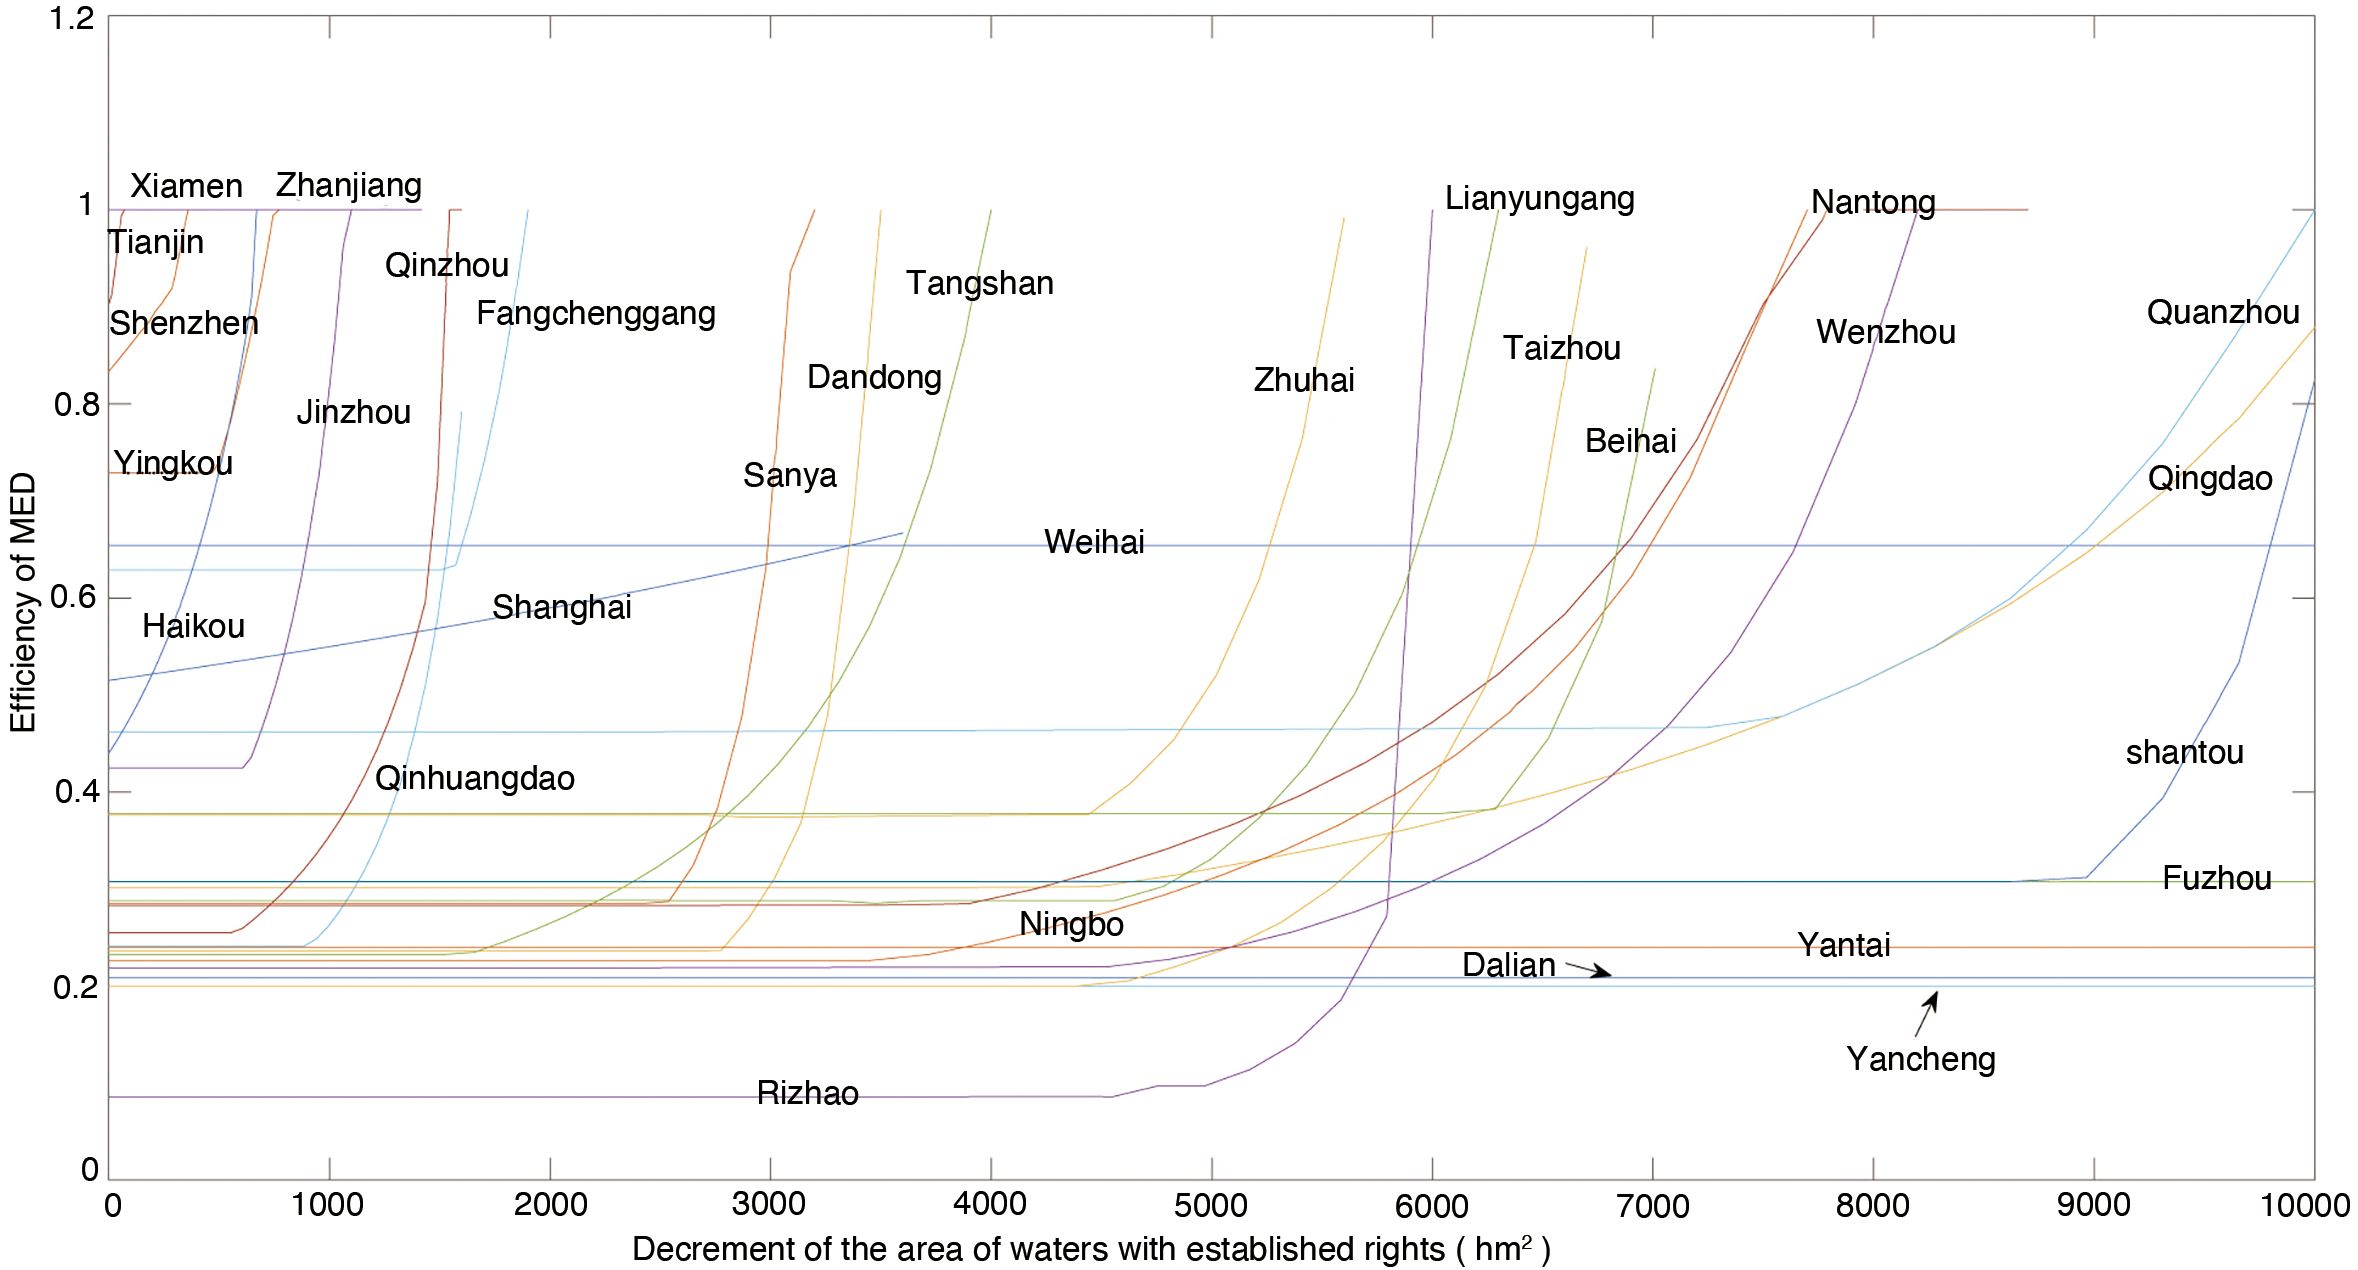
Figure 5. Response of the decrement of X2 to MED efficiency for 30 coastal cities of China.
Sometimes, constrained by limited resources (human, capital, information, time, techniques, etc), it is difficult to achieve the desired efficiency score for the target DMUoby changing a single input or output. Therefore, within the capacity of the DMUo, the ideal efficiency score may be achieved by changing several variables. For example, if only the number of ocean-related employed personnel is reduced (e.g. varying in the range [0, 80], −ΔX1) or the gross marine product is merely increased (e.g. varying in the range [0, 8000], +ΔZ1), it is difficult to make the DMU Qingdao reach an effective state under the constraints of its own resources. As shown in Figure 6, if we make a combination between ocean-related employed personnel and gross ocean product (e.g., {−ΔX1 = −24.55, +ΔZ1 = 7181.32}, {−ΔX1 = 35.66, +ΔZ1 = 6155.73}, {−ΔX1 = 66.53, +ΔZ1 = 2869.37} etc), then it can make the DMU Qingdao reach an effective state, providing the possibility for Qingdao to adjust input and output according to its own situation to improve efficiency.

Figure 6. Effect of X1 and Z1 on MED efficiency.
When the allocation of the three variables can be adjusted, it provides more options for the DMU to improve efficiency. Figure 7 presents the distribution of MED efficiency scores when simultaneously decreasing ocean-related employed personnel (−ΔX1) and marine fixed assets investment (−ΔX3), and increasing gross ocean product (+ΔZ1). From Figure 7, we can intuitively see how −ΔX1, −ΔX3 and +ΔZ1 shape the efficiency of the MED. According to the Figure 7, we probably know the distribution of efficiency scores, which provides a reference for the improvement direction.
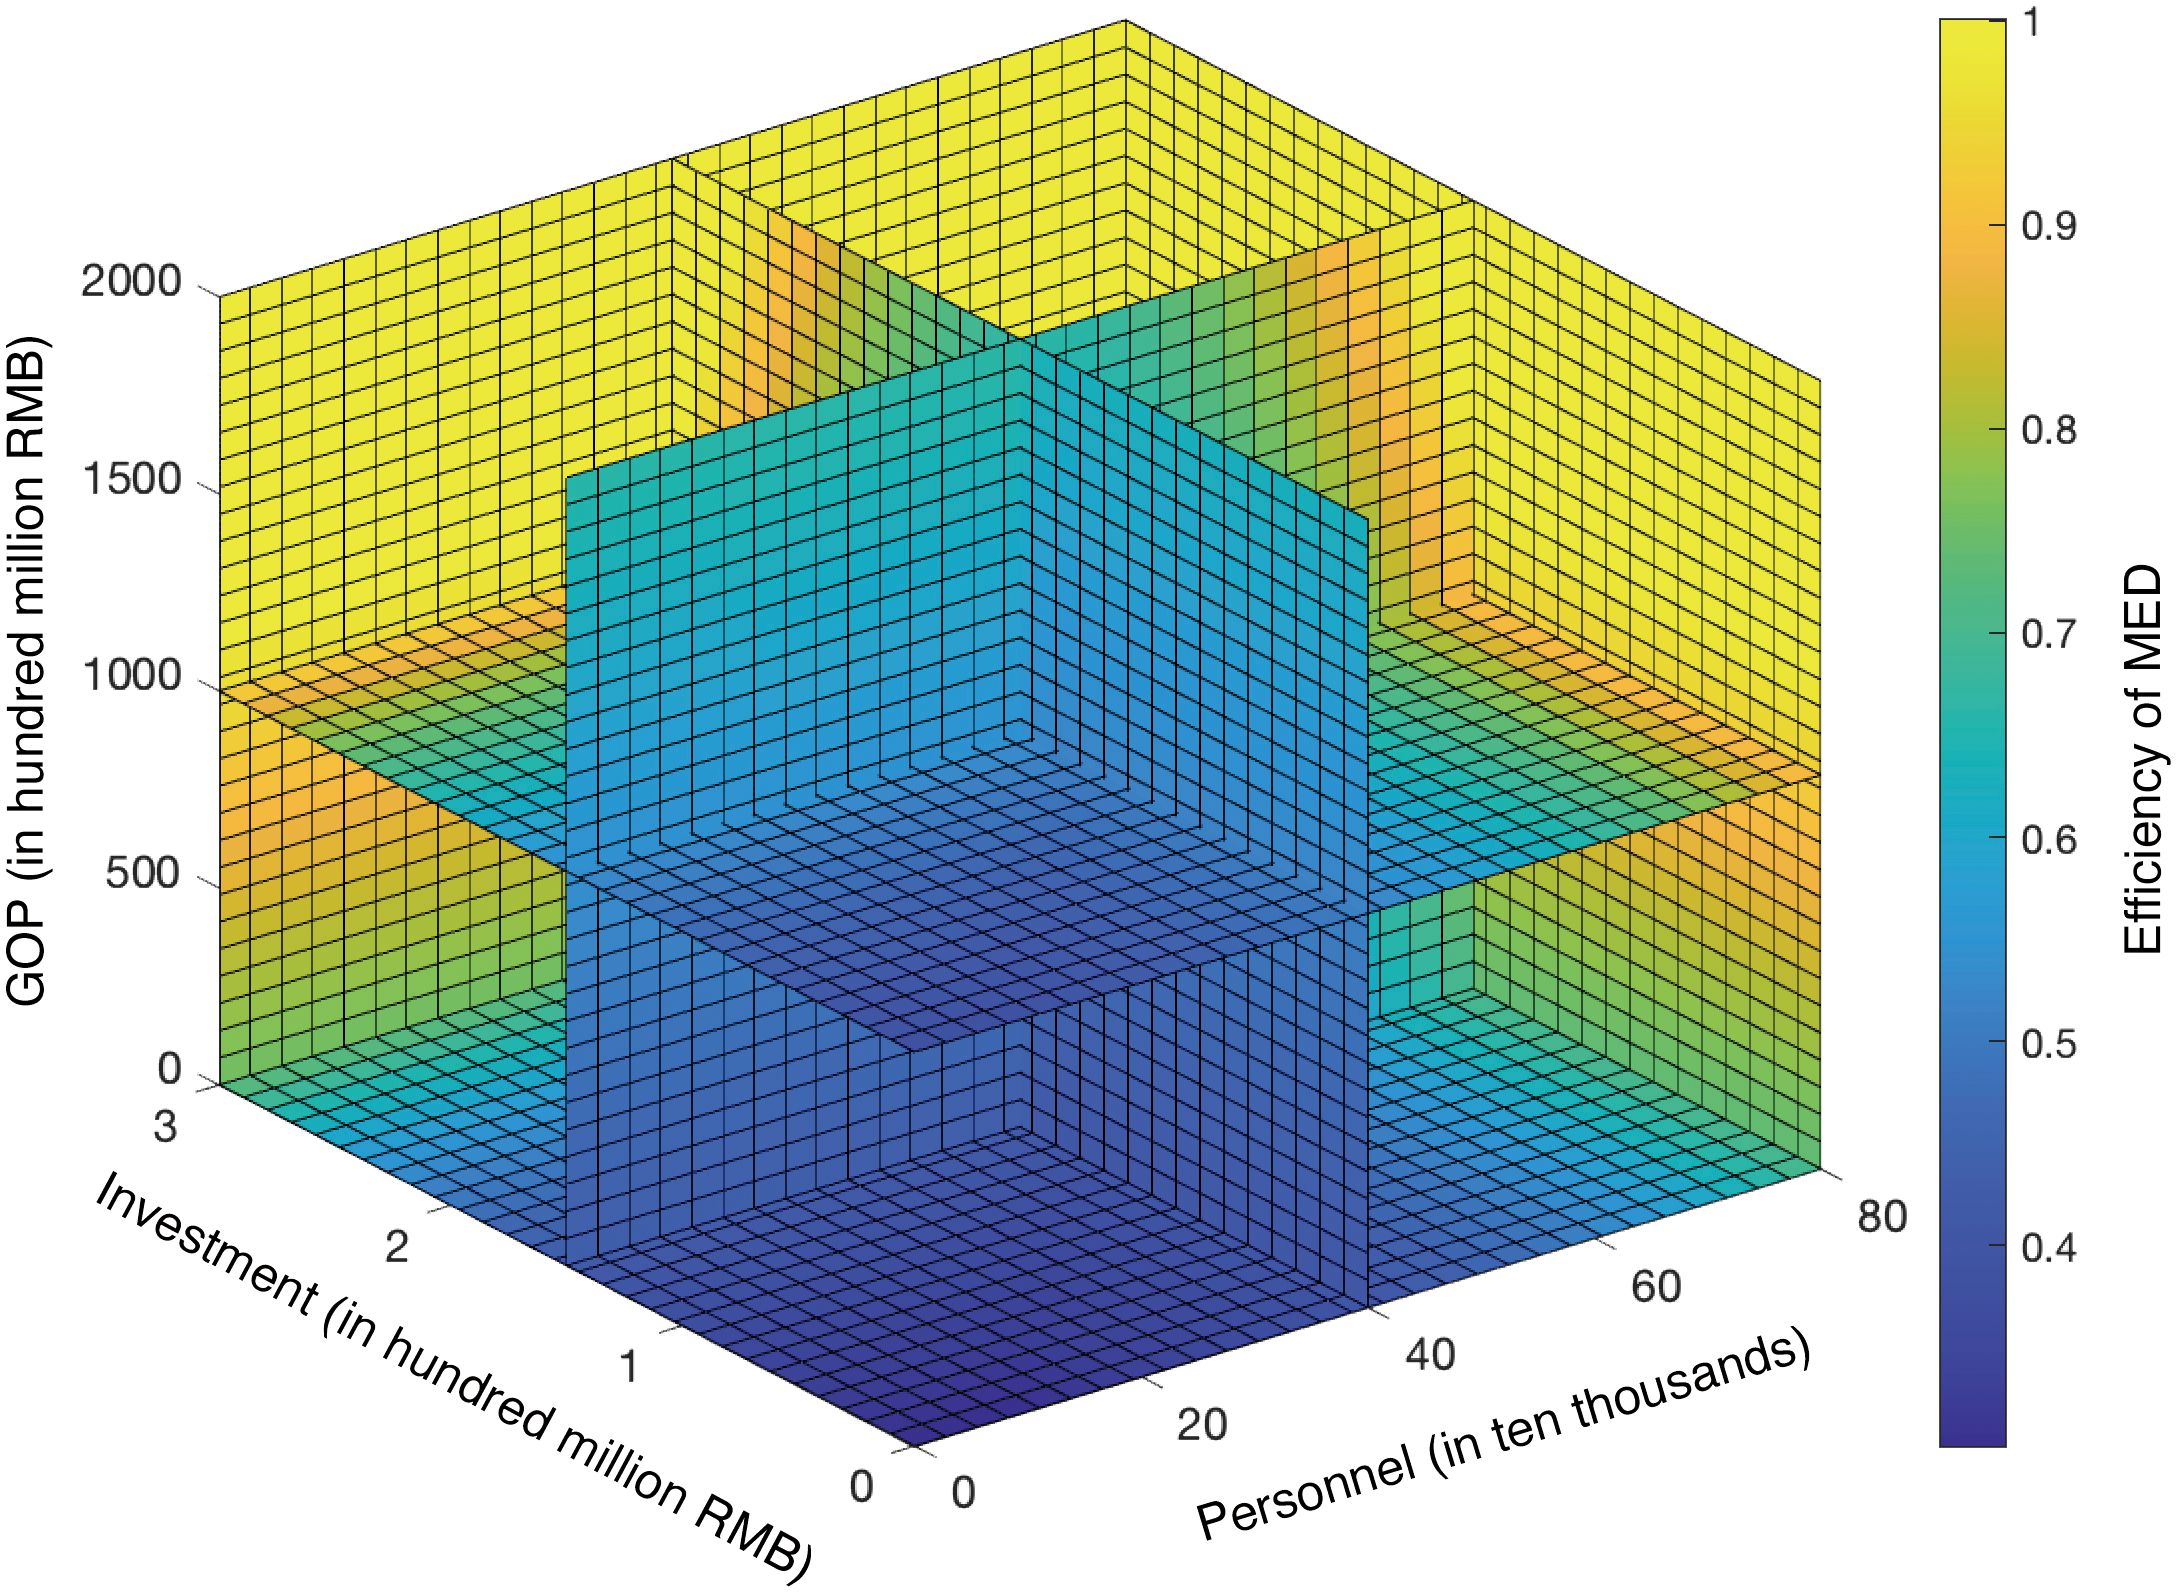
Figure 7. MED efficiency scores with varying X1, X3 and Z1.
4.5 Sensitivity and stability analysis of MEP
Next, we briefly analyze the sensitivity and stability of MEP. As shown in Figure 4, it’s easy to find that Qingdao’s MEP efficiency is constantly improving from 0.3765 to 0.3811 with the increment of the area of coastal waters with excellent and good water quality (+ΔY1). Yet, it can’t make Qingdao’s MEP reach an effective state. To improve the efficiency of MEP, compensation funds or resources can only be allocated to other aspects, such as increasing the gross marine product and maintaining marine biodiversity.
Marine biodiversity is the foundation of marine ecosystem services. Conserving marine biodiversity is not only critical to maintaining the functioning of Earth’s ecosystems, but is also closely related to human well-being. Figure 8 reports the impact of enhancing marine biodiversity on MEP’s efficiency in China’s coastal cities. Observing Figure 8, it behooves us to extrapolate the subsequent deductions. Firstly, increasing the marine biodiversity index has the same effect on the MEP efficiency of Yingkou and Weihai. Secondly, for some DMUs, increasing marine biodiversity almost cannot improve the efficiency of MEP in a certain range. As an example, when the increment of Tanshan’s biodiversity index is within the range [0,0.5], the efficiency of Tanshan’s MEP will remain unchanged. Finally, the efficiencies of Rizhao and Xiamen are already in the effective states, and increasing the marine biodiversity index will make them remain in effective states.
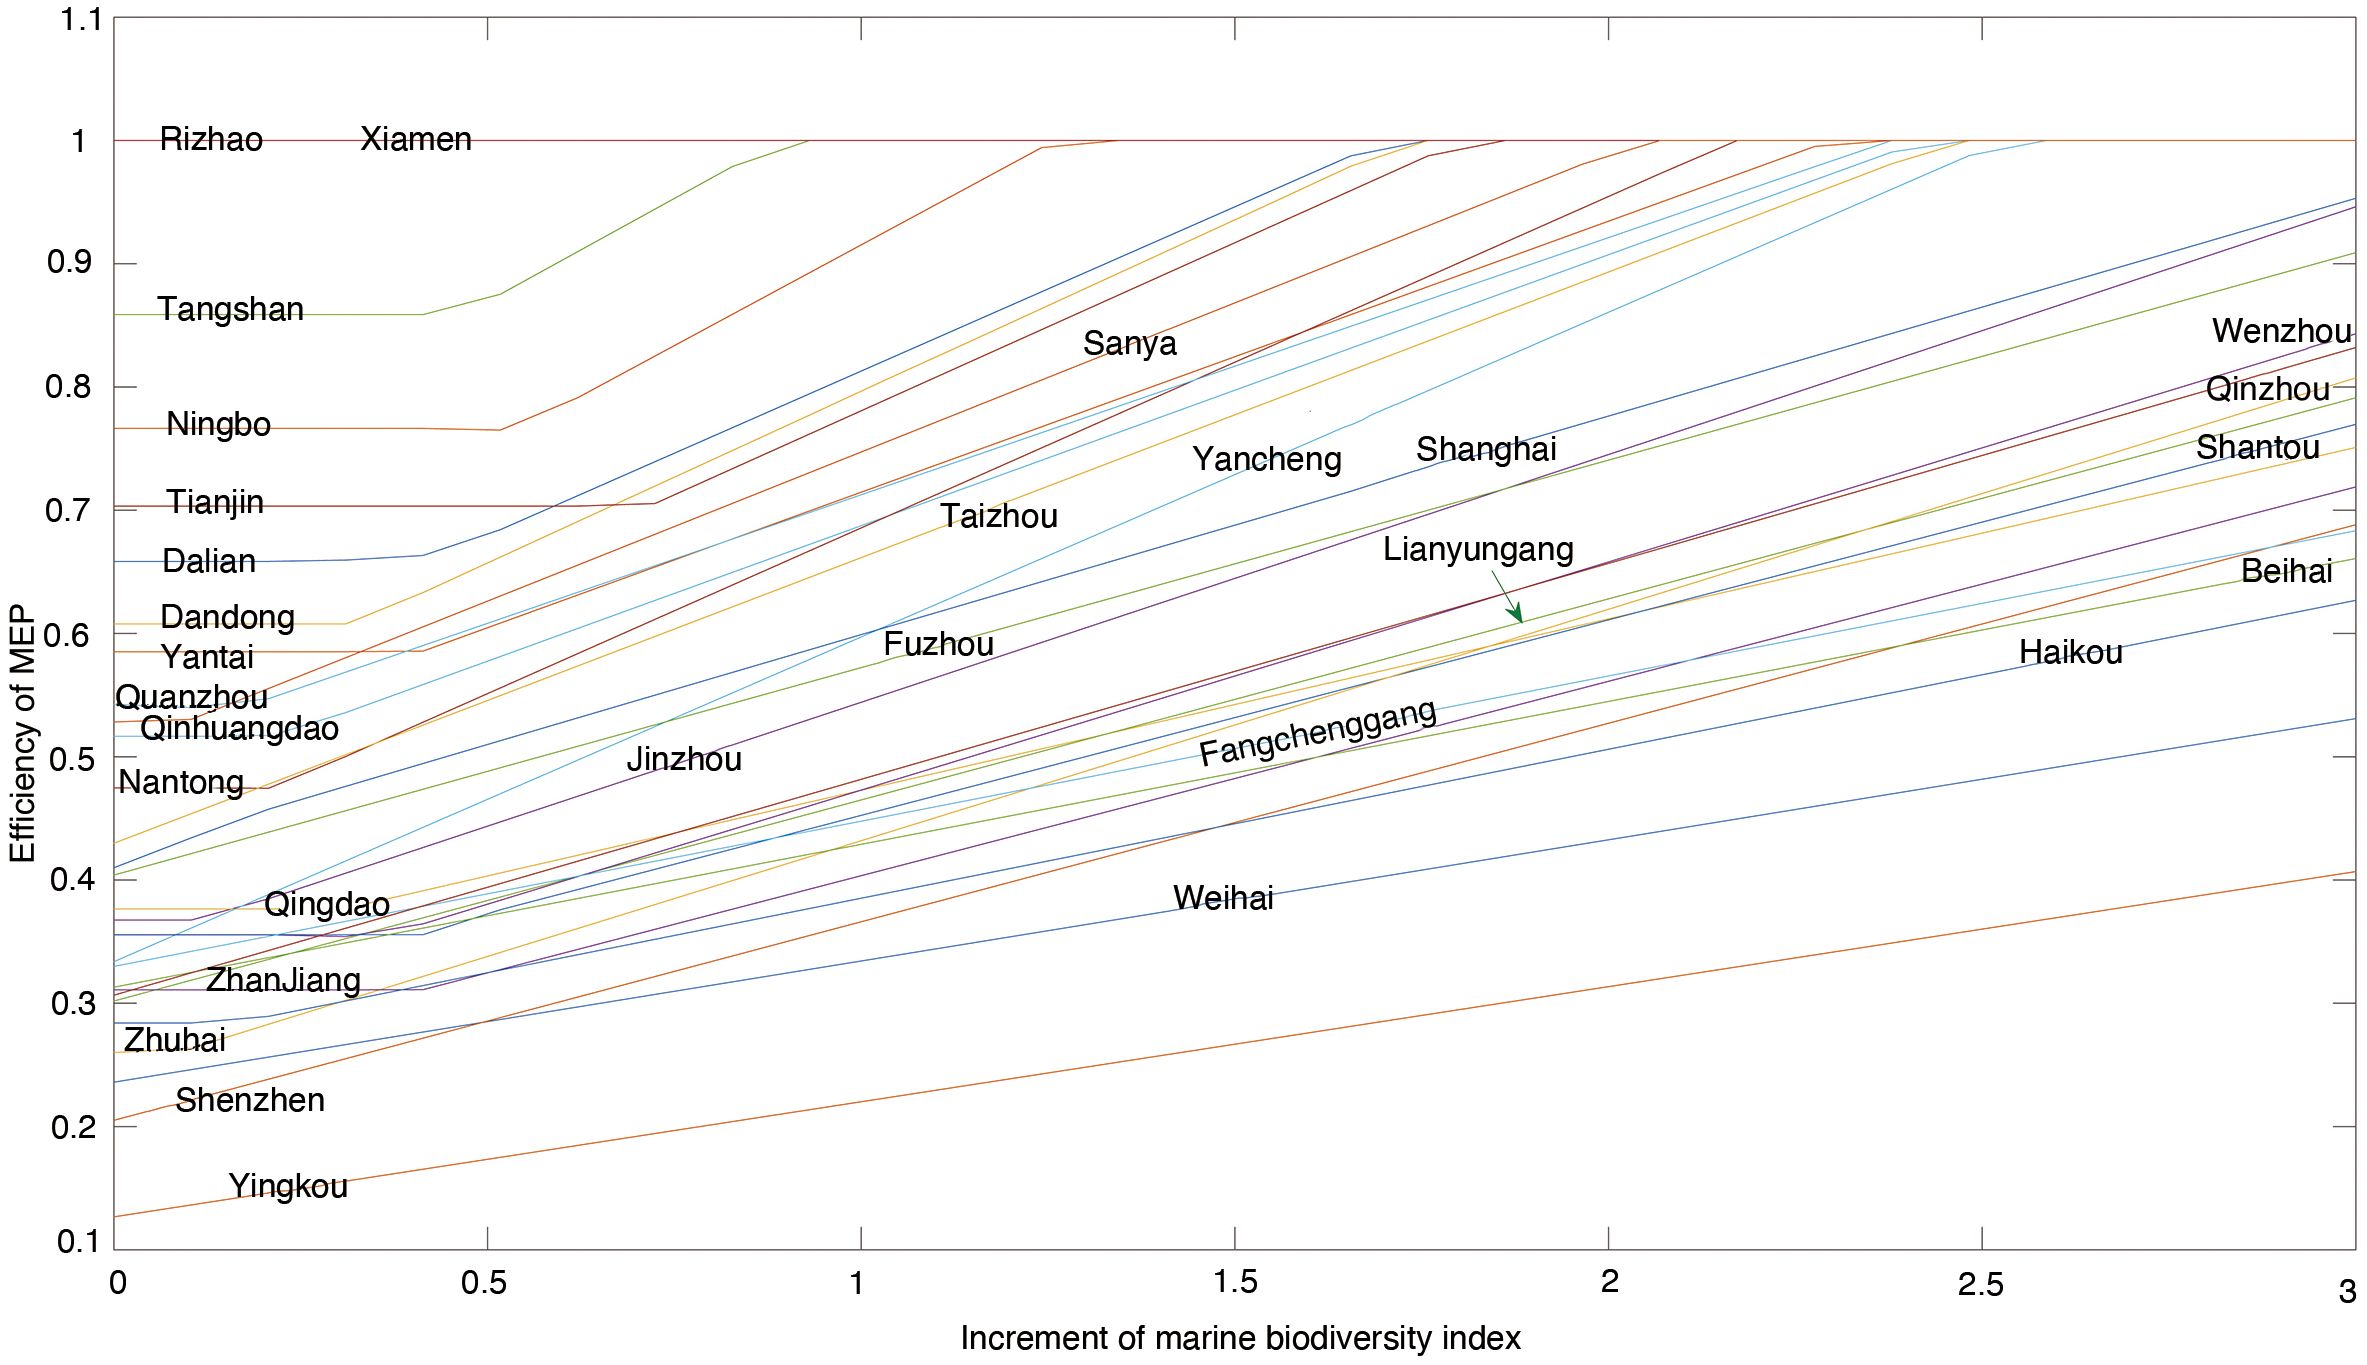
Figure 8. Response of marine biodiversity index increment to MEP efficiency for 30 coastal cities of China.
Figure 9 shows the effect of simultaneously increasing marine fixed assets investment (+ΔZ1) and marine biodiversity index (+ΔY2) on the efficiency of MEP in Jinzhou. Clearly, the increase in inputs limits the efficiency of MEP, while increasing the marine biodiversity index will significantly improve the efficiency of MEP. Figure 10 show the impacts of increasing gross ocean product (+ΔZ1), wastewater discharged (+ΔZ2) and marine biodiversity index (+ΔY2) on MEP’s efficiency in the form of section plot.
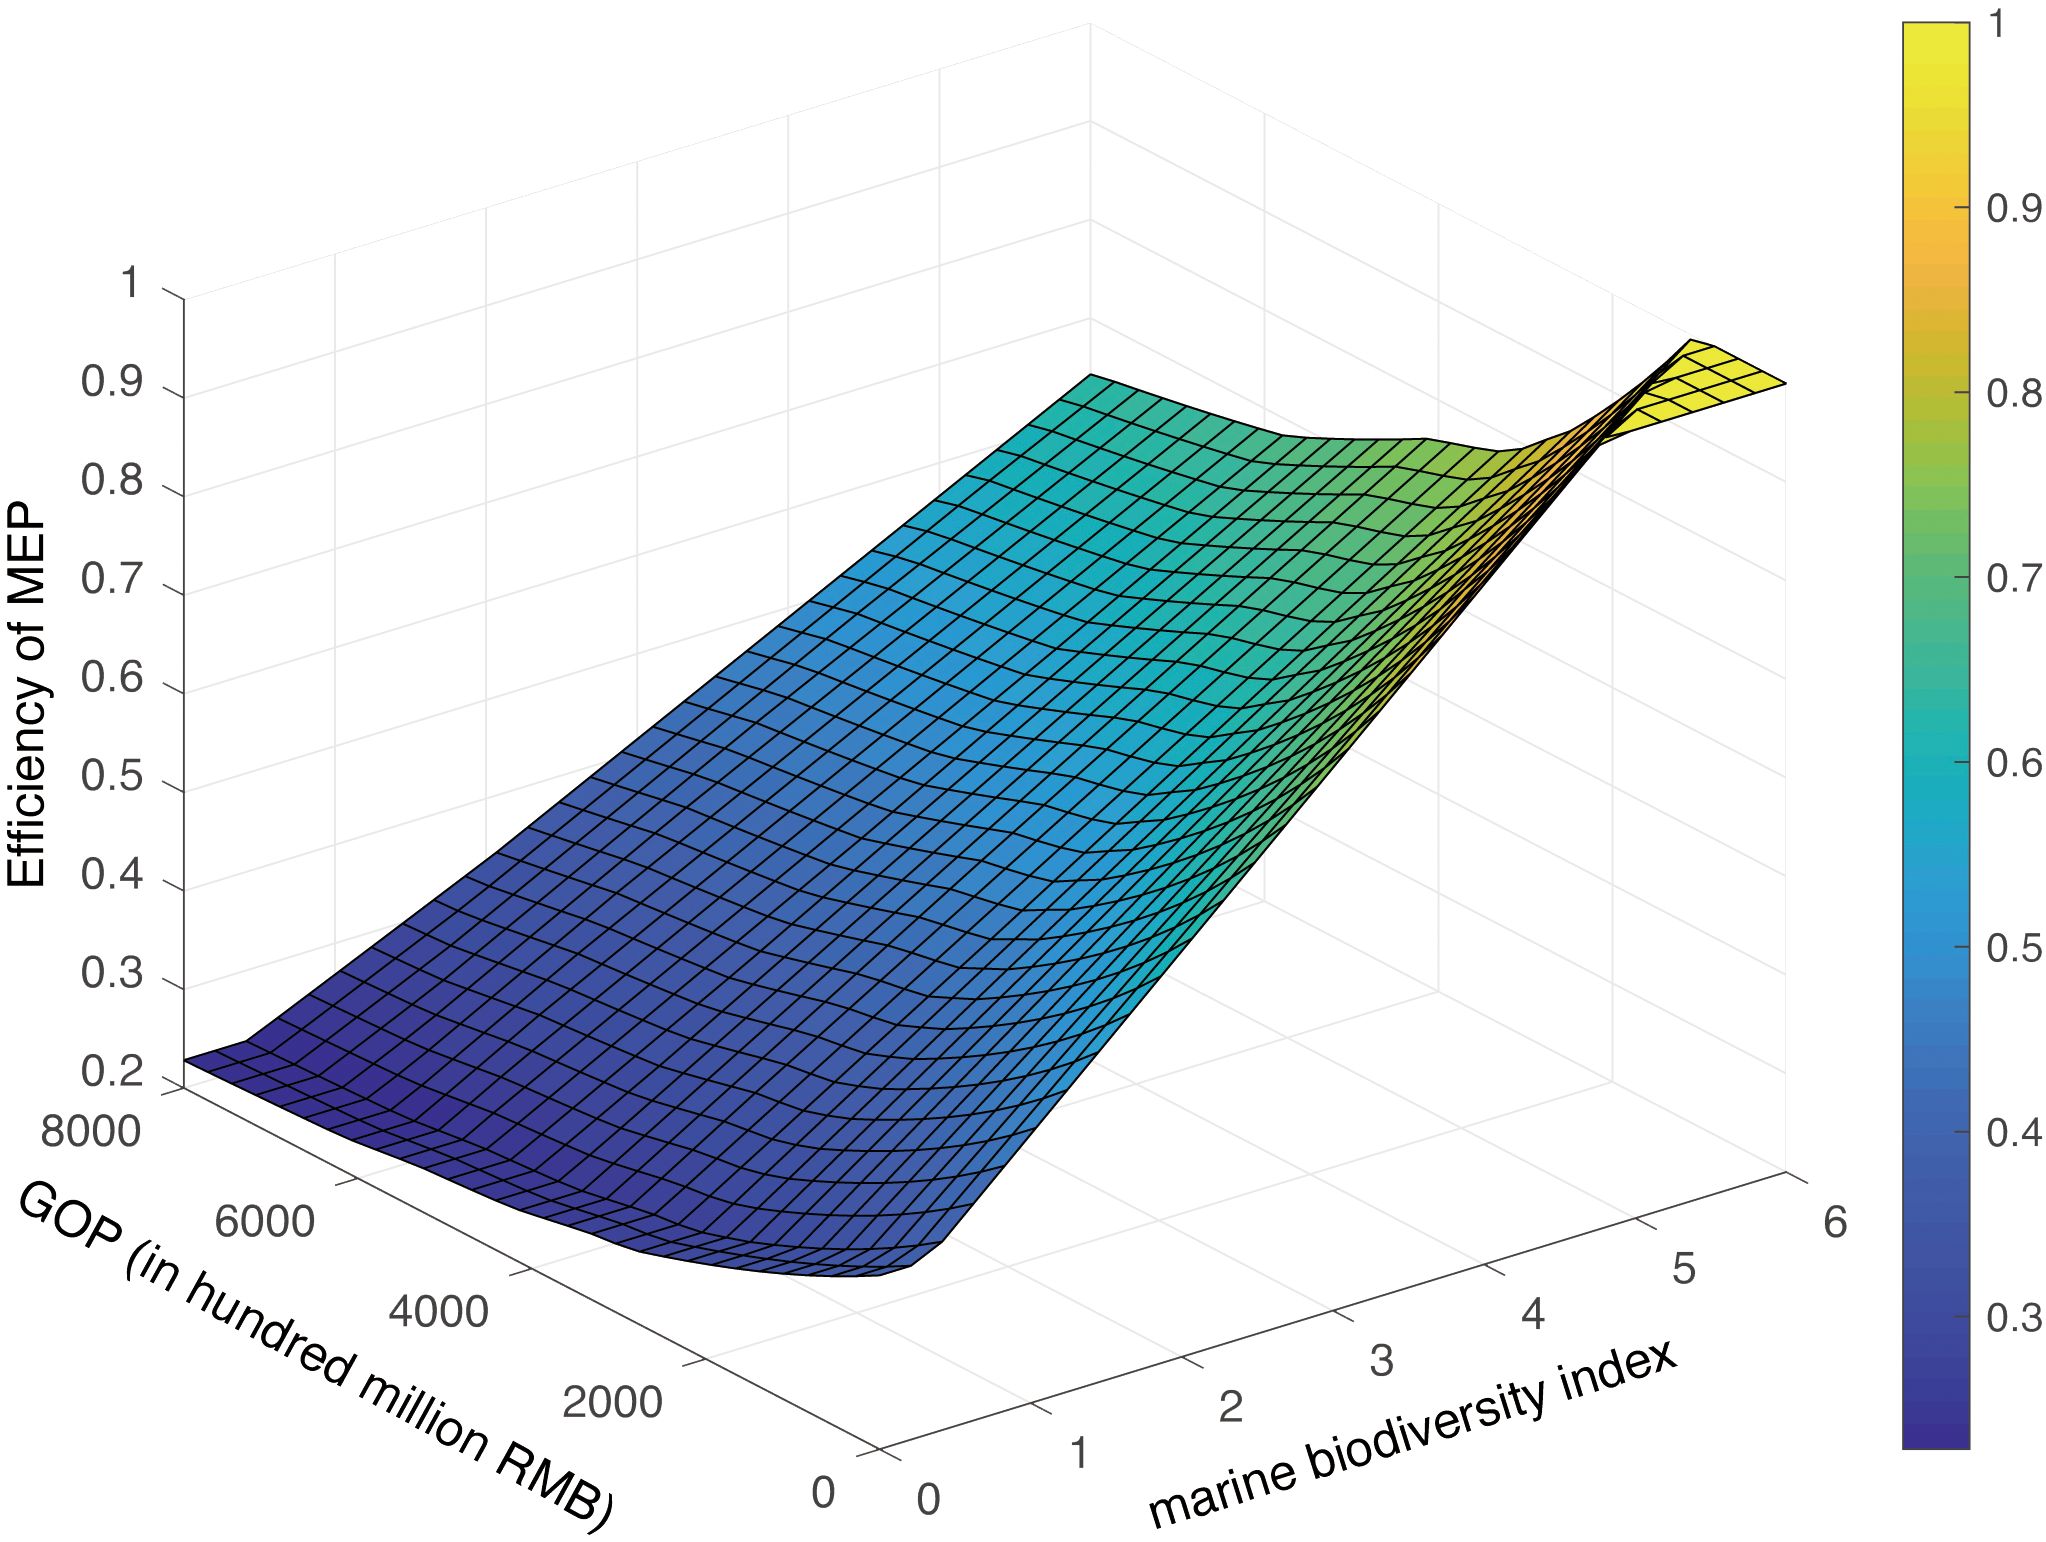
Figure 9. Effect of Y2 and Z1 on MEP efficiency.
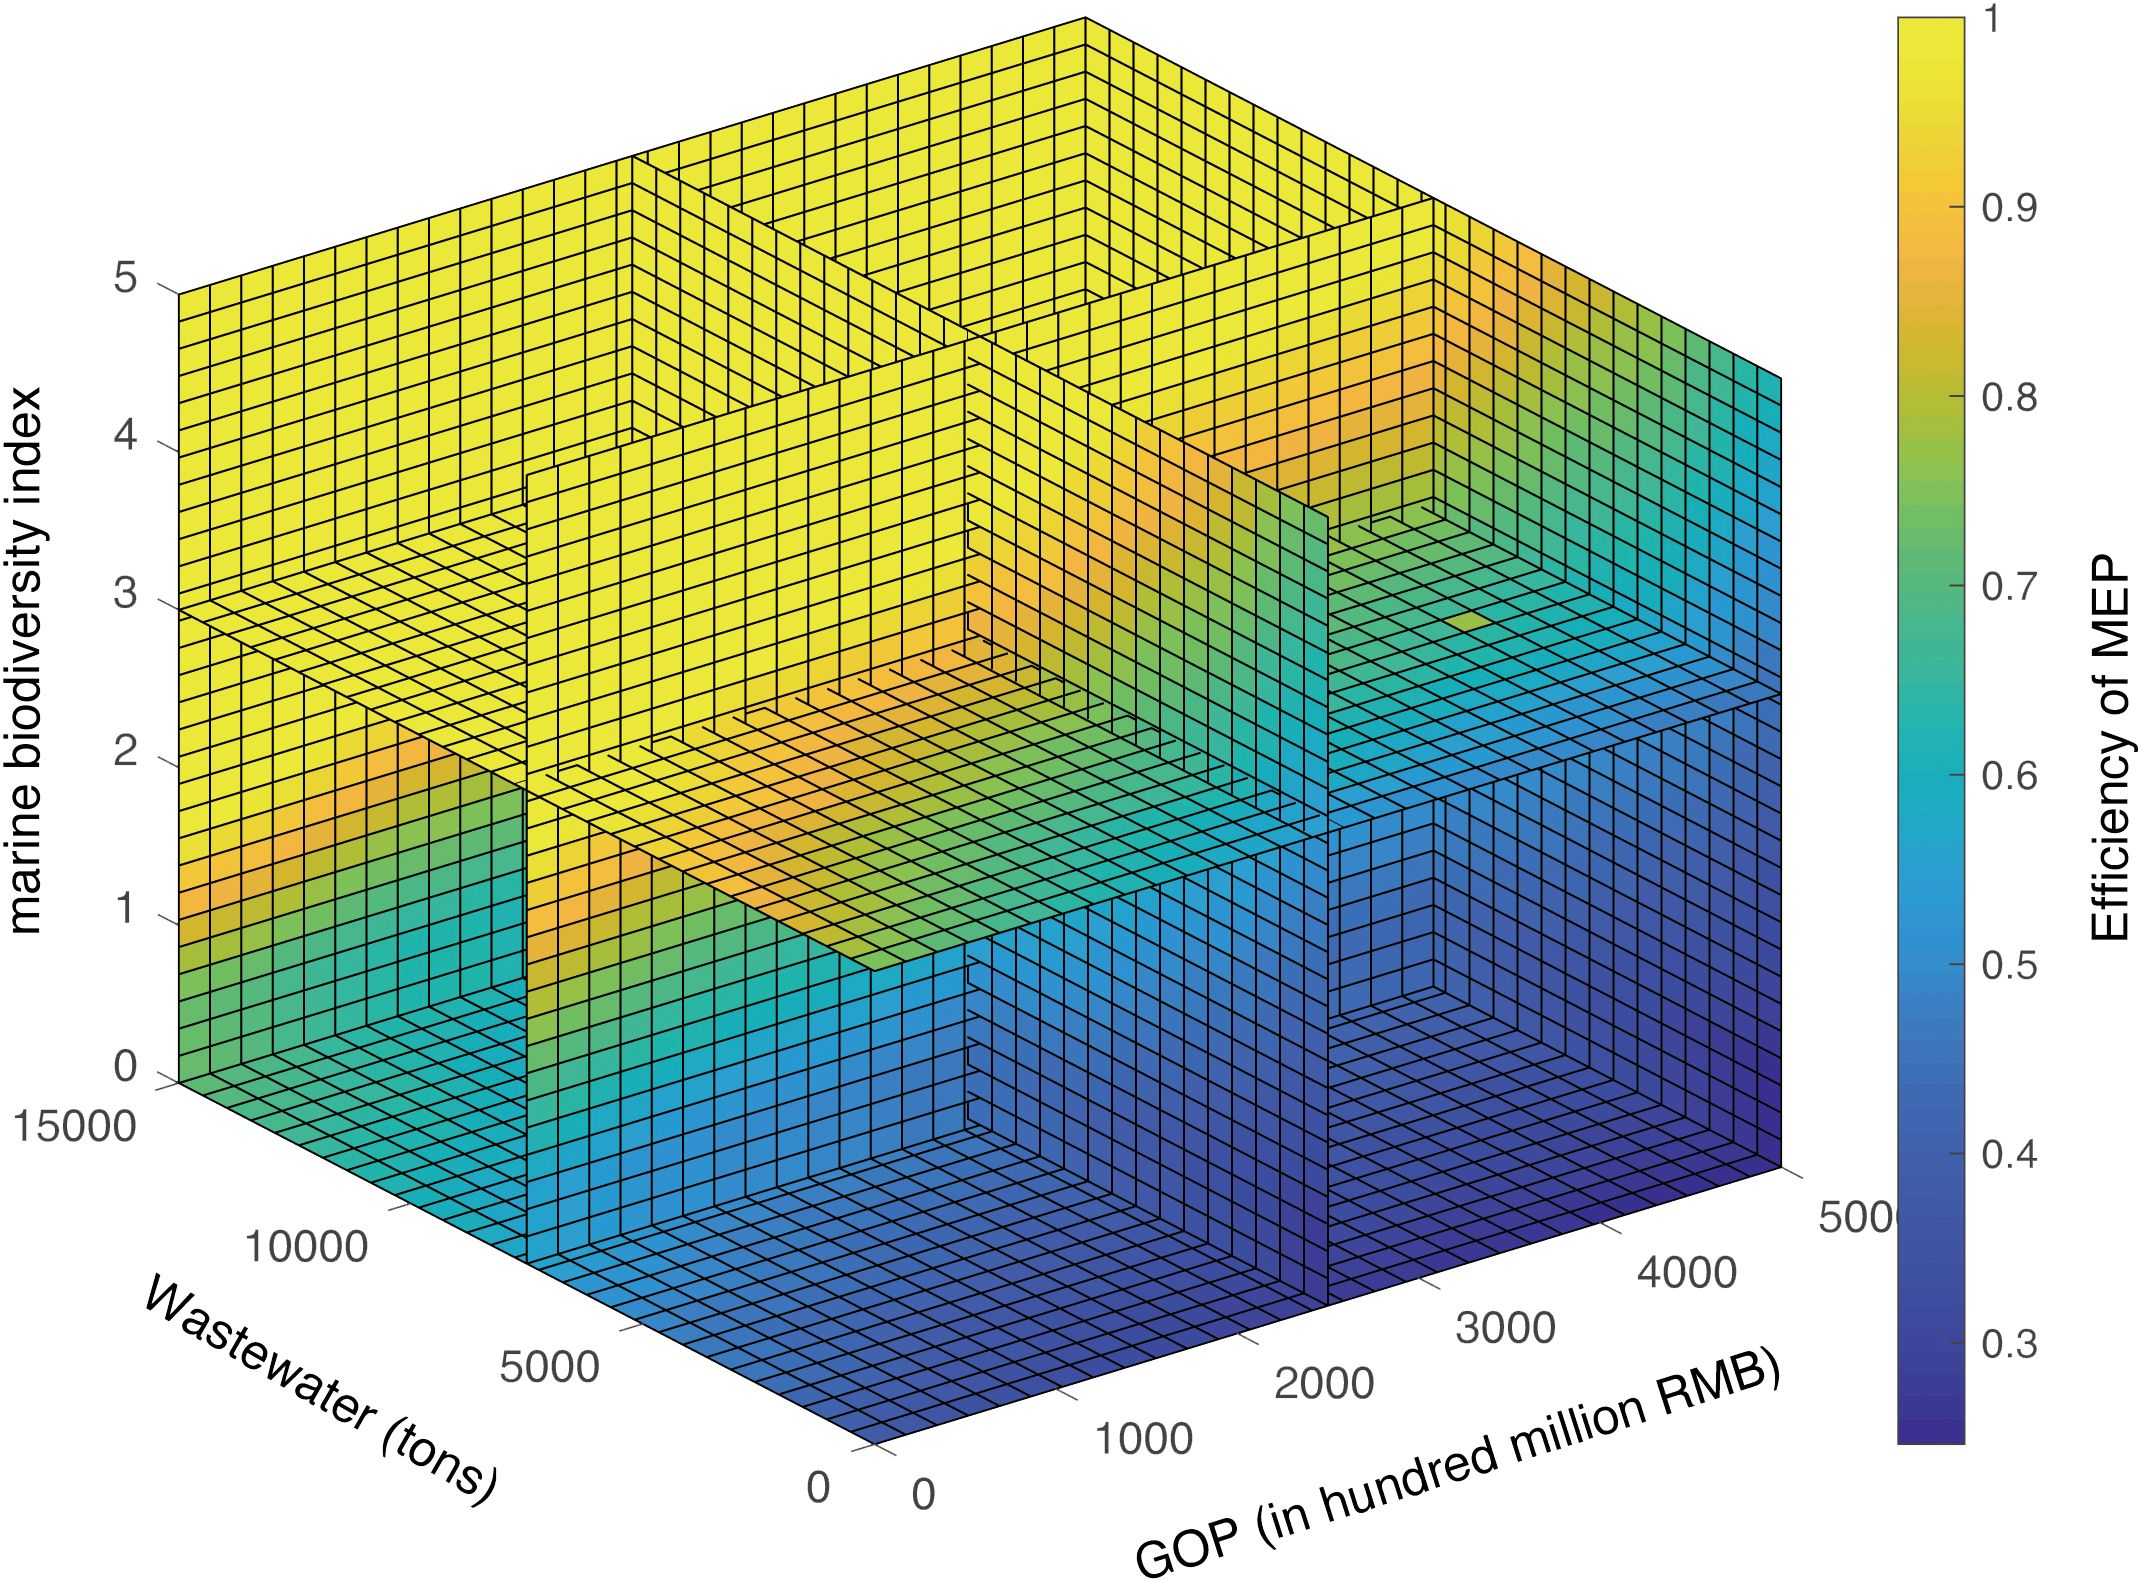
Figure 10. MEP efficiency scores with varying Z1, Z2 and Y2.
5 Conclusions
This study introduced a novel two-stage bargaining game DEA model to evaluate the performance of MEC in coastal cities of China. The proposed model considers the cooperative structure between MED and MEP, and addresses the limitations of conventional two-stage DEA models in handling uncertain variables. Key findings from the empirical research include: (1) There is a negative correlation between MED and MEP for desirable intermediate measures, while for undesirable intermediate measures, there is a positive correlation between MED and MEP. (2) Sensitivity analysis revealed that inputs and outputs have different impacts on the efficiency scores of MED and MEP, offering valuable insights for improving the efficiency of both systems. (3) The model successfully addresses the challenge of handling uncertain data, revealing the influence of uncertainty on MEC efficiency. The proposed model provides a more acceptable and reliable evaluation of MEC performance, facilitating a better understanding of the trade-offs between MED and MEP. The results highlight the importance of considering the interdependencies between economic development and environmental protection in the context of MEC.
Future research could expand the scope of the study by incorporating additional variables affecting MED and MEP and testing the influence of those variables on the efficiency scores using econometric models.
Data availability statement
Publicly available datasets were analyzed in this study. The raw data supporting the conclusions of this article will be made available by the authors, without undue reservation.
Author contributions
ZZ: Writing – original draft, Methodology, Software, Writing – review & editing, Conceptualization. XZ: Funding acquisition, Writing – original draft, Writing – review & editing, Data curation, Investigation. JG: Formal Analysis, Writing – original draft, Writing – review & editing, Project administration, Supervision. JL: Validation, Writing – review & editing, Resources, Visualization, Writing – original draft.
Funding
The author(s) declare financial support was received for the research, authorship, and/or publication of this article. This work was financially supported by Social Science Planning Fund Program, Shangdong Province (no. 23CSDJ70).
Conflict of interest
The authors declare that the research was conducted in the absence of any commercial or financial relationships that could be construed as a potential conflict of interest.
Publisher’s note
All claims expressed in this article are solely those of the authors and do not necessarily represent those of their affiliated organizations, or those of the publisher, the editors and the reviewers. Any product that may be evaluated in this article, or claim that may be made by its manufacturer, is not guaranteed or endorsed by the publisher.
References
Cao L., Wang M. (2022). Evaluation of marine ecological compensation policy in China: based on entropy method and quasi-natural experiment. Chin. fisheries economics 40, 1–11.
Charnes A., Cooper W. (1962). Programming with linear fractional functionals. Nav. Res. Logist. Q. 9, 181–186. doi: 10.1002/nav.3800090303
Charnes A., Cooper W., Lewin A., Morey R., Rousseau J. (1984). Sensitivity and stability analysis in dea. Ann. Oper. Res. 2, 139–156. doi: 10.1007/BF01874736
Charnes A., Cooper W., Rhodes E. (1978). Measuring the efficiency of decision making units. Eur. J. Oper. Res. 2, 429–444. doi: 10.1016/0377-2217(78)90138-8
Charnes A., Neralić L. (1990). Sensitivity analysis of the additive model in data envelopment analysis. Eur. J. Oper. Res. 48, 332–341. doi: 10.1016/0377-2217(90)90416-9
Chen X., Zhou F., Hu D., Yi G., Cao W. (2022). An improved evaluation method to assess the coordination between mineral resource exploitation, economic development, and environmental protection. Ecol. Indic. 138, 108808. doi: 10.1016/j.ecolind.2022.108808
Chen Y., Zhu J. (2004). Measuring information technology’s indirect impact on firm performance. Inf. Technol. Manage. 5, 9–22. doi: 10.1023/B:ITEM.0000008075.43543.97
Chu J., Wu J., Chu C., Zhang T. (2020). Dea-based fixed cost allocation in two-stage systems: Leader-follower and satisfaction degree bargaining game approaches. Omega 94, 102054. doi: 10.1016/j.omega.2019.03.012
Ding L., Lei L., Wang L., fu Zhang L., Calin A. C. (2020). A novel cooperative game network dea model for marine circular economy performance evaluation of China. J. Clean Prod. 253, 120071. doi: 10.1016/j.jclepro.2020.120071
Du J., Liang L., Chen Y., Cook W. D., Zhu J. (2011). A bargaining game model for measuring performance of two-stage network structures. Eur. J. Oper. Res. 210, 390–397. doi: 10.1016/j.ejor.2010.08.025
Färe R., Grosskopf S. (2000). Network dea. Socio-Econ. Plan. Sci. 34, 35–49. doi: 10.1016/S0038-0121(99)00012-9
Gao L., Bao W., Shi L. (2022). Governance mechanism and performance of marine eco-economic system: Evidence from China. Ecol. Indic. 136, 108668. doi: 10.1016/j.ecolind.2022.108668
Goldsmith R. W. (1951). “A perpetual inventory of national wealth,” in Studies in Income and Wealth (New York: National Bureau of Economic Research), vol. 14. , 5–73.
Guo C., Abbasi Shureshjani R., Foroughi A. A., Zhu J. (2017). Decomposition weights and overall efficiency in two-stage additive network dea. Eur. J. Oper. Res. 257, 896–906. doi: 10.1016/j.ejor.2016.08.002
Hinojosa M., Lozano S., Mármol A. (2016). Nash decomposition for process efficiency in multistage production systems. Expert Syst. Appl. 55, 480–492. doi: 10.1016/j.eswa.2016.02.039
Jiang B., Lio W., Li X. (2019a). An uncertain dea model for scale efficiency evaluation. IEEE Trans. Fuzzy Syst. 27, 1616–1624. doi: 10.1109/TFUZZ.2018.2883546
Jiang B., Peng L., Li J., Lio W. (2021). Uncertain network dea models for evaluating efficiencies of bi-echelon supply chain with asymmetric power. Iran. J. Fuzzy. Syst. 18, 87–100. doi: 10.22111/ijfs
Jiang B., Zou Z., Lio W., Li J. (2020). The uncertain dea models for specific scale efficiency identification. J. Intell. Fuzzy Syst. 38, 3403–3417. doi: 10.3233/JIFS-190662
Jiang M., Faure M. (2022). The compensation system for marine ecological damage resulting from offshore drilling in China. Mar. Pol. 143, 105132. doi: 10.1016/j.marpol.2022.105132
Jiang Y., Zhang J., Chen K., Xue X., Michael A. U. (2019b). Moving towards a systematic marine eco-compensation mechanism in China: Policy, practice and strategy. Ocean Coast. Manage. 169, 10–19. doi: 10.1016/j.ocecoaman.2018.12.002
Kangas J., Ollikainen M. (2019). Economic insights in ecological compensations: Market analysis with an empirical application to the finnish economy. Ecol. Econ. 159, 54–67. doi: 10.1016/j.ecolecon.2019.01.003
Kao C., Hwang S.-N. (2008). Efficiency decomposition in two-stage data envelopment analysis: An application to non-life insurance companies in Taiwan. Eur. J. Oper. Res. 185, 418–429. doi: 10.1016/j.ejor.2006.11.041
Kao C., Liu S.-T. (2011). Efficiencies of two-stage systems with fuzzy data. Fuzzy Sets Syst. 176, 20–35. doi: 10.1016/j.fss.2011.03.003
Levrel H., Pioch S., Spieler R. (2012). Compensatory mitigation in marine ecosystems: Which indicators for assessing the “no net loss” goal of ecosystem services and ecological functions? Mar. Pol. 36, 1202–1210. doi: 10.1016/j.marpol.2012.03.004
Liang L., Cook W. D., Zhu J. (2008). Dea models for two-stage processes: Game approach and efficiency decomposition. Nav. Res. Logist. 55, 643–653. doi: 10.1002/nav.20308
Liang L., Yang F., Cook W. D., Zhu J. (2006). Dea models for supply chain efficiency evaluation. Ann. Oper. Res. 145, 35–49. doi: 10.1007/s10479-006-0026-7
Lim S., Zhu J. (2013). Integrated data envelopment analysis: Global vs. local optimum. Eur. J. Oper. Res. 229, 276–278. doi: 10.1016/j.ejor.2013.02.023
Lio W., Liu B. (2018). Uncertain data envelopment analysis with imprecisely observed inputs and outputs. Fuzzy Optim. Decis. Mak. 17, 357–373. doi: 10.1007/s10700-017-9276-x
Liu C., Yang M. (2020). An empirical analysis of dynamic changes in ecological sustainability and its relationship with urbanization in a coastal city: The case of xiamen in China. J. Clean Prod. 256, 120482. doi: 10.1016/j.jclepro.2020.120482
Liu D., Zhu L. (2014). Assessing China’s legislation on compensation for marine ecological damage: A case study of the bohai oil spill. Mar. Pol. 50, 18–26. doi: 10.1016/j.marpol.2014.05.009
Lozano S. (2023). Bargaining approach for efficiency assessment and target setting with fixed-sum variables. Omega 114, 102728. doi: 10.1016/j.omega.2022.102728
Lozano S., Gutiérrez E. (2011). Slacks-based measure of efficiency of airports with airplanes delays as undesirable outputs. Comput. Oper. Res. 38, 131–139. doi: 10.1016/j.cor.2010.04.007
Lozano S., Hinojosa M., Mármol A. (2019). Extending the bargaining approach to dea target setting. Omega 85, 94–102. doi: 10.1016/j.omega.2018.05.015
Nejad Z. M., Hadigheh A. G. (2017). A novel dea model based on uncertainty theory. Ann. Oper. Res. 264, 367–389. doi: 10.1007/s10479-017-2652-7
Omrani H., Alizadeh A., Emrouznejad A., Teplova T. (2022). A robust credibility dea model with fuzzy perturbation degree: An application to hospitals performance. Expert Syst. Appl. 189, 116021. doi: 10.1016/j.eswa.2021.116021
Omrani H., Gharizadeh Beiragh R., Shafiei Kaleibari S. (2015). Performance assessment of Iranian electricity distribution companies by an integrated cooperative game data envelopment analysis principal component analysis approach. Int. J. Electr. Power Energy Syst. 64, 617–625. doi: 10.1016/j.ijepes.2014.07.045
Pagiola S. (2005). Assessing the efficiency of payments for environmental services programs: a framework for analysis (Washington: World Bank).
Pan X., Xu L., Yang Z., Yu B. (2017). Payments for ecosystem services in China: Policy, practice, and progress. J. Clean Prod. 158, 200–208. doi: 10.1016/j.jclepro.2017.04.127
Pourmahmoud J., Bagheri N. (2021). Providing an uncertain model for evaluating the performance of a basic two-stage system. Soft Comput. 25, 4739–4748. doi: 10.1007/s00500-020-05481-8
Rao H., Lin C., Kong H., Jin D., Peng B. (2014). Ecological damage compensation for coastal sea area uses. Ecol. Indic. 38, 149–158. doi: 10.1016/j.ecolind.2013.11.001
Ren W., Ji J., Chen L., Zhang Y. (2018). Evaluation of China’s marine economic efficiency under environmental constraints—an empirical analysis of China’s eleven coastal regions. J. Clean Prod. 184, 806–814. doi: 10.1016/j.jclepro.2018.02.300
Ren W., Xu Y., Ni J. (2023). Development, hotspots and trend directions of marine ecological compensation in China: A bibliometric-based assessment. Mar. Pol. 156, 105815. doi: 10.1016/j.marpol.2023.105815
Seiford L., Zhu J. (1998). Stability regions for maintaining efficiency in data envelopment analysis. Eur. J. Oper. Res. 108, 127–139. doi: 10.1016/S0377-2217(97)00103-3
Seiford L. M., Zhu J. (2002). Modeling undesirable factors in efficiency evaluation. Eur. J. Oper. Res. 142, 16–20. doi: 10.1016/S0377-2217(01)00293-4
Sengupta J. K. (1992). A fuzzy systems approach in data envelopment analysis. Comput. Math. Appl. 24, 259–266. doi: 10.1016/0898-1221(92)90203-T
Shi X., Zhang C., Yin K. (2020). Evaluation of marine ecological compensation efficiency in coastal provinces and cities of China. China Environ. Sci. 40, 3204–3215.
Sun Y., Li H. (2021). Data mining for evaluating the ecological compensation, static and dynamic benefits of returning farmland to forest. Environ. Res. 201, 111524. doi: 10.1016/j.envres.2021.111524
Tavana M., Khalili-Damghani K., Santos Arteaga F. J., Mahmoudi R., Hafezalkotob A. (2018). Efficiency decomposition and measurement in two-stage fuzzy dea models using a bargaining game approach. Comput. Ind. Eng. 118, 394–408. doi: 10.1016/j.cie.2018.03.010
Wang M., Li Y. (2014). Supplier evaluation based on nash bargaining game model. Expert Syst. Appl. 41, 4181–4185. doi: 10.1016/j.eswa.2013.12.044
Wen M., Guo L., Kang R., Yang Y. (2014). Data envelopment analysis with uncertain inputs and outputs. J. Appl. Math. 307108. doi: 10.1155/2014/307108
Wen M., Qin Z., Kang R., Zhang Y. (2015). Sensitivity and stability analysis of the additive model in uncertain data envelopment analysis. Soft Comput. 19, 1987–1996. doi: 10.1007/s00500-014-1385-7
Wen M., Zhang Q., Kang R., Yang Y. (2017). Some new ranking criteria in data envelopment analysis under uncertain environment. Comput. Ind. Eng. 110, 498–504. doi: 10.1016/j.cie.2017.05.034
Wu J., Liang L., Yang F., Yan H. (2009). Bargaining game model in the evaluation of decision making units. Expert Syst. Appl. 36, 4357–4362. doi: 10.1016/j.eswa.2008.05.001
Wu H., Lv K., Liang L., Hu H. (2017a). Measuring performance of sustainable manufacturing with recyclable wastes: A case from China’s iron and steel industry. Omega 66, 38–47. doi: 10.1016/j.omega.2016.01.009
Wu J., Sheng Y. (2022). Uncertain dea-malmquist productivity index model and its application. J. Intell. Fuzzy Syst. 44, 5295–5308. doi: 10.3233/JIFS-222109
Wu W., Yan S., Feng R., Song D., Chen X. (2017b). Development of an environmental performance indicator framework to evaluate management effectiveness for jiaozhou bay coastal wetland special marine protected area, Qingdao, China. Ocean Coast. Manage. 142, 71–89. doi: 10.1016/j.ocecoaman.2017.03.021
Wu J., Zhu Q., Ji X., Chu J., Liang L. (2016). Two-stage network processes with shared resources and resources recovered from undesirable outputs. Eur. J. Oper. Res. 251, 182–197. doi: 10.1016/j.ejor.2015.10.049
Yan X., Shi X., Fang X. (2022). The internal dynamics and regional differences of China’s marine economic evolution based on comprehensive evaluation. Alex. Eng. J. 61, 7571–7583. doi: 10.1016/j.aej.2022.01.016
Yang X., Morita H. (2013). Efficiency improvement from multiple perspectives: An application to Japanese banking industry. Omega 41, 501–509. doi: 10.1016/j.omega.2012.06.007
Yu S., Lei M., Deng H. (2023). Evaluation to fixed-sum-outputs dmus by non-oriented equilibrium efficient frontier dea approach with nash bargaining-based selection. Omega 115, 102781. doi: 10.1016/j.omega.2022.102781
Zhou Z., Lin L., Xiao H., Ma C., Wu S. (2017). Stochastic network dea models for two-stage systems under the centralized control organization mechanism. Comput. Ind. Eng. 110, 404–412. doi: 10.1016/j.cie.2017.06.005
Keywords: marine ecological compensation, uncertainty theory, uncertain DEA, uncertain variable, sustainable development
Citation: Zou Z, Zhang X, Gao J and Li J (2024) Performance evaluation of marine ecological compensation in coastal cities of China via a novel two-stage bargaining game DEA with imprecise data. Front. Mar. Sci. 11:1461376. doi: 10.3389/fmars.2024.1461376
Received: 08 July 2024; Accepted: 12 August 2024;
Published: 09 September 2024.
Edited by:
Song Ding, Zhejiang University of Finance and Economics, ChinaReviewed by:
Jiamin Ge, Anhui University, ChinaMeilin Wen, Beihang University, China
Chen Ming Bao, Macau University of Science and Technology, Macao SAR, China
Copyright © 2024 Zou, Zhang, Gao and Li. This is an open-access article distributed under the terms of the Creative Commons Attribution License (CC BY). The use, distribution or reproduction in other forums is permitted, provided the original author(s) and the copyright owner(s) are credited and that the original publication in this journal is cited, in accordance with accepted academic practice. No use, distribution or reproduction is permitted which does not comply with these terms.
*Correspondence: Xiaofan Zhang, emhhbmd4aWFvZmFuQG91Yy5lZHUuY24=