 Haiyi Shi
 Ying Chen
 Hui Gao
94% of researchers rate our articles as excellent or good
Learn more about the work of our research integrity team to safeguard the quality of each article we publish.
Find out more
ORIGINAL RESEARCH article
Front. Mar. Sci., 09 September 2024
Sec. Coastal Ocean Processes
Volume 11 - 2024 | https://doi.org/10.3389/fmars.2024.1461012
This article is part of the Research TopicAdvanced Monitoring, Modelling, and Analysis of Coastal Environments and EcosystemsView all 26 articles
Global warming, driven by human activities since the Industrial Revolution, has significantly elevated atmospheric carbon dioxide (CO2) levels, leading to higher global temperatures and a rise in extreme weather events. The ocean, as a major carbon sink, has absorbed about 30% of human-induced carbon emissions, helping mitigate global warming’s impacts. This study examines the spatiotemporal distribution of air-sea CO2 flux in the Northwest Pacific from 1982 to 2021 and its response to El Niño-Southern Oscillation, using Empirical Orthogonal Function and composite analysis. The seasonal patterns of air-sea CO2 flux and the influence of environmental factors were further evaluated. The results show that air-sea CO2 flux in the Northwest Pacific exhibits clear seasonal fluctuations. In winter, high-latitude areas act as significant carbon sources. Strong winds deepen the mixed layer, promoting CO2 release from the ocean into the atmosphere. In contrast, in summer, longer daylight hours, rising SST, and melting sea ice lead to upwelling, which brings nutrients to the surface and stimulates phytoplankton growth. This process turns the region into a carbon sink as phytoplankton growth, driven by intense sunlight, enhances the ocean’s CO2 absorption. The mid-latitude region consistently acts as a carbon sink year-round. During El Niño events, more negative air-sea CO2 flux anomalies appear in the eastern Northwest Pacific, enhancing carbon uptake. La Niña events have the opposite effect in the eastern regions. These findings highlight the Northwest Pacific’s critical role in modulating regional and global carbon cycles under varying climatic conditions. Understanding these dynamics is crucial for improving predictions of future climate impacts and for developing effective strategies to mitigate global warming.
Since the Industrial Revolution, human activities (primarily fossil fuel combustion and land use changes) have produced large amounts of carbon dioxide (CO2) (Le Quéré et al., 2018). In May 2021, the atmospheric CO2 concentration reached a historical peak of 414.7 ppm, approximately 49% higher than pre-industrial levels (Friedlingstein et al., 2021). As atmospheric CO2 concentrations increase, the global average temperature also shows an upward trend (Houghton, 2007; Li et al., 2023). The rise in global temperatures leads to more frequent extreme weather events, reduces biodiversity, and affects ocean circulation and marine ecosystems (Geng et al., 2023; Shan et al., 2023; Wang et al., 2022).
The ocean is a significant carbon sink, playing an indispensable role in the global carbon cycle and climate change processes (Muller-Karger et al., 2005; Pittman et al., 2022; Wang et al., 2015). It has absorbed approximately 30% of the carbon emissions produced by human activities (Khatiwala et al., 2013; Sabine et al., 2004), mitigating the extent of global warming. While the ocean regulates climate change, climate change also affects ocean carbon sinks, creating an interaction between changes in ocean carbon sinks and climate change (Tan et al., 2009). If the ocean’s ability to absorb CO2 weakens, the growth rate of atmospheric CO2 concentrations will accelerate, leading to more severe global warming and its potential climate impacts (Le Quéré et al., 2009). The air-sea CO2 flux, representing the exchange of CO2 between the ocean and the atmosphere, directly reflects the distribution and strength of oceanic carbon sources and sinks (Rustogi et al., 2023). Studying the distribution and variation of air-sea CO2 flux helps us understand the interaction mechanisms between different parts of the earth system, thereby improving our understanding and prediction of the environmental effects of carbon emissions.
The Northwest Pacific is an important atmospheric CO2 sink (Gruber et al., 2009; Takahashi et al., 2009). Changes in ocean carbon sinks and reservoirs will have a significant impact on the climate system. During non-El Niño periods, the equatorial Pacific releases 0.4 – 1.0 Pg C yr−1 of CO2 annually (Feely et al., 2002; Iida et al., 2015; Loukos et al., 2000; Takahashi et al., 2009). However, during El Niño events, weakened easterly trade winds and reduced upwelling in the eastern Pacific lower nutrient levels and deepen the thermocline, decreasing CO2 emissions in the central and eastern equatorial Pacific while increasing them in the western Pacific. This results in a reduced carbon source of 0.2 – 0.4 Pg C annually for the equatorial Pacific (Feely et al., 2002; Ishii et al., 2014; Loukos et al., 2000). These variations not only affect regional carbon fluxes but also have measurable impacts on the global atmospheric.
Understanding the seasonal characteristics of air-sea CO2 flux in the Northwest Pacific and its responses to environmental factors are crucial for elucidating its role in the global carbon cycle. Our study analyzes the spatiotemporal distribution of air-sea CO2 flux and investigates its responses to environmental drivers from 1982-2021 in the Northwest Pacific According to the seasonal spatial characteristic of air-sea CO2 flux, we divided the Northwest Pacific into two regions, that is, Region A is the area north of 45°N, and Region B is the area between 15°N and 45°N (Figure 1). Furthermore, we explore the responses of air-sea CO2 flux during El Niño and La Niña periods, aiming to deepen our understanding of the region’s carbon dynamics under varying climatic conditions.

Figure 1. Depth map of the study area. Box (A) is the high-latitude region of the Northwest Pacific Ocean (north of 45°N), and box (B) is the mid-high latitude region (between 15°N and 45°N). The orange line with arrows represents Kuroshio and its extension.
The daily sea surface temperature (SST) data is obtained from the Advanced Very High-Resolution Radiometer (AVHRR) satellite sensor provided by National Oceanic and Atmospheric Administration (NOAA) and accessed through the Optimum Interpolation Sea Surface Temperature (OISST) database. The spatial resolution of this dataset is 0.25° × 0.25°.
The monthly data of chlorophyll-a (Chl-a) with a 0.04° ×0.04° spatial resolution derived from four different sensors of Sea Wifs, Modis, Meris, and Viirs with GSM Model (Maritorena et al., 2010; Maritorena and Siegel, 2005) are generated from Glob Colour database provided by Hermes. Note that since the satellite Chl-a data started in September 1997, the data from 1998 to 2021 were selected for the correlation analysis of Chl-a and air-sea CO2 flux.
The monthly 10 m wind and evaporation-precipitation (E-P) data come from the global atmospheric reanalysis product ERA5 provided by the European Center for Medium-Range Weather Forecasts (ECMWF). The 10 m wind data includes wind speed and the u/v components at a height of 10 meters. The spatial resolution is 0.25° × 0.25°.
The monthly sea surface salinity (SSS) and mixed layer depth (MLD) with a resolution of 0.25° × 0.25°, are from the ORAS5 global ocean reanalysis data provided by the Copernicus.
The air-sea CO2 flux data are provided by Jersild et al. (2017) and can be accessed from the NOAA Ocean Carbon Data System (OCADS). The sea surface pCO2 data is simulated based on the second version of the Surface Ocean CO2 Atlas (SOCAT) using a two-step neural network method (self-organizing map-feedforward neural network, SOM-FFN) developed by Landschützer et al. (2013). This dataset covers the global ocean (excluding the Arctic Ocean) from January 1982 to December 2021, providing monthly average data. The method was initially developed by Landschützer et al. (2013) and later improved and updated (Landschützer et al., 2016). The spatial resolution of the data is 1° × 1°. The air-sea carbon flux data is calculated using the standard bulk formula and high-resolution wind speed.
The Oceanic Niño Index (ONI) data is provided by the Climate Prediction Center (CPC) of the NOAA (https://origin.cpc.ncep.noaa.gov/). ONI index ≥ 0.5°C or ≤ -0.5°C for more than 5 months is a warm event (El Niño event) or a cold event (La Niña event).
The calculation formula of air-sea CO2 flux is mainly based on empirical formula (Wanninkhof, 1992):
Where the F is the air-sea CO2 flux; is the difference between the average ocean and atmospheric CO2 partial pressures; E is the average gas transmission coefficient (gas exchange coefficient) at the air-sea interface, and its calculation formula is:
Where is the solubility of CO2 in seawater, which is a function of temperature and salinity. k is the gas transmission rate at the air-sea interface, which is proportional to the square of the wind speed.
Where is the Schmidt number of CO2 in seawater (S = 35); 660 is the Schmidt number of CO2 in seawater at 20°C; f is a proportionality factor, which is 0.31 for short-term wind calculations (Wanninkhof, 1992).
The Schmidt number of a dissolved gas component in water is the quotient of the kinematic viscosity of water and the diffusion coefficient of the gas, and can usually be expressed as a function of temperature and salinity. For CO2 in seawater (salinity 35 psu, temperature range 0 – 30°C), its is:
The empirical orthogonal function (EOF) is a statistical analysis method that decomposes the data matrix of the original variable field into an eigenvector matrix and a time coefficient matrix, which is used to extract the main characteristics of the elements (Navarro and Ruiz, 2006). If the components of the eigenvectors have the same sign, it means that the change trend of the variables in this pattern is basically the same; if the components of the eigenvectors have different signs, it indicates an opposite spatial distribution form. The time coefficient corresponding to the eigenvector represents the time change characteristics of different distribution forms. The larger the absolute value of the time coefficient, the more typical the distribution form; the closer the coefficient is to 0, the less typical the distribution form.
Composite analysis in meteorology is a method used to examine the relationship between specific weather phenomena and key atmospheric variables. It overlays similar events (like specific meteorological conditions) and averages them to form a representative sample, reducing noise and highlighting common characteristics. Compared to other methods, composite analysis clearly shows the typical characteristics of meteorological events while reducing the randomness and uncertainty of individual occurrences. This makes it especially suitable for studying periodic or recurring meteorological phenomena, like seasonal climate patterns or El Niño (Wallace and Gutzler, 1981). Composite analysis typically involves the following basic computational steps:
Event classification and data selection: Identify specific events (e.g., cold air incursions or precipitation) from the time series and record the corresponding variable values (e.g., temperature, pressure, wind speed).
Data superposition and averaging: Assume n selected event time series as , where t represents time.
Superimpose and average these time series:
Where represents the composite time series, the outcome of the composite analysis.
Result analysis: Analyzing reveals common event characteristics and eliminates random noise from individual events.
The air-sea CO2 flux in the Northwest Pacific has strong seasonal variation (Figure 2). In the Region A (north of 45°N), the air-sea CO2 flux is characterized by weak negative values in summer and autumn (weak carbon sink capacity) and positive values in winter and spring (strong carbon source in the open ocean, especially in the Bering Sea). The average air-sea CO2 flux is approximately 4 mol m-2 yr-1, indicating a shift from a weak carbon sink during summer to a strong carbon source in winter. However, in the Region B, the carbon sink capacity (strong negative air-sea CO2 flux) generally weakens from winter to summer, gradually transforming into a weak carbon source. The southern boundary of the carbon sink area gradually moves north approximately from 10°N to 35°N. In the equatorial area (approximately south of 15°N), the air-sea CO2 flux is positive throughout the year, showing a weak marine carbon source characteristic.
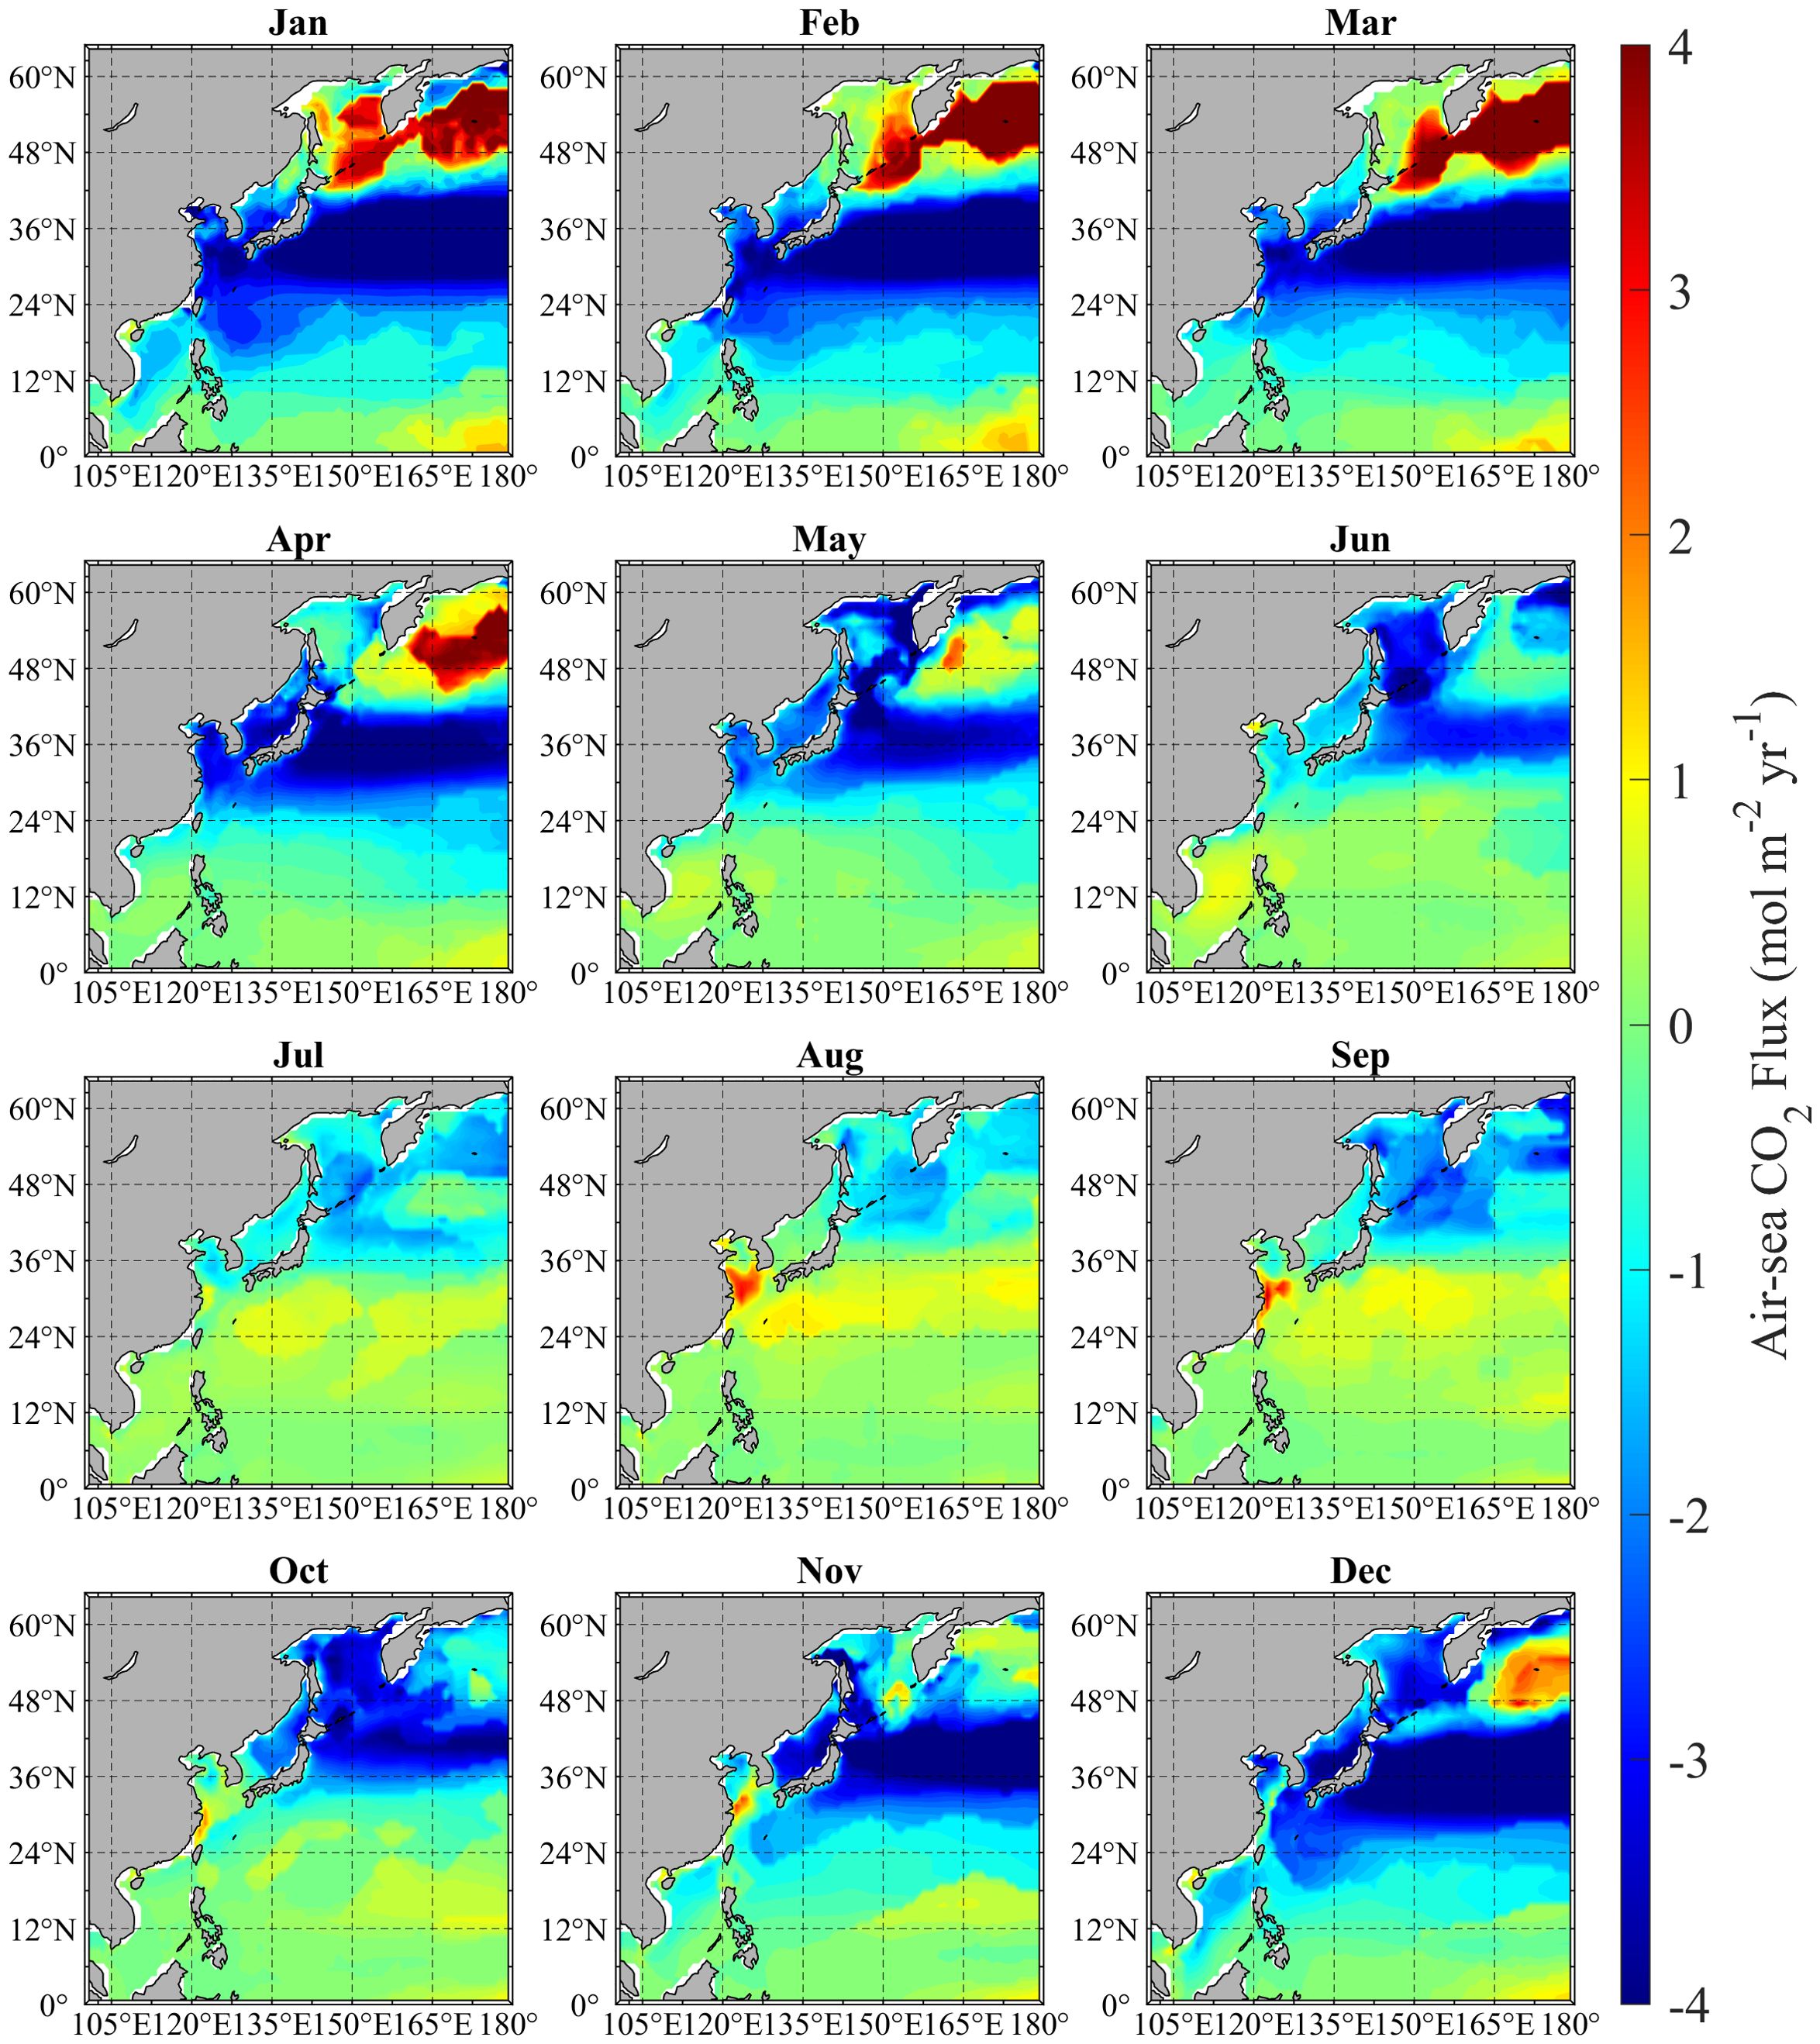
Figure 2. Distribution of monthly climatological mean air-sea CO2 flux in the Northwest Pacific from 1982 to 2021.
Here, we focus on our study region north of 15°N, and do not address the region south of 15°N, since air-sea CO2 flux in this region does not exhibit any clear seasonal variation characteristics (Figure 2). Additionally, the relationship between air-sea CO2 flux and environmental factors in this region is more complex (Valsala et al., 2014).
From 1982 to 2021, covering a span of 40 years, the North Pacific consistently served as a crucial sink for atmospheric CO2, except for several summer months (Figure 3). This capacity to absorb CO2 varied at the interannual scale. Before 1997, the Northwest Pacific exhibited relatively stable CO2 absorption with minor fluctuations (around -0.3 mol m⁻² yr⁻¹). During 1998 to 2002, there was a general positive anomaly in air-sea CO2 flux, indicating the weakest oceanic carbon sink capacity. The oceanic carbon sink strengthened after 2002, which has absorbed more carbon than the period of 1982-2002.
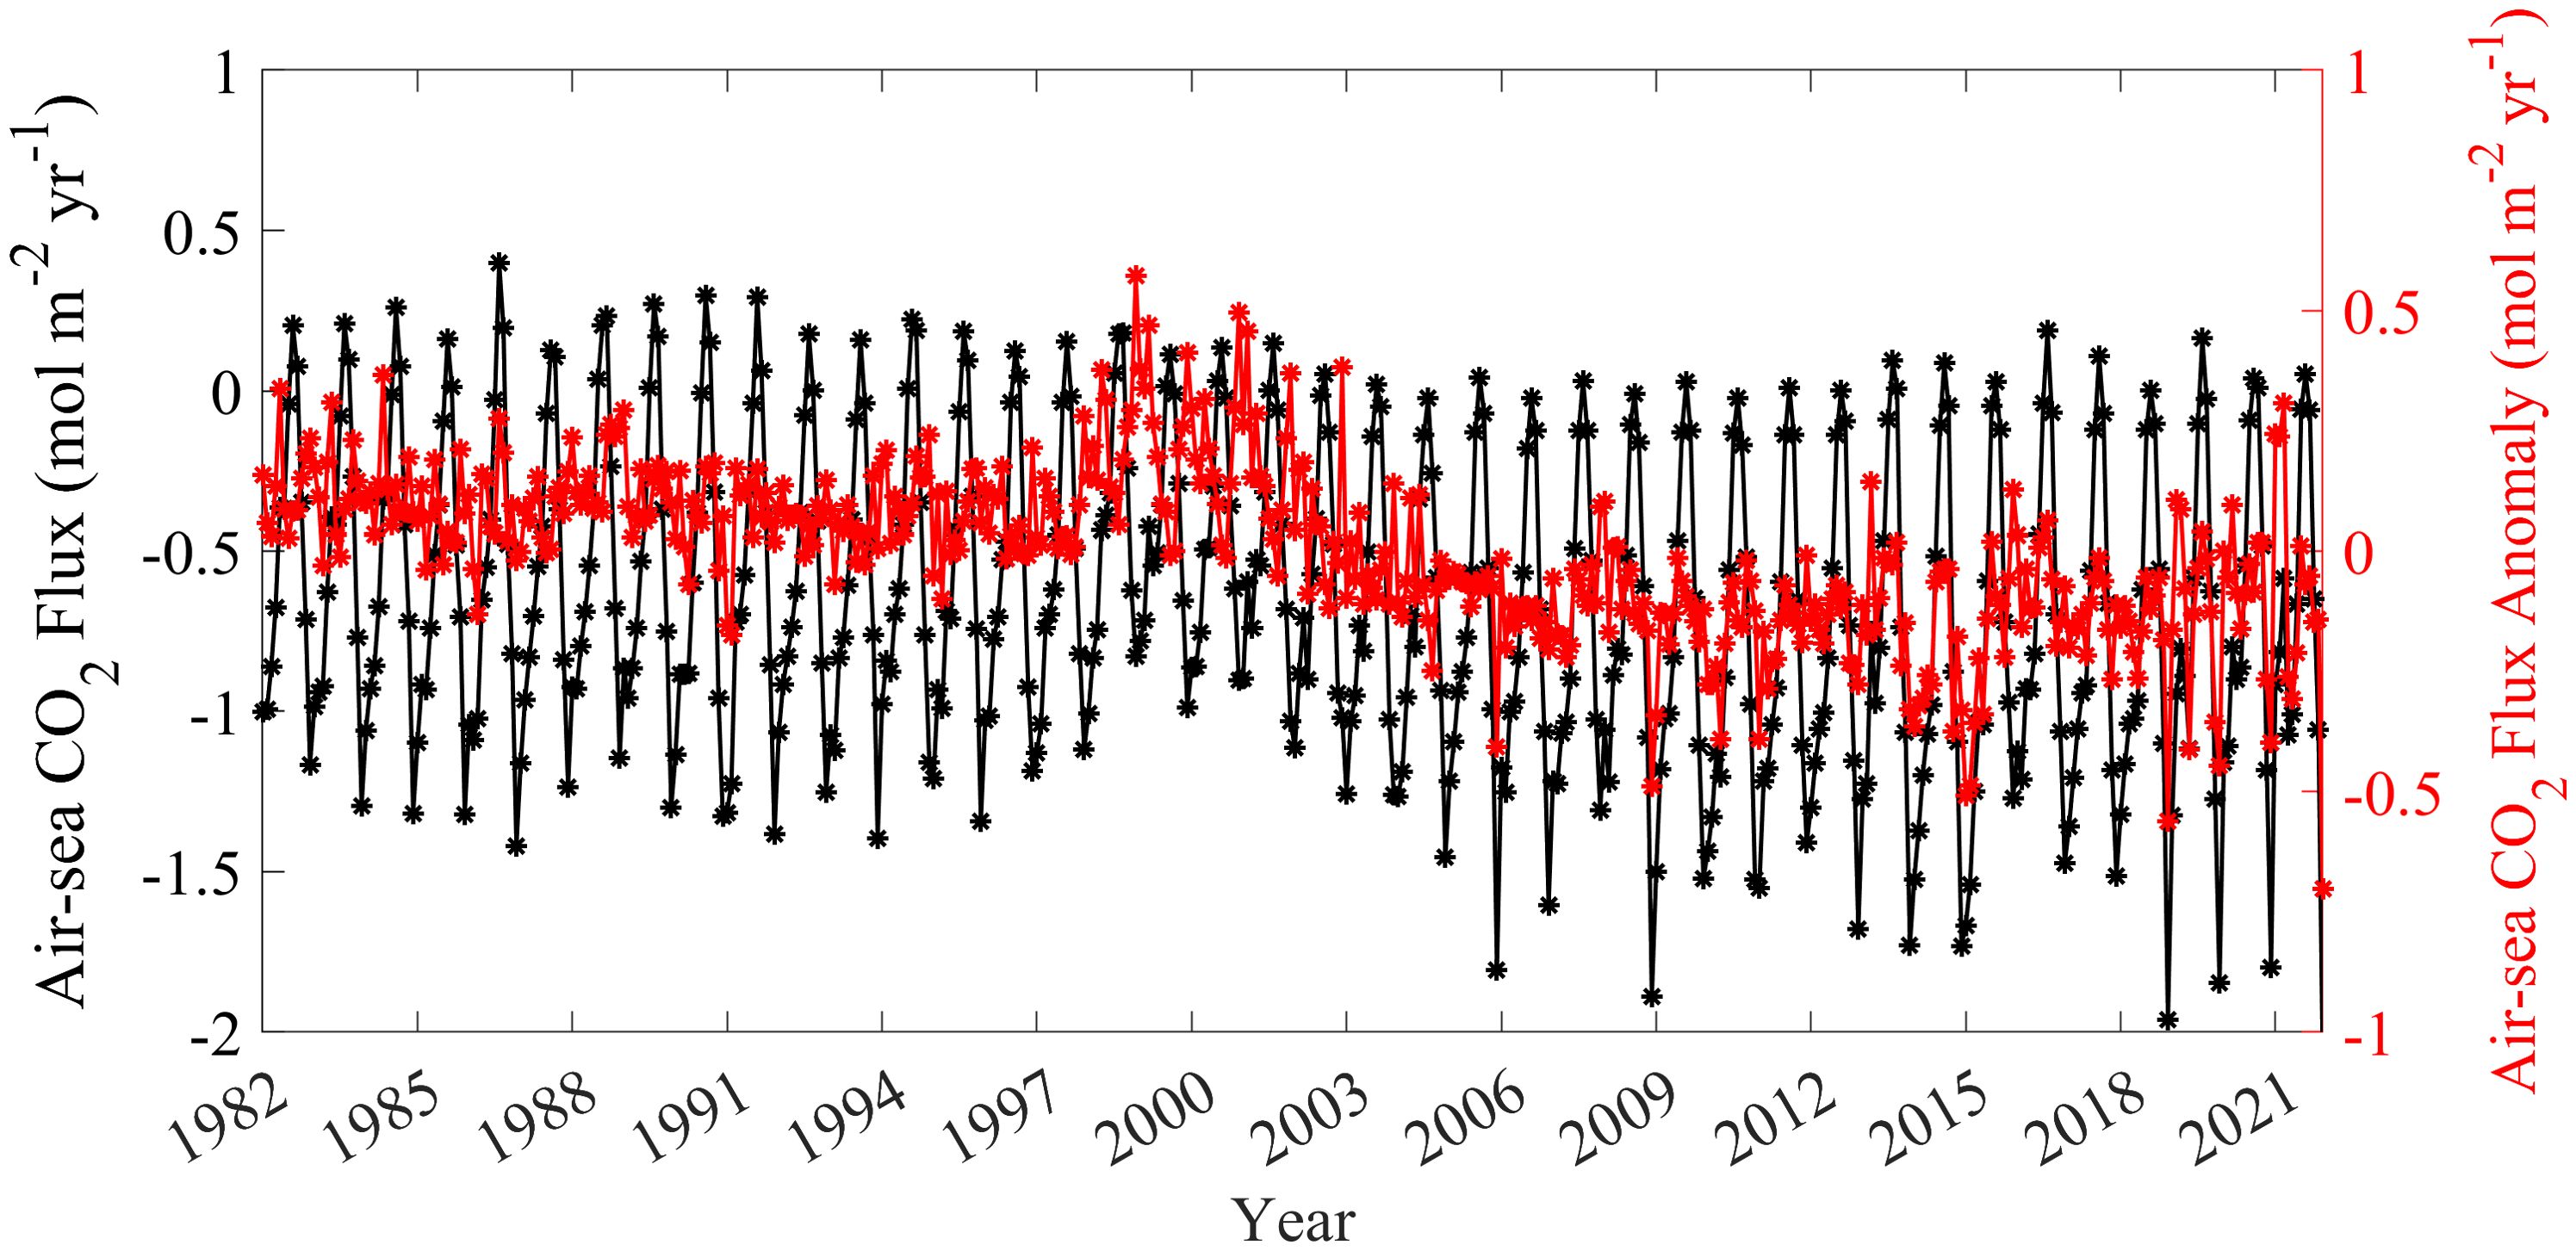
Figure 3. Time series of air-sea CO2 flux and air-sea CO2 flux anomaly in the Northwest Pacific from 1982 to 2021.
The distribution of air-sea CO2 flux varies across latitudes in the Northwest Pacific (Figure 2). Since 2000, carbon sinks have increased across all latitudes in the Northwest Pacific (Figure 3). Region B has primarily driven the annual variation in carbon sinks within the Northwest Pacific (Figure 4). After 2000, Regions A and B also saw an increase in carbon sinks, shifting from carbon sources to carbon sinks.
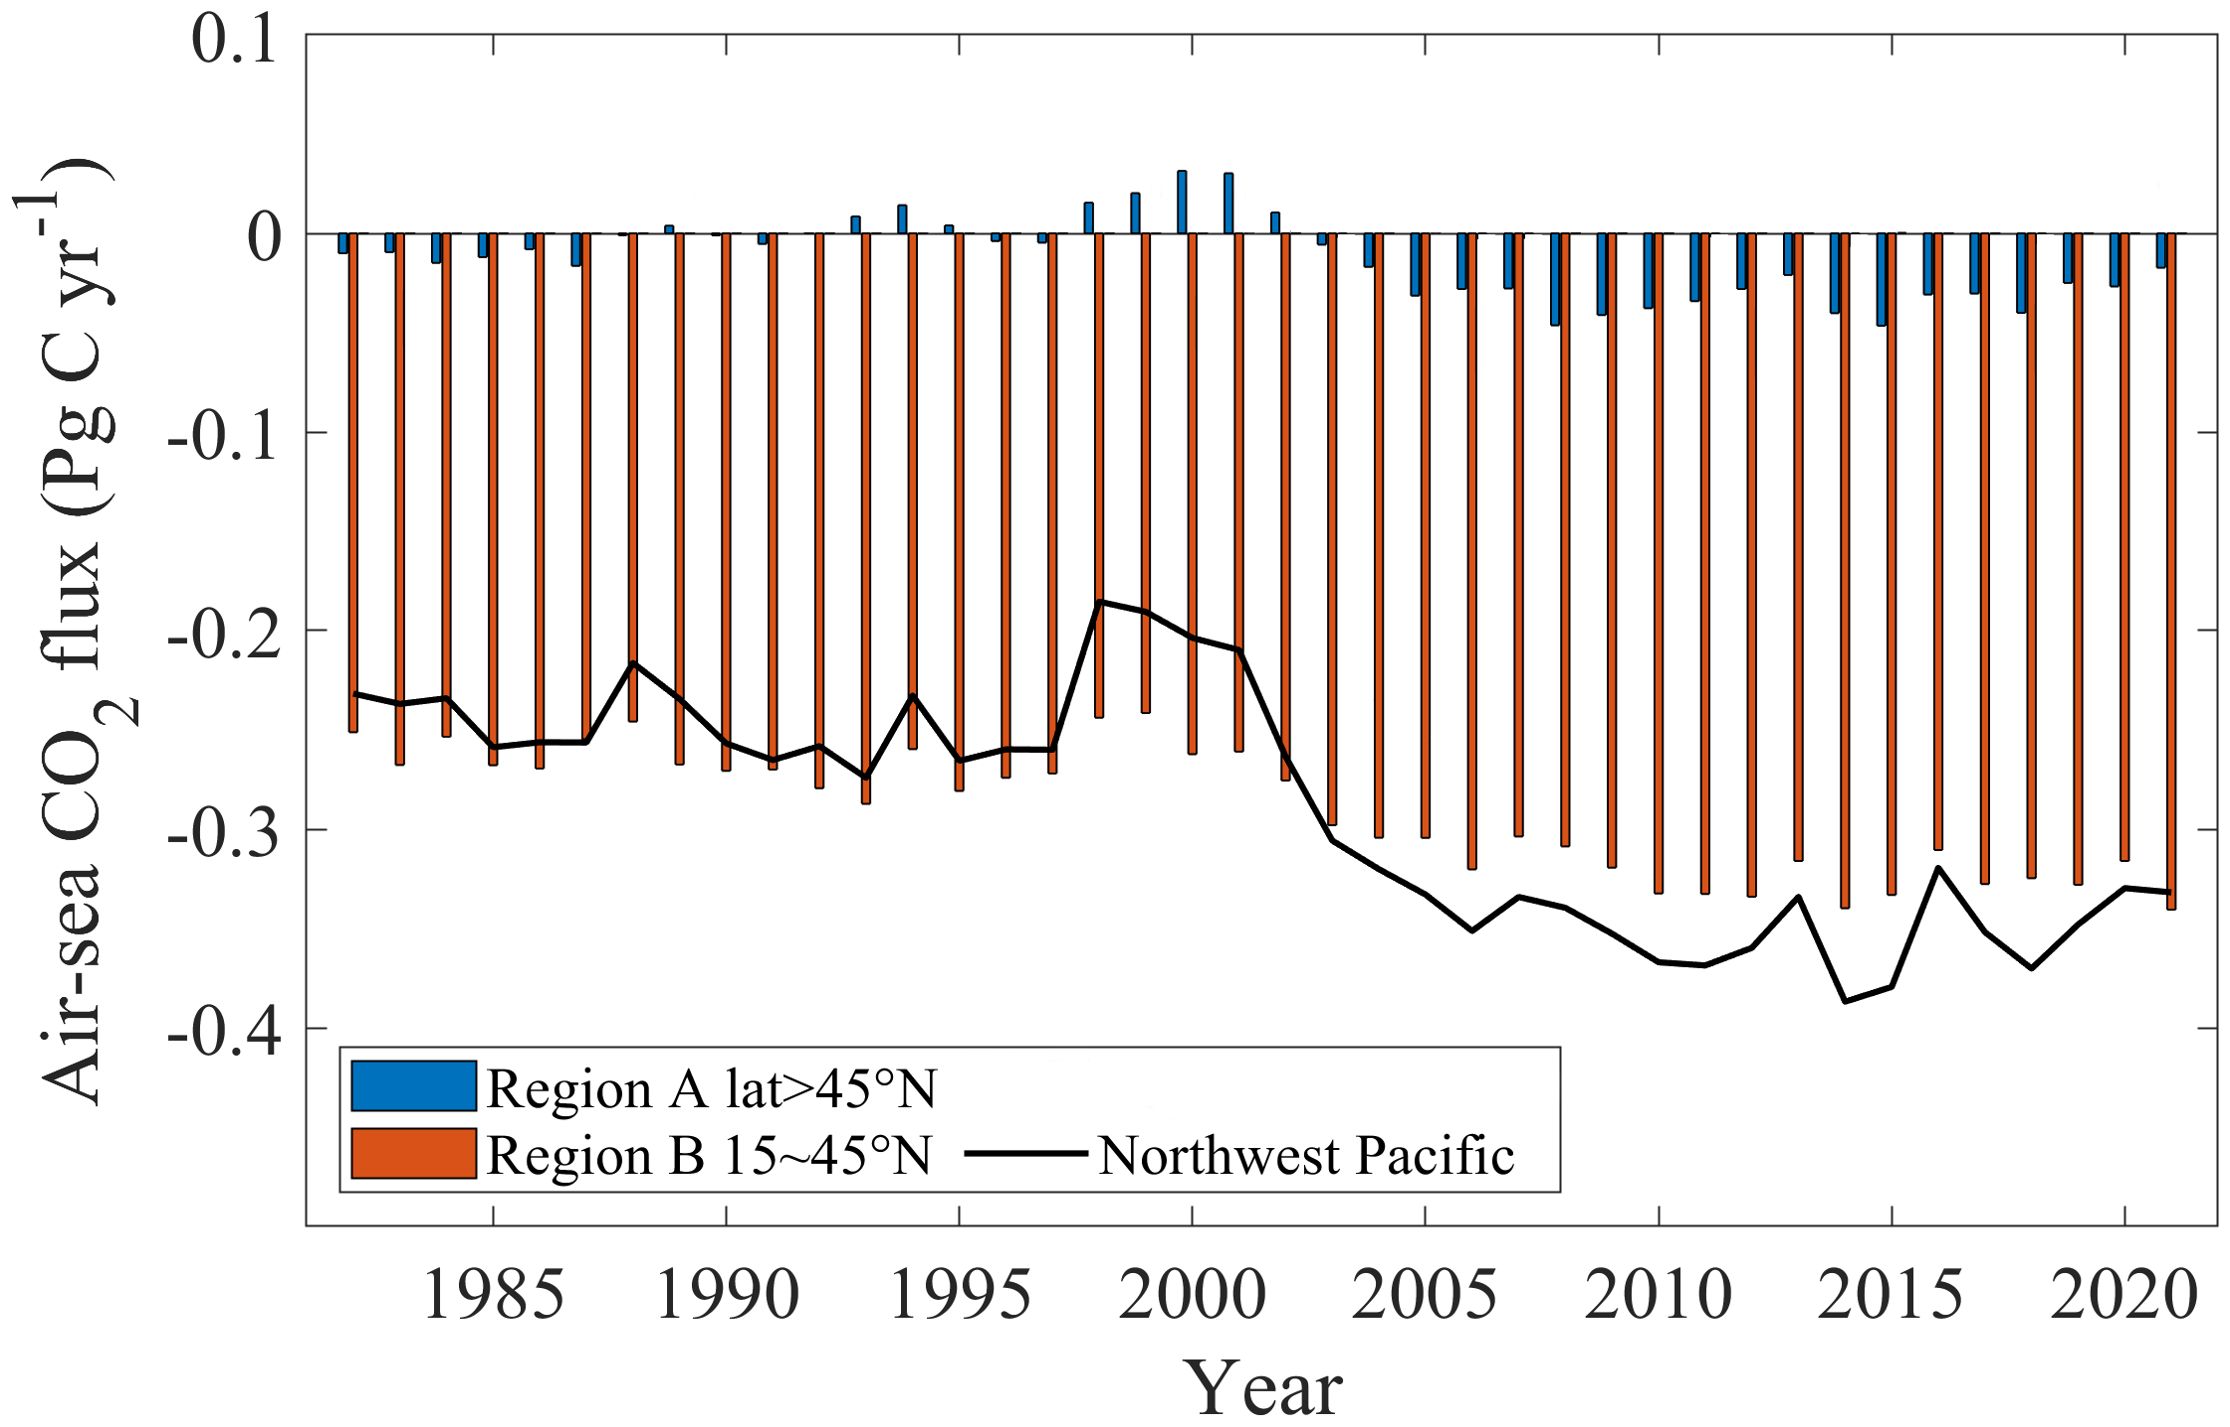
Figure 4. Time series of air-sea CO2 flux in different regions of the Northwest Pacific from 1982 to 2021.
To further illustrate the spatiotemporal variation of air-sea CO2 flux in the Northwest Pacific, we performed the EOF analysis to the climatological air-sea CO2 flux (Figure 5). The variance contribution of the EOF1 is 79.3%, and that of the EOF2 is 15.3%. The variance contribution of the first two modes exceeds 90%, which can better reflect the main seasonal characteristics of the climatological air-sea CO2 flux. Over the past 40 years, EOF1 reveals the dominant mode of CO2 flux in the Northwest Pacific. The spatial distribution shows that Region A consistently exhibits positive values, indicating a strong CO2 release from the ocean to the atmosphere, making it a carbon source area. In contrast, Region B, with large negative values, is an area where CO2 is absorbed from the atmosphere into the ocean, acting as a carbon sink. The CO2 release in Region A and absorption in Region B are more pronounced during winter and spring. EOF2 captures a significant secondary variability pattern that complements the primary mode of EOF1. In this pattern, Region A and the northern part of Region B show distinct carbon sink characteristics (negative values), especially during spring and autumn, closely related to changes in wind patterns.
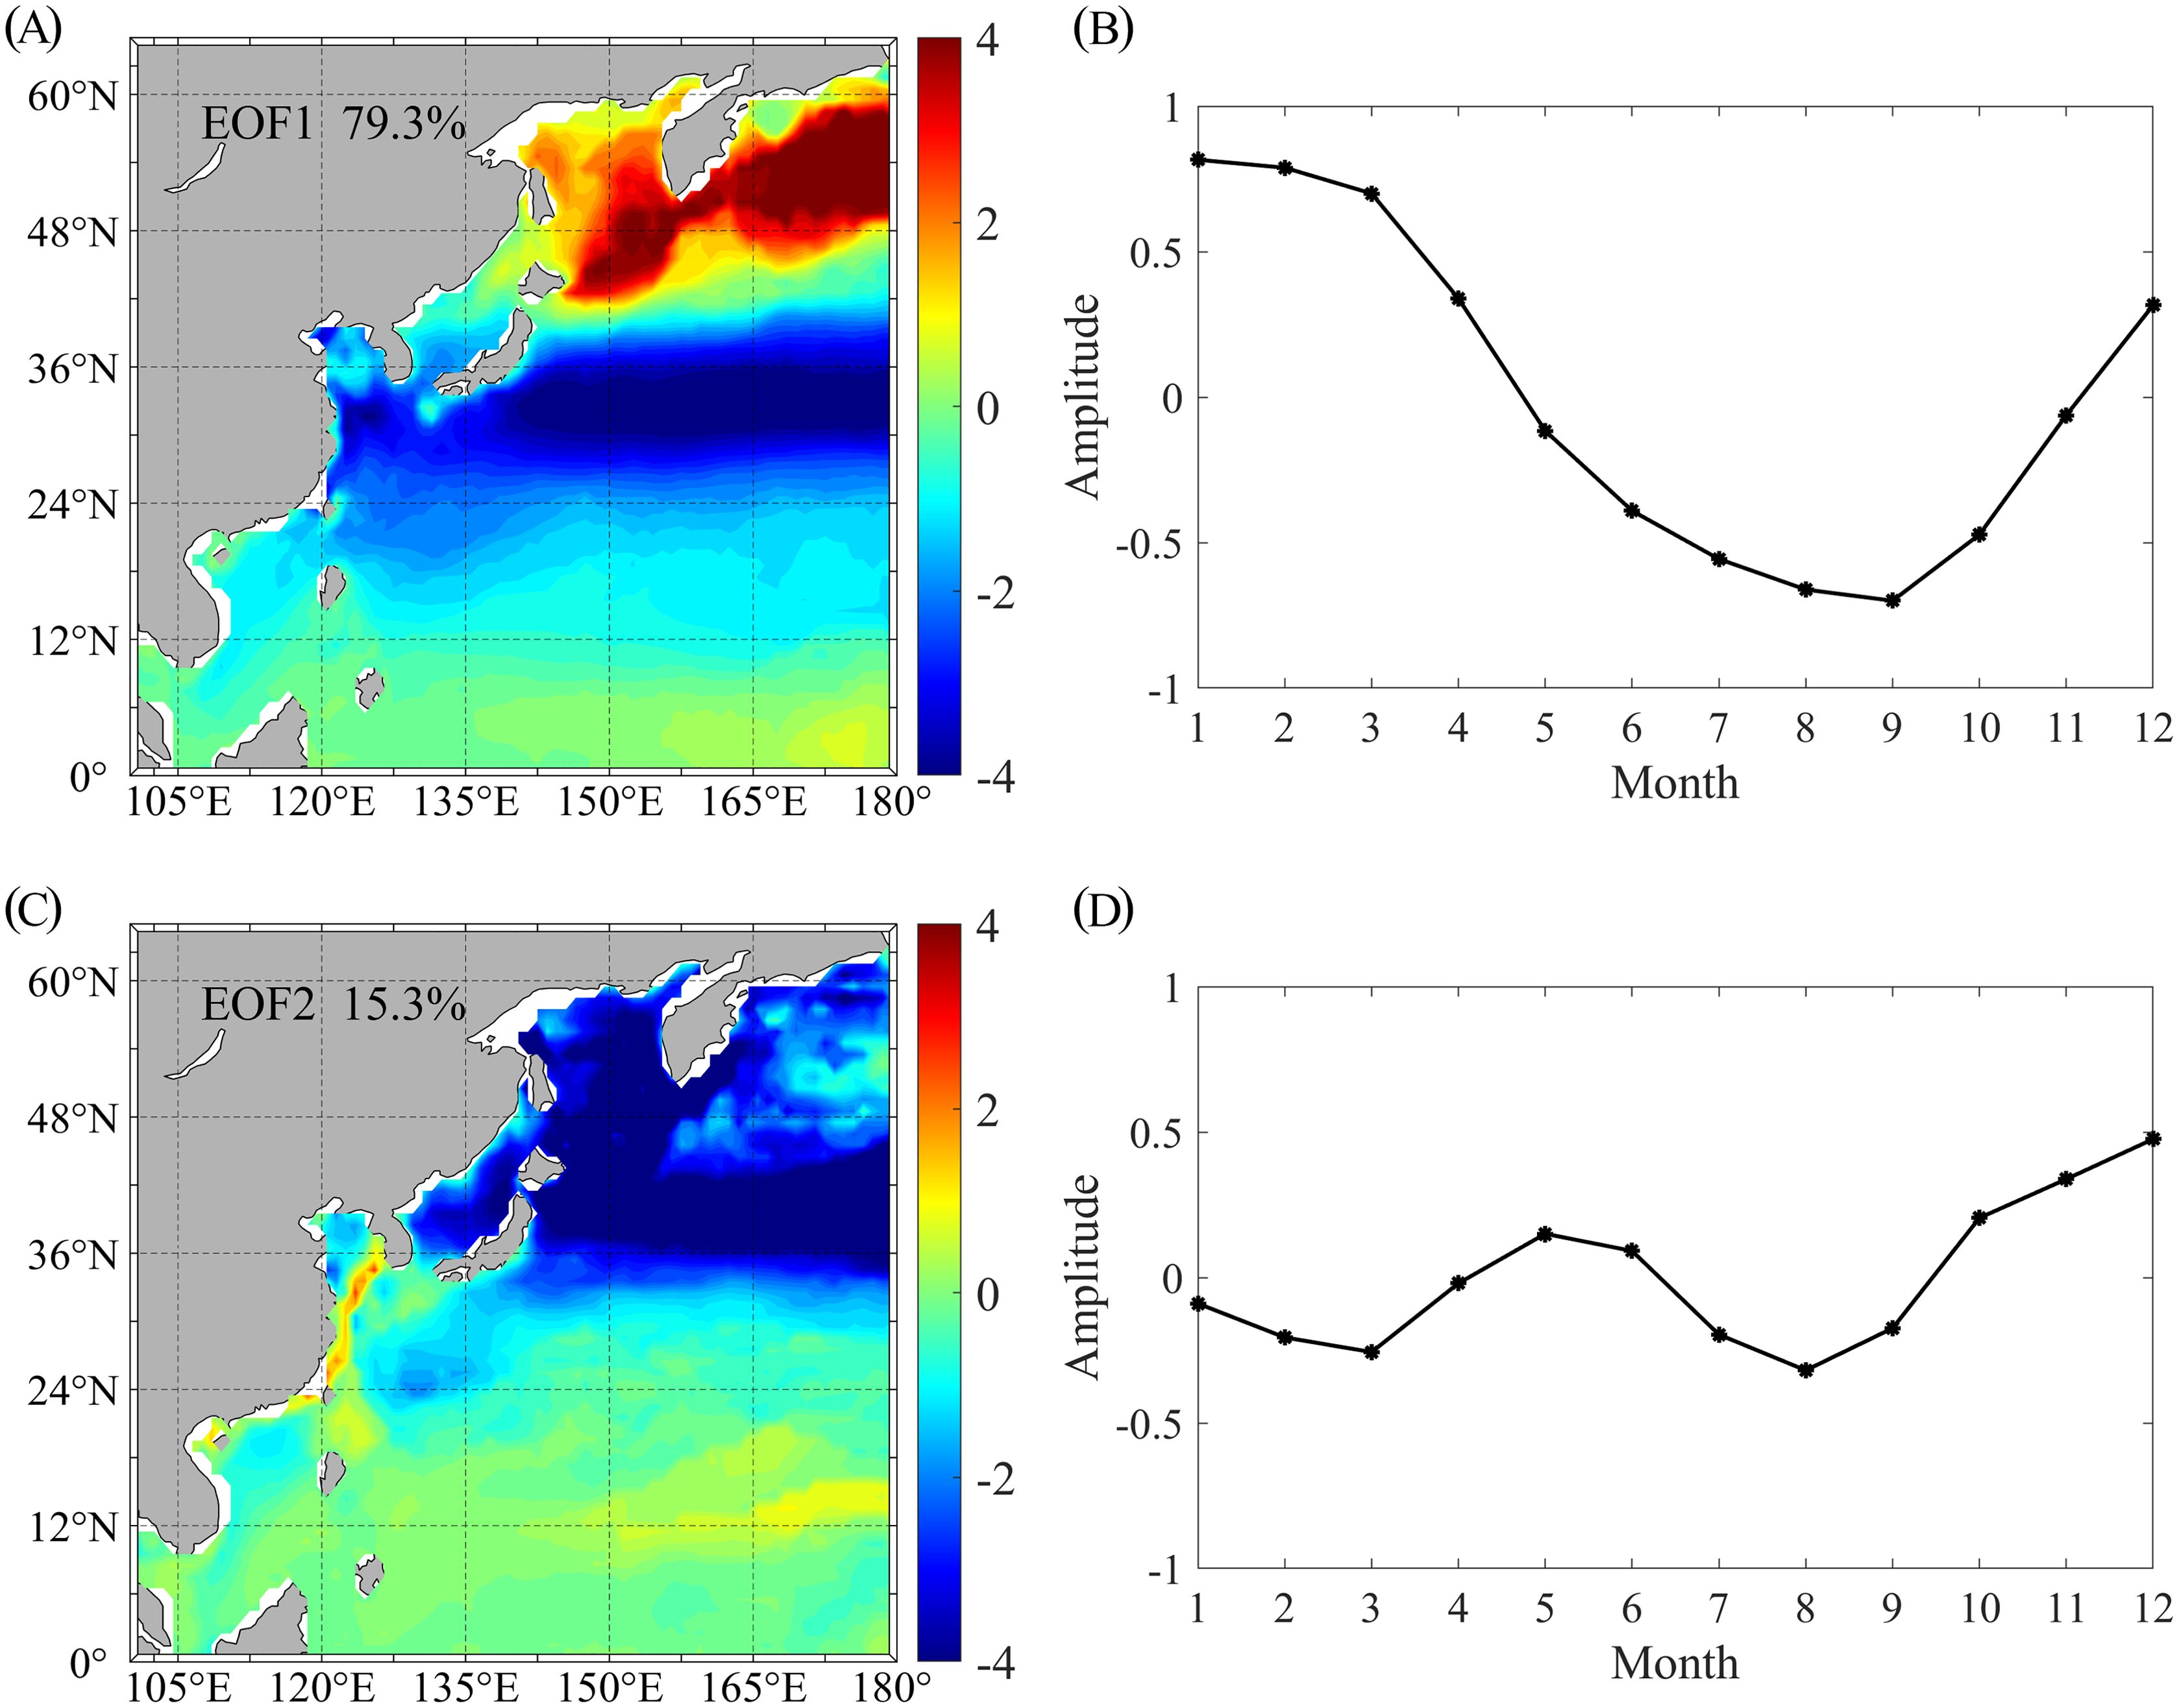
Figure 5. EOF Analysis of the climatological air-sea CO2 flux. Contains (A) the spatial distribution and (B) time variation of the first mode, and (C) the spatial distribution and (D) time series of the second mode.2 flux.
Air-sea CO2 flux is thought to be related to wind speed, SST, SSS or net freshwater flux (evaporation minus precipitation, E-P), MLD, and primary production (i.e., Chl-a) (Sun et al., 2023). Here we chose these variables as potential environmental factors to investigate the relationship between air-sea CO2 flux and these potential factors (Table 1). To investigate the seasonal carbon source and sink changes in Regions A and B, we examined the relationship between environmental factors and air-sea CO2 flux in winter and summer for each area. In this study, winter and summer are defined as January to March and July to September, based on the climatological monthly mean air-sea CO2 flux distribution (Figure 2) and the first mode of EOF analysis (Figures 5A, B). Annual and seasonal data, along with simple correlation results (Table 1), show a significant positive correlation between air-sea carbon flux in Region A and SSS and MLD (r = 0.75, r = 0.80), suggesting that higher salinity and deeper mixed layers may enhance carbon flux. Conversely, it negatively correlates with SST and Chl-a (r = -0.65, r = -0.60), indicating that higher SST and Chl-a suppress carbon flux. In Region B, annual air-sea carbon flux positively correlates with SST and E-P (r = 0.90, r = 0.50), implying that higher sea surface temperature and evaporation rates may increase carbon flux. However, it negatively correlates with Wind, SSS, and MLD (r = -0.84, r = -0.83, r = -0.87), suggesting that increases in these factors may reduce carbon flux. In winter, the positive and negative correlation trends in Region A remain consistent with the annual pattern, though slightly weaker. In Region B, air-sea carbon flux in winter positively correlates with SSS and E-P (r = 0.34) but negatively with Wind, SST, and MLD (r = -0.22, r = -0.44, r = -0.46). In summer, air-sea carbon flux in Region A positively correlates with E-P and Chl-a (r = 0.36, r = 0.51), but negatively with Wind, SST, and MLD (r = -0.37, r = -0.28, r = -0.39). In Region B, summer air-sea carbon flux positively correlates with SST and MLD (r = 0.68, r = 0.30), but negatively with Wind, SSS, and E-P (r = -0.47, r = -0.45, r = -0.31). These results show that the impact of these variables on carbon flux in summer differs significantly from that observed annually and in winter.

Table 1. Correlation coefficients between air-sea CO2 flux and factors in different regions of the Northwest Pacific from 1982 to 2021.
Regarding seasonal variations, wind speed, SSS, Chl-a, E-P, and MLD show strong seasonal relationships with the air-sea CO2 flux in Region A. However, SST, E-P, and Chl-a vary inversely with the air-sea CO2 flux (Figure 6). In Region B, SST and E-P changes align with the air-sea CO2 flux, while wind speed, SSS, and MLD vary inversely. Notably, Chl-a in Region B does not correlate with air-sea CO2 flux changes (Figure 6).

Figure 6. Area-weighted time series of Wind, SSS, SST, E-P, MLD, and Chl-a for (A) Region A (> 45°N) and (B) Region B (15°N – 45°N) in the Northwest Pacific.
El Niño and La Niña events alternated distinctly during the study period (Figure 7A). El Niño was prominent during three key phases: 1982 - 1983, 1997 - 1998, and 2015 - 2016. La Niña was strong in 1989, 1998 - 2000, 2008, and 2010. Over 40 years (480 months), El Niño occurred for 115 months, and La Niña for 124 months. This cyclic variability highlights the dynamic nature of the equatorial Pacific climate system, which influences global weather and ocean conditions over long periods. The response of air-sea CO2 flux in the Northwest Pacific to El Niño and La Niña events shows a complex pattern (Figure 7). Unlike the general distribution of air-sea CO2 flux shown in Figure 2, its response to these events appears influenced by proximity to the coast. In the western part of the Northwest Pacific, west of 150°E, there is a positive anomaly in air-sea CO2 flux during El Niño events, indicating increased CO2 release to the atmosphere. In contrast, in the eastern part, east of 150°E, a negative anomaly during El Niño suggests either reduced CO2 release or increased ocean uptake. During La Niña, the response pattern generally reverses.
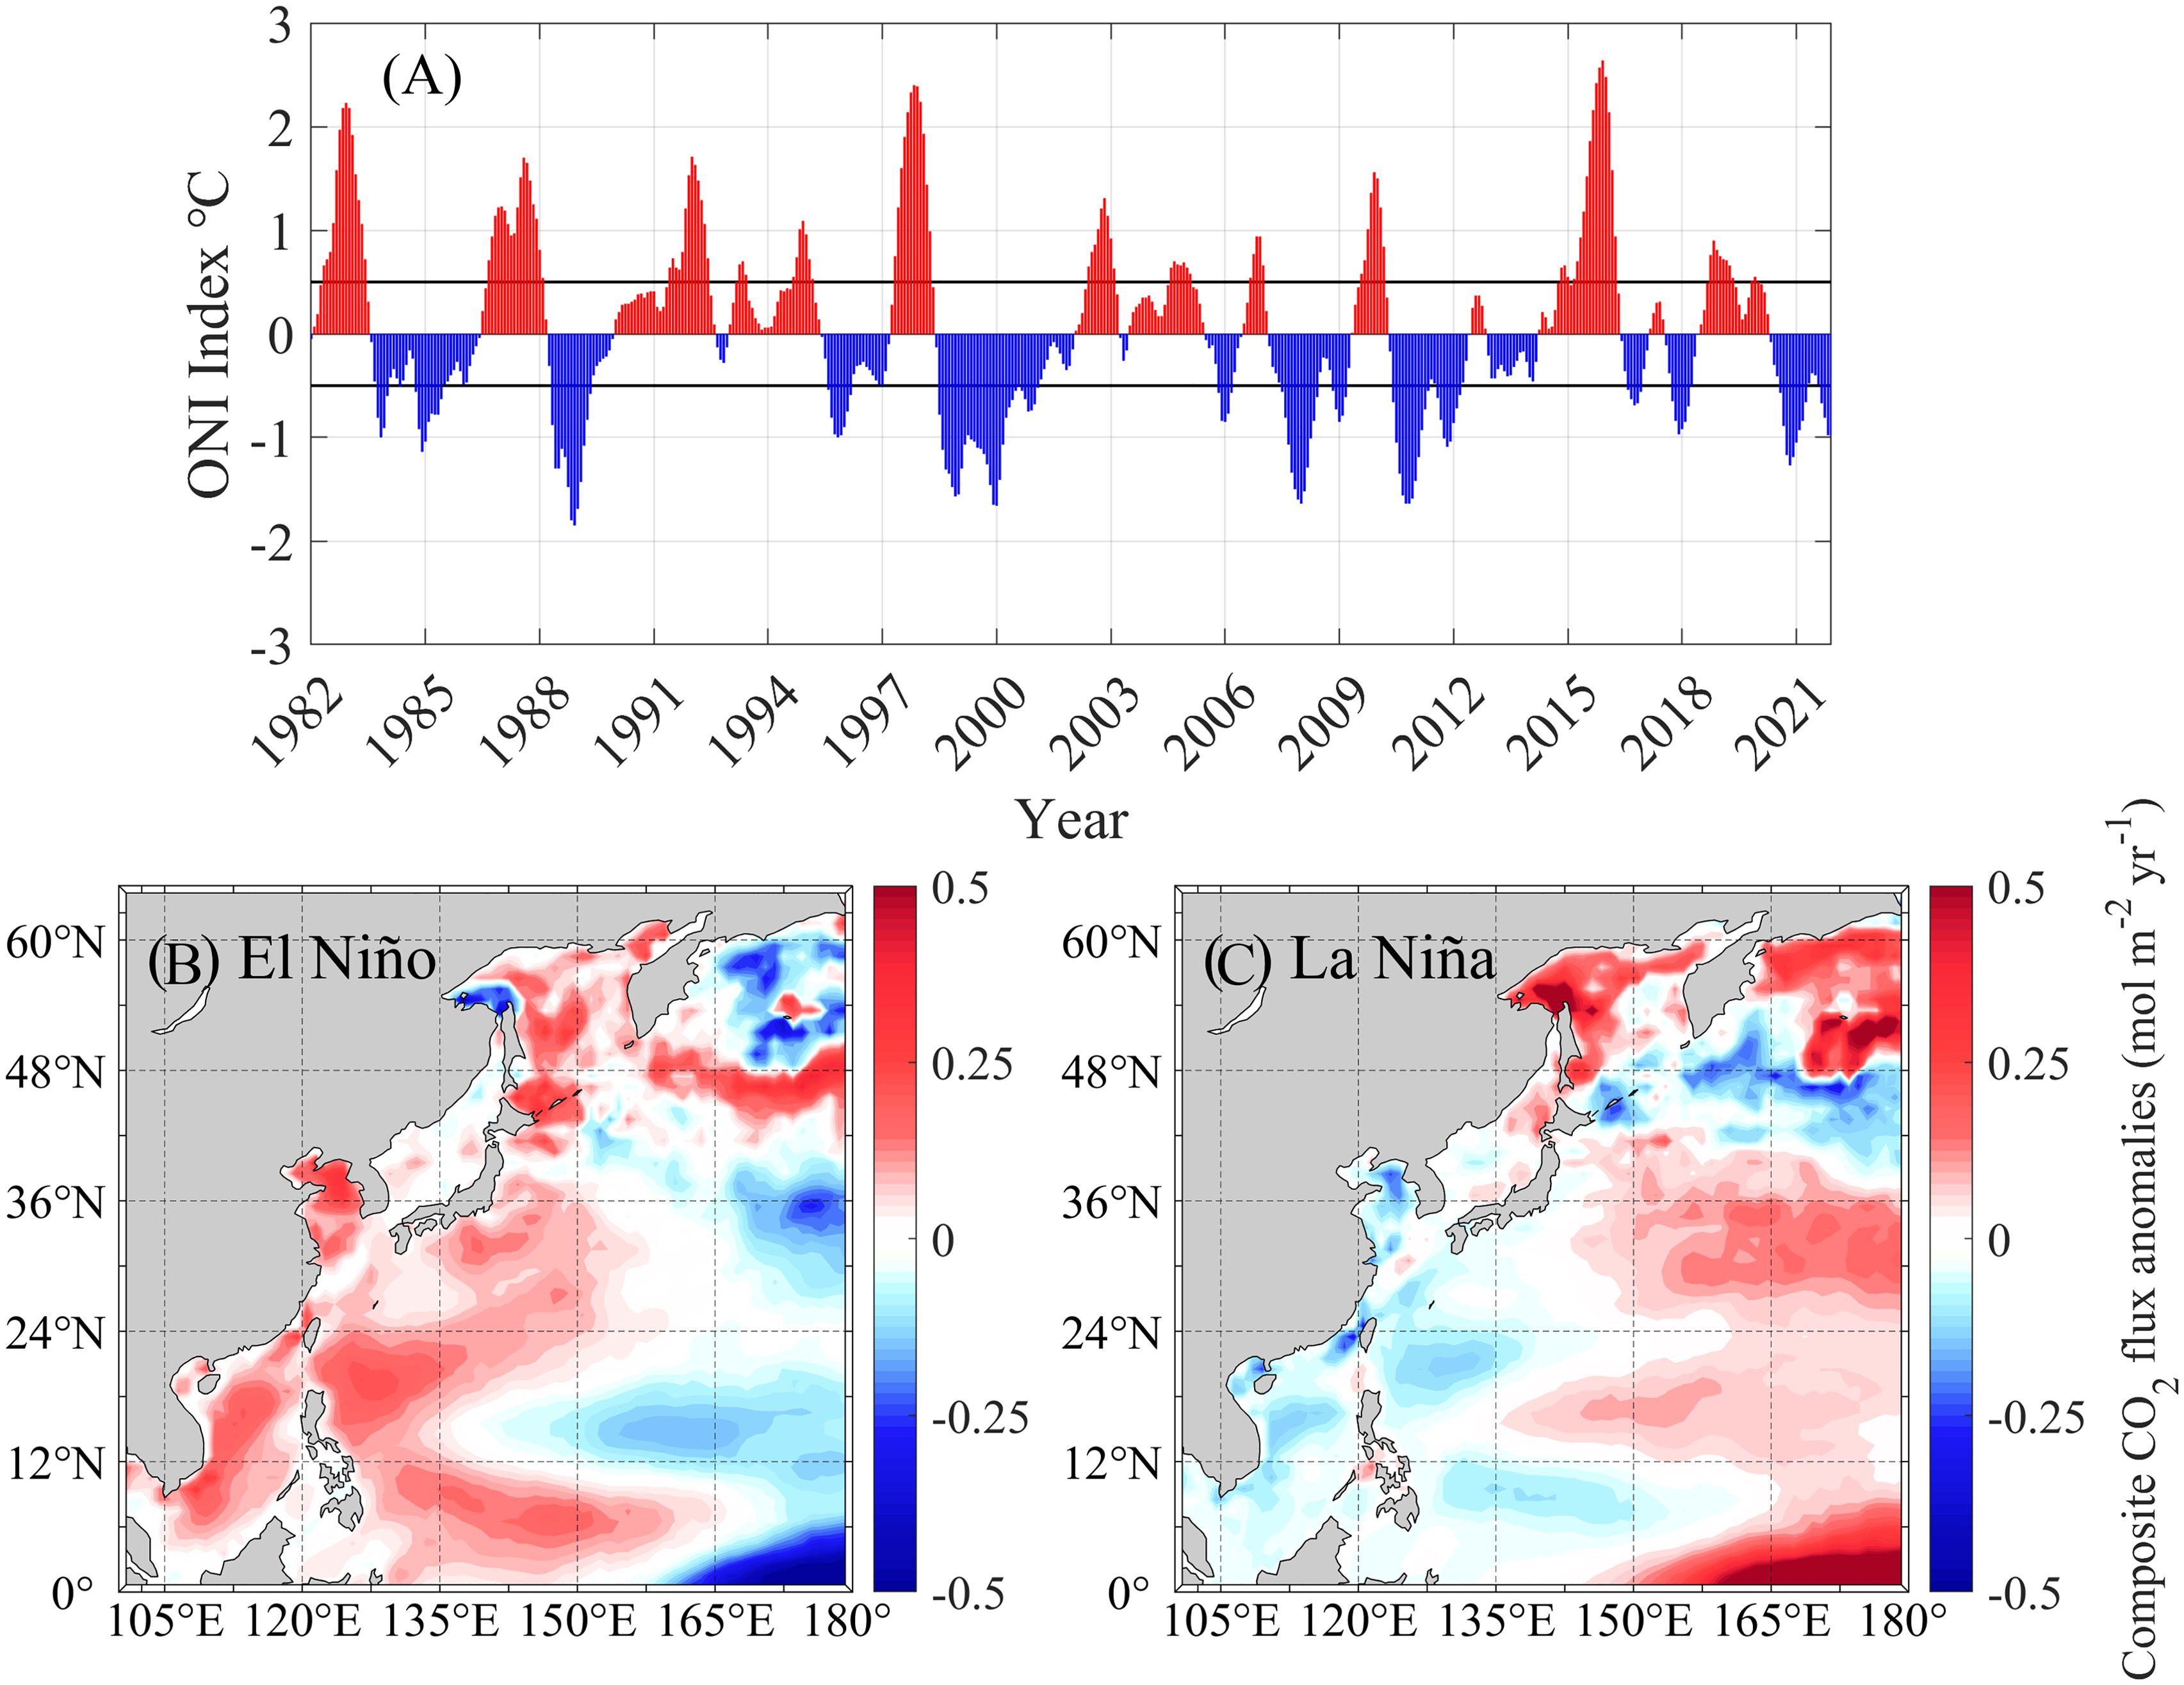
Figure 7. (A) Oceanic Niño Index (ONI) from 1982 to 2021. Composite analysis of air-sea CO2 flux with (B) El Niño events and (C) La Niña events in the Northwestern Pacific Ocean.
When analyzing seasonal variations, it’s clear that the response of air-sea CO2 flux to ENSO differs between winter and summer (Figure 8). The spatial patterns of air-sea CO2 flux responses to ENSO in winter (Figures 8A, B) are similar to those without distinguishing seasons (Figures 7A, B), suggesting that winter predominantly drives the air-sea CO2 flux reaction to ENSO. In contrast, the summer response shows a distinct latitudinal distribution. During El Niño, Region A typically shows a positive CO2 flux anomaly, indicating a net carbon source, while Region B acts mainly as a weak carbon source, with a strong carbon sink evident in the northern part of Region B (36°N - 42°N). During La Niña, the air-sea CO2 flux response in the Northwest Pacific essentially reverses compared to El Niño.

Figure 8. Composite analysis of air-sea CO2 flux to (A) El Niño events in winter, (B) La Niña events in winter, (C) El Niño events in summer, and (D) La Niña events in summer in the Northwestern Pacific Ocean.
The ocean, as a crucial component of the global carbon cycle, mitigating the increase in atmospheric CO2 concentrations (DeVries et al., 2017; Friedlingstein et al., 2019; Gruber et al., 2019; Khatiwala et al., 2013; Sabine et al., 2004). However, the air-sea CO2 flux is influenced by a variety of environmental factors, which vary across different regions and temporal scales (Ishii et al., 2001; Landschützer et al., 2018). The air-sea CO2 flux in the Northwest Pacific is influenced by a variety of environmental factors. These factors interact in complex ways to modulate the CO2 exchange between the ocean and the atmosphere. In this section, we will discuss the observed temporal and spatial variations in CO2 flux and analyze the specific roles of different environmental drivers.
The air-sea CO2 flux in different regions of the Northwest Pacific exhibits significant seasonal distribution characteristics, varying with latitude (Figures 2, 5). It is evident that the distribution pattern of air-sea CO2 flux in high-latitude areas (Region A) is opposite to that in mid-latitude areas (Region B). In Region A, MLD is the strongest positive factor affecting carbon flux in winter (r = 0.5171), while SST and SSS have significant negative effects (r = -0.2996, r = -0.2717). When wind speed and other variables are removed, the multiple correlation decreases, showing that these factors significantly contribute to the overall variance in carbon flux (Table 2). The deepening of the MLD indicates that cold surface waters are sinking, bringing CO2 -rich deep waters to the surface (Koenig et al., 2021). Although this process resembles upwelling, it is mainly driven by density differences and wind stress, not typical coastal upwelling mechanisms (Yuan and Mitsudera, 2023). As these waters rise, the CO2 concentration in surface seawater increases, causing the ocean to release CO2 into the atmosphere, making this area a strong carbon source. During winter and early spring, shorter daylight hours, lower light intensity, and colder SST suppress phytoplankton growth (Kikuchi et al., 2020). As a result, CO2 consumption in the ocean decreases, leaving more CO2 in surface waters. Lower SST simultaneously increases CO2 solubility, leading to supersaturation, which enhances CO2 release into the atmosphere. CO2 supersaturation, combined with low productivity, reinforces this area’s role as a carbon source during winter and spring. In winter, Region A is usually covered by extensive sea ice. Although air-sea exchange is limited by ice coverage, CO2 exchange can still occur at the ice edges and during melting. Seawater beneath the ice may accumulate high CO2 concentrations. When the ice melts, CO2 -rich waters rapidly release CO2 into the atmosphere (Schiller-Weiss et al., 2023), making these regions carbon sources in early spring (Figure 2).
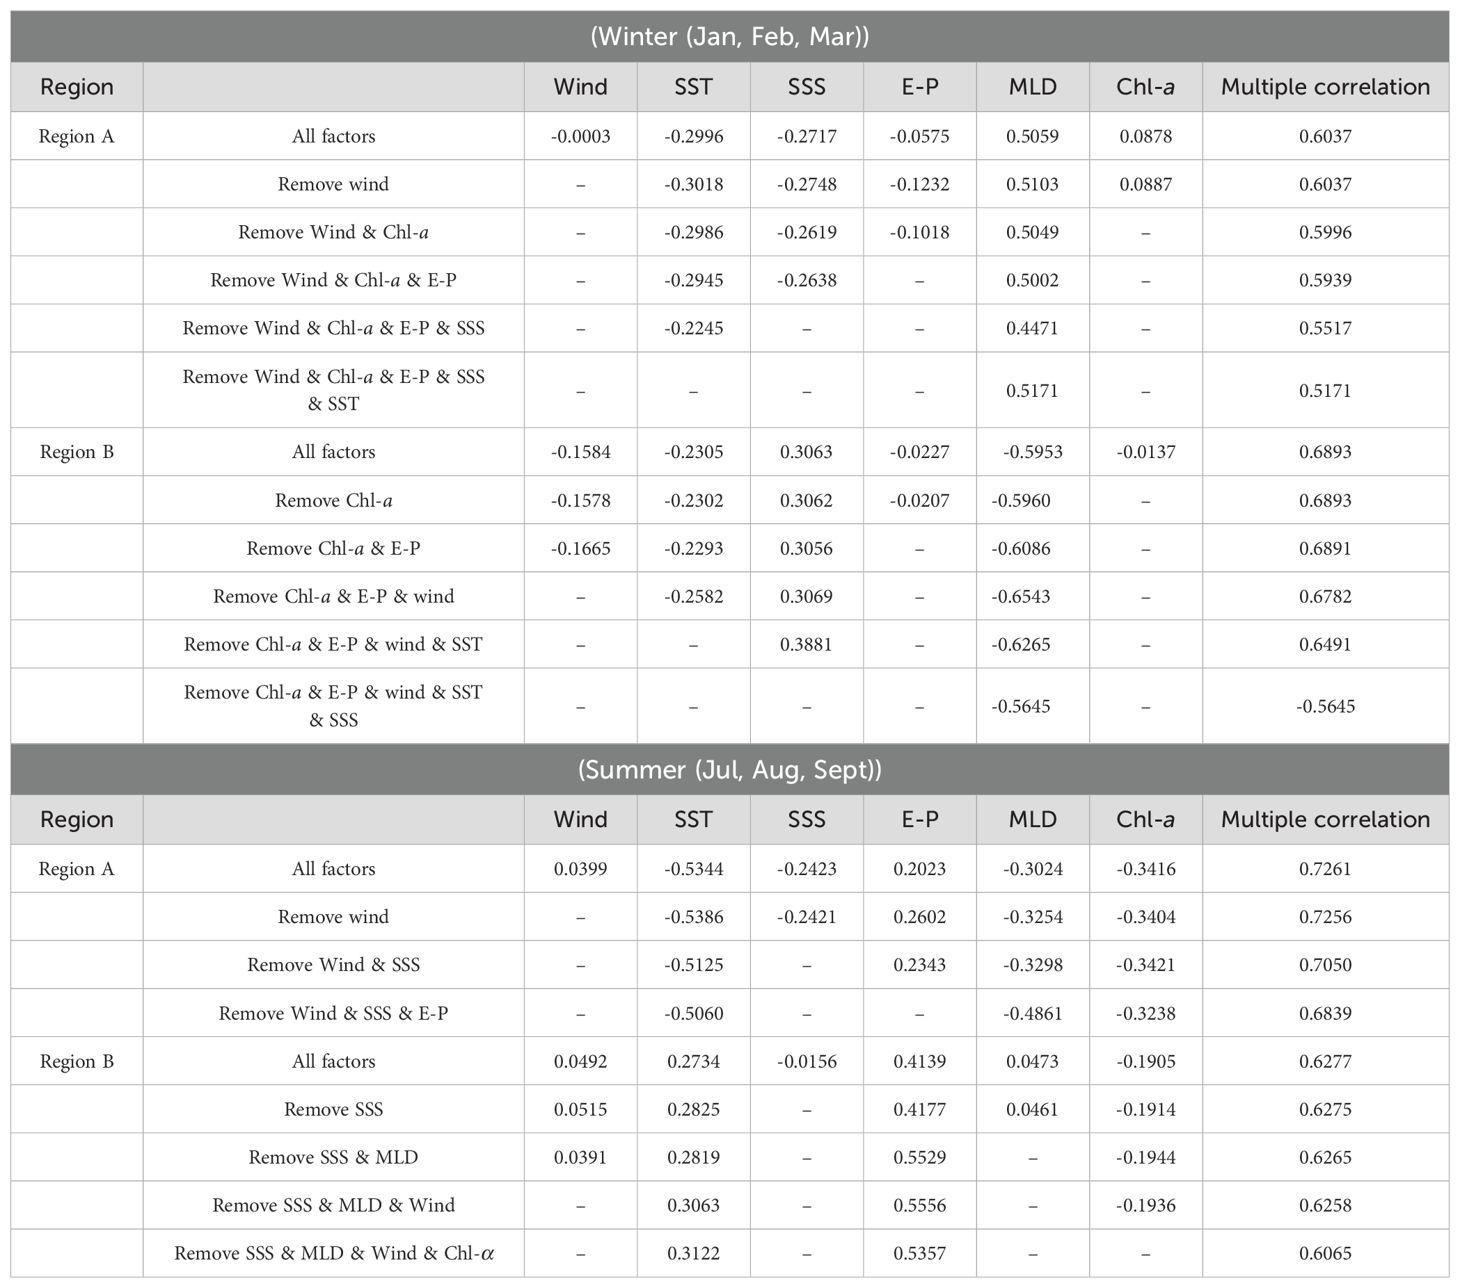
Table 2. Multiple coefficients and Partial coefficients between air-sea CO2 flux and factors in different regions of the Northwest Pacific from 1982 to 2021.
In summer, SST has the strongest negative impact on carbon flux (r = -0.5344), while the positive correlation with wind speed is weak (r = 0.0399). Removing variables like wind speed and SSS slightly decreases the overall correlation, indicating that these factors moderate the effects of others (Table 2). In high latitudes, longer summer daylight increases SST, and melting ice promotes upwelling (Kerr, 1999; Zhabin et al., 2019). Upwelling brings cold, nutrient-rich deep water to the surface, enhancing phytoplankton growth and photosynthesis, leading to increased Chl-a. Phytoplankton absorb CO2 through photosynthesis, converting it into organic matter stored in the ocean. This process suppresses carbon flux and shifts CO2 from a source to a weak sink. This shift is mainly due to longer daylight and upwelling in summer. Thus, the seasonal variation in CO2 flux in Region A is mainly regulated by MLD, SST, and SSS in winter and summer. Enhanced deep mixing in winter is the key mechanism driving CO2 release and flux changes.
In Region B, seasonal changes in air-sea CO2 flux are influenced by various environmental factors (Table 2), but the mechanisms differ from those in Region A. In winter, SSS positively impacts carbon flux (r = 0.3063), while MLD has a significant negative effect (r = -0.5953). This suggests that as the winter monsoon intensifies, stronger water mixing increases surface salinity and releases CO2 from deeper layers. Despite the partial release of CO2 from deep mixing, Region B remains the strongest carbon sink in winter. This is mainly due to the lower sea surface temperature and stronger wind speeds in winter. The lower sea surface temperature increases CO2 solubility, allowing the ocean to absorb more atmospheric CO2. Stronger winds accelerate gas exchange between air and ocean, increasing CO2 transfer efficiency. Together, these factors maintain Region B’s high carbon sink capacity, despite CO2 release from deep mixing. Further analysis shows that excluding key variables like wind speed and Chl-a significantly weakens the correlation, highlighting their crucial role in regulating winter carbon flux.
In summer, Region B’s carbon sink capacity gradually weakens and shifts northward (Figure 2). This trend is mainly due to the northward expansion of the Kuroshio and its extension, which pushes warm water north, raising temperatures in Region B and reducing its carbon sink capacity (Tang et al., 2000). Additionally, E-P and SST positively affect carbon flux in this area (r = 0.3122, r = 0.5357), while Chl-a inhibits it (Table 2). Higher evaporation rates and SST promote CO2 release, while elevated Chl-a indicates higher primary productivity, consuming CO2 and thus inhibiting its release (Venrick et al., 1987). This reflects the northward shift of the Kuroshio and intense solar radiation in summer, increasing surface water temperature. At the same time, high evaporation reduces freshwater input, diminishing surface water’s ability to absorb CO2, gradually shifting the area from a strong carbon sink to a weak carbon source. In Region B, the negative correlation between wind speed and CO2 flux is weak. After removing wind speed and SSS, the correlation diminishes significantly. This may be because Region B is strongly influenced by the subtropical high, leading to stable wind speeds with little direct impact on flux (Karnauskas and Ummenhofer, 2014; Yang et al., 2022). Overall, the seasonal variation in CO2 flux in Region B is mainly influenced by the combined effects of SST, E-P, and SSS. The increase in SST and evaporation rates in summer are key drivers of flux changes, reflecting the subtropical high’s enhancement, leading to higher SST and more evaporation, weakening the carbon sink capacity.
The EOF analysis of air-sea CO2 flux in the Northwest Pacific reveals primary and secondary flux variation modes, offering insights into seasonal changes (Figure 5). In EOF1, Region A acts as a carbon source, while Region B functions as a carbon sink. This mode indicates strong vertical mixing in Region A during winter and the influence of the Kuroshio and subtropical high-pressure systems on Region B. This pattern is most prominent in winter and spring, showing that CO2 release in Region A and absorption in Region B are more pronounced during these seasons, mainly driven by winter wind fields and temperature gradients. EOF2 is especially evident in spring and autumn when the carbon sink characteristics in Region A and northern Region B are more significant. This mode is closely linked to wind field changes, further confirming wind speed’s role in regulating seasonal flux variations. Wind field changes directly affect surface water movement and mixing, influencing CO2 transport and release.
Due to human activities such as fossil fuel combustion and changes in land use, which continue to release CO2 into the atmosphere, the entire ocean may no longer serve as a crucial carbon sink (Gruber et al., 2009; Khatiwala et al., 2013; Sabine et al., 2004). Therefore, the reduced absorption of CO2 by the oceans could have serious consequences for Earth’s climate. During El Niño events in the equatorial Pacific Ocean, the air-sea CO2 flux shows significant variability. For instance, El Niño events reduce the net annual CO2 flux compared to non-El Niño periods (Feely et al., 1999; Wanninkhof et al., 1996). Conversely, during La Niña events, CO2 efflux from the region to the atmosphere tends to increase (Feely et al., 2004). These fluctuations highlight the impact of ENSO phenomena on carbon exchange between the ocean and the atmosphere in the equatorial Pacific.
Our findings show that El Niño and La Niña events impact air-sea CO2 flux differently across the Northwest Pacific. (Figure 7). In the past four decades, ENSO has significantly affected air-sea CO2 flux in the Northwest Pacific, showing marked differences between the western (105°E - 150°E) and eastern (150°E - 180°E) areas. Specifically, El Niño typically decreases CO2 flux in the eastern Northwest Pacific (150°E - 180°E), indicating increased carbon uptake. During El Niño, the weakened northeast monsoon reduces vertical mixing in the upper ocean, inhibiting upwelling of CO2 -rich waters and significantly lowering air-sea CO2 flux (Feely et al., 1987; Sheu et al., 2010; Wanninkhof et al., 1996). Previous studies support this phenomenon. For example, Feely et al. (2002) observed a significant decline in air-sea CO2 flux in the eastern Northwest Pacific during El Niño, reinforcing the above mechanism.
El Niño affects the eastern Northwest Pacific mainly through changes in ocean dynamics and atmospheric circulation. During El Niño, higher SST in the eastern Northwest Pacific increases ocean stratification, blocking the upwelling of CO2 -rich subsurface waters. Additionally, weaker trade winds slow ocean currents, further reducing vertical water replenishment (Kurapov, 2023; Wang et al., 2024). As a result, air-sea CO2 exchange decreases, enhancing carbon uptake in the area. As SST rises, phytoplankton photosynthesis intensifies, speeding up CO2 absorption.
During La Niña events, the reduced CO2 flux in the western Northwest Pacific (105-150°E) indicates increased carbon uptake in this area. This is likely due to intensified ocean circulation and vertical mixing during La Niña. Specifically, La Niña strengthens easterly winds over the western Northwest Pacific and reduces SST, leading to weaker stratification and enhanced vertical mixing (Jiang et al., 2023; Chung et al., 2024). Consequently, CO2 -rich subsurface waters rise to the surface, increasing air-sea CO2 exchange. However, intensified mixing causes more atmospheric CO2 to be absorbed by the ocean, decreasing CO2 flux and increasing carbon uptake. Additionally, the westward shift of the warm pool during La Niña may further increase CO2 flux differences between the eastern and western Northwest Pacific (Zhong et al., 2022; Peter et al., 2023). The response of air-sea carbon flux to ENSO in summer closely mirrors the latitudinal distribution of the climatological air-sea carbon flux (Figures 2, 8C, D). In winter, however, this response differs, with a contrasting distribution between the western and eastern parts (Figures 8A, B). We hypothesize that this seasonal variation is likely related to temperature gradients. In summer, the overall background temperature of the Northwest Pacific is higher, resulting in a larger temperature gradient during ENSO than in winter.
Overall, ENSO events significantly affect air-sea CO2 flux in the Northwest Pacific by altering ocean dynamics and atmospheric circulation. El Niño enhances carbon uptake in the eastern area, while La Niña increases uptake in the western area.
This study comprehensively analyzed the spatiotemporal distribution of air-sea CO2 flux in the Northwest Pacific from 1982 to 2021 and its driving factors, using data on air-sea CO2 flux, wind, SST, SSS, E-P, MLD and Chl-a. Its response to ENSO was further explored.
The findings reveal distinct seasonal distribution patterns in air-sea CO2 flux across different regions of the Northwest Pacific. Region A acts as a significant carbon source during winter and shifts to a carbon sink in summer, whereas Region B consistently functions as a carbon sink. In Region A, the region acts as a significant carbon source in winter and shifts to a carbon sink in summer, while Region B remains a carbon sink throughout the year. The seasonal variability in Region A is mainly driven by MLD and SST. The winter release of CO2 is caused by enhanced deep mixing, the key mechanism. In contrast, Region B shows a significant northward shift in its carbon sink, with seasonal variations strongly influenced by SST and E-P balance. In summer, the northward shift of the Kuroshio Current and the strengthening of the subtropical high raise sea surface temperature, weakening the region’s carbon sink capacity.
During El Niño events, CO2 flux decreases in the eastern Northwest Pacific, enhancing carbon absorption and changing the regional carbon balance. Conversely, La Niña events have the opposite effect, especially in the western region, where CO2 flux decreases, showing a complex interplay between oceanic and atmospheric processes influenced by these climate events. These patterns highlight the need to understand regional variations in CO2 flux responses to large-scale climate events.
The original contributions presented in the study are included in the article/supplementary material. Further inquiries can be directed to the corresponding author.
HS: Formal analysis, Methodology, Visualization, Writing – original draft, Writing – review & editing. YC: Conceptualization, Writing – original draft, Writing – review & editing. HG: Conceptualization, Funding acquisition, Supervision, Writing – review & editing.
The author(s) declare financial support was received for the research, authorship, and/or publication of this article. This study is supported by program for scientific research start-up funds of Guangdong Ocean University (No. 060302122304), National Natural Science Foundation of China (No. 42076162), the project supported by Innovation Group Project of Southern Marine Science and Engineering Guangdong Laboratory (Zhuhai) (No. 311020004), and the Postgraduate Education Innovation Project of Guangdong Ocean University (202428).
We are grateful to the National Oceanic and Atmospheric Administration (NOAA) (www.ncdc.noaa.gov) for providing the sea surface temperature and the Oceanic Niño Index (ONI) data, the European Center for Medium-Range Weather Forecasts (ECMWF) (https://www.ecmwf.int/) for providing the sea surface wind, the Copernicus for providing the sea surface salinity and mixed layer depth data (https://www.copernicus.eu/en). The pCO2 data can be downloaded from: https://www.ncei.noaa.gov/access/ocean-carbon-acidification-data-system/oceans/SPCO2_1982_present_ETH_SOM_FFN.html.
The authors declare that the research was conducted in the absence of any commercial or financial relationships that could be construed as a potential conflict of interest.
All claims expressed in this article are solely those of the authors and do not necessarily represent those of their affiliated organizations, or those of the publisher, the editors and the reviewers. Any product that may be evaluated in this article, or claim that may be made by its manufacturer, is not guaranteed or endorsed by the publisher.
Chung E.-S., Kim S.-J., Lee S.-K., Ha K.-J., Yeh S.-W., Kim Y. S., et al. (2024). Tropical eastern Pacific cooling trend reinforced by human activity. NPJ Clim Atmos Sci. 7, 1–12. doi: 10.1038/s41612-024-00713-2
DeVries T., Holzer M., Primeau F. (2017). Recent increase in oceanic carbon uptake driven by weaker upper-ocean overturning. Nature. 542, 215–218. doi: 10.1038/nature21068
Feely R. A., Boutin J., Cosca C. E., Dandonneau Y., Etcheto J., Inoue H. Y., et al. (2002). Seasonal and interannual variability of CO2 in the equatorial Pacific. Deep Sea Res. Part II: Topical Stud. Oceanography. 49, 2443–2469. doi: 10.1016/S0967-0645(02)00044-9
Feely R. A., Gammon R. H., Taft B. A., Pullen P. E., Waterman L. S., Conway T. J., et al. (1987). Distribution of chemical tracers in the eastern equatorial Pacific during and after the 1982–1983 El Niño/Southern Oscillation event. J. Geophysical Research: Oceans. 92, 6545–6558. doi: 10.1029/JC092iC06p06545
Feely R. A., Wanninkhof R., McGillis W., Carr M. E., Cosca C. E. (2004). Effects of wind speed and gas exchange parameterizations on the air-sea CO2 fluxes in the equatorial Pacific Ocean. J. Geophys. Res. 109, C08S03. doi: 10.1029/2003JC001896
Feely R. A., Wanninkhof R., Takahashi T., Tans P. (1999). Influence of El Niño on the equatorial Pacific contribution to atmospheric CO2 accumulation. Nature. 398, 597–601. doi: 10.1038/19273
Friedlingstein P., Jones M., O'Sullivan M., Andrew R., Bakker D., Hauck J., et al. (2021). Global carbon budget 2021. Earth Syst. Sci. Data. 14, 1917–2005. doi: 10.5194/essd-14-1917-2022
Friedlingstein P., Jones M. W., O'Sullivan M., Andrew R. M., Hauck J., Peters G. P., et al. (2019). Global carbon budget 2019. Earth Syst. Sci. Data. 11, 1783–1838. doi: 10.5194/essd-11-1783-2019
Geng T., Jia F., Cai W., Wu L., Gan B., Jing Z., et al. (2023). Increased occurrences of consecutive La Niña events under global warming. Nature. 619, 774–781. doi: 10.1038/s41586-023-06236-9
Gruber N., Clement D., Carter B. R., Feely R. A., van Heuven S., Hoppema M., et al. (2019). The oceanic sink for anthropogenic CO2 from 1994 to 2007. Science. 363, 1193–1199. doi: 10.1126/science.aau5153
Gruber N., Gloor M., Mikaloff Fletcher S. E., Doney S. C., Dutkiewicz S., Follows M. J., et al. (2009). Oceanic sources, sinks, and transport of atmospheric CO2. Glob. Biogeochem. Cycles. 23, GB1005. doi: 10.1029/2008GB003349
Houghton R. A. (2007). Balancing the global carbon budget. Annu. Rev. Earth Planetary Sci. 35, 313–347. doi: 10.1146/annurev.earth.35.031306.140057
Iida Y., Kojima A., Takatani Y., Nakano T., Sugimoto H., Midorikawa T., et al. (2015). Trends in pCO2 and sea–air CO2 flux over the global open oceans for the last two decades. J. Oceanography. 71, 637–661. doi: 10.1007/s10872-015-0306-4
Ishii M., Feely R. A., Rodgers K. B., Park G. H., Wanninkhof R., Sasano D., et al. (2014). Air–sea CO2 flux in the Pacific Ocean for the period 1990–2009. Biogeosciences. 11, 709–734. doi: 10.5194/bg-11-709-2014
Ishii M., Inoue H. Y., Matsueda H., Saito S., Fushimi K., Nemoto K., et al. (2001). Seasonal variation in total inorganic carbon and its controlling processes in surface waters of the western North Pacific subtropical gyre. Mar. Chemistry. 75, 17–32. doi: 10.1016/S0304-4203(01)00023-8
Jersild A., Landschützer P., Gruber N., Bakker D. C. E. (2017). An observation-based global monthly gridded sea surface pCO2 and air-sea CO2 flux product from 1982 onward and its monthly climatology (NCEI Accession 0160558). [indicate subset used]. NOAA National Centers for Environmental Information. Dataset. doi: 10.7289/v5z899n6
Jiang S., Zhu C., Hu Z.-Z., Jiang N., Zheng F. (2023). Triple-dip La Niña in 2020–23: understanding the role of the annual cycle in tropical Pacific SST. Environ. Res. Lett. 18, 084002. doi: 10.1088/1748-9326/ace274
Karnauskas K. B., Ummenhofer C. C. (2014). On the dynamics of the Hadley circulation and subtropical drying. Clim Dyn. 42, 2259–2269. doi: 10.1007/s00382-014-2129-1
Kerr R. A. (1999). A new force in high-latitude climate. Science. 284, 241–242. doi: 10.1126/science.284.5412.241
Khatiwala S., Tanhua T., Mikaloff Fletcher S., Gerber M., Doney S. C., Graven H. D., et al. (2013). Global ocean storage of anthropogenic carbon. Biogeosciences. 10, 2169–2191. doi: 10.5194/bg-10-2169-2013
Kikuchi G., Abe H., Hirawake T., Sampei M. (2020). Distinctive spring phytoplankton bloom in the Bering Strait in 2018: A year of historically minimum sea ice extent. Deep Sea Res. Part II: Topical Stud. Oceanography. 181–182, 104905. doi: 10.1016/j.dsr2.2020.104905
Koenig Z., Kolås E. H., Fer I. (2021). Structure and drivers of ocean mixing north of Svalbard in summer and fall 2018. Ocean Sci. 17, 365–381. doi: 10.5194/os-17-365-2021
Kurapov A. L. (2023). El niño-related stratification anomalies over the continental slope off oregon in summer 2014 and 2015: the potential vorticity advection mechanism. J. Geophysical Research: Oceans. 128, e2022JC019588. doi: 10.1029/2022JC019588
Landschützer P., Gruber N., Bakker D. C. E. (2016). Decadal variations and trends of the global ocean carbon sink. Global Biogeochemical Cycles. 30, 1396–1417. doi: 10.1002/2015GB005359
Landschützer P., Gruber N., Bakker D. C.E., Schuster U., Nakaoka S., Payne M. R., et al. (2013). A neural network-based estimate of the seasonal to inter-annual variability of the Atlantic Ocean carbon sink. Biogeosciences. 10, 7793–7815. doi: 10.5194/bg-10-7793-2013
Landschützer P., Gruber N., Bakker D. C. E., Stemmler I., Six K. D. (2018). Strengthening seasonal marine CO2 variations due to increasing atmospheric CO2. Nat. Climate Change. 8, 146–150. doi: 10.1038/s41558-017-0057-x
Le Quéré C., Andrew R. M., Friedlingstein P., Sitch S., Hauck J., Pongratz J., et al. (2018). Global carbon budget 2018. Earth Syst. Sci. Data. 10, 2141–2194. doi: 10.5194/essd-10-2141-2018
Le Quéré C., Raupach M. R., Canadell J. G., Marland G., Bopp L., Ciais P., et al. (2009). Trends in the sources and sinks of carbon dioxide. Nat. Geoscience. 2, 831–836. doi: 10.1038/ngeo689
Li Z., England M. H., Groeskamp S. (2023). Recent acceleration in global ocean heat accumulation by mode and intermediate waters. Nat. Communications. 14, 6888. doi: 10.1038/s41467-023-42468-z
Loukos H., Vivier F., Murphy P. P., Harrison D. E., Le Quéré C. (2000). Interannual variability of equatorial Pacific CO2 fluxes estimated from temperature and salinity data. Geophysical Res. Letters. 27, 1735–1738. doi: 10.1029/1999GL011013
Maritorena S., Siegel D. A. (2005). Consistent merging of satellite ocean color data sets using a bio-optical model. Remote Sens. Environment. 94, 429–440. doi: 10.1016/j.rse.2004.08.014
Maritorena S., d'Andon O. H. F., Mangin A., Siegel D. A. (2010). Merged satellite ocean color data products using a bio-optical model: Characteristics, benefits and issues. Remote Sens. Environment. 114, 1791–1804. doi: 10.1016/j.rse.2010.04.002
Muller-Karger F. E., Varela R., Thunell R., Luerssen R., Hu C., Walsh J. J. (2005). The importance of continental margins in the global carbon cycle. Geophysical Res. Lett. 32, L01602. doi: 10.1029/2004GL021346
Navarro G., Ruiz J. (2006). Spatial and temporal variability of phytoplankton in the Gulf of Cádiz through remote sensing images. Deep Sea Res. Part II: Topical Stud. Oceanography. 53, 1241–1260. doi: 10.1016/j.dsr2.2006.04.014
Peter R., Kuttippurath J., Chakraborty K., Sunanda N. (2023). A high concentration CO2 pool over the Indo-Pacific Warm Pool. Sci. Rep. 13, 4314–4325. doi: 10.1038/s41598-023-31468-0
Pittman N. A., Strutton P. G., Johnson R., Matear R. J., Sutton A. J. (2022). Relationships between air-sea CO2 flux and new production in the equatorial pacific. Global Biogeochemical Cycles. 36, e2021GB007121. doi: 10.1029/2021GB007121
Rustogi P., Landschützer P., Brune S., Baehr J. (2023). The impact of seasonality on the annual air-sea carbon flux and its interannual variability. NPJ Climate Atmospheric Science. 6, 66. doi: 10.1038/s41612-023-00378-3
Sabine C. L., Feely R. A., Gruber N., Key R. M., Lee K., Bullister J. L., et al. (2004). The oceanic sink for anthropogenic CO2. Science. 305, 367–371. doi: 10.1126/science.1097403
Schiller-Weiss I., Martin T., Karstensen J., Biastoch A. (2023). Do salinity variations along the east Greenland shelf show imprints of increasing meltwater runoff? J. Geophysical Research: Oceans. 128, e2023JC019890. doi: 10.1029/2023JC019890
Shan K., Lin Y., Chu P. S., Yu X., Song F. (2023). Seasonal advance of intense tropical cyclones in a warming climate. Nature. 623, 83–89. doi: 10.1038/s41586-023-06544-0
Sheu D. D., Chou W. C., Wei C. L., Hou W. P., Wong G. T. F., Hsu C. W. (2010). Influence of El Niño on the sea-to-air CO2 flux at the SEATS time-series site, northern South China Sea. J. Geophysical Research: Oceans. 115, C10021. doi: 10.1029/2009jc006013
Sun H., Zheng K., Yu J., Zheng H. (2023). Spatiotemporal distributions of air-sea CO2 flux modulated by windseas in the Southern Indian Ocean. Front. Mar. Sci. 10, 1139591. doi: 10.3389/fmars.2023.1139591
Takahashi T., Sutherland S. C., Wanninkhof R., Sweeney C., Feely R. A., Chipman D. W., et al. (2009). Climatological mean and decadal change in surface ocean pCO2, and net sea–air CO2 flux over the global oceans. Deep Sea Res. Part II: Topical Stud. Oceanography. 56, 554–577. doi: 10.1016/j.dsr2.2008.12.009
Tan J., Shen X., Li Q. (2009). Study on the feedback between ocean carbon circulation and global climate change. J. Meteorological Res. Application 30, 33–36.
Tang T., Tai J.-H., Yang Y. (2000). The flow pattern north of Taiwan and the migration of the Kuroshio. Continental Shelf Res. 20, 349–371. doi: 10.1016/S0278-4343(99)00076-X
Valsala V. K., Roxy M. K., Ashok K., Murtugudde R. (2014). Spatiotemporal characteristics of seasonal to multidecadal variability of pCO2 and air-sea CO2 fluxes in the equatorial Pacific Ocean. J. Geophysical Research: Oceans. 119, 8987–9012. doi: 10.1002/2014JC010212
Venrick E. L., McGowan J. A., Cayan D. R., Hayward T. L. (1987). Climate and chlorophyll a: long-term trends in the central north pacific ocean. Science. 238, 70–72. doi: 10.1126/science.238.4823.70
Wallace J. M., Gutzler D. S. (1981). Teleconnections in the geopotential height field during the Northern Hemisphere winter. Monthly Weather Rev. 109, 784–812. doi: 10.1175/1520-0493(1981)109<0784:TITGHF>2.0.CO;2
Wang Y.-L., Jin F.-F., Wu C.-R., Qiu B. (2024). Northwestern Pacific Oceanic circulation shaped by ENSO. Sci. Rep. 14, 11684. doi: 10.1038/s41598-024-62361-z
Wang X., Murtugudde R., Hackert E., Wang J., Beauchamp J. (2015). Seasonal to decadal variations of sea surface pCO2 and sea-air CO2 flux in the equatorial oceans over 1984–2013: A basin-scale comparison of the Pacific and Atlantic Oceans. Global Biogeochemical Cycles. 29, 597–609. doi: 10.1002/2014GB005031
Wang G., Wu L., Mei W., Xie S. P. (2022). Ocean currents show global intensification of weak tropical cyclones. Nature. 611, 496–500. doi: 10.1038/s41586-022-05326-4
Wanninkhof R. (1992). Relationship between wind speed and gas exchange over the ocean. J. Geophysical Research: Oceans. 97, 7373–7382. doi: 10.1029/92JC00188
Wanninkhof R., Feely R. A., Chen H., Cosca C., Murphy P. P. (1996). Surface water fCO2 in the eastern equatorial Pacific during the 1992–1993 El Niño. J. Geophysical Research: Oceans. 101, 16333–16343. doi: 10.1029/96JC01348
Yang F., Zhang L., Long M. (2022). Intensification of pacific trade wind and related changes in the relationship between sea surface temperature and sea level pressure. Geophysical Res. Lett. 49, e2022GL098052. doi: 10.1029/2022GL098052
Yuan N., Mitsudera H. (2023). Cross-shelf overturning in geostrophic-stress-dominant coastal fronts. J. Oceanogr. 79, 27–48. doi: 10.1007/s10872-022-00661-6
Zhabin I. A., Vanin N. S., Dmitrieva E. V. (2019). Summer wind-driven upwelling and tidal mixing on the western kamchatka shelf in the sea of okhotsk. Russ. Meteorol. Hydrol. 44, 130–135. doi: 10.3103/S1068373919020067
Keywords: air-sea CO2 flux, ENSO, EOF analysis, environmental factors, Northwest Pacific
Citation: Shi H, Chen Y and Gao H (2024) Spatiotemporal evolution of air-sea CO2 flux in the Northwest Pacific and its response to ENSO. Front. Mar. Sci. 11:1461012. doi: 10.3389/fmars.2024.1461012
Received: 07 July 2024; Accepted: 19 August 2024;
Published: 09 September 2024.
Edited by:
Meilin Wu, Chinese Academy of Sciences (CAS), ChinaReviewed by:
Yuhan Cao, Jiangsu Ocean University, ChinaCopyright © 2024 Shi, Chen and Gao. This is an open-access article distributed under the terms of the Creative Commons Attribution License (CC BY). The use, distribution or reproduction in other forums is permitted, provided the original author(s) and the copyright owner(s) are credited and that the original publication in this journal is cited, in accordance with accepted academic practice. No use, distribution or reproduction is permitted which does not comply with these terms.
*Correspondence: Hui Gao, aHVpZ2FvQGdkb3UuZWR1LmNu
Disclaimer: All claims expressed in this article are solely those of the authors and do not necessarily represent those of their affiliated organizations, or those of the publisher, the editors and the reviewers. Any product that may be evaluated in this article or claim that may be made by its manufacturer is not guaranteed or endorsed by the publisher.
Research integrity at Frontiers
Learn more about the work of our research integrity team to safeguard the quality of each article we publish.