 Renfu Fan
 Hao Wei
 Yanfang Mai4
- 1Hainan Academy of Ocean and Fisheries Sciences, Haikou, China
- 2Yazhou Bay Innovation Institute of Hainan Tropical Ocean University, Sanya, China
- 3School of Marine Science and Technology, Tianjin University, Tianjin, China
- 4College of Computer Science and Technology, Hainan Tropical Ocean University, Sanya, China
Understanding the wave and current conditions of coral reef ecosystems is essential for maintaining their health, as many reef processes are controlled by these hydrodynamic conditions. In this study, high-frequency measurements of tides, waves, and currents were made using acoustic, electromagnetic, and pressure instruments over a 28-d period on the fore-reef and reef flat of a coral reef atoll in the South China Sea. The research revealed wave transformation, tidal and wave modulation of flow, and wave setup conditions for the first time at this typical atoll. Three large wave processes dominated by gravity waves (GWs) are observed in the fore-reef. The GWs are significantly attenuated on the reef flat, whereas infragravity (IG) waves strengthened. The tidal modulation of GWs and IG waves on the reef flat is significant when the incident wave height exceeded 1 m. In the fore-reef, the modulation of progressive tidal waves and large waves leads to relatively stronger upper-layer currents, and weak near-bottom currents are primarily attributed to the dissipation of tidal wave energy by the rough coral terrain. In calm conditions, flow variations on the reef flat are modulated by tides, thereby allowing seawater flow to pass through the reef flat during spring tides. Conversely, during periods with large waves, tidal modulation of flow on the reef flat is less significant, and the cross-reef flow velocity increases with increasing incident wave height. The occurrence of wave setup on the reef flat enhances cross-reef flow towards the lagoon. The wave setup is positively linearly correlated with the incident wave height. The magnitude of wave setup is associated with the distance between the measurement sites on the fore-reef and reef flat.
1 Introduction
Coral reef systems exhibit high primary productivity and biodiversity (e.g., Chappell, 1980; Hearn et al., 2001), and are known as the tropical rainforests of the ocean. Healthy coral reef ecosystems play important roles in marine resource enhancement, marine environmental protection, and disaster risk reduction (Huang et al., 2021). Hydrodynamic processes have both direct and indirect effects on the ecological health of coral reefs (e.g., Munk and Sargent, 1948; Lowe et al., 2005a, 2005b; Monismith, 2007; Wang et al., 2012). Owing to various driving factors such as breaking waves, tides, wind, and density gradients, the hydrodynamics (e.g., flow conditions) on coral reefs are more complex (e.g., Frith and Mason, 1986; Lowe et al., 2009; Herdman et al., 2015; Lowe and Falter, 2015; Grimaldi et al., 2022). Additionally, the coasts of coral reefs usually exhibit shallow water depths, and local topographic effects may significantly influence flow conditions. For these reasons, in situ observations of waves and currents in the coasts of coral reefs are required to determine the flow variations on the reef, aiding in understanding water exchanges around the reef–lagoon systems, which is fundamental for maintaining the ecological health of coral reefs.
A typical coral reef system comprises a fore-reef, reef crest, reef flat, lagoon, and rough coral substrate. The most common coral reef types are fringing reefs, barrier reefs, and atolls (Woodroffe, 2002). Lagoons are usually present on both barrier reefs and atolls (Yao and Zhong, 2023). It is estimated that wave-dominated and tidally dominated coral reefs account for approximately two-thirds and one-third of coral reefs worldwide, respectively (Lowe and Falter, 2015). Although reefs are believed to be dominated by hydrodynamic forcing, reef processes are also influenced by these combined hydrodynamic forces. At the reef scale (e.g., scales of hundreds of meters), waves and tides are the primary driving forces that influence hydrodynamic conditions on the reef (Monismith, 2007; Lowe and Falter, 2015), with wind stress often playing a secondary role. Wave and tidal processes occur frequently in the fore-reef and reef flat areas. After interacting with the different zones of a reef, open ocean waves and tidal processes form unique hydrodynamic phenomena on the reef, including longer-period waves, oscillatory flow, and breaking wave setups (e.g., Becker et al., 2014; Green et al., 2018; Cheriton et al., 2024).
Wave-dominated reefs often experience energetic wave energy inputs that are strongly dissipated by bottom friction and wave breaking processes (Lowe et al., 2005c; Monismith et al., 2015; Rogers et al., 2016). Lugo-Fernandez et al. (1998) reported a 65–71% reduction in wave energy between the fore-reef and reef crest, with a further decrease of 78–88% when the back of the reef crest was included. Ferrario et al. (2014) suggested that an entire coral reef system can dissipate 97% of deep-water wave energy, of which the reef crest dissipated 86%. Blanchon et al. (2010) found that fringing reefs dissipate 99% of the wave energy under hurricane conditions. Although high wave energy dissipation by reefs is well known, the relative contributions of bottom friction and wave breaking have not been fully elucidated. Changes in wave energy on coral reefs primarily occur as gravity (GWs, 0.04–0.25 Hz), infragravity (IG, 0.004–0.040 Hz), and very low-frequency (VLF, 0.001–0.004 Hz) waves (e.g., Cheriton et al., 2016, 2020, 2024; Gawehn et al., 2016; Bruch et al., 2022). Previous studies have shown that large incident waves from the open ocean lose significant amounts of GW energy during propagation over a reef, some of this energy is transformed into low-frequency bands in the form of bound waves, and the dissipation of GW energy also contributes to the enhancement of low-frequency IG and VLF waves (Longuet-Higgins and Stewart, 1964; Symonds et al., 1982; Hardy and Young, 1996; Lowe et al., 2005c; Pomeroy et al., 2012; Sous et al., 2019). Low-frequency IG and VLF waves typically form in large wave conditions and propagate onto the reef flat. Low-frequency wave variations on the reef flat depend on the incident wave height and tidal water level, with distinct dependencies at different sites (Becker et al., 2016; Shimozono et al., 2022). Changes in the generation and dissipation of GW, IG, and VLF waves influence wave dynamics on a reef. Previous studies have recognized the importance of these waves in fore-reef and reef flat areas; however, further research is required to determine the energy variations of different waves, as well as the effects of incident wave intensity and tidal modulation.
Tidally dominated coral reef systems have substantially different dynamic characteristics than those of wave-dominated systems (Lowe and Falter, 2015). The water level gradient generated by tides between the reef and open ocean drives oscillatory flow across the reef within each tidal cycle (Lowe et al., 2015; Grimaldi et al., 2022). During low tide, the emergence of the reef crest and flat restricts water exchanges between the open ocean and lagoon (Lowe et al., 2016). On the tidally driven semi-enclosed coral atolls in northwestern Australia, the large tidal range results in the exposure of the reef crest and flat during low tide, and the atoll topography and tidal range produce highly asymmetric water levels, flow velocities, and residual currents within the lagoon (Green et al., 2018). Constrained by the reef topography, tidally dominated coral reef systems with large tidal differences (e.g., longer ebb than flood tides) exhibit tidal truncation effects (Ludington, 1979; McCabe et al., 2010; Lowe et al., 2015; Green et al., 2018). Observations at Mermaid Reef over approximately 11 months showed that tidally driven processes accounted for 79% of the hydrodynamics, in which larger tidal ranges caused the reef flat to temporarily act as a physical barrier to incoming and outgoing flow (Grimaldi et al., 2022). Although previous studies have highlighted the roles of tidal range and reef topography in tidally dominated reef systems, detailed explanations of specific tidally modulated flow variations are lacking.
Energetic waves break through the reef crest and create spatial gradients of radiative stress (Longuet-Higgins and Stewart, 1964), which leads to wave setup and wave-induced currents on the reef flat (Vetter et al., 2010; Lentz et al., 2016). Observations at the La Saline fringing reef indicate that wave setup (on the order of tens of cm) has the same magnitude as the still water depth; thus, wave setup is an essential component of wave dissipation calculations (Bruch et al., 2022). Wave setup on the reef flat is largely forced by GWs breaking on the reef, wherein wave setup increases with increasing incident wave height (Vetter et al., 2010; Bruch et al., 2022; Shimozono et al., 2022). Studies have also shown that wave setup appears to be modulated by tides in environments with large tidal ranges, in which wave setup decreases during high tides and increases during low tides (Bonneton et al., 2007; Becker et al., 2014). A direct explanation for this is that lower water levels result in more wave breaking at the reef crest, thereby leading to a higher wave setup. Observations by Lentz et al. (2016) indicate that wave setup could induce cross-reef flows of 5–20 cm s-1. Wave-driven cross-reef and along-reef flows are critical for coral larvae dispersal (Monismith et al., 2006), heat distribution (Davis et al., 2011), and nutrient uptake (Hearn et al., 2001). Therefore, understanding wave setup conditions on a typical coral reef atoll, including the wave setup extent and wave-induced currents, is essential for defining the flow dynamics in reef–lagoon systems.
In this study, we quantitatively analyze changes in high- and low-frequency waves and tidal conditions, as well as their effects on flow. This study aims to determine the wave transformation, tidal and wave modulation of flow, and wave setup conditions from the fore-reef to the reef flat based on high-frequency observations of a typical coral reef atoll in the South China Sea. Section 2 describes the study area, field observations, and data processing methods. Section 3 presents the characteristics of the wind, wave, and current variations. The conditions of the wave transformation, tidal and wave modulation of flow, and estimated wave setup are discussed in Section 4. Finally, Section 5 provides a summary of conclusions.
2 Methods
2.1 Study area
The study area is located in the western central South China Sea. The coral reef atoll system investigated in this study comprises a fore-reef, reef crest, reef flat, lagoon, and channels (Figure 1). The atoll is surrounded by abundant live corals, making a representative coral reef ecosystem in the South China Sea and an important coral conservation area (Huang et al., 2011; Wu et al., 2011; Yang et al., 2015). The water depth on the reef flat is approximately 1–3 m, whereas the water depth in the lagoon increases gradually from northeast to southwest, with an average depth of about 30 m (Cai et al., 2020). The reef also contained multiple channels (Figure 1B) that facilitate the exchange of water between the lagoon and open ocean.
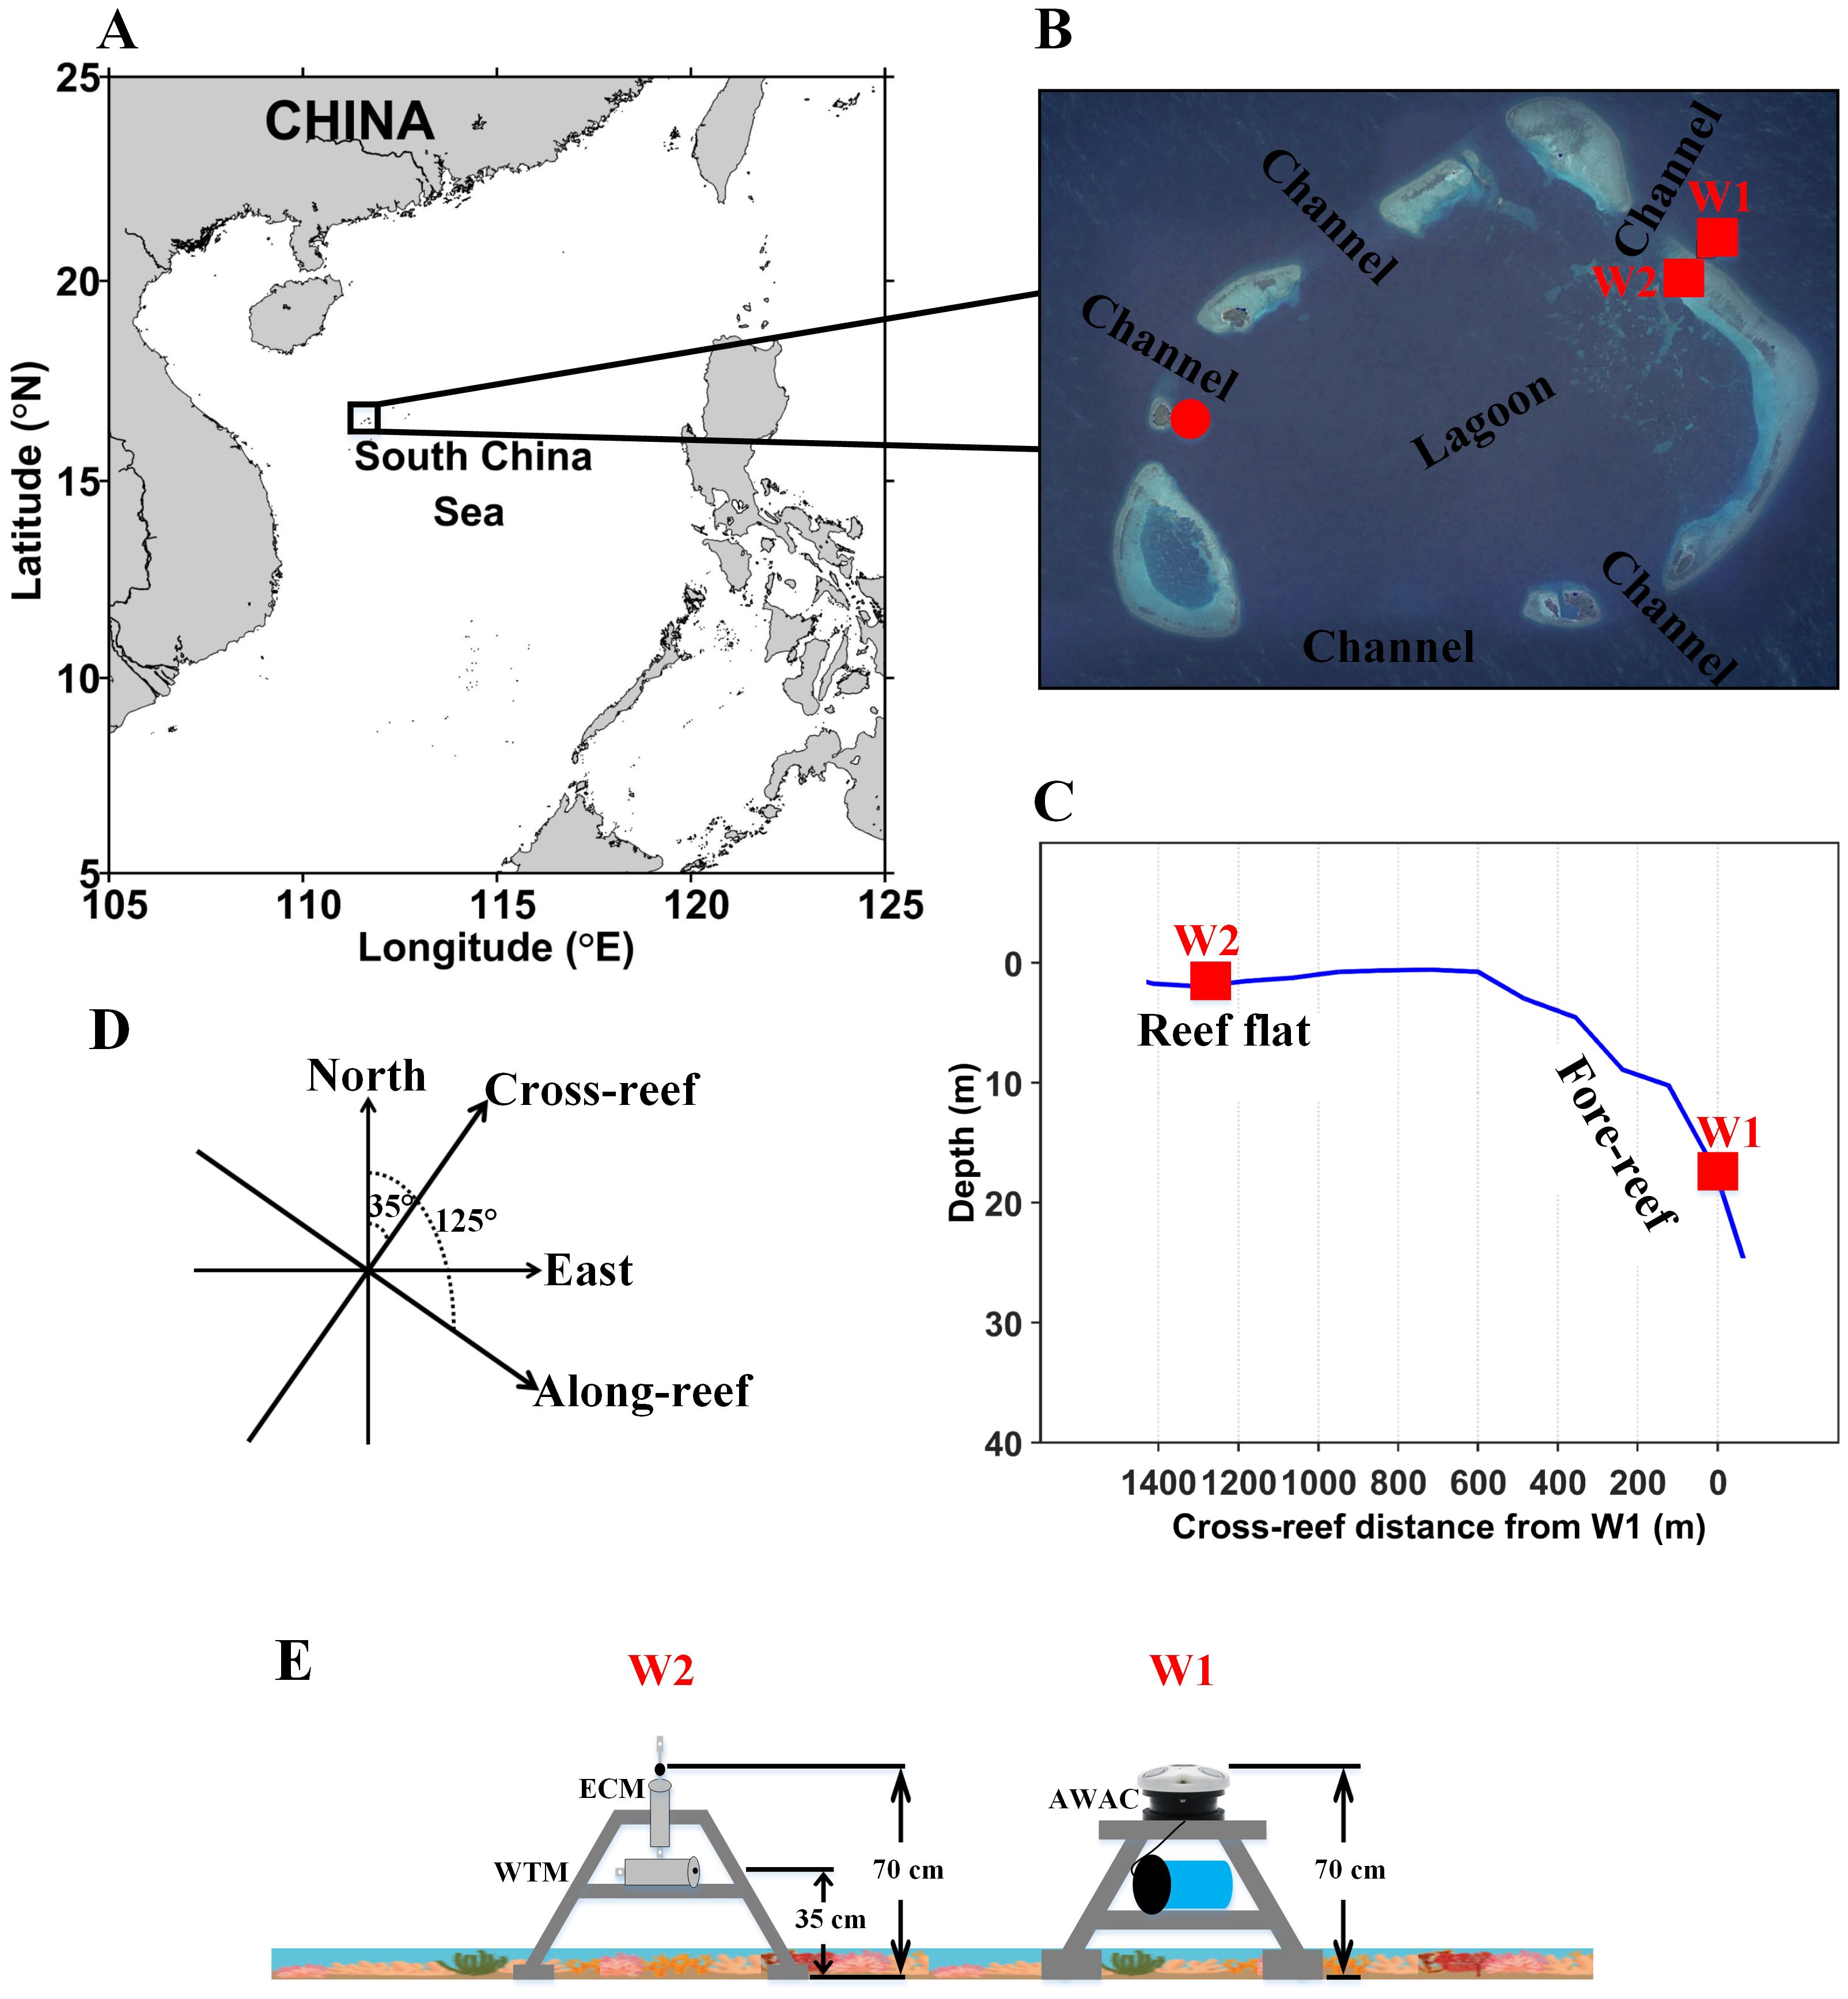
Figure 1. Locations of (A) the coral reef atoll in the South China Sea and (B) the mooring stations W1 and W2 (red solid squares) on the fore-reef and reef flat. Panel (B) presents sketch map of the coral reef atoll obtained from a satellite image provided by Google Earth. Panel (C) presents cross-section of the reef bathymetry. (D) Black arrows denoting the two sets of coordinates (north and east vs. cross- and along-reef) used for the atoll. (E) Sketch of the instruments deployed at W1 (AWAC) and W2 (ECM, WTM) sites. In (B), the red solid circle denotes the location of the wind measurements at Shanhu Dao station.
The study area is frequently influenced by monsoons and typhoons owing to prevailing northeasterly winds from November to February and prevailing southwesterly winds and typhoons from June to October. On average, the study area is affected by 1.4 typhoons per year (Yang et al., 2015). Northeast and southwest wave directions are dominant in this region. Previous studies have reported 1.22 m and 0.78 m tidal ranges during spring and neap tides, respectively (Wang, 2001), as well as strong diurnal current energy (Deng et al., 2013), in this region. Satellite altimeter data indicate that the study area is located in the northern part of an anticyclonic circulation pattern during spring and summer (Wang et al., 2012).
2.2 Field measurements
Measurements were set up on the fore-reef and reef flat of the atoll, corresponding to stations W1 and W2, respectively (red squares in Figure 1). The water depths at W1 and W2 were approximately 17 and 2 m, respectively, and the straight-line distance between the two stations was approximately 1250 m (Figure 1C). The measurement period extended from March 28 to April 25, 2021 (~28 d).
A bottom-mounted tripod equipped with a Nortek 1MHz Acoustic Wave and Current profiler (AWAC) was deployed at W1 (Figure 1E). The AWAC measured high-frequency pressure, wave direction, and velocity profiles. The acoustic sensor of the upward-looking AWAC was positioned at 0.70 m above the bottom (mab), with a blanking distance of 0.40 m. Pressure and wave direction measurements were taken in burst mode using a 60-min sampling interval. Each sampling period was 20 min long, with a sampling frequency of 2 Hz. Velocity profile observations were also conducted in burst mode using a 10-min sampling interval. Each sampling period was 1 min long, with a sampling frequency of 1 Hz, from which 1-min averaged results were outputted. The vertical interval of velocity was 0.50 m and the center of the first layer was positioned at 1.60 mab.
A bottom-mounted tripod equipped with a JFE Infinity Electromagnetic Current Meter (ECM) and a JFE Infinity Wave and Tide Meter (WTM) was deployed at W2 (Figure 1E). The ECM sensor was positioned at 0.70 mab to measure single-point velocities. ECM measurements were taken in burst mode using a 20-min sampling interval. Each sampling period was 1 min long, with a sampling frequency of 1 Hz. The WTM sensor was positioned at 0.35 mab and used to measure high-frequency pressure. WTM measurements were conducted in burst mode using a 60-min sampling interval. Each sampling period was 20 min long, with a sampling frequency of 2 Hz.
Wind data in the study area were collected 5 m above the sea surface at Shanhu Dao station (Figure 1B, red solid circle) on the western side of the atoll. The data had a 3-h sampling interval and were obtained from the National Centers for Environmental Information (https://www.ncei.noaa.gov/maps/hourly/). Wind speeds 10 m above the sea surface () were calculated using the method described by Large and Pond (1981). Wind directions were reported as the direction from which the wind was coming.
2.3 Data processing
To obtain the surface elevation spectra (), pressure power spectra () were first calculated for each sampling period (1200 s; AWAC and WTM = 2400 records) using the Welch method with a Hamming window of 20 min. The surface elevation power spectrum considering the pressure signal attenuation was then computed as follows (Rogers et al., 2015; Acevedo-Ramirez et al., 2021):
where h is the local water depth, is the height of the pressure gauge above the bottom, = 1021.7 kg m-3 is the seawater density calculated from the measured water temperature and salinity, = 9.8 m s-2 is the acceleration of gravity, and k is the wave number computed from the dispersion relationship , where is the radian frequency (Dean and Dalrymple, 1991) and f is the frequency. The mean wave period () was calculated based on the first spectral moment of . Based on the acoustic surface tracking data measured by the AWAC, the estimation of mean wave direction () was obtained from Nortek Storm software package with the maximum likelihood method, where the direction is the coming from. The spectrum-based significant wave heights (H) were calculated for each frequency band. The total (, ), GW (, ), IG (, ), and VLF (, ) wave heights were calculated as follows:
where = 1 is the Nyquist frequency of the pressure sampling (Cheriton et al., 2016, 2020; Bruch et al., 2022; Grimaldi et al., 2022). The root mean square near-bottom wave velocity () was estimated as follows (Monismith et al., 2015):
Following the approach described by Monismith et al. (2015), the wave energy flux (F) was calculated using the following equation:
where is the group velocity, which is expressed as follows (Lowe et al., 2005c; Acevedo-Ramirez et al., 2021):
The F values for the total, GW, IG, and VLF frequency bands were then calculated (, , , and , respectively). The percentage of dissipated energy flux () between W1 and W2 was computed using:
where is the change in energy flux between the stations and is the wave energy flux at W1. To compute the average energy dissipation rate (), the one-dimensional wave energy flux equation was discretized as follows (Monismith et al., 2015; Acevedo-Ramirez et al., 2021):
where is the projected distance to a similar depth, and the distance that a wave must traverses between stations taking into account the wave direction .
The burst-averaged water levels were obtained from the pressure data collected at W1 and W2. The variations in water level were similar at both stations (–0.66 to +0.61 m). Harmonic analysis of the water level time series at both stations was performed using the T_TIDE toolbox (Pawlowicz et al., 2002). The tidal variations obtained from the harmonic analysis were in agreement with the observed water level changes (see the magenta and black lines in Figure 2), indicating that the tidal elevations in the study area controlled the total water level variations. Diurnal constituents O1 and K1 were the most significant tidal components, followed by the semidiurnal constituent M2. Shallow water constituents M4 and M6 were not significant. During the observation period, the tidal range varied from 0.01 to 1.17 m, with an average of 0.67 m. The average tidal ranges during spring and neap tides were 1.10 and 0.53 m, respectively. The tidal-type coefficient for both stations was 2.88, indicating that the tidal regime in the study area is dominated by irregular diurnal tides.
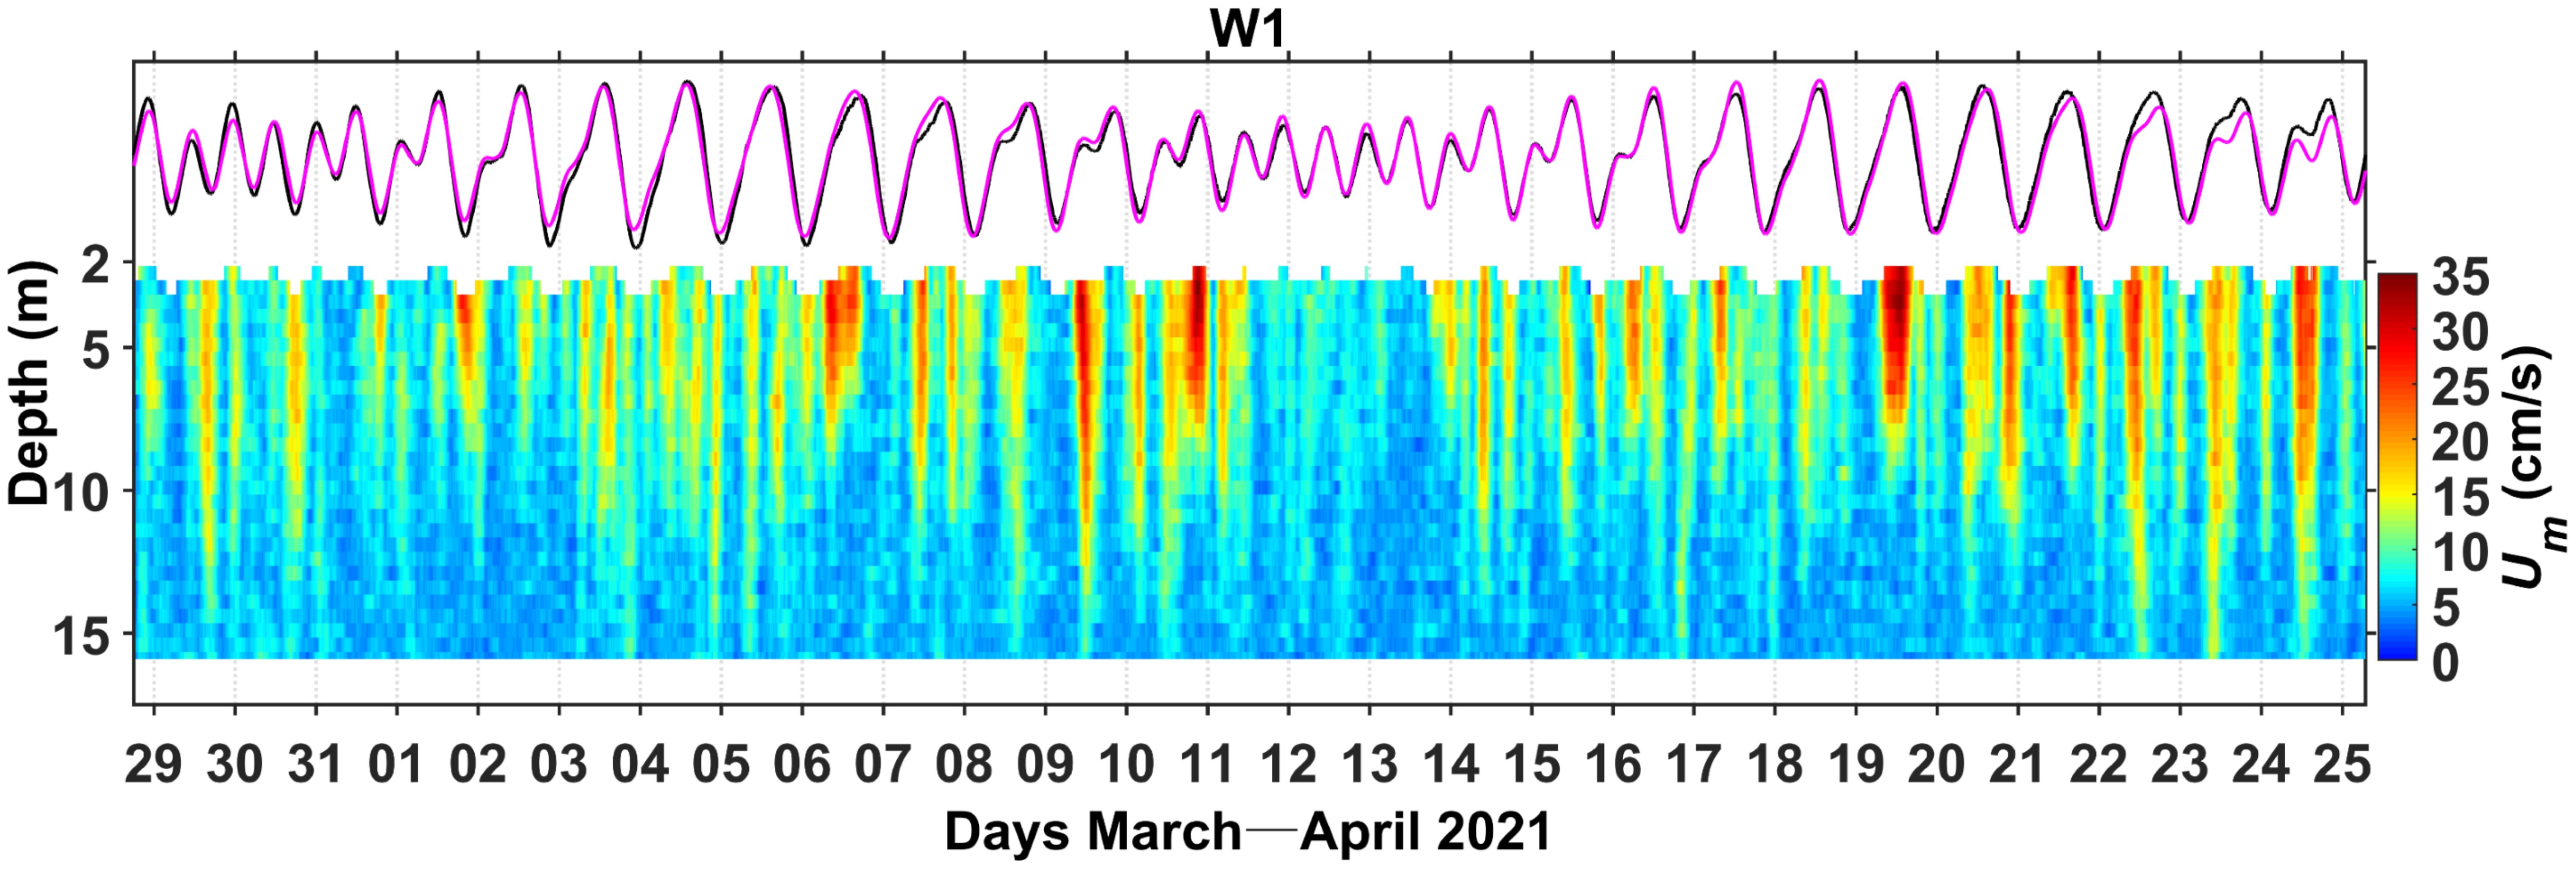
Figure 2. Depth–time variations of the burst-averaged velocity magnitude () at W1. The magenta and black lines denote the variations of the tidal and observed water levels, respectively.
As shown in Figure 1D, the burst-averaged flow velocities in the east (u) and north (v) components were converted into flow velocity components in along-reef () and cross-reef () directions. A positive direction was defined as 125° clockwise from north, whereas a positive direction was defined as 35° clockwise from north. The magnitude of the horizontal flow velocity () was calculated as follows:
3 Results
3.1 Wind speed and direction
Figure 3 shows the time series of wind speed and direction obtained from the meteorological station at Shanhu Dao. Throughout the observation period, the prevailing winds in the study area were northeasterly and southeasterly, with W10 values ranging from 0.9 to 6.4 m s-1 (mean of 3.0 m s-1). At the beginning of the observation period (March 30–31), prevailing southeasterly winds exceeded speeds of 4.0 m s-1. From April 4 to 14, the wind became northeasterly, with stronger winds (W10 > 5.0 m s-1) on April 6–7 and April 10–11. The wind changed back to southeasterly on April 15–16 and W10 decreased to below 2 m s-1. From April 19 to 21, easterly winds prevailed, with W10 values of 2–4 m s-1. Near the end of the observation period (April 23–24), the wind field was once again dominated by southeasterly winds.
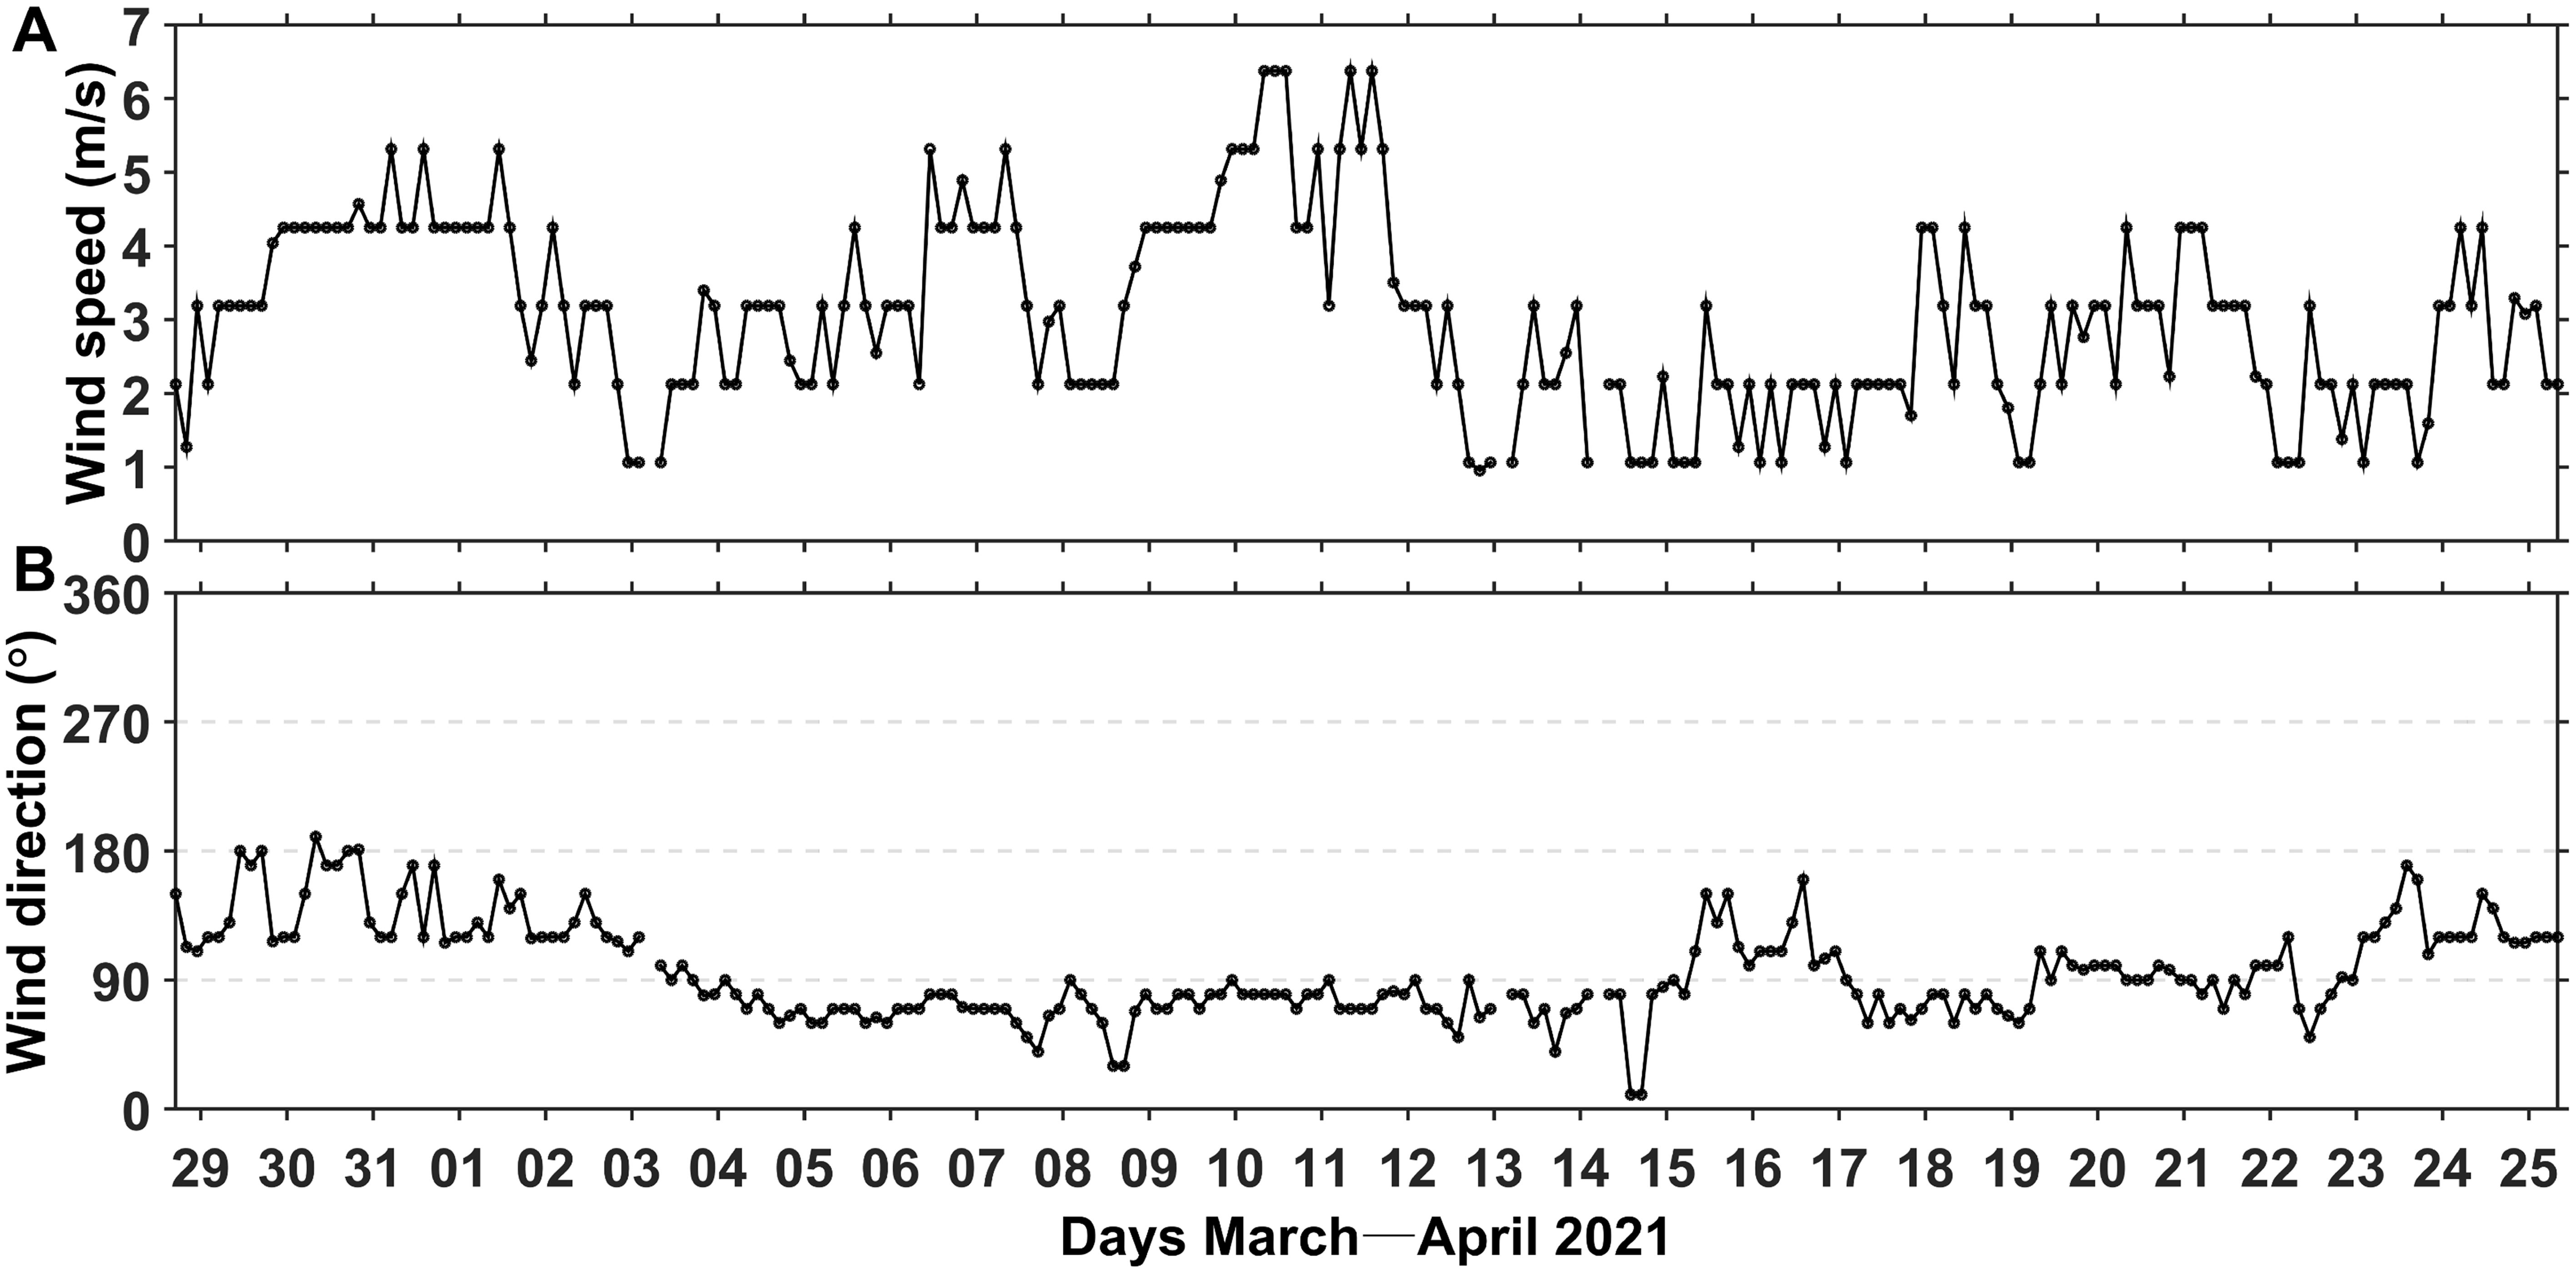
Figure 3. Time series of (A) wind speed and (B) direction at Shanhu Dao station. Wind directions are defined in the positive clockwise direction (north = 0°).
3.2 Wave conditions
The wave spectra generated by aligning Sηη at W1 and W2 are shown in Figure 4. The time-averaged spectra (Figures 4C, D) indicate that the boundaries between the GW and IG (0.04 Hz) and between the IG and VLF (0.004 Hz) bands are suitable choices for this study because the spectra exhibit relatively low energies at these frequencies.
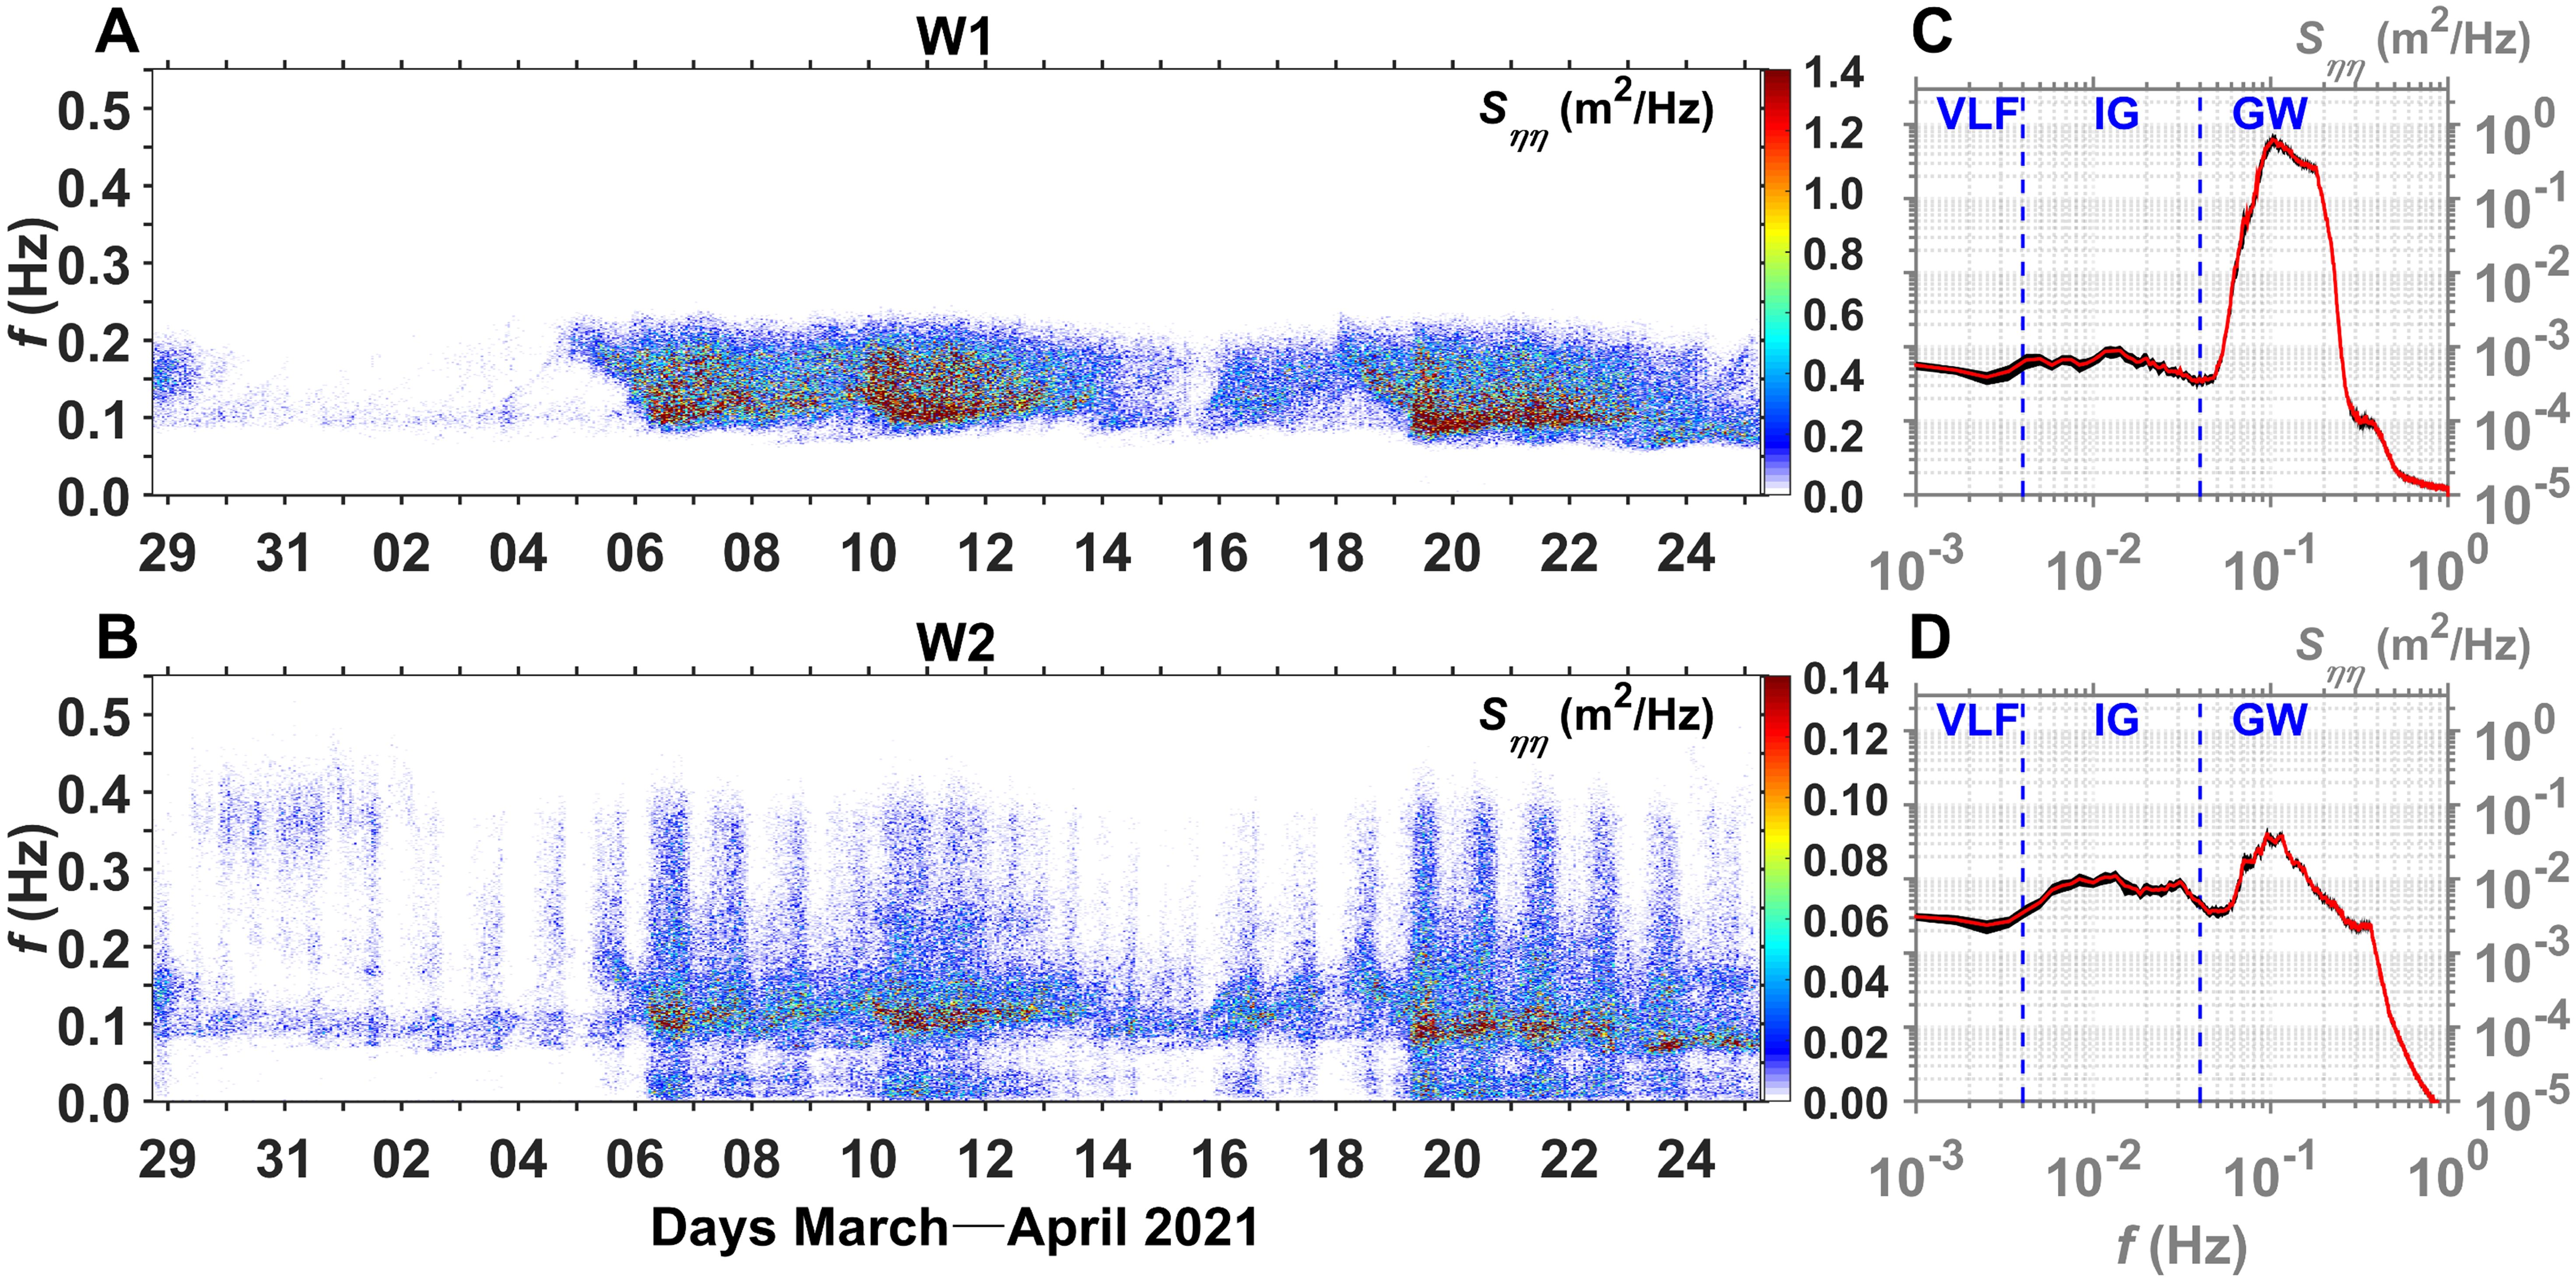
Figure 4. (A, B) Temporal variations in wave energy spectra and (C, D) time-averaged spectra over the 28-d experiment at (A, C) W1 and (B, D) W2. In (C) and (D), vertical blue dashed lines represent the frequency band boundaries (0.04 Hz for gravity wave (GW) and infragravity (IG) wave bands, and 0.004 Hz for IG wave and very low-frequency (VLF) wave bands).
On the fore-reef at W1, the Sηη values were mainly distributed in the 0.1–0.2 Hz frequency band, with relatively higher Sηη values observed during April 6–8, April 10–12, and April 19–21 (Figure 4A). As the waves propagated across the reef flat at W2, the recorded Sηη values were smaller (Figure 4B), but periods with higher Sηη values were corresponded with those observed at W1. The Sηη values on the reef flat covered a wide frequency band, including long-period waves with frequencies less than 0.04 Hz and shorter period waves with frequencies of 0.2–0.4 Hz.
The average spectral densities indicate that the GW energy levels on the fore-reef were higher than those in the IG and VLF bands, with a peak energy level at 0.10 Hz (Figure 4C). On the reef flat, the GW energy levels were lower than those on the fore-reef, whereas the IG and VLF bands had higher energy levels (Figure 4D). Two energy peaks were observed in the GW frequency band at 0.10 and 0.35 Hz. These results suggest that energetic GWs influence the fore-reef area, whereas attenuated GWs and long-period IG and VLF waves influence the reef flat.
Figure 5A shows the wave height time series measured at W1. The variations of were consistent with those of , whereas and were near zero throughout the observation period, indicating the dominance of GWs on the observed waves. During the observation period, Hs, , and ranged from 0.10 to 1.81 m, from 6 to 10 s, and from 1 to 22 cm s-1, respectively (Figures 5A, C, E), ranged from 43 to 90° (northeasterly waves), with an incoming wave direction that was nearly parallel to the cross-reef orientation (, Figures 1D, 5D). Three relatively large wave events (, = 7–9 s) occurred on April 6–7, 10–12, and 19–21, with values of 10–20 cm s-1.
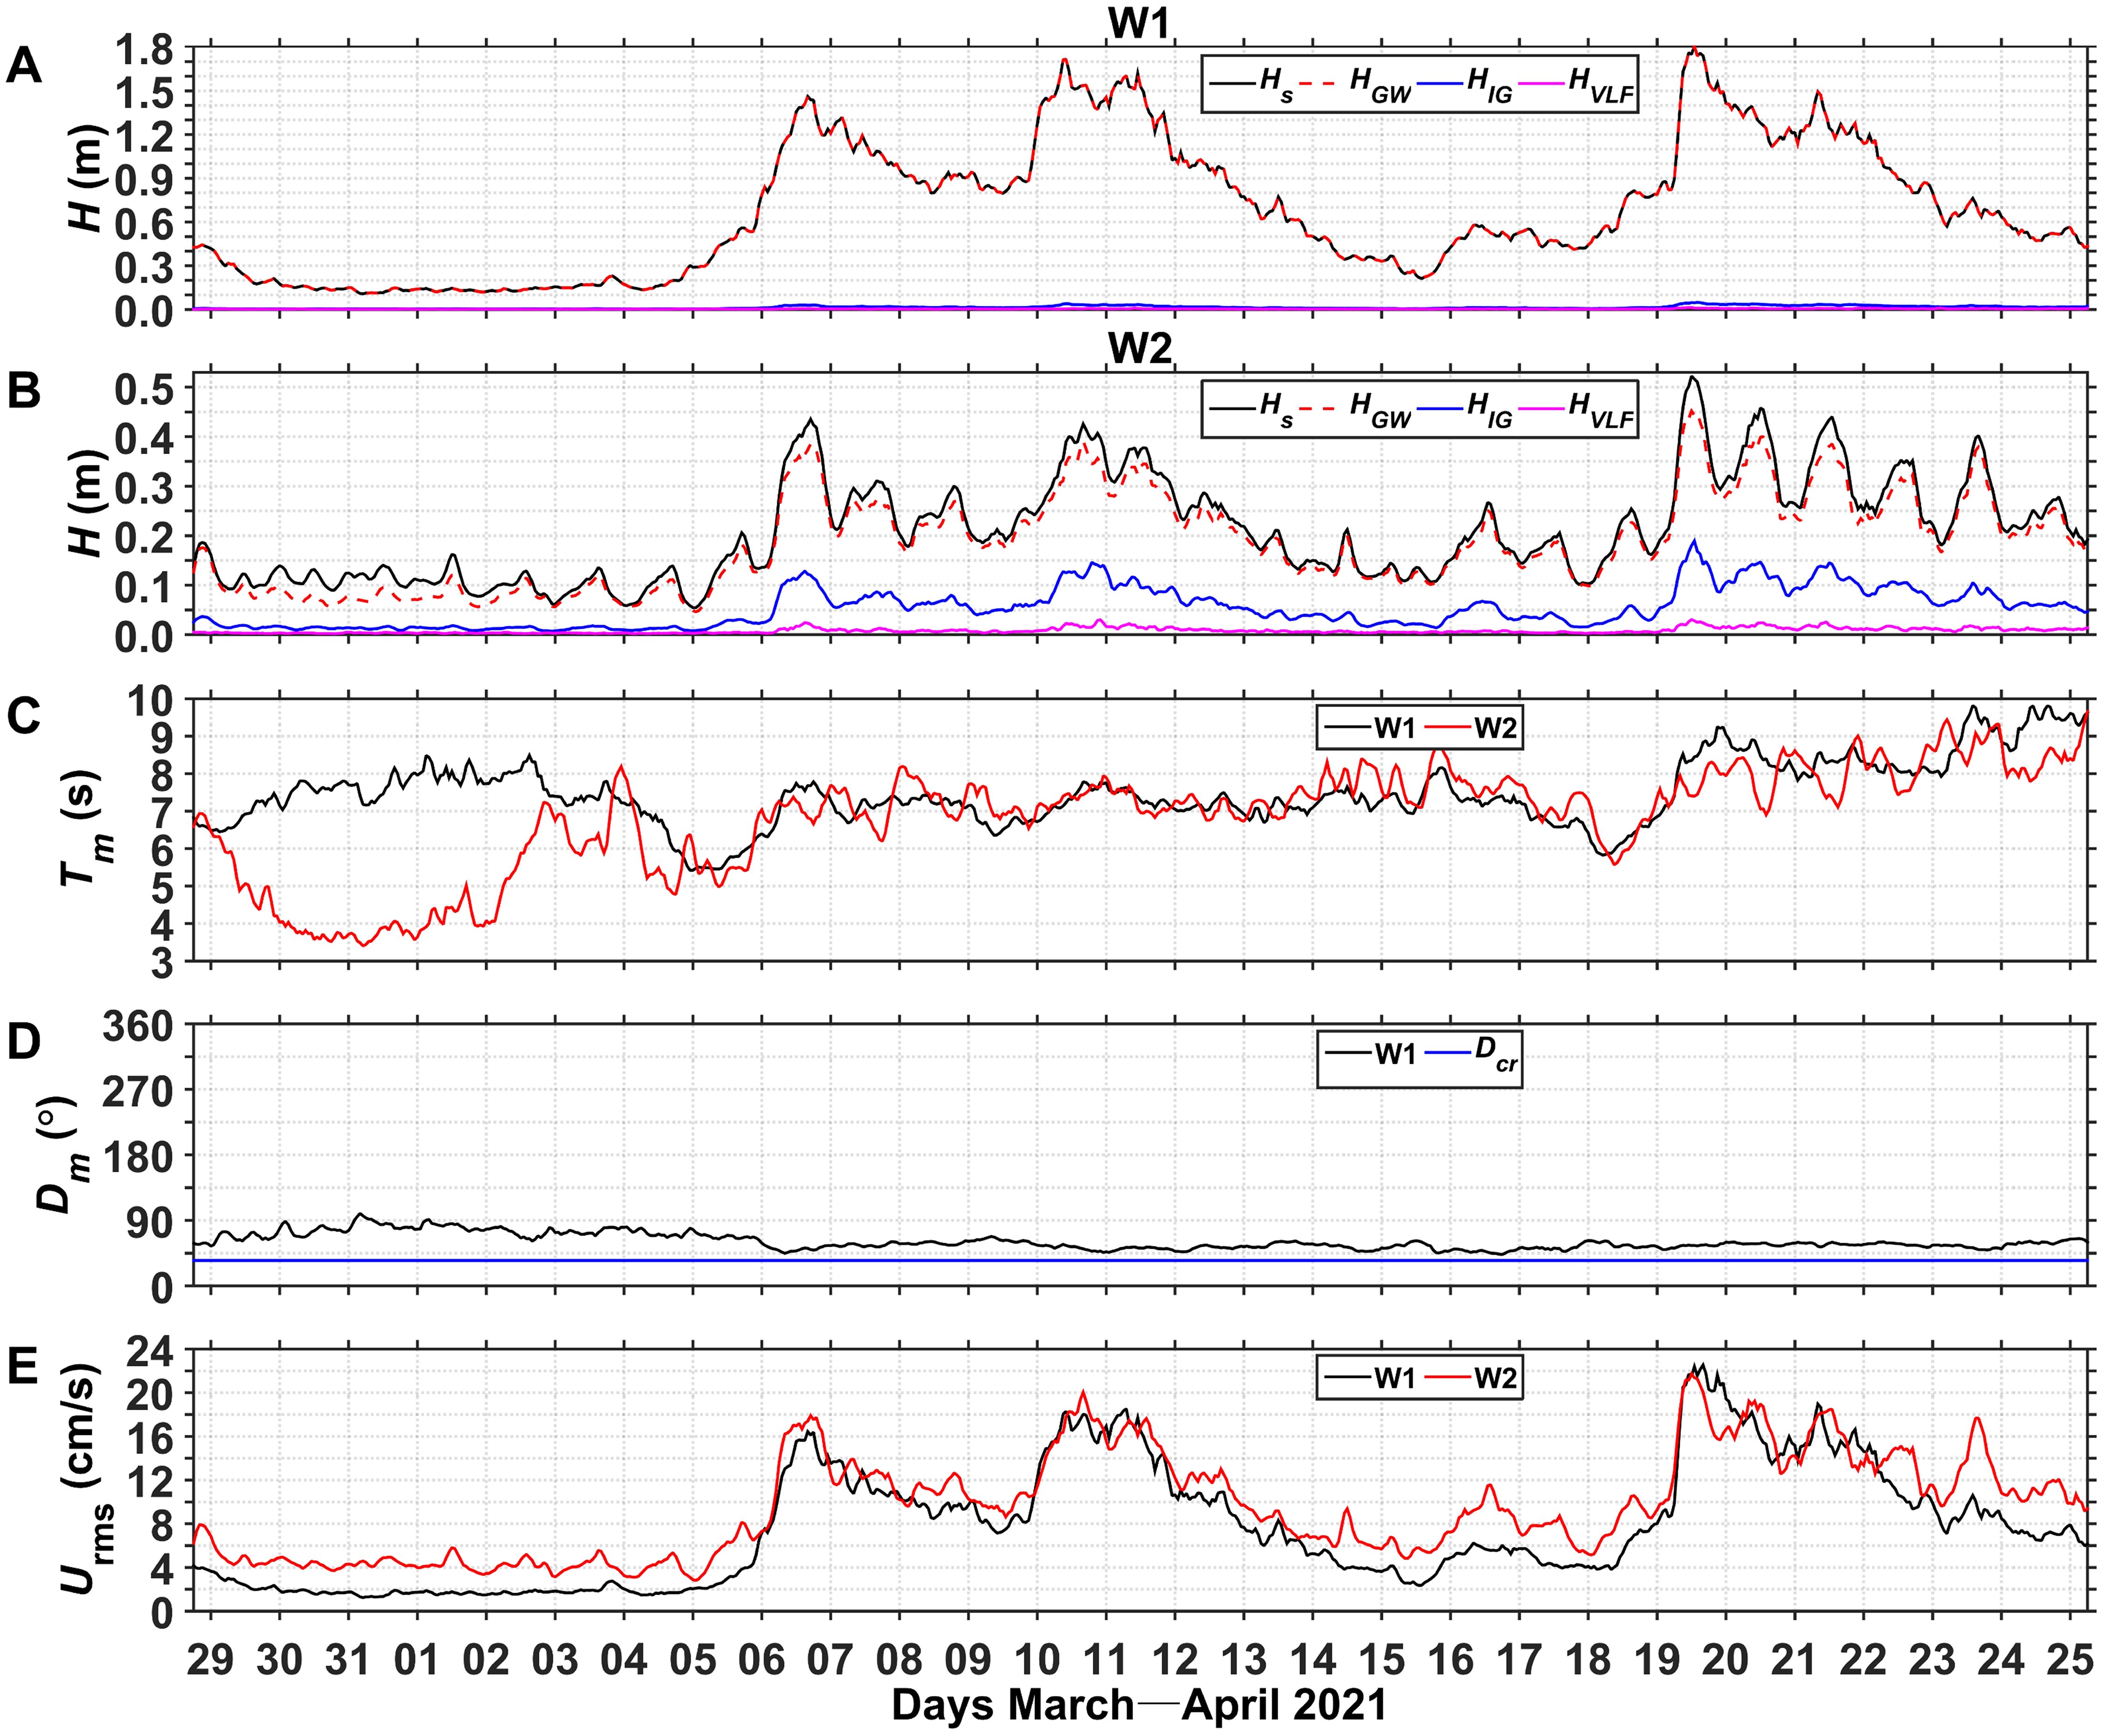
Figure 5. Time series of wave parameters: wave heights (H) at (A) W1 and (B) W2, (C) mean wave period () at W1 (black line) and W2 (red line), (D) mean wave direction () at W1, and (E) root-mean-square near-bottom wave velocity () at W1 (black line) and W2 (red line). In (A) and (B), , , , and denote significant wave heights of the total, GW, IG, and VLF waves, respectively. In (D), denotes the cross-reef orientation.
The wave heights measured at W2 on the reef flat were significantly lower than those measured at W1. and ranged from 0.05 to 0.52 m and from 4 to 9 s, respectively (Figures 5B, C). The variations of were mainly influenced by . In addition, IG waves were observed on the reef flat, with ranging from 0.01 to 0.19 m. Both and exhibited tidal signals. The variations in the VLF waves were not significant ( of 0.002–0.03 m). The values on the reef flat varied significantly, ranging from 3 to 22 cm s-1.
At both stations, the variations in corresponded with those of Hs. On the fore-reef at W1, was less than 2.00 kW m-1 during low wave conditions, but varied between 3.50 and 16.62 kW m-1 during high wave conditions (Figure 6A). On the reef flat at W2, was relatively small, ranging from 0.01 to 0.79 kW m-1 (Figure 6B). was the main contributor to at W1 and W2. The values on the reef flat varied from 1.33×10⁻⁴ to 0.12 kW m-1. decreased substantially from the fore-reef to the reef flat, with a of 80–90% during most of the study period and exceeding 90% during the three large swell events in April (Figure 6C). ranged from 10-5 to 10-2 kW m-2 between W1 and W2, and approached 10-2 kW m-2 during the large swell events (Figure 6D), indicating that wave energy was strongly dissipated in this area.
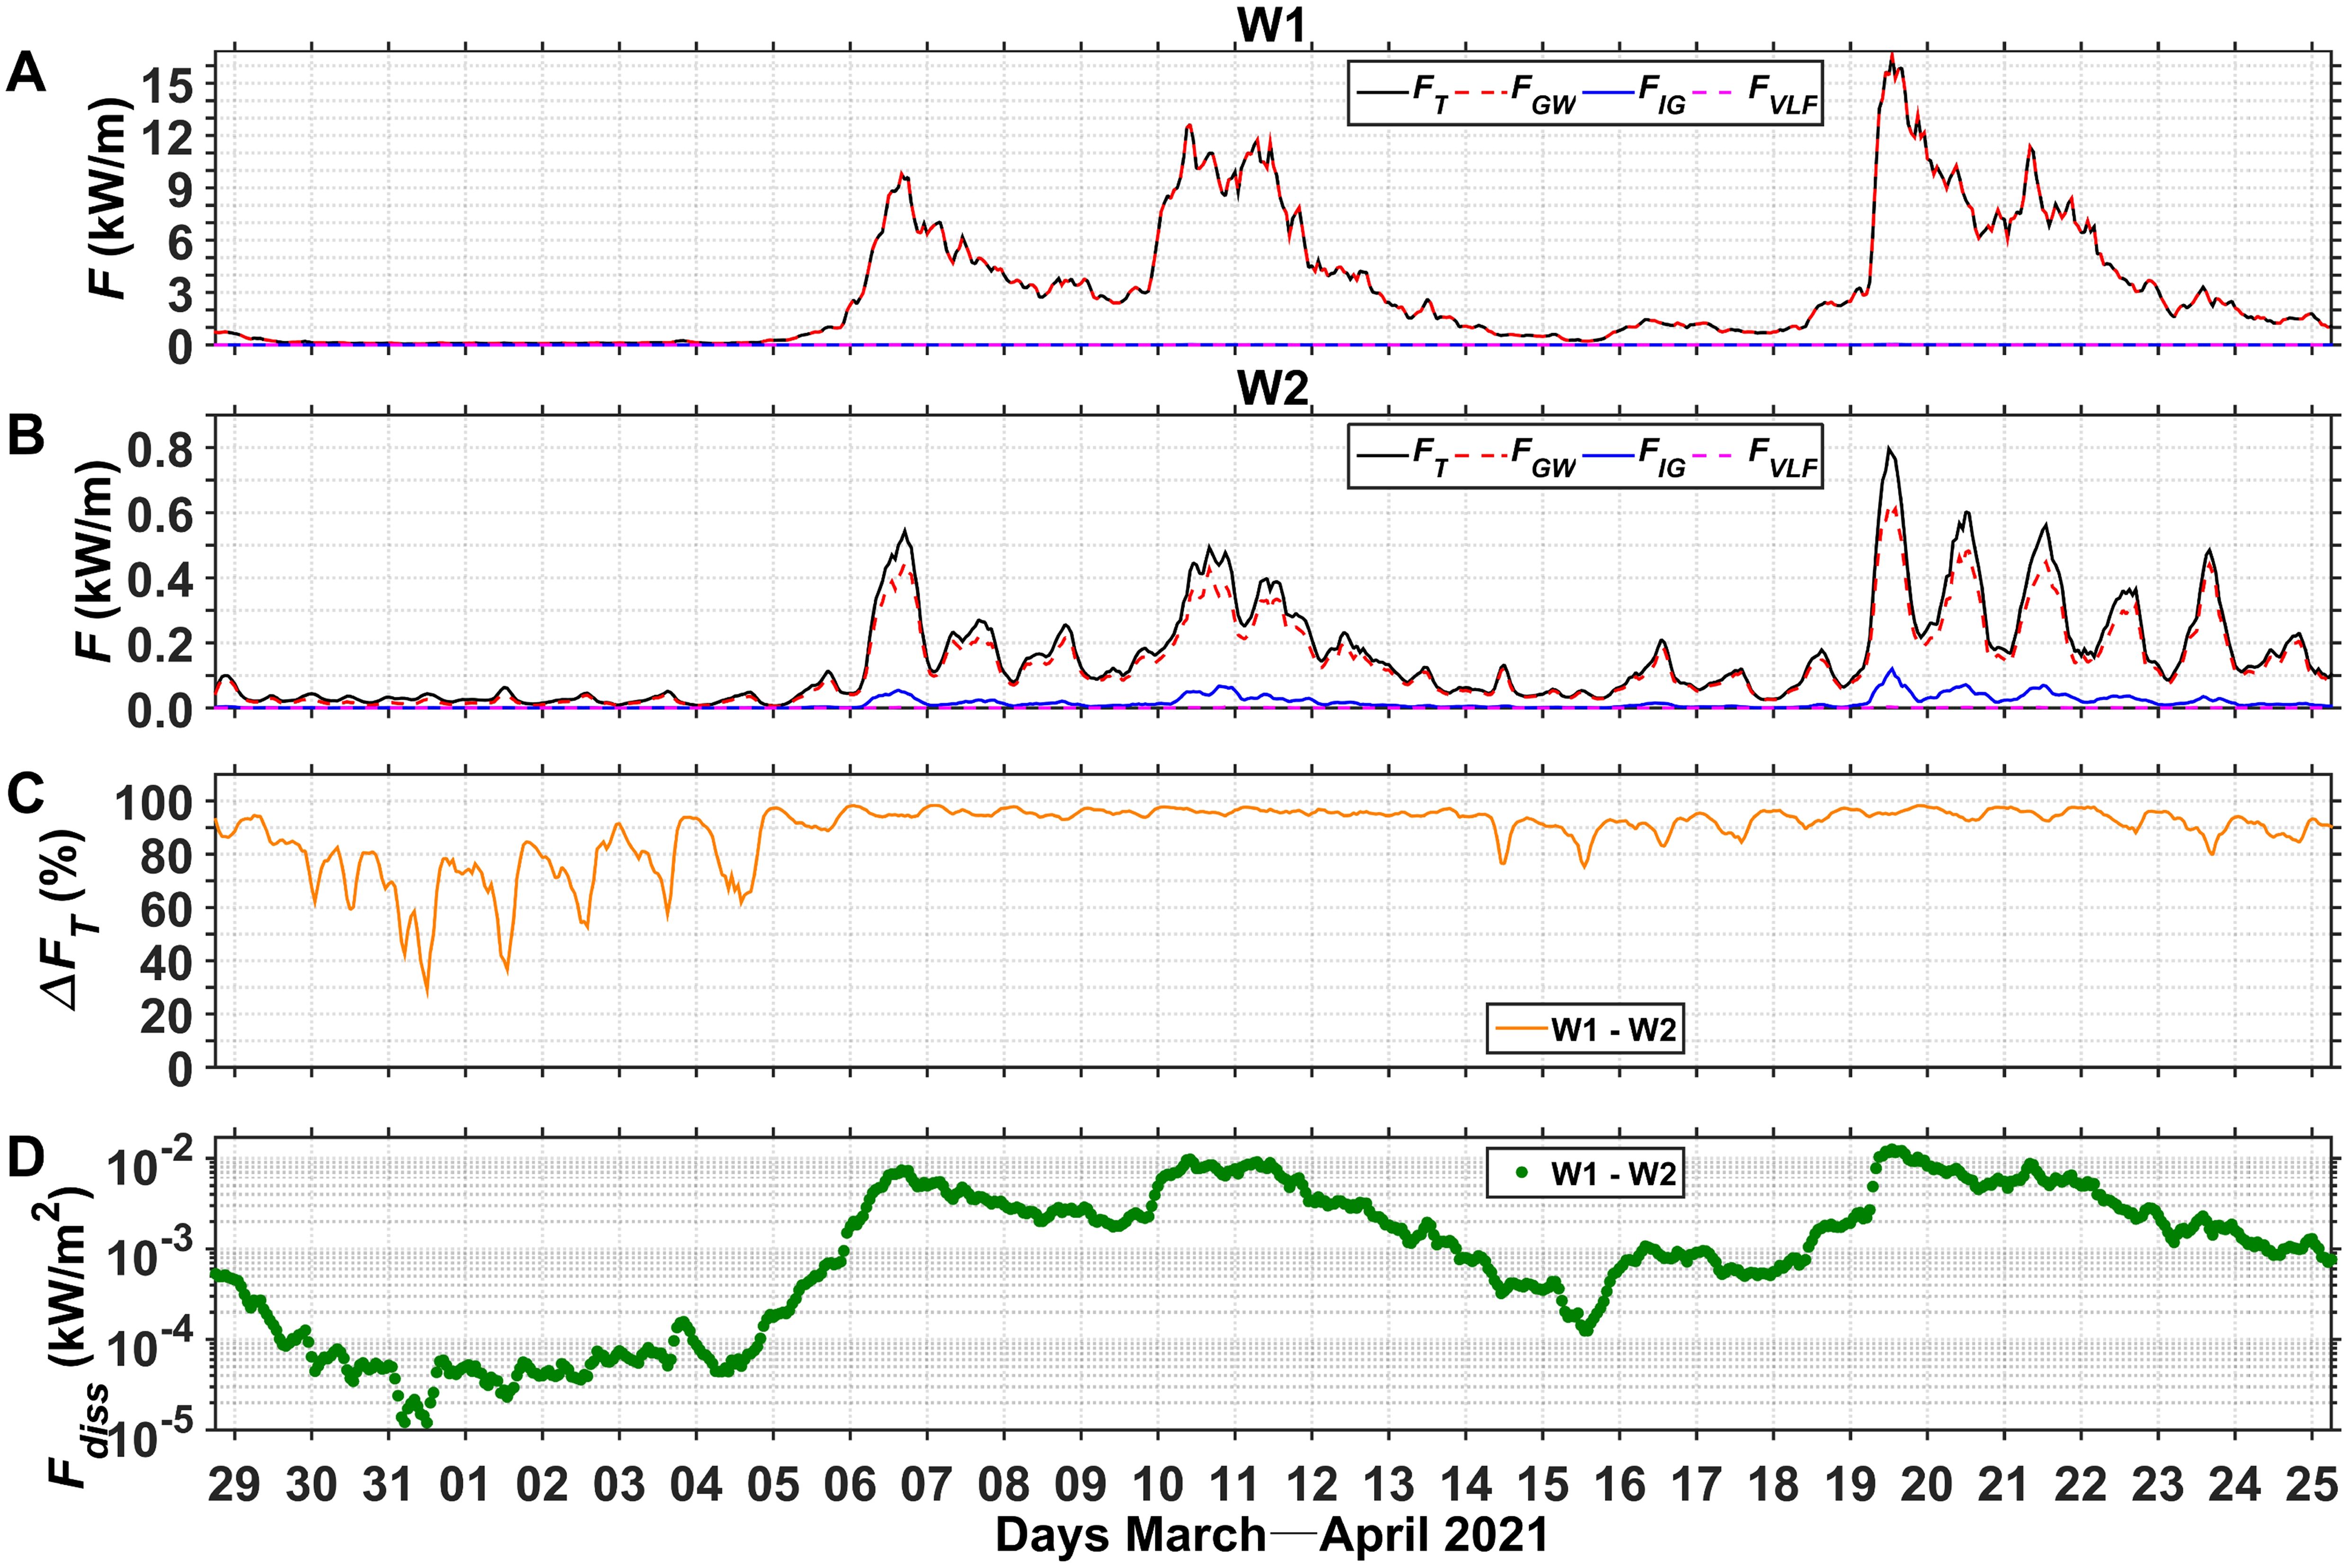
Figure 6. Time series of wave energy fluxes (F) at (A) W1 and (B) W2, (C) percentage () of wave energy flux dissipation between W1 and W2, and (D) energy flux dissipation rate () between W1 and W2. In (A) and (B), , , , and denote the total, GW, IG, and VLF wave energy fluxes, respectively.
3.3 Currents
Figure 2 shows the depth–time variations of on the fore-reef at W1. During the observation period, ranged from 1 to 37 cm s-1. The flow velocity in the upper-layer at a depth of < 8 m was significantly higher than that in the near-bottom layer. Within a tidal cycle, the flow velocity in the upper-layer increased significantly during high- and low-tidal phases. This phenomenon was more pronounced during spring tides.
To obtain a more detailed understanding of the flow conditions at W1, we presented the time series Um, , and in the near-surface (3.4 m depth), middle (9.4 m depth), and near-bottom (15.4 m depth) layers (Figure 7). The flow velocity decreased with increasing depth, with near-surface, middle, and near-bottom layer Um ranges of 4–30, 4–16, and 3–10 cm s-1, respectively (Figures 7A, C, E). In addition, was greater than (Figures 7B, D, F), indicating that flow conditions on the fore-reef were mainly controlled by along-reef flow (i.e., was the main contributor to Um). During the flood tide phase, flow was mainly directed northwestward along the reef, whereas flow was directed southeastward along the reef during the ebb tide phase. In the near-bottom layer, the flow velocity was relatively low, and along-reef flow during most of the flood–ebb tide phases was not significant.
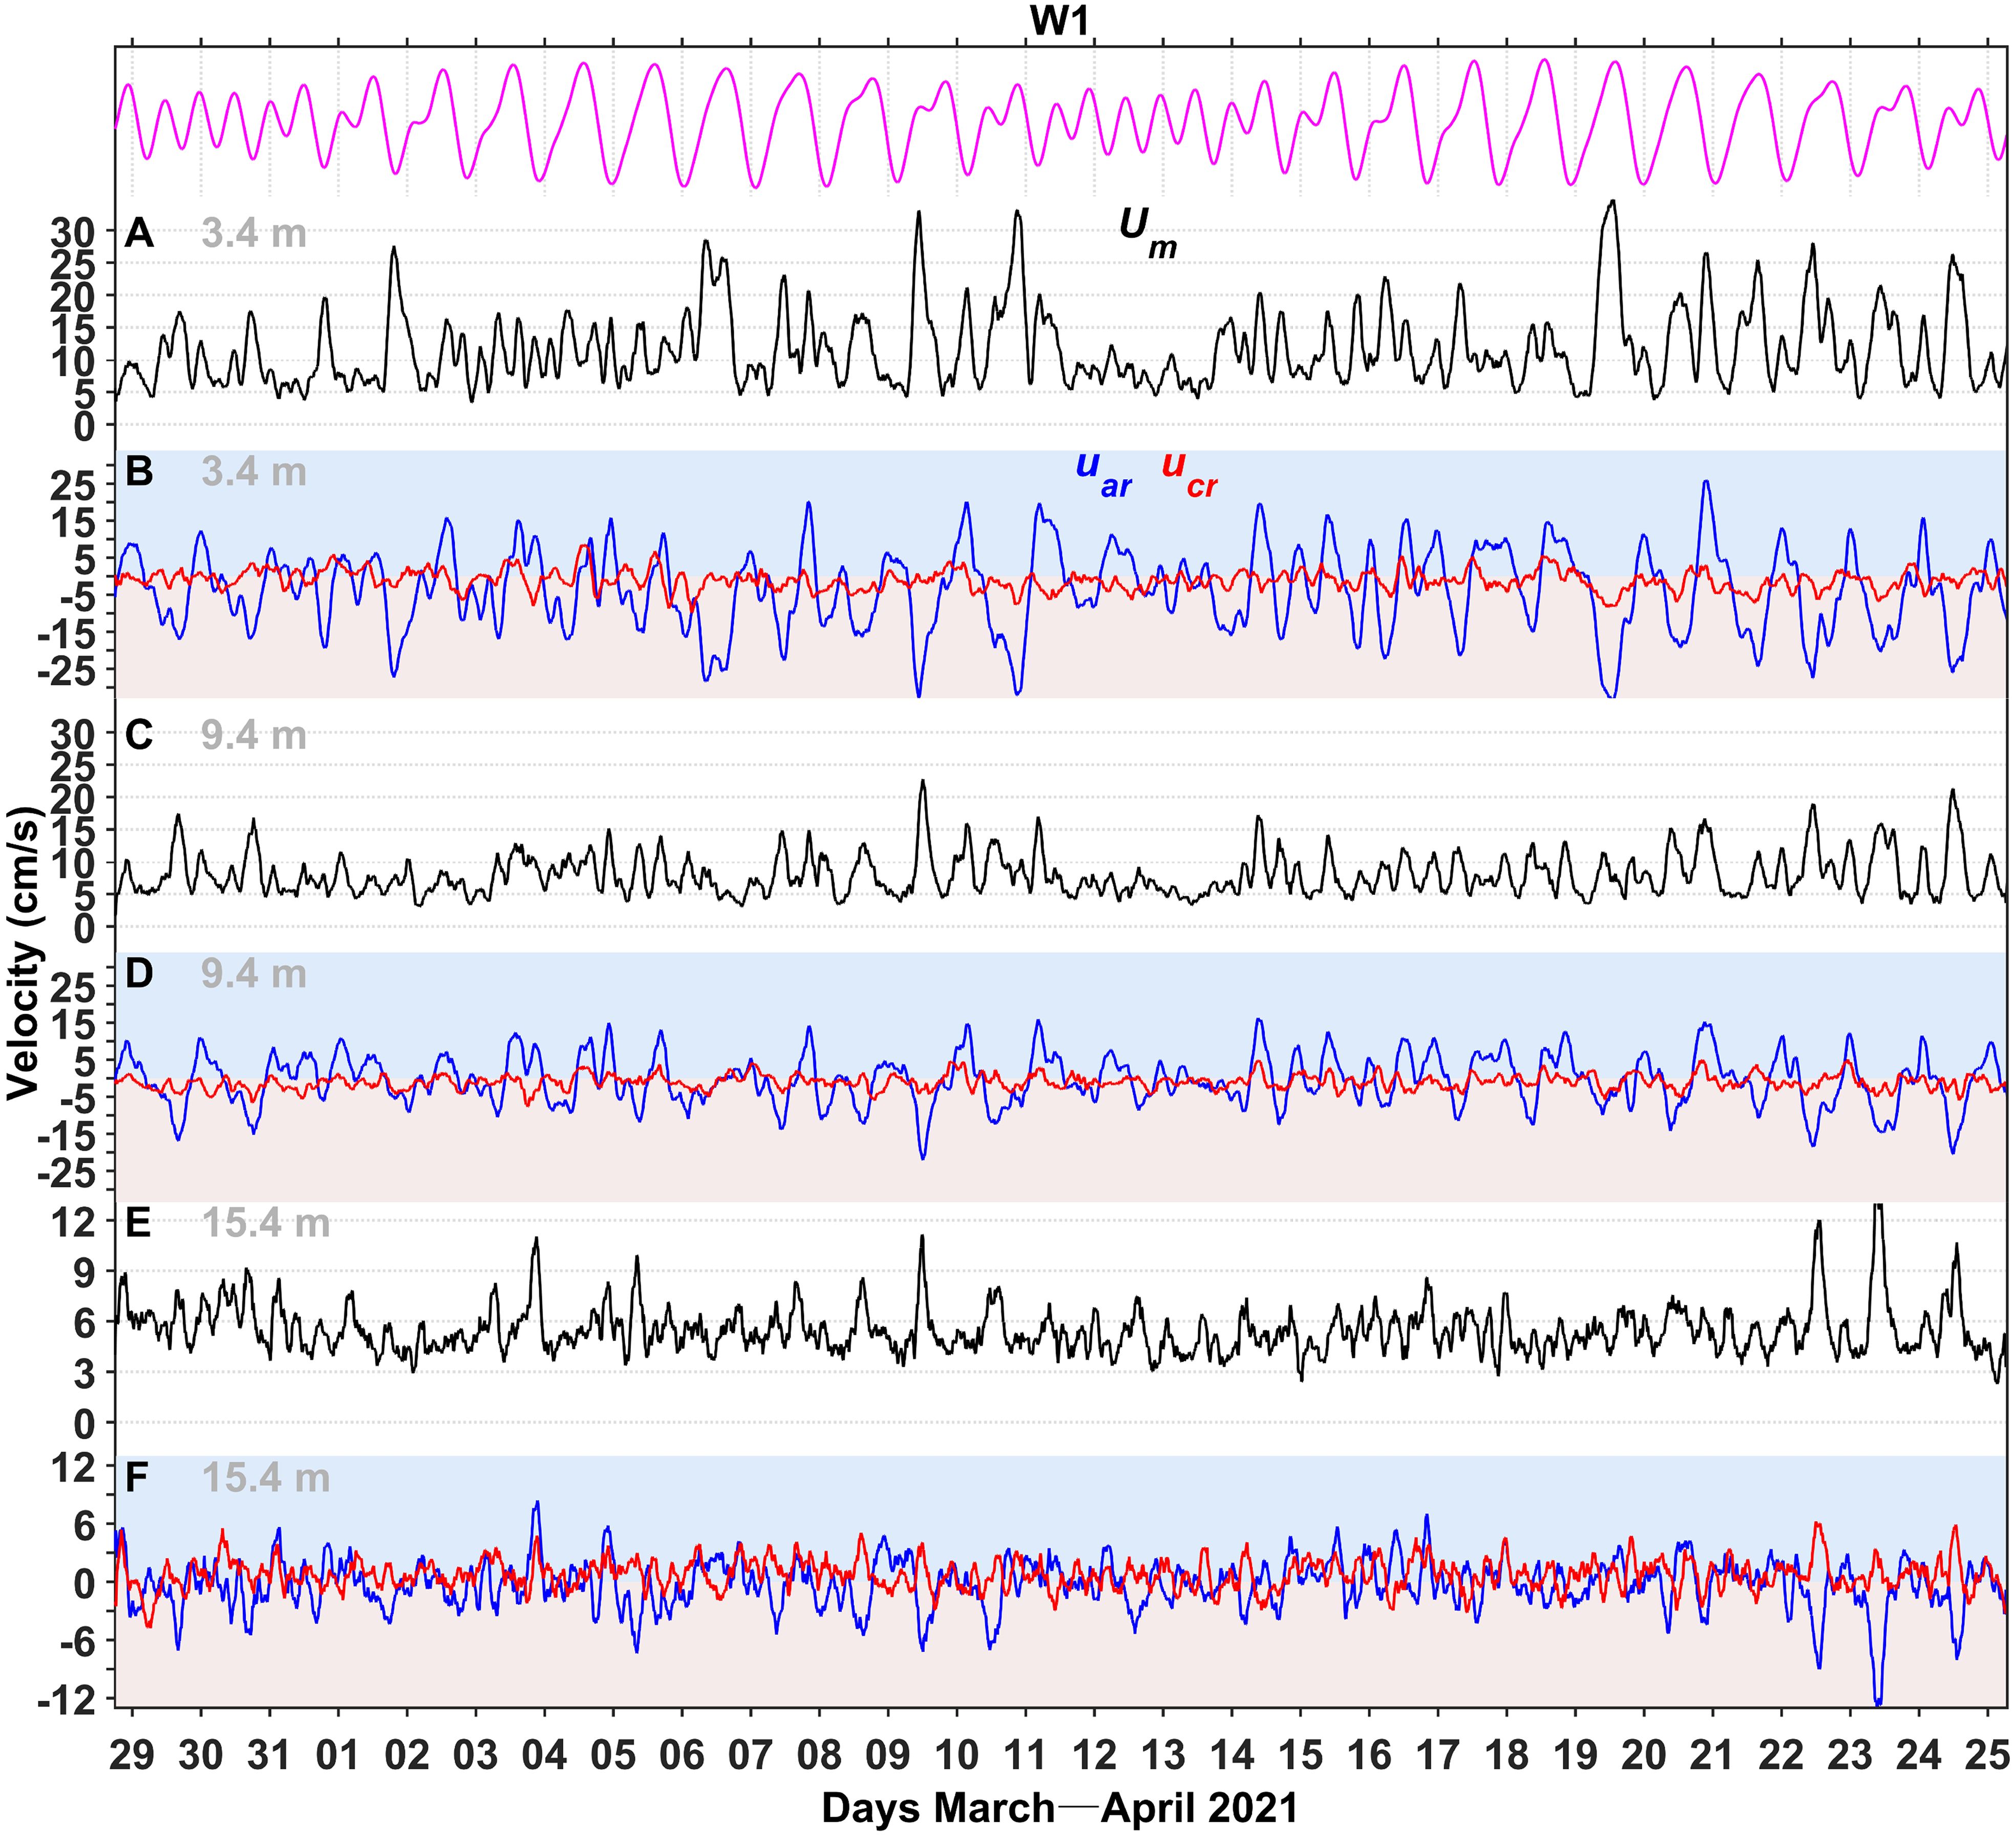
Figure 7. Time series of (black line), along-reef velocity (, blue line), and cross-reef velocity (, red line) at W1 in the (A, B) near-surface, (C, D) middle, and (E, F) near-bottom layers. The magenta line in the upper panel denotes the variations of tidal water level.
The variations in flow velocity at W1 exhibited periodic characteristics. Thus, we conducted a spectral analysis of the and time series in the near-surface, middle, and near-bottom layers (Figures 8A–C). The energy of was larger than that of , and their peak energy periods were identical. In the near-surface layer, the diurnal tidal constituent was the most significant, followed by the semidiurnal and shallow-water constituents. In the near-bottom layer, no significant energy peaks were observed, and the three tidal component energies were notably lower, indicating less pronounced periodic flow velocity characteristics. In addition, relatively weaker energy peaks corresponding to periods of ~30–31, ~16–17, and ~8–9 h were observed in the near-surface layer.
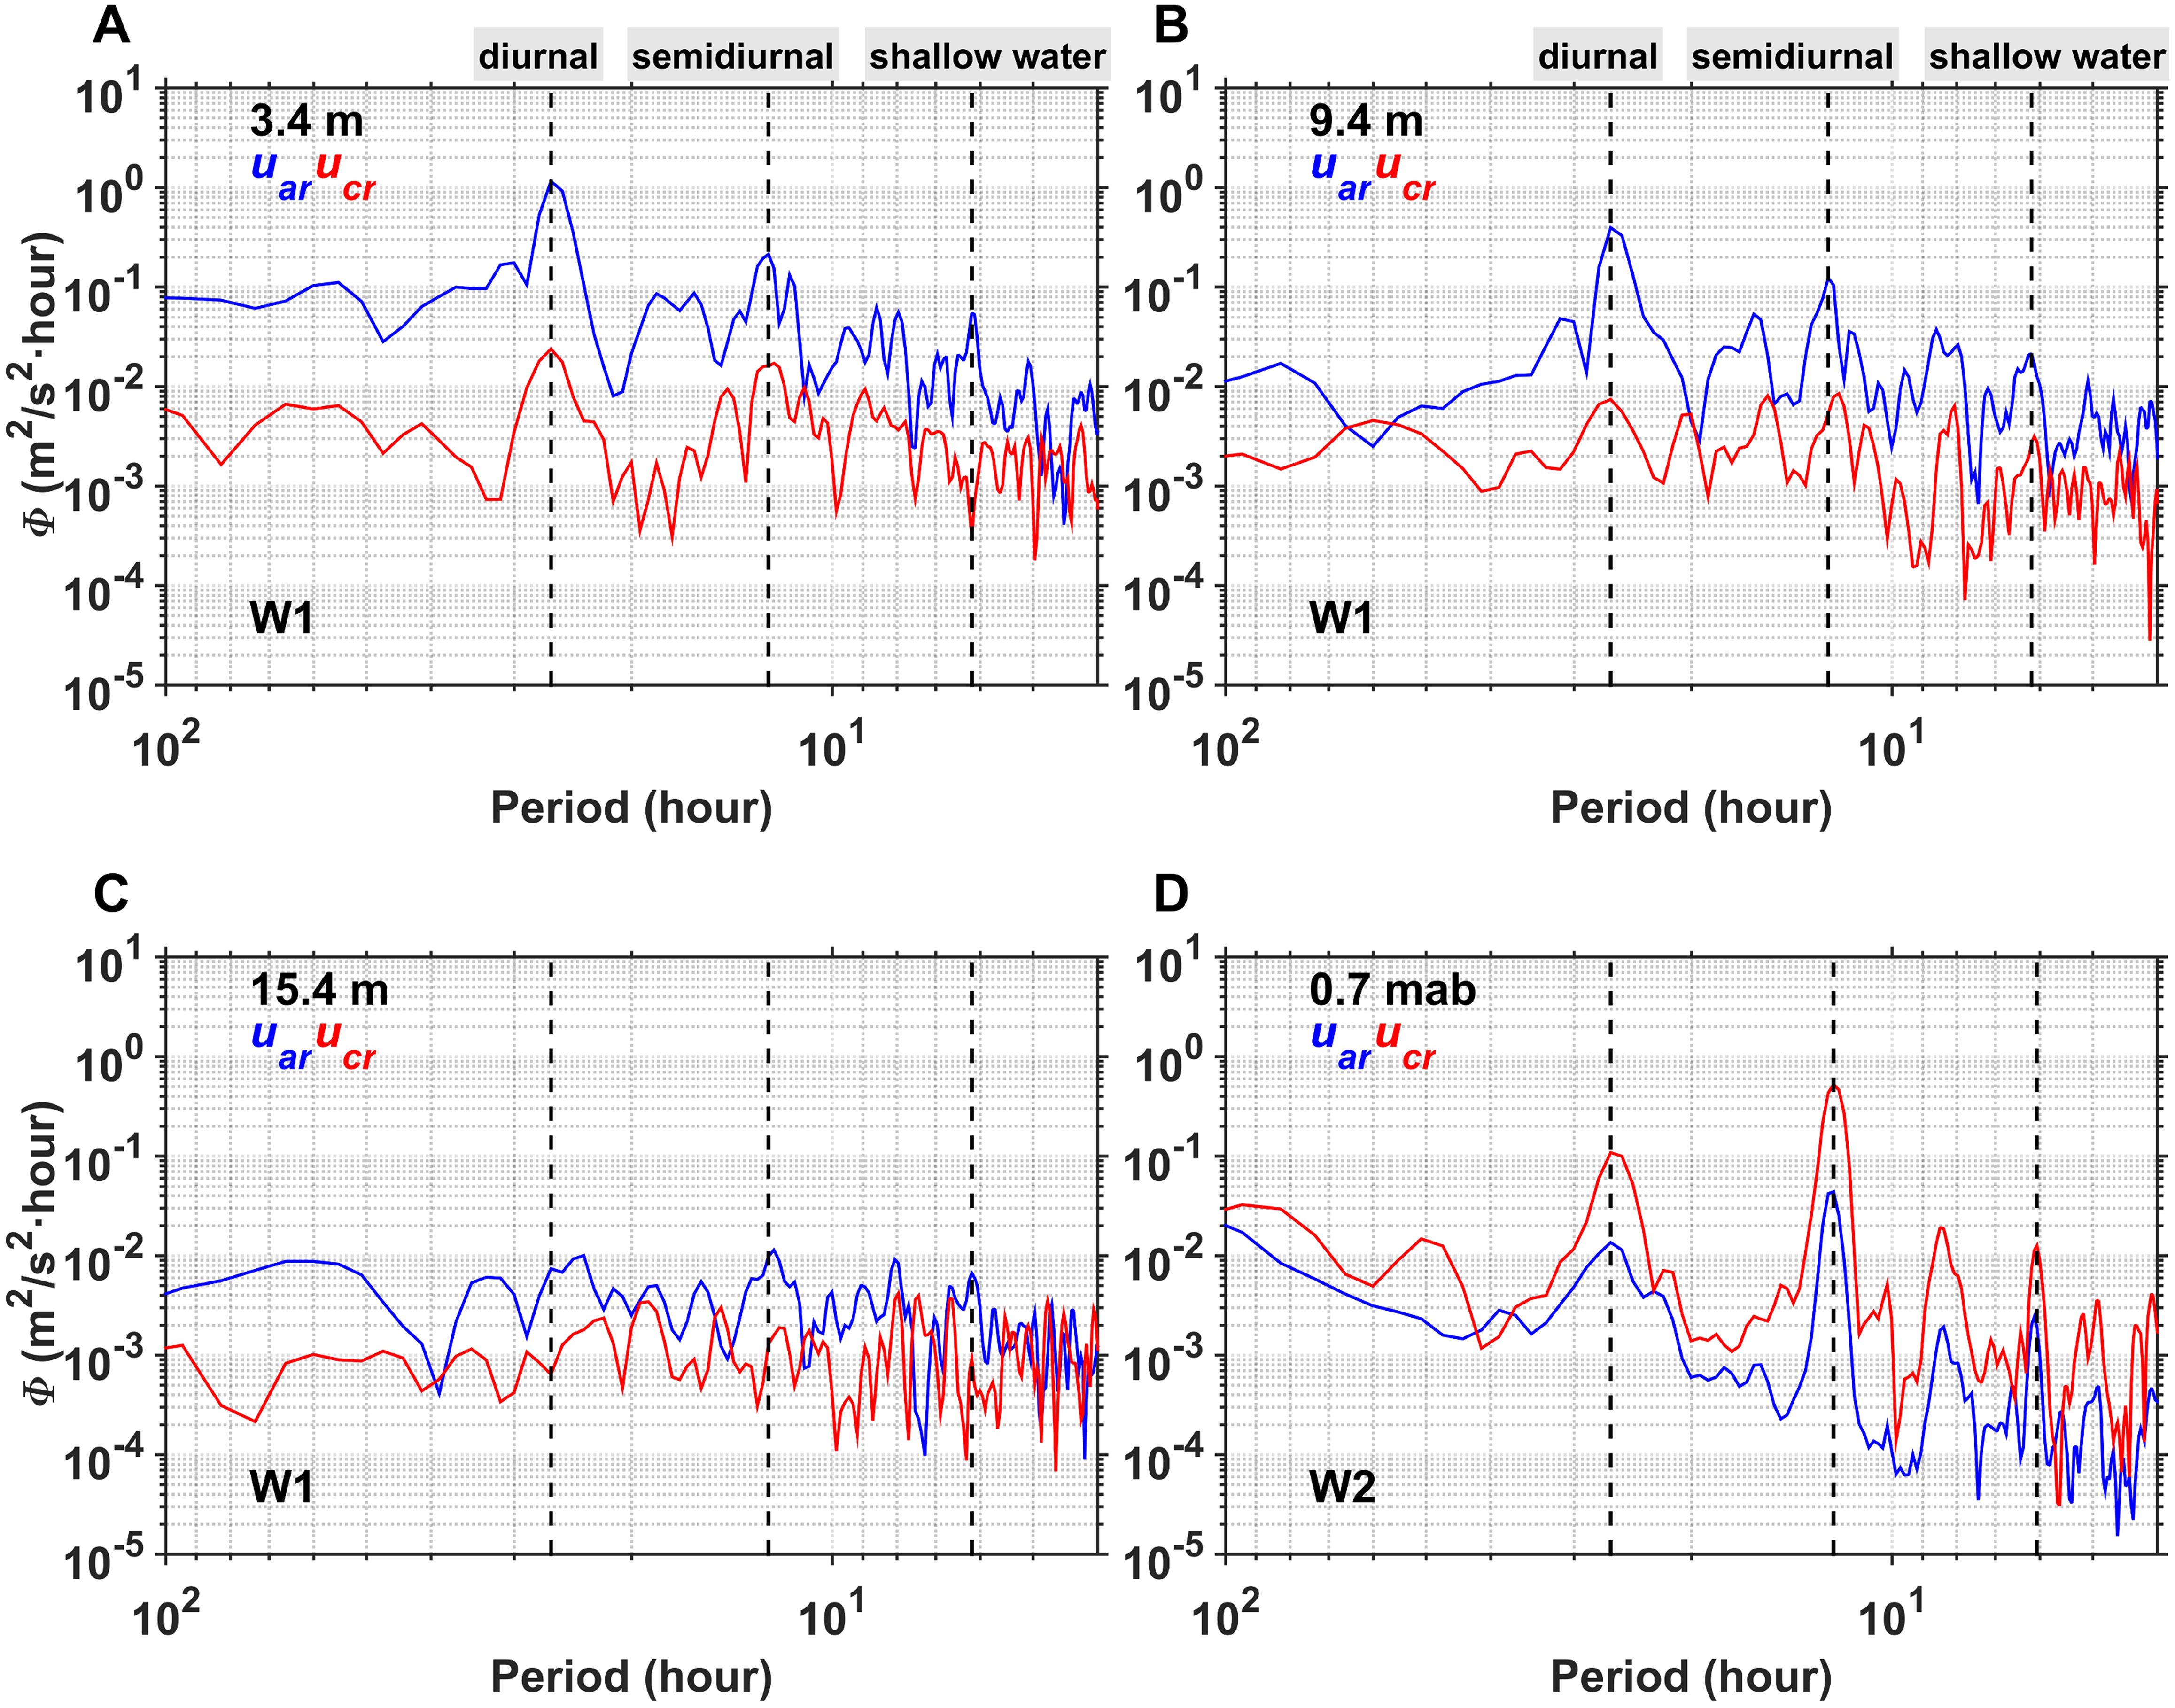
Figure 8. Energy spectra of (blue line) and (red line) at W1 in the (A) near-surface, (B) middle, (C) near-bottom layers, and (D) at W2, 0.70 m above the bottom (mab). Vertical black dashed lines denote the diurnal, semidiurnal, and shallow-water tidal component periods.
Figure 9 shows the time series of Um, , and on the reef flat at W2. During the observation period, Um varied from 1 to 24 cm s-1. From March 29 to April 2, the flow velocity exhibited significant periodic tidal characteristics. From April 7 to 11 and from April 19 to 23, the tidal variations in the flow velocity weakened. In addition, was less than , indicating that flow variations on the reef flat were mainly controlled by cross-reef currents. At the beginning of the observation period, the cross-reef flow was northeasterly during neap tides, whereas partial southwesterly cross-reef flow occurred during spring tides.
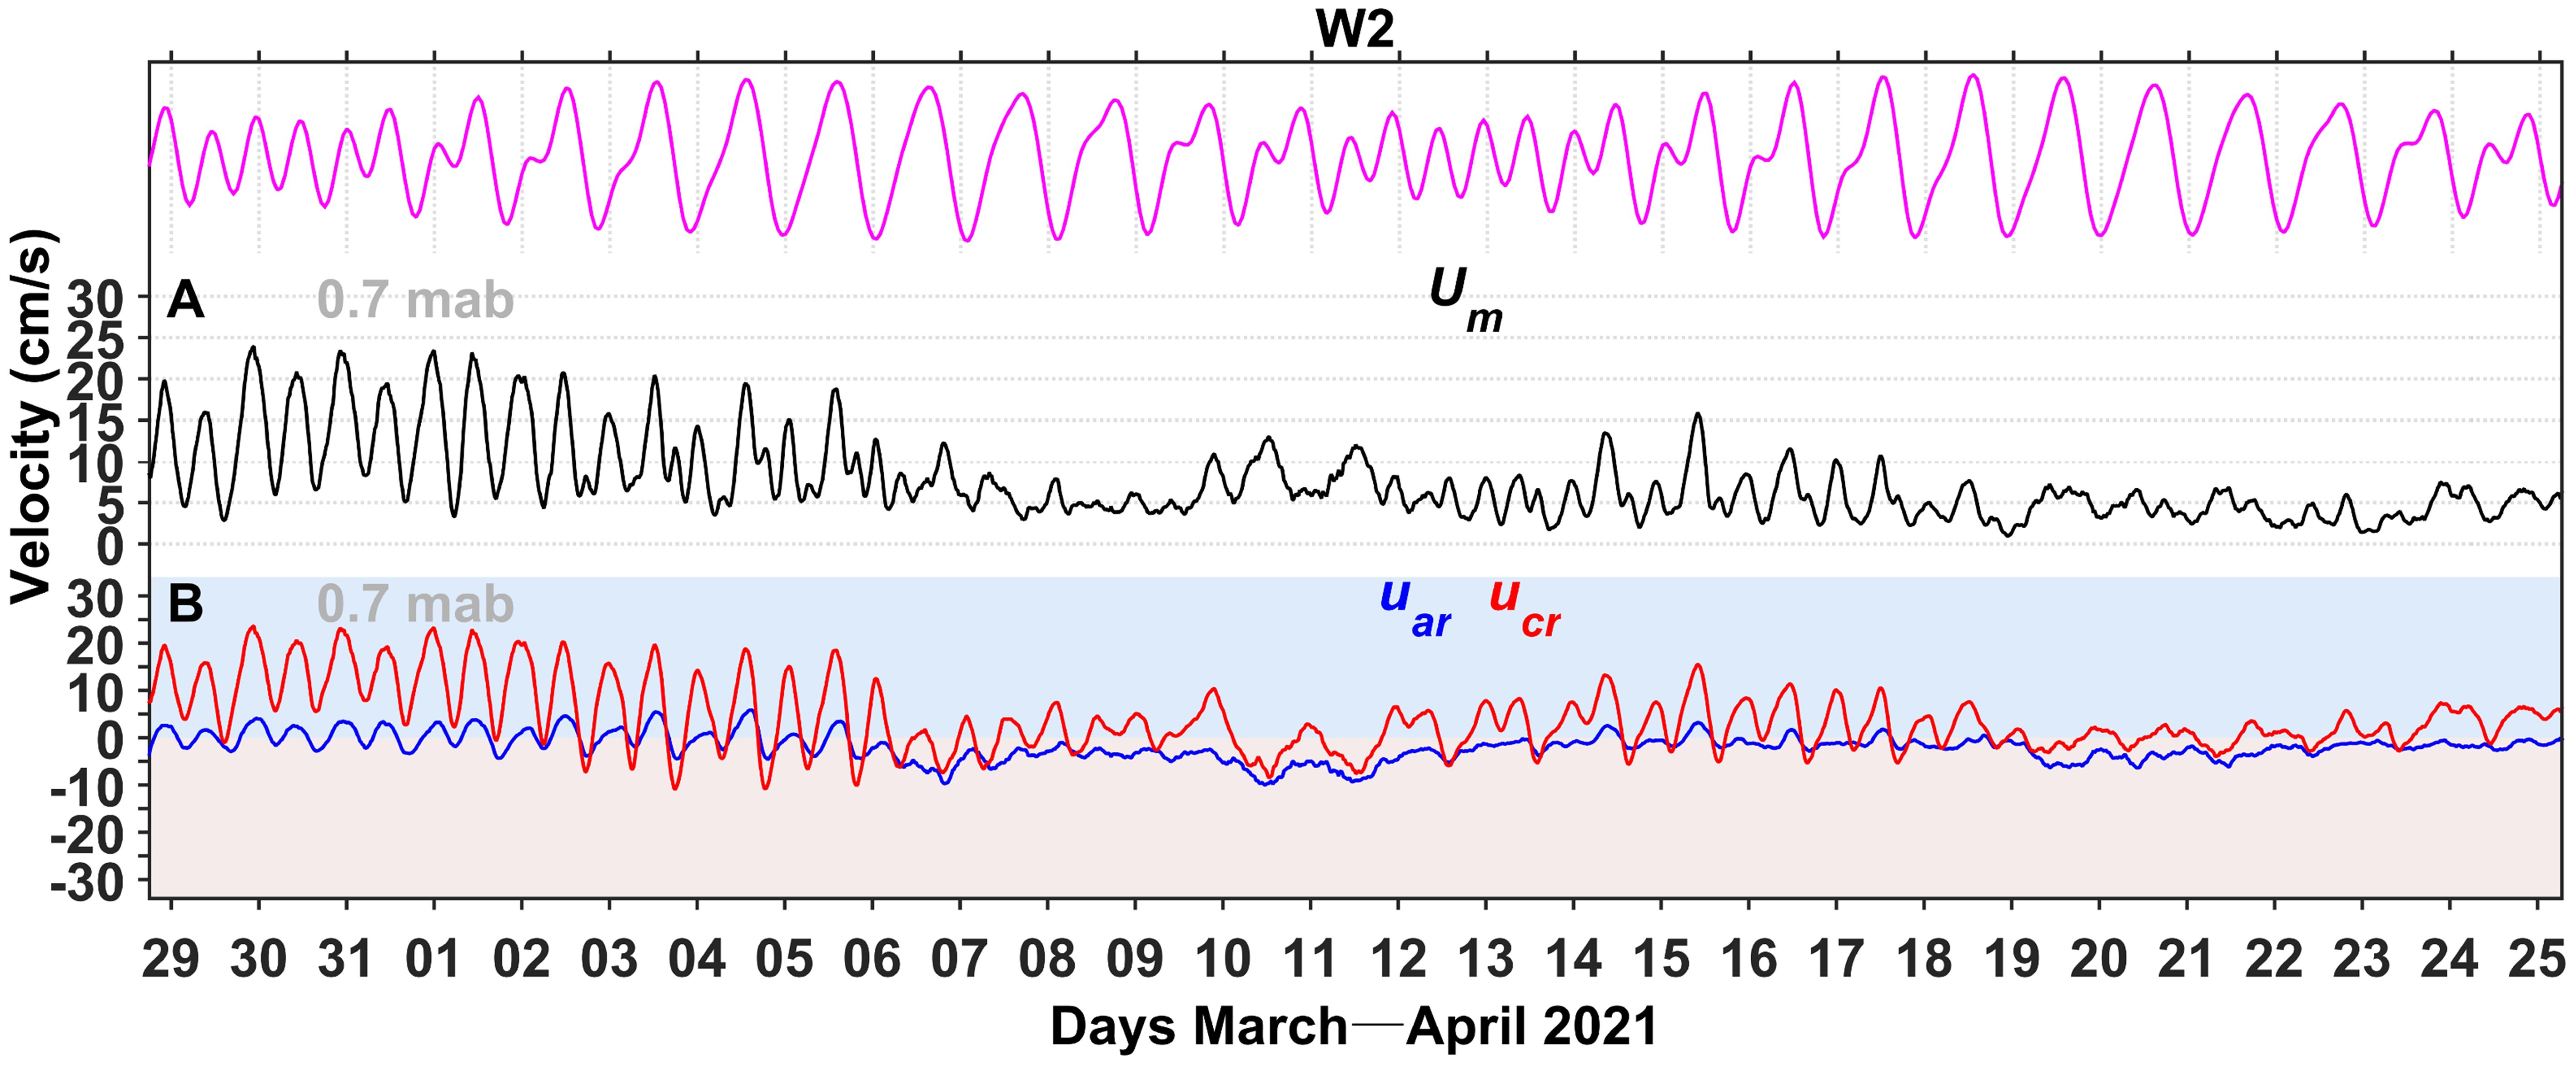
Figure 9. Time series of (A) , (B) (blue line) and (red line) at W2 at 0.70 mab. The magenta line in the top panel denotes the variations of tidal water level.
The variations in flow velocity at W2 also exhibited periodic signals. Spectral analysis (Figure 8D) indicates that the energy level of was lower than that of ; however, the periods in which their energy peaks occurred were the same. The semidiurnal tidal constituent was the most significant, followed by the diurnal and shallow-water constituents. Other weaker energy signals were also observed, including those with periods of 8–9 and 5 h.
In summary, the currents in the fore-reef area were stronger in the upper-layer and weaker in the near-bottom layer, with higher velocities during high and low tides. The currents on the reef flat exhibited various conditions, including stages with high flow velocities and significant tidal signals, and those with low flow velocities and weak tidal signals. The current variations on the fore-reef and reef flat were primarily influenced by diurnal and semidiurnal constituent currents.
4 Discussion
4.1 Wave transformation from the fore-reef to the reef flat
The observations indicate that large waves () propagated from the fore-reef to the reef flat, during which the wave height decreased by ~0.98 m (Figures 5A, B), wave energy dissipation exceeded 90%, and the maximum dissipation rate reached ~10-2 kW m-2 (Figures 6C, D). In the fore area of the reef, such strong wave energy dissipation is usually caused by bottom friction or a combination of bottom friction and wave breaking processes (Lugo-Fernandez et al., 1998; Lowe et al., 2005c; Rogers et al., 2016). In the shallow fore-reef zone (before waves break), bottom friction induced by the remarkably rough coral terrain can lead to strong wave energy dissipation (Monismith et al., 2015). As waves propagate to shallower depths on the reef (e.g., the reef crest), waves often break; thus, this zone becomes the main source of wave energy dissipation (Vetter et al., 2010; Ferrario et al., 2014). Station W2 was located in the shallow part of the reef flat behind the reef crest (Figures 1B, C); thus, the strong wave energy dissipation from the fore-reef to the reef flat should be the result of a combination of bottom friction and wave breaking. Acevedo-Ramirez et al. (2021) found that during large wave conditions, wave energy dissipation on the fore-reef was approximately 35% when influenced only by bottom friction process; however, wave energy dissipation varied between 65% and 99% in the area from the reef crest to the back reef, which involved both bottom friction and wave breaking processes. These findings support the control mechanism for strong wave energy dissipation from the fore-reef to the reef flat observed in this study. In addition, during large wave conditions, the near-bottom wave orbital velocity is significantly larger than the near-bottom mean flow velocity (Figures 2, 5E, 7E, 9A), indicating that the mean flow plays a minor role in the frictional dissipation of wave energy.
We further present the scatter plot (Figure 10) of Hs at W1 versus included bottom friction and wave breaking. The variables basically follow a quadratic relationship (fitting equation of ; coefficient of determination = 0.98). This relationship is reasonable because the relationship between wave height and energy is also quadratic (Vetter et al., 2010; Acevedo-Ramirez et al., 2021; Smith et al., 2023). Numerical modeling studies have suggested that the relative contributions of wave breaking and bottom friction processes depend on the incident wave conditions; wave breaking is the main dissipative process for large waves, whereas bottom friction is that for small waves (Lowe et al., 2005c). In this study, is relatively low for small waves (Hs < 1 m) and the relationship between Hs and is quadratic (Figure 10), indicating that bottom friction energy dissipation is dominant in this case. As Hs increased (> 1.2 m), some Hs and values deviated slightly from the quadratic relationship. Waves often break when the wave steepness (Hs/wavelength) is large and interaction with bottom friction begins, thereby making energy dissipation more complex. In particular, such deviations are more likely to occur for very large waves.
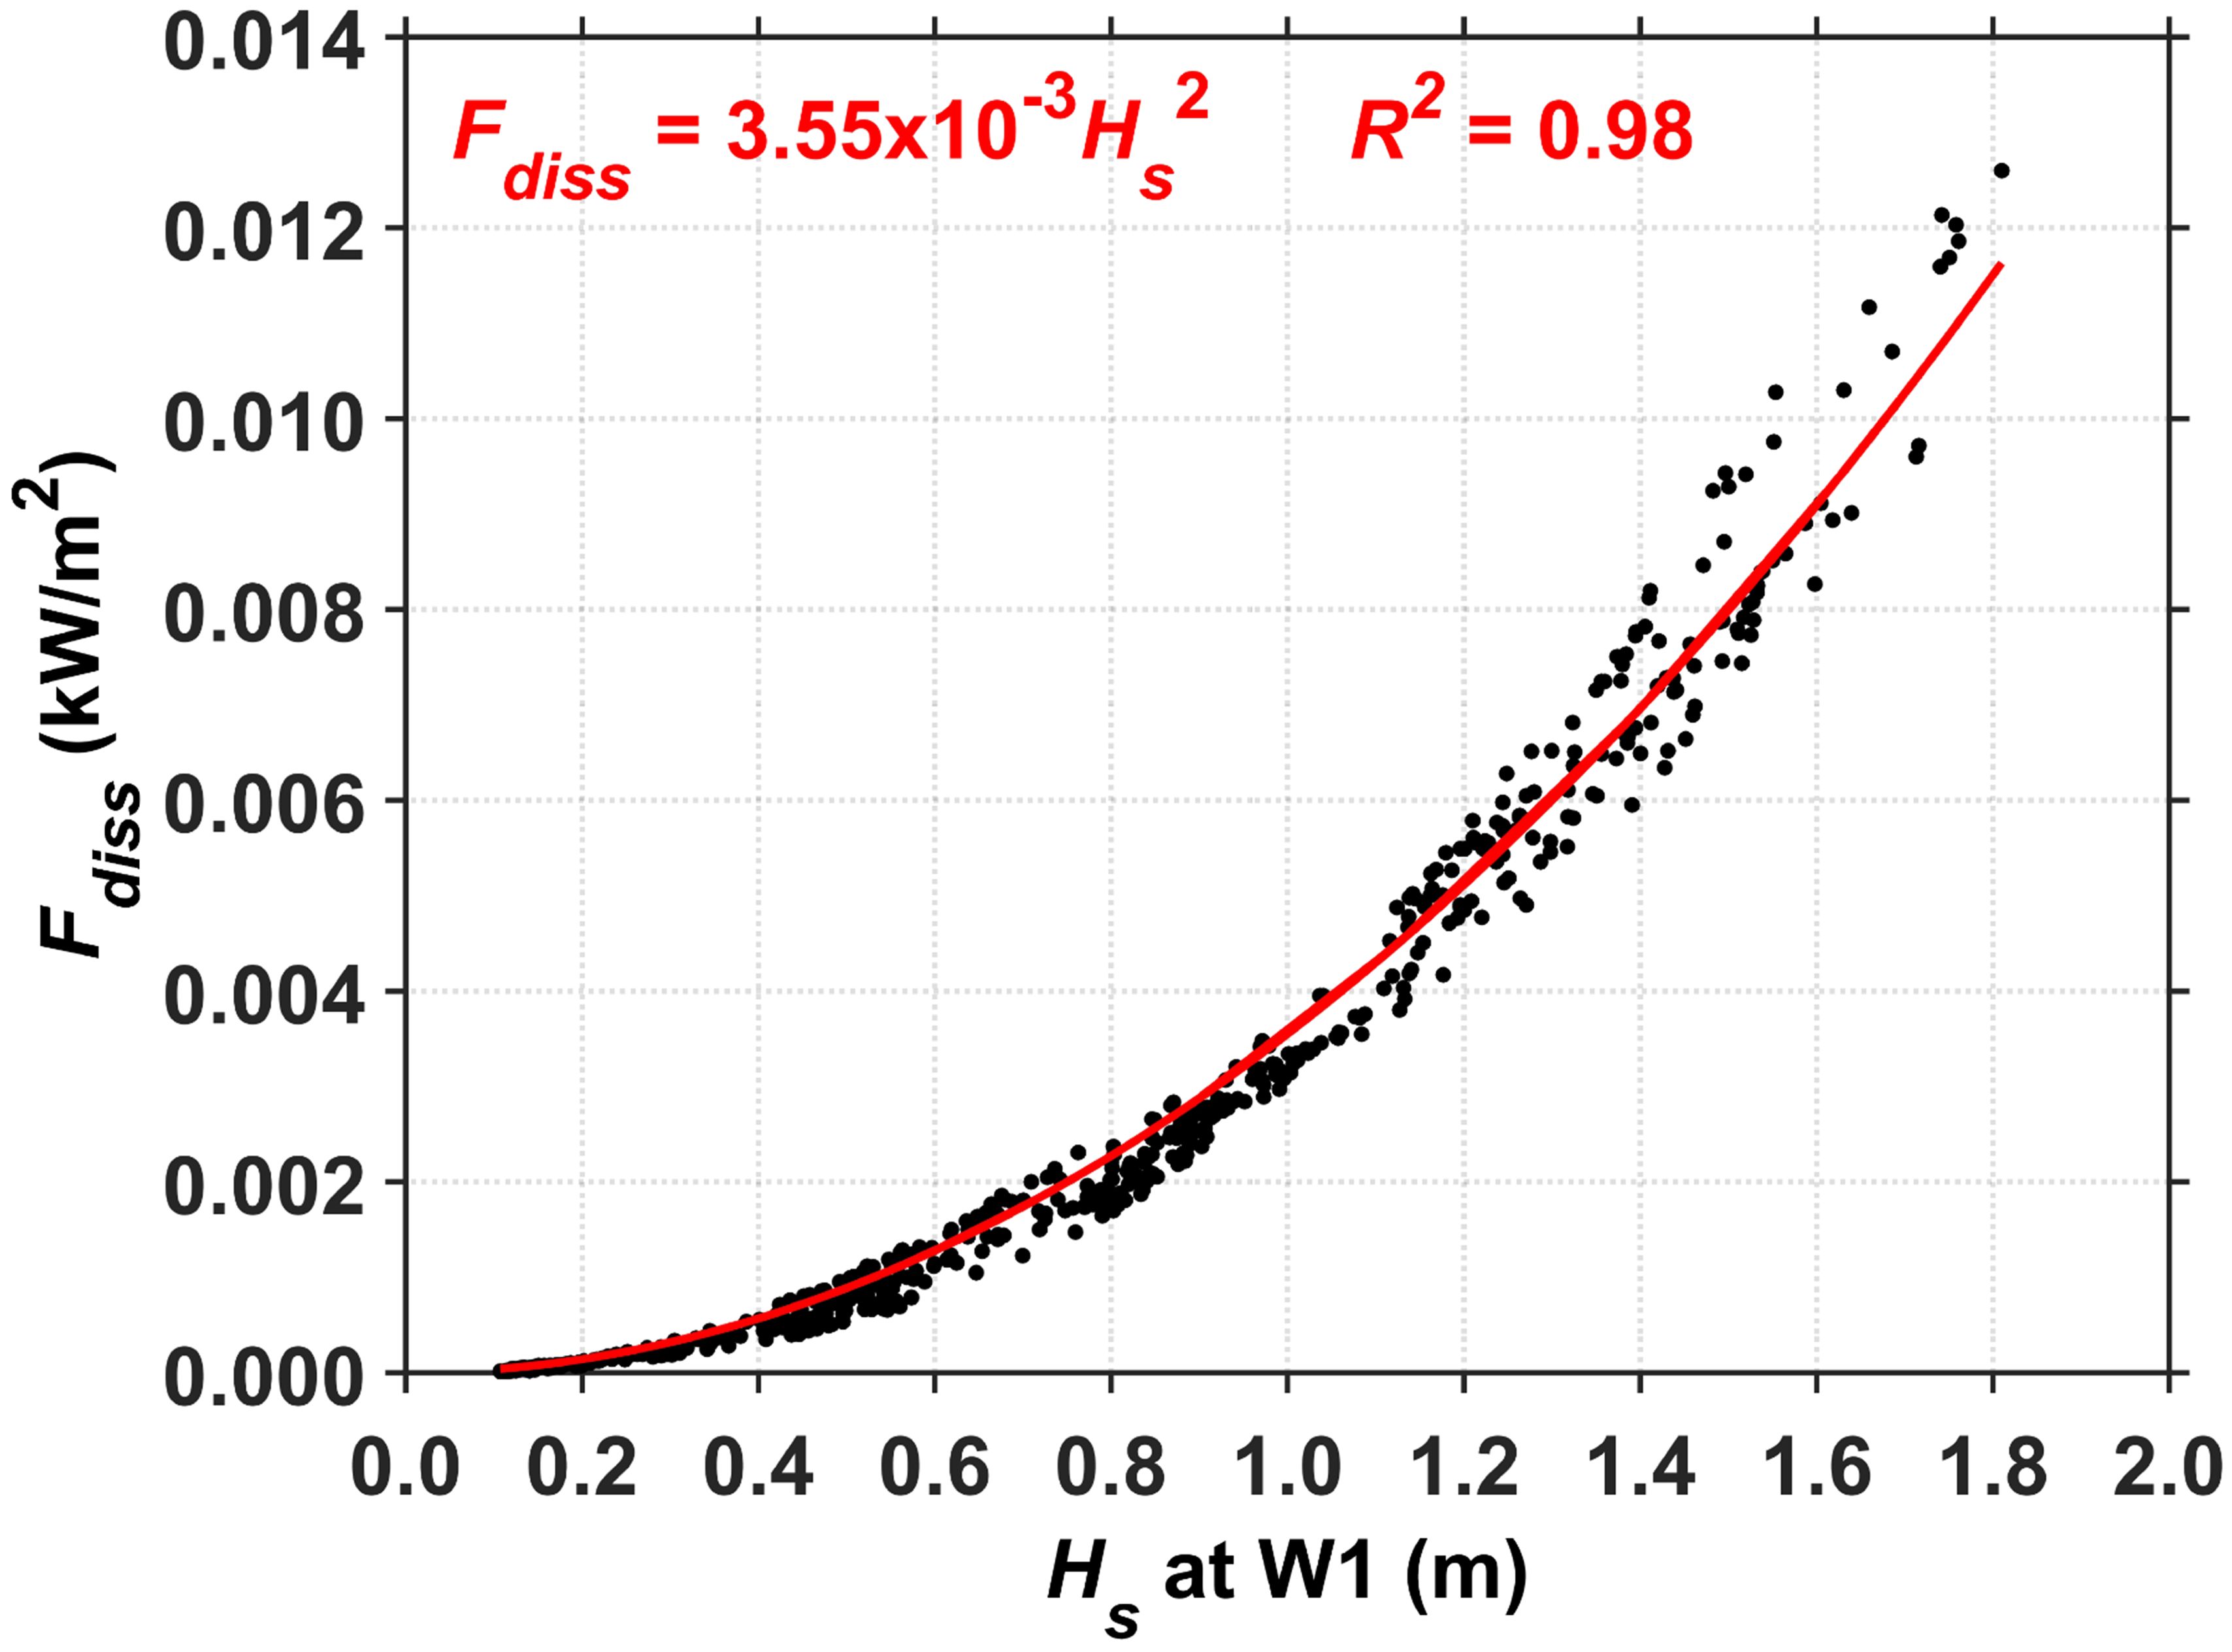
Figure 10. Scatter plot of Hs at W1 versus . The least square fitted regression is denoted by the red solid curve.
The observations captured GWs, IG waves, and VLF waves on the reef flat, which have also been reported in previous studies (e.g., Bonneton et al., 2007; Pearson et al., 2017; Shimozono et al., 2022). Owing to the combined effects of wave breaking and frictional dissipation, most of the incident GW energy entering the reef is dissipated; however, GW energy is still present on the reef flat, and the IG wave energy is enhanced significantly (Figure 4). During the three large wave events, the GW and IG wave energy levels on the reef flat are particularly high (Figure 4B), indicating that the incident GWs are a driving mechanism. Energy dissipation mainly occurs in the GW frequency band, confirming that the coral reef system acted as a low-pass filter (Bruch et al., 2022). Behind these processes, a portion of the incident GW energy is also transferred to the IG frequency band as bound waves (Longuet-Higgins and Stewart, 1964; Shimozono et al., 2022). Under high incident energy conditions, waves on the reef flat exhibited characteristics of both high- and low-frequency waves.
On the reef flat, the GW and IG wave heights (Figure 5B) exhibited clear periodic tidal characteristics. Figure 11 shows the scatter plot of and versus tidal water levels at W2, with colors representing the incident at W1. Both GWs and IG waves on the reef flat are influenced by the incident waves and tidal conditions. When is less than 1 m at W1, is relatively small and slightly higher during high tides at W2, whereas remains small and is not dependent on the tidal water level. However, when is greater than 1 m at W1, increases significantly and is significantly larger during high tides at W2, whereas increases slightly and exhibits slightly higher values during high tides. These findings indicate that tidal modulation of GWs and IG waves on the reef flat is more substantial when the incident wave height exceeded 1 m. IG waves are generated under large wave conditions and propagate on the reef flat. Previous studies have indicated that IG waves on the reef flat are mainly modulated by tides under incident wave heights of less than 2.5 m, whereas IG waves are controlled by incident GWs when the incident wave height exceeded 2.5 m (Bruch et al., 2022). In this study, we found that tidal modulation of the IG waves on the reef flat is not significant when the incident wave height is less than 1 m. Therefore, the dependency of reef flat IG waves on tidal water level is significantly reduced for very large and very small waves. Under normal wave conditions, wave processes on the reef flat exhibit tidal modulation in which the wave height is strictly constrained by the water depth on the reef flat. Higher water levels reduce the energy dissipated by wave breaking and bottom friction, resulting in larger wave heights (Bruch et al., 2022; Shimozono et al., 2022).
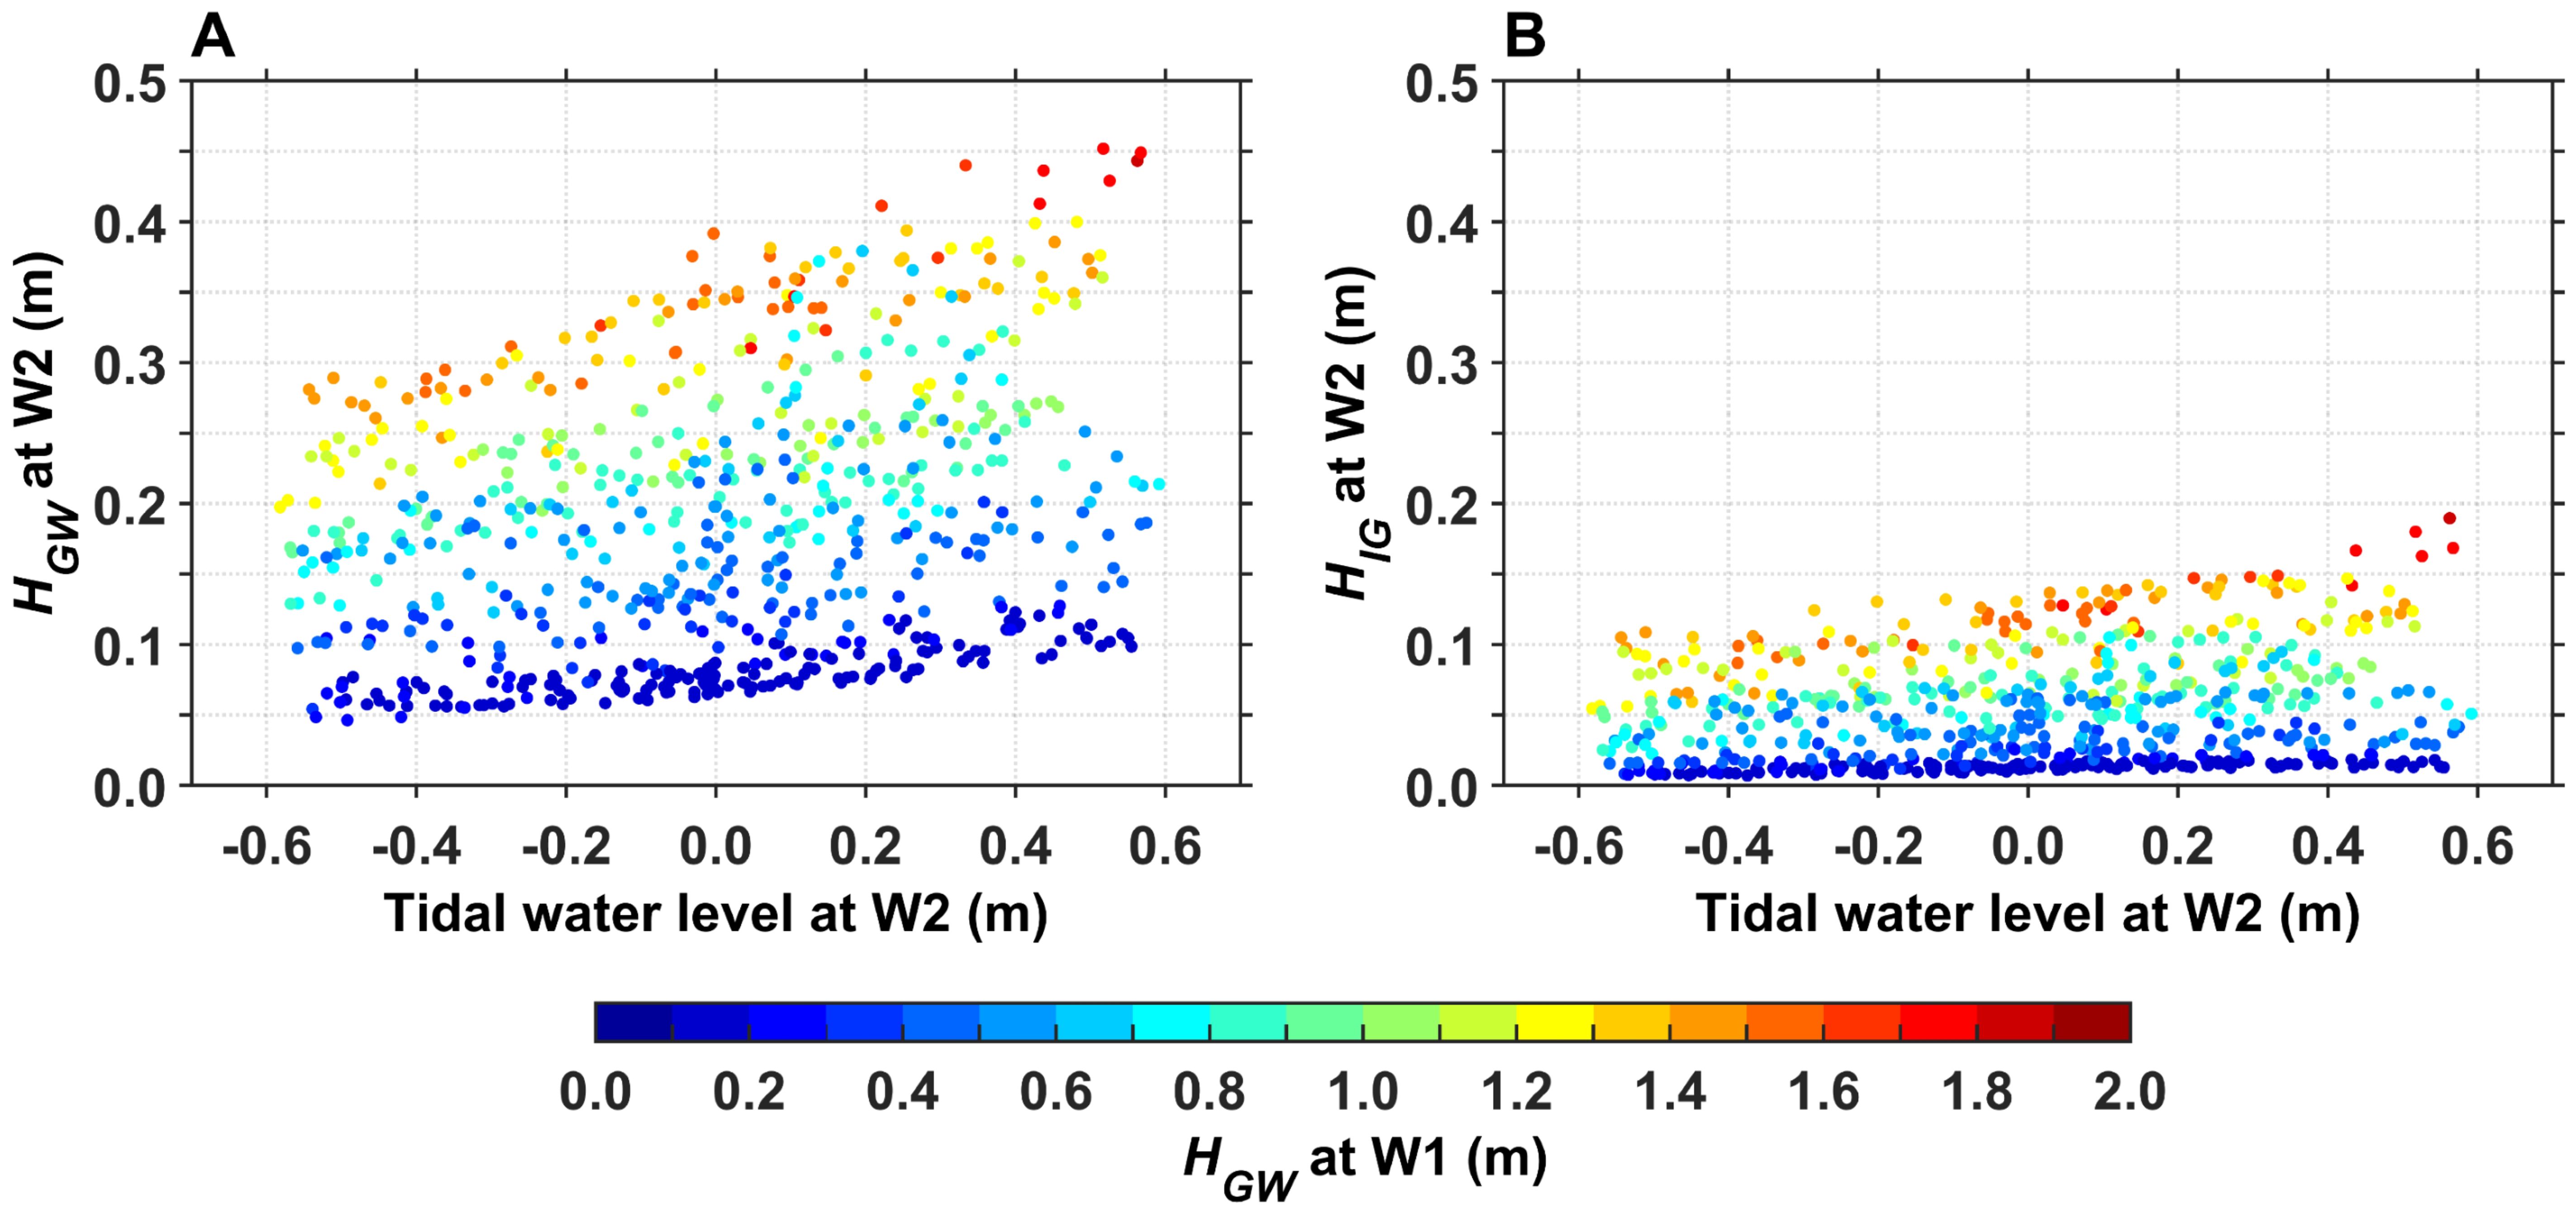
Figure 11. Scatter plot of (A) and (B) versus tidal water level at W2. Colors represent the incident at W1.
Low-frequency waves on the reef flat are generated by interactions between nonlinear waves in the fore-reef area via two potential mechanisms: bound waves and breaking points (Shimozono et al., 2022). For both mechanisms, low-frequency waves are excited by incident wave groups. The relative importance of each mechanism is controlled by the relative seabed slope (which excites low-frequency waves) and relative water depth at the breaking point (Battjes et al., 2004; Baldock, 2012). Owing to the lack of sufficient wave observation stations in the shallow fore-reef area, we do not investigate the mechanism that generated the IG waves in this study.
4.2 Tidal and wave modulation of flow
In the fore-reef area, spectral analysis of the near-surface-layer flow velocity shows that the diurnal and semidiurnal constituent energies have more significant influences on the flow (Figure 8A). The scatter plot of tidal water levels versus Um reveals relatively higher Um values during high and low tide periods (Figure 12A). These findings indicate that relatively strong flow in the upper-layer is modulated by tidal waves with obvious progressive wave characteristics. Most of the seawater areas in the South China Sea usually exhibit property of progressive tidal waves (Yu, 1984). However, the corresponding flow velocities are higher during periods with larger wave heights (Figure 12A), suggesting that wave influences on flow in the upper-layer cannot be ignored. To further investigate this influence, the tidal wave energy is removed from the flow velocity by applying a low-pass filter to the original velocity components with a cutoff period of 30 h, which produced a horizontal flow velocity defined as . Figure 12D shows that is independent of tidal variations. In addition, the wave modulation effect on flow becomes more significant when Hs exceeded 1 m, particularly during high- and low-tides where increases with increasing Hs. Therefore, the relatively strong flow in the upper-layer is primarily caused by the modulation of progressive tidal waves and large waves. In the middle layer, the progressive tidal wave characteristics weakened, and large waves do not enhance the flow, which resulted in weaker flow (Figures 12B, E). In the near-bottom layer, Um reaches its minimum and is independent of wave variations (Figures 12C, F). The weak flow conditions near the bottom are primarily caused by the frictional dissipation of most of the tidal wave energy by the remarkably rough coral terrain. The presence of a rough seabed increases friction and applies resistance to the flow, thereby dissipating most of the energy flowing through the area (Lowe et al., 2005a; Monismith, 2007; Yao and Zhou, 2024). Furthermore, the near-bottom location at W1 is close to the side of the fore-reef topography (Figure 1C), where local topographic effects may have weakened the flow.
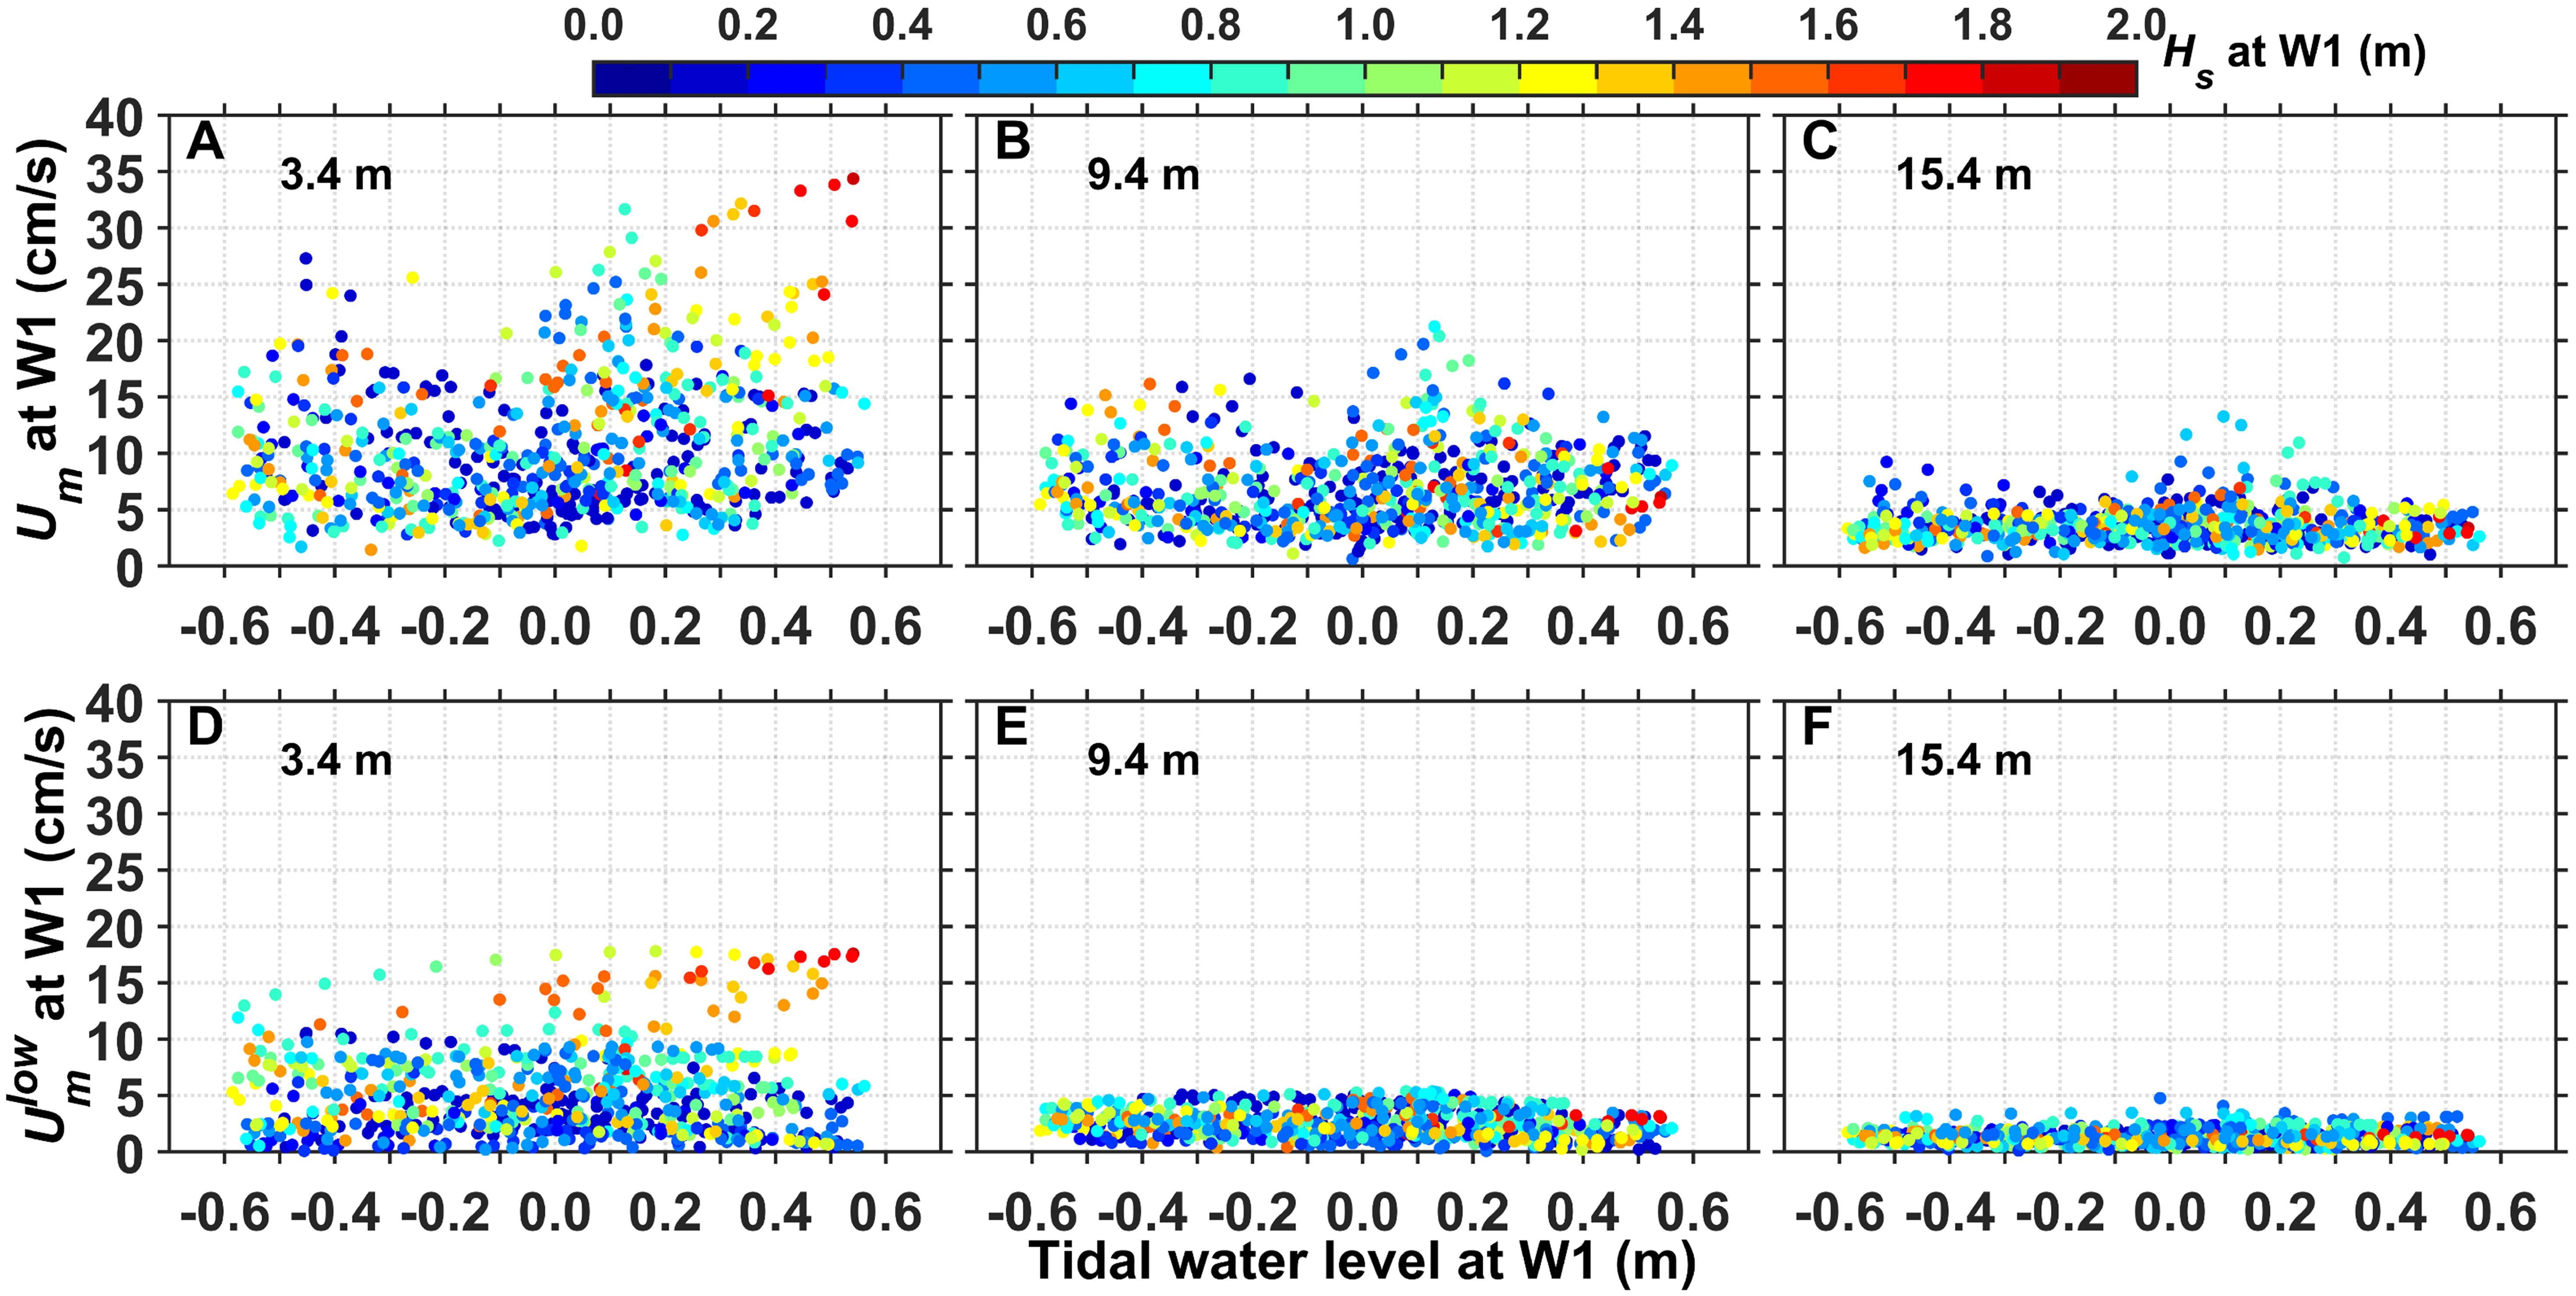
Figure 12. Scatter plot of (A–C) Um and (D–F) versus tidal water level at W1 in the (A, D) near-surface, (B, E) middle, and (C, F) near-bottom layers, with the colors representing Hs at W1. denotes the magnitude of the velocity after removing tidal wave energy by applying a low-pass filter with a cutoff period of 30 h. The and values in the figure are the 60-min averaged results.
Flow on the reef flat exhibited different conditions during different time periods that are closely related to tidal variations and the occurrence of large and small waves. We further analyze the two scenarios in the observational results. For tidally dominated conditions with small waves (e.g., March 30–April 4), during which the incident Hs is less than 0.20 m, Hs on the reef flat is less than 0.15 m, on the reef flat is less than 5 cm s-1, and Um on the reef flat is greater than 5 cm s-1 (Figures 5A, B, E, 9A), indicating that currents are dominant on the reef flat. The second scenario is during the occurrence of large waves (e.g., April 6–13), covering the two large wave events and spring-neap tidal cycle (Figures 2, 5A, C).
For the small-wave scenario, the flow velocity increases during the flood tide and decreases during the ebb tide (Figure 13A), the cross-reef flow velocity is mostly greater than or close to zero during the flood and ebb tide periods (Figure 13B), indicating that the cross-reef flow oscillates on the offshore side of the reef and does not enter the lagoon much of the time. However, during the spring tide (e.g., April 3–4), the cross-reef flow velocity have values less than zero (Figures 13B, 9), reflecting a tendency to flow towards the lagoon during this period. A comprehensive analysis suggests that the flow variations on the reef flat under small-wave conditions are mainly modulated by tides. Seawater only flows through the reef flat during the spring tide, which promotes water exchange with the lagoon, thereby maintaining the ecological health of the coral reef.
Large waves disrupted the flow variations under the original tidally modulated conditions on the reef flat. The overall flow velocity decreases and do not change significantly during flood and ebb tides, respectively (Figure 13C), indicating the weakened role of tidal modulation. The cross-reef flow toward the lagoon increases, particularly when the incident Hs exceeded 1 m, and and Um on the reef flat increased correspondingly (Figures 13C, D). This finding suggests that the cross-reef flow velocity increases with increasing incident wave height and that large waves are crucial for modulating flow variations on the reef flat. Previous studies have also found a correlation between reef flat flow velocities and incident wave heights (Tamura et al., 2007; Lindhart et al., 2021), as well as an increase in cross-reef flow toward the lagoon during wave intensification (Reid et al., 2020). Lowe et al. (2009) found that wave-driven flow on the reef flat in a coral reef system in Kaneohe Bay, Hawaii, increased approximately linearly with increasing incident wave height; however, the magnitudes of the currents were relatively small (i.e., < 20 cm s-1). The occurrence of large waves enhances flow toward the lagoon, which facilitates water exchange. However, previous studies have also indicated that very large waves caused by extreme typhoon events can cause serious damage to corals in shallow areas of atolls (Yang et al., 2015). Therefore, it is necessary to comprehensively examine the advantages and disadvantages of the effects of large waves on the ecological health of coral reefs.
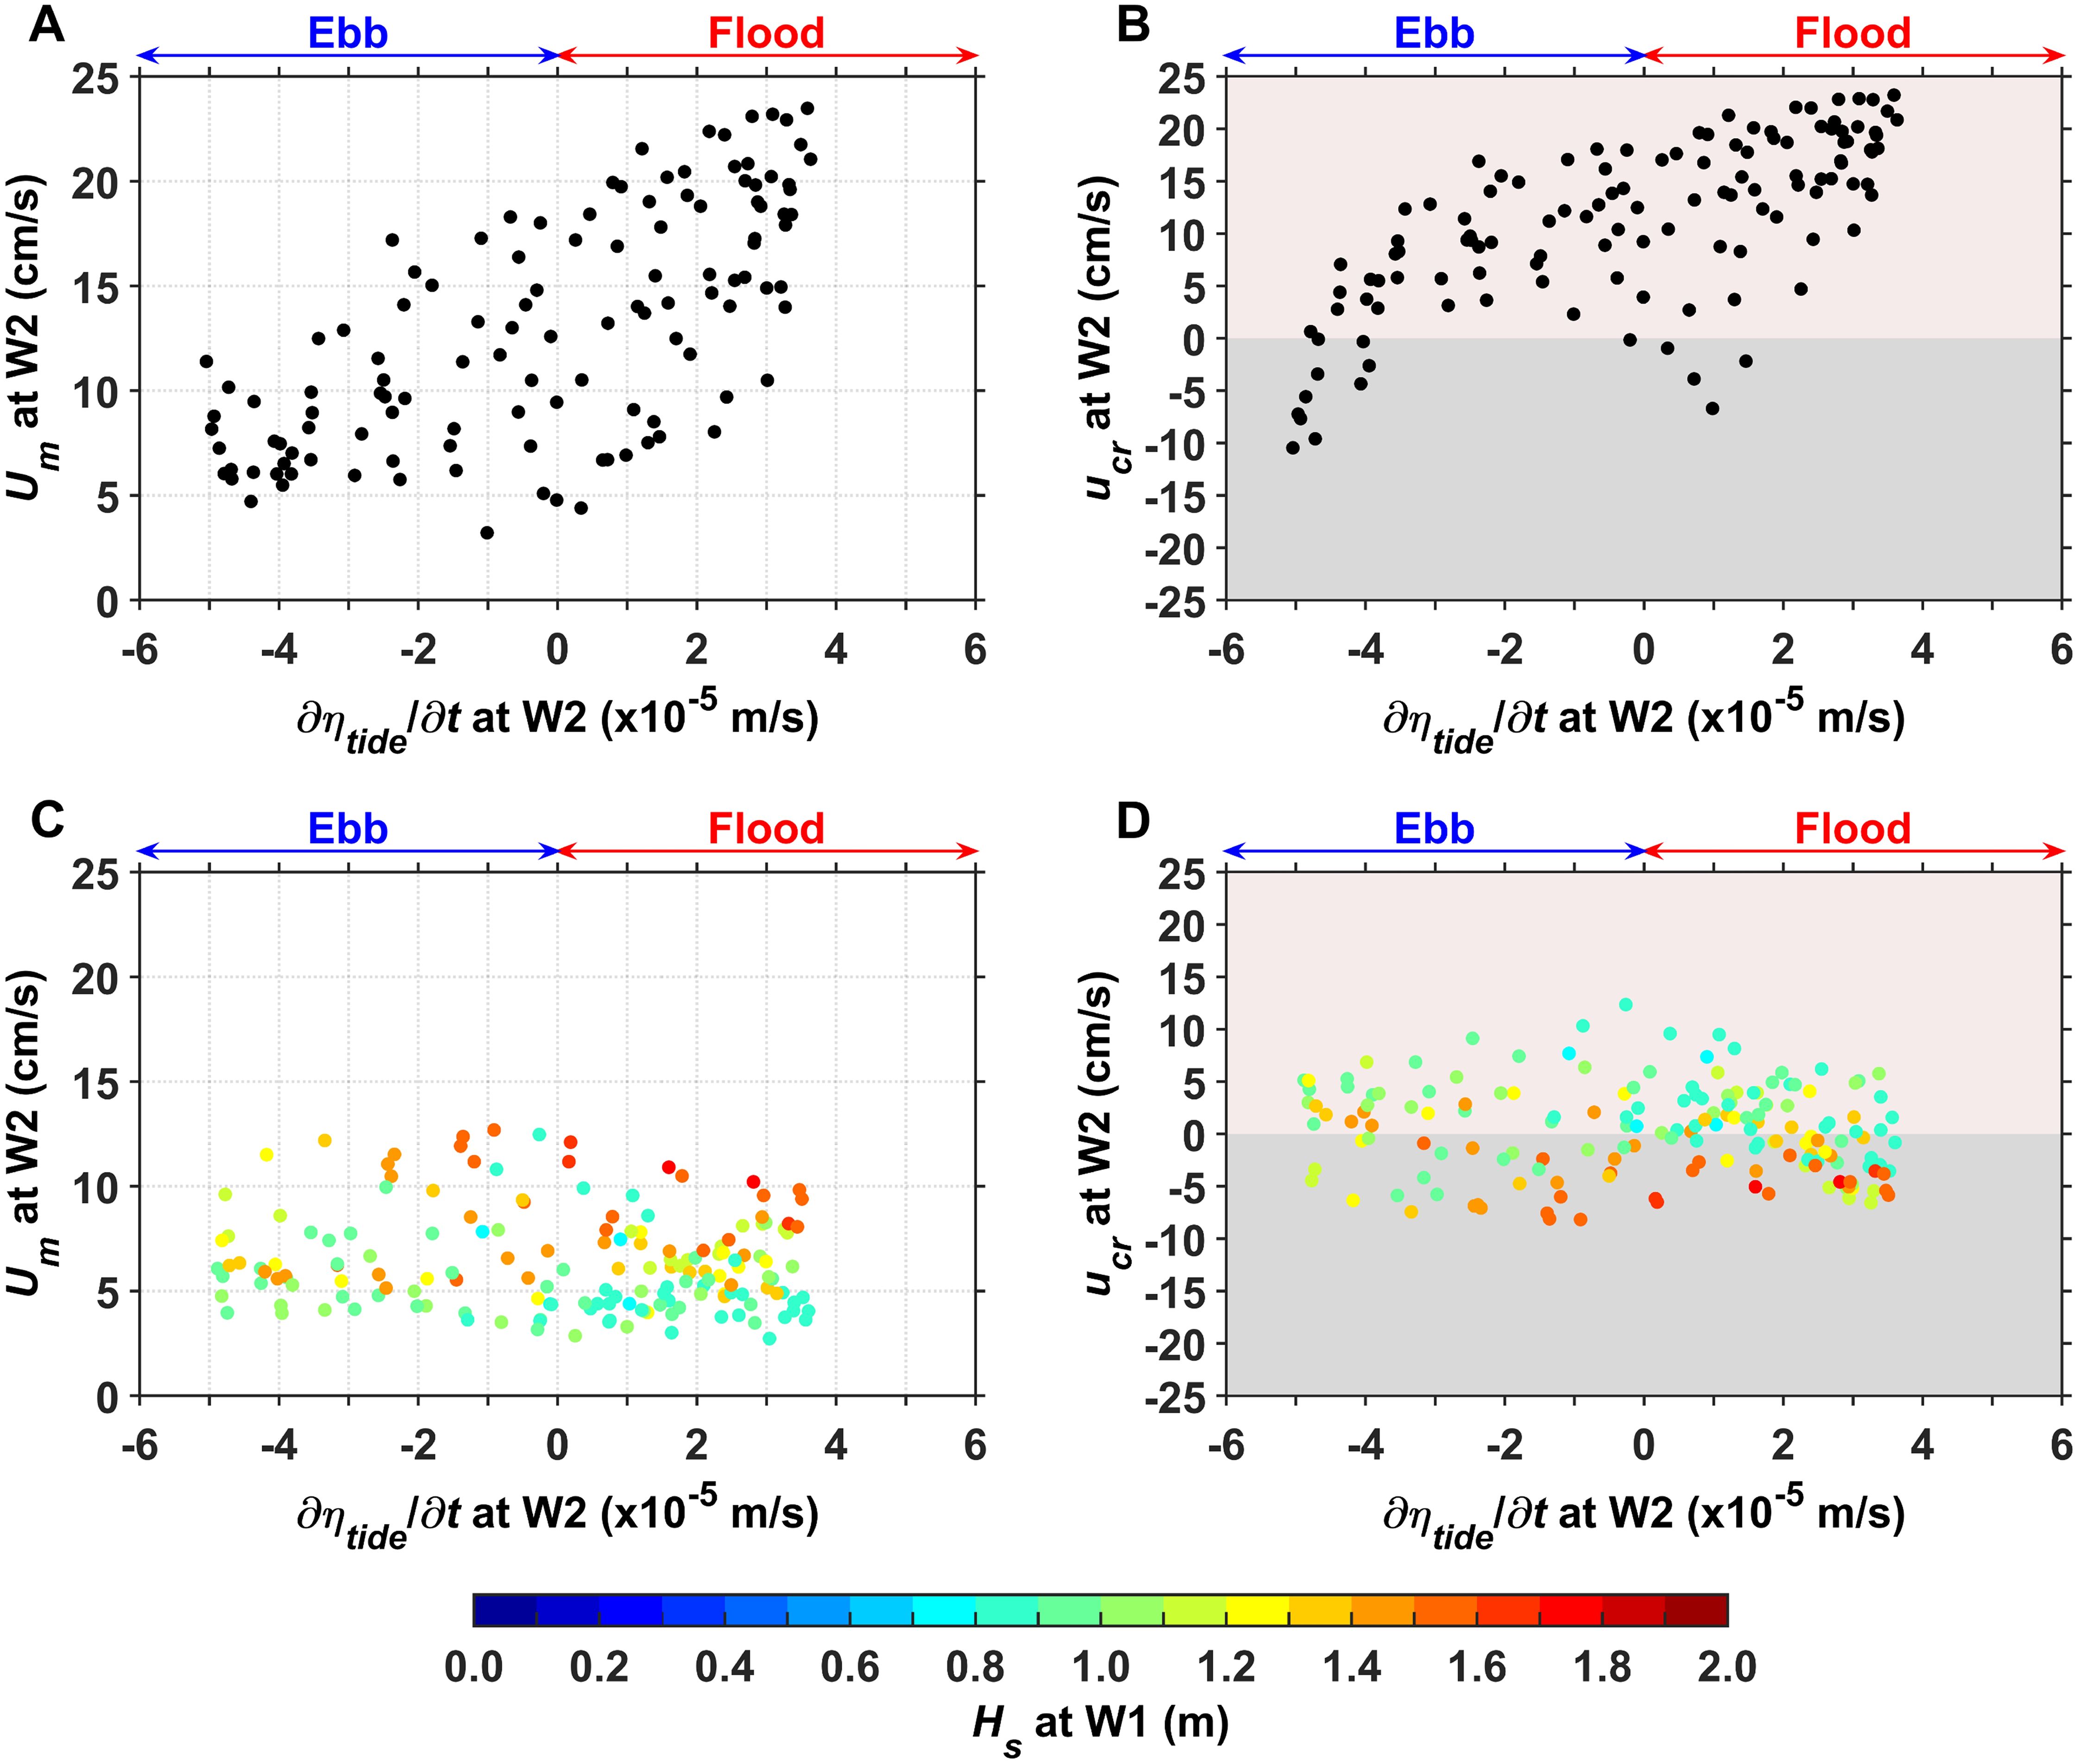
Figure 13. Scatter plot of the time-variation rate () of tidal elevation versus (A, C) and (B, D) at W2 for (A, B) small and (C, D) large wave phases. In (C) and (D), colors represent Hs at W1. The and values in the figure are the 60-min averaged results. > (<) 0 represents the flood (ebb) tide phase. > (<) 0 represents flow toward the offshore region (lagoon).
4.3 Estimating wave setup
Under high-energy conditions, the wave setup on the reef is a crucial component of coastal water levels. In this study, wave data from stations W1 and W2 were used to estimate the wave setup. The wave setdown at W1 was anticipated to be negligible. Following previous research methods (Vetter et al., 2010; Shimozono et al., 2022), we indirectly estimated the wave setup using the following regression analysis:
where is the difference in the mean water depths at W1 and W2, Hs is the incident wave height at W1, and and are the regression parameters that were determined using least squares fitting. The first term on the right side of Equation 10 formulates the wave setup and represents the elevation difference of the two instruments (Shimozono et al., 2022). The two regression parameters were determined using a dataset comprising 444 Hs and pairs.
The regression analysis yielded a linear relationship between and Hs, with increasing with increasing Hs (Figure 14A). Therefore, the wave setup at W2 is 0.012Hs. A strong linear correlation between the wave setup on the reef flat and incident wave height has also been reported in previous studies (e.g., Vetter et al., 2010; Bruch et al., 2022; Grimaldi et al., 2022; Shimozono et al., 2022). The presence of wave setup influences the flow conditions on the reef flat accordingly. at W2 is positively correlated with , particularly when the incident Hs exceeded 1 m; increases significantly with increasing , corresponding to wave-driven flow speeds of 5–8 cm s-1 when the wave setup is 1.5–2.2 cm (Figure 14B). This suggests that the enhanced cross-reef flow toward the lagoon is primarily induced by the wave setup. Lentz et al. (2016) observed a wave setup of 2–10 cm near the reef crest on a platform coral reef, which drove cross-reef currents with speeds of 5–20 cm s-1. These findings highlight the importance of the wave setup effect (Tamura et al., 2007). In addition, previous studies have reported that wave setup on the reef flat is also modulated by tides (Bonneton et al., 2007; Becker et al., 2014), but the results obtained herein indicate that the tidal modulation of wave setup is not significant (Figure 14C).
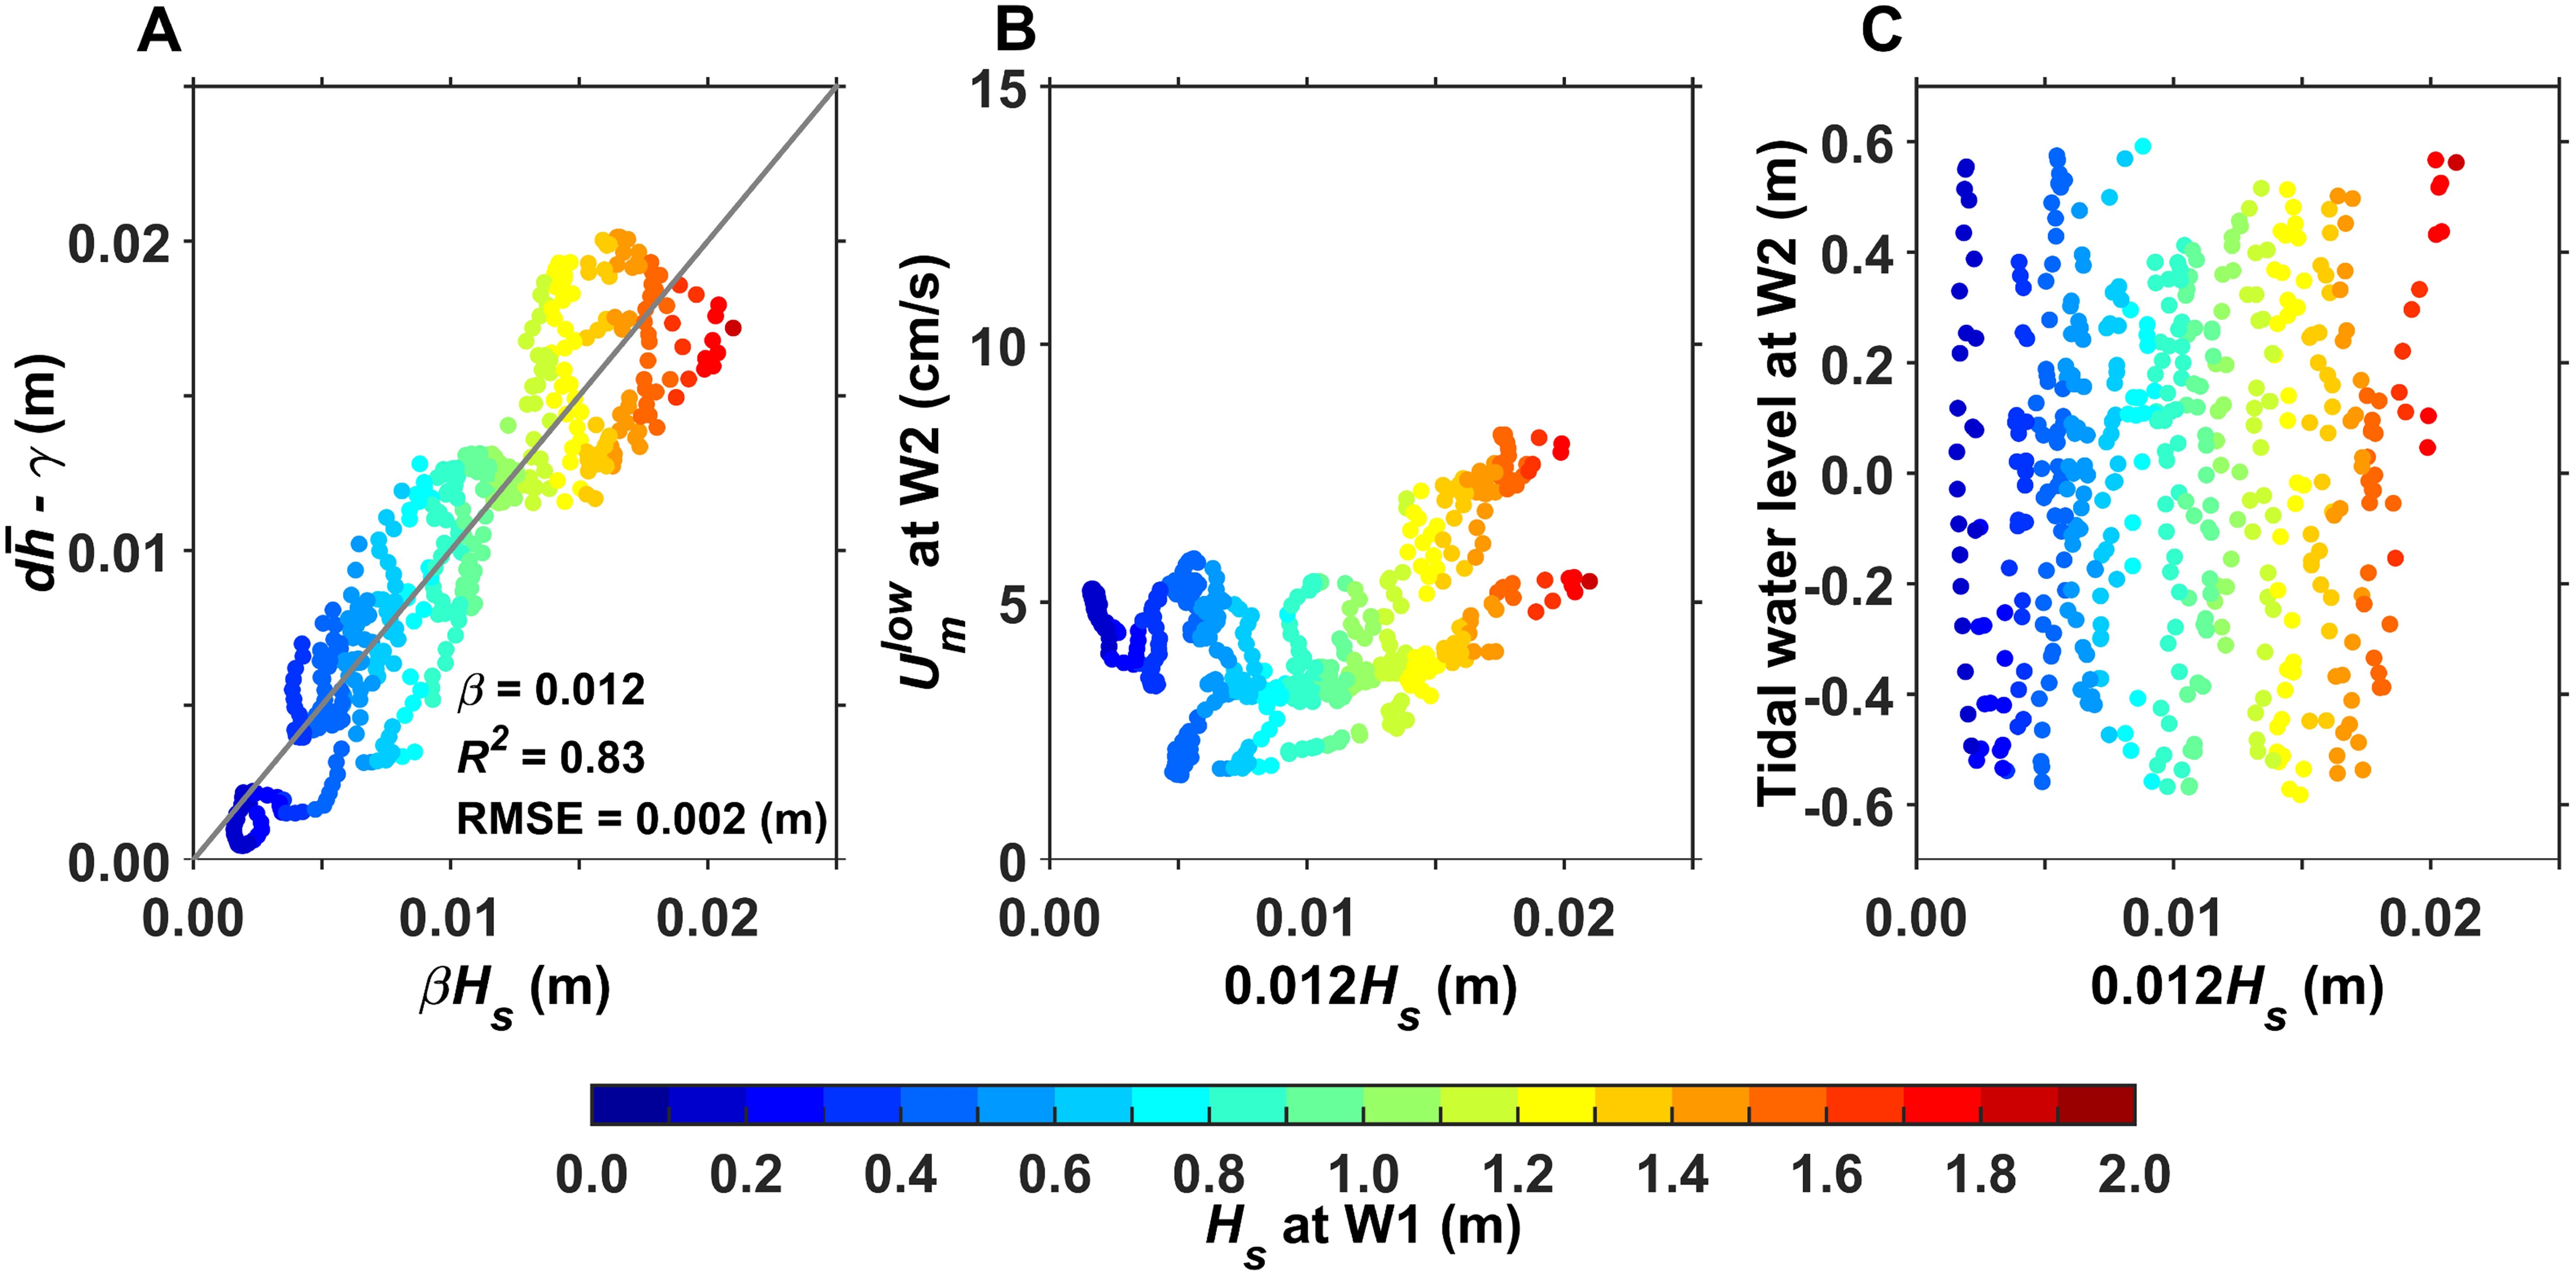
Figure 14. (A) Wave setup estimated from a regression analysis based on wave data. Scatter plot of wave setup versus (B) and (C) tidal water level at W2. Colors represent Hs at W1. In (A), the regression parameter , coefficient of determination , and root-mean-square error RMSE are also presented.
The scaling parameter β for wave setup obtained in this study is an order of magnitude smaller than that reported in previous studies (e.g., Vetter et al., 2010), resulting in a relatively small wave setup magnitude at W2 (Figure 14). We speculate that this scaling parameter may be related to the distance between the two sites. We compared our results with those obtained by previous studies using similar research methods. Figure 15 shows the scatter plot of the scaling parameter values versus the distance between sites. No order-of-magnitude difference is observed for the scaling parameter values at distances of 100–600 m; however, at distances > 1000 m, the scaling parameter values are relatively small and exhibit an order-of-magnitude difference. This indicates that the wave setup magnitude is also related to the distance between the two sites. When the distance between the sites is assumed to be large, the wave setup signals are not significant. Vetter et al. (2010) noted that the wave setup observed at stations near the reef crest were more significant. Therefore, future observations of the wave setup and wave-induced currents on coral reefs should use a distance of 100–500 m between the fore-reef and reef flat sites, as this will improve the ability to capture the wave setup signal.
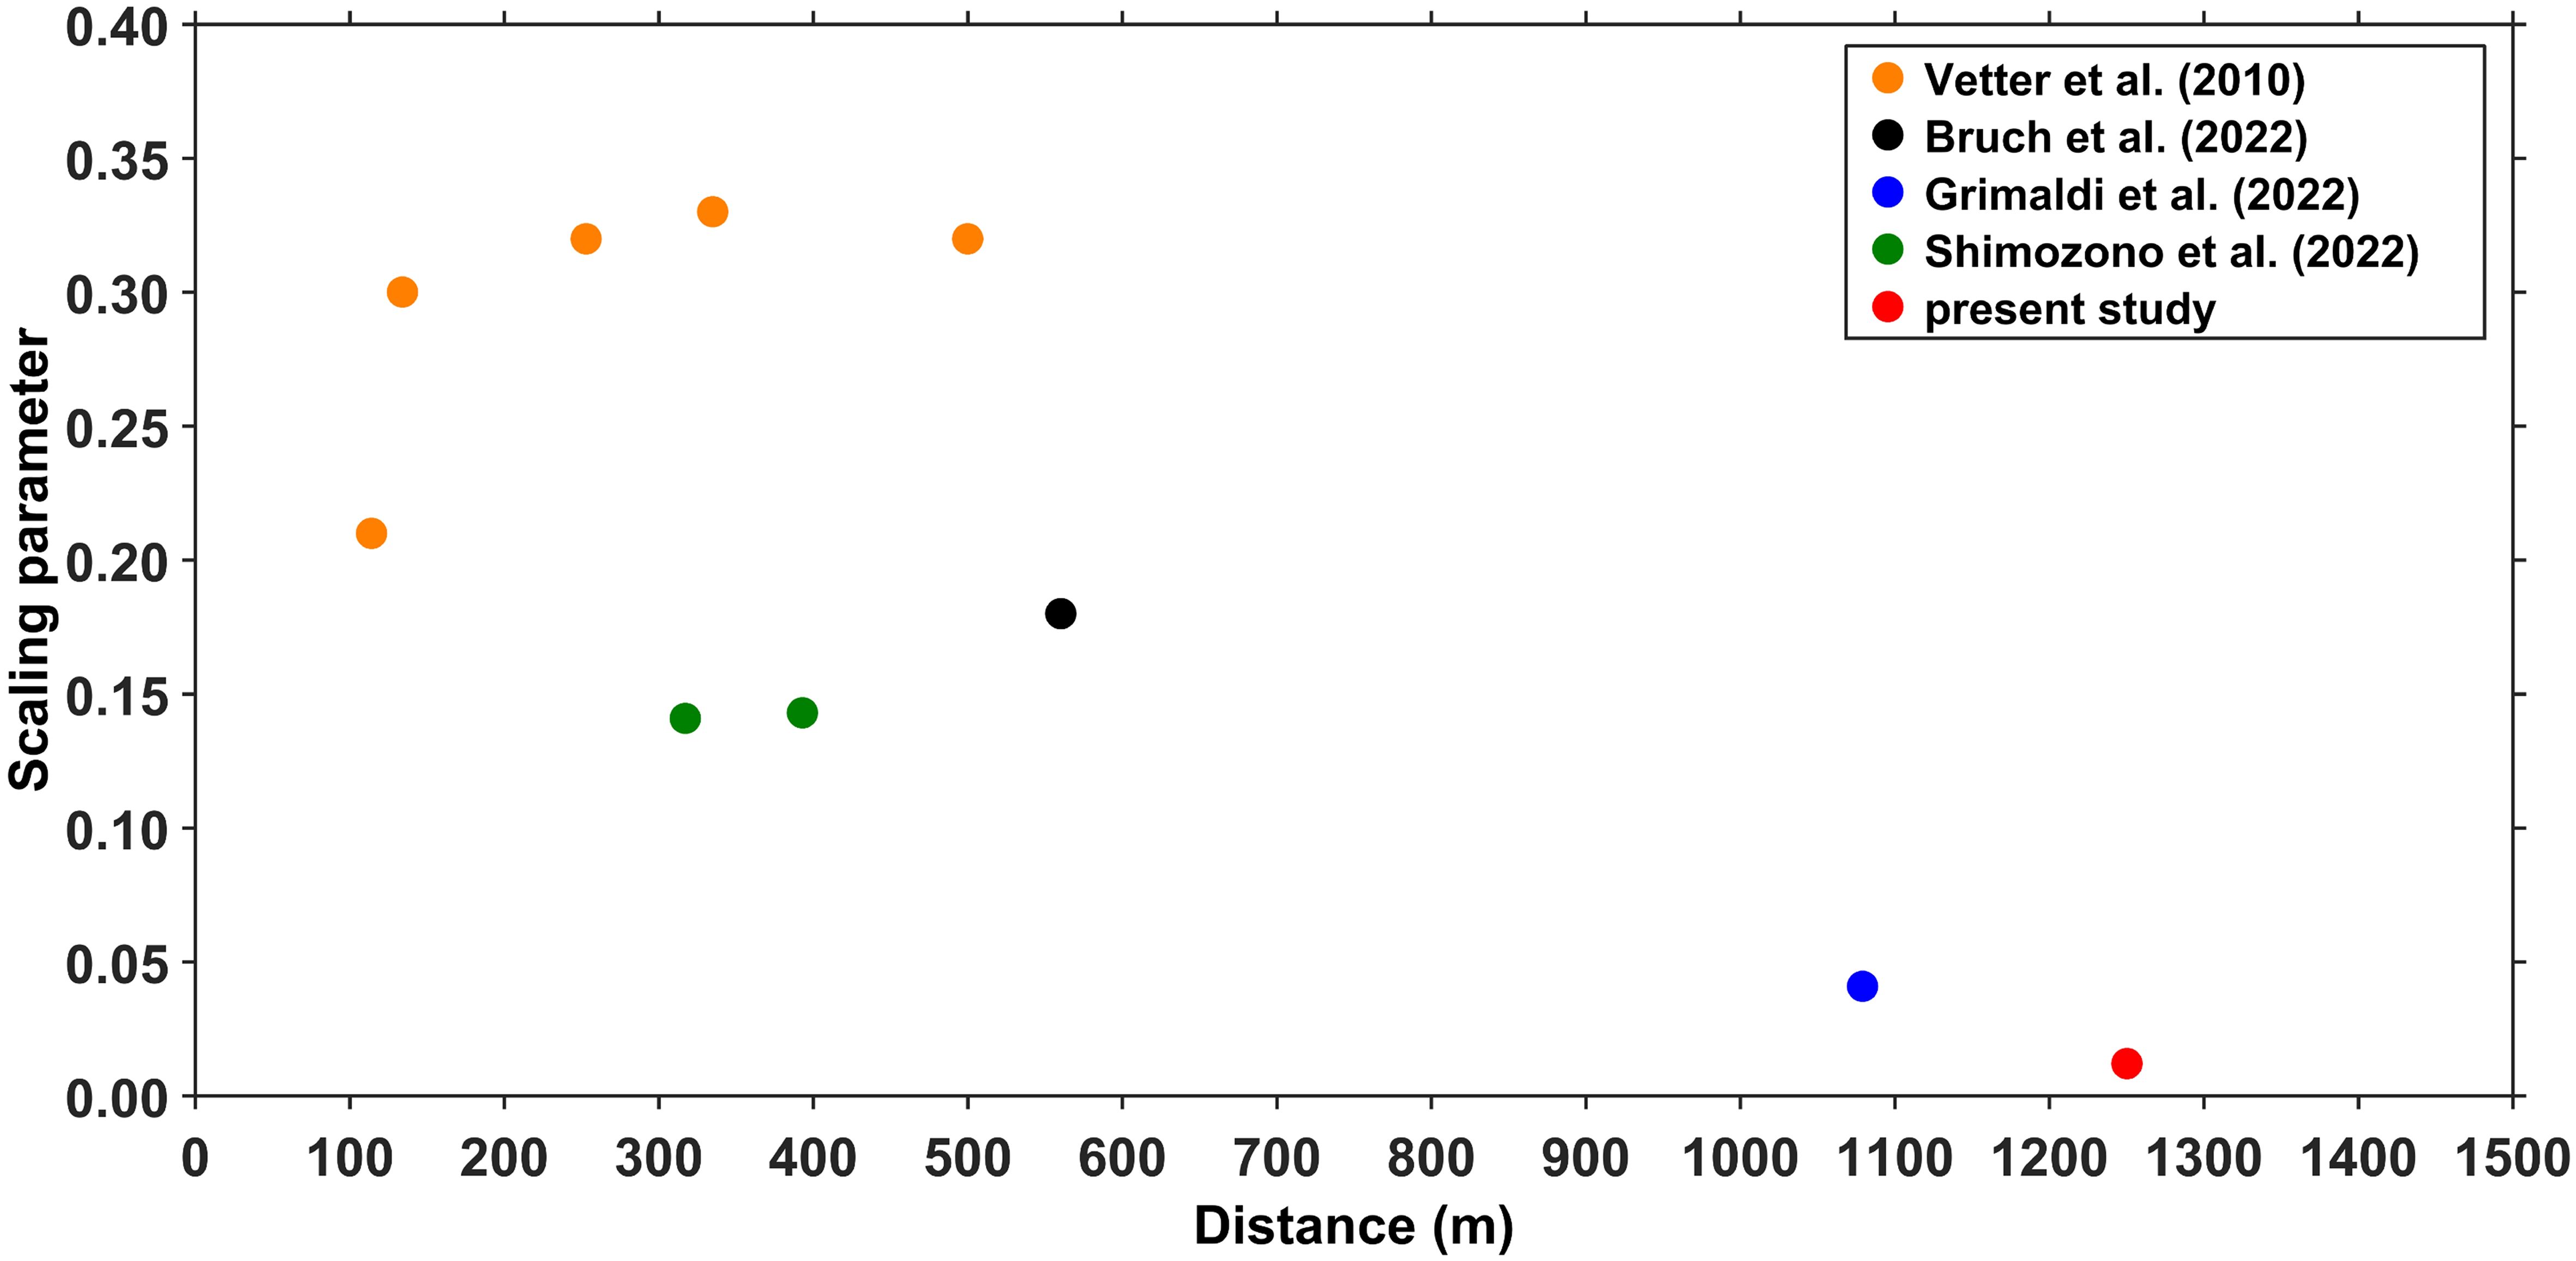
Figure 15. Scatter plot of scaling parameter values versus the distance between the fore-reef and reef flat sites. The red solid circle represents the result of present study. The analysis results of Vetter et al. (2010); Bruch et al. (2022); Grimaldi et al. (2022), and Shimozono et al. (2022) are presented as orange, black, blue, and green solid circles, respectively.
5 Conclusions
High-frequency observations of tides, waves, and currents were conducted on the fore-reef and reef flat of a coral reef atoll in the South China Sea using AWAC, ECM, and WTM instruments. The main findings are summarized as follows.
GWs, IG waves, and VLF waves are identified on the reef. Wave variations on the fore-reef are dominated by GWs with Hs of 0.10–1.81 m. The incident wave directions are mostly parallel to the cross-reef direction. GW attenuation occurred from the fore-reef to the reef flat behind the reef crest owing to bottom friction and wave breaking, resulting in wave energy flux that decreased by over 80%. The wave energy dissipation rate is quadratic with respect to Hs. On the reef flat, IG waves are enhanced. Tidal modulation of GWs and IG waves on the reef flat is significant during large wave events, whereas the dependence of IG waves on tidal water levels weakened during very large and small wave events.
Flow velocity on the fore-reef in the along-reef direction is greater than that in the across-reef direction. During flood (ebb) tide phases, flow is mainly northwestward (southeastward) along the reef. On the fore-reef, relatively strong upper-layer flow is caused by progressive tidal wave and large wave modulation, large waves do not impact the lower-layer flow, and weak flow in the near-bottom layer is mainly the result of frictional dissipation of most of the tidal wave energy by the rough coral terrain. On the reef flat, the flow velocity across the reef is greater than that along the reef. Under small wave conditions, the variations in flow on the reef flat are modulated by tides, resulting in cross-reef flow that oscillates on the offshore side of the reef and does not enter the lagoon much of the time. During spring tides, the cross-reef flow can pass through the reef flat and approach the lagoon. During large wave periods, the tidal modulation of flow on the reef flat is not significant, and the cross-reef velocity increases with increasing incident wave height. Wave setup occurred on the reef flat, which enhances the cross-reef flow toward the lagoon.
The wave setup on the reef flat is strongly linearly correlated with incident wave height. Tidal modulation of the wave setup is not significant. The wave setup magnitude is related to the distance between the fore-reef and reef flat sites. Less significant wave setup signals are captured when the distance between the two sites is large, suggesting that the distance between sites should be set to 100–500 m.
The analysis of the observations revealed the low-pass filtering capability, wave setup, and wave-induced currents of a typical coral reef atoll system in the South China Sea. However, the low-frequency wave generation mechanism and wave-induced current variations on the reef flat could not be clarified due to the lack of sufficient wave observation sites on the reef. Future studies should establish additional observation sites on the fore-reef, reef crest, and reef flat to investigate these issues. In addition, large waves enhance flow toward the lagoon, which is beneficial for seawater exchange; however, the extent of coral damage from large waves should also be evaluated. In the future, in-situ video monitoring and intelligent coral identification technologies should be developed, and coral monitoring results should be correlated with hydrodynamic conditions to evaluate and maintain their ecological health.
Data availability statement
The raw data supporting the conclusions of this article will be made available by the authors, without undue reservation.
Author contributions
RF: Conceptualization, Formal analysis, Funding acquisition, Investigation, Methodology, Visualization, Writing – original draft, Writing – review & editing. HW: Formal analysis, Writing – original draft, Writing – review & editing. YM: Methodology, Software, Visualization, Writing – review & editing. LZ: Investigation, Writing – review & editing. JY: Formal analysis, Project administration, Writing – review & editing. DW: Funding acquisition, Supervision, Writing – review & editing.
Funding
The author(s) declare financial support was received for the research, authorship, and/or publication of this article. This study was supported by the National Natural Science Foundation of China (No. 42106026), the Hainan Provincial Natural Science Foundation of China (No. 421RC1105), the Ministry of Industry and Information Technology of the People’s Republic of China with the research project in the fields of high-tech ships (No. [2019]357), and the Major Science and Technology Plan Project of Yazhou Bay Innovation Institute of Hainan Tropical Ocean University (No. 2022CXYZD003).
Conflict of interest
The authors declare that the research was conducted in the absence of any commercial or financial relationships that could be construed as a potential conflict of interest.
Publisher’s note
All claims expressed in this article are solely those of the authors and do not necessarily represent those of their affiliated organizations, or those of the publisher, the editors and the reviewers. Any product that may be evaluated in this article, or claim that may be made by its manufacturer, is not guaranteed or endorsed by the publisher.
References
Acevedo-Ramirez C. A., Stephenson W., Wakes S., Marino-Tapia I. (2021). Wave transformation on a fringing reef system with spur and groove structures. J. Geophys. Res.: Oceans 126, e2020JC016910. doi: 10.1029/2020JC016910
Baldock T. E. (2012). Dissipation of incident forced long waves in the surf zone—implications for the concept of “bound” wave release at short wave breaking. Coast. Eng. 60, 276–285. doi: 10.1016/j.coastaleng.2011.11.002
Battjes J. A., Bakkenes H. J., Janssen T. T., van Dongeren A. R. (2004). Shoaling of subharmonic gravity waves. J. Geophys. Res.: Oceans 109, C02009. doi: 10.1029/2003jc001863
Becker J. M., Merrifield M. A., Ford M. (2014). Water level effects on breaking wave setup for Pacific island fringing reefs. J. Geophys. Res.: Oceans 119, 914–932. doi: 10.1002/2013jc009373
Becker J. M., Merrifield M. A., Yoon H. (2016). Infragravity waves on fringing reefs in the tropical Pacific: dynamic setup. J. Geophys. Res.: Oceans 121, 3010–3028. doi: 10.1002/2015jc011516
Blanchon P., Iglesias-Prieto R., Jordán Dahlgren E., Richards S. (2010). Arrecifes de coral y cambio climático: vulnerabilidad de la zona costera del estado de Quintana Roo. In Botello, A. V., Villanueva-Fragoso, S., Gutiérrez, J., Rojas Galaviz, J. L. (Eds.). Vulnerabilidad de las zonas costeras mexicanas ante el cambio climático. Semarnat-ine, unam-icmyl, Universidad Autónoma de Campeche.
Bonneton P., Lefebvre J.-P., Bretel P., Ouillon S., Douillet P. (2007). Tidal modulation of wave-setup and wave-induced currents on the aboré coral reef, New Caledonia. J. Coast. Res. SI50, 762–766.
Bruch W., Cordier E., Floc’h F., Pearson S. G. (2022). Water level modulation of wave transformation, setup and runup over La Saline fringing reef. J. Geophys. Res.: Oceans 127, e2022JC018570. doi: 10.1029/2022JC018570
Cai Z. W., Chen W. W., Liu X. L., Sun Z. (2020). Observations of typhoon waves in a reef lagoon of the South China Sea. J. Phys. Oceanogr. 50, 161–173. doi: 10.1175/JPO-D-19-0146.1
Chappell J. (1980). Coral morphology, diversity and reef growth. Nature 286, 249–252. doi: 10.1038/286249a0
Cheriton O. M., Storlazzi C. D., Oberle F. K. J., Rosenberger K. J., Brown E. K. (2024). Extreme low-frequency waves on the Ofu, American Samoa, reef flat. Coral Reefs 43, 185–191. doi: 10.1007/s00338-023-02453-w
Cheriton O. M., Storlazzi C. D., Rosenberger K. J. (2016). Observations of wave transformation over a fringing coral reef and the importance of low-frequency waves and offshore water levels to runup, overwash, and coastal flooding. J. Geophys. Res.: Oceans 121, 3121–3140. doi: 10.1002/2015jc011231
Cheriton O. M., Storlazzi C. D., Rosenberger K. J. (2020). In situ observations of wave transformation and infragravity bore development across reef flats of varying geomorphology. Front. Mar. Sci. 7. doi: 10.3389/fmars.2020.00351
Davis K. A., Lentz S. J., Pineda J., Farrar J. T., Starczak V. R., Churchill J. H. (2011). Observations of the thermal environment on Red Sea platform reefs: a heat budget analysis. Coral Reefs 30, 25–36. doi: 10.1007/s00338-011-0740-8
Dean R. G., Dalrymple R. A. (1991). “Water wave mechanics for engineers and scientists,” in Advanced Series on Ocean Engineering, vol. 2. (Singapore: World Scientific Publishing Company). doi: 10.1017/CBO9781107415324.004
Deng X. D., Liu J. L., Cai S. Q. (2013). Analyses of the tidal current characteristics on the continental shelf of the Xisha Islands in the South China Sea. J. Trop. Oceanogr. 32, 8–12. doi: 10.3969/j.issn.1009-5470.2013.04.002
Ferrario F., Beck M. W., Storlazzi C. D., Micheli F., Shepard C. C., Airoldi L. (2014). The effectiveness of coral reefs for coastal hazard risk reduction and adaptation. Nat. Commun. 5, 3794. doi: 10.1038/ncomms4794
Frith C. A., Mason L. B. (1986). Modelling wind driven circulation one tree reef, southern Great Barrier Reef. Coral Reefs 4, 201–211. doi: 10.1007/BF00298078
Gawehn M., van Dongeren A., van Rooijen A., Storlazzi C. D., Cheriton O. M., Reniers A. (2016). Identification and classification of very low frequency waves on a coral reef flat. J. Geophys. Res.: Oceans 121, 7560–7574. doi: 10.1002/2016JC011834
Green R. H., Lowe R. J., Buckley M. L. (2018). Hydrodynamics of a tidally forced coral reef atoll. J. Geophys. Res.: Oceans 123, 7084–7101. doi: 10.1029/2018JC013946
Grimaldi C. M., Lowe R. J., Benthuysen J. A., Green R. H., Reyns J., Kernkamp H., et al. (2022). Wave and tidally driven flow dynamics within a coral reef atoll off northwestern Australia. J. Geophys. Res.: Oceans 127, e2021JC017583. doi: 10.1029/2021JC017583
Hardy T. A., Young I. R. (1996). Field study of wave attenuation on an offshore coral reef. J. Geophys. Res.: Oceans 101, 14311–14326. doi: 10.1029/96JC00202
Hearn C., Atkinson M., Falter J. (2001). A physical derivation of nutrient-uptake rates in coral reefs: effects of roughness and waves. Coral Reefs 20, 347–356. doi: 10.1007/s00338-001-0185-6
Herdman L. M. M., Hench J. L., Monismith S. G. (2015). Heat balances and thermally driven lagoon-ocean exchangeson a tropical coral reef system (Moorea, French Polynesia). J. Geophys. Res.: Oceans 120, 1233–1252. doi: 10.1002/2014JC010145
Huang H., Chen Z., Huang L. T. (2021). Status of coral reefs in China, (2010-2019) (Beijing, China: Ocean Press).
Huang H., You F., Lian J. S., Yang J. H., Li X. B., Dong Z. J., et al. (2011). Species diversity and distribution of scleractinian coral at Xisha Islands, China. Biodivers. Sci. 19, 710–715. doi: 10.3724/SP.J.1003.2011.06132
Large W. G., Pond S. (1981). Open ocean momentum flux measurements in moderate to strong winds. J. Phys. Oceanogr. 11, 324–336. doi: 10.1175/1520-0485(1981)011<0324:OOMFMI>2.0.CO;2
Lentz S. J., Churchill J. H., Davis K. A., Farrar J. T., Pineda J., Starczak V. (2016). The characteristics and dynamics of wave-driven flow across a platform coral reef in the Red Sea. J. Geophys. Res.: Oceans 121, 1360–1376. doi: 10.1002/2015JC011141
Lindhart M., Rogers J. S., Maticka S. A., Woodson C. B., Monismith S. G. (2021). Wave modulation of flows on open and closed reefs. J. Geophys. Res.: Oceans 126, e2020JC016645. doi: 10.1029/2020JC016645
Longuet-Higgins M. S., Stewart R. W. (1964). Radiation stresses in water waves: a physical discussion, with applications. Deep Sea Res. 11, 529–562. doi: 10.1016/0011-7471(64)90001-4
Lowe R. J., Falter J. L. (2015). Oceanic forcing of coral reefs. Annu. Rev. Mar. Sci. 7, 43–66. doi: 10.1146/annurev-marine-010814-015834
Lowe R. J., Falter J. L., Bandet M. D., Pawlak G., Atkinson M. J., Monismith S. G., et al. (2005c). Spectral wave dissipation over a barrier reef. J. Geophys. Res.: Oceans 110, C04001. doi: 10.1029/2004JC002711
Lowe R. J., Falter J. L., Monismith S. G., Atkinson M. J. (2009). Wave-driven circulation of a coastal reef–lagoon system. J. Phys. Oceanogr. 39, 873–893. doi: 10.1175/2008JPO3958.1
Lowe R. J., Koseff J. R., Monismith S. G. (2005a). Oscillatory flow through submerged canopies: 1. velocity structure. J. Geophys. Res.: Oceans 110, C10016. doi: 10.1029/2004JC002788
Lowe R. J., Koseff J. R., Monismith S. G., Falter J. L. (2005b). Oscillatory flow through submerged canopies: 2. canopy mass transfer. J. Geophys. Res.: Oceans 110, C10017. doi: 10.1029/2004JC002789
Lowe R. J., Leon A. S., Symonds G., Falter J. L., Gruber R. (2015). The intertidal hydraulics of tide-dominated reef platforms. J. Geophys. Res.: Oceans 120, 4845–4868. doi: 10.1002/2015JC010701
Lowe R. J., Pivan X., Falter J. L., Symonds G., Gruber R. (2016). Rising sea levels will reduce extreme temperature variations in tide-dominated reef habitats. Sci. Adv. 2, e1600825. doi: 10.1126/sciadv.1600825
Ludington C. A. (1979). Tidal modifications and associated circulation in a platform reef lagoon. Aust. J. Mar. Fresh. Res. 30, 425–430. doi: 10.1071/MF9790425
Lugo-Fernandez A., Roberts H. H., Suhayda J. N. (1998). Wave transformations across a Caribbean fringing-barrier coral reef. Cont. Shelf Res. 18, 1099–1124. doi: 10.1016/S0278-4343(97)00020-4
McCabe R. M., Estrade P., Middleton J. H., Melville W. K., Roughan M., Lenain L. (2010). Temperature variability in a shallow, tidally isolated coral reef lagoon. J. Geophys. Res.: Oceans 115, C12011. doi: 10.1029/2009JC006023
Monismith S. G. (2007). Hydrodynamics of coral reefs. Annu. Rev. Fluid Mech. 39, 37–55. doi: 10.1146/annurev.fluid.38.050304.092125
Monismith S. G., Genin A., Reidenbach M. A., Yahel G., Koseff ,. J. R. (2006). Thermally driven exchanges between a coral reef and the adjoining ocean. J. Phys. Oceanogr. 36, 1332–1347. doi: 10.1175/JPO2916.1
Monismith S. G., Rogers J. S., Koweek D., Dunbar R. B. (2015). Frictional wave dissipation on a remarkably rough reef. Geophys. Res. Lett. 42, 4063–4071. doi: 10.1002/2015GL063804
Munk W. H., Sargent M. C. (1948). Adjustment of bikini atoll to ocean waves. Eos Trans. Am. Geophys. Union 29, 855–860. doi: 10.1029/TR029i006p00855
Pawlowicz R., Beardsley B., Lentz S. (2002). Classical tidal harmonic analysis including error estimates in MATLAB using T_TIDE. Comput. Geosci. 28, 929–937. doi: 10.1016/S0098-3004(02)00013-4
Pearson S. G., Storlazzi C. D., van Dongeren A. R., Tissier M. F. S., Reniers A. J. H. M. (2017). A bayesian-based system to assess wave-driven flooding hazards on coral reef-lined coasts. J. Geophys. Res.: Oceans 122, 10099–10117. doi: 10.1002/2017JC013204
Pomeroy A., Lowe R., Symonds G., van Dongeren A., Moore C. (2012). The dynamics of infragravity wave transformation over a fringing reef. J. Geophys. Res.: Oceans 117, C11022. doi: 10.1029/2012JC008310
Reid E. C., Lentz S. J., DeCarlo T. M., Cohen A. L., Davis K. A. (2020). Physical processes determine spatial structure in water temperature and residence time on a wide reef flat. J. Geophys. Res.: Oceans 125, e2020JC016543. doi: 10.1029/2020JC016543
Rogers J. S., Monismith S. G., Dunbar R. B., Koweek D. (2015). Field observations of wave-driven circulation over spur and groove formations on a coral reef. J. Geophys. Res.: Oceans 120, 145–160. doi: 10.1002/2014JC010464
Rogers J. S., Monismith S. G., Koweek D. A., Dunbar R. B. (2016). Wave dynamics of a Pacific atoll with high frictional effects. J. Geophys. Res.: Oceans 121, 350–367. doi: 10.1002/2015JC011170
Shimozono T., Shibata R., Onaka S., Mori T., Awazu Y. (2022). Variability of shoreline water levels on an atoll in the Maldives. J. Geophys. Res.: Oceans 127, e2021JC017880. doi: 10.1029/2021JC017880
Smith C., Vila-Concejo A., Salles T. (2023). Offshore wave climate of the Great Barrier Reef. Coral Reefs 42, 661–676. doi: 10.1007/s00338-023-02377-5
Sous D., Tissier M., Rey V., Touboul J., Bouchette F., Devenon J.-L., et al. (2019). Wave transformation over a barrier reef. Cont. Shelf Res. 184, 66–80. doi: 10.1016/j.csr.2019.07.010
Symonds G., Huntley D. A., Bowen A. J. (1982). Two-dimensional surf beat: long wave generation by a time-varying breakpoint. J. Geophys. Res.: Oceans 87, 492–498. doi: 10.1029/JC087iC01p00492
Tamura H., Nadaoka K., Paringit E. C. (2007). Hydrodynamic characteristics of a fringing coral reef on the east coast of Ishigaki Island, southwest Japan. Coral Reefs 26, 17–34. doi: 10.1007/s00338-006-0164-z
Vetter O., Becker J. M., Merrifield M. A., Pequignet A.-C., Aucan J., Boc S. J., et al. (2010). Wave setup over a Pacific Island fringing reef. J. Geophys. Res.: Oceans 115, C12066. doi: 10.1029/2010JC006455
Wang G. Z. (2001). Sedimentology of coral reefs in the South China Sea (Beijing, China: Oceanic Press).
Wang D. R., Shi M. C., Nan F. (2012). Study on features of tide and residual currents in the region of Paracel Islands. Period. Ocean U. China 42, 1–9. doi: 10.16441/j.cnki.hdxb.2012.10.001
Woodroffe C. D. (2002). Coasts: form, process and evolution (Cambridge, United Kingdom: Cambridge University Press).
Wu Z. J., Wang D. R., Tu Z. G., Li Y. C., Chen J. R., Zhang G. X. (2011). The analysis on the reason of hermatypic coral degradation in Xisha. Acta Oceanol. Sin. 33, 140–146.
Yang H. Q., Yu K. F., Zhao M. X., Shi Q., Tao S. C., Yan H. Q., et al. (2015). Impact on the coral reefs at Yongle Atoll, Xisha Islands, South China Sea from a strong typhoon direct sweep: Wutip, September 2013. J. Asian Earth Sci. 114, 457–466. doi: 10.1016/j.jseaes.2015.04.009
Yao Y., Zhong X. (2023). A review of water-sediment dynamics around the reef islands. J. Changsha U. Sci. Technol. 20, 1–10. doi: 10.19951/j.cnki.1672-9331.20230427002
Yao Y., Zhou B. B. (2024). A review of coral reef canopy hydrodynamics. Acta Oceanol. Sin. 46, 1–11. doi: 10.12284/hyxb2024002
Keywords: coral reef, waves, currents, reef flat, South China Sea
Citation: Fan R, Wei H, Mai Y, Zhang L, Yu J and Wang D (2024) Observations of waves and currents on the fore-reef and reef flat of a coral reef atoll in the South China Sea. Front. Mar. Sci. 11:1460450. doi: 10.3389/fmars.2024.1460450
Received: 06 July 2024; Accepted: 26 August 2024;
Published: 17 September 2024.
Edited by:
Michel Benoit, Centrale Marseille, FranceReviewed by:
Aifeng Tao, Hohai University, ChinaLaura Carrillo, El Colegio de la Frontera Sur, Mexico
Copyright © 2024 Fan, Wei, Mai, Zhang, Yu and Wang. This is an open-access article distributed under the terms of the Creative Commons Attribution License (CC BY). The use, distribution or reproduction in other forums is permitted, provided the original author(s) and the copyright owner(s) are credited and that the original publication in this journal is cited, in accordance with accepted academic practice. No use, distribution or reproduction is permitted which does not comply with these terms.
*Correspondence: Jitao Yu, ZGR5anRAMTYzLmNvbQ==; Daoru Wang, d2FuZ2RyNkB2aXAuc2luYS5jb20=