- 1Coastal Studies Institute, Department of Biology, East Carolina University, Wanchese, NC, United States
- 2Department of Environmental Sciences, University of North Carolina Wilmington, Wilmington, NC, United States
Artificial reefs may be created within estuaries for multiple reasons, including habitat enhancement, oyster production, or recreational fishing. While traditional sampling in this environment is difficult due to complex structures and the high turbidity of estuaries, acoustic imaging sonar provides an effective alternative to measure abundance and size spectra of the fish community. We sampled eight artificial reefs in Pamlico Sound, North Carolina, that are designated as oyster sanctuaries. At each oyster sanctuary, we sampled 26 boat positions along two transects using ARIS imaging sonar, which included control areas outside of the sanctuaries over featureless bottom. We found that fish abundance and mean length were greater within the oyster sanctuary boundaries, but did not observe any significant differences among artificial substrate types within the sanctuaries. Further, we found that fish abundance dropped to near background levels within 25 m outside of the oyster sanctuary edge. Size spectra analysis revealed that abundance was higher in the sanctuaries versus control areas for every length bin of the fish community (5 to 50 cm). However, the differences in abundance were greatest for 10 to 30 cm fishes. Our results can be coupled with previous research on species composition data to more fully understand the potential role that the Pamlico Sound oyster sanctuaries, and estuarine artificial reefs in general, serve as habitat and recreational fishing enhancement.
1 Introduction
Interest in how artificial structures function as habitat in marine ecosystems has increased in recent years, which has been motivated by multiple reasons (Becker et al., 2018). For instance, artificial reefs are often included in strategies to increase the amount of complex habitats in order to enhance fisheries production or fishing opportunities (Paxton et al., 2022; Chong et al., 2024). Indeed, the footprint of artificial structures in the ocean has increased dramatically during the last three decades, and a wide variety of structures are used (Paxton et al., 2024). Further, the expanding marine energy and aquaculture sectors consist of novel structures that change habitat function (Dumbauld et al., 2009; Degraer et al., 2020; Bolser et al., 2021).
While artificial reefs are often associated with the continental shelf of the ocean, they also occur in estuaries. The specific goals of estuarine artificial reefs are often similar to their ocean counterparts, but may also include the enhancement of natural oyster recruitment or shoreline protection (Brown et al., 2013; Silva et al., 2016; Theuerkauf et al., 2021). Artificial reefs in estuaries can have distinct fish assemblages from adjacent bottom or from natural rocky substrate (Folpp et al., 2013; Pierson and Eggleston, 2014). Further, the complex artificial substrate can accumulate a diverse community of epibenthic invertebrates and also attract forage fish (Martin and Bortone, 1997; Folpp et al., 2013), both of which may lead to novel prey resources for fish predators (Simonsen and Cowan, 2013).
Along the U.S. Atlantic coast, the state of North Carolina maintains ~71 artificial reefs and 28 of these are in estuaries (NCDMF, 2016). Among the estuarine artificial reefs, a network of 17 of these are designated as oyster sanctuaries, which have the dual-purpose of containing a protected brood stock of oysters and providing habitat enhancement. While the function of the oyster sanctuaries as brood stock has been well characterized (Peters et al., 2017; Theuerkauf et al., 2021), the habitat enhancement of these artificial reefs remains uncertain (Pierson and Eggleston, 2014).
There are major challenges with assessing fish habitat enhancement of estuarine artificial reefs including the difficulty of using traditional net-based sampling gear around complex structure and turbid water limiting the application of scuba or cameras. Alternatively, acoustic imaging sonar has been widely used to assess aquatic habitat differences in the abundance and length structure of the fish community in structured environments (Sibley et al., 2023a; Munnelly et al., 2024). Imaging sonar is also effective in turbid environments, such as estuaries, and samples the fish community more completely than traditional gear types; estimates of fish abundance are frequently higher with acoustic imaging compared to other methods used in tandem (Kerschbaumer et al., 2020; Sibley et al., 2023b). This reduction in sampling bias across fish lengths associated with acoustic imaging is important, because fish communities are highly size-structured, with different species and life stages spanning multiple orders of magnitude. Analysis of size spectra—the relationship of organism densities across length bins—is an effective way to contrast differences in habitat function (Dunn et al., 2023; Olson et al., 2023; Letessier et al., 2024). Despite these strengths of acoustic imaging, species identification is often not possible, and detections of cryptic species may be underrepresented (Sibley et al., 2023b). Therefore, some alternate form of sampling to get species identities is often helpful. In this study we use acoustic imaging sonar to test the hypothesis that there is a greater abundance of fish within the North Carolina oyster sanctuaries as compared to adjacent-featureless bottom. Further, we examine size spectra to determine if the length structure of the fish community within these sanctuaries differs from the surrounding areas. Our results can be considered in tandem with previous efforts to characterize the species assemblage within and around the oyster sanctuaries (Pierson and Eggleston, 2014).
2 Methods
2.1 Pamlico Sound study area
The oyster reef sanctuaries sampled over the course of this study are located in Pamlico Sound, North Carolina (Figure 1). Pamlico Sound represents the second largest estuary in the U.S. and holds great importance for fisheries production and biodiversity along the U.S. Atlantic coast (APNEP, 2012; Binion-Rock et al., 2023). It functions as an important nursery habitat for a variety of species, including economically important fishes (e.g., southern flounder Paralichthys lethostigma, weakfish Cynoscion regalis and red drum Sciaenops ocellatus), blue crab Callinectes sapidus and penaeid shrimp. The Pamlico and Neuse Rivers, and the Albemarle Sound to the north, feed lower salinity water into Pamlico Sound. Connectivity between the sound and ocean occurs at only three coastal inlets, specifically Oregon, Hatteras and Ocracoke inlets. Unlike most U.S. Atlantic estuarine systems, the influence of the lunar tide is minimal and mostly restricted to areas in close proximity to the inlets; wind generated tides are the primary mode of water circulation and larval transport in this system (Reyns et al., 2006).
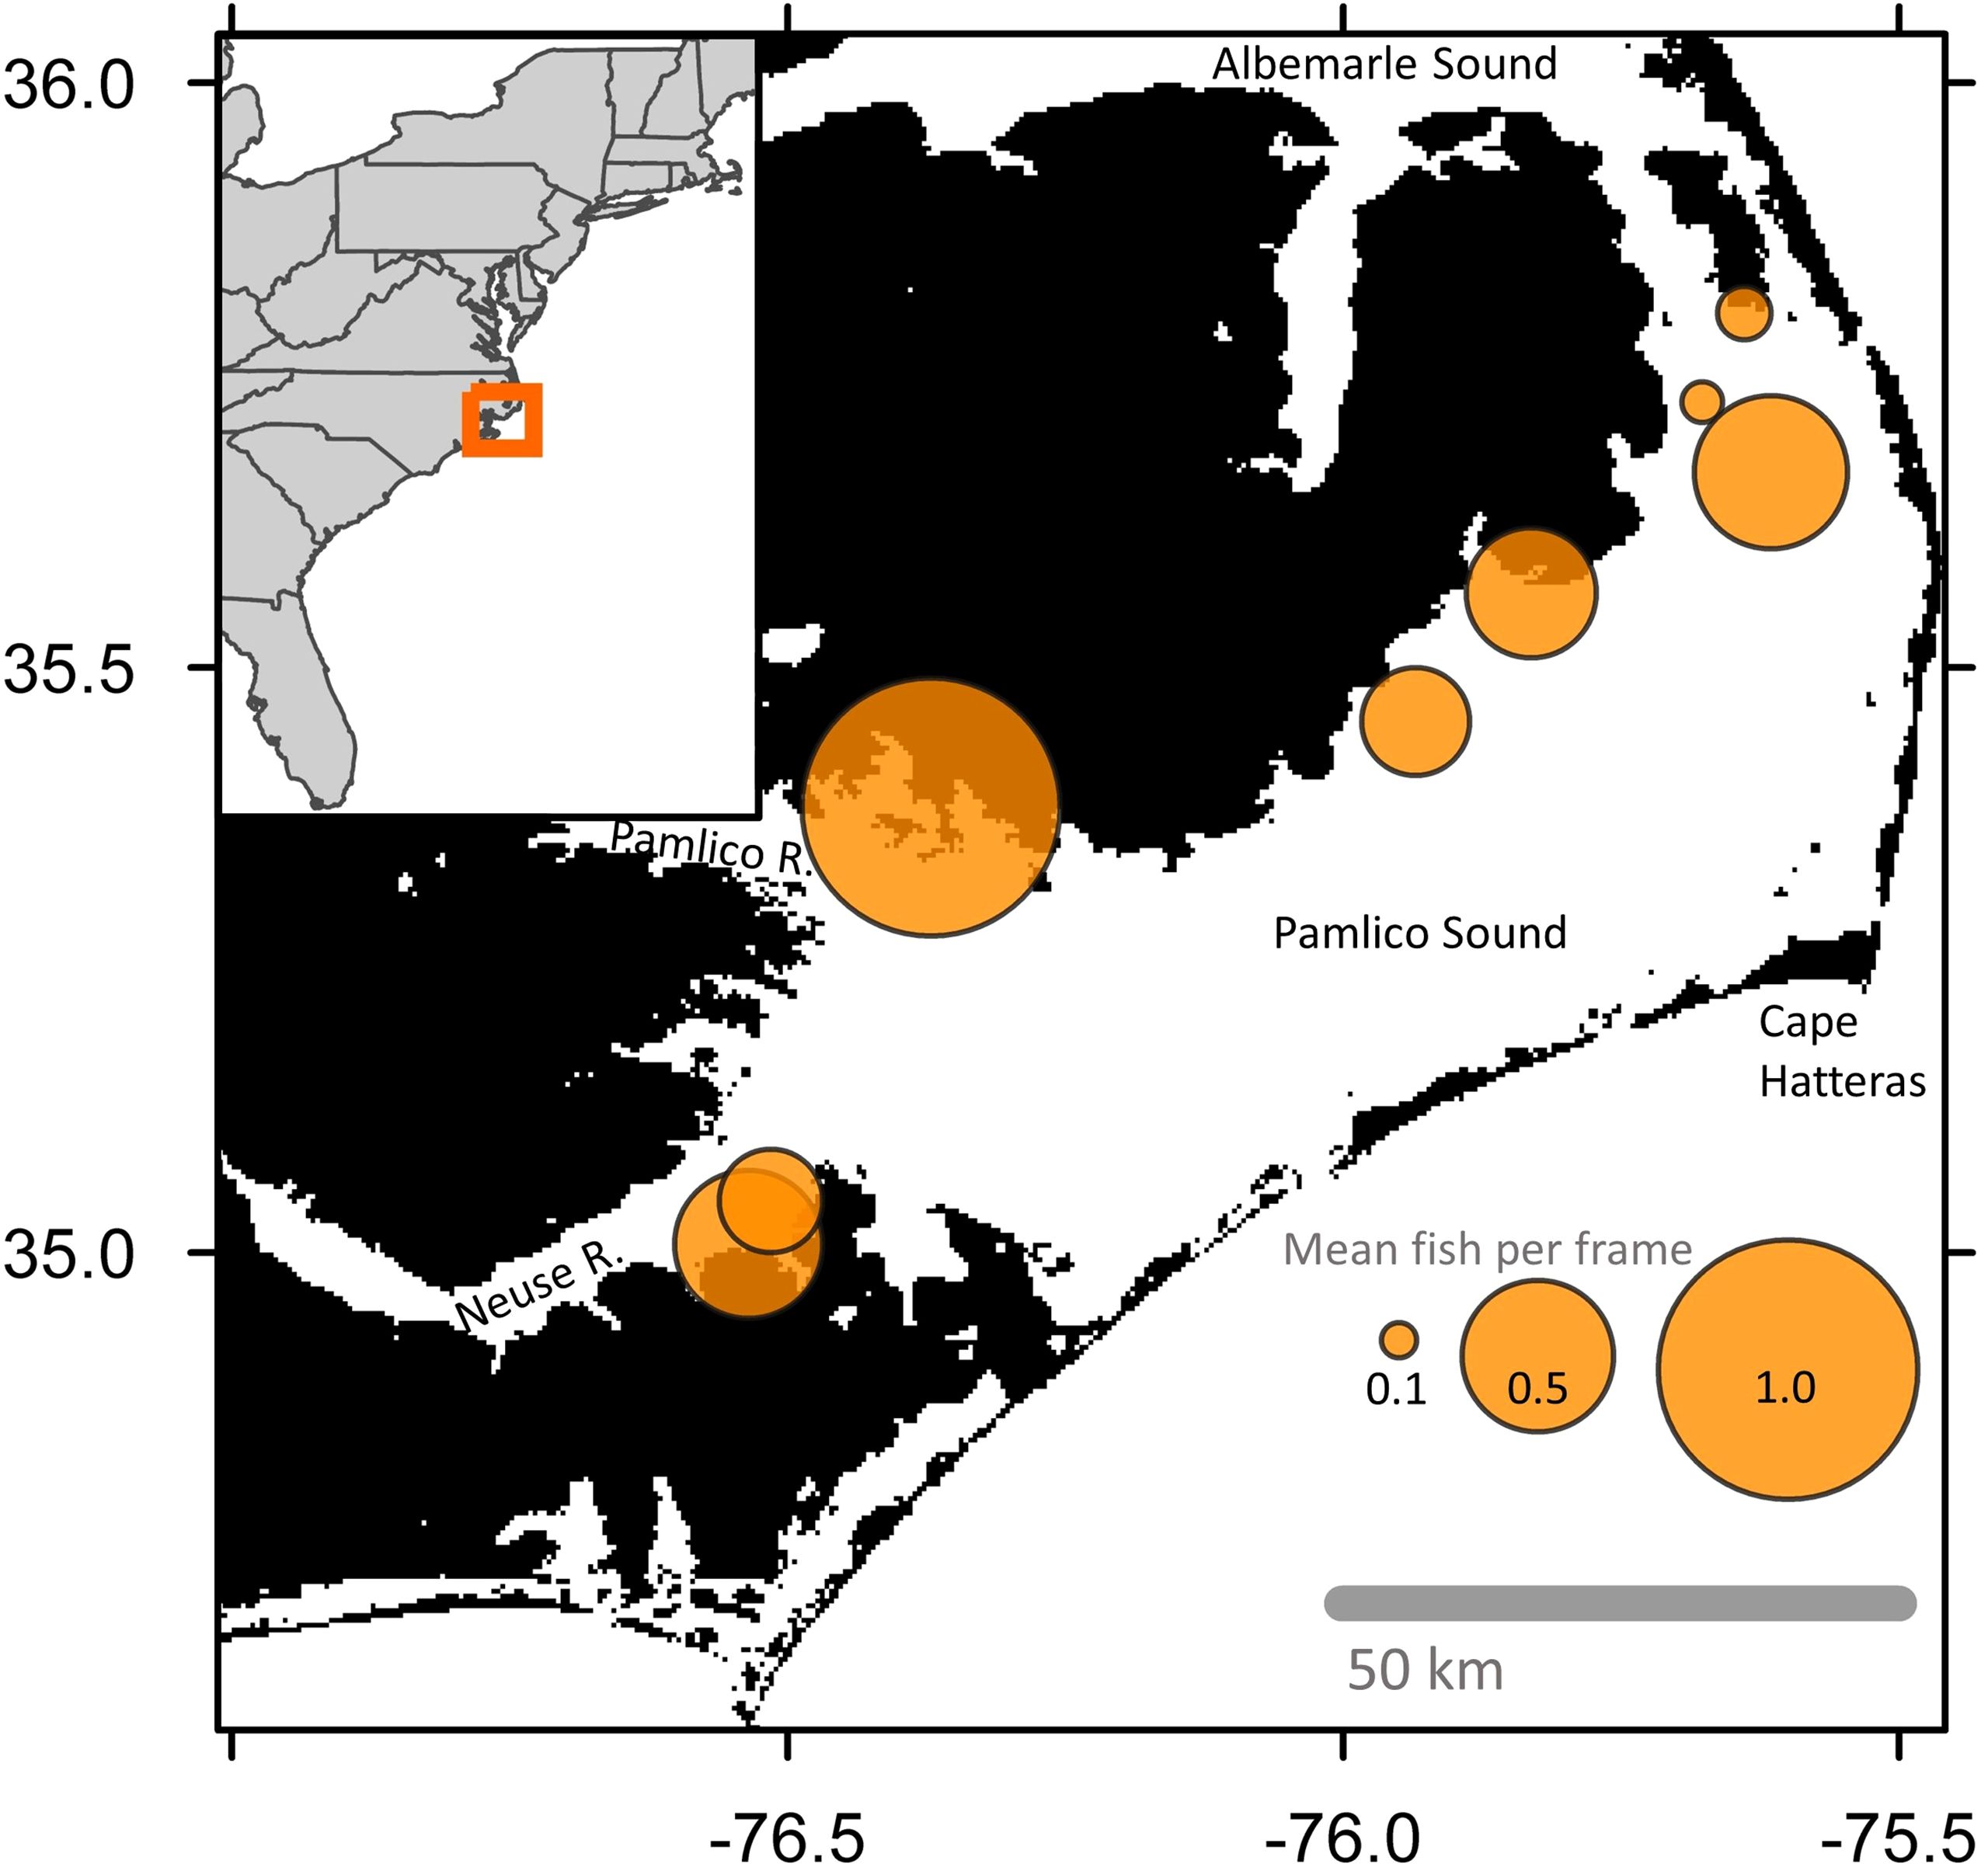
Figure 1. Map of Pamlico Sound and adjacent waterways in North Carolina, U.S.A. Orange circles are centered on the locations of each sampled oyster sanctuary, from north to south: Croatan, Crab Hole, Pea Island, Long Shoal, Gibbs Shoal, Deep Bay, Little Creek, and Neuse River. Size of orange circles are proportional to mean logged abundance for all samples taken within and adjacent to the oyster sanctuaries. The legend provides back-transformed abundance values. Map was generated with gridded bathymetry data at ~450 m resolution (GEBCO Compilation Group, 2023). Inset map of the U.S. Atlantic coastline made with ggplot2 (Wickham, 2016).
North Carolina’s Oyster Sanctuary Program started in 1996, with the goal of restoring subtidal oyster reef habitat for the eastern oyster (Crassostrea virginica) in Pamlico Sound (NCDMF, 2023). The network of oyster sanctuaries established through this program range in size from 10 to 80 acres. These completely subtidal restoration oyster reefs are composed of a variety of materials including natural oyster or clam shell, rip-rap or limestone marl, concrete reef balls, and recycled concrete or pipe (NCDMF, 2016). Each sanctuary is unique in arrangement and material types, with some using only one material and others using multiple materials laid out in distinct patches. The distance of the sanctuaries from the nearest shoreline varies from 200 m to 10 km. The goal of the oyster reef sanctuaries is to provide a productive-natural brood stock of adult oysters that will produce oyster larvae to distribute throughout Pamlico Sound (Peters et al., 2017; Theuerkauf et al., 2021). Recreational fishing is allowed within the oyster sanctuaries, but commercial gear is not.
2.2 Acoustic imaging of artificial reefs
Acoustic imaging technology was used to sample eight oyster sanctuaries and their adjacent featureless bottom in Pamlico Sound, and each site was sampled on only one occasion. Specifically, the Croatan and Deep Bay sanctuaries were sampled during June-July of 2022; during 2023 Long Shoal, Crab Hole, Pea Island, and Gibbs Shoal were sampled during May-June and in October Neuse River and Little Creek sanctuaries were sampled (Table 1). Mean depth ranged from 2.4 to 6.3 m among these sanctuaries, but varied little within each sanctuary. All sanctuaries were over 400 m from shore, with the exception of Deep Bay, which was ~200 m from shore and in a more enclosed bay. The initial construction date among the sanctuaries ranged from 1996 to 2016, although the older sites had been added to as recently as 2014 (NCDMF, 2016). A majority of the sanctuaries had multiple substrate types. However, Crab Hole and Neuse sanctuaries were composed only of rock-marl, and Long Shoal contained only reef balls (Table 1).
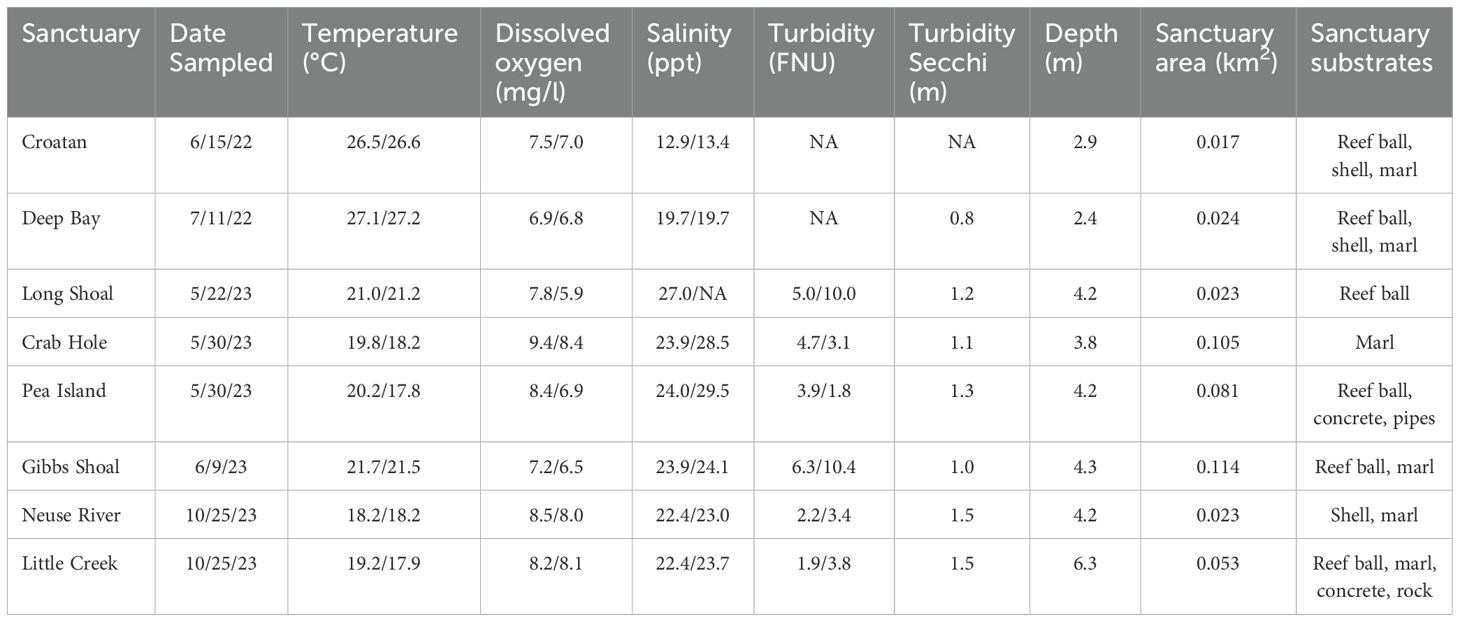
Table 1. Mean water quality data (surface/depth) and oyster sanctuary characteristics for each sampling date in Pamlico Sound, NC.
At each sanctuary, an ARIS Explorer 1800 was used to measure fish abundance and length structure (Sound Metrics Corporation, Bellevue, Washington, U.S.A.). Samples were taken at previously determined-fixed positions along two transects bisecting each sanctuary, following the approach used by Able et al. (2013). Each transect contained 13 fixed positions along a straight line, with one transect running approximately north to south and the other oriented perpendicular from east to west (Figure 2). Each transect had the following sampling positions: 200, 150, 100, 10, edge, first-quarter, middle, third-quarter, edge, 10, 100, 150, 200; where numeric values indicate locations outside of the sanctuary (in meters from sanctuary edge) and text-positions describe relative points within the sanctuary boundaries, which were determined using digital maps of the sanctuaries (NCDMF, 2016). Because the sanctuaries varied in size, the interior sampling distances from the edge varied by sanctuary, while the distances outside of the sanctuaries were consistent. The GPS sampling points along each transect were inputted into the boat’s navigation system prior to sampling. The ARIS was fixed to an aluminum pole-mount on the starboard-side stern of the vessel, and the sampling face of the instrument was ~0.5 m below the surface. The ARIS was mounted to an AR2 Rotator and set to a vertical orientation (i.e., aimed straight down), which improved detection ability of fish near the bottom and adjacent to reef structures. ARIS sampling points were two minutes in duration, during which time the vessel was held in position using a GPS-locked trolling motor mounted to the port-side bow of the vessel. ARIS sampling frequency was 1.8 MHz, and typically sampled at 15 frames per second, with a typical minimum target resolution between 3 – 4 mm. The sampling area of seafloor varied among regions based on depth and the expanding nature of the ARIS imaging area, ranging from 0.75 m2 at 2.5 m depth to 4.3 m2 at 6.5 m depth (Figure 3).
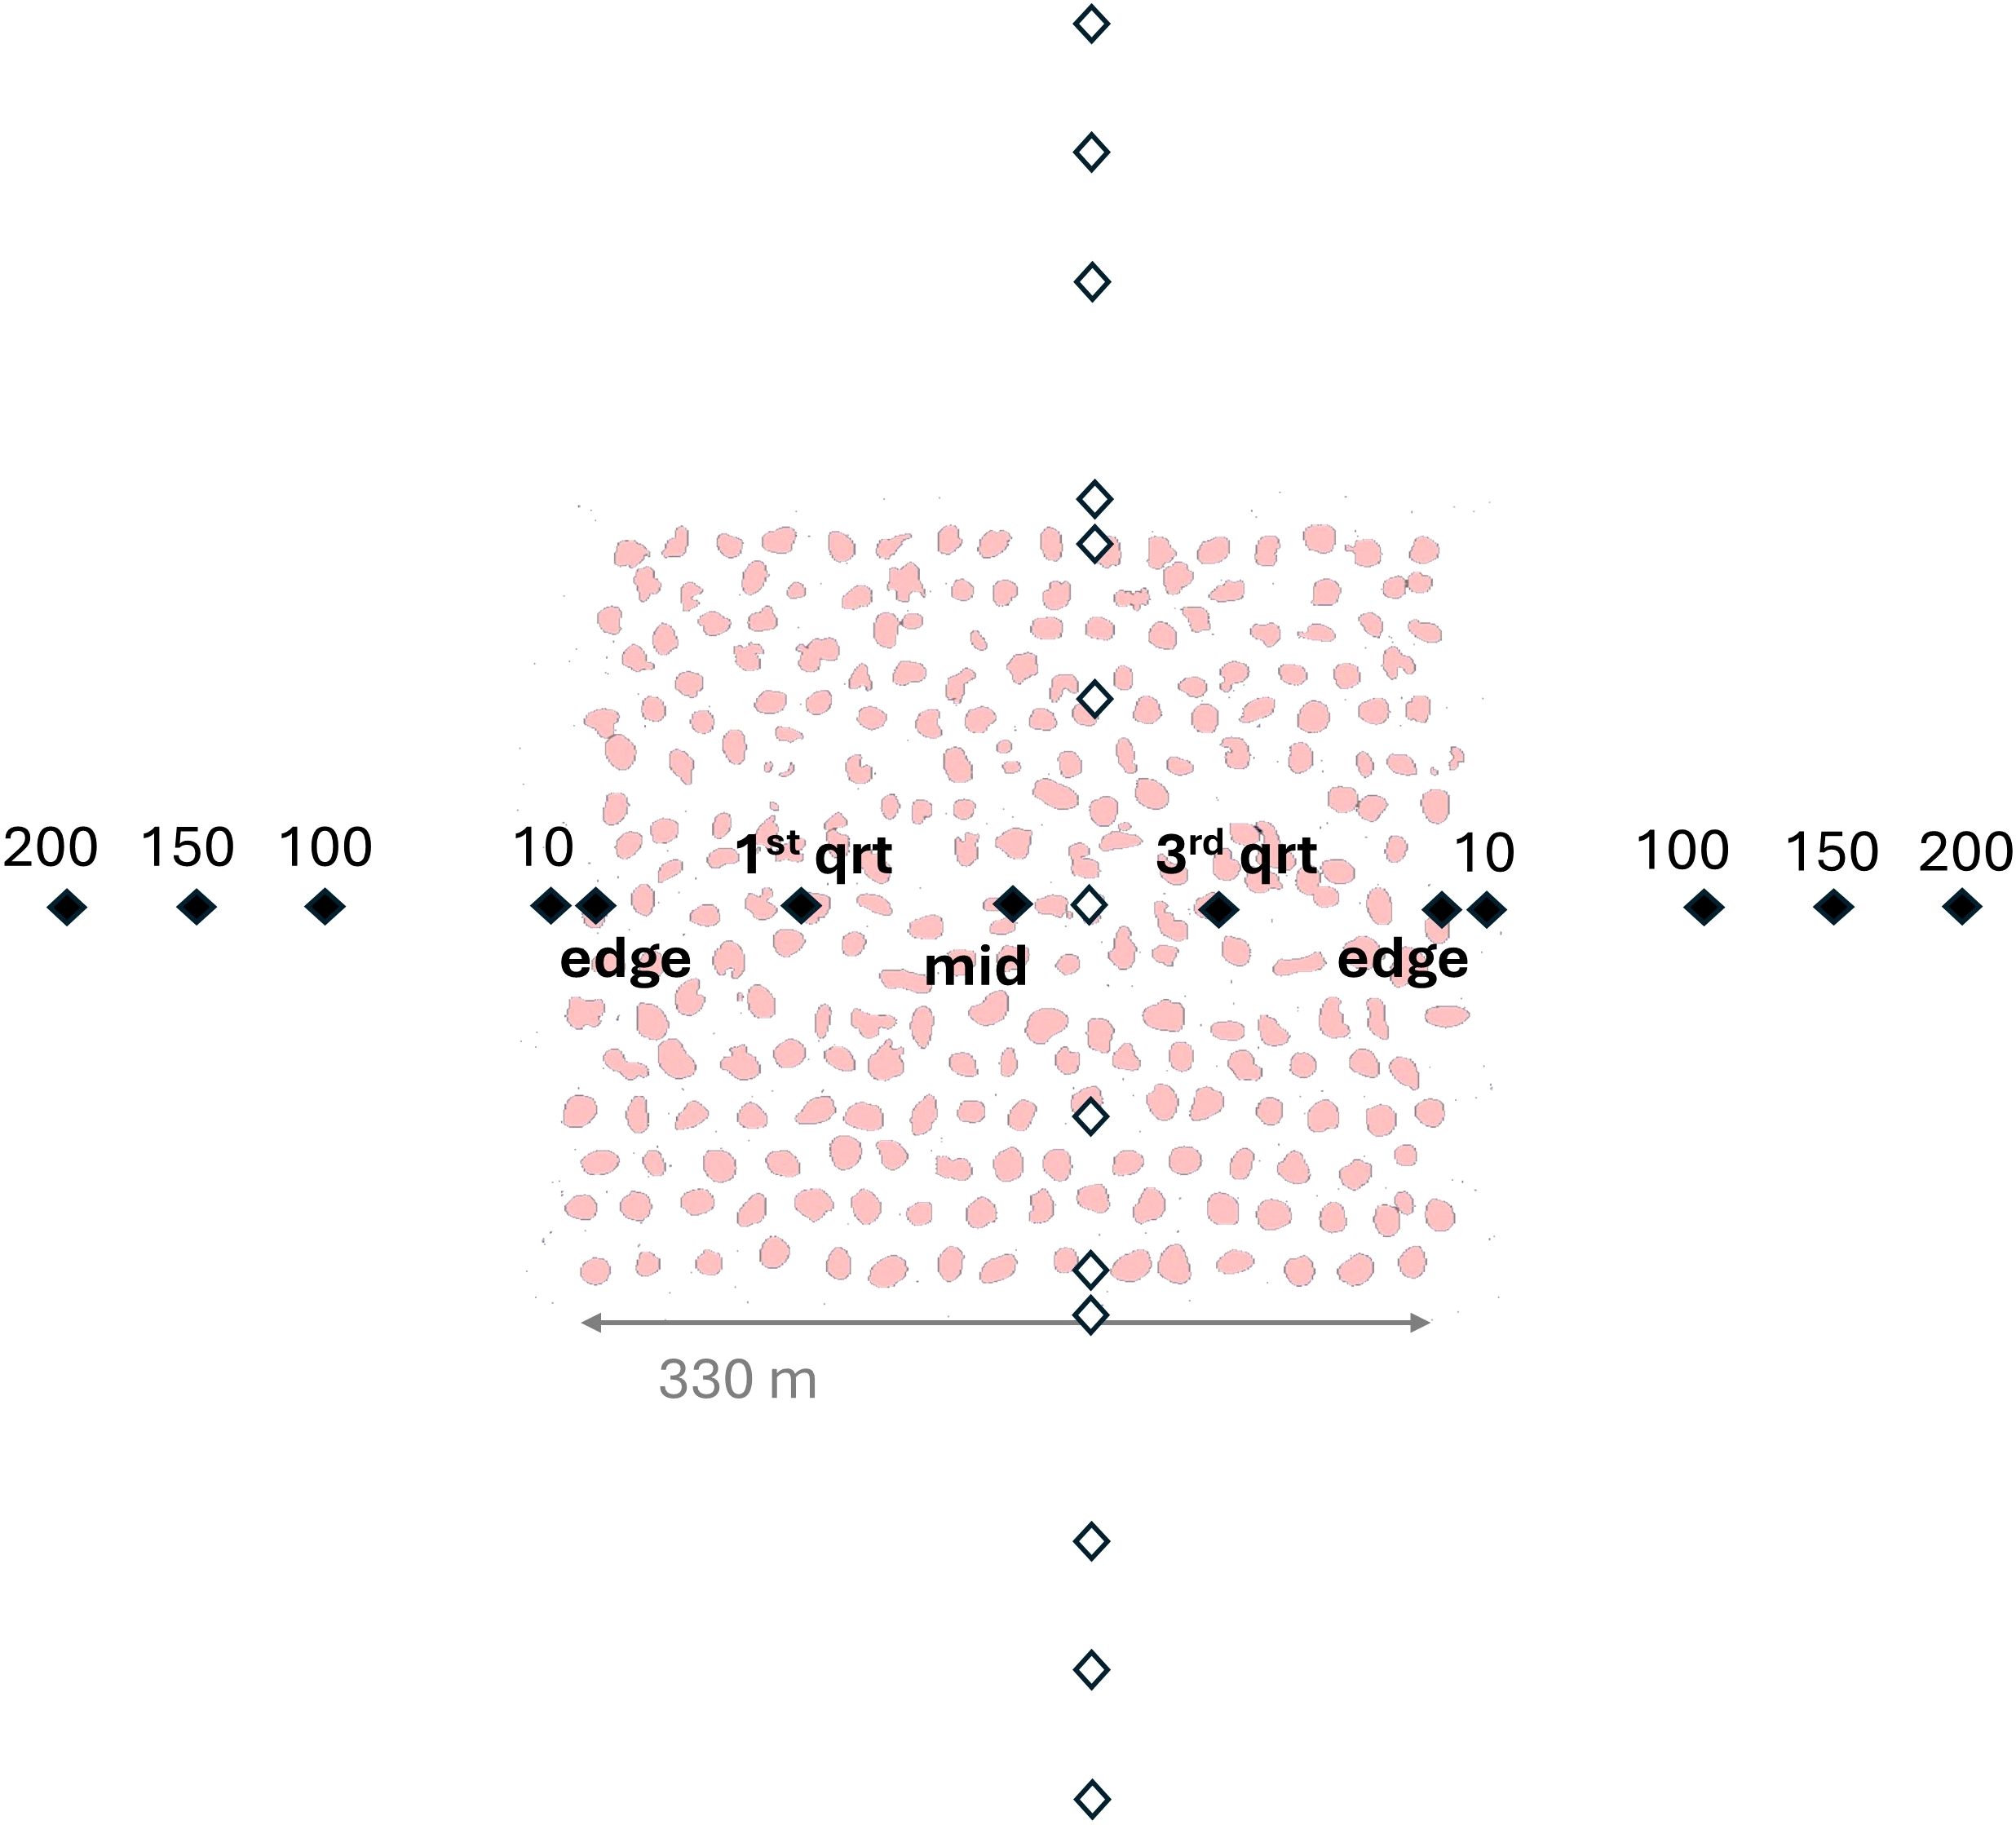
Figure 2. Diagram of sampling design where black points and labels represent sampling positions along the east-west transect and white points represent the north-south transect. Pink shapes represent structures within the oyster sanctuary and for this example are based on the Crab Hole sanctuary, which was comprised entirely of rock-marl substrate.
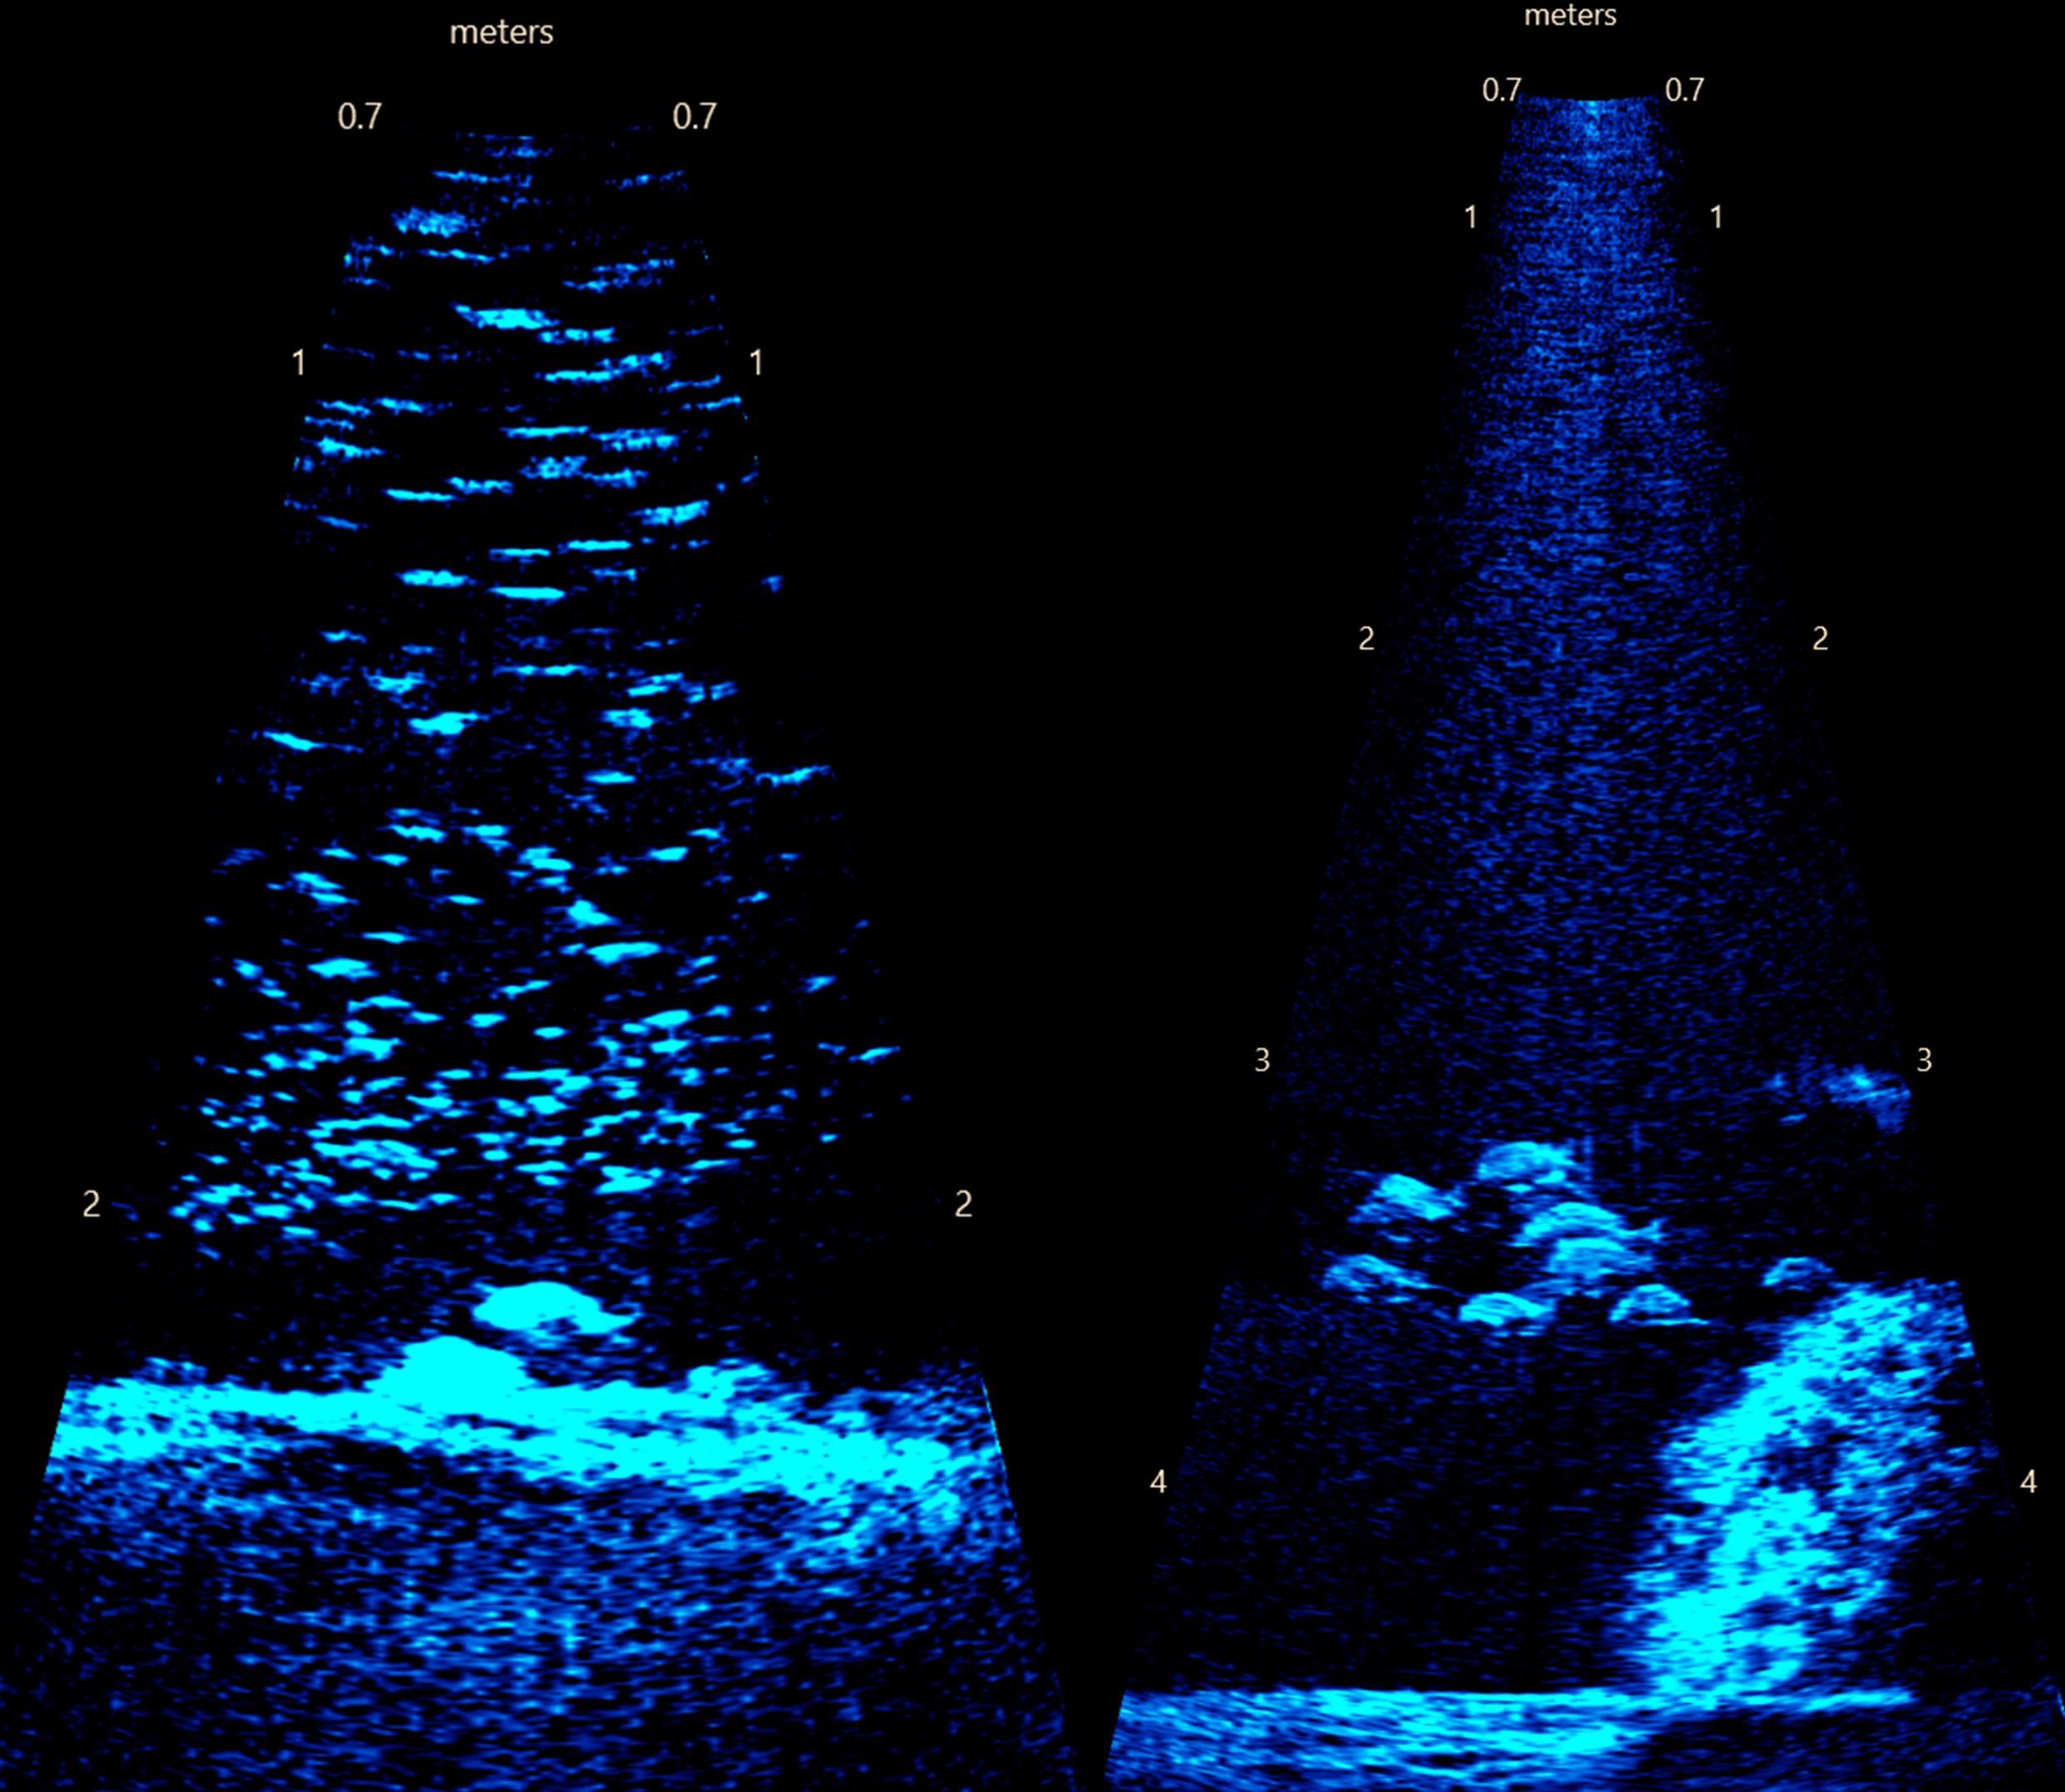
Figure 3. Example frame images from acoustic imaging. (left) Deep Bay sanctuary (depth ~2.2 m) showing rocks artificial substrate and a large prey school where the subsampling protocol was used. Also visible is a larger fish near the bottom, which was included separately from the subsampling of small fish. (right) Long Shoal sanctuary (depth ~4.3 m) showing reef ball substrate.
Water quality samples were taken at a portion of the fixed sampling positions at both surface (~0.5 m depth) and bottom (within 1 m of bottom) depths using a handheld water quality meter equipped with temperature, salinity, dissolved oxygen, turbidity and depth sensors. Surface turbidity was also measured with a Secchi disk (Table 1). The recording frequency of water quality varied over time, ranging from 3 or 4 samples during 2022 to approximately every other fish sampling position in 2023 (N ~ 14). Water quality varied little among sampling positions and daily mean surface and bottom values were calculated across all water quality samples (Table 1).
2.3 Acoustic imaging data processing
Each acoustic imaging sample consisted of a digital video file and echogram from a 2 min recording (Figure 3). Hereafter, the term “sample” is used to represent this 2 min ARIS file taken at each boat position within a given transect and oyster sanctuary (N = 26 per sanctuary, except N = 20 for Gibbs Shoal, which was not completely sampled due to inclement weather). Species identification was not possible, so our analyses focused on abundance and length structure of the fish community. Each ARIS sample was comprised of a series of ~1800 frames. For each sample, ten random-frame subsamples were selected using R software (R Core Team, 2020); randomly selected frames were unique for each sample and adjacent frames were not allowed to be within 50 frames of each other (~3.5 seconds), which was intended to increase independence among subsamples (Smith et al., 2021; Munnelly et al., 2024). Hereafter, these random subsamples are referred to as “frames” and were examined for fish abundance and lengths of all individuals present, which were counted and measured manually using ARISFish software (ver. 2.8, Sound Metrics Corporation). To get the most accurate measurement of length, a buffer region of 10 frames on either side of the designated frame was examined and the clearest of those frames was chosen for measurement of any given fish. For example, if the randomly selected frame was number 104 but the lateral profile of a fish on this frame was not fully visible, frames 94-114 would be used instead to obtain a better angle for fish measurement. However, any additional fish that came into view within the buffer region were ignored. We assumed that any nekton visible in the ARIS imagery represented a fish. While no obvious invertebrates were detected during our study, we acknowledge that invertebrates (e.g., squid, shrimp) might occasionally be misclassified as small fish. There was minimal drifting detritus in our sampling areas and water currents appeared to be minimal. The type of habitat or bottom substrate present was noted for each sample and categorized as either Rocks, Reef Balls, or Bare (Figure 2). Rocks substrate could represent anything from a small amount of rubble or shell material present on the bottom to large piles. Reef Balls that we observed were identical in dimensions among sanctuaries and consisted of ~1 m high dome shaped concrete structures permeated with several large holes. Bare substrate occurred outside of the sanctuaries, but also was common in sanctuary interiors (i.e., between artificial structures).
On rare occasions, if there were large numbers (> 50) of small prey fish in a frame, a subsampling protocol was used. First, a grid system was laid over the frame, which is an option within ARISFish software, and a random number generator was used to select a cell from each row of the grid containing fish. The fish in those cells were then counted and the total number was extrapolated based on the number of cells occupied. Additionally, ten random fish were measured from the prey school and the mean length from those ten was used to represent the entire school (range in mean length when subsampling used was 4.1 to 8.7 cm; mean was 6.1 cm). This subsampling protocol was used for only 21 individual frames, from 10 different samples (i.e., multiple samples had more than one frame requiring subsampling) and three different sanctuaries (Deep Bay, Long Shoal, and Gibbs Shoal).
2.4 Statistical analyses
2.4.1 Mean abundance and length versus distance from artificial reef edge
Mean log fish abundance was calculated for each sample by natural log transforming the fish count in each of the ten random frames (first adding 1 to allow transformation of zero values) and then those ten frames were averaged within a sample. Fish abundance data were log transformed because the data were strongly skewed due to occasional high fish densities. Fish length was treated in a similar manner as the count data. First, if multiple fish were present on a randomly selected frame, then these lengths were averaged together. Next, all frames where fish were present within a sample were averaged in order to get a mean length value per sample. For this approach, frames with zero fish were ignored. For both mean fish abundance (logged) and mean fish length we used linear mixed effects models with the nlme package in R to examine the effects of distance from the sanctuary edge (Pinheiro et al., 2023). Initially, generalized additive mixed models were attempted, but these resulted in linear fits, so the simpler linear mixed effects option was used. Two models were fit for each variable (i.e., abundance and length), the first included sanctuary as a random effect on the intercept and the second allowed the linear relationship to vary randomly among sanctuaries. Including sanctuary as a random effect was important, as overall abundance per frame can vary due to sanctuary location and date of sample, and also due to depth varying among regions, which affects the ARIS sampling area. AIC was used to choose between the two model options for each variable (Burnham and Anderson, 2002). Based on model diagnostics both mean log abundance and length had non-normal residual error distributions. Therefore, we did not evaluate the above regression models with parametric statistics. Instead, final model significance was evaluated by performing 1000 bootstrap samples of the data to estimate 95% confidence intervals for the effect of distance from sanctuary edge on mean abundance and length; if confidence intervals did not overlap with zero (i.e., a slope of zero would indicate no effect), then we considered the effect significant.
2.4.2 Monte Carlo analysis for edge effects
The linear regression analysis described above would not effectively determine if there was an “edge effect” of the sanctuaries, where abundance might be higher at the boundaries or just outside of the sanctuaries. Therefore, to test for an edge effect we grouped the mean log abundance data into the following categories based on their sampling location: interior (N = 47; first quarter, middle, and third quarter samples); edge (N = 31; samples at distance = 0 m); outside (N = 30; samples at distance = 10 m); control (N = 94; samples at 100, 150 and 200 m). Residual error was not normally distributed and variance differed among treatment groups, so we used a Monte Carlo resampling procedure to assess the difference in mean abundance between adjacent groups (i.e., interior vs. edge; edge vs. outside; outside vs. control). Specifically, for each of these pairwise comparisons samples were reclassified among the two groups at random, while preserving initial sample sizes, and a null distribution of no difference in mean abundance between groups was generated (N = 1000 iterations). The observed difference between the groups was then compared with this null distribution to calculate a P value and assess significance (Gotelli and Ellison, 2013).
2.4.3 Effects of substrate type
In addition to examining large-scale patterns in abundance and length across the sanctuary boundaries, the data were also trimmed to include only the samples within the sanctuary, including edge positions. With this data subset, mean log fish abundance and mean length were compared across the specific habitat types recorded (bare, rocks, and reef balls) using mixed effects ANOVA with sanctuary as a random effect on the intercept; models were fitted and evaluated using the nlme and car packages in R (Fox and Weisberg, 2019; Pinheiro et al., 2023).
2.4.4 Size spectra analysis
The above analyses for abundance and length use mean values, aggregated within frames and then averaged for each sample. Mean values among frames were used, as opposed to using the sum, to prevent bias associated with double counting and repeatedly measuring fish that maintain position during a sample. While using mean values is useful for assessing the significance of broad trends, much information on the length structure of the assemblage is concealed. For example, schools of smaller fish can drive the observed variation in mean lengths. Therefore, to visualize differences in size spectra of the fish community inside versus outside of the sanctuaries, we used the following data resampling procedure. One of the ten random frames from each sample was chosen at random. This produced a set of 202 random ARIS frames, which represents 26 samples at seven oyster sanctuaries, plus 20 samples from Gibbs Shoal Sanctuary (Gibbs Shoal not completely sampled). To get equal representation from samples inside the sanctuary (including edge samples) versus outside, we randomly dropped six of the outside samples for each sanctuary. This reduced the set of sampled frames to 156, ten inside and ten outside samples for each sanctuary, except for Gibbs Shoal, which had eight inside and outside. This process was repeated 1000 times, each iteration producing a unique-random set of ARIS frames. For each iteration, the total number of fish within 5 cm length bins was recorded for both inside and outside sanctuary positions. Thus, for each length bin we were able to compare distributions of 1000 potential outcomes from a random set of frames from 78 samples inside sanctuaries and 78 outside sanctuaries.
The above iteratively resampled dataset was used to conduct a size spectra analysis. We fit a generalized additive model (GAM) with the mgcv package (Wood, 2011) to the length frequency data using the form,
where frequency represents the number of fish for iteration i (N = 1000) within length bin j, at location k (categorical variable, inside versus outside sanctuary) and εijk is residual error. A value of 1 was added to frequency before log transformation to include iterations with zero fish in a length bin. s represents a smooth-spline function and k sets an upper limit on the degrees of freedom for the smoothed term (i.e., curviness), and ti fits a tensor product smoothed term, where the effect of length can differ between the two locations. The 5 cm length bin was omitted from the above model to be consistent with most size spectra analyses, which examine the monotonic decline in abundance of individuals from small to large body sizes (Dunn et al., 2023; Olson et al., 2023; Letessier et al., 2024). Further, fish in the 1-5 cm length bin are probably missed at a higher frequency compared to larger individuals by ARIS analysts (i.e., greater observer bias; Wei et al., 2022).
3 Results
Length estimates of 4716 individual fish, across 202 discrete positions within eight oyster sanctuaries in Pamlico Sound were obtained through acoustic imaging. Generally, fish length varied by an order of magnitude on any given sampling date (Table 2). Mean log abundance of fish varied among oyster sanctuaries by over a factor of 5 (Figure 1; Table 2). With the exception of Little Creek sanctuary, fish abundance was always higher inside the sanctuary compared to outside. Water quality varied greatly among locations. For example, water temperature varied by 9°C, which reflects the large range in sampling dates. Salinity was generally above 20 ppt, although the Croatan sanctuary had a mean bottom salinity of 13.4. Dissolved oxygen (DO) never approached hypoxic conditions, although on certain dates bottom DO was notably lower than surface conditions (Table 1).
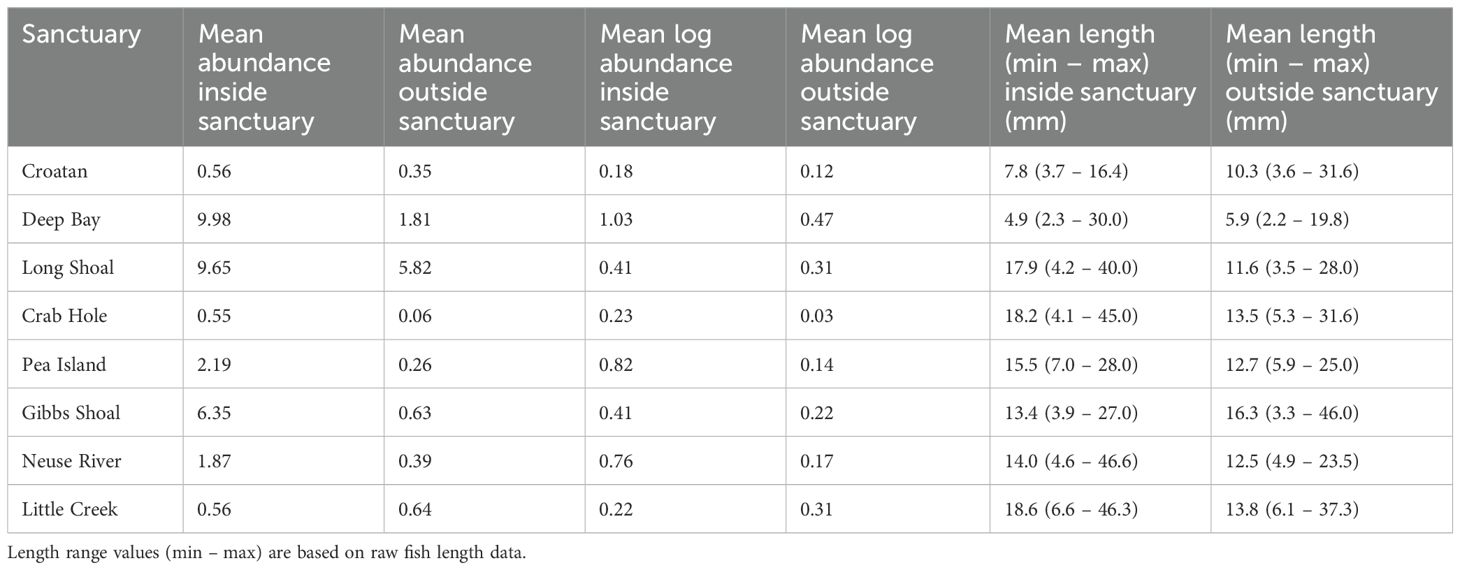
Table 2. Mean fish abundance and logged abundance per ARIS frame, and mean length per sample, within and outside of each oyster sanctuary.
3.1 Mean abundance and length versus distance from artificial reef edge
For examining the effect of distance from sanctuary edge on mean log fish abundance, the model that allowed the slope of the relationship to randomly vary among sanctuaries was selected as the most parsimonious (AIC = 306.7 vs. random intercept model AIC = 309.3). There was a negative relationship between fish abundance and distance from the sanctuary edge, supporting the hypothesis that abundances are higher within sanctuary boundaries (Figure 4). This negative relationship was significant, based on the bootstrapped 95% confidence interval for the regression slope (95% confidence interval: -0.0019, -0.0006; r2 = 0.20).
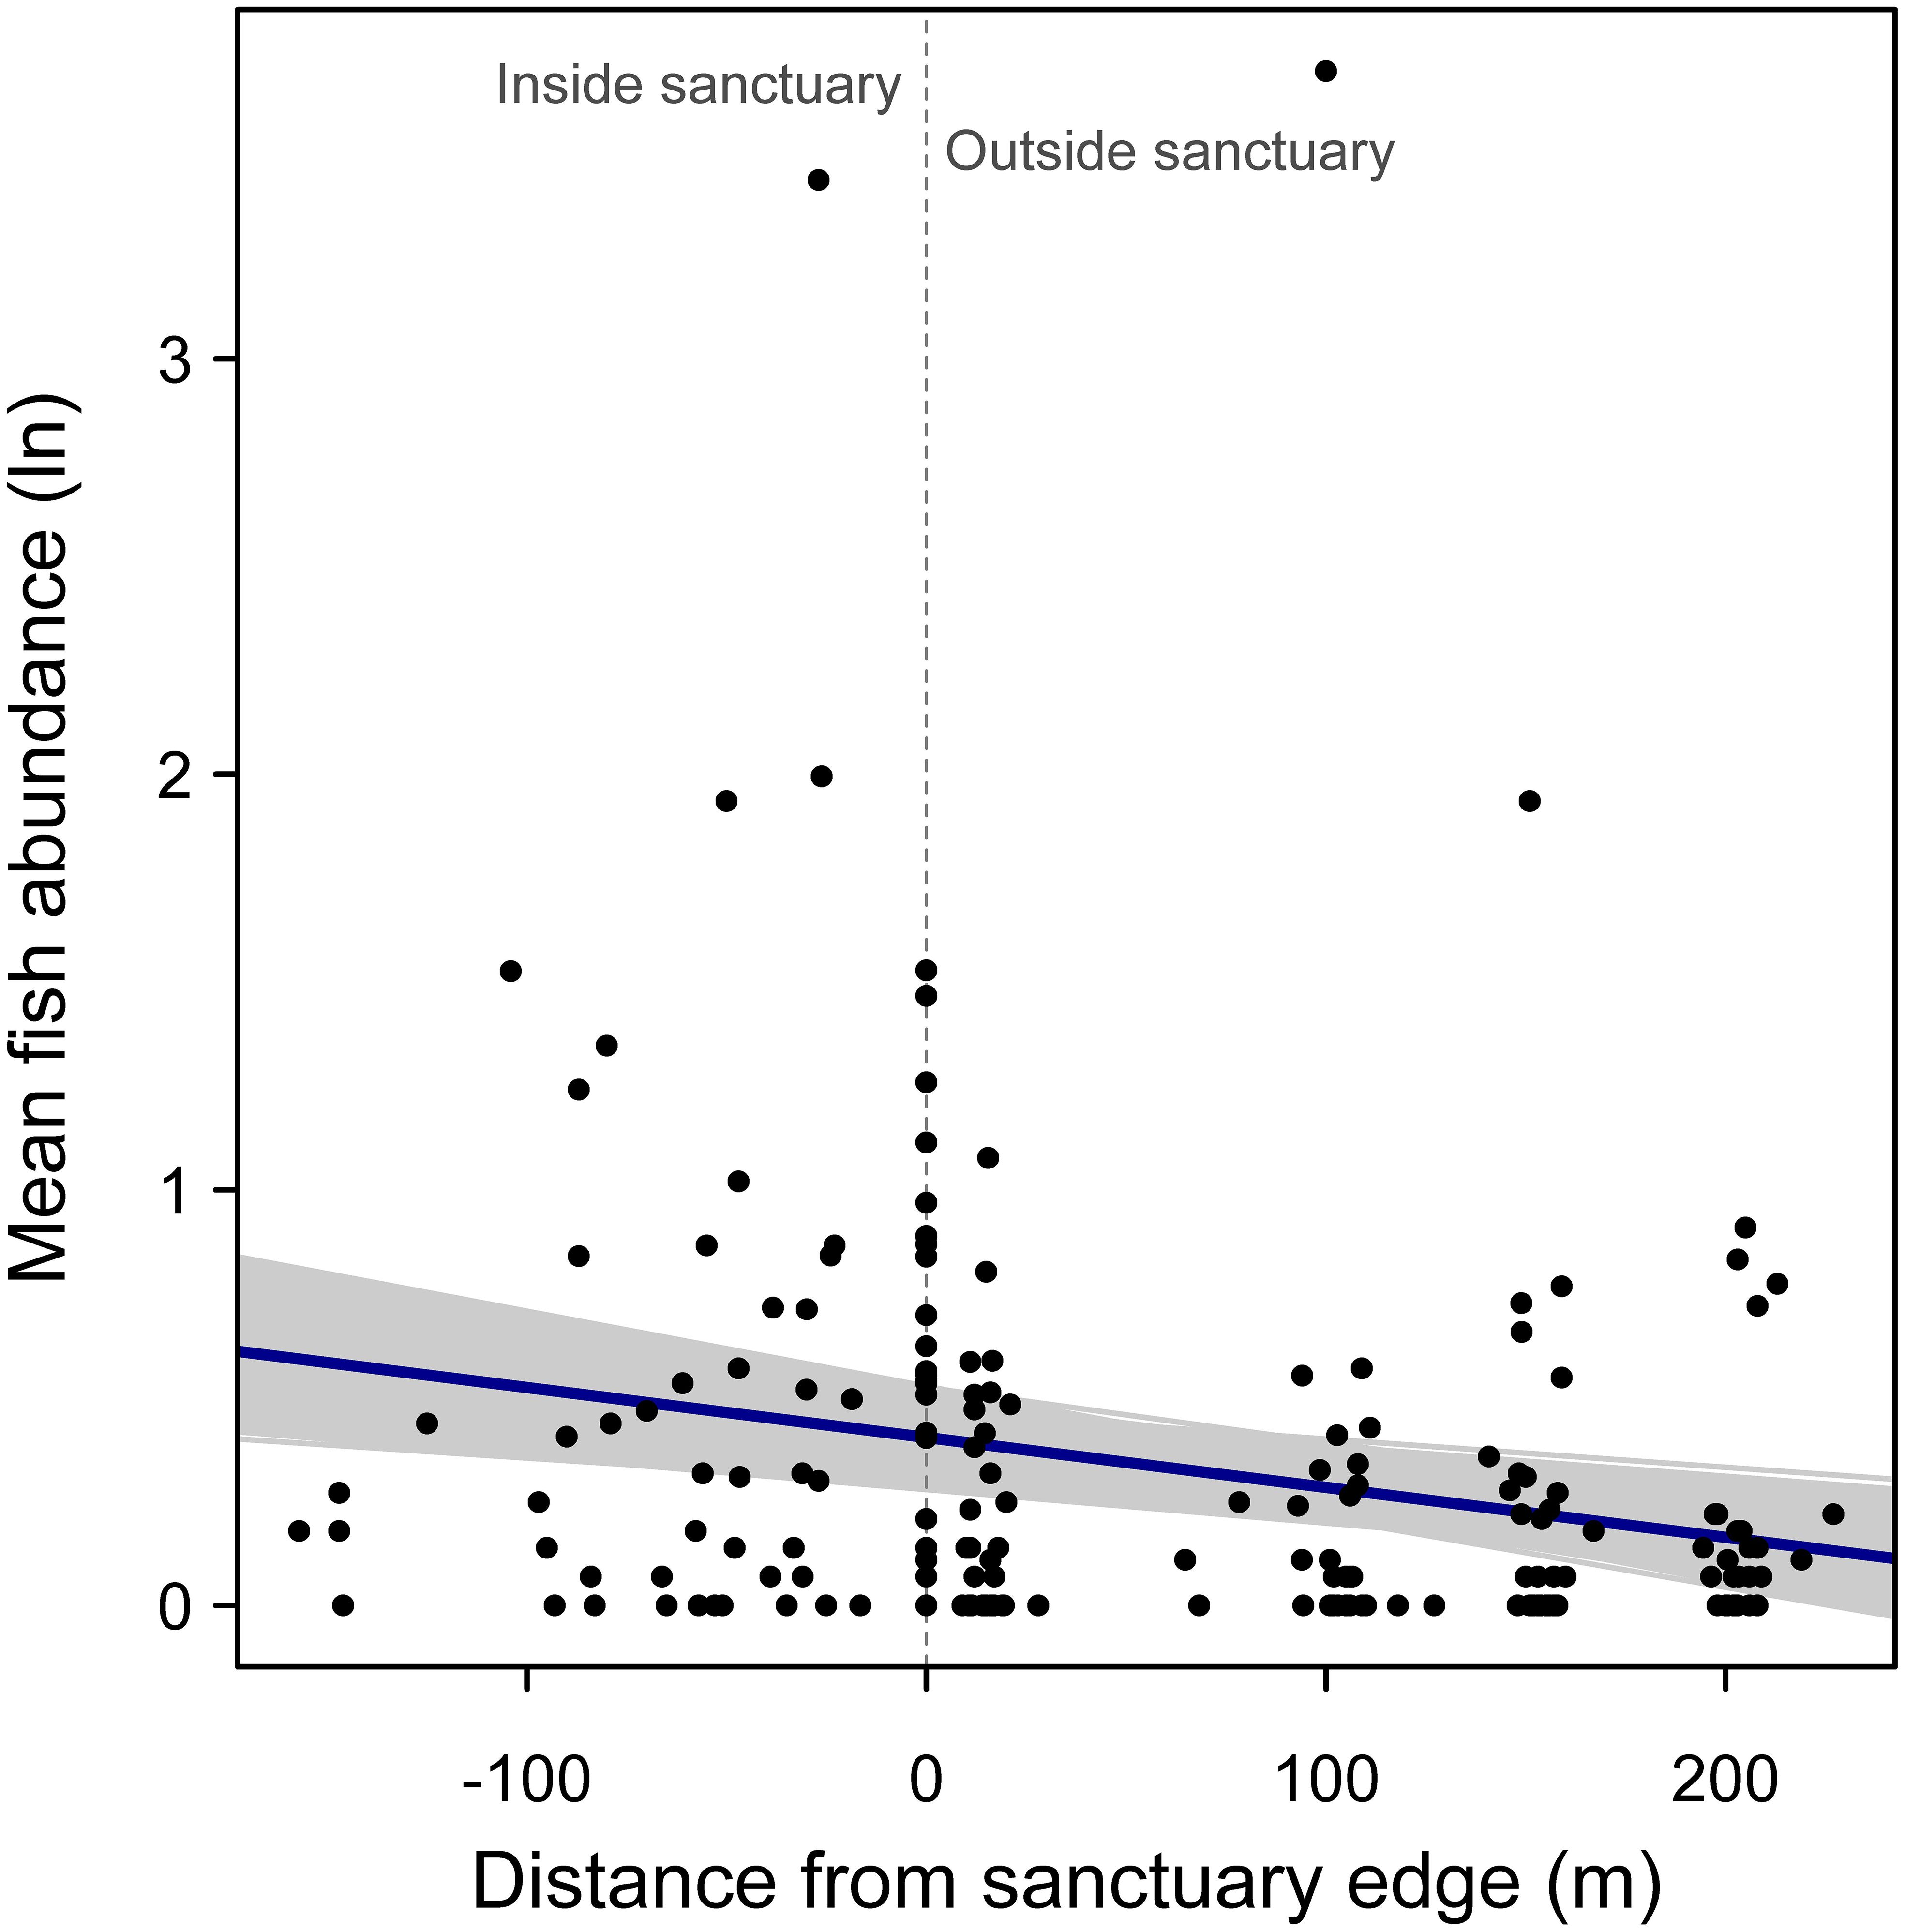
Figure 4. Random effects regression model of mean logged fish abundance versus distance from oyster sanctuary edge, where a value of zero on the x-axis indicates samples taken at edges of the artificial reef, and positive and negative values indicate sampling positions outside and inside the sanctuary, respectively. Gray regression lines represent 1000 bootstrapped regression models.
For examining the effect of distance from sanctuary edge on mean fish length, both models performed similarly (random slope model AIC = 908.7 vs. random intercept model AIC = 907.9) and so the simpler model with a random intercept was selected. There was a negative relationship between mean fish length and distance from sanctuary edge, supporting the hypothesis that fishes are larger on average within sanctuary boundaries (Figure 5). This negative relationship was significant, based on the bootstrapped 95% confidence interval for the regression slope (95% confidence interval: -0.0262, -0.0069; r2 = 0.27).
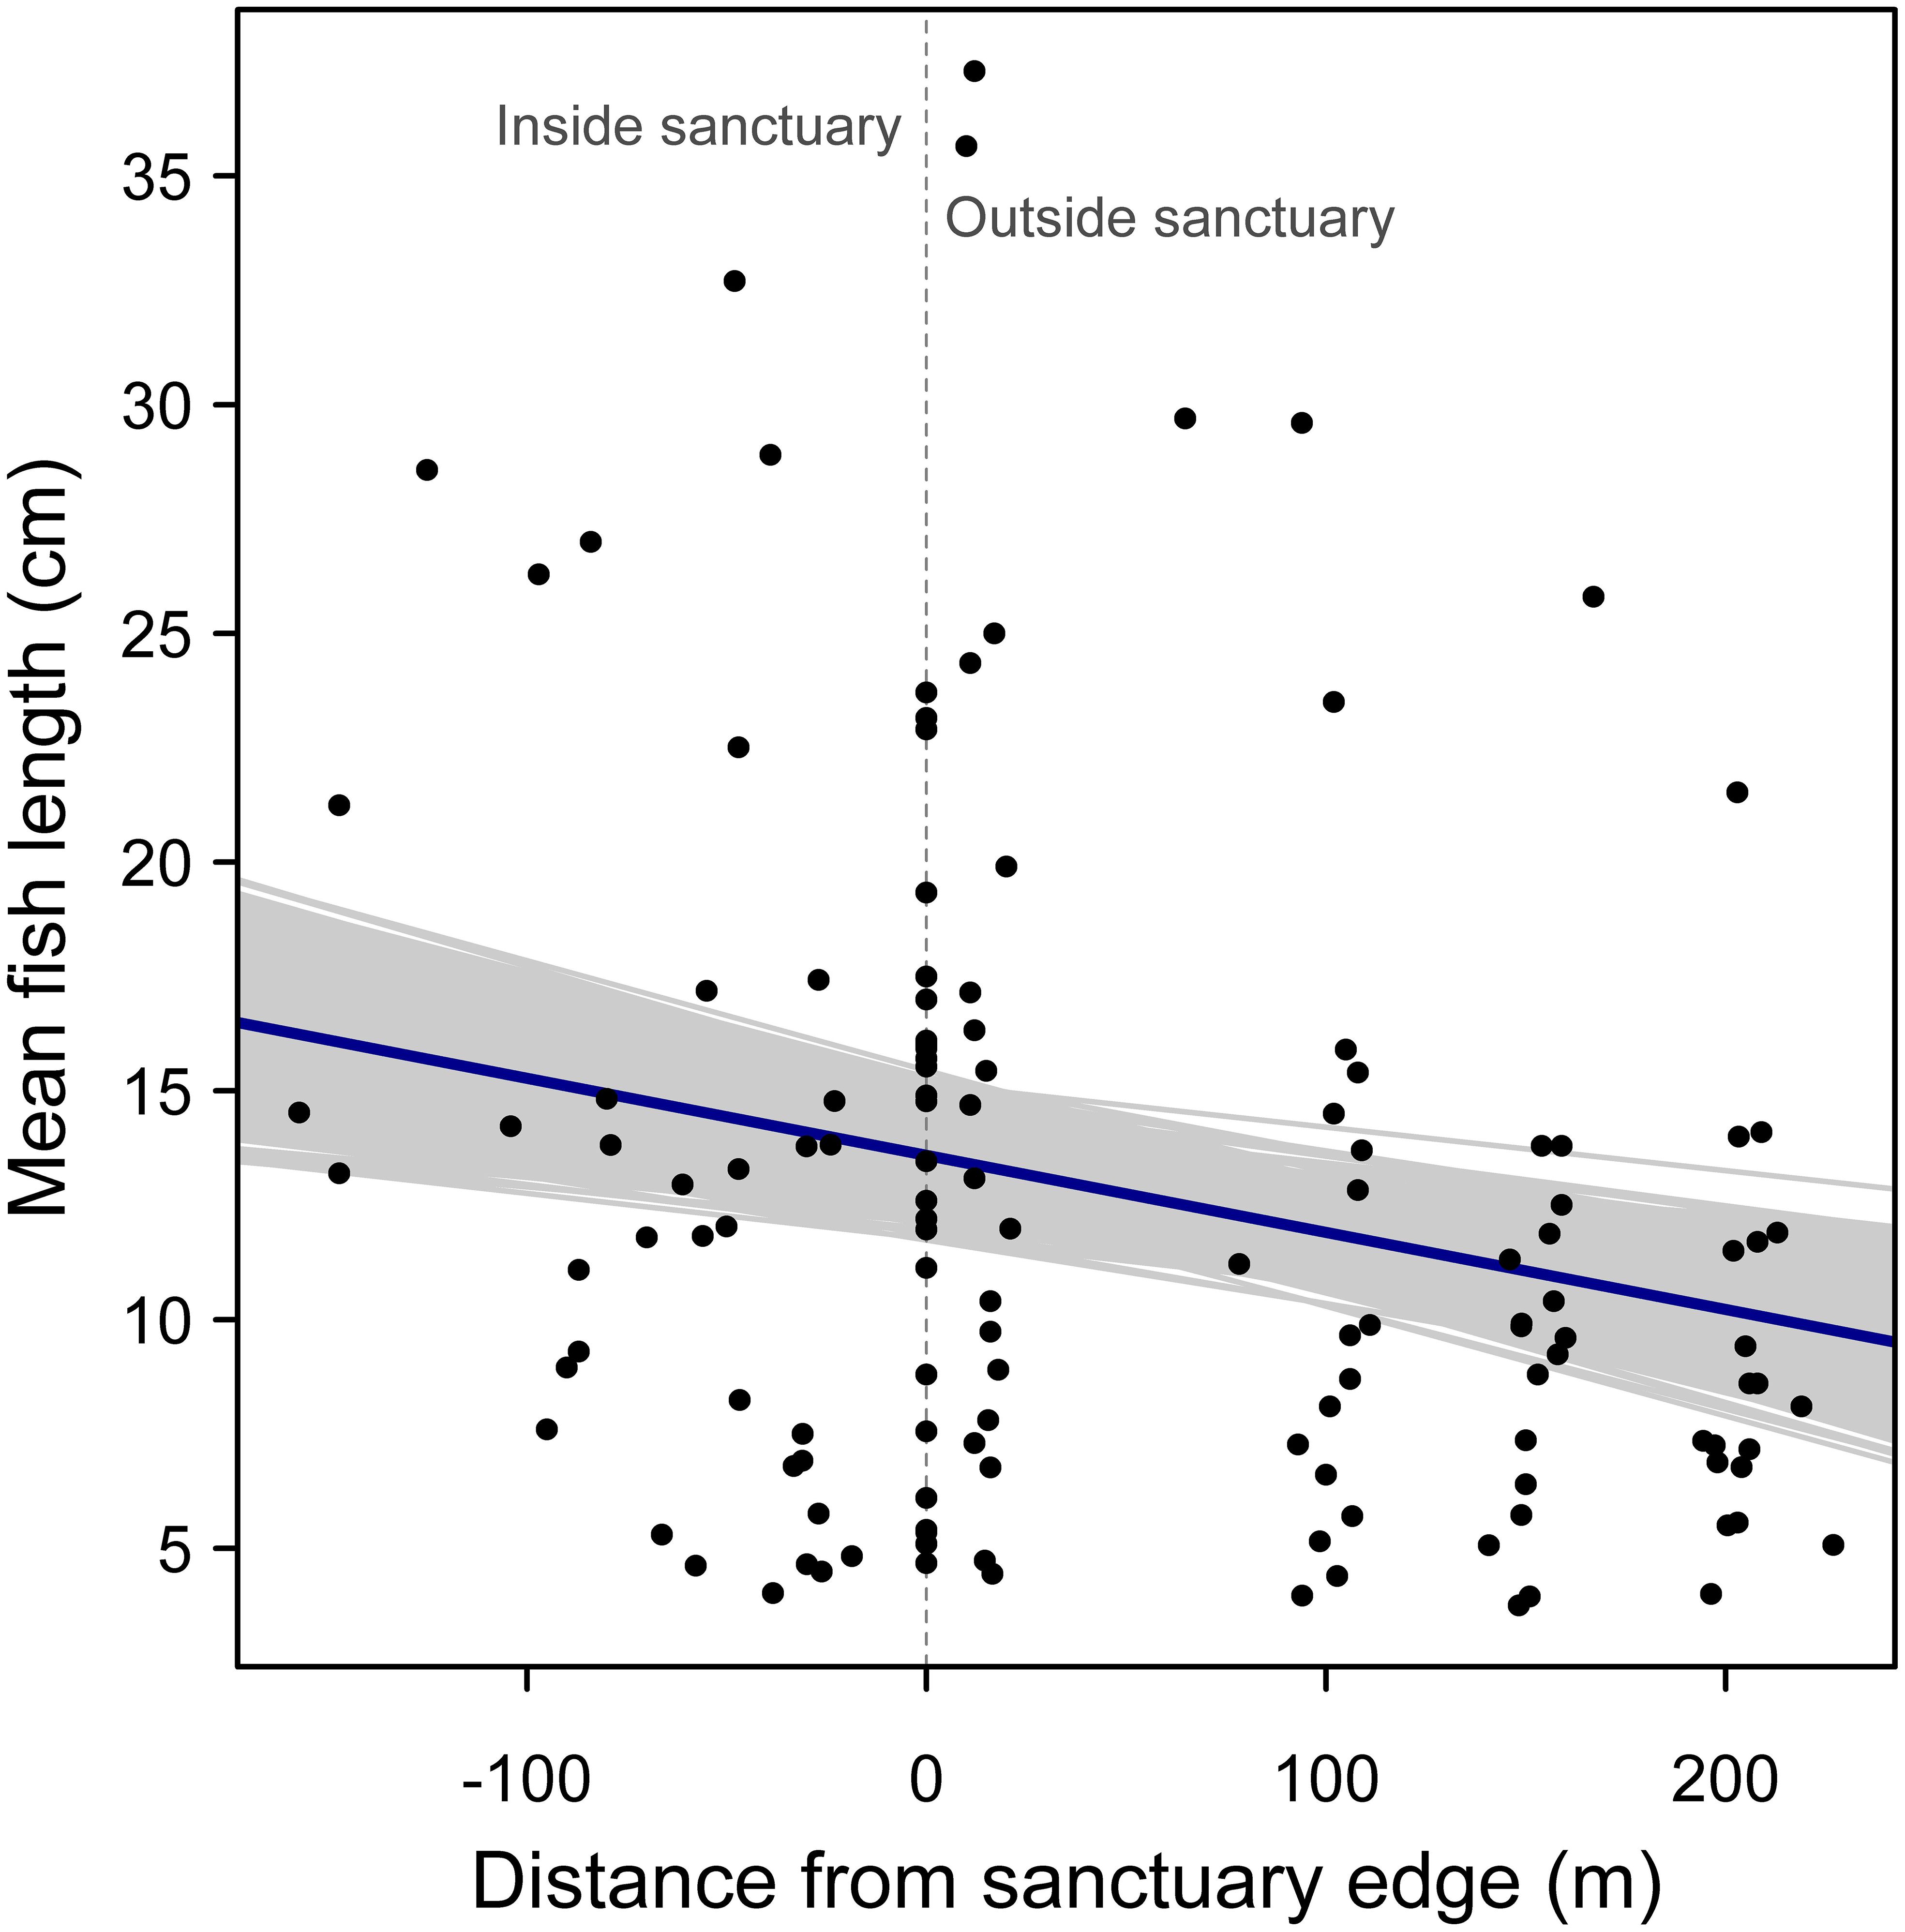
Figure 5. Random effects regression model of mean fish length versus distance from oyster sanctuary edge, where a value of zero on the x-axis indicates samples taken at edges of the artificial reef, and positive and negative values indicate sampling positions outside and inside the sanctuary, respectively. Gray regression lines represent 1000 bootstrapped regression models.
3.2 Monte Carlo analysis for edge effects
When fish abundance was examined categorically, to examine for an edge effect, Monte Carlo resampling showed no significant difference between the oyster sanctuary interior and edge (P = 0.77; Figure 6). However, there was a difference between the edge and the immediate outside perimeter within 25 m of the edge (P = 0.02). Outside of the sanctuary, there was no difference between sampling positions near versus farther away from the edge (P = 0.81; Figure 6). However, there was greater variation in abundance at the 10 m site compared to more distant controls. Overall, abundance of fish (not log transformed) was 3.1 times higher within the oyster sanctuaries (including the edge) compared to outside of them.
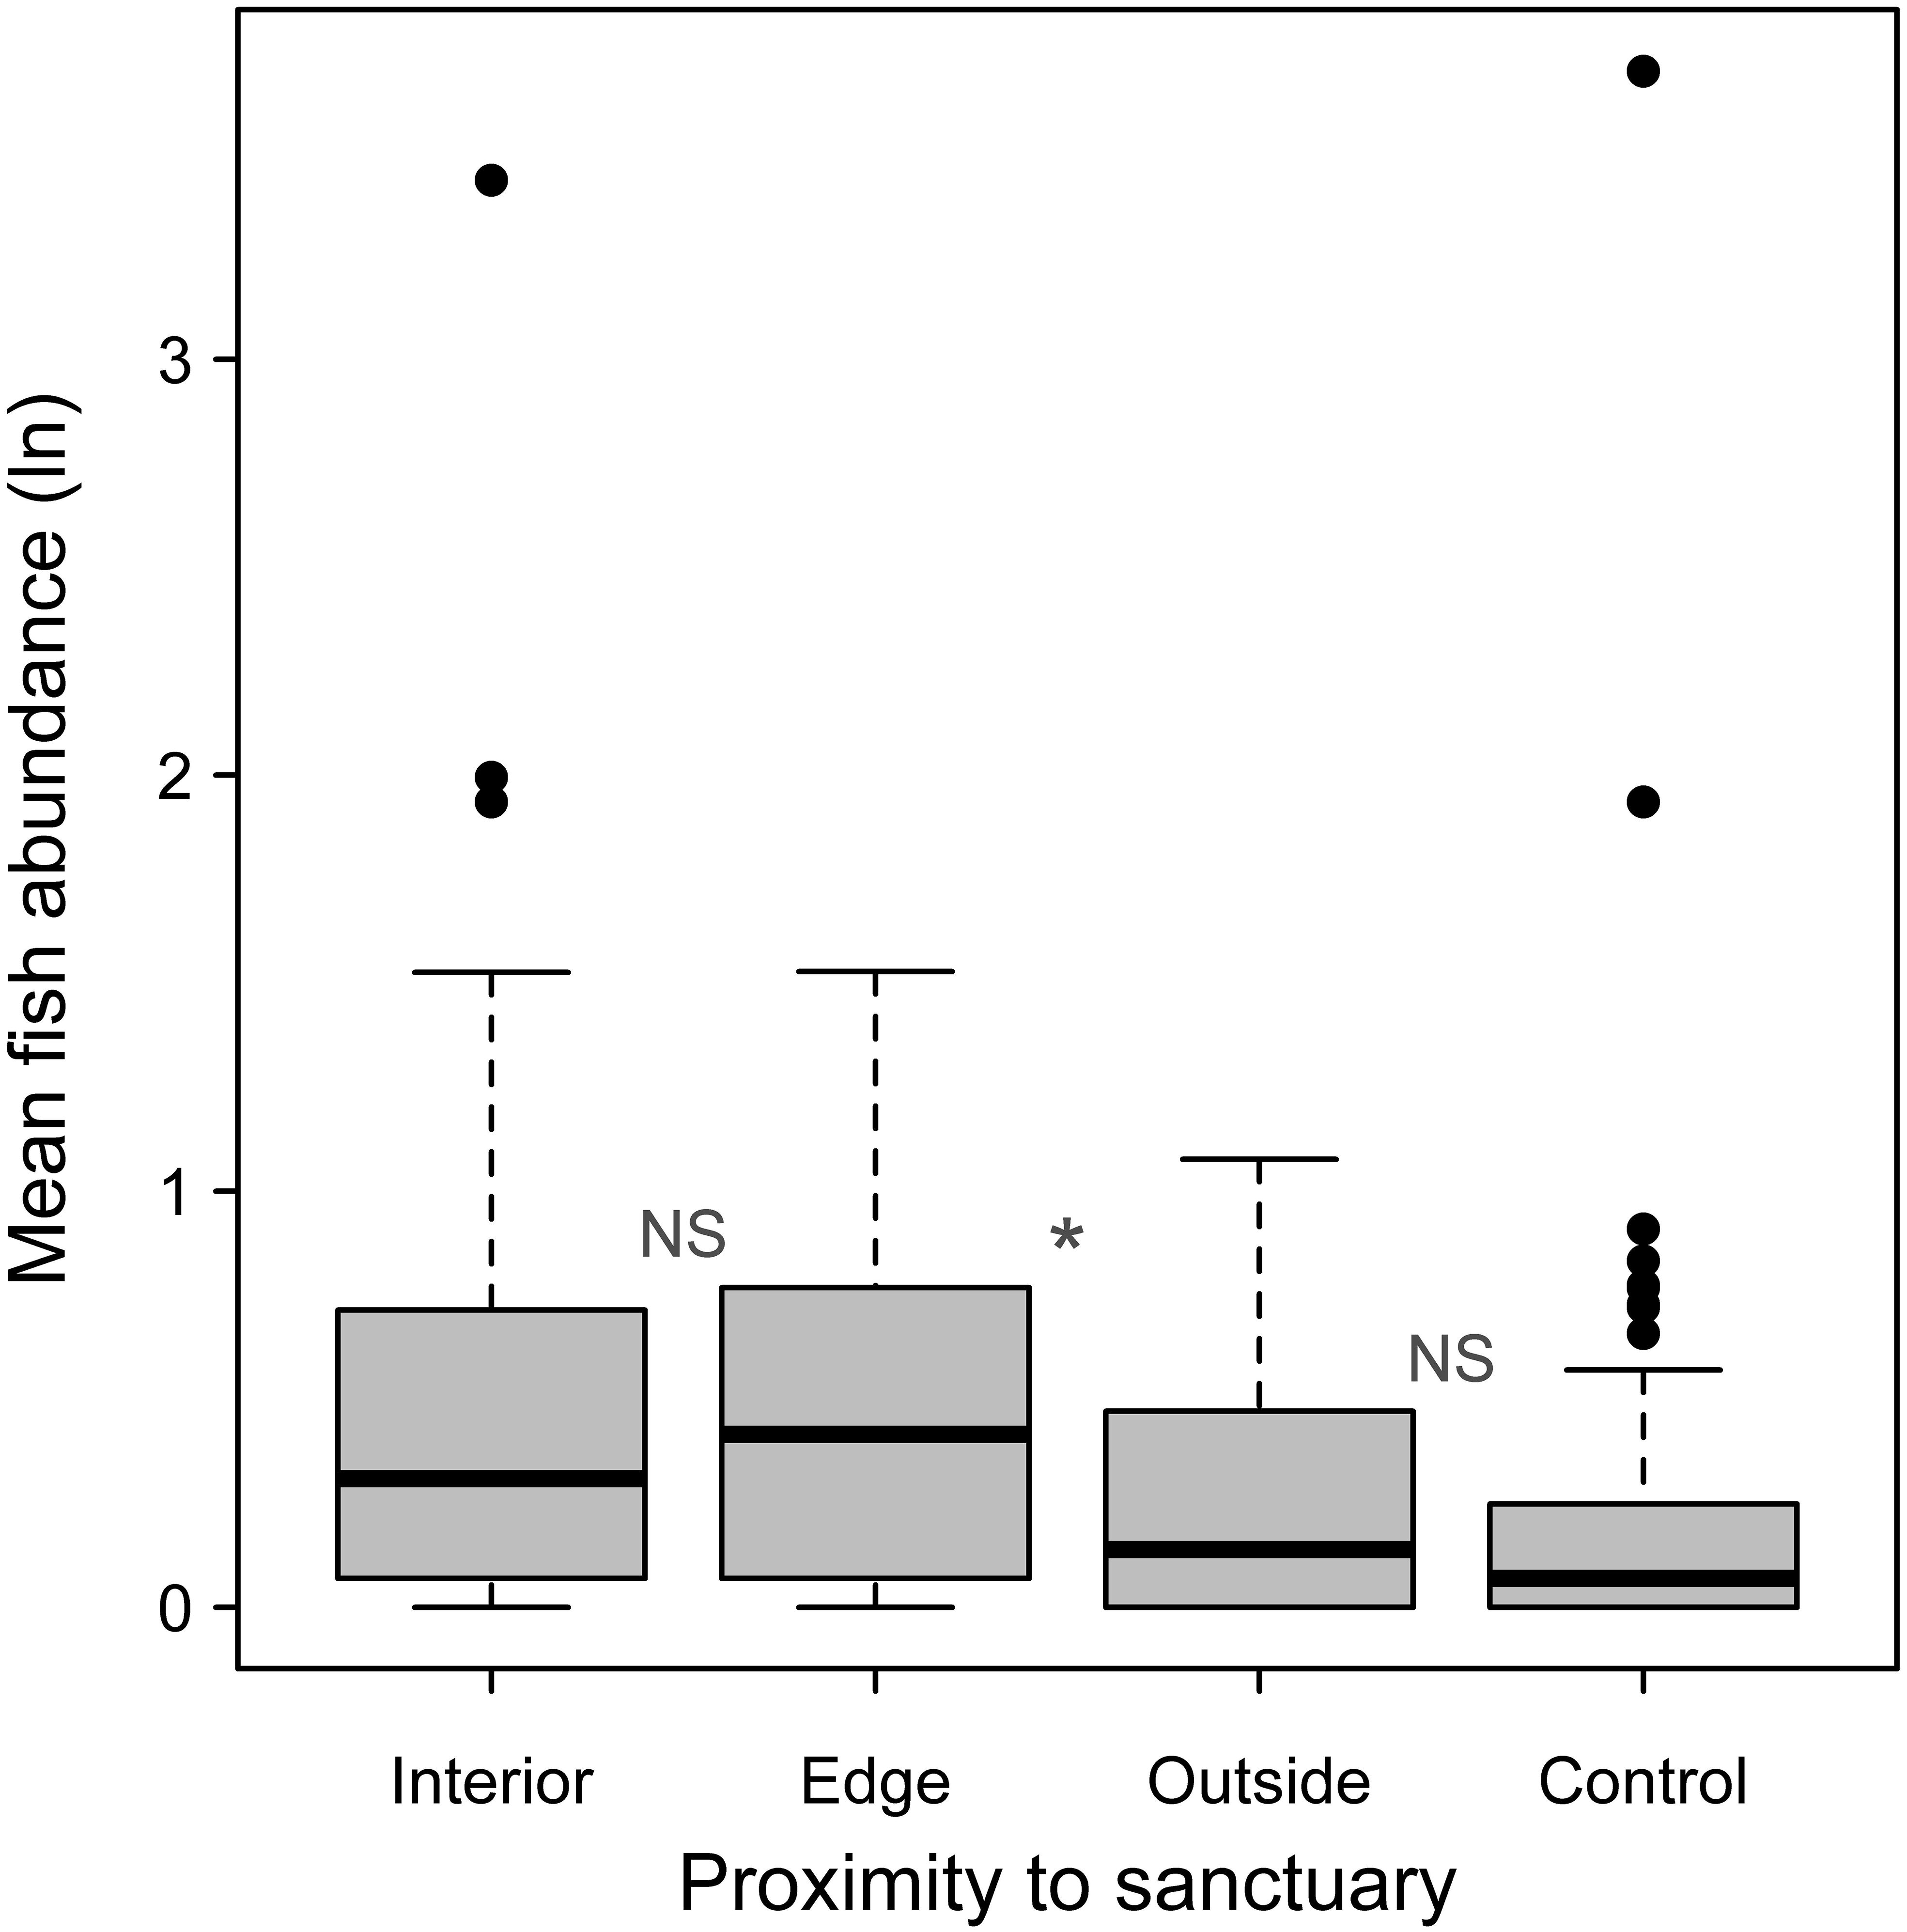
Figure 6. Mean logged fish abundance from all samples taken within oyster sanctuary interiors (N = 47), edges (N = 31), outside of sanctuaries within 25 m of the edge (N = 30), and at more distant controls (N = 94). NS indicates no significant difference between adjacent groups and * indicates P< 0.05 based on a Monte Carlo reassignment analysis.
3.3 Effects of substrate type
Mean log fish abundance and mean length data were analyzed across major artificial substrate categories within oyster sanctuary boundaries. Fish abundance was similar across substrate types (Figure 7; Mixed effects ANOVA: χ2 = 0.29, df = 2, P = 0.87). For mean length, rocks substrate tended to have smaller fish, but differences were not significant (Figure 7; Mixed effects ANOVA: χ2 = 4.36, df = 2, P = 0.11).
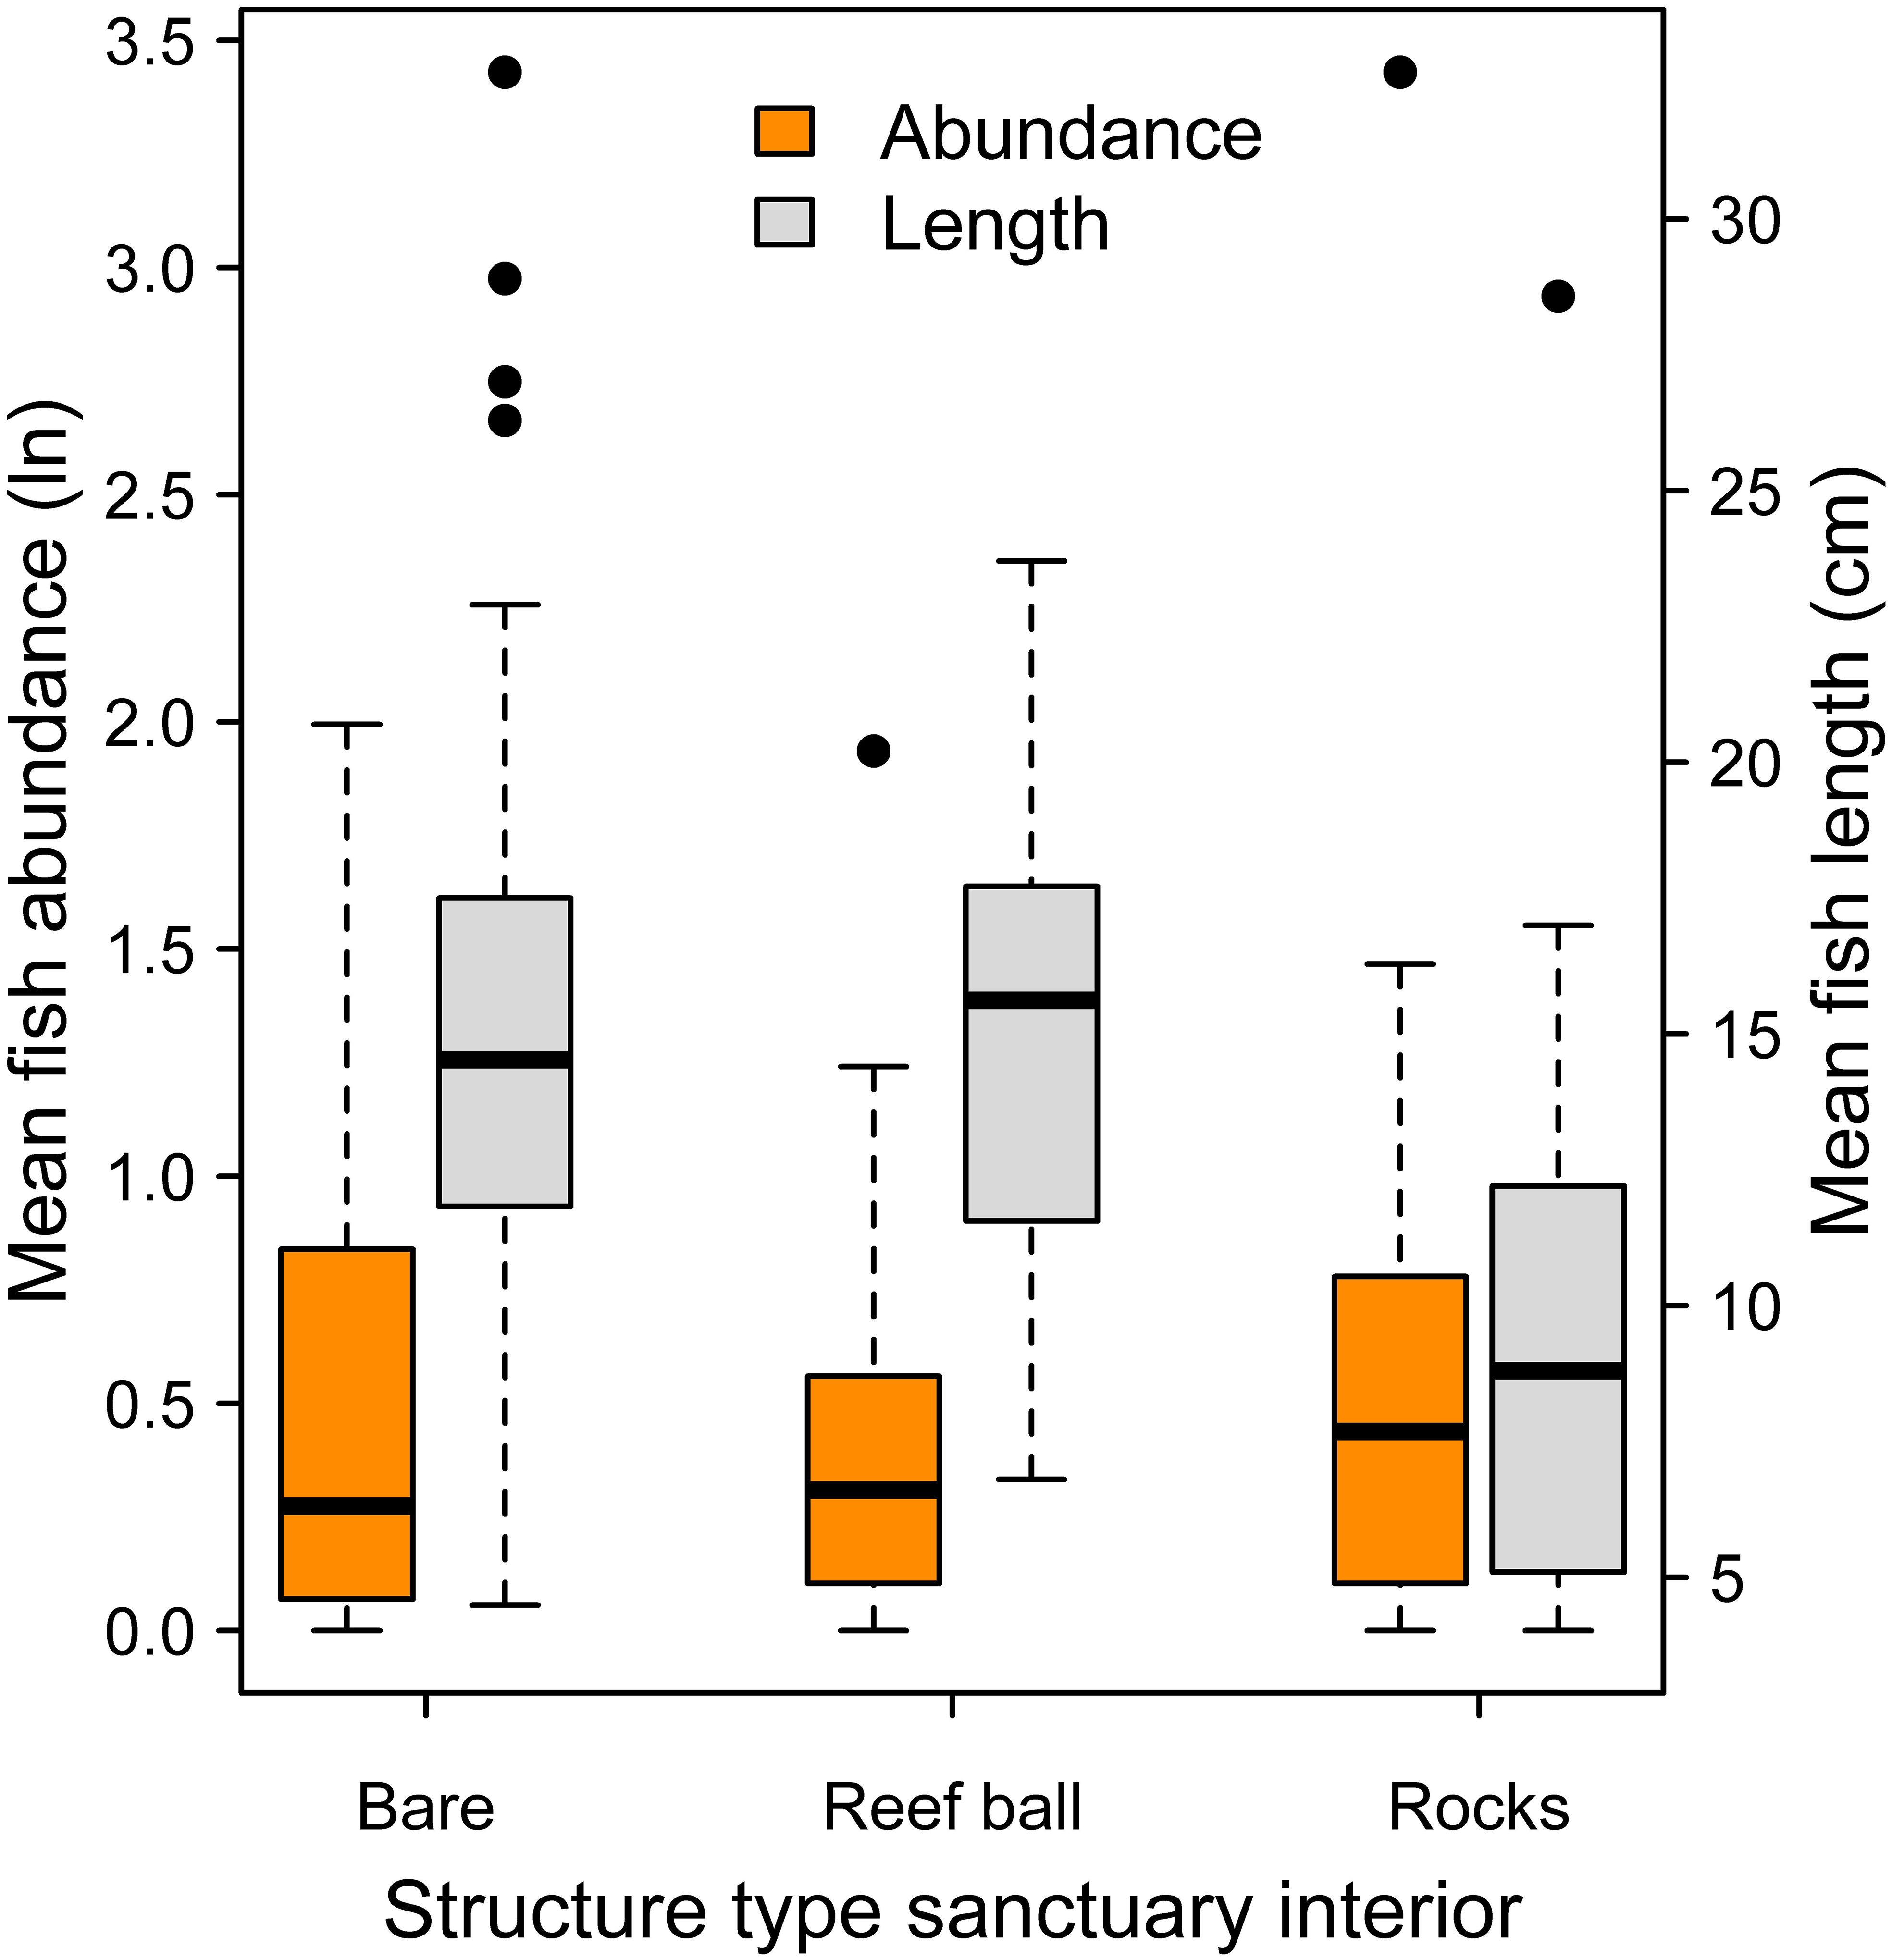
Figure 7. Mean logged fish abundance (orange boxes; left y-axis) and mean fish length (gray boxes; right y-axis) among the three major substrate categories within oyster sanctuaries. There were no significant differences among substrates in abundance or length.
3.4 Size spectra analysis
Across 1000 random frame resampling iterations, length distributions of fish were compared between sampling positions inside versus outside of the oyster sanctuaries, and fish abundance was higher within the sanctuaries across all 5 cm length bins (Figure 8). The most abundant length class were fish in the 6-10 cm category, and fish in larger length bins declined rapidly; fish larger than 25 cm were relatively rare occurrences either inside or outside of the sanctuaries (Figure 8). The size spectra analysis supported these observations, where predicted abundance based on the GAM fit (85.6% of deviance explained in model) was higher inside the sanctuaries across all length bins (Figure 9). Further, modeled abundance declined more quickly outside than inside of the sanctuaries as length increased, suggesting that the greatest proportional difference in abundance occurred among fish of intermediate lengths (10 – 30 cm; Figure 9). The smallest length bin (1-5 cm) was not included in the size spectra analysis (see methods), but we observed that abundances of this group were much lower outside of the artificial reefs (Figure 8), suggesting that the smallest schooling fish were strongly attracted to the artificial reefs.
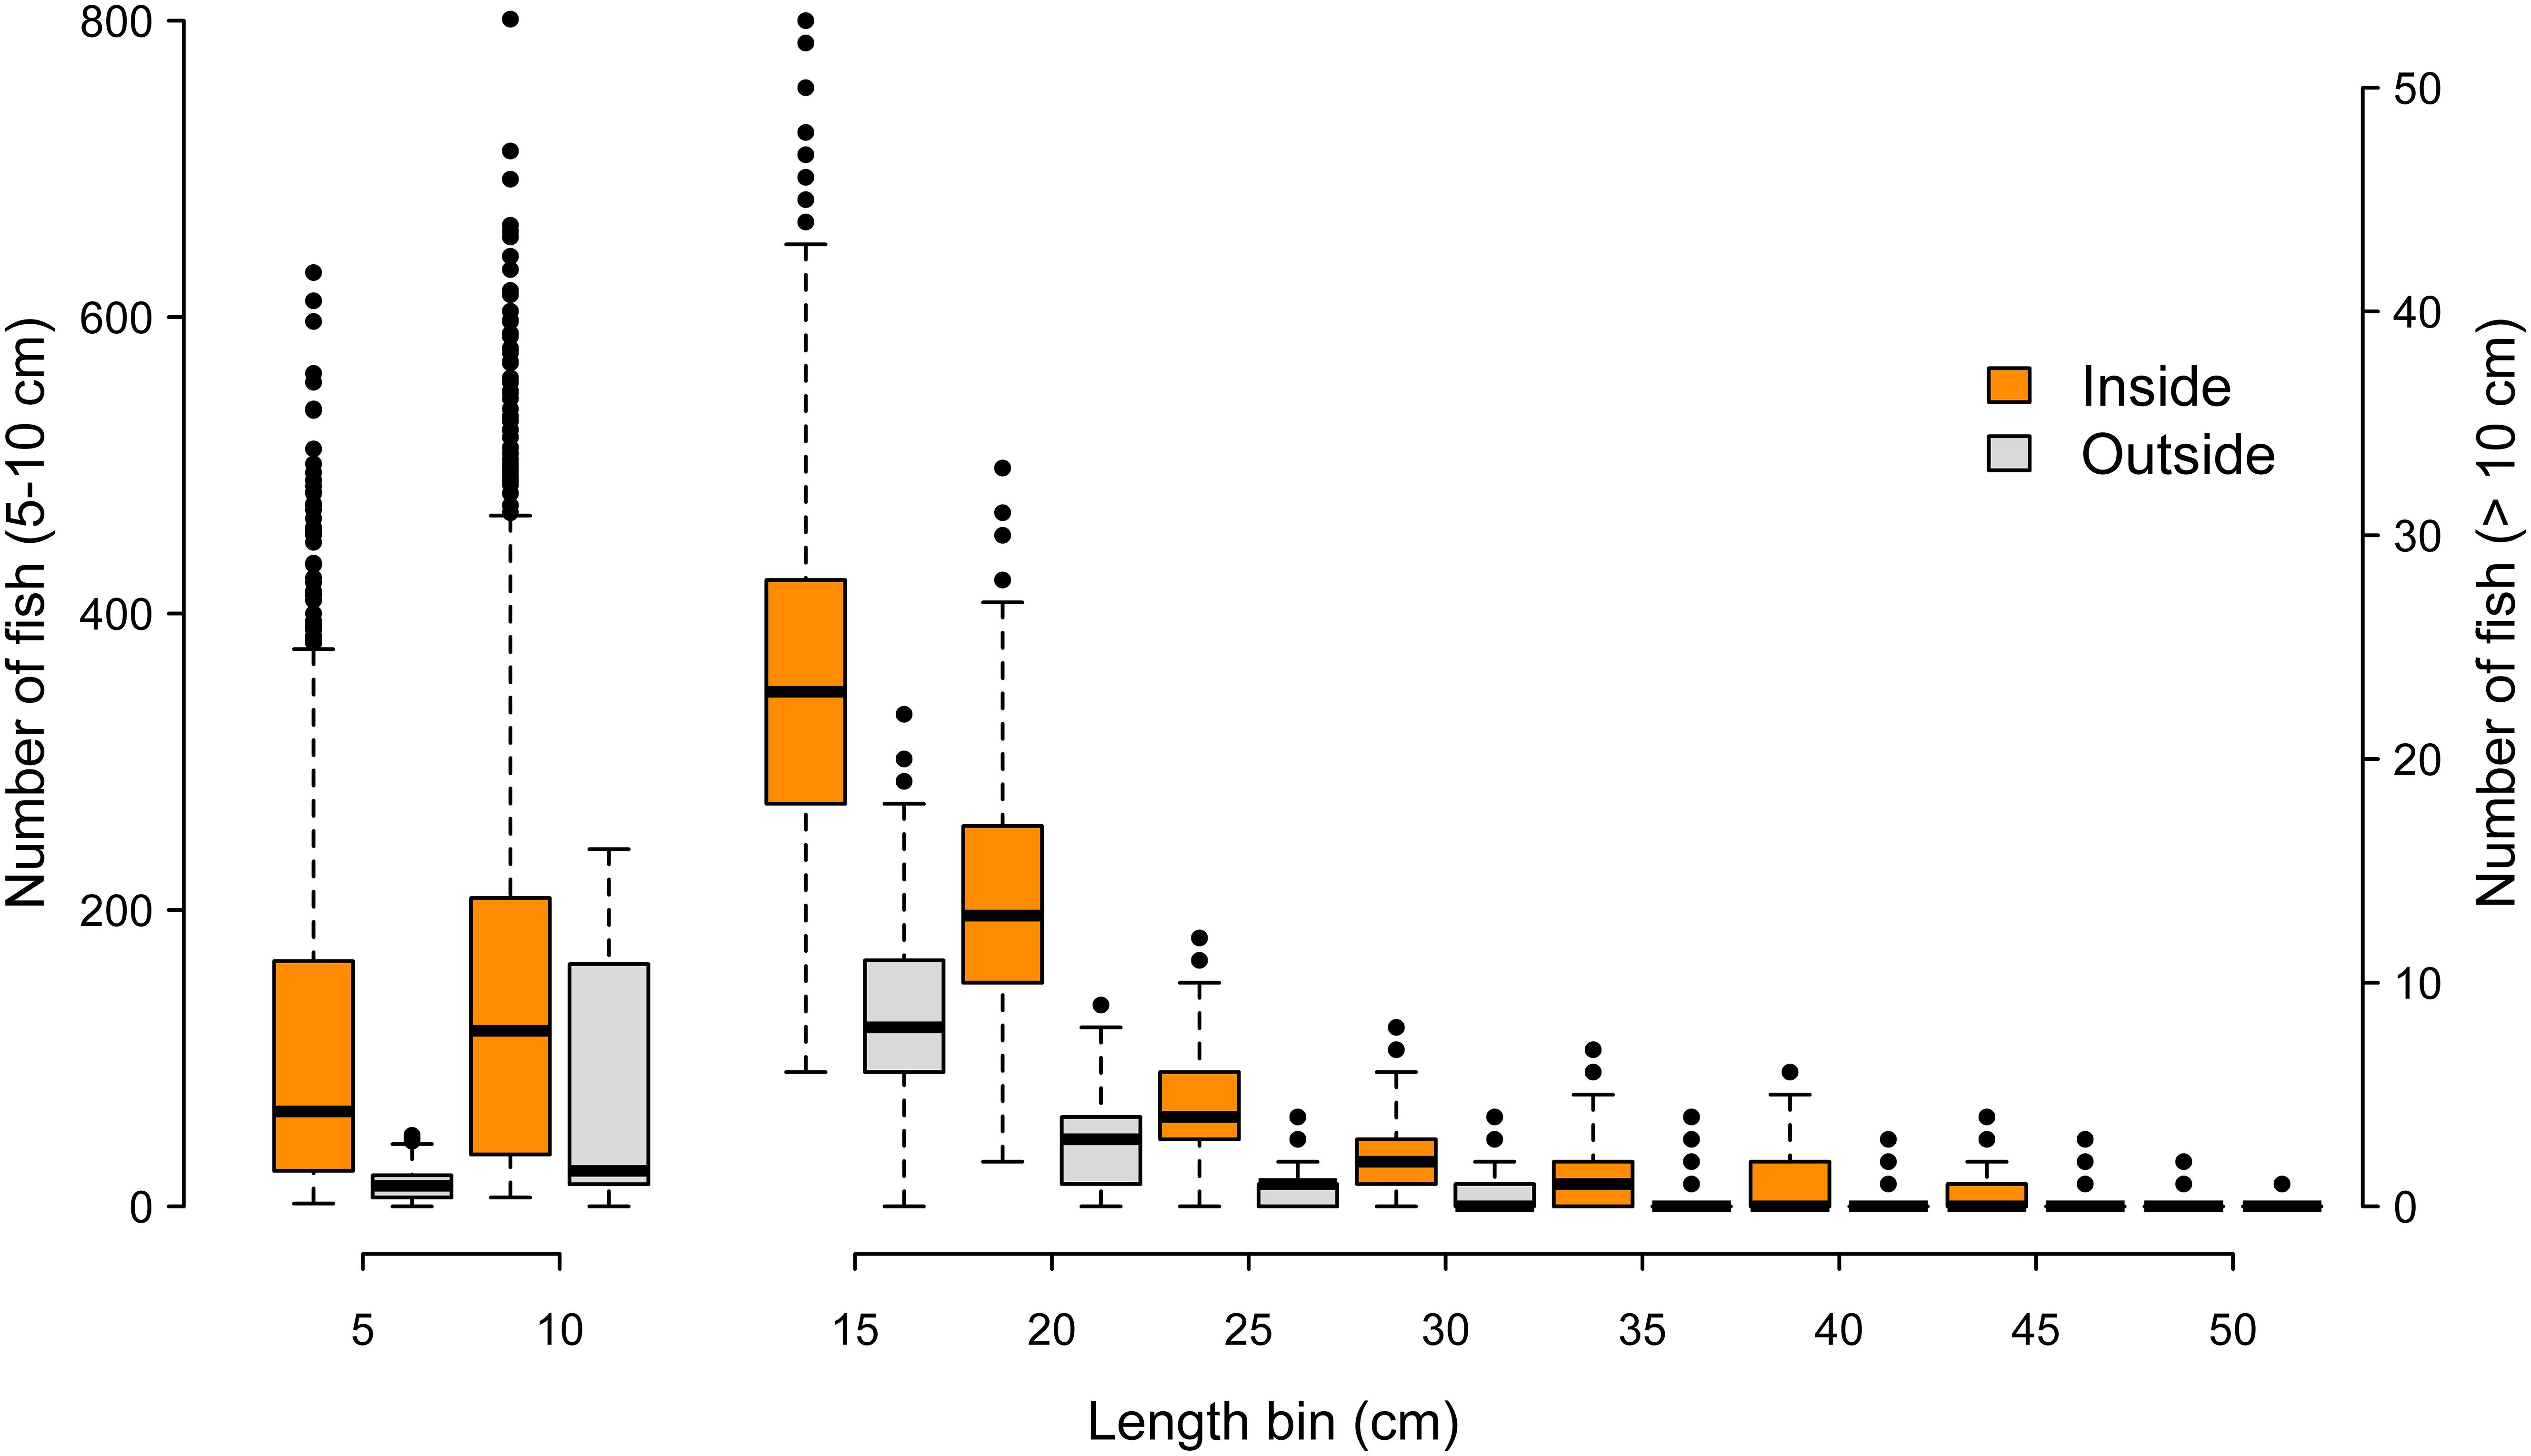
Figure 8. Number of fish across length bins at sampling positions inside (orange) versus outside (gray) of the oyster sanctuaries. Each box and whiskers represents 1000 iterations, where each iteration is the number of fish within a 5 cm length bin from 78 sample frames spread evenly among 8 oyster sanctuaries. Length bins greater than 10 cm correspond to the right y-axis.
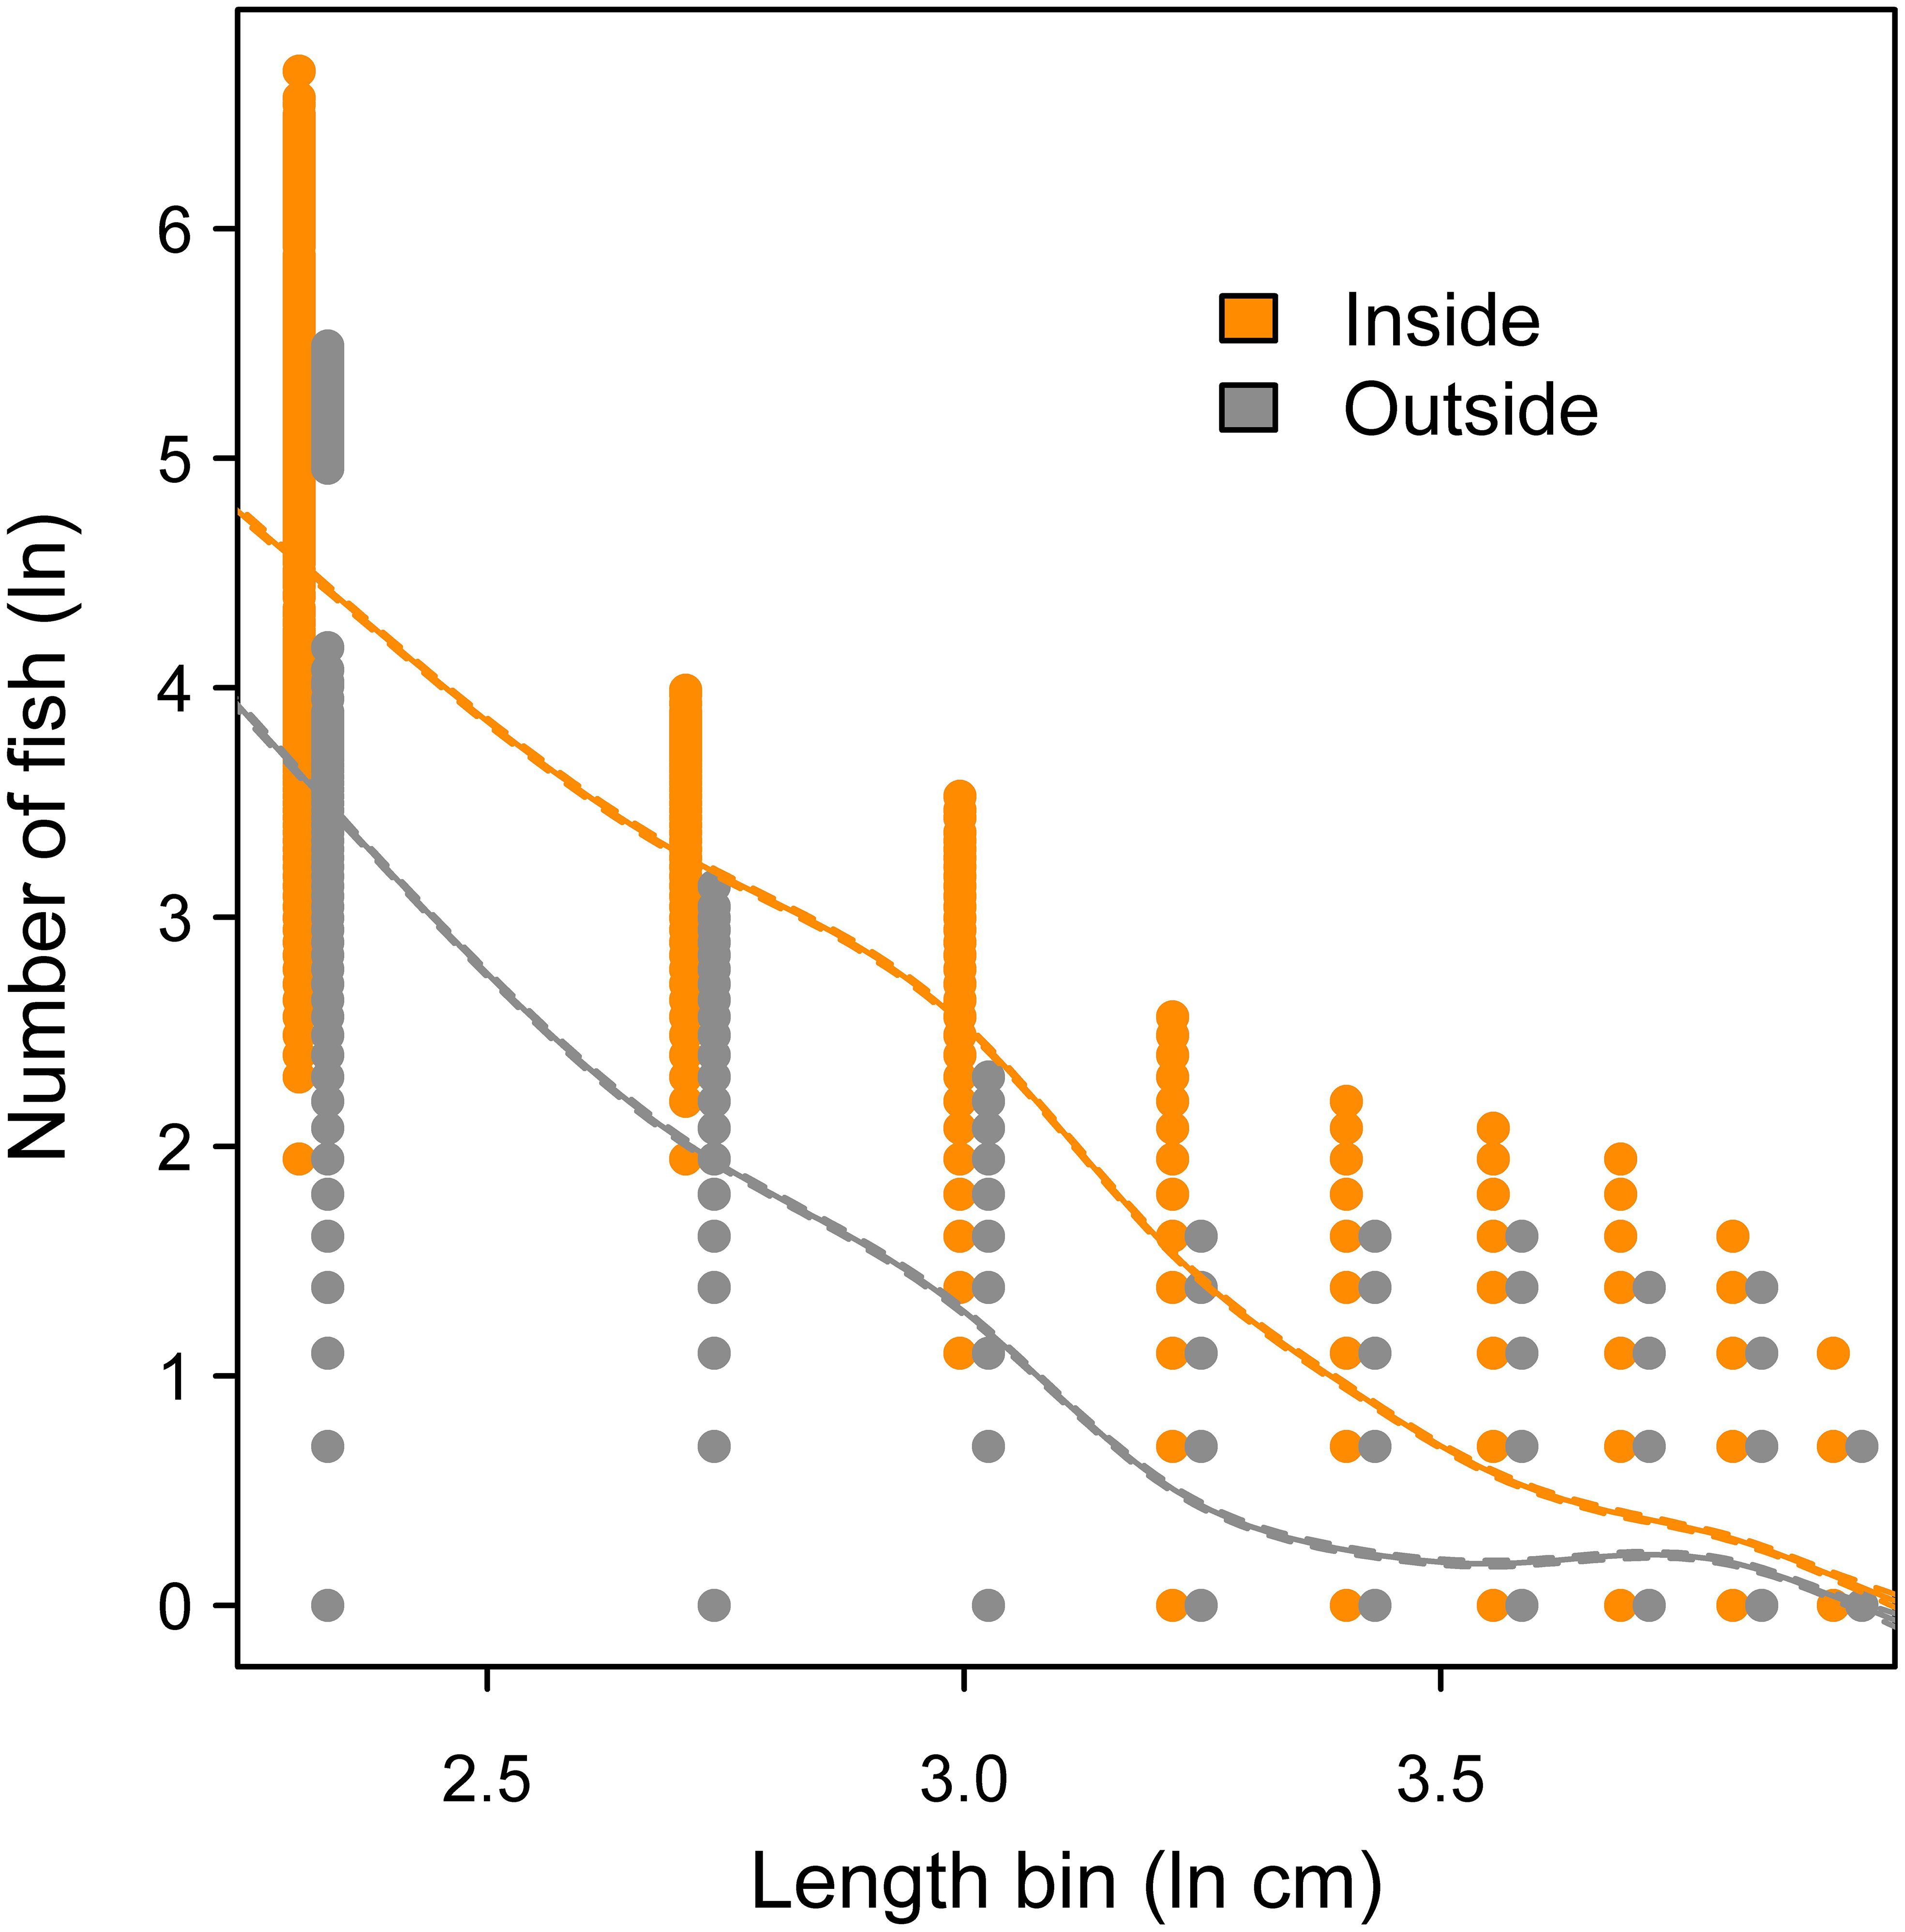
Figure 9. Size spectra analysis comparing logged abundance of fish inside versus outside of the oyster sanctuaries across logged length bins (1-5 cm fish excluded). Curves represent fit from a generalized additive model; 95% confidence intervals are included but too small to be visible.
4 Discussion
The fish community within the oyster sanctuaries in Pamlico Sound were notably different in abundance and size structure compared to the surrounding areas, which largely consist of featureless bottom in this system. The use of acoustic imaging technology allowed us to sample a large portion of the fish community within the highly structured environment of the sanctuaries, where most sampling gears could not be deployed in a similar fashion across different locations (e.g., gill nets, trawls). Obtaining abundance and length data on the fish community, sampled at discrete positions relative to the oyster sanctuaries allowed us to examine fine scale spatial characteristics of the fish community. The resulting data represent size-structured abundance, which has been increasingly used to contrast fish assemblages among habitats or to examine the impacts of protected areas (Dunn et al., 2023; Olson et al., 2023; Letessier et al., 2024).
The abundance of fish in the sanctuaries was over three times higher than the surrounding unstructured habitat. Artificial reef material is well documented to increase fish abundance compared to nearby control sites (Boswell et al., 2010; Folpp et al., 2013; Rosemond et al., 2018). Similarly, restored oyster reefs increase nekton abundance and diversity over adjacent bare habitats and are comparable to natural reefs (Brown et al., 2013; George et al., 2014; La Peyre et al., 2014). We found that all length classes of fish contributed to this increase in abundance, including both small schooling fish and larger consumers. Our results contrast with Pierson and Eggleston (2014) who used gill nets and traps and found that fish abundance was similar or greater on nearby (1 – 1.5 km) unstructured bottom compared to the oyster sanctuaries. Comparing our study with Pierson and Eggleston (2014) should be done with caution, as there are multiple factors that differ in our approaches, including the specific sanctuaries sampled and that only limestone marl piles were sampled by the previous study, while most sanctuaries also contained reef balls or other materials during our study. However, sampling with nets or traps contains biases that might have obscured abundance estimates from the previous study. Specifically, both gill nets and traps may become saturated with catch, which can reduce the contrast in abundance between sampling areas (Li et al., 2011; Bacheler et al., 2013a). Further, gill nets are highly size selective based on mesh size, and there are distinct species-specific differences in vulnerability to capture with both gear types (Carol and Garcia-Berthou, 2007; Bacheler et al., 2013b). Finally, species encounter rates with these passive gear types might be lower over artificial reefs, due to differences in species behavior or habitat effects (Scharf et al., 2006). Due to these potential gear related biases, we suggest that our results provide a more accurate estimate of abundance effects within the sanctuaries, and when used in conjunction with the species composition data from Pierson and Eggleston (2014), a more comprehensive understanding of the sanctuaries is possible.
The enhancement in fish abundance we observed within oyster sanctuaries did not show any evidence of spilling over to the immediate surrounding areas, at least not at the ~10 m sampling resolution that we used. Specifically, our nearest sampling position outside of the sanctuaries was 10 m away, and we found that abundance there was typically no different than areas > 100 m from the sanctuary edge. Also, there was no evidence of an edge effect, where abundance was highest at the sanctuary boundary. Instead, we found that fish abundance was similar between the sanctuary edge and interior. Similarly, Boswell et al. (2010) sampled a large artificial reef in the Gulf of Mexico using acoustics and concluded that the effects of the reef were confined to within 20 m of the edge. Rosemond et al. (2018) sampled the fish community around artificial reefs off the coast of North Carolina using SCUBA. This study found a more gradual decline in abundance, and areas 30 m from artificial reefs still showed signs of fish aggregation. The degree of water clarity might affect this buffer zone for fish enhancement—water clarity in Pamlico Sound is generally lower than on the continental shelf—but to our knowledge this has not been examined. Alternatively, differences in fish use of the areas surrounding artificial reefs might depend on the local species assemblage and the scale of movement among the species present.
The mean length of fish was higher in the oyster sanctuaries compared to areas outside of the sanctuary. Indeed, based on our size spectrum analysis the largest differences in log abundance when comparing inside the sanctuary with the surrounding areas was fish between 10 and 30 cm. In other systems, larger mean fish size has been observed on artificial reefs compared to surrounding areas (Boswell et al., 2010). Paxton et al. (2020) observed that large predator species are generally more abundant on artificial reefs than on natural reefs, a pattern that was driven by more transient predators (e.g., pelagic, mobile and schooling predators). It is possible that the larger sized fish observed within the oyster sanctuaries indicates that the species assemblage differs inside versus outside the sanctuaries. This conclusion is supported by studies on the habitat value of restored oyster reefs (George et al., 2014; La Peyre et al., 2014). In our study we did not attempt to confirm species identify or classify fish into potential trophic guilds. However, anecdotally we did observe larger fish on the acoustic imagery with more distinct body types within the sanctuaries, including structure oriented fishes and mobile-pelagic predators. Fish with porgy-like body forms (family Sparidae) were frequently observed within the sanctuaries (Figure 3); anglers in the sanctuaries were also observed to catch sheepshead on multiple occasions (Archosargus probatocephalus, family Sparidae). Sparids have been shown to respond positively to artificial reefs and restored oyster reefs, including subtidal reefs (Folpp et al., 2020; Davenport et al., 2021). Pierson and Eggleston (2014) support our conclusion of distinct communities within the sanctuaries. Based on gill net and trap sampling of four oyster sanctuaries within Pamlico Sound, that study found that the community structure differed within oyster sanctuaries compared to control sites. As an example using two structure oriented species, a total of 179 Atlantic spadefish (Chaetodipterus faber) and 13 sheepshead were caught within the sanctuaries, while in the control areas only 26 spadefish were caught and no sheepshead (Pierson and Eggleston, 2014). Additional support that species assemblages on the sanctuaries are distinct compared to surrounding areas can be seen with passive acoustics sampling. Specifically, Lillis et al. (2014) sampled soundscapes with hydrophones at three oyster sanctuaries in Pamlico Sound. They found that sound levels and acoustic diversity were higher in oyster sanctuaries compared to nearby controls, indicating greater biodiversity on the artificial reefs. The differences were mostly driven by snapping shrimp activity in the sanctuaries, but the authors also noted elevated biological noise from soniferous fishes.
Fish abundance varied substantially among the eight sanctuaries sampled, although attempts to examine mechanisms for these differences were beyond the scope of our work. Differences in fish abundance are likely to be due to a number of factors, including seasonal-temperature effects and sanctuary distance from shore. For example, Deep Bay had the highest fish abundance and is also unique in that it is positioned near more complex-sheltered marsh habitats. Repeated sampling of these sanctuaries over the course of one or more seasons would be required to understand if certain sanctuaries have greater abundances of fish over others. Both Pierson and Eggleston (2014) and Lillis et al. (2014) found evidence that certain oyster sanctuaries may be more productive than others. However, the mechanisms behind these differences remain speculative.
No significant differences were found between the three broad categories of substrate type that we compared within sanctuaries. Similar results have been found among studies that compared substrate type for oyster restoration projects (Brown et al., 2013; George et al., 2014). Other studies on artificial reefs have found contrasting results, instead showing that substrate type can influence fish abundance and that different species may have unique preferences (Lemoine et al., 2019; Tharp et al., 2024). However, studies on artificial reefs have been able to compare substrates with much greater structural differences (e.g., concrete pipes versus sunken ships) as compared to typical oyster restoration materials. Our analysis of substrate type effects was done opportunistically, based on ARIS files that happened to occur over varied bottom types. Therefore, a more directed study to examine artificial substrate differences, with larger sample sizes over varied bottom types, might produce different results. It also should be noted that within certain oyster sanctuaries artificial substrates are densely arranged, so even if a particular sample was recorded as bare, some form of structure was often nearby. While acoustic imaging technology is more limited in its ability to understand such fine scale differences in the fish community, we recommend that future studies using this approach categorize fish into several guilds (e.g., pelagic vs. benthic; Sibley et al., 2023a) to maximize the chance of measuring community differences among artificial substrate types.
5 Conclusions
Artificial reefs have generally been shown to function similarly to nearby natural habitats (Paxton et al., 2020). In Pamlico Sound, natural subtidal oyster reefs and human-cultch planted reefs represent the most comparable, structurally complex habitat to the sanctuaries where we sampled, but the habitat function of these areas in Pamlico Sound has received little attention. The sanctuaries represent a small fraction of the total oyster reef area in this system, but they harbor much greater oyster densities (Theuerkauf et al., 2021). Our study has shown that fish abundance, across the full size spectrum, is higher within the sanctuaries compared to the bare substrate in the surrounding areas. Further, Pierson and Eggleston (2014) showed that catches of multiple valuable species were far greater within the sanctuaries, including sheepshead, spadefish, black sea bass (Centropristes striata) and southern flounder (Paralichthys lethostigma). Increased abundances of schooling prey might also provide enhanced foraging opportunities for pelagic piscivores. Nevertheless, more research is needed to determine if this high fish abundance translates into enhanced productivity of the oyster reef fish assemblage in Pamlico Sound (Beck et al., 2001; Chong et al., 2024), or if these sanctuaries enhance habitat availability for certain species and life stages. The amount of oyster reefs present in Pamlico Sound has been estimated to be around one third of historical values (Craig et al., 2021). Therefore, artificial reefs, including oyster sanctuaries, have the potential to help mitigate this habitat loss. While responses to increases in habitat availability can be species-specific (Keller et al., 2017), there are examples of artificial habitats, including shellfish reefs, enhancing system wide productivity of the fish community in estuaries (Folpp et al., 2020; Gilby et al., 2021). While future research is needed to examine the interaction that the Pamlico Sound oyster sanctuaries have with natural subtidal reefs, the evidence we present here supports the idea that these artificial reefs enhance fisheries habitat, which further supports the justification for investing in artificial reefs designated as oyster sanctuaries.
Data availability statement
The raw data supporting the conclusions of this article will be made available by the authors, without undue reservation.
Ethics statement
Ethical approval was not required for the study involving animals in accordance with the local legislation and institutional requirements because no animals were handled or captured for this research. The only approach used was acoustic imaging sonar.
Author contributions
CG: Data curation, Formal analysis, Funding acquisition, Investigation, Project administration, Visualization, Writing – original draft. JM: Conceptualization, Data curation, Formal analysis, Funding acquisition, Investigation, Methodology, Project administration, Resources, Supervision, Visualization, Writing – original draft. DR: Data curation, Formal analysis, Funding acquisition, Investigation, Project administration, Writing – review & editing. AM: Data curation, Investigation, Methodology, Project administration, Supervision, Writing – review & editing.
Funding
The author(s) declare financial support was received for the research, authorship, and/or publication of this article. CG received funding from the East Carolina University Undergraduate Research and Creative Activity Awards. DR received support from the REU C2C National Science Foundation Grant No. 2041425. AM received support from the CCEDS NRT National Science Foundation Grant No. 2125684.
Acknowledgments
Gene Oakley assisted with the fabrication of the ARIS vessel mount. Patrick Harris reviewed an earlier version of this manuscript. Three reviewers and the associate editor reviewed and helped improve this manuscript.
Conflict of interest
The authors declare that the research was conducted in the absence of any commercial or financial relationships that could be construed as a potential conflict of interest.
Publisher’s note
All claims expressed in this article are solely those of the authors and do not necessarily represent those of their affiliated organizations, or those of the publisher, the editors and the reviewers. Any product that may be evaluated in this article, or claim that may be made by its manufacturer, is not guaranteed or endorsed by the publisher.
References
Able K. W., Grothues T. M., Kemp I. M. (2013). Fine-scale distribution of pelagic fishes relative to a large urban pier. Mar. Ecol. Prog. Ser. 476, 185–198. doi: 10.3354/meps10151
APNEP. (2012). Albemarle-Pamlico Ecosystem Assessment. Eds. Carpenter D. E., Dubbs L.. (Raleigh, NC: Albemarle-Pamlico National Estuary Partnership).
Bacheler N. M., Schobernd Z. H., Berrane D. J., Schobernd C. M., Mitchell W. A., Geraldi N. R. (2013a). When a trap is not a trap: converging entry and exit rates and their effect on trap saturation of black sea bass (Centropristis striata). ICES J. Mar. Sci. 70, 873–882. doi: 10.1093/icesjms/fst062
Bacheler N. M., Schobernd C. M., Schobernd Z. H., Mitchell W. A., Berrane D. J., Kellison G. T., et al. (2013b). Comparison of trap and underwater video gears for indexing reef fish presence and abundance in the southeast United States. Fish. Res. 143, 81–88. doi: 10.1016/j.fishres.2013.01.013
Beck M. W., Heck K. L., Able K. W., Childers D. L., Eggleston D. B., Gillanders B. M., et al. (2001). The identification, conservation, and management of estuarine and marine nurseries for fish and invertebrates. Bioscience 51, 633–641. doi: 10.1641/0006-3568(2001)051[0633:TICAMO]2.0.CO;2
Becker A., Taylor M. D., Folpp H., Lowry M. B. (2018). Managing the development of artificial reef systems: The need for quantitative goals. Fish Fish. 19, 740–752. doi: 10.1111/faf.12288
Binion-Rock S. M., Christian R. R., Buckel J. A. (2023). Identification of important forage fish and implications of increased predator demand through Ecopath modeling. Estuar. Coast. Shelf Sci. 280, 108164. doi: 10.1016/j.ecss.2022.108164
Bolser D. G., Egerton J. P., Gruss A., Erisman B. E. (2021). Optic-acoustic analysis of fish assemblages at petroleum platforms. Fisheries 46, 552–563. doi: 10.1002/fsh.10654
Boswell K. M., Wells R. J. D., Cowan J. H., Wilson C. A. (2010). Biomass, density, and size distributions of fishes associated with a large-scale artificial reef complex in the Gulf of Mexico. Bull. Mar. Sci. 86, 879–889. doi: 10.5343/bms.2010.1026
Brown L. A., Furlong J. N., Brown K. M., La Peyre M. K. (2013). Oyster reef restoration in the Northern Gulf of Mexico: Effect of artificial substrate and age on nekton and benthic macroinvertebrate assemblage use. Rest. Ecol. doi: 10.1111/rec.12071
Burnham K. P., Anderson D. R. (2002). Model Selection and multimodel Inference: A Practical Information-Theoretic Approach. 2nd ed (New York: Springer-Verlag), 488 p.
Carol J., Garcia-Berthou E. (2007). Gillnet selectivity and its relationship with body shape for eight freshwater species. J. Appl. Ichthyol. 23, 654–660. doi: 10.1111/j.1439-0426.2007.00871.x
Chong L., Siders Z. A., Lorenzen K., Ahrens R. N. M., Camp E. V. (2024). Global synthesis of effects and feedbacks from artificia2l reefs on socioecological systems in recreational fisheries. Fish Fish. 25, 303–319. doi: 10.1111/faf.12809
Craig J. K., Kellison G. T., Binion-Rock S. M., Regan S. D., Karnauskas M., Lee S. K., et al. (2021). "Ecosystem Status Report for the U.S. South Atlantic Region." in NOAA Technical Memorandum NMFS-SEFSC-753. (Beaufort, NC: National Oceanic and Atmospheric Administration), 145. doi: 10.25923/qmgr-pr03
Davenport T. M., Hughes A. R., Zu Ermgassen P. S. E., Grabowski J. H. (2021). Recruitment enhancement varies by taxonomic group and oyster reef habitat characteristics. Ecol. Appl. 31, e02340. doi: 10.1002/eap/2340
Degraer S., Carey D. A., Coolen J. W. P., Hutchison Z. L., Kerckhof F., Rumes B., et al. (2020). Offshore wind farm artificial reefs affect ecosystem structure and functioning: A synthesis. Oceanography 33, 48–57. doi: 10.5670/oceanog.2020.405
Dumbauld B. R., Ruesink J. L., Rumrill S. S. (2009). The ecological role of bivalve aquaculture in the estuarine environment: a review with application to oyster and clam culture in the West Coast (USA) estuaries. Aquaculture 290, 196–223. doi: 10.1016/j.aquaculture.2009.02.033
Dunn R. P., Kimball M. E., O’Brien C. G., Adams N. T. (2023). Characterising fish habitat use of fringing oyster reefs using acoustic imaging. Mar. Freshw. Res. 74, 39–49. doi: 10.1071/MF22081
Folpp H., Lowry M., Gregson M., Suthers I. M. (2013). Fish assemblages on estuarine artificial reefs: natural rocky-reef mimics or discrete assemblages? PLoS One 8, e63505. doi: 10.1371/journal.pone.0063505
Folpp H. R., Schilling H. T., Clark G. F., Lowry M. B., Maslen B., Gregson M., et al. (2020). Artificial reefs increase fish abundance in habitat-limited estuaries. J. Appl. Ecol. 57, 1752–1761. doi: 10.1111/1365-2664.13666
Fox J., Weisberg S. (2019). An R Companion to Applied Regression. 3rd ed. (Thousand Oaks CA: Sage). Available at: https://socialsciences.mcmaster.ca/jfox/Books/Companion/.
GEBCO Compilation Group. (2023). Data from GEBCO 2023 Grid. doi: 10.5285/f98b053b-0cbc-6c23-e053-6c86abc0af7b
George L. M., Santiago K. D., Palmer T. A., Pollack J. B. (2014). Oyster reef restoration: effect of alternative substrates on oyster recruitment and nekton habitat use. J. Coast. Conserv. doi: 10.1007/s11852-014-0351-y
Gilby B. L., Olds A. D., Chapman S., Goodridge Gaines L. A., Henderson C. J., Ortodossi N. L., et al. (2021). Attraction versus production in restoration: spatial and habitat effects of shellfish reefs for fish in coastal seascapes. Rest. Ecol. 29, e13413. doi: 10.1111/rec.13413
Gotelli N. J., Ellison A. M. (2013). A primer of ecological statistics. 2nd ed (Massachusetts: Sinauer Associates, Inc).
Keller D. A., Gittman R. K., Bouchillon R. K., Fodrie F. J. (2017). Life stage and species identity affect whether habitat subsidies enhance or simply redistribute consumer biomass. J. Anim. Ecol. 86, 1394–1403. doi: 10.1111/1365-2656.12745
Kerschbaumer P., Tritthart M., Keckeis H. (2020). Abundance, distribution, and habitat use of fishes in a large river (Danube, Austria): mobile, horizontal hydroacoustic surveys vs. standard fishing method. ICES J. Mar. Sci. 77, 1966–1978. doi: 10.1093/icesjms/fsaa081
La Peyre M. K., Humphries A. T., Casas S. M., La Peyre J. F. (2014). Temporal variation in development of ecosystem services from oyster reef restoration. Ecol. Engin. 63, 34–44. doi: 10.1016/j.ecoleng.2013.12.001
Lemoine H. R., Paxton A. B., Anisfeld S. C., Rosemond R. C., Peterson C. H. (2019). Selecting the optimal artificial reefs to achieve fish habitat enhancement. Biol. Cons. 238, 108200. doi: 10.1016/j.biocon.2019.108200
Letessier T. B., Mouillot D., Mannocci L., Christ H. J., Elamin E. M., Elamin S. M., et al. (2024). Divergent responses of pelagic and benthic fish body-size structure to remoteness and protection from humans. Science 383, 976–982. doi: 10.1126/science.adi7562
Li Y., Jiao Y., Reid K. (2011). Gill-net saturation in Lake Erie: effects of soak time and fish accumulation on catch per unit effort of walleye and yellow perch. N. Amer. J. Fish. Manage. 31, 280–290. doi: 10.1080/02755947.2011.574931
Lillis A., Eggleston D. B., Bohnenstiehl D. R. (2014). Estuarine soundscapes: distinct acoustic characteristics of oyster reefs compared to soft-bottom habitats. Mar. Ecol. Prog. Ser. 505, 1–17. doi: 10.3354/meps10805
Martin T. R., Bortone S. A. (1997). Development of an epifaunal assemblage on an estuarine artificial reef. G. Mex. Sci. 15, 55–70. doi: 10.18785/goms.1502.01
Munnelly R. T., Castillo J. C., Handegard N. O., Kimball M. E., Boswell K. M., Rieucau G. (2024). Applications and analytical approaches using imaging sonar for quantifying behavioural interactions among aquatic organisms and their environment. ICES J. Mar. Sci. 81, 207–251. doi: 10.1093/icesjms/fsad182
NCDMF (2016). “Artificial Reef Guide.” in Division of Marine Fisheries, eds. Comer A. M., Love-Adrick A.. (Morehead City, NC: North Carolina Department of Environmental Quality).
NCDMF. (2023). Oyster Sanctuary Program: North Carolina’s effort to restore subtidal oyster populations with protected artificial reefs. (North Carolina Division of Marine Fisheries, Habitat and Enhancement). Available at: https://storymaps.arcgis.com/stories/d876f9b131174f859270c600ccf3545f. (Accessed August 1, 2024).
Olson J. C., Lefcheck J. S., Goodison M. R., Lienesch A., Ogburn M. B. (2023). Fish size spectra from imaging sonar reveal variation in habitat use across nearshore coastal ecosystems. Mar. Ecol. Prog. Ser. 705, 95–108. doi: 10.3354/meps14247
Paxton A. B., Newton E. A., Adler A. M., Van Hoeck R. V., Iversen E. S., Taylor J. C., et al. (2020). Artificial habitats host elevated densities of large reef-associated predators. PLoS One 15, e0237374. doi: 10.1371/journal.pone.0237374
Paxton A. B., Steward D. N., Harrison Z. H., Taylor J. C. (2022). Fitting ecological principles of artificial reefs into the ocean planning puzzle. Ecosphere 13, e3924. doi: 10.1002/ecs2.3924
Paxton A. B., Steward D. N., Mille K. J., Renchen J., Harrison Z. H., Byrum J. S., et al. (2024). Artificial reef footprint in the United States ocean. Nat. Sus. 7, 140–147. doi: 10.1038/s41893-023-01258-7
Peters J. W., Eggleston D. B., Puckett B. J., Theuerkauf S. J. (2017). Oyster demographics in harvested reefs vs. no-take reserves: Implications for larval spillover and restoration success. Front. Mar. Sci. 4. doi: 10.3389/fmars.2017.00326
Pierson K. J., Eggleston D. B. (2014). Response of estuarine fish to large-scale oyster reef restoration. Trans. Amer. Fish. Soc 143, 273–288. doi: 10.1080/00028487.2013.847863
Pinheiro J., Bates D., R Core Team (2023). nlme: Linear and Nonlinear Mixed Effects Models (R package version 3), 1–164. Available at: https://CRAN.R-project.org/package=nlme.
R Core Team. (2020). R: A language and environment for statistical computing (Vienna, Austria: R Foundation for Statistical Computing). Available at: https://www.R-project.org/.
Reyns N. B., Eggleston D. B., Luettich R. A. (2006). Secondary dispersal of early juvenile blue crabs within a wind-driven estuary. Limnol. Oceanogr. 51, 1982–1995. doi: 10.4319/lo.2006.51.5.1982
Rosemond R. C., Paxton A. B., Lemoine H. R., Fegley S. R., Peterson C. H. (2018). Fish use of reef structures and adjacent sand flats: implications for selecting minimum buffer zones between new artificial reefs and existing reefs. Mar. Ecol. Prog. Ser. 587, 187–199. doi: 10.3354/meps12428
Scharf F. S., Manderson J. P., Fabrizio M. C. (2006). The effects of seafloor habitat complexity on survival of juvenile fishes: Species-specific interactions with structural refuge. J. Exper. Mar. Biol. Ecol. 335, 167–176. doi: 10.1016/j.jembe.2006.03.018
Sibley E. C. P., Elsdon T. S., Marnane M. J., Madgett A. S., Harvey E. S., Cornulier T., et al. (2023b). Sound sees more: A comparison of imaging sonars and optical cameras for estimating fish densities at artificial reefs. Fish. Res. 264, 106720. doi: 10.1016/j.fishres.2023.106720
Sibley E. C. P., Madgett A. S., Elsdon T. S., Marnane M. J., Harvey E. S., Fernandes P. G. (2023a). The capacity of imaging sonar for quantifying the abundance, species richness, and size of reef fish assemblages. Mar. Ecol. Prog. Ser. 717, 157–179. doi: 10.3354/meps14378
Silva R., Mendoza E., Marino-Tapia I., Martinez M. L., Escalante E. (2016). An artificial reef improves coastal protection and provides a base for coral recovery. J. Coast. Res. 75, 497–471. doi: 10.2112/SI75-094.1
Simonsen K. A., Cowan J. H. (2013). Effects of an inshore artificial reef on the trophic dyamics of three species of estuarine fish. Bull. Mar. Sci. 89, 657–676. doi: 10.5343/bms.2012.1013
Smith C. S., Paxton A. B., Donaher S. E., Kochan D. P., Neylan I. P., Pfeifer T., et al. (2021). Acoustic camera and net surveys reveal that nursery enhancement at living shorelines may be restricted to the marsh platform. Ecol. Engin. 166, 106232. doi: 10.1016/j.ecoleng.2021.106232
Tharp R. M., Hostetter N. J., Paxton A. B., Taylor J. C., Buckel J. A. (2024). Artificial structure selection by economically important reef fishes at North Carolina artificial reefs. Front. Mar. Sci. 11. doi: 10.3389/fmars.2024.1373494
Theuerkauf S. J., Puckett B. J., Eggleston D. B. (2021). Metapopulation dynamics of oysters: sources, sinks, and implications for conservation and restoration. Ecosphere 12, e03573. doi: 10.1002/ecs2.3573
Wei Y., Duan Y., An D. (2022). Monitoring fish using imaging sonar: capacity, challenges and future perspective. Fish Fish. 23, 1347–1370. doi: 10.1111/faf.12693
Keywords: ARIS, acoustic imaging, sonar, artificial reef, oyster restoration, Pamlico Sound, size spectra analysis, habitat
Citation: Grimes CE, Morley JW, Richie DN and McMains AR (2024) Fish abundance is enhanced within a network of artificial reefs in a large estuary. Front. Mar. Sci. 11:1459277. doi: 10.3389/fmars.2024.1459277
Received: 03 July 2024; Accepted: 05 November 2024;
Published: 22 November 2024.
Edited by:
John Logan, Massachusetts Division of Marine Fisheries, United StatesReviewed by:
Matthew E. Kimball, University of South Carolina, United StatesRyan Tharp, North Carolina State University, United States
Mark Rousseau, Massachusetts Division of Marine Fisheries, United States
Copyright © 2024 Grimes, Morley, Richie and McMains. This is an open-access article distributed under the terms of the Creative Commons Attribution License (CC BY). The use, distribution or reproduction in other forums is permitted, provided the original author(s) and the copyright owner(s) are credited and that the original publication in this journal is cited, in accordance with accepted academic practice. No use, distribution or reproduction is permitted which does not comply with these terms.
*Correspondence: James W. Morley, bW9ybGV5ajE5QGVjdS5lZHU=
†These authors share first authorship
 Charlotte E. Grimes1†
 James W. Morley
 Diandre′ N. Richie
 Andrew R. McMains