 Tong Cao1,2
 Feng Zhou1,2,3*
 Di Tian2,3*
 Qicheng Meng2,3
 Xiao Ma2,3
 Bin Wang4
 Qianjiang Zhang2,3
 Jiliang Xuan2,3
 Jianfang Chen1,2,3,4
 Daji Huang1,2
- 1Ocean College, Zhejiang University, Zhoushan, China
- 2State Key Laboratory of Satellite Ocean Environment Dynamics, Second Institute of Oceanography, Ministry of Natural Resources, Hangzhou, China
- 3Observation and Research Station of Yangtze River Delta Marine Ecosystems, Ministry of Natural Resources, Zhoushan, China
- 4Key Laboratory of Marine Ecosystem Dynamics, Ministry of Natural Resources, Second Institute of Oceanography, Ministry of Natural Resources, Hangzhou, China
The degradation of coastal seawater quality off the Changjiang Estuary and adjacent waters is typically associated with monsoon wind, ocean currents and inputs of terrestrial pollutants. In addition to these factors, the passage of typhoons can be also important in driving short-term fluctuations in coastal water quality. Using a coupled Regional Ocean Modeling Systems (ROMS) and carbon, silicate, and nitrogen ecosystem (CoSiNE) model with Eulerian tracers, we investigated the transport processes of pollutants discharged from the Changjiang during the passage of Typhoons Lingling and Tapah (2019). The model results show that Typhoons Lingling and Tapah significantly enhanced the southward transport of these pollutants, leading to a sudden and noteworthy degradation of water quality in the Zhejiang coastal region during early autumn, despite no considerable change in monsoon pattern or river discharge compared to normal years. As Lingling and Tapah successively passed through the East China Sea in September, the average nitrate concentration in the Zhejiang coastal waters rose by 77%, and the percentage of heavily polluted water increased by 28%. Our numerical experiments showed that the impacts caused by Lingling and Tapah on nitrate levels in these waters lasted for approximately 34 and 23 days, respectively. These results indicate that typhoons play a crucial role in regulating the transport of pollutants in coastal waters, with significant sub-seasonal effects on the marine biogeochemical environment.
1 Introduction
The coastal waters off Zhejiang Province, dotted with numerous estuaries and bays, play a vital role in providing abundant natural resources and supporting local economic and social development. However, due to excessive terrestrial pollutant discharge in recent decades, these coastal waters have faced escalating threats such as eutrophication and harmful algal blooms, resulting in significant degradation of water quality (Tang et al., 2006; Deng et al., 2010; Tong et al., 2017; Wang et al., 2018; Wen et al., 2021). The offshore water quality is also influenced by coastal land reclamation (Wang et al., 2021) and extreme weather events (Fabian et al., 2023; Zou et al., 2023).
The Changjiang (Yangtze River), the largest river in the Euro-Asian continent, discharges substantial amounts of freshwater (~2.64 × 10⁴ m3/s; Mei et al., 2015), sediments (~4.7 × 10⁸ t/yr; Yang et al., 2011), and dissolved inorganic nitrogen (DIN, ~3.4 × 10¹⁰ mol/yr; Dagg et al., 2004) into the East China Sea (ECS) and Yellow Sea. In summer, the Changjiang diluted water (CDW) mainly extends northeast towards the Jeju Strait, while in winter, it flows southwest towards the Taiwan Strait (Mao et al., 1963; Beardsley, 1983; Zhao, 1991; Zhu, 1997). This shift significantly contributes to seasonal variations in water quality of the Zhejiang coastal waters, which shows relatively better conditions in spring and summer but poorer qualities with high levels of DIN in autumn and winter (Wu et al., 2022). Therefore, the Changjiang is considered as a primary nutrient source for the Zhejiang coastal waters, profoundly affecting their water quality (Liu et al., 2007; Xu et al., 2016, 2022).
Seasonal variations of the CDW are influenced by factors such as monsoon winds, river discharge, and shelf circulation, while shorter-term fluctuations are driven by synoptic winds and tides (Zhou et al., 2009a; Wu et al., 2014; Cao et al., 2024). Researches have indicated that changes in wind patterns over days to weeks can greatly regulate the CDW pathway and its associated pollutant transport. Xuan et al. (2012) found that a detachment of low salinity water off the Changjiang Estuary (CJE) was related to a strong southeasterly wind in summer. The summertime offshore extension towards the Jeju Strait was remarkably reduced due to a weak southerly wind (Chang et al., 2014). It may completely disappear (Lee et al., 2017), and even shift southward along the Zhejiang coast under the influence of typhoon winds (Zhang et al., 2018). However, few efforts have been made to link typhoons in the ECS with water quality in the Zhejiang coastal region, which is the primary focus of this study.
In recent years, the water quality in the Zhejiang coastal region has gradually improved due to major pollution control measures since 2014 (Figure 1C). However, the percentage of heavily polluted water unexpectedly rose to 42.9% in 2019, nearly 1.2 times the average of the period of water quality improvement (2015–2022). This increase may be highly associated with the strong northerly winds during the successive passage of Typhoons Lingling (No. 1913) and Tapah (No. 1917) over the eastern ECS in September. This study aims to (1) investigate the impacts of Lingling and Tapah on pollutant transport processes off the CJE and its adjacent waters, and (2) quantitatively assess the extent to which these pollutants affect the water quality of the Zhejiang coastal waters. The findings presented here will deepen our understanding of the influence of typhoons passing through the ECS on pollutant transport off the CJE, and provide valuable scientific insights for marine pollution prevention in the Zhejiang coastal waters and other regions facing similar challenges.
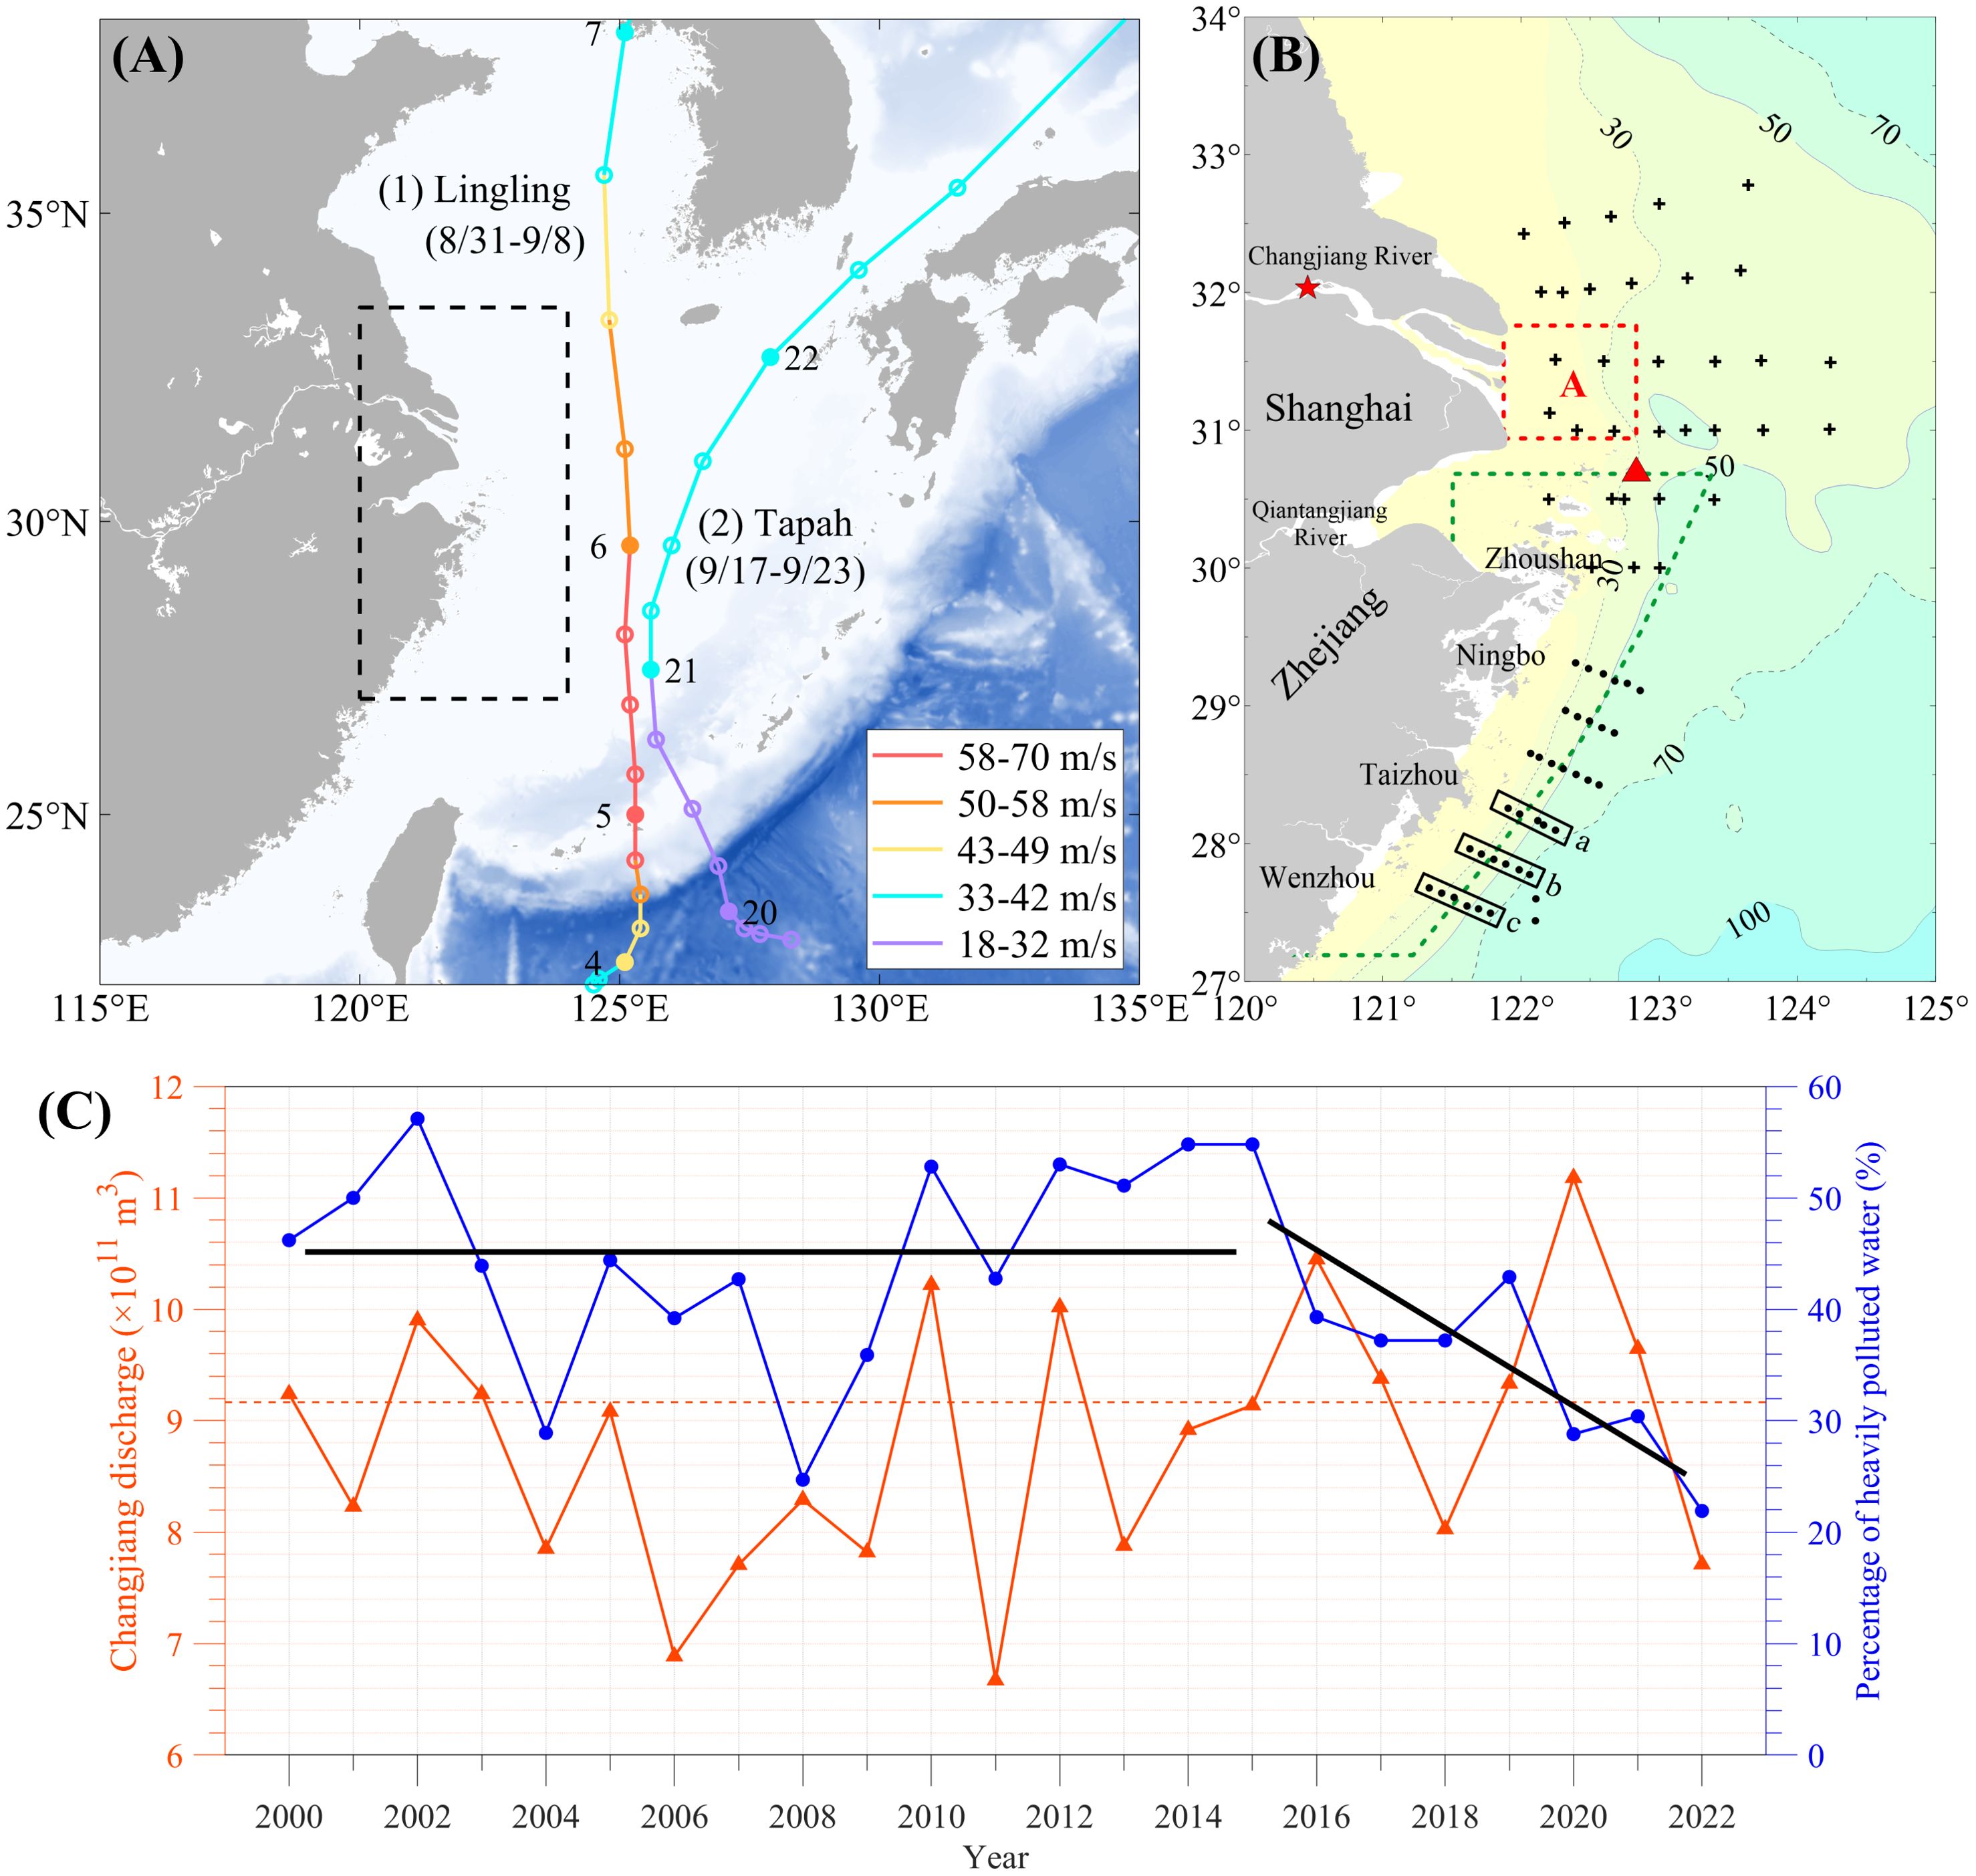
Figure 1. (A) The best tracks and maximum sustained wind speeds of Lingling and Tapah in September 2019. Solid dots denote typhoon positions at 06:00 UTC on the dates labeled by corresponding numbers, while hollow dots denote typhoon positions at 00:00, 12:00, or 18:00 UTC. Dashed black rectangle denotes the study region. (B) The CJE and its adjacent ECS, along with bathymetry. Sampling stations from the August and September surveys are denoted by black plus signs (+) and dots, respectively. Red triangle marks the location of the Shengshan buoy, and the red star denotes the Changjiang input. The dashed red line highlights the region for quantitative analyses, and the dashed green line denotes the Zhejiang coastal waters based on a simplified administrative division. The black boxes show transects a–c in the southern Zhejiang coastal waters. (C) Annual mean discharge of the Changjiang (red line) and percentage of heavily polluted water (inferior to Category IV) in the Zhejiang coastal waters (blue line) from 2000 to 2022. Dashed red line represents the decade-average discharge of 2013–2022, and the solid black line represents the long-term trend in the percentage of heavily polluted water.
2 Materials and methods
2.1 Typhoons Lingling and Tapah
In September 2019, Lingling and Tapah successively passed northward over the eastern ECS (Figure 1A), with similar wind directions and comparable paths, affecting the pollutant transport processes off the CJE. The tropical cyclone best track data, including the center positions, 1-min maximum sustained winds, and the radius of maximum wind, were provided at 6-hourly resolution by the U.S. Joint Typhoon Warning Center (JTWC; https://www.metoc.navy.mil/jtwc/jtwc.html).
Lingling formed east of the Philippine Sea and developed into a tropical storm on September 2. Early on September 5, it underwent rapid intensification and soon became a Category 4 (on the Saffir-Simpson Scale) typhoon east of Taiwan, with a maximum wind speed of approximately 61 m/s and a minimum central air pressure of about 928 hPa. Lingling weakened gradually as it traveled through the ECS, eventually making landfall in western North Korea.
Tapah originated east of Taiwan on September 18 and moved northwestward. On September 21, it intensified into a Category 1 typhoon after entering the ECS, reaching a maximum wind speed of approximately 33 m/s and a minimum central air pressure of around 967 hPa. Tapah then weakened rapidly, moving northeastward and fully dissipating in the East Sea (Japan Sea) by September 23.
2.2 Survey data
Data on annual Changjiang discharge from 2000 to 2022 were collected at Datong hydrological station from the River Sediment Bulletin of China, compiled by the Chinese Ministry of Water Resources. Annual reports regarding the water quality of the Zhejiang coastal waters for the same period were extracted from the Ecological and Environmental Status Bulletin and the Marine Environment Bulletin of Zhejiang Province, published by the Ministry of Ecological Environment and the Zhejiang Provincial Bureau of Ocean and Fisheries, respectively.
Two ship-borne surveys were conducted off the CJE and in the Zhejiang coastal waters during August 16–21 (before the typhoon passages) and September 24–27 (after the typhoon passages), 2019, from which salinity and nitrate data were collected for model validation. The August and September surveys took in situ measurements at 33 and 37 stations, respectively (Figure 1B). Salinity was measured throughout most of the water column with a bin size of 1 m using an SBE911 plus CTD. Seawater samples were collected from the surface, middle, and bottom layers, and were immediately filtered through 47 mm GF/F glass fiber filters. The nitrate concentrations of the filtered samples were measured using a continuous flow analyzer (San++, Skalar, Breda, Netherlands) with colorimetric methods following Grasshoff et al. (2009).
2.3 Numerical model
The coupled physical-biogeochemical model utilized in this study was configured specifically for the CJE and its adjacent seas. The physical module was based on the Regional Ocean Modeling System (ROMS; Shchepetkin and McWilliams, 2005; Haidvogel et al., 2008), which has been broadly employed to investigate estuaries and open seas (Zhou et al. 2009b; Zhou et al., 2015, Zhou et al., 2017a; Xie and Li, 2018; Tian et al., 2022). The biogeochemical module was based on the Carbon, Silicate, and Nitrogen Ecosystem (CoSiNE) model (Chai et al., 2002; Xiu and Chai, 2014). The coupled ROMS-CoSiNE model domain covered the entire Bohai Sea, Yellow Sea, and ECS, spanning from 117.5°E to 132.0°E and from 23.5°N to 41.0°N, with a fine horizontal resolution of 1/24°×1/24° and 30 vertical S-coordinate layers (Song and Haidvogel, 1994). This model was well-calibrated and able to reproduce the seasonal and synoptic variations of the CDW extension and associated nutrient transport (Zhou et al., 2015, 2020; Meng et al., 2022).
The coupled ROMS-CoSiNE model was initialized using climatological mean January values based on multi-year observations (Chen, 1992), and spun up for ten years driven by climatological forcings from the Comprehensive Ocean-Atmosphere Data Set (COADS) monthly fields (Da Silva et al., 1994), including surface wind stress, shortwave radiation, heat, and freshwater fluxes. The climatological run outputs during December served as the initial field for a realistic run from 2018 to 2019. To establish suitable boundary conditions for the realistic run, the daily average outputs from the Hybrid Coordinate Ocean Model (HYCOM) simulations were utilized to specify temperature, salinity, velocity, and sea surface elevation. Fifteen tidal components derived from the TPXO9 global tide model (Egbert and Erofeeva, 2002) were considered at the offshore open boundary, accounting for over 95% of the total tidal variability in the study region. As for surface forcings, the surface heat and freshwater fluxes were obtained from the European Centre for Medium-Range Weather Forecasts latest reanalysis (ERA5) product (Hersbach et al., 2020). The 10-m wind field was extracted from the Cross-Calibrated Multi-Platform (CCMP) wind vector analysis product, at resolutions of 0.25°×0.25° and 6-hourly (Atlas et al., 2011). Considering the underestimation of high typhoon wind speeds in the CCMP dataset (Uhlhorn and Black, 2003; Uhlhorn et al., 2007; Klotz and Uhlhorn, 2014), a blended wind field was constructed for Lingling (due to its strong intensity), which was more representative than that from the CCMP data (see the Supplementary Material for further information on wind field reconstruction). Daily runoff and monthly nutrient concentrations of the Changjiang were specified by measurements at Datong hydrological station. The modeled phytoplankton concentration (mmol N/m3) was converted to chlorophyll-a (Chl-a) concentration (mg/m3) using a conversion factor of 1.58 g Chl-a per mole nitrogen (Cloern et al., 1995). This ratio is frequently employed in modeling studies of the ECS (Liu et al., 2010; Zhou et al., 2017b; Tian et al., 2022). More details on the model setup were elaborated by Zhou et al. (2015), and additional information regarding parameter configuration and model validation in the ECS was provided by Zhou et al. (2017). The realistic run of 2019 was referred to as Exp.R, and the 6-hourly average model outputs were analyzed in this study.
2.4 Sensitivity experiments
Four sensitivity experiments with different wind forcings were designed to assess the separate and combined impacts of Lingling and Tapah, as well as monsoon winds, on pollutant transport off the CJE (Table 1). Exp.C was the climatological experiment using 6-hourly climatological wind field (2001–2020). In Exp.L, Exp.T and Exp.L+T, the realistic wind fields were replaced with the climatological wind field for the periods of Lingling (September 4–7), Tapah (September 17–22) and these two typhoons, respectively.
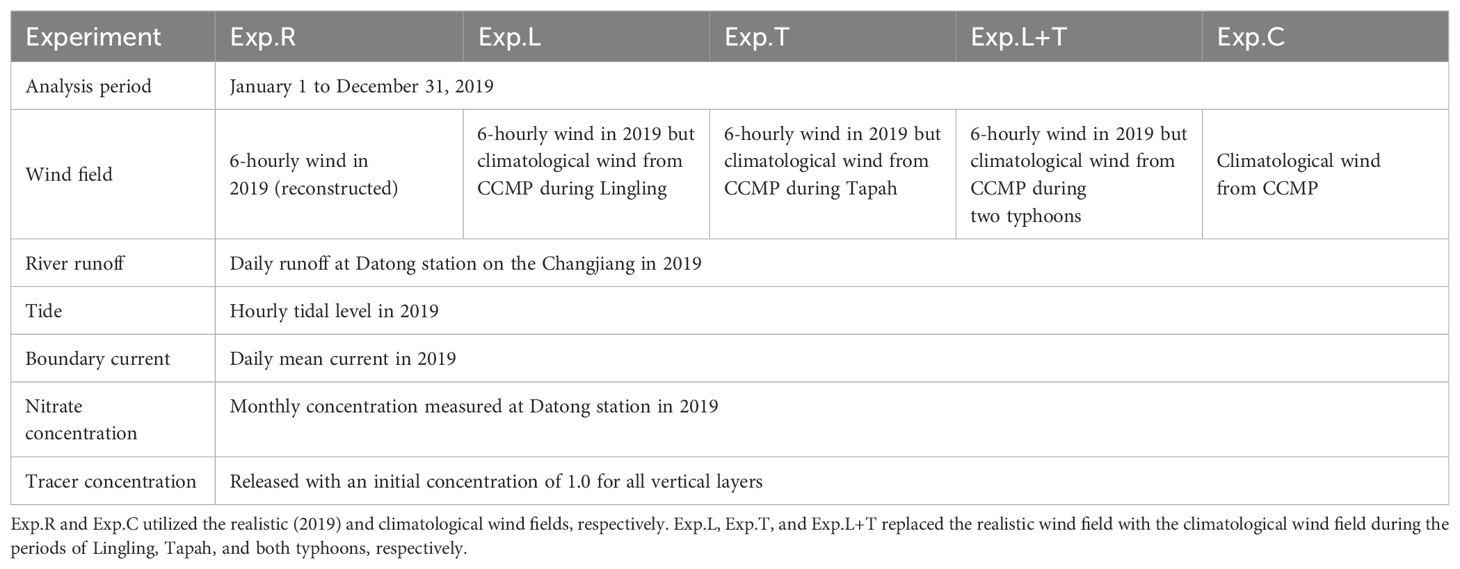
Table 1. Design of five numerical experiments.
Given that this study primarily aimed to investigate the impacts of wind fields on pollutant transport off the CJE, other factors remained consistent across all experiments. Note that the influence of typhoon-induced variations in river runoff was not considered, due to the challenge of differentiating whether alterations in pollutant transport resulted from changes in river runoff or wind field.
To illustrate the differences in wind forcings across these experiments, wind vectors averaged over the region covering the Changjiang outlets and adjacent waters (dashed red box in Figure 1B, hereinafter referred to as region A) were calculated (Figure 2). During the passage of Lingling, the wind speed off the estuary mouth increased from 6.3 m/s to a maximum of 24.7 m/s (northerly) at 12:00 on September 6, and then rapidly decreased to 1.3 m/s, while the wind direction underwent a significant counterclockwise shift within 48 hours. During the passage of Tapah, the wind speed increased from 7.2 m/s to a peak of 16.6 m/s at 12:00 on September 21, with an average speed of 10.6 m/s. The wind speed was relatively low during the monsoon transition in early autumn 2019, with variable wind directions. In Exp.C, the climatological winds showed limited variability, with a monthly average speed of 3.9 m/s and a prevailing direction of northeasterly.
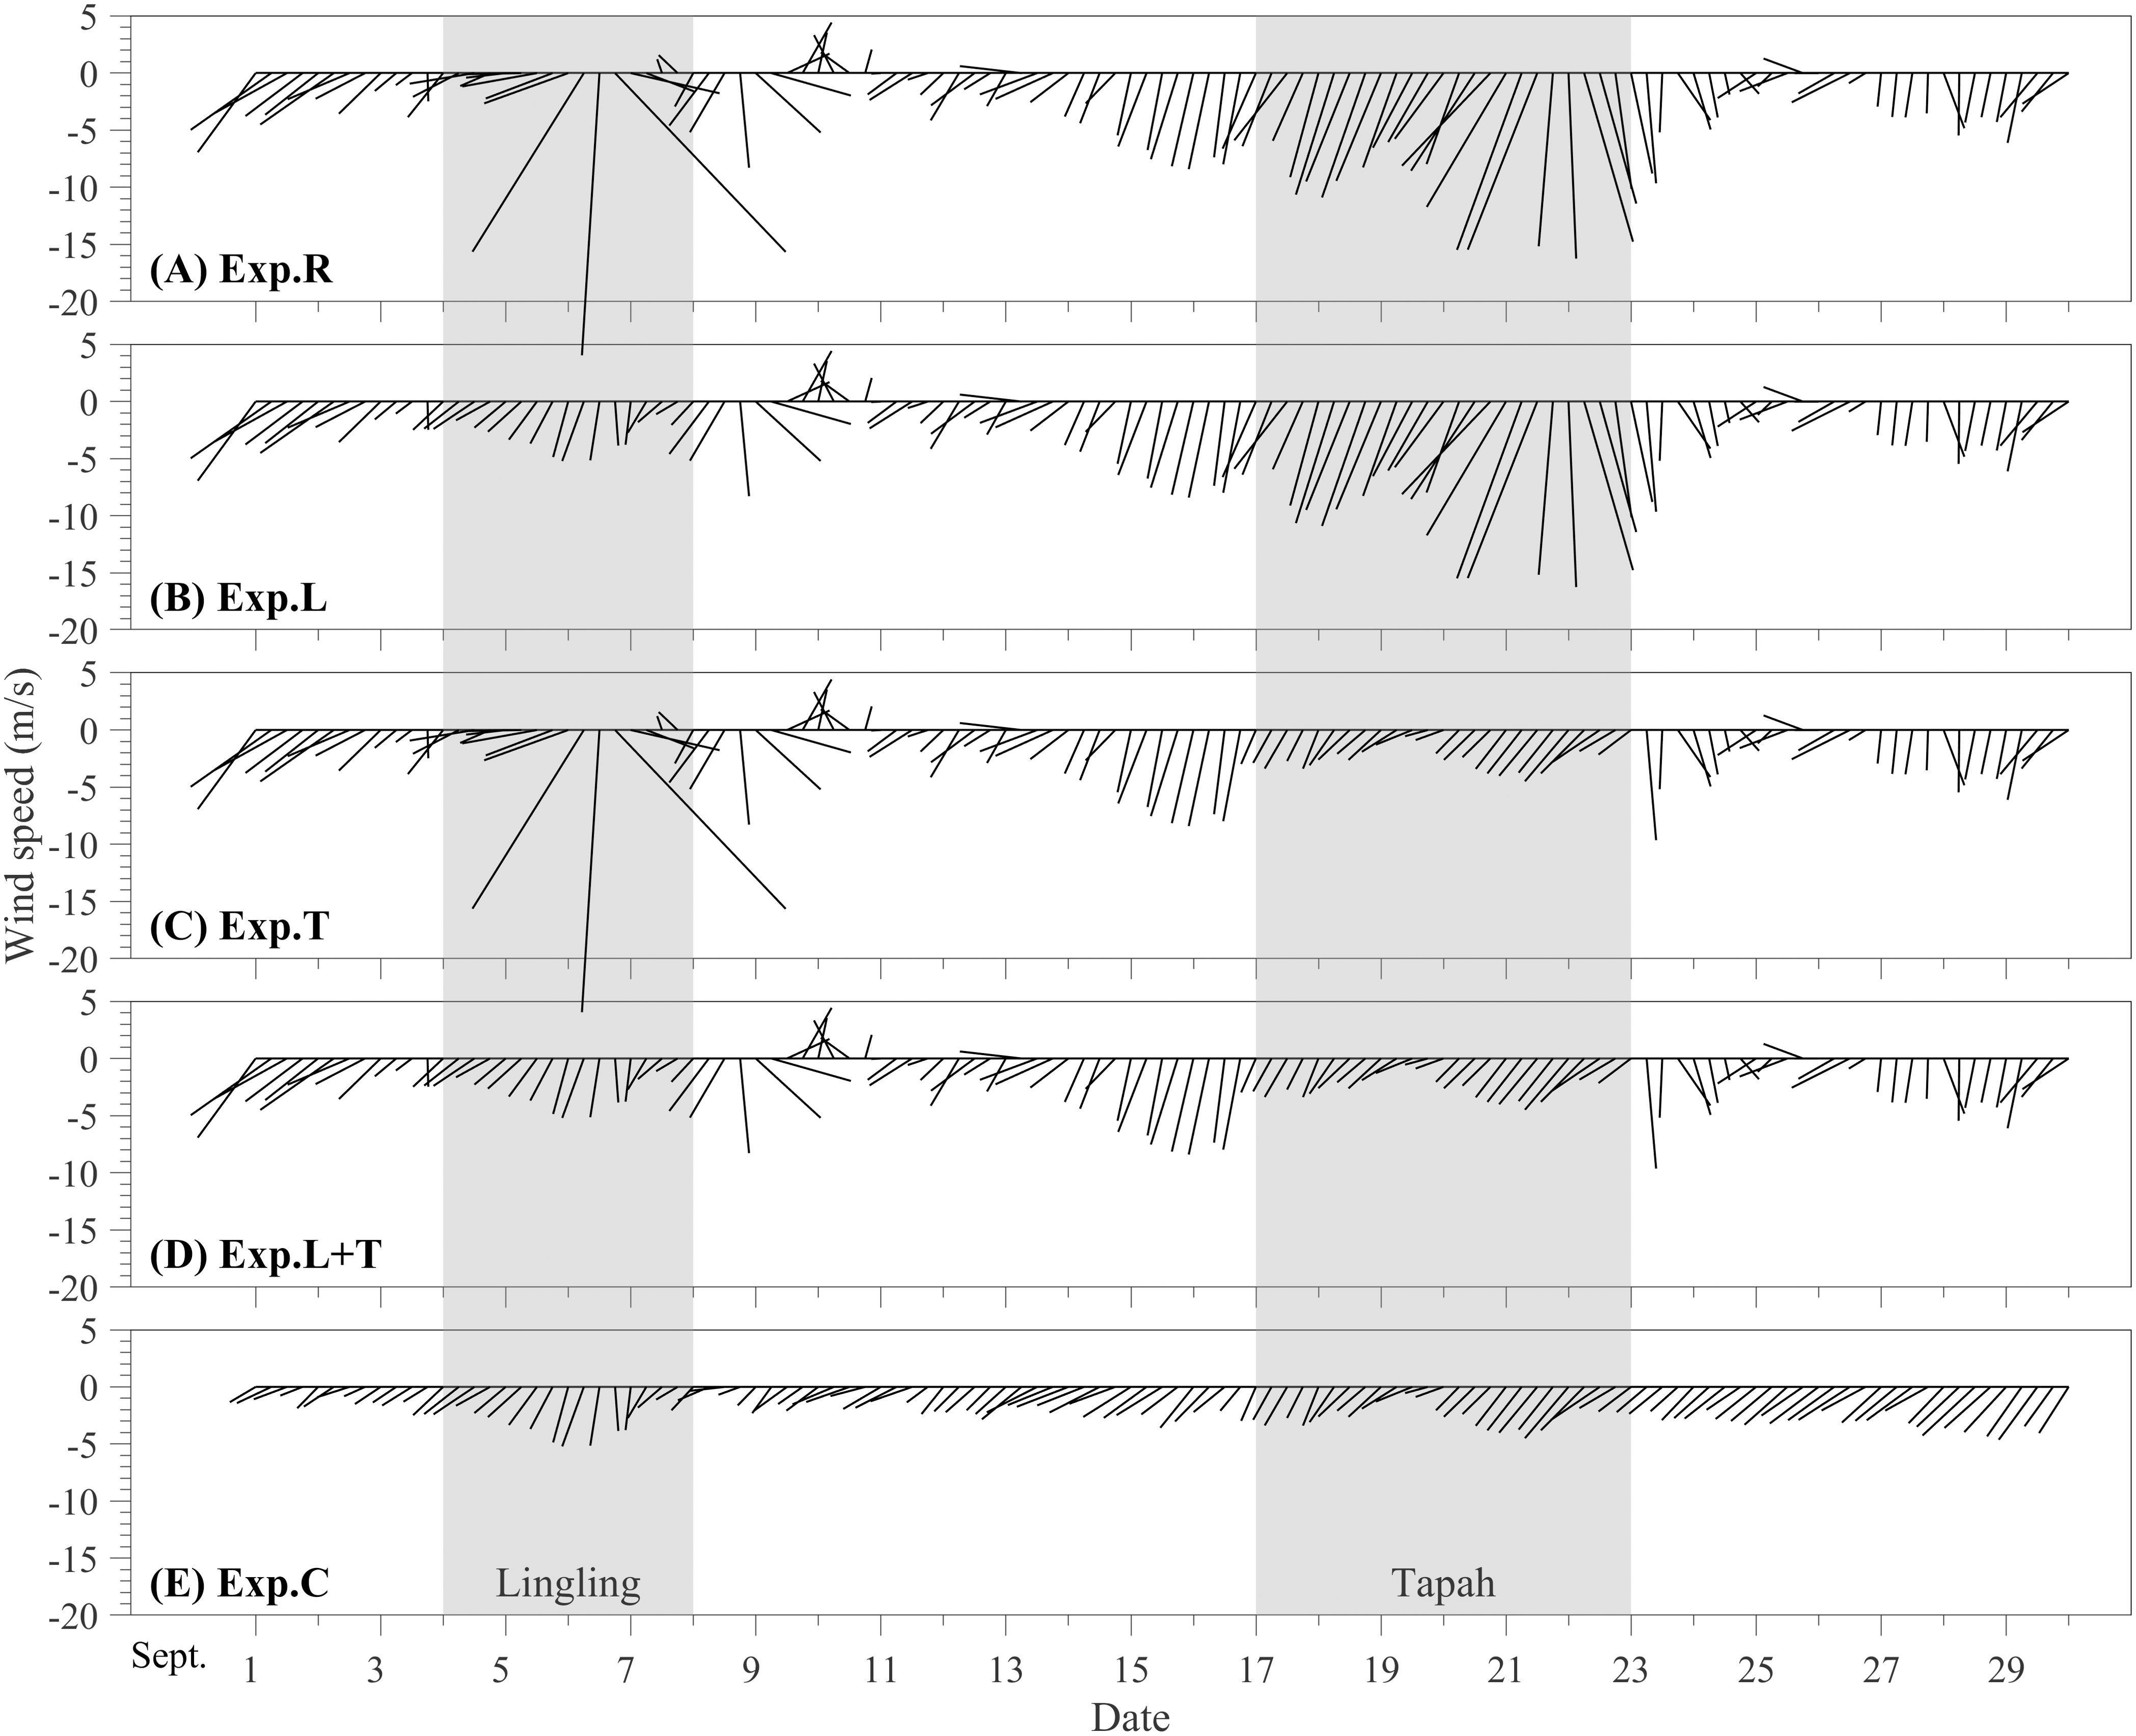
Figure 2. Time series of 6-hourly wind vectors averaged over region A during September in (A) Exp.R, (B) Exp.L, (C) Exp.T, (D) Exp.L+T and (E) Exp.C. The gray shadings represent the periods of Lingling and Tapah.
2.5 Eulerian approach
Ocean pollutants (e.g., nitrogen and phosphorus) undergo both physical processes (i.e., advection and diffusion) and biogeochemical processes involving diverse biological variables and environmental components. An Eulerian tracer was utilized to specifically investigate the effects of physical processes on pollutant transport. This tracer, representing conservative pollutants, changes its concentration solely through advection and dispersion (Yang et al., 2012; Du and Shen, 2017; Zhang et al., 2019), in contrast to nitrate, which represents non-conservative pollutants. Given that the Changjiang is the predominant source of terrestrial pollutants for the ECS (Beardsley et al., 1985; Zhang, 1996; Liu et al., 2009), we introduced conservative pollutants via a continuous tracer injection into the downstream area (marked by a red pentagram in Figure 1B) in every experiment. The initial tracer concentration was set to 1.0 (arbitrary unit) for all vertical layers, while the initial concentration within the model domain was zero. The tracer concentrations were recorded at a 6-hourly interval.
2.6 Water quality standards
According to the national seawater quality standards of China (GB 3097–1997), seawater quality is classified into five categories, namely clean water (Category I), relatively clean water (Category II), slightly polluted water (Category III), moderately polluted water (Category IV) and heavily polluted water (inferior to Category IV). Among monitored pollutants, DIN stands out as a significant threat to water quality of the Zhejiang coastal waters. The maximum DIN concentration recorded in these waters during 2019 has exceeded the Category IV standard by nearly sixfold, as reported by the Ecological and Environmental Status Bulletin. The permissible limits of DIN for Category I to IV are 0.2, 0.3, 0.4, and 0.5 mg/L, respectively.
Nitrate is generally the predominant form of DIN in estuaries and adjacent coastal waters (Statham, 2012), constituting over 84% in regular seasons and over 95% in flood season along the Changjiang (Wu et al., 2023). Since only two forms of DIN, nitrate (NO3-N) and ammonium (NH4-N), were simulated in the model, this study assumed a constant fraction of 90% for nitrate in DIN to assess seawater quality by comparing the modeled nitrate concentrations against the water quality standards.
3 Results
3.1 Model validation
The comparison between modeled and observed salinity in the Zhejiang coastal waters revealed that, the model could accurately capture the spatial characteristics and effectively reproduce the spreading pattern of the CDW (Figures 3A–D). Both modeled and observed salinity demonstrated the presence of low-salinity water (< 28) in the Zhejiang coastal region following Tapah. The root-mean-square error (RMSE) and mean absolute error (MAE) for surface (bottom) salinity were 1.10 and 0.85 (1.13 and 0.84), respectively, with a correlation coefficient of 0.92 (0.66) (p<0.01). Discrepancies mostly occurred in coastal regions with small islands, mainly due to inadequate spatial resolution. For vertical distributions along transects a–c, as indicated in Figure 1B, the RMSE and MAE were 0.84 and 0.65, respectively, with a correlation coefficient of 0.88 (p<0.01) (Figure 4). Evaluations of salinity suggested that our model has a reliable performance in reproducing the behavior of the CDW extension under typhoon conditions.
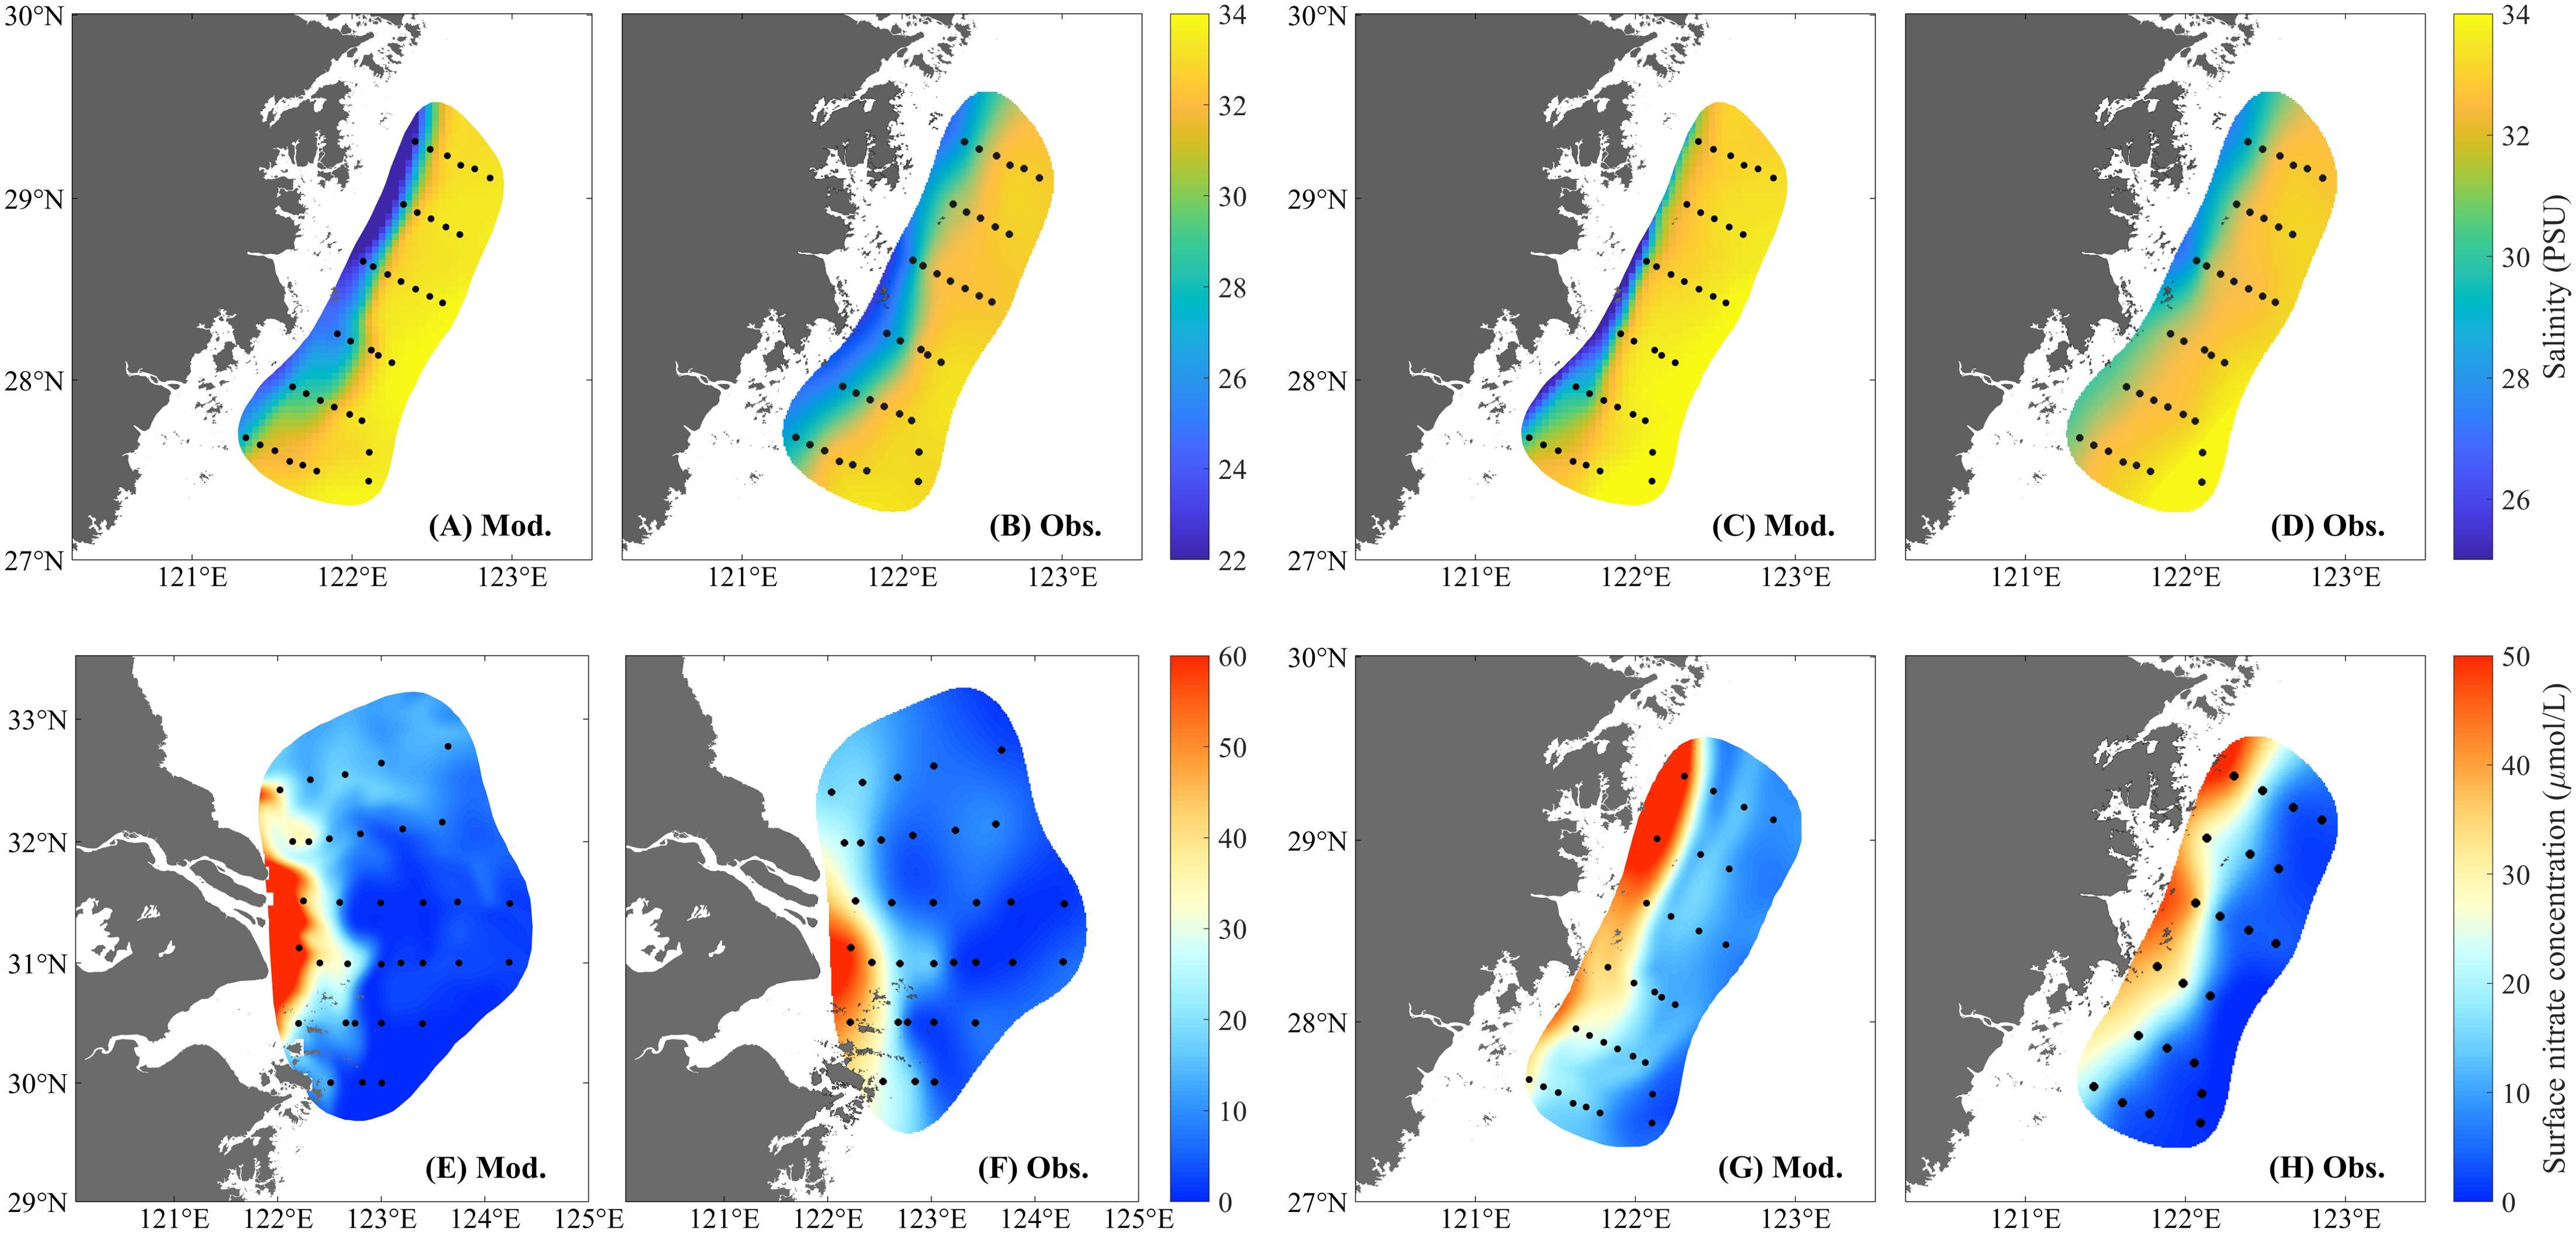
Figure 3. Modeled and observed salinity and nitrate concentrations. (A, B) Surface and (C, D) bottom salinity during September 24–27, 2019. Surface nitrate concentrations during (E, F) August 16–21 and (G, H) September 24–27, 2019.
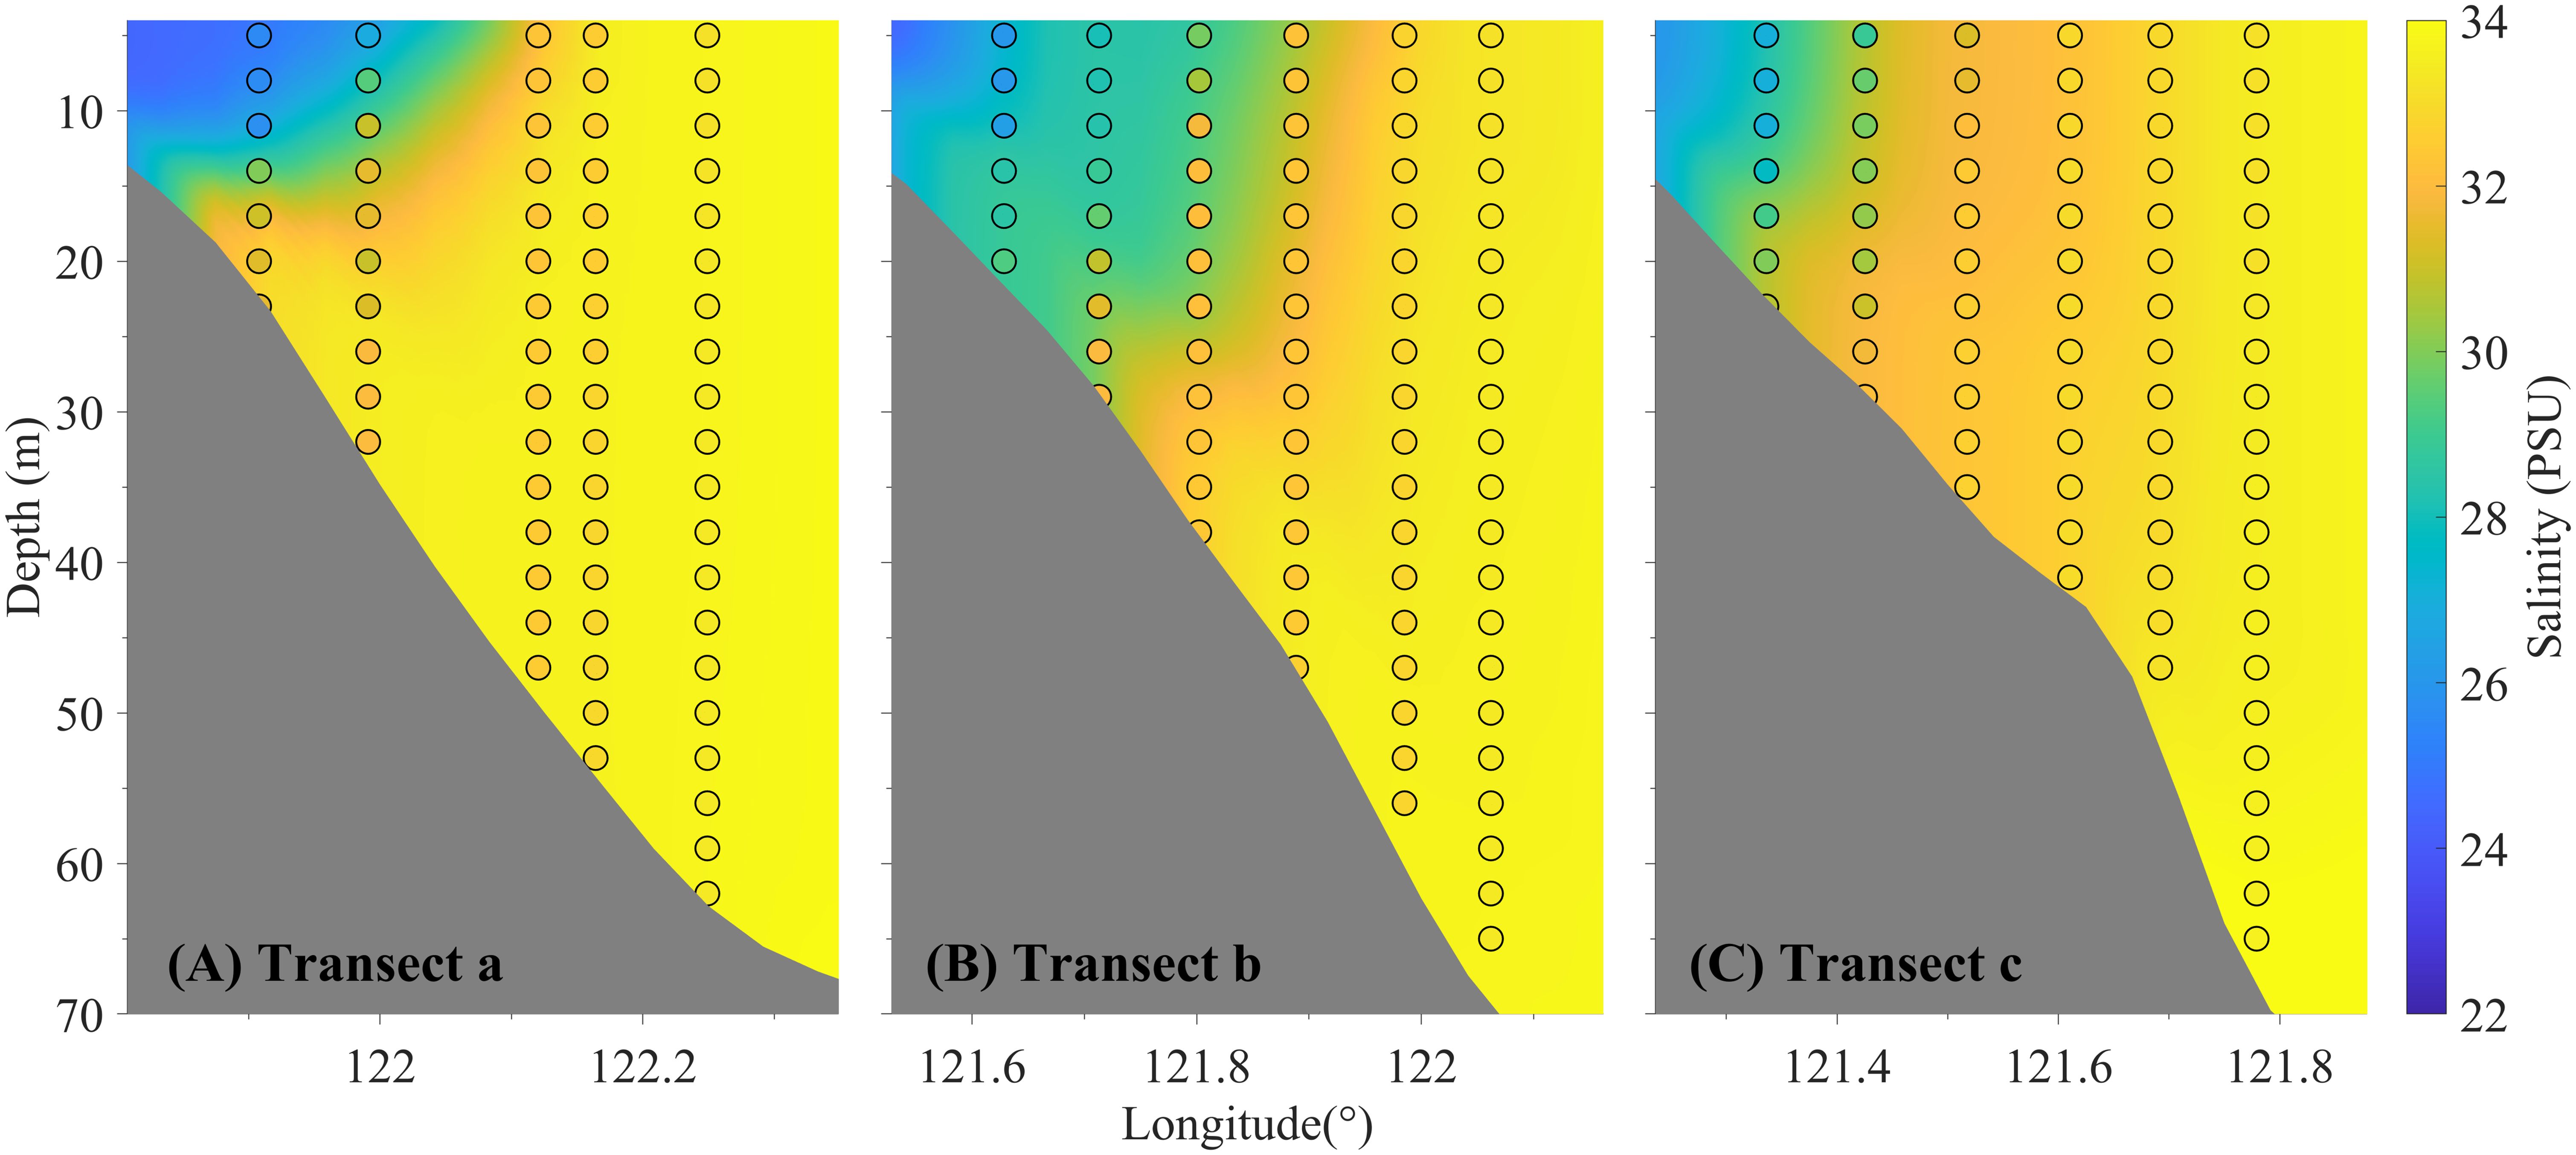
Figure 4. Modeled (shading) and observed (dots) salinity along transects (A–C) during September 26-27, 2019.
The modeled surface nitrate concentration agreed reasonably well with field observations off the CJE and in the Zhejiang coastal waters (Figures 3E–H). The RMSE and MAE for surface nitrate concentrations during the survey in August (September) were 7.07 and 8.81 (6.25 and 7.12) μmol/L, respectively, with a correlation coefficient of 0.81 (0.92) (p<0.01). Both modeled and observed results exhibited similar spatial patterns, suggesting a satisfactory skill of the model in reproducing the spatial and temporal variations in nitrate concentrations.
3.2 Influence of typhoons on pollutant transport
Figure 5 shows the spatiotemporal variations in nitrate and tracer concentrations before and after the typhoon passage. Prior to Lingling’s arrival (September 1–3), due to weak seaward momentum, high-concentration nitrate (marked by a 60 μmol/L contour) accumulated near the estuary mouth, forming a bulge shape. This structure was completely disrupted by Lingling, with the majority of nitrate rapidly moving southward, and a southwestward extension of lower concentrations (marked by a 20 μmol/L contour) along the Zhejiang coast (September 8–10).
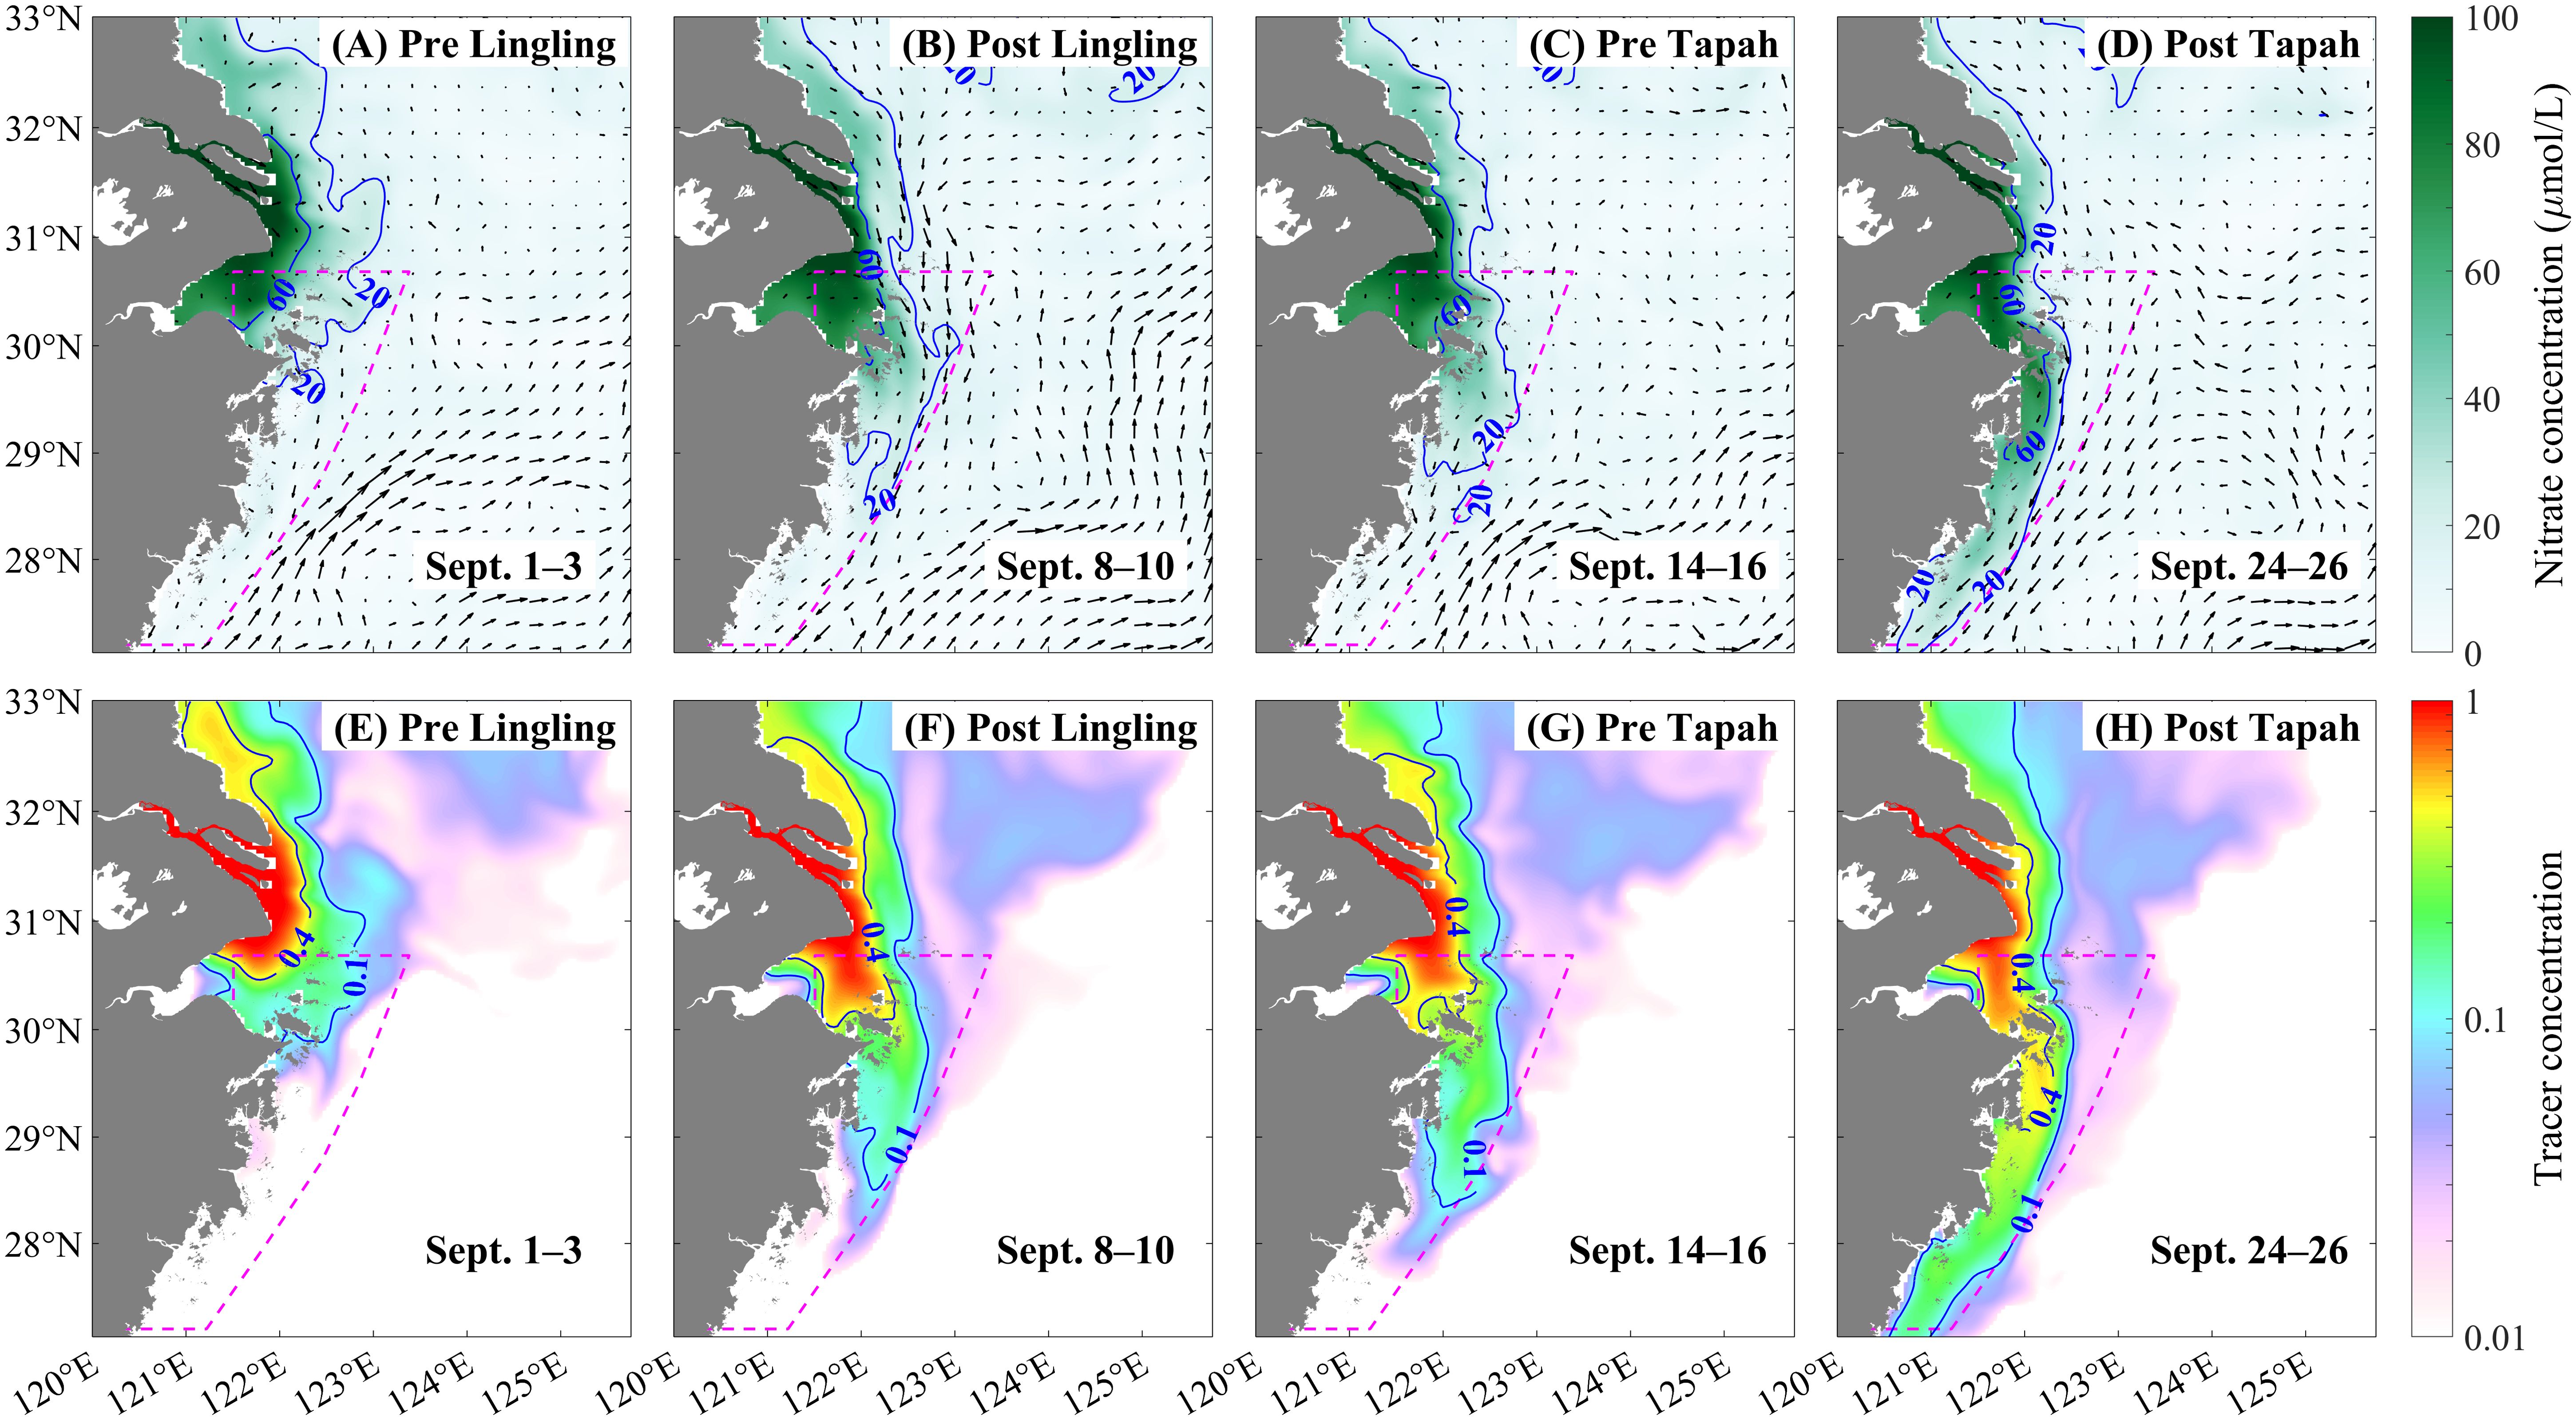
Figure 5. Depth-averaged nitrate concentration and passive tracer field (shading), along with current field (arrow) before and after the typhoon passage in Exp.R. Upper panel: spatial distributions of nitrate concentrations and current fields, averaged during (A) September 1–3, (B) September 8–10, (C) September 14–16, and (D) September 24–26. Lower panel is similar, but for tracer concentrations averaged during (E) September 1–3, (F) September 8–10, (G) September 14–16, and (H) September 24–26. The dashed magenta lines denote the Zhejiang coastal waters.
The nitrate distribution remained largely unchanged until Tapah passed through, where high concentrations reached the Ningbo coastal region and lower concentrations extended throughout the Zhejiang coastal waters (September 24–26). Notably, the average nitrate concentration in the Zhejiang coastal waters (indicated by the dashed green line in Figure 1B) increased from 18.5 to 26.5 μmol/L during Lingling, and subsequently from 26.3 to 32.7 μmol/L during Tapah. The spatiotemporal variations in the tracer field were broadly consistent with those in the nitrate field (Figures 5E–H). The increase in average tracer concentration during Lingling (0.08) was nearly 1.3 times that during Tapah (0.06), paralleling the ratio (1.25) of changes in average nitrate concentration.
If Lingling or Tapah had not passed through this region, where would pollutants off the CJE and adjacent waters have been transported? To what extent would these pollutants have affected the Zhejiang coastal waters? To address these questions, we carried out Exp.L, Exp.T and Exp.L+T to examine the separate and combined impacts of Lingling and Tapah, respectively. The results revealed that, Lingling and Tapah significantly enhanced the southward transport of pollutants off the CJE, adversely affecting the water quality in the Zhejiang coastal region (Figure 6). In the absence of individual typhoon, the average nitrate concentration increased by 2.3 and 3.2 μmol/L during the periods of Lingling and Tapah, respectively. As expected, the sum of these two values closely matched the combined increase of 5.7 μmol/L during the period of the two typhoons in Exp.L+T. Note that the spatial distribution differences in nitrate and tracer between experiments with and without the typhoon exhibited similar patterns in coastal regions west of the 30-m isobath, with correlation coefficients of 0.88 (p<0.01) during Lingling (Figures 6B, C) and 0.90 (p<0.01) during Tapah (Figures 6E, F). This finding suggested that physical processes could exert a remarkable influence on pollutant transport during short-term extreme weather events like typhoons.
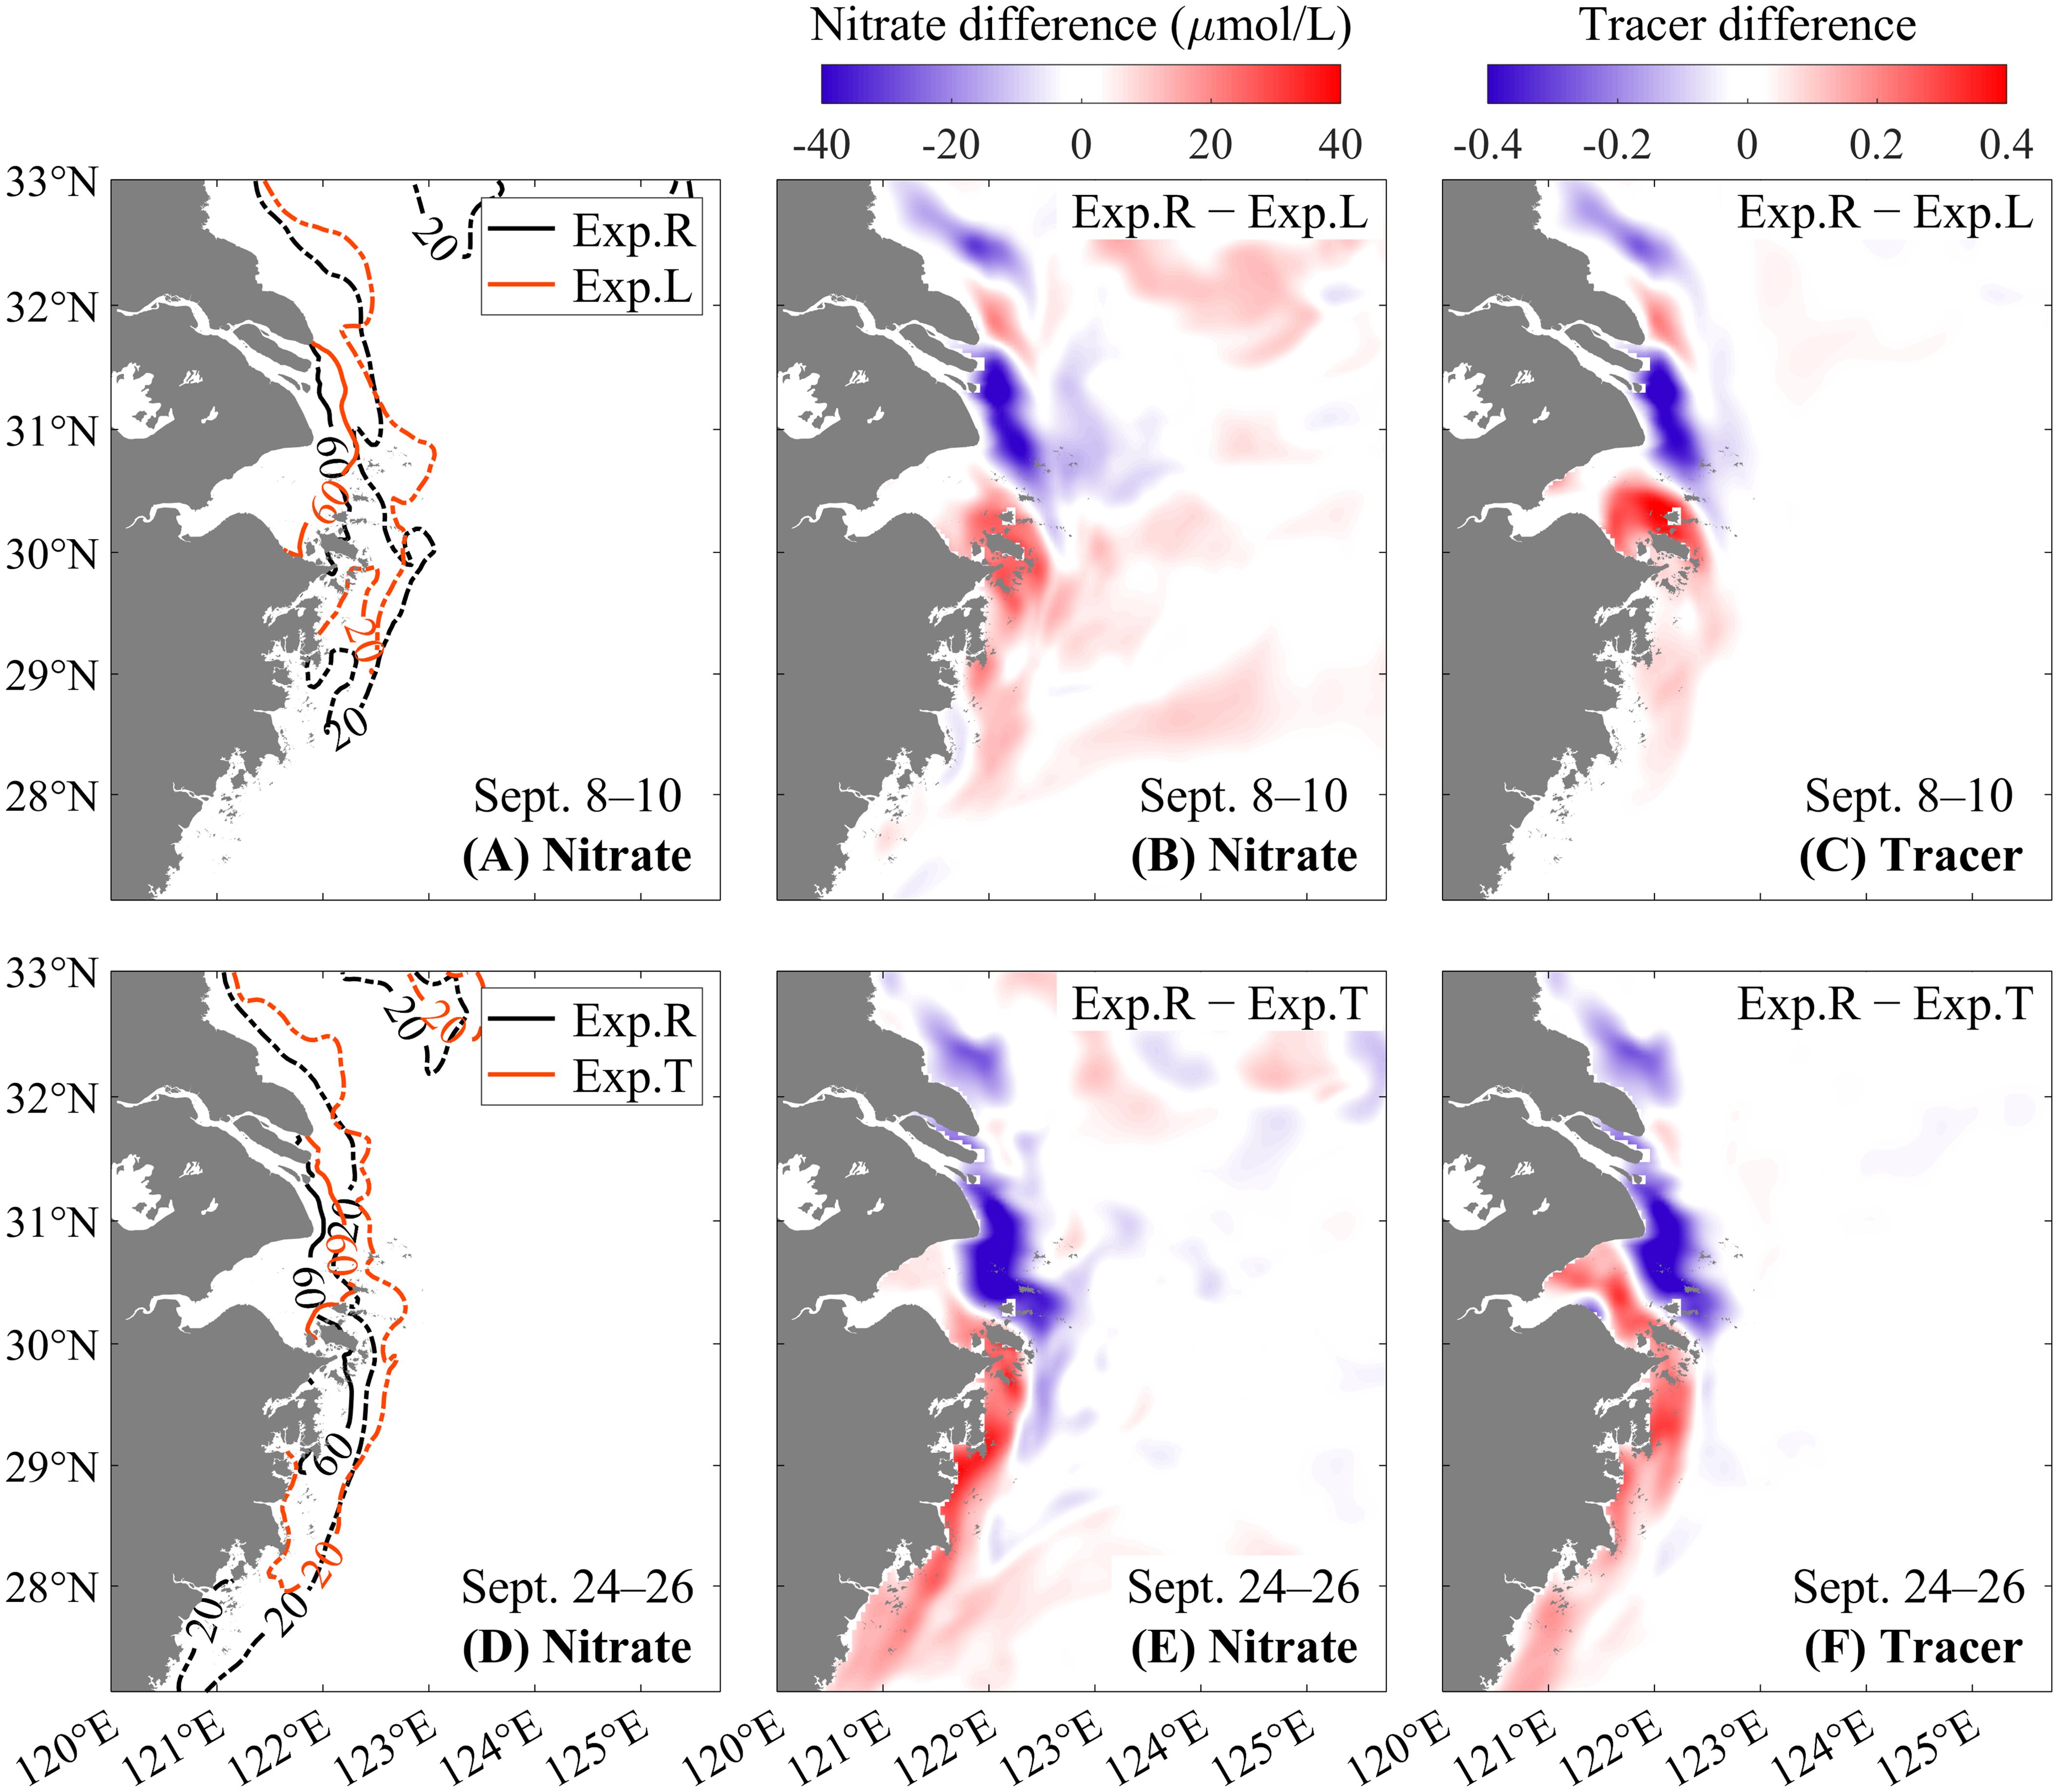
Figure 6. Spatial patterns of (A, D) depth-averaged nitrate concentrations, and differences in (B, E) nitrate and (C, F) tracer concentrations under wind conditions with and without the typhoon (upper panel: Lingling, lower panel: Tapah).
3.3 Budget analyses
To quantitatively assess the impacts of Lingling and Tapah on pollutant transport off the estuary mouth, we calculated the masses () of nitrate and tracer across each bordering section of region A during either typhoon event. The masses were determined by integrating their respective fluxes (), the product of concentration and flow velocity, over a specified period:
Here, represents the concentration of nitrate or tracer, is the flow velocity at the cross-section, and is a unit normal vector heading inward (positive entering the region). is the total water depth, is the section length, and is time. The units for nitrate and tracer masses are mol and m3, respectively.
The budget analyses indicated that, Lingling and Tapah significantly affected the north-south pollutant transport off the estuary mouth (Figure 7). Influenced by the typhoons, the net nitrate mass across the southern section during Lingling and Tapah were 5.62 and 3.47 Gmol, respectively, accounting for nearly 6% and 4% of the total nitrate flux from the Changjiang in 2019. The net southward transports during Lingling and Tapah were respectively 4.1 and 7.4 times larger than those in experiments without the corresponding typhoon. These ratios were higher than those obtained from tracer experiments (3.6 and 5.4; Figures 7C, D), primarily due to greater inputs from the northern section, as nitrate was non-conservative and had multiple sources. Note that the difference in net southward transports between Exp.R and Exp.L+T closely matched the total of those differences derived from Exp.R−Exp.L and Exp.R−Exp.T, suggesting that the combined impact of the two typhoons was approximately equal to the sum of their individual impacts (see Supplementary Figure 2). Based on a momentum balance analysis, this significant southward transport was driven predominantly by strong local southward wind stress in the coastal region and a substantial cross-shore sea level gradient due to continuous seawater accumulation in nearshore areas (Figure 8).
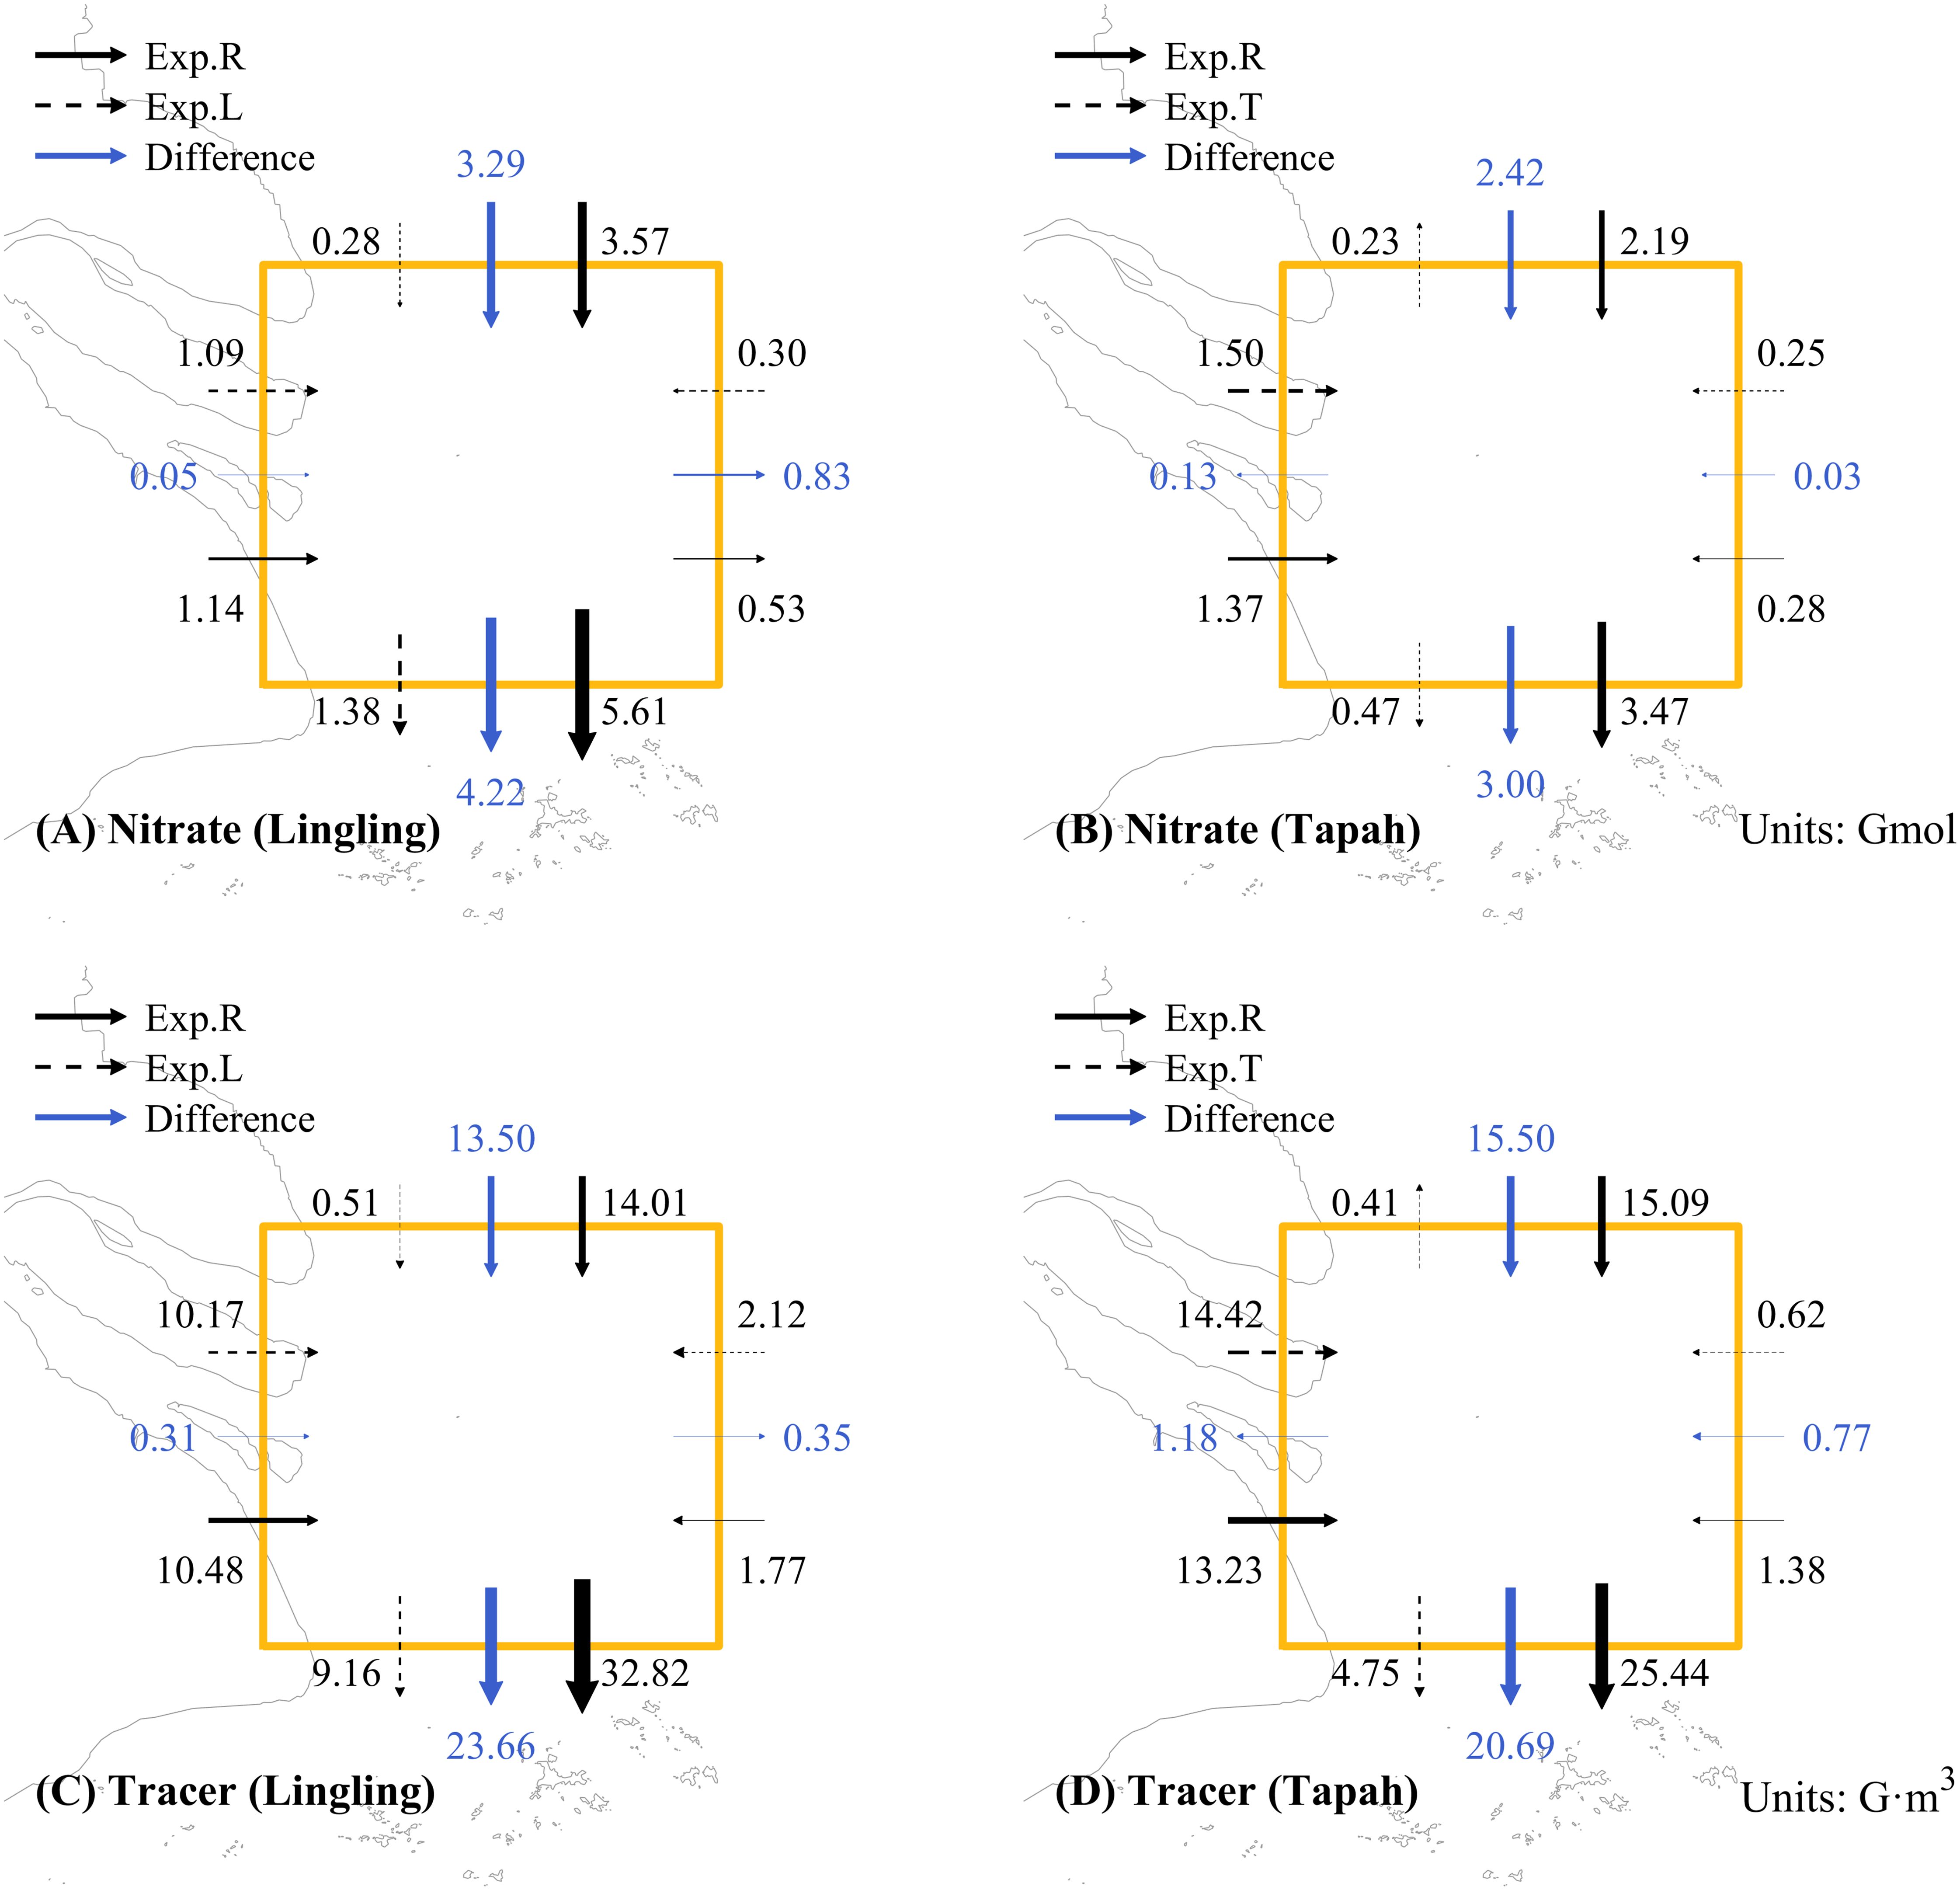
Figure 7. Budget analyses of nitrate and tracer mass off the estuary mouth during the periods of (A, C) Lingling and (B, D) Tapah. Solid and dashed black arrows represent the estimated net transports with and without the typhoon, respectively; blue arrows represent the differences between the two experiments.
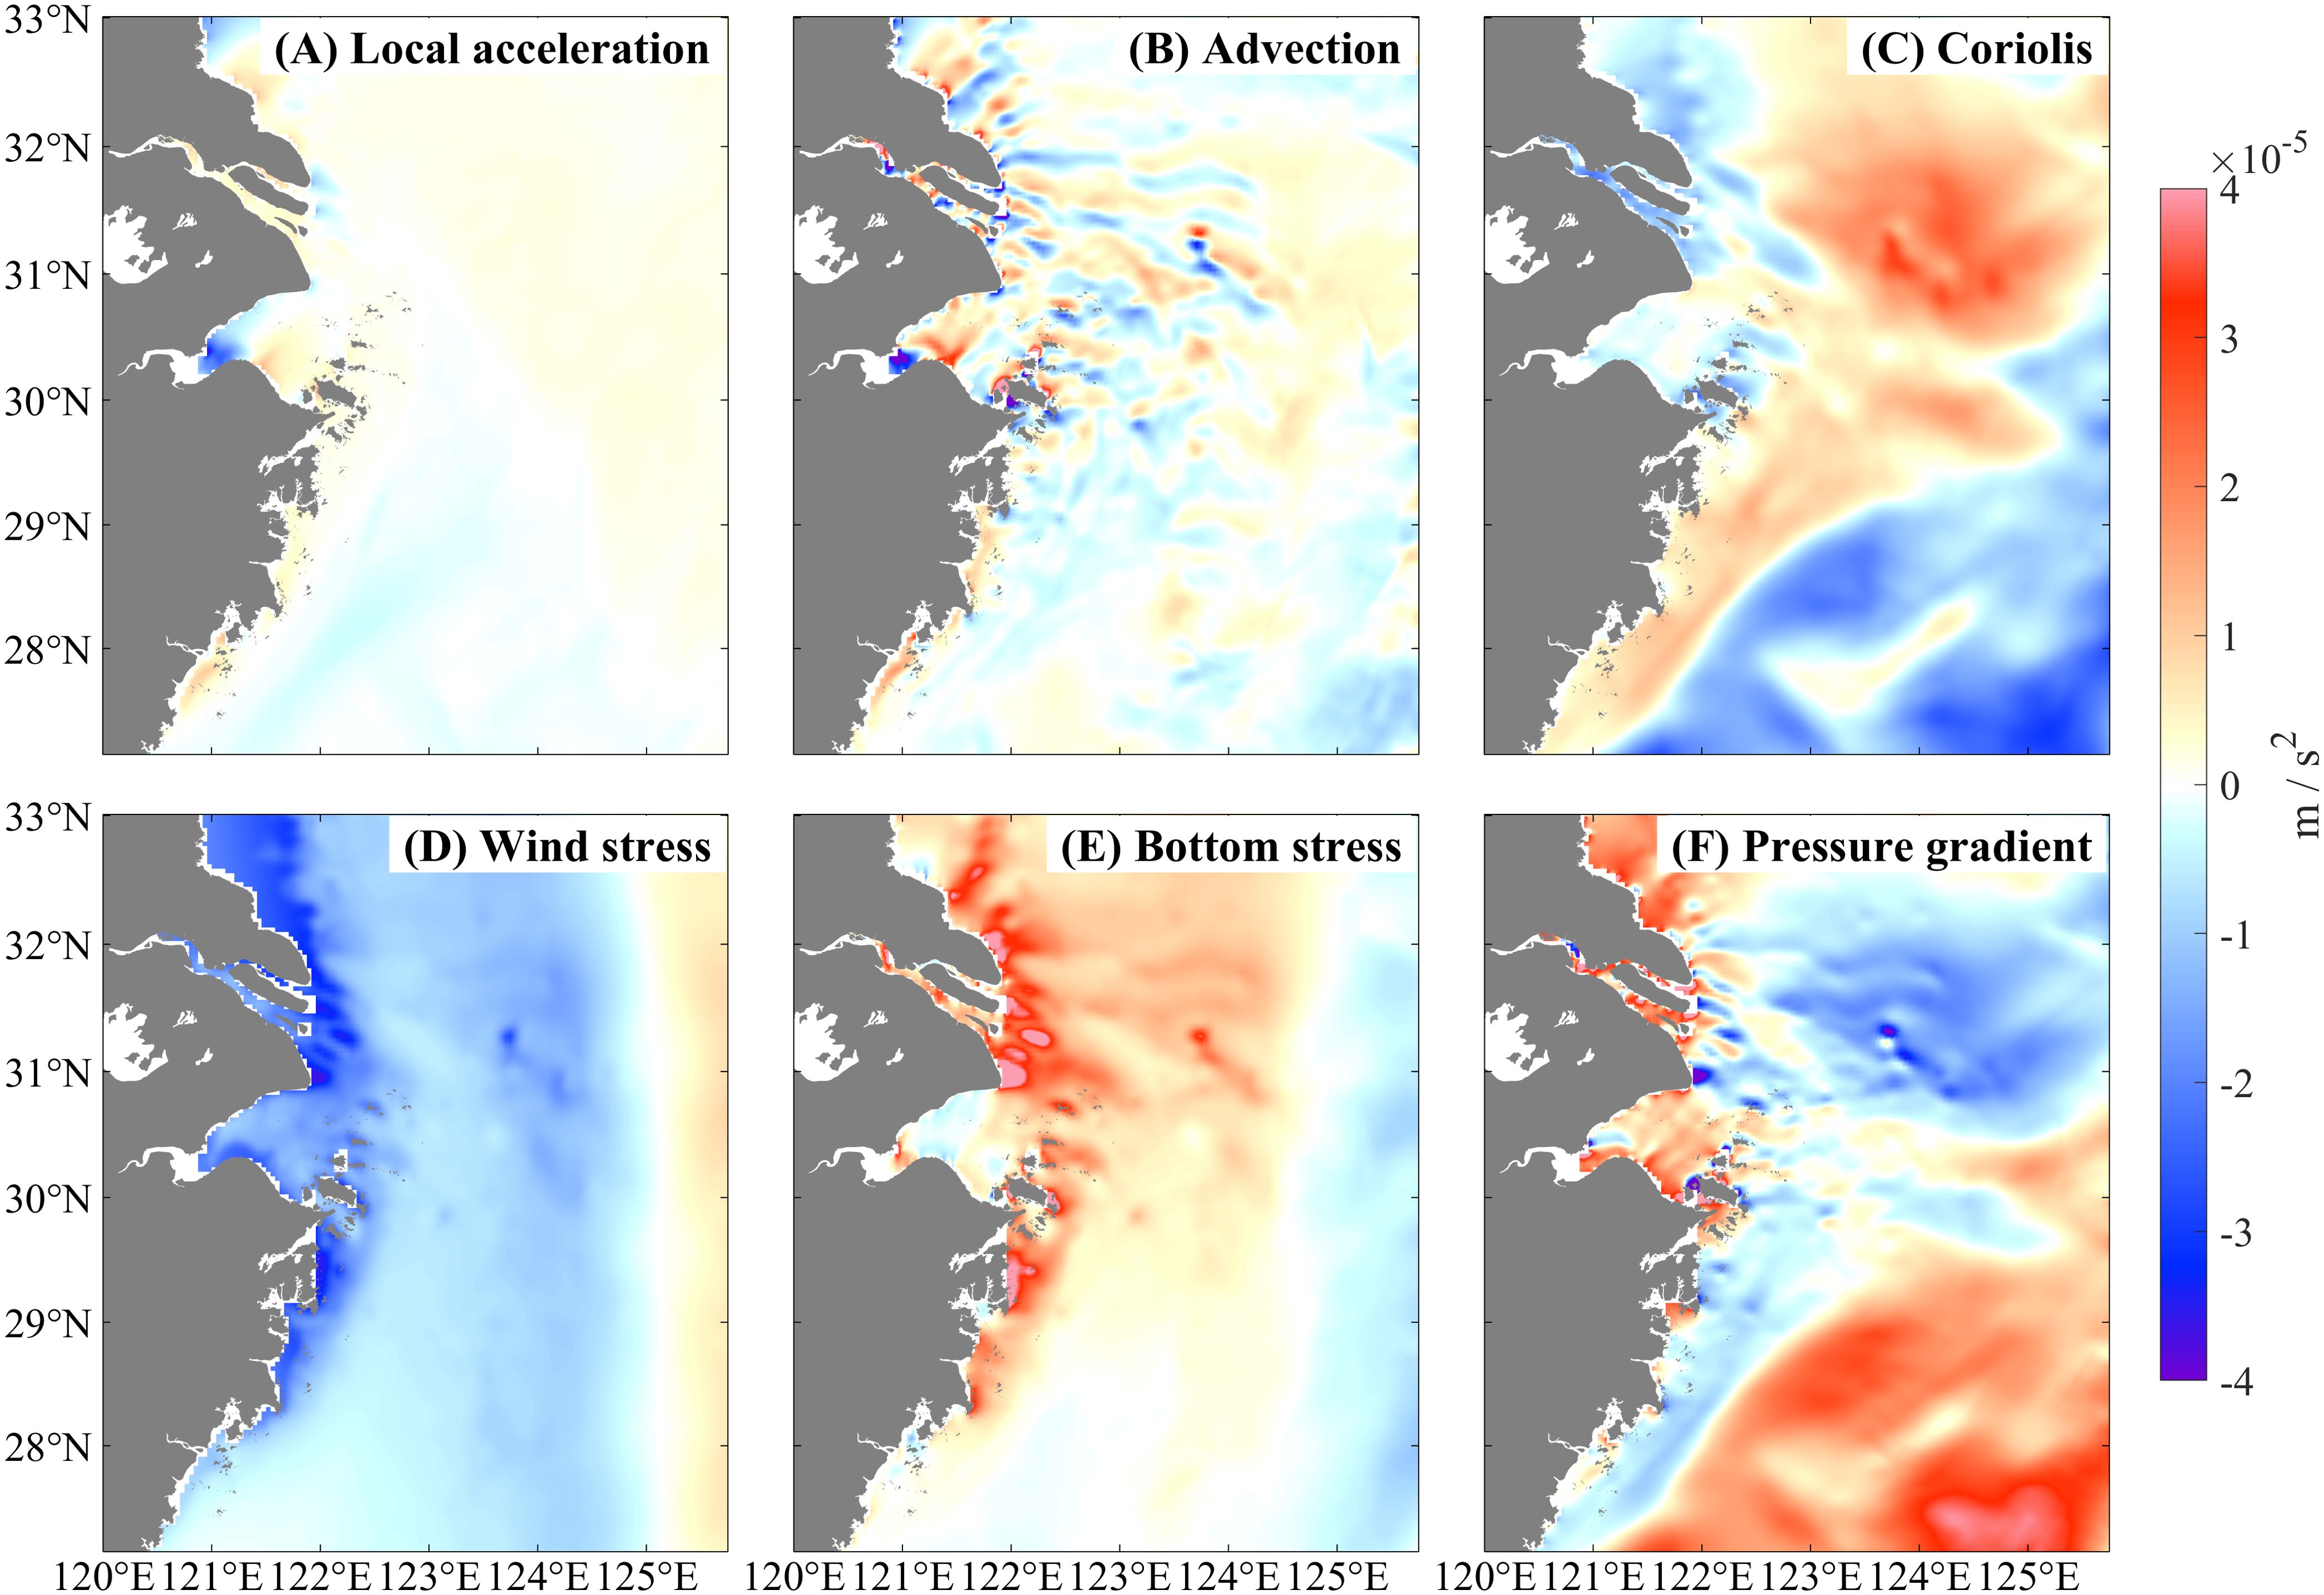
Figure 8. Spatial distributions of v-momentum terms for depth-averaged currents during Lingling consisting of (A) local acceleration, (B) advection, (C) Coriolis, (D) wind stress, (E) bottom stress, and (F) pressure gradient terms. Positive and negative values represent terms towards the north and south directions, respectively.
3.4 Lasting effects
To quantitatively describe the pollutant intrusion into the Zhejiang coastal waters, the mean concentrations of nitrate and tracer were estimated, and significant increases were observed during the typhoons (Figure 9). In Exp.R, the average nitrate concentration peaked at 26.6 and 32.8 μmol/L on September 9 (post Lingling) and 24 (post Tapah), respectively. As these two typhoons passed through, the average nitrate concentration gradually decreased. By October 7 (October 9), the mean nitrate concentrations in Exp.R and Exp.L (Exp.T) became identical, suggesting a lasting effect of Lingling (Tapah) on nitrate levels for approximately 34 (23) days. Note that the tracer concentrations took about 10 days longer than nitrate to return from typhoon-affected levels to normal conditions, since nitrate decreased partly due to phytoplankton uptake (Figure 9B).
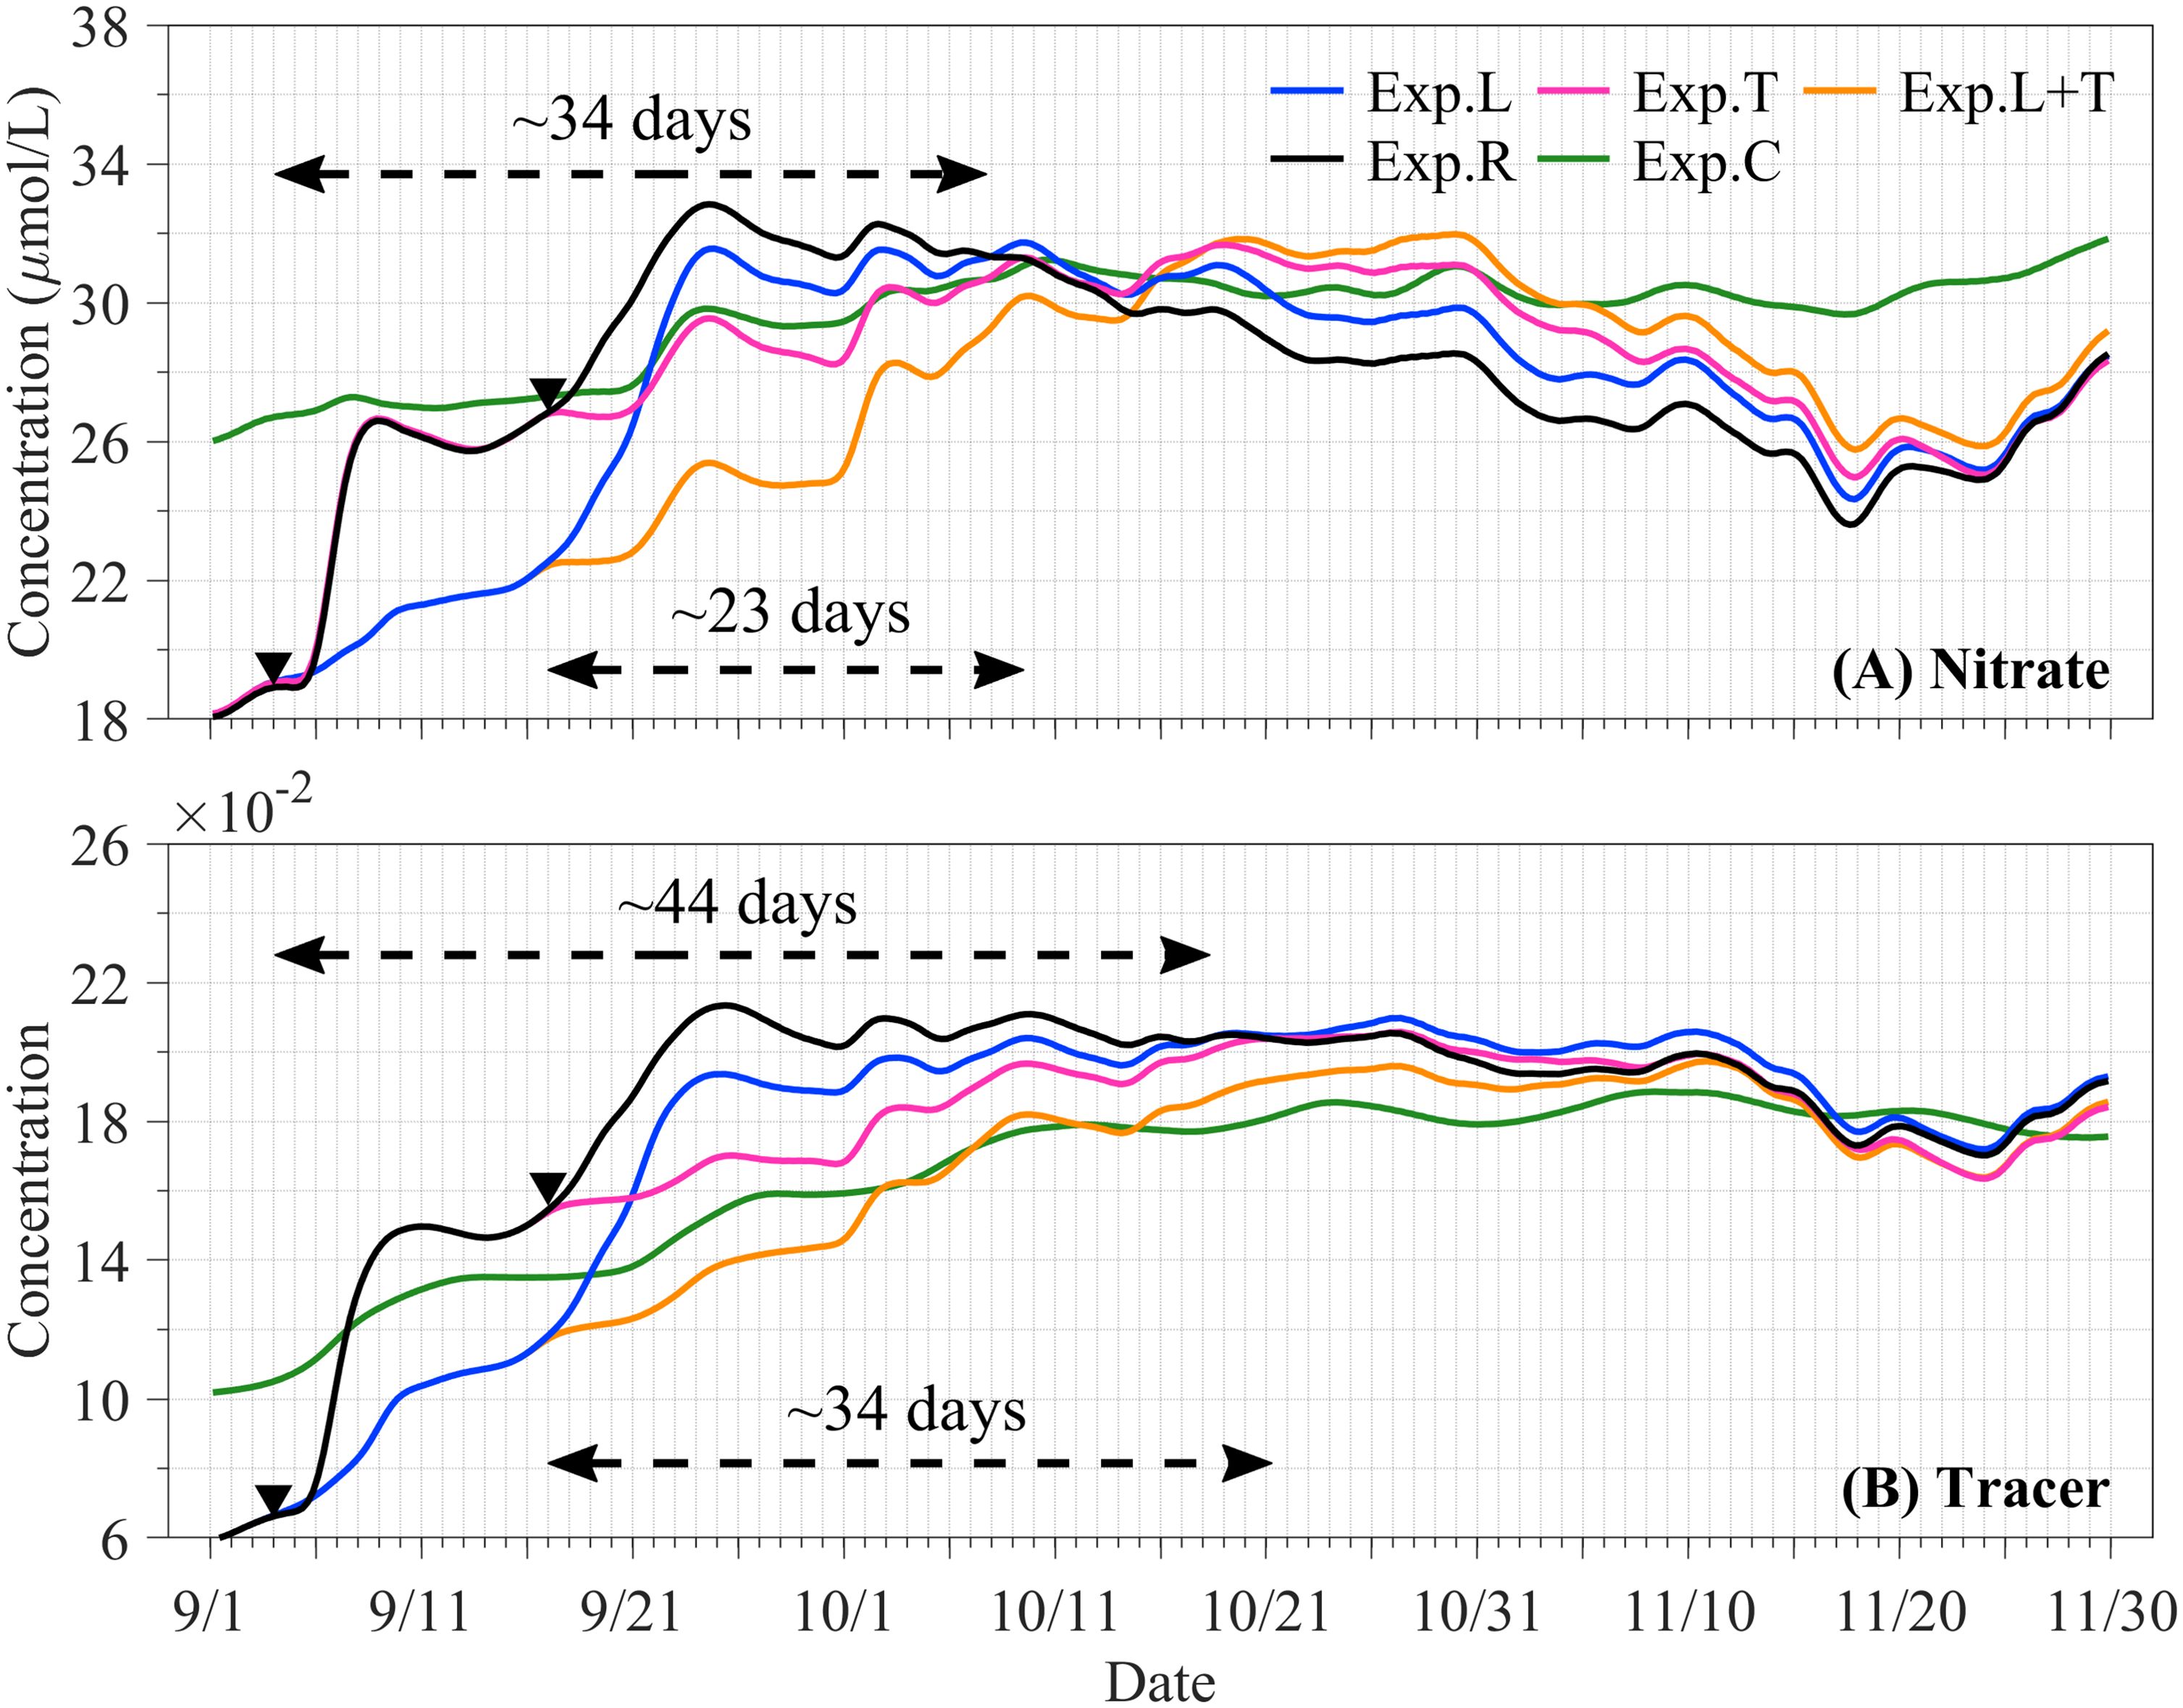
Figure 9. Temporal evolutions of the average concentrations of (A) nitrate and (B) tracer in the Zhejiang coastal waters from five experiments. Solid inverted triangle symbols represent the arrival times of Lingling and Tapah near the CJE in sequential order. Dashed arrows represent the periods when the average concentrations from Exp.R returned to the values of those from Exp.L and Exp.T.
Due to the influence of Lingling, both modeled and GOCI-observed surface Chl-a concentrations off the CJE and adjacent waters showed significant increases (Figures 10A, B). The Chl-a concentration during September 11–14 was much higher than that during August 21–24, with the maximum change rate exceeding 3. The temporal evolution of the rate of changes in modeled surface Chl-a concentration showed a consistent trend with that from GOCI-observed results (with spatial coverage of >75%), suggesting that the Chl-a concentration in the Zhejiang coastal waters peaked ~1–2 weeks after the passage of Lingling (Figure 10C). A similar time lag between the typhoon event and peak biomass was also revealed in other modeling studies of this region (Zhou et al., 2020). Tapah also induced an increase in Chl-a concentration, though to a lesser extent, probably because phosphate (PO4), the primary limiting nutrient in the CJE and adjacent waters, was insufficient to support enhanced phytoplankton growth and reproduction (Fan and Song, 2014; Liu et al., 2016). The nitrate/phosphate ratio in the Zhejiang coastal waters during Tapah (82.2) was nearly 2 times larger than that during Lingling (40.6).
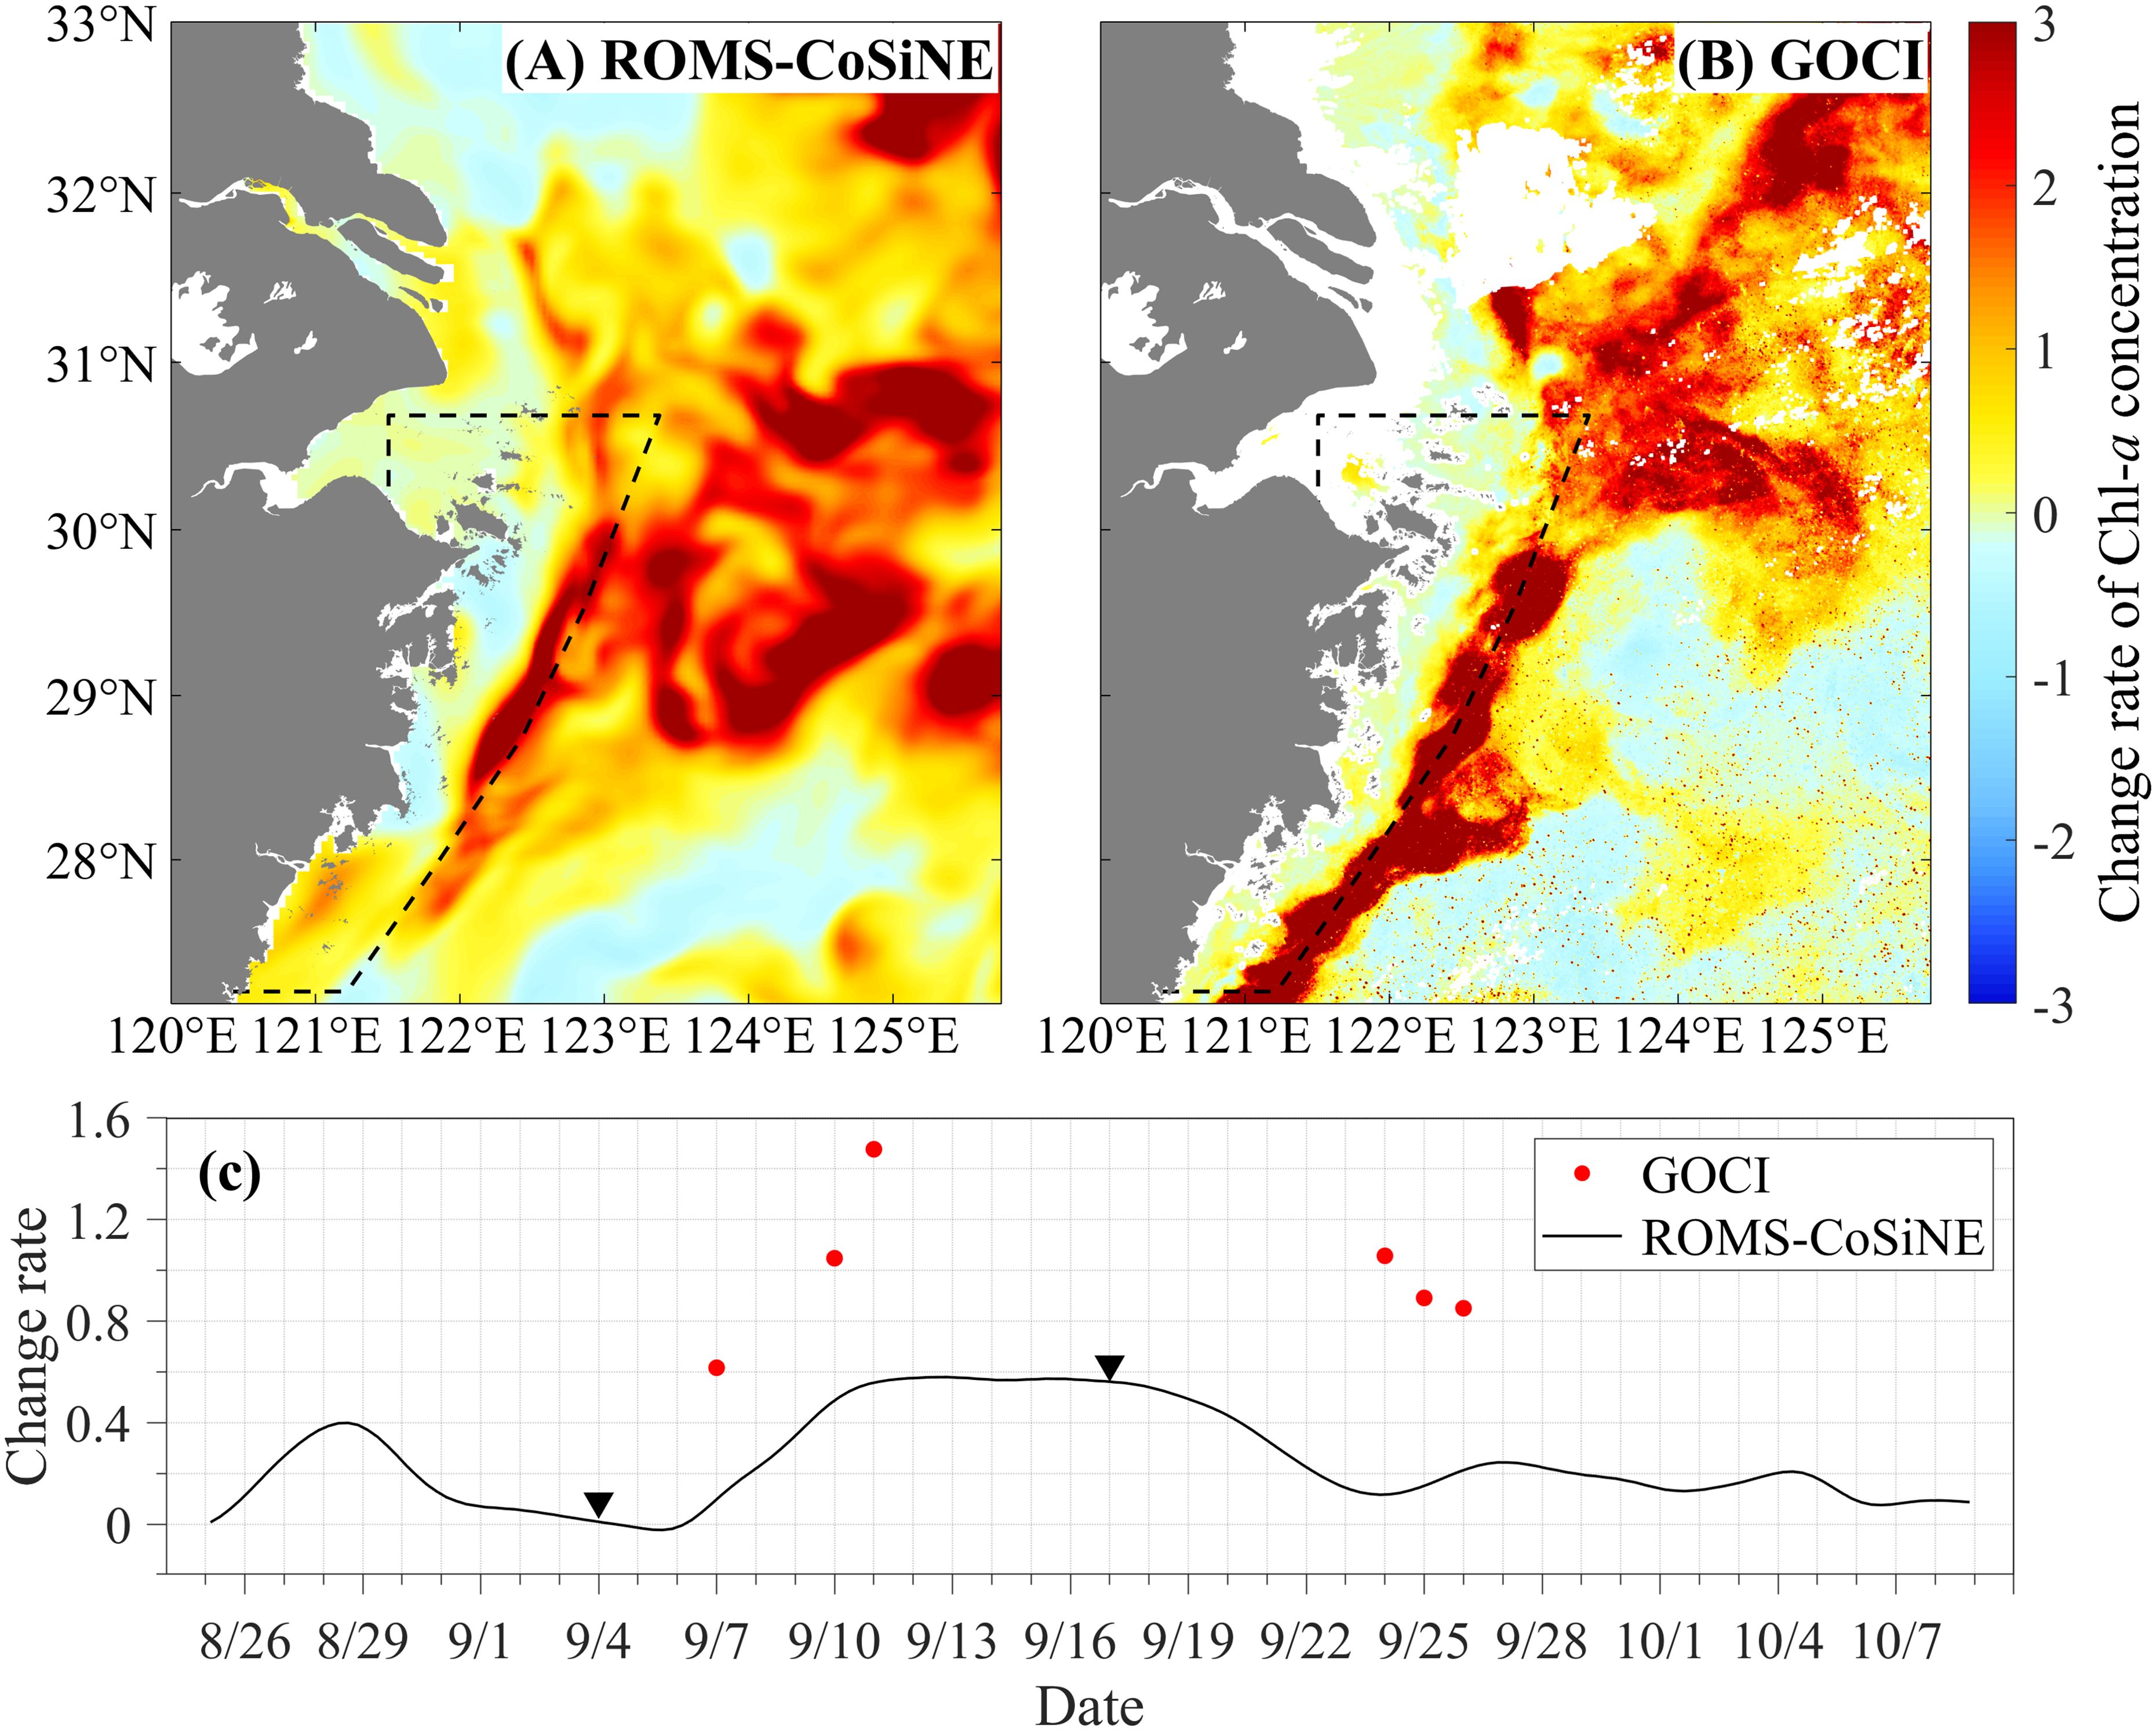
Figure 10. The rates of changes in surface Chl-a concentrations between August 21–24 and September 11–14 from (A) Exp.R and (B) GOCI. (C) Temporal evolution of the horizontal 6-hourly average (ROMS-CoSiNE) and daily mean (GOCI) rates of changes in surface Chl-a concentrations in the Zhejiang coastal waters, relative to the concentration during August 21-24. Solid inverted triangle symbols represent the arrival times of Lingling and Tapah near the CJE in sequential order.
In terms of net transport and lasting effects, Lingling exerted a more significant influence on southward pollutant transport compared to Tapah, partly because Lingling approached the CJE in closer proximity with greater intensity. Additionally, Lingling forced pollutants near the estuary mouth southward ahead of Tapah, thus reducing Tapah’s impact to a certain extent. These findings underscore the crucial role of typhoons in facilitating pollutant migration from the Changjiang to the Zhejiang coastal waters.
3.5 Influence of typhoons on water quality of coastal waters
The water quality off the CJE and its adjacent waters was classified based on nitrate levels, and the results showed degradation in the Zhejiang coastal region during the typhoon passages (Figure 11). The spatial pattern of water quality closely aligned with water quality mapping in autumn based on remote sensing and a deep learning model (Wu et al., 2022). In Exp.R, the percentage of heavily polluted water in the Zhejiang coastal waters increased from 12% to 26% during Lingling and subsequently from 28% to 40% during Tapah (Table 2). In the absence of typhoons, the increases in heavily polluted water were only 6% and 4% during the periods of Lingling and Tapah, respectively. As the typhoons passed through, seawater exceeding the Category II standard (at least slightly polluted) rapidly spread over the Zhejiang coastal region, increasing from 29% during September 1–3 to 61% during September 24–26.
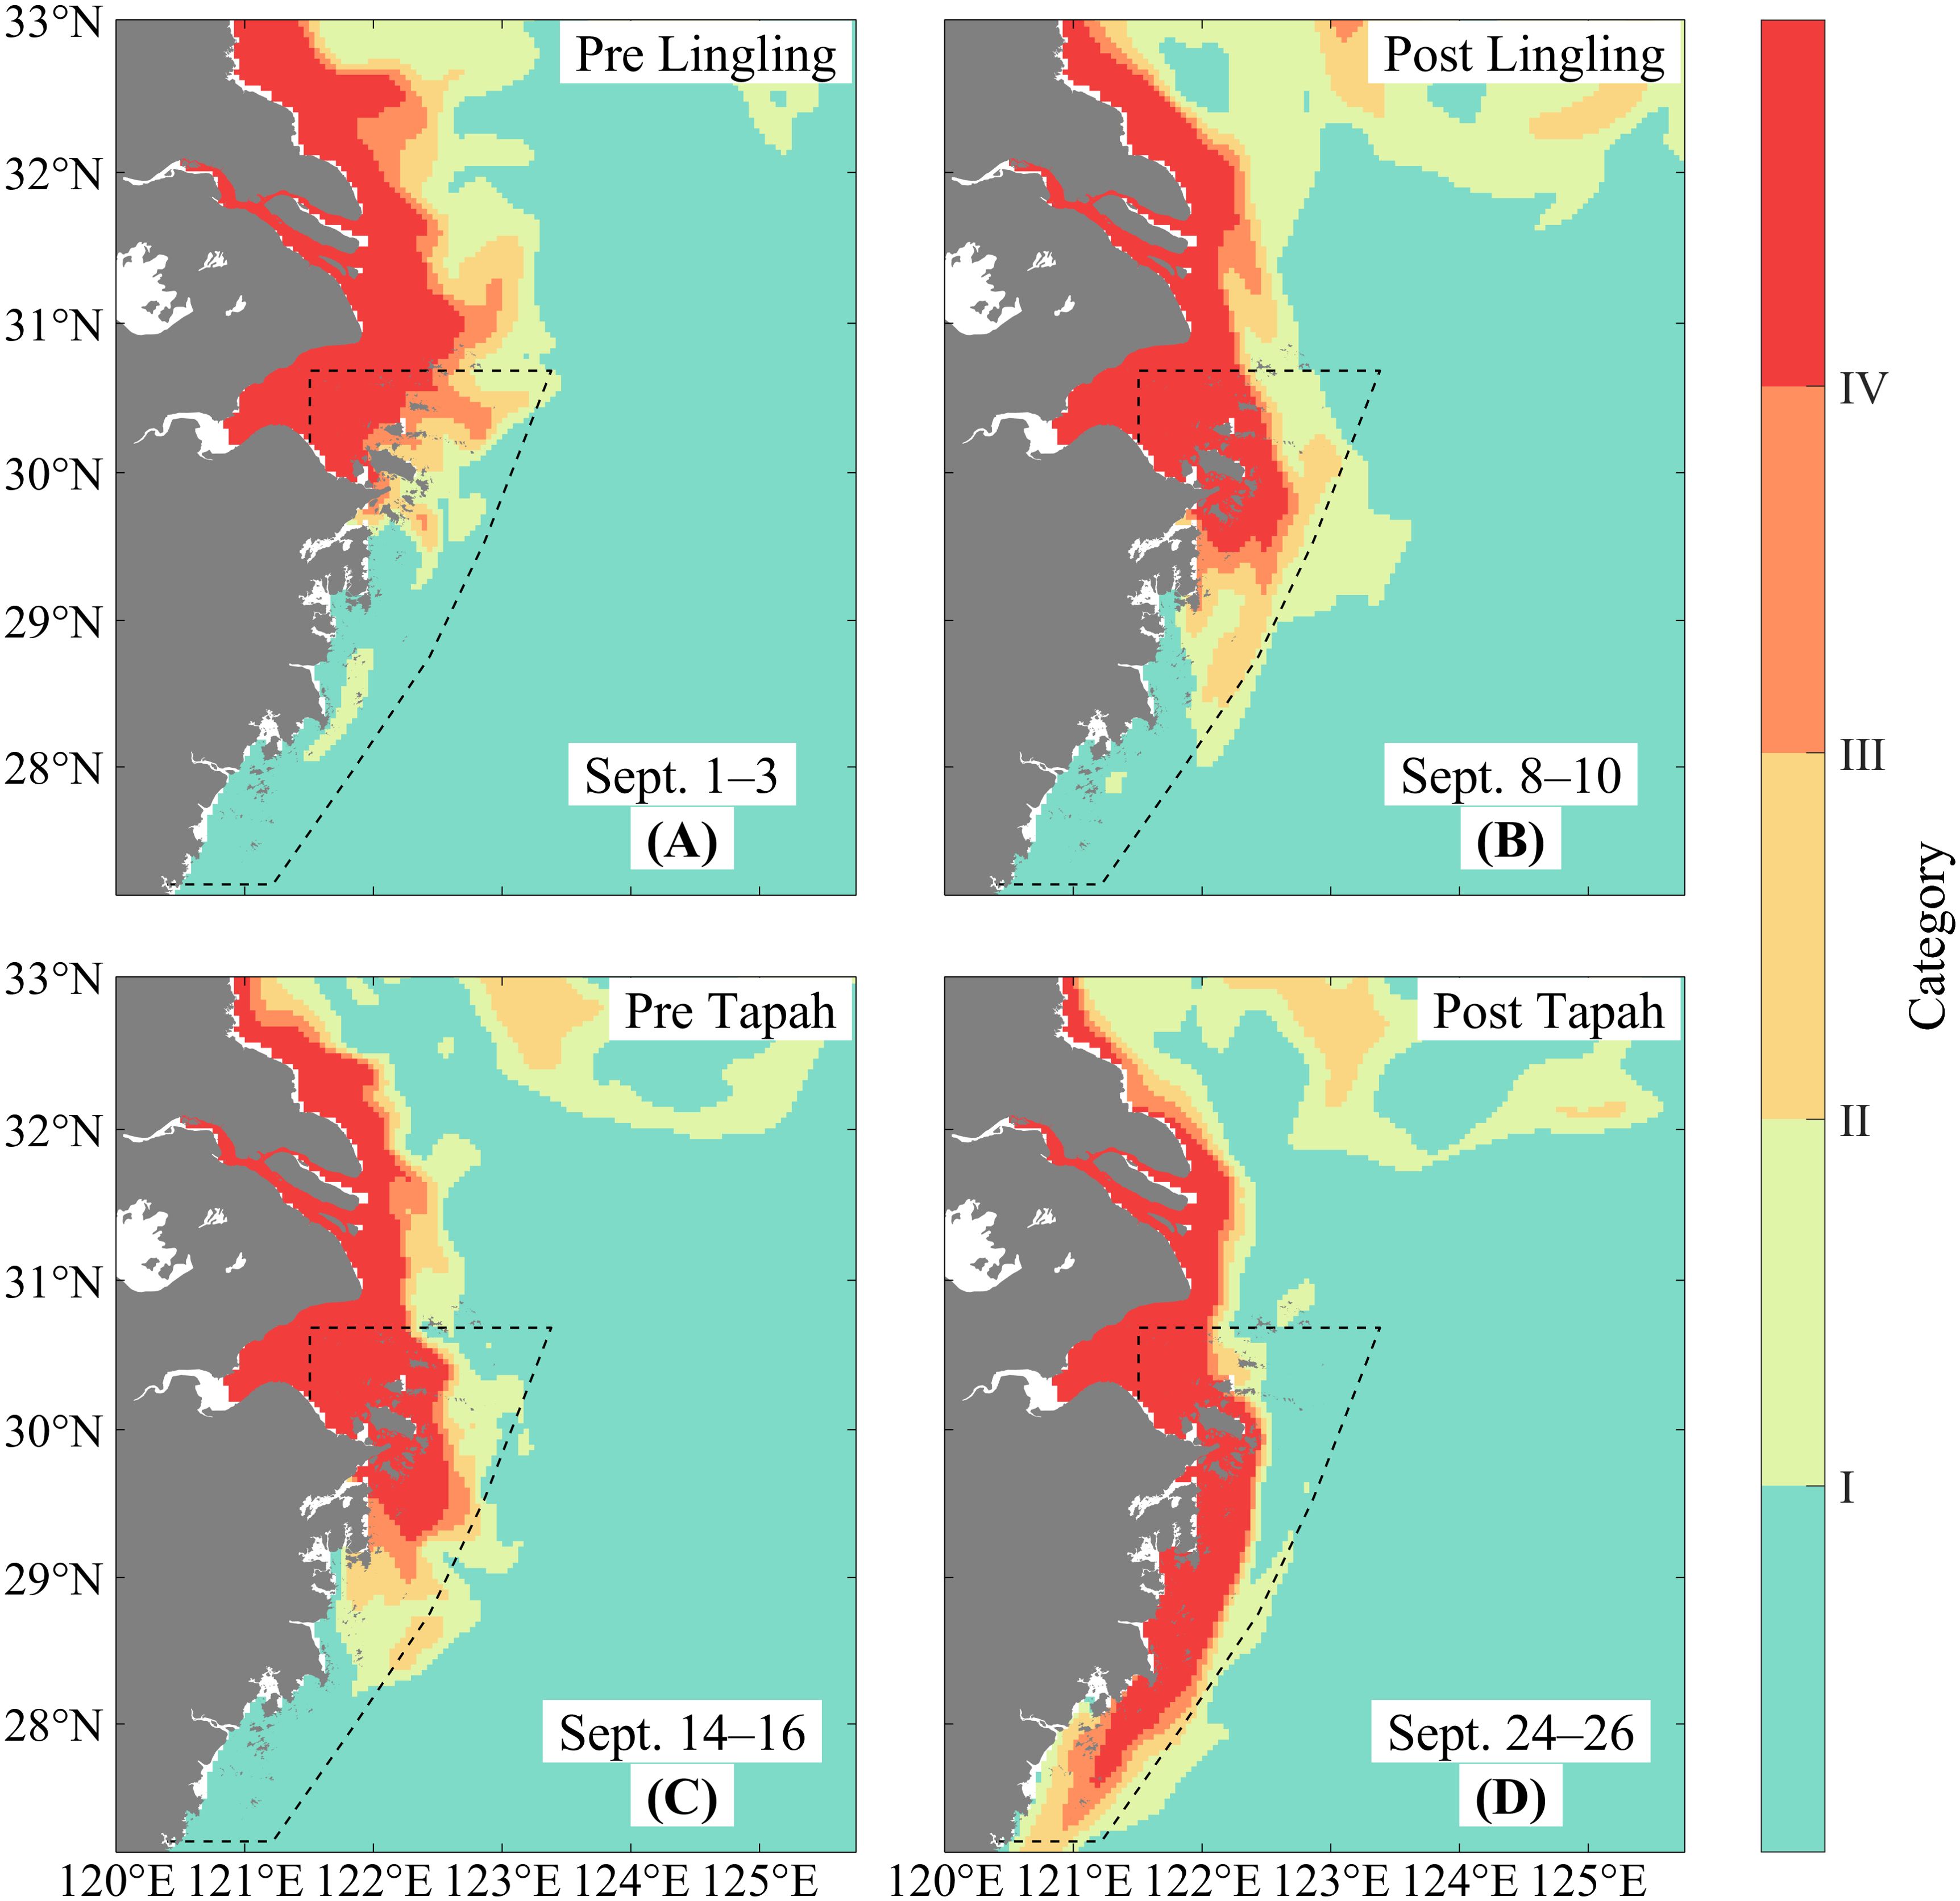
Figure 11. Spatial distributions of water quality before and after the typhoon passage in Exp.R, averaged during (A) September 1–3, (B) September 8–10, (C) September 14–16, and (D) September 24–26.
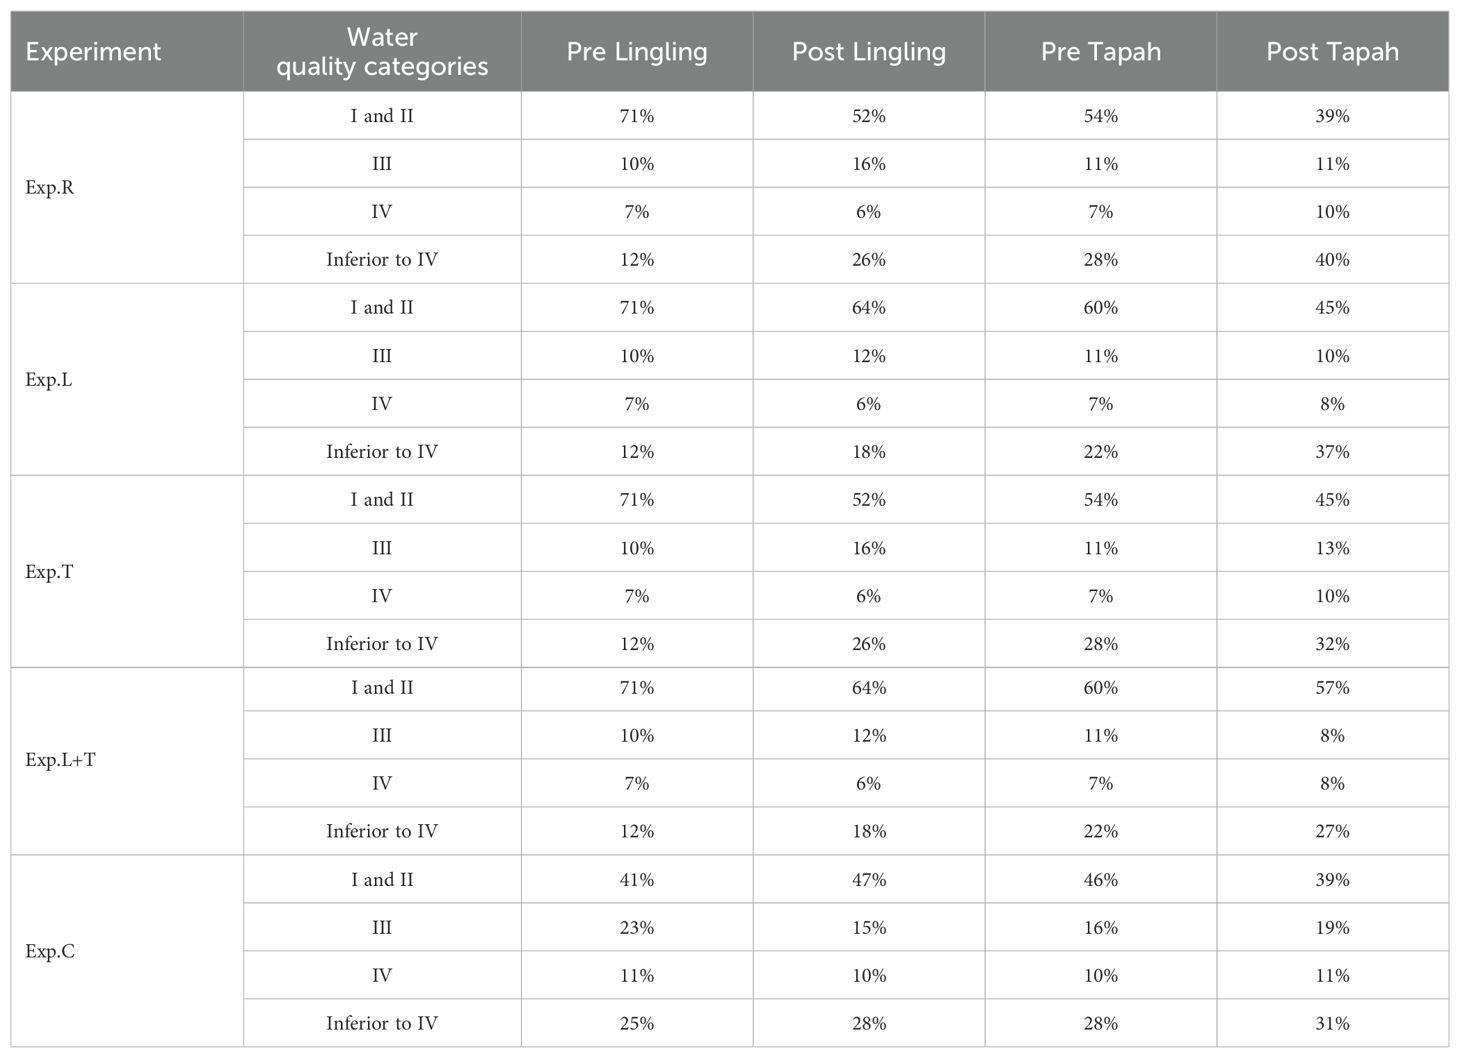
Table 2. Coverage of seawater in different water quality standards before and after the typhoon passage.
4 Discussion
4.1 Influence of monsoon wind on pollutant transport
We conducted a climatological experiment (Exp.C) to investigate the impact of monsoon winds on pollutant transport off the CJE and its adjacent waters. The seasonal mean wind fields for Exp.R and Exp.C are depicted in Figure 12. During spring (March to May) and autumn (September to November), the study region was largely controlled by northerly winds, with wind speeds in Exp.R approximately 15% and 9% higher, respectively, than those in Exp.C. In contrast, during summer (June to August), wind speeds in Exp.R were about 17% lower than those in Exp.C, and the wind directions were slightly more easterly.
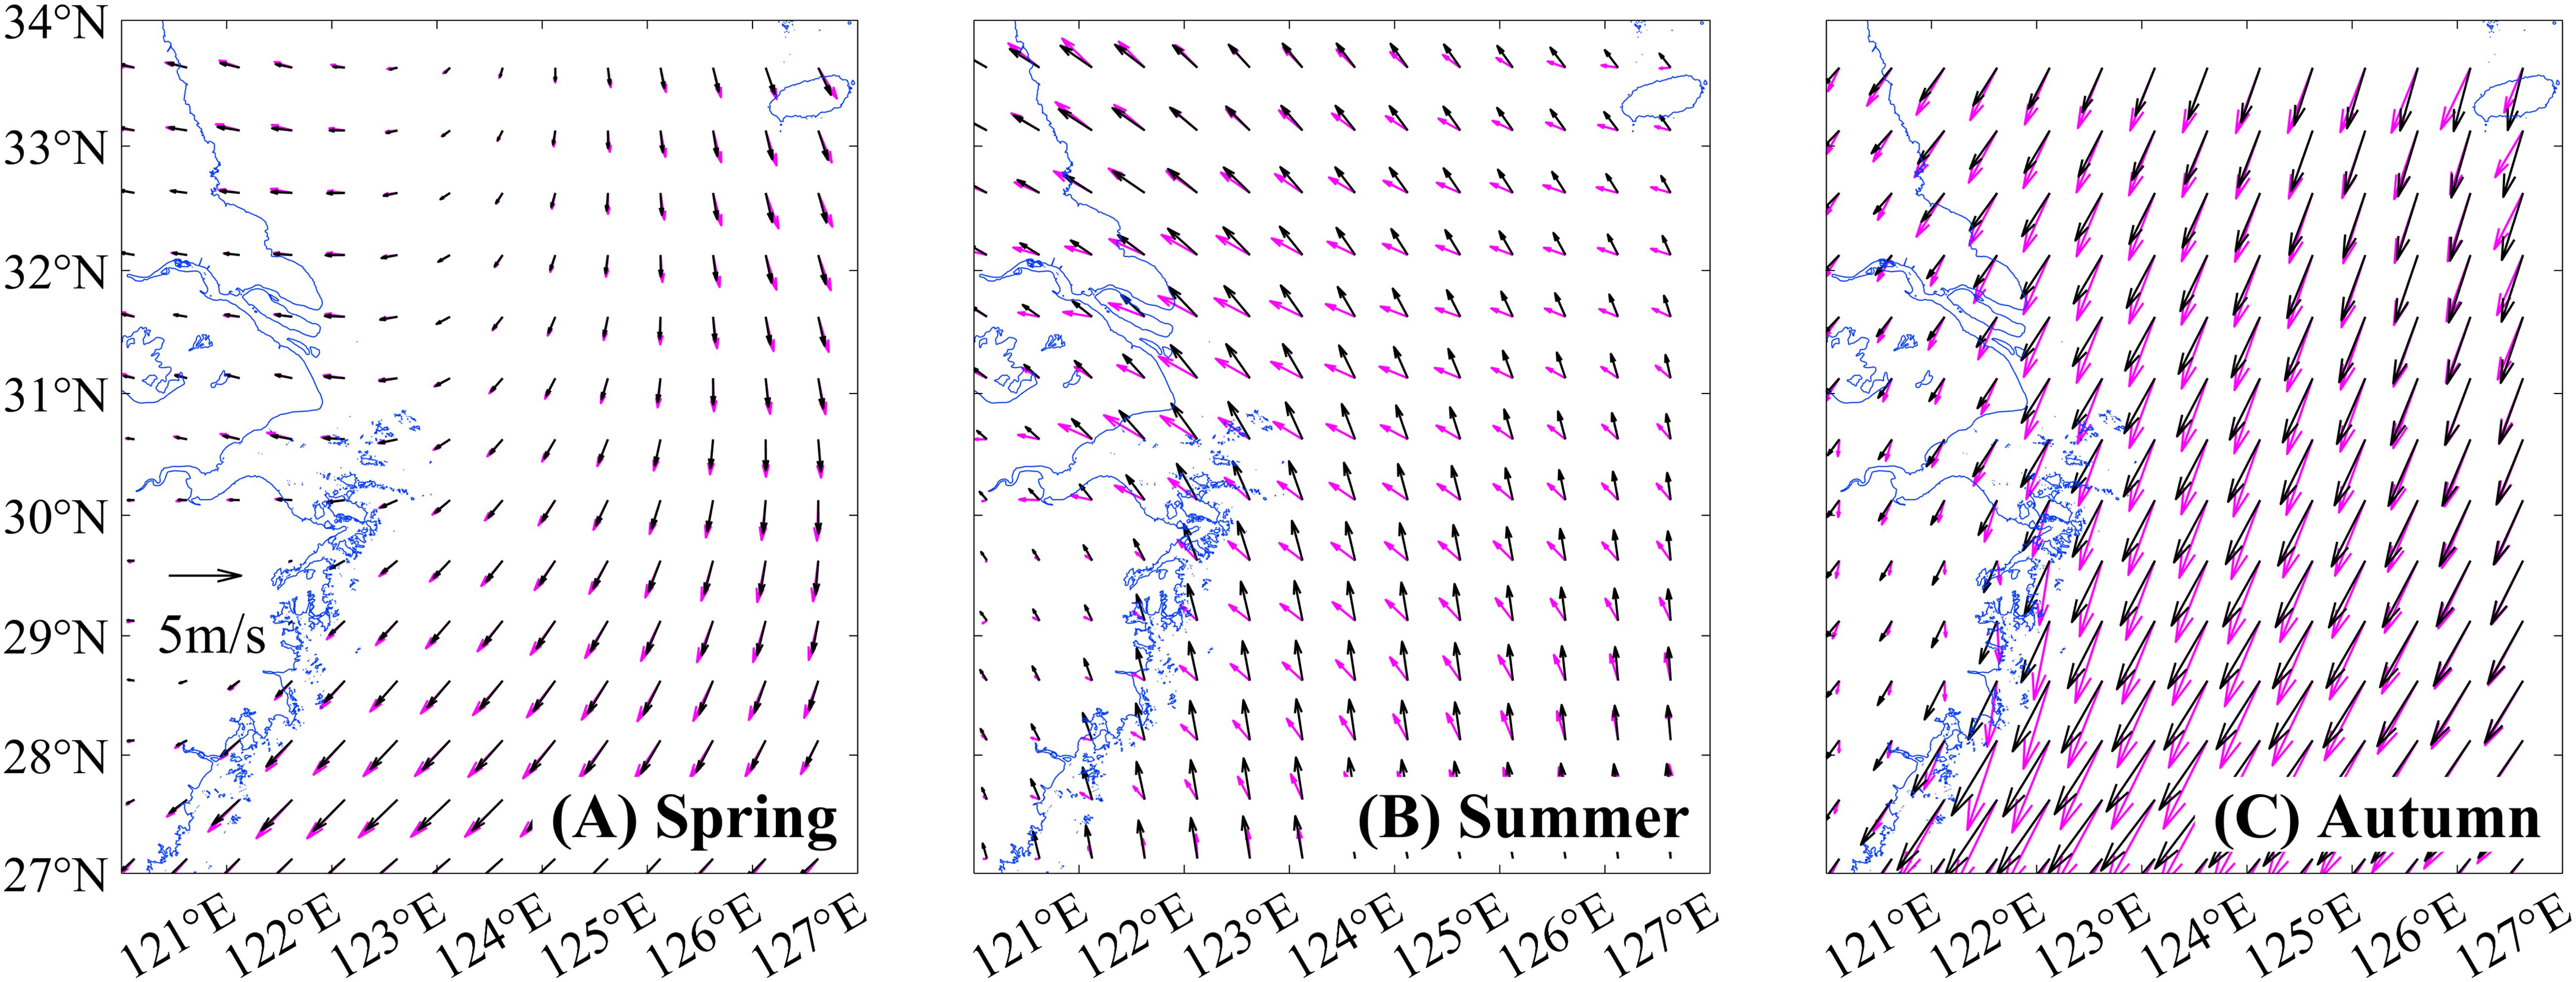
Figure 12. Comparison of seasonal mean wind fields between Exp.R (magenta arrow) and Exp.C (black arrow) during (A) spring, (B) summer, and (C) autumn.
The similar spatial distributions of nitrate and tracer (Figures 13A, B, D, E) indicated a significant influence of the autumn monsoon transition on the southward transport of pollutants discharged off the CJE. This spatial pattern was consistent with the previous study, which found heightened susceptibility of the Zhejiang coastal waters to these pollutants in autumn, mainly due to the climatological wind field (Cao et al., 2024). Additionally, the typhoon-induced strong northerly winds further enhanced the southward movement of pollutants, resulting in slightly higher concentrations of nitrate and tracer along the Zhejiang coast in Exp.R than Exp.C (Figure 13C, F).
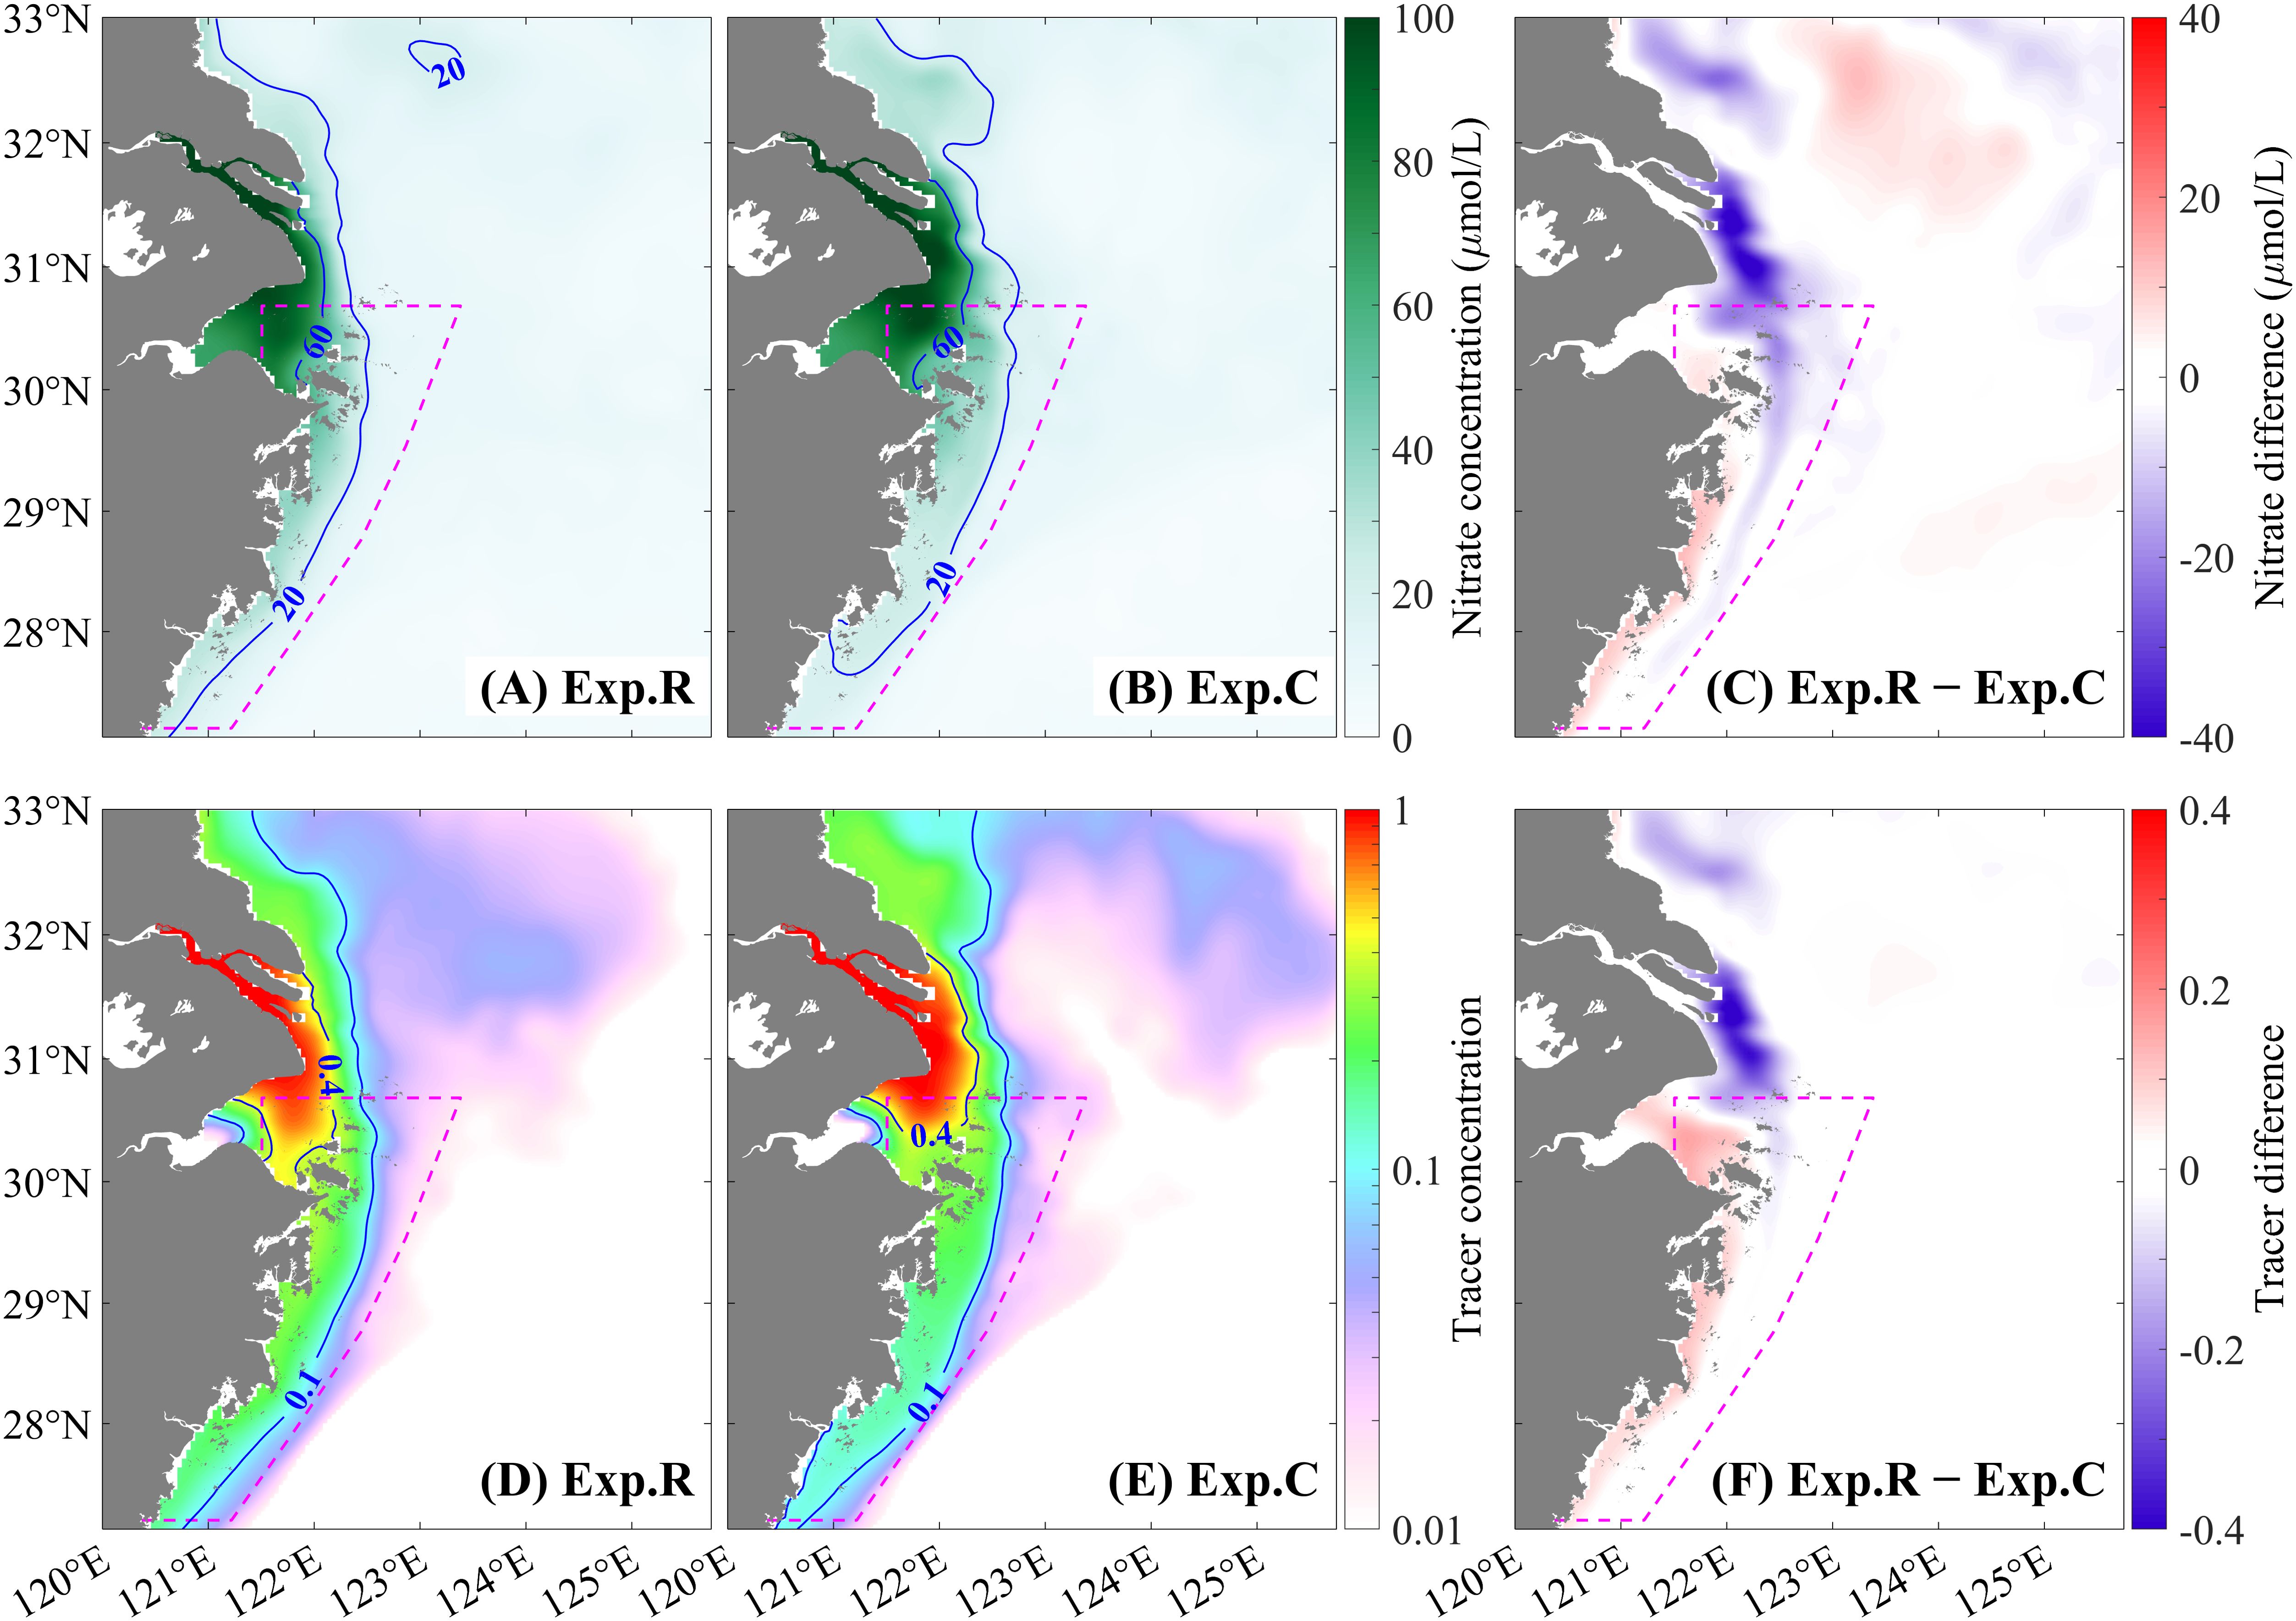
Figure 13. Spatial distributions of depth-averaged (A–C) nitrate and (D–F) tracer concentrations during autumn from Exp.R, Exp.C, and Exp.R−Exp.C.
The temporal evolutions of mean pollutant concentrations in the Zhejiang coastal waters showed that during September 1–3, the concentrations in Exp.R were lower than those in Exp.C (Figure 9), indicating reduced southward transport, primarily due to a delayed monsoon transition relative to the climatological condition. However, the average pollutant concentrations in Exp.R increased significantly and exceeded those in Exp.C during the typhoon events, suggesting that Lingling and Tapah were the predominant drivers of the water quality degradation in September 2019, besides the overall impact of the monsoon transition throughout the autumn.
4.2 Influence of riverine nutrient input
Riverine nutrient input is also considered a major factor impacting seawater quality in coastal regions (Liu et al., 2017; Tong et al., 2017; Liu et al., 2021). According to the River Sediment Bulletin of China, the total discharge of the Changjiang in 2019 was 9.33×10¹¹ m3, closely matching the decadal average of 2013–2022 (9.17×10¹¹ m3). The annual mean nitrate concentration measured at the Datong hydrological station in 2019 was 104.18 μmol/L, slightly below the average of 1999–2017 (114.92 μmol/L; Zhou et al., 2008). Based on monthly river runoff and nitrate concentration recorded at the Datong station, the total nitrate flux in 2019 was 94.81 Gmol, closely aligned with the average of 2013–2019 (95.34 Gmol; Wu et al., 2023). Therefore, the river discharge and DIN flux of the Changjiang in 2019 were generally consistent with the multi-year average, suggesting that the degradation of water quality in the Zhejiang coastal region was not due to increases in riverine nutrient input.
Note that of all eight watersheds located in Zhejiang Province (Qiantang River, Canal, Yongjiang, Oujiang, Jiaojiang, Tiaoxi, Feiyun River, and Aojiang), only nutrient input from Qiantang River was considered in this study. The other seven rivers were excluded based on the fact that the annual total DIN flux from these rivers was 10.8 Gmol, accounting for only 8.4% of the combined flux from the Changjiang and Qiantang River (128.5 Gmol; Chen et al., 2017; Wu et al., 2023).
5 Conclusions
A validated coupled physical-biogeochemical model with Eulerian tracers was employed to quantitatively assess the impacts of Typhoons Lingling and Tapah on pollutant transport processes off the CJE, as well as their influence on water quality in the coastal region of Zhejiang Province. Generally, the Zhejiang coastal waters were susceptible to pollutants from the Changjiang during autumn, primarily due to the monsoon seasonal transition. However, Lingling and Tapah further enhanced the southward pollutant transport, resulting in worse water quality during early autumn than normal conditions, despite no considerable increase in pollutant discharge. During the typhoon passages, the average nitrate concentration in the Zhejiang coastal waters rose from 18.5 to 32.7 μmol/L (increased by 77%). The budget analyses suggested that, the net southward nitrate transports during Lingling and Tapah were respectively 4.1 and 7.4 times greater than those under climatological wind conditions. Such significant southward transport was mainly driven by strong local southward wind stress in the coastal region and a substantial cross-shore sea level gradient caused by continuous seawater accumulation in nearshore areas. Based on the temporal evolution of nitrate concentration in the Zhejiang coastal waters, the lasting effects of Lingling and Tapah on nitrate levels were estimated at approximately 34 and 23 days, respectively. As these two typhoons successively passed, the percentage of heavily polluted water in the Zhejiang coastal region rose from 12% to 40% (increased by 28%).
These findings highlight the crucial role of typhoons passing through the ECS in regulating pollutant transport off the CJE and affecting the water quality in the Zhejiang coastal region. Note that the effects of a typhoon on pollutant transport are influenced by various factors, including the typhoon’s size, intensity, track, and translation speed. Further research is essential to explore how these factors affect the transport processes of pollutants.
Data availability statement
The original contributions presented in the study are included in the article/Supplementary Material. Further inquiries can be directed to the corresponding authors.
Author contributions
TC: Conceptualization, Data curation, Formal analysis, Investigation, Methodology, Validation, Visualization, Writing – original draft, Writing – review & editing. FZ: Conceptualization, Funding acquisition, Resources, Software, Writing – review & editing. DT: Conceptualization, Formal analysis, Funding acquisition, Methodology, Supervision, Writing – review & editing. QM: Data curation, Funding acquisition, Software, Writing – review & editing. XM: Data curation, Visualization, Writing – review & editing. BW: Data curation, Writing – review & editing. QZ: Conceptualization, Writing – review & editing. JX: Conceptualization, Writing – review & editing. JC: Conceptualization, Writing – review & editing. DH: Conceptualization, Writing – review & editing.
Funding
The author(s) declare financial support was received for the research, authorship, and/or publication of this article. This work was supported by the National Natural Science Foundation of China (No. 42230404, U23A2033), the Zhejiang Provincial Natural Science Foundation of China (No. LZJMZ23D050001), the Key R&D Program of Zhejiang Province (No. 2024C03034), and the National Key Research & Development Program of China (Task No. 2023YFC3108003 in Project No. 2023YFC3108000). The study was a part of the “Kuroshio Edge Exchange and the Shelf Ecosystem (KEES)” under the Ocean Decade program UN24 “2nd Cooperative Study of the Kuroshio and its Adjacent Regions” (No. CSK-2/08/2023). The contribution by Qicheng Meng was supported by the Oceanic Interdisciplinary Program of Shanghai Jiao Tong University and Scientific Research Fund of the Second Institute of Oceanography, MNR (No. SL2022ZD207).
Acknowledgments
All model simulations were supported by the high-performance computing cluster of State Key Laboratory of Satellite Ocean Environment Dynamics.
Conflict of interest
The authors declare that the research was conducted in the absence of any commercial or financial relationships that could be construed as a potential conflict of interest.
The author(s) declared that they were an editorial board member of Frontiers, at the time of submission.
Publisher’s note
All claims expressed in this article are solely those of the authors and do not necessarily represent those of their affiliated organizations, or those of the publisher, the editors and the reviewers. Any product that may be evaluated in this article, or claim that may be made by its manufacturer, is not guaranteed or endorsed by the publisher.
Supplementary material
The Supplementary Material for this article can be found online at: https://www.frontiersin.org/articles/10.3389/fmars.2024.1458827/full#supplementary-material
References
Atlas R., Hoffman R. N., Ardizzone J., Leidner S. M., Jusem J. C., Smith D. K., et al. (2011). A cross-calibrated, multiplatform ocean surface wind velocity product for meteorological and oceanographic applications. Bull. Amer. Meteorol. Soc 92, 157–174. doi: 10.1175/2010BAMS2946.1
Beardsley R. C. (1983). “Structure of the Changjiang river plume in the East China Sea during June 1980,” in Proceedings of International Symposium on Sedimentation on the Continental Shelf, with Special Reference to the East China Sea, 1983, Vol. 1. 265–284 (Beijing, China: China Ocean Press).
Beardsley R. C., Limeburner R., Yu H., Cannon G. A. (1985). Discharge of the Changjiang (Yangtze river) into the East China sea. Cont. Shelf Res. 4, 57–76. doi: 10.1016/0278-4343(85)90022-6
Cao T., Tian D., Zhou F., Bao M. (2024). Numerical investigation of the transport and accumulation of conservative pollutants off Changjiang Estuary. J. Mar. Syst. 241, 103895. doi: 10.1016/j.jmarsys.2023.103895
Chai F., Dugdale R. C., Peng T., Wilkerson F. P., Barber R. T. (2002). One-dimensional ecosystem model of the equatorial Pacific upwelling system. Part I: model development and silicon and nitrogen cycle. Deep Sea Res. Part II: Topical Stud. Oceanogr. 49, 2713–2745. doi: 10.1016/S0967-0645(02)00055-3
Chang P., Isobe A., Kang K., Ryoo S., Kang H., Kim Y. (2014). Summer behavior of the Changjiang diluted water to the East/Japan Sea: A modeling study in 2003. Cont. Shelf Res. 81, 7–18. doi: 10.1016/j.csr.2014.03.007
Chen B., Chang S. X., Lam S. K., Erisman J. W., Gu B. (2017). Land use mediates riverine nitrogen export under the dominant influence of human activities. Environ. Res. Lett. 12, 94018. doi: 10.1088/1748-9326/aa84bc
Chen G. (1992). Marine Atlas of Bohai sea Yellow sea East China sea. Hydrology. 61. China Ocean Press (Beijing).
Cloern J. E., Grenz C., Vidergar Lucas L. (1995). An empirical model of the phytoplankton chlorophyll: carbon ratio-the conversion factor between productivity and growth rate. Limnol. Oceanogr. 40, 1313–1321. doi: 10.4319/lo.1995.40.7.1313
Dagg M., Benner R., Lohrenz S., Lawrence D. (2004). Transformation of dissolved and particulate materials on continental shelves influenced by large rivers: plume processes. Cont. Shelf Res. 24, 833–858. doi: 10.1016/j.csr.2004.02.003
Da Silva A. M., Young C. C., Levitus S. (1994). Atlas of surface marine data 1994, Vol. 1: Algorithms and procedures Vol. 6 (Washington, DC: U.S. Department of Commerce, Noaa Atlas Nesdis), 20910–23282.
Deng Y., Zheng B., Fu G., Lei K., Li Z. (2010). Study on the total water pollutant load allocation in the Changjiang (Yangtze River) Estuary and adjacent seawater area. Estuarine Coast. Shelf Sci. 86, 331–336. doi: 10.1016/j.ecss.2009.10.024
Du J., Shen J. (2017). Transport of riverine material from multiple rivers in the Chesapeake Bay: Important control of estuarine circulation on the material distribution. J. Geophys. Res.: Biogeosci. 122, 2998–3013. doi: 10.1002/2016JG003707
Egbert G. D., Erofeeva S. Y. (2002). Efficient inverse modeling of barotropic ocean tides. J. Atmos. Ocean. Technol. 19, 183–204. doi: 10.1175/1520-0426(2002)019<0183:EIMOBO>2.0.CO;2
Fabian P. S., Kwon H., Vithanage M., Lee J. (2023). Modeling, challenges, and strategies for understanding impacts of climate extremes (droughts and floods) on water quality in Asia: A review. Environ. Res. 225, 115617. doi: 10.1016/j.envres.2023.115617
Fan W., Song J. (2014). A numerical study of the seasonal variations of nutrients in the Changjiang River estuary and its adjacent sea area. Ecol. Model. 291, 69–81. doi: 10.1016/j.ecolmodel.2014.07.026
Grasshoff K., Kremling K., Ehrhardt M. (2009). Methods of seawater analysis (Weinheim, Germany: John Wiley & Sons).
Haidvogel D. B., Arango H., Budgell W. P., Cornuelle B. D., Curchitser E., Di Lorenzo E., et al. (2008). Ocean forecasting in terrain-following coordinates: Formulation and skill assessment of the Regional Ocean Modeling System. J. Comput. Phys. 227, 3595–3624. doi: 10.1016/j.jcp.2007.06.016
Hersbach H., Bell B., Berrisford P., Hirahara S., Horányi A., Muñoz Sabater J., et al. (2020). The ERA5 global reanalysis. Q. J. R. Meteorol. Soc 146, 1999–2049. doi: 10.1002/qj.3803
Klotz B. W., Uhlhorn E. W. (2014). Improved stepped frequency microwave radiometer tropical cyclone surface winds in heavy precipitation. J. Atmos. Ocean. Technol. 31, 2392–2408. doi: 10.1175/JTECH-D-14-00028.1
Lee J. H., Moon I. J., Moon J. H., Kim S. H., Jeong Y. Y., Koo J. H. (2017). Impact of typhoons on the Changjiang plume extension in the Yellow and East China Seas. J. Geophys. Res.: Oceans 122, 4962–4973. doi: 10.1002/2017JC012754
Liu K., Chao S., Lee H., Gong G., Teng Y. (2010). Seasonal variation of primary productivity in the East China Sea: A numerical study based on coupled physical-biogeochemical model. Deep Sea Res. Part II: Topical Stud. Oceanogr. 57, 1762–1782. doi: 10.1016/j.dsr2.2010.04.003
Liu S., Hong G.-H., Zhang J., Ye X., Jiang X. (2009). Nutrient budgets for large Chinese estuaries. Biogeosciences 6, 2245–2263. doi: 10.5194/bg-6-2245-2009
Liu S., Jiang Z., Zhang J., Wu Y., Huang X., Macreadie P. I. (2017). Sediment microbes mediate the impact of nutrient loading on blue carbon sequestration by mixed seagrass meadows. Sci. Total Environ. 599, 1479–1484. doi: 10.1016/j.scitotenv.2017.05.129
Liu S., Qi X., Li X., Ye H., Wu Y., Ren J., et al. (2016). Nutrient dynamics from the Changjiang (Yangtze River) estuary to the East China Sea. J. Mar. Syst. 154, 15–27. doi: 10.1016/j.jmarsys.2015.05.010
Liu J. P., Xu K., Li A., Milliman J. D., Velozzi D. M., Xiao S., et al. (2007). Flux and fate of Yangtze River sediment delivered to the East China Sea. Geomorphology 85, 208–224. doi: 10.1016/j.geomorph.2006.03.023
Liu M., Zhang Q., Maavara T., Liu S., Wang X., Raymond P. A. (2021). Rivers as the largest source of mercury to coastal oceans worldwide. Nat. Geosci. 14, 672–677. doi: 10.1038/s41561-021-00793-2
Mao H., Gan Z., Lan S. (1963). A preliminary study of the yangtze diluted water and its mixing processes. Oceanol. Et Limnol. Sin. 5, 183–206.
Mei X., Dai Z., Van Gelder P., Gao J. (2015). Linking three gorges dam and downstream hydrological regimes along the Yangtze river, China. Earth Space Sci. 2, 94–106. doi: 10.1002/2014EA000052
Meng Q., Zhou F., Ma X., Xuan J., Zhang H., Wang S., et al. (2022). Response process of coastal hypoxia to a passing typhoon in the East China sea. Front. Mar. Sci. 692. doi: 10.3389/fmars.2022.892797
Shchepetkin A. F., McWilliams J. C. (2005). The regional oceanic modeling system (ROMS): a split-explicit, free-surface, topography-following-coordinate oceanic model. Ocean Model. 9, 347–404. doi: 10.1016/j.ocemod.2004.08.002
Song Y., Haidvogel D. (1994). A semi-implicit ocean circulation model using a generalized topography-following coordinate system. J. Comput. Phys. 115, 228–244. doi: 10.1006/jcph.1994.1189
Statham P. J. (2012). Nutrients in estuaries—An overview and the potential impacts of climate change. Sci. Total Environ. 434, 213–227. doi: 10.1016/j.scitotenv.2011.09.088
Tang D., Di B., Wei G., Ni I., Oh I. S., Wang S. (2006). Spatial, seasonal and species variations of harmful algal blooms in the South Yellow Sea and East China Sea. Hydrobiologia 568, 245–253. doi: 10.1007/s10750-006-0108-1
Tian D., Zhou F., Zhang W., Zhang H., Ma X., Guo X. (2022). Effects of dissolved oxygen and nutrients from the Kuroshio on hypoxia off the Changjiang River estuary. J. Oceanol. Limnol. 1-15. doi: 10.1007/s00343-021-0440-3
Tong Y., Bu X., Chen J., Zhou F., Chen L., Liu M., et al. (2017). Estimation of nutrient discharge from the Yangtze River to the East China Sea and the identification of nutrient sources. J. Hazard. Mater. 321, 728–736. doi: 10.1016/j.jhazmat.2016.09.011
Uhlhorn E. W., Black P. G. (2003). Verification of remotely sensed sea surface winds in hurricanes. J. Atmos. Ocean. Technol. 20, 99–116. doi: 10.1175/1520-0426(2003)020<0099:VORSSS>2.0.CO;2
Uhlhorn E. W., Black P. G., Franklin J. L., Goodberlet M., Carswell J., Goldstein A. S. (2007). Hurricane surface wind measurements from an operational stepped frequency microwave radiometer. Mon. Weather Rev. 135, 3070–3085. doi: 10.1175/MWR3454.1
Wang B., Xin M., Wei Q., Xie L. (2018). A historical overview of coastal eutrophication in the China Seas. Mar. pollut. Bull. 136, 394–400. doi: 10.1016/j.marpolbul.2018.09.044
Wang X., Zhang W., Yin J., Wang J., Ge J., Wu J., et al. (2021). Assessment of coastal erosion vulnerability and socio-economic impact along the Yangtze River Delta. Ocean Coast. Manage. 215, 105953. doi: 10.1016/j.ocecoaman.2021.105953
Wen S., Sun T., Wang Z., Li F., Li D., Liu N. (2021). Spatial and temporal characteristics of harmful algal blooms in Zhejiang Province waters during 1933-2018. Mar. Biol. Res. 17, 545–553. doi: 10.1080/17451000.2021.2009874
Wu S., Qi J., Yan Z., Lyu F., Lin T., Wang Y., et al. (2022). Spatiotemporal assessments of nutrients and water quality in coastal areas using remote sensing and a spatiotemporal deep learning model. Int. J. Appl. Earth Obs. Geoinf. 112, 102897. doi: 10.1016/j.jag.2022.102897
Wu H., Shen J., Zhu J., Zhang J., Li L. (2014). Characteristics of the Changjiang plume and its extension along the Jiangsu Coast. Cont. Shelf Res. 76, 108–123. doi: 10.1016/j.csr.2014.01.007
Wu W., Wang J., Wang H., Liu J., Yao Q., Yu Z., et al. (2023). Trends in nutrients in the Changjiang river. Sci. Total Environ. 872, 162268. doi: 10.1016/j.scitotenv.2023.162268
Xie X., Li M. (2018). Effects of wind straining on estuarine stratification: A combined observational and modeling study. J. Geophys. Res.: Oceans 123, 2363–2380. doi: 10.1002/2017JC013470
Xiu P., Chai F. (2014). Connections between physical, optical and biogeochemical processes in the Pacific Ocean. Prog. Oceanogr. 122, 30–53. doi: 10.1016/j.pocean.2013.11.008
Xu L., Liang Y., Xiao W., Chen B. (2022). Analysis of the inter-annual variability and southward expansion of red tides in the Zhejiang coastal waters from 1981 to 2018. Acta Oceanol. Sin. 41, 132–140. doi: 10.1007/s13131-021-1741-2
Xu G., Liu J., Liu S., Wang Z., Hu G., Kong X. (2016). Modern muddy deposit along the Zhejiang coast in the East China Sea: Response to large-scale human projects. Cont. Shelf Res. 130, 68–78. doi: 10.1016/j.csr.2016.10.007
Xuan J., Huang D., Zhou F., Zhu X., Fan X. (2012). The role of wind on the detachment of low salinity water in the Changjiang Estuary in summer. J. Geophys. Res.: Oceans 117, C10004. doi: 10.1029/2012JC008121
Yang S., Milliman J. D., Li P., Xu K. (2011). 50,000 dams later: Erosion of the Yangtze River and its delta. Glob. Planet. Change 75, 14–20. doi: 10.1016/j.gloplacha.2010.09.006
Yang D., Yin B., Liu Z., Bai T., Qi J., Chen H. (2012). Numerical study on the pattern and origins of Kuroshio branches in the bottom water of southern East China Sea in summer. J. Geophys. Res.: Oceans 117, C02014. doi: 10.1029/2011JC007528
Zhang J. (1996). Nutrient elements in large Chinese estuaries. Cont. Shelf Res. 16, 1023–1045. doi: 10.1016/0278-4343(95)00055-0
Zhang W., Wu H., Hetland R. D., Zhu Z. (2019). On mechanisms controlling the seasonal hypoxia hot spots off the Changjiang River Estuary. J. Geophys. Res.: Oceans 124, 8683–8700. doi: 10.1029/2019JC015322
Zhang Z., Wu H., Yin X., Qiao F. (2018). Dynamical response of Changjiang River plume to a severe typhoon with the surface wave-induced mixing. J. Geophys. Res.: Oceans 123, 9369–9388. doi: 10.1029/2018JC014266
Zhou F., Chai F., Huang D., Wells M., Ma X., Meng Q., et al. (2020). Coupling and decoupling of high biomass phytoplankton production and hypoxia in a highly dynamic coastal system: the Changjiang (Yangtze River) estuary. Front. Mar. Sci. 7. doi: 10.3389/fmars.2020.00259
Zhou F., Chai F., Huang D., Xue H., Chen J., Xiu P., et al. (2017b). Investigation of hypoxia off the Changjiang Estuary using a coupled model of ROMS-CoSiNE. Prog. Oceanogr. 159, 237–254. doi: 10.1016/j.pocean.2017.10.008
Zhou F., Huang D., Su J. (2009b). Numerical simulation of the dual-core structure of the Bohai Sea cold bottom water in summer. Chin. Sci. Bull. 54, 4520–4528. doi: 10.1007/s11434-009-0019-4
Zhou F., Huang D., Xue H., Xuan J., Yan T., Ni X., et al. (2017a). Circulations associated with cold pools in the Bohai Sea on the Chinese continental shelf. Cont. Shelf Res. 137, 25–38. doi: 10.1016/j.csr.2017.02.005
Zhou M., Shen Z., Yu R. (2008). Responses of a coastal phytoplankton community to increased nutrient input from the Changjiang (Yangtze) River. Cont. Shelf Res. 28, 1483–1489. doi: 10.1016/j.csr.2007.02.009
Zhou F., Xuan J., Ni X., Huang D. (2009a). A preliminary study of variations of the Changjiang Diluted Water between August of 1999 and 2006. Acta Oceanol. Sin. 28, 1–11.
Zhou F., Xue H., Huang D., Xuan J., Ni X., Xiu P., et al. (2015). Cross-shelf exchange in the shelf of the East China Sea. J. Geophys. Res.: Oceans 120, 1545–1572. doi: 10.1002/2014JC010567
Zhu J. (1997). Numerical simulation of the wind field’s impact on the expansion of the Changjiang River diluted water in summer. Oceanol. Et Limnol. Sin. 28, 72–79.
Keywords: pollutant transport, typhoon, water quality, Changjiang estuary, Zhejiang coastal waters, physical-biogeochemical model
Citation: Cao T, Zhou F, Tian D, Meng Q, Ma X, Wang B, Zhang Q, Xuan J, Chen J and Huang D (2024) Degradation of water quality caused by typhoon passage: a case study of the Zhejiang coastal waters in 2019. Front. Mar. Sci. 11:1458827. doi: 10.3389/fmars.2024.1458827
Received: 03 July 2024; Accepted: 26 August 2024;
Published: 11 September 2024.
Edited by:
Do-Seong Byun, Korea Hydrographic and Oceanographic Agency, Republic of KoreaReviewed by:
Yanbin Li, Ocean University of China, ChinaYing Su, Dalian University of Technology, China
Copyright © 2024 Cao, Zhou, Tian, Meng, Ma, Wang, Zhang, Xuan, Chen and Huang. This is an open-access article distributed under the terms of the Creative Commons Attribution License (CC BY). The use, distribution or reproduction in other forums is permitted, provided the original author(s) and the copyright owner(s) are credited and that the original publication in this journal is cited, in accordance with accepted academic practice. No use, distribution or reproduction is permitted which does not comply with these terms.
*Correspondence: Feng Zhou, emhvdWZlbmdAc2lvLm9yZy5jbg==; Di Tian, dGlhbmRpQHNpby5vcmcuY24=