- 1State Key Laboratory of Satellite Ocean Environment Dynamics, Second Institute of Oceanography, Ministry of Natural Resources, Hangzhou, China
- 2Southern Marine Science and Engineering Guangdong Laboratory, Zhuhai, China
- 3State Key Laboratory of Marine Environmental Science, Xiamen University, Xiamen, China
The observational data of the air-sea interface and upper ocean elements from a buoy array deployed in the northern South China Sea from June to November 2014 is analyzed. The COARE 3.0 algorithm was adopted to examine the variability of air-sea heat fluxes and their contributions to near-surface ocean temperature changes. During the observation period, air-sea heat exchange in the northern South China Sea is primarily determined by solar shortwave radiation and latent heat flux, with net heat flux mostly negative, indicating that the ocean predominantly loses heat. In autumn, net heat flux loss significantly increased by an average of 34.4 W/m2, primarily due to enhanced latent heat loss driven by stronger winter monsoon. During typhoon period, net air-sea heat flux was significantly suppressed, mainly due to reduced solar shortwave radiation, with minimal contribution from sensible heat flux. Near-surface ocean temperature exhibited a seasonal cooling trend, averaging 29.7°C in summer and 28.4°C in autumn. The maximum cooling during typhoon reached 3.1°C, with minimal contribution from air-sea heat flux. During the monsoon transition period, weaker winds led to a slight increase in near-surface ocean temperature, with air-sea heat flux contributing 70.2% and 56.3% to this process. During winter monsoon, more uniform water column mixing resulted in a gradual decrease in near-surface ocean temperature, with air-sea heat flux contributing over 60% to this process.
1 Introduction
The oceans, covering 71% of the Earth’s surface, play a crucial role in the complex forcing and feedback processes with the atmosphere. The air-sea interface serves as the sole conduit for these interactions. The exchange of fluxes at the air-sea interface significantly impact the large-scale coupled atmosphere-ocean dynamical system, influencing the structure between the atmospheric boundary layer and the surface ocean, which in turn affects atmospheric circulation and contributes to climate change on different scales. Air-sea flux involves three main processes: momentum exchange, heat flux exchange, and material exchange. The air-sea heat flux consists of solar shortwave radiation (SW), infrared longwave radiation flux (LW), latent heat flux (LH), and sensible heat flux (SH) (Ma et al., 2015; Hsu et al., 2022). The sum of these fluxes is the net heat flux (Qnet) at the sea surface. Understanding air-sea heat flux is essential for comprehending air-sea interactions and climate variabilities.
The South China Sea (SCS) (0°-23°N, 99°-121°E) is located in the western Pacific Ocean and features a typical monsoon climate. Differences in LH between the southern and northern regions of the SCS are closely related to the East Asian monsoon (Wang et al., 2008). The seasonal variation of the sea surface heat flux in the SCS is pronounced, with a peak-to-peak amplitude ranging from 100 to 300 Wm2, and the amplitude is larger in the northern region (Oberhuber, 1988). Using ship-based observational data from the northern SCS (NSCS), it was found that Qnet is positive in spring and summer (SU), indicating heat absorption in the NSCS region, with SW playing the dominant role (Zhang et al., 2012). In autumn (AU) and winter, Qnet is negative in most observation areas, indicating heat loss in the NSCS region, with LH being dominant. Net surface heating mainly results from the compensation between SW heating and LH and LW cooling, with SH being negligible (Chen et al., 2003; Zhang et al., 2012).
Furthermore, the SCS is prone to tropical cyclones (TCs). The TC process involves complex exchanges of momentum and heat between the ocean and atmosphere (Cheng et al., 2015; Potter et al., 2017). Positive sea surface temperature (SST) anomalies can lead to nearly a 300% increase in air-sea heat fluxes, providing an energy source for the rapid intensification of a TC within a short time (Lin et al., 2009). During the TC period, Qnet is significantly suppressed, with a possible variation range of up to 695 W/m2 (Song et al., 2021). In the TC wake region, both LH and SH at the air-sea interface decrease (Bender et al., 1993; Zhu et al., 2004; Zhang, 2023), leading to the suppression of clouds and precipitation (Ma et al., 2020; Pasquero et al., 2021). The eddies generated by TCs play an important role in the transport of water masses and heat (Volkov et al., 2008; Zhang et al., 2014). The sea spray generated by the strong winds under TC weather conditions also affects the exchange of air-sea heat fluxes (Li, 2004). For instance, sea spray extracts LH from the atmosphere and evaporates, leading to cooling of the near-surface atmospheric layer. This cooling enhances sensible heat transfer from the ocean to the atmosphere, ultimately contributing to the intensification of the TC (Andreas and Emanuel, 2001). Therefore, accurately understanding the changes in air-sea heat fluxes related to TCs is of great importance (Lin et al., 2009; Zhang et al., 2021).
Global air-sea heat flux data are mainly derived from reanalysis, satellite data, and estimates calculated from Voluntary Observing Ship (VOS) data based on integral parameterizations. However, reanalysis data depend on not only the parameterization used in the atmospheric model but also on the meteorological parameters (primarily cloud cover) and model diagnostics, and the cloud cover data may contain significant errors (Dobson and Smith, 1988; Bedacht et al., 2007). Furthermore, there are large discrepancies in the global ocean-atmosphere fluxes among different heat flux products (Yu, 2019). Satellite data also have errors and their accuracy needs to be improved. Determining air humidity and temperature at a fixed height above the ocean surface still requires technical improvements (Simonot et al., 1989). Some datasets use air temperature (SAT) from reanalysis products instead of satellite-derived SAT, while others use a constant surface-air temperature difference from HOAPS (Andersson et al., 2010). In regions such as the tropical Indian Ocean and the Southern Ocean, VOSs are infrequent, and the data sampling density can also affect the accuracy of flux estimates. In-situ observational data are key to constraining studies of ocean-atmosphere interactions in the SCS. Due to offshore observational limitations, it is challenging to obtain long time series and high-resolution data. Additionally, harsh weather conditions during TCs pose significant challenges for monitoring, leading to limited observational data on ocean-atmosphere interactions throughout the entire TC process. The processes that affect the temperature changes in the upper ocean include horizontal advection, vertical turbulent mixing, entrainment, and air-sea heat flux exchange. However, the contribution of air-sea heat flux to the changes in upper ocean temperature has been less studied, especially in the absence of in-situ observations of air-sea heat flux. The SCS lacks observation equipment, and direct observations of the air-sea interface elements are scarce, making it difficult to obtain long time series and high-resolution heat flux data. Does the air-sea heat flux in the NCSC contribute significantly to the changes in near-surface ocean temperature (NSOT)? To answer this question, this study used in-situ buoy observation data from June to November 2014 to analyze the characteristics of air-sea heat flux under different weather conditions (summer monsoon, autumn part of the winter monsoon, and two TCs that passed through the buoy array during the observation period), which provides a basis for further investigating the contribution of air-sea heat flux to the changes in NSOT.
Through the deployment of a buoy array in the northern SCS, we obtained six-month-long time-series heat flux data, which are valuable for studying air-sea interactions. The remaining sections of this paper are organized as follows: Section 2 describes the data and methodology used to calculate air-sea heat fluxes and analyze the associated parameters. Section 3 first discusses changes in the elements of the air-sea interface during the observation period, characterizes corresponding changes in the air-sea heat flux, and finally describes changes in NSOT. Section 4 provides a summary and discussion.
2 Data and methods
2.1 Buoy data
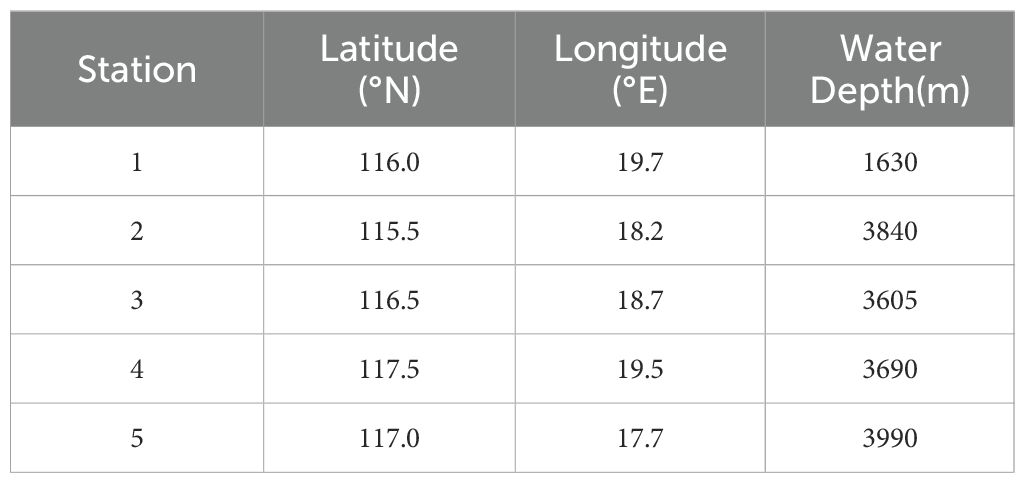
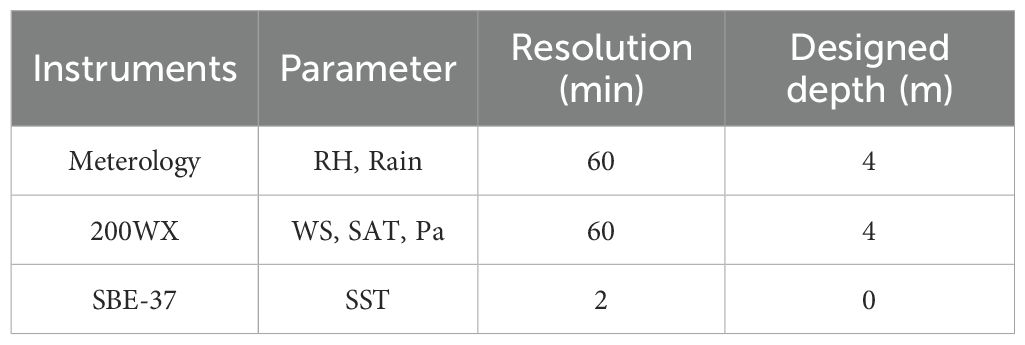
The cross-shaped observation array used in this study was deployed in the NSCS and consists of five deep-sea buoys and four deep-sea moorings (Figure 1; Table 1). At station 1, a series of SeaBird recorders was lost, resulting in missing temperature data. On September 15th, during the early morning hours UTC time, TC Kalmaegi snapped the wire rope of buoy 3, then buoy 3 drifted away. Additionally, stations 2 and 5 only captured data during TC Kalmaegi. Station 2 consists of one buoy and one mooring, recording relative humidity (RH), SAT, sea level pressure (Pa), SST, wind speed (WS), and rainfall (Table 2). Stations 1, 4, and 5 have a similar setup, with station 2 collecting atmospheric data at 12-minute intervals. The data were transmitted in real-time via satellite to a shore-based data center for processing and analysis. The accuracy and stability of the buoy data were ensured through regular calibration and maintenance. Air-sea heat fluxes were calculated using data from the air-sea interface elements observed over the six-month period from June to November 2014. The analysis revealed the characteristics of the changes in SST, NSOT, and air-sea heat fluxes during the observation period, along with their relationships with the air-sea interface elements.
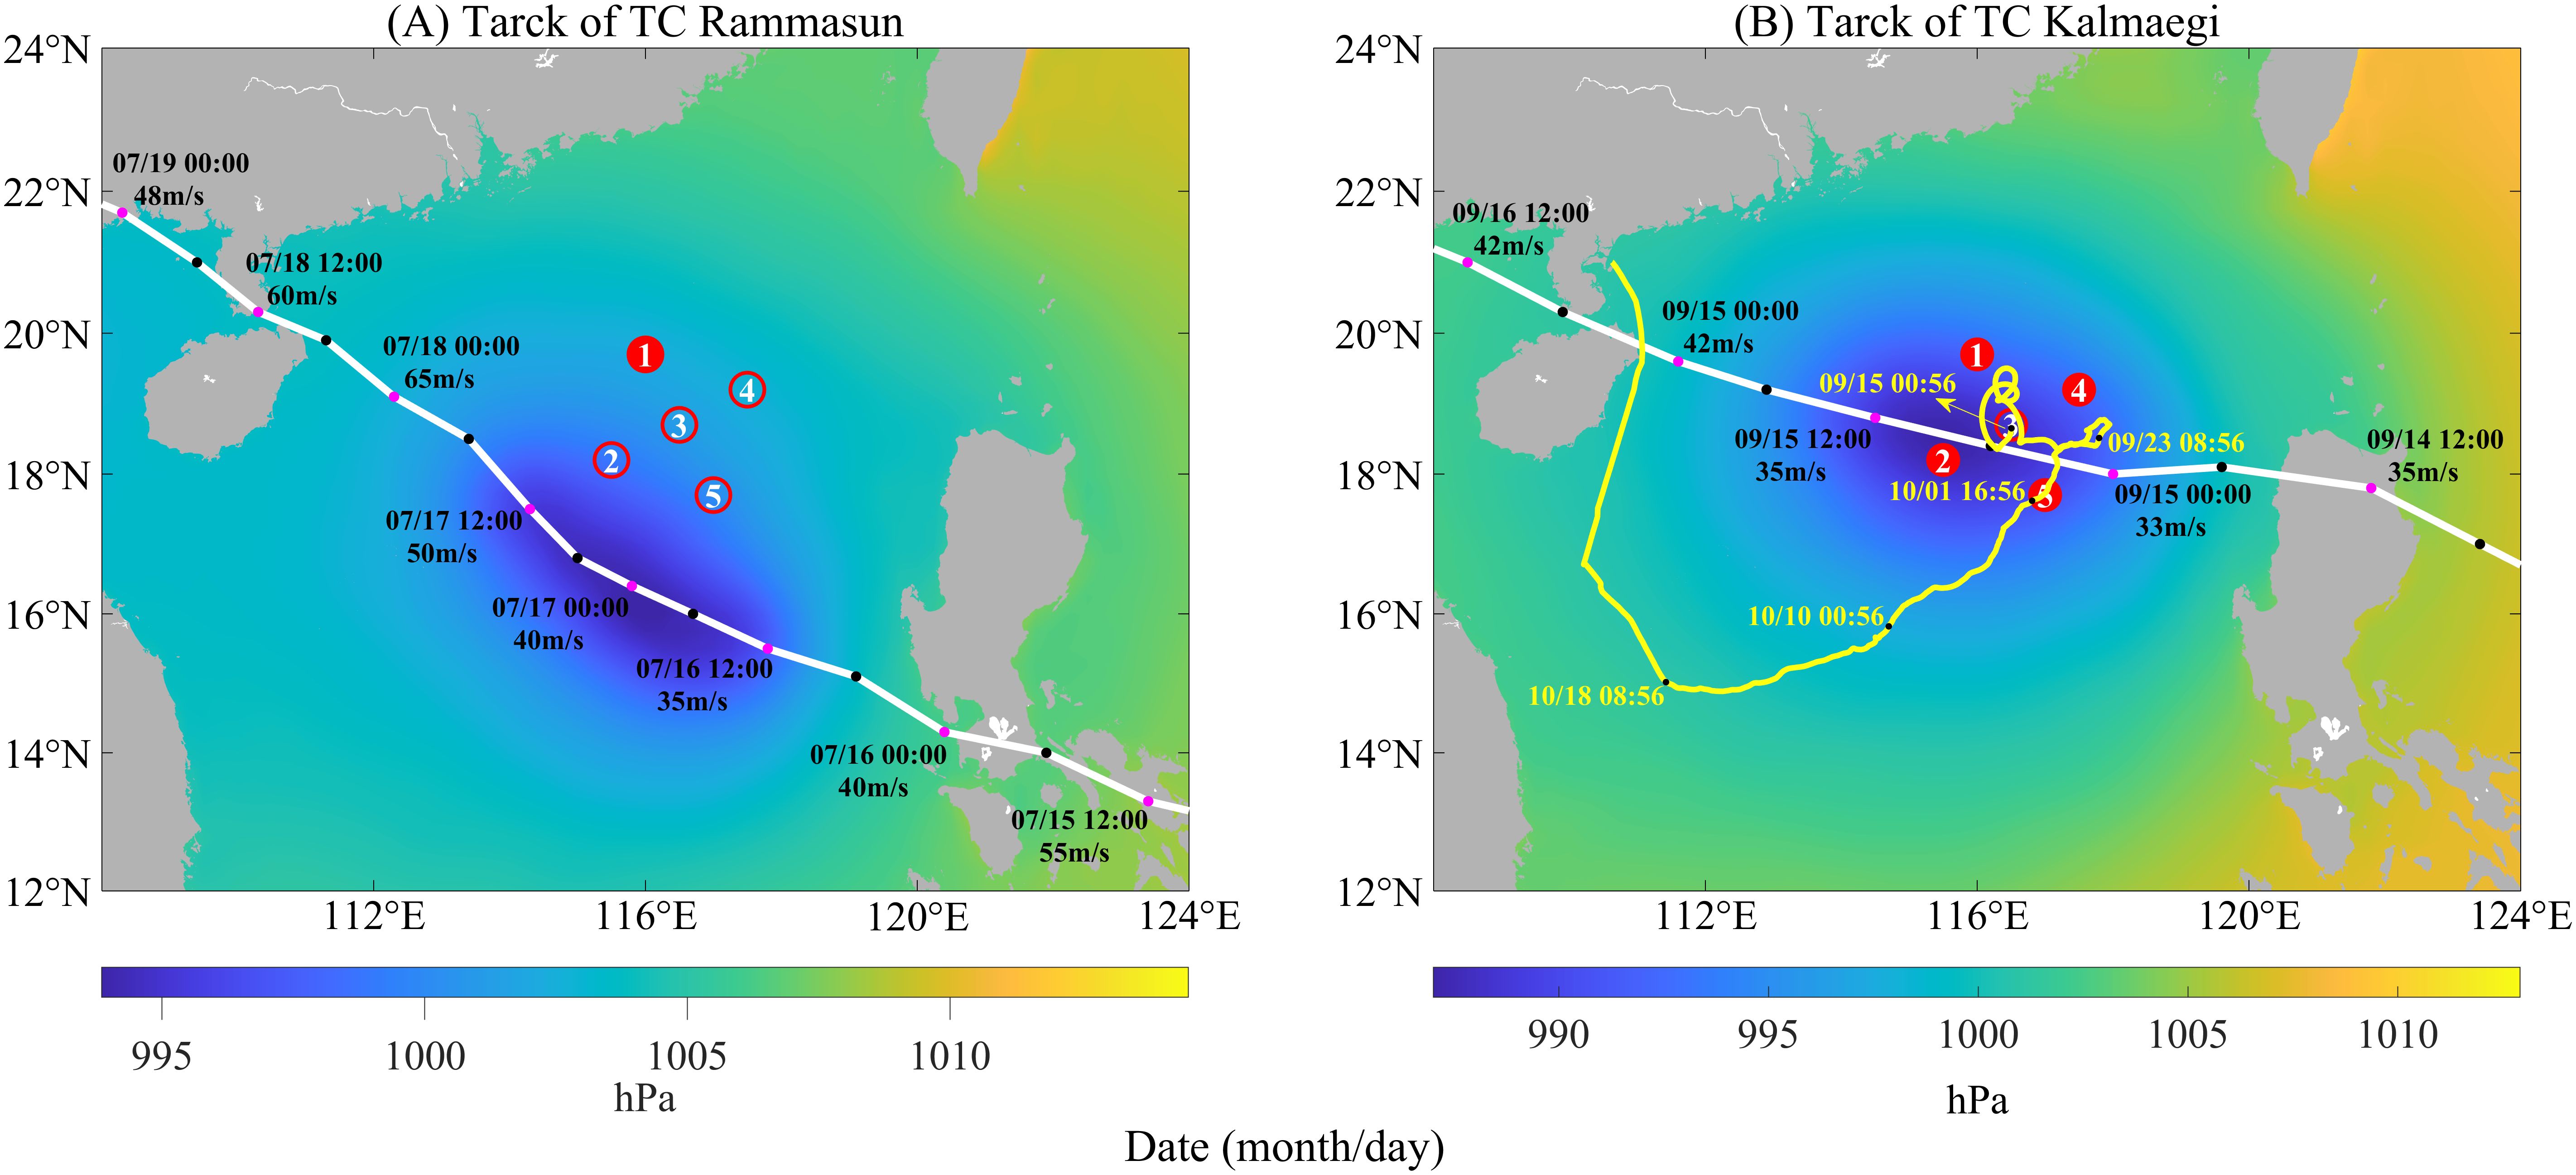
Figure 1. Buoy array and TCs track. Figures (A, B) represent the tracks of TC Rammasun and Kalmaegi respectively. The background is the mean sea level pressure field as it passes through the observational array. The white lines represent the tracks of the TCs, and the black points represent the positions of the TCs sampling time point. The locations of the five observation stations are indicated by red dots, and the station with no observation data is indicated by a hollow. The yellow color is the floating track of buoy 3 after it disconnects.
2.2 Typhoon data
Two TCs passed through the buoy array during the observation period: TC Rammasun and TC Kalmaegi (Figure 1). Information on their tracks and intensities was obtained from the China Meteorological Administration (CMA, http://tcdata.typhoon.gov.cn) (Ying et al., 2014; Lu et al., 2021). All data in this paper are recorded in UTC with a time resolution of 6 hours. The near-center maximum WS of the TCs in the dataset is considered as the average of the 2-minute near-center maximum WS. TC Rammasun formed over the western Pacific Ocean, east of the Philippines on July 10, 2014. By 12:00 UTC on July 15, it intensified to super typhoon. On July 16, TC Rammasun entered the SCS, and after 06:00 UTC on that day, the maximum WS at the center of TC Rammasun continued to increase. From July 16 to July 18, TC Rammasun underwent rapid intensification, transitioning from the typhoon level to the super typhoon level. TC Rammasun passed through the observing array from 18:00 UTC on July 16 to 18:00 UTC on July 17. TC Kalmaegi formed over the northwest Pacific Ocean, east of the Philippines on September 12. By 17:00 UTC on September 13, it had strengthened to the typhoon level. On the morning of September 15, TC Kalmaegi entered the northeastern part of the SCS and passed through the observational array. By 18:00 UTC on the same day, it further intensified to be strong typhoon.
2.3 Other data
The sea-level atmospheric pressure data for the average pressure field is sourced from the European Centre for Medium-Range Weather Forecasts (ECMWF, https://cds.climate.copernicus.eu). The sea-level atmospheric pressure data has a temporal resolution of 1 hour and a spatial resolution of 0.25° × 0.25°. The sea-level pressure of the two TCs passing through the observation array was averaged, and the average pressure field was plotted. The cloud cover data for calculating SW were obtained from the National Centers for Environmental Prediction (NCEP, http://www.esrl.noaa.gov/psd/data/gridded/data.ncep.reanalysis.html) reanalysis product.
2.4 Method of air-sea heat flux calculation
The Qnet consists of four components:
Where is the net downward SW, is the net LW, is the LH, is the SH. Positive values denote that the ocean is receiving heat.
Where is the incoming solar radiation directly measured from the buoy, is the surface albedo, is the observed downward LW, is the upward LW, is the surface emissivity, which is dependent on temperature and wavelength, is the Stefan–Boltzmann constant.
The advanced Coupled Ocean-Atmosphere Response Experiment version 3.0 (COARE3.0) is used to estimate SH and LH (Fairall et al., 2003). The algorithm calculates the SH and LH as follows:
Where is the density of air, is the LH of evaporation, is thespecific heat capacity of air, and is the turbulent exchange coefficients for the LH and SH respectively, is the WS at the height of 2m, and is the air-sea temperature and humidity difference.
3 Results
3.1 Air-sea interface elements
According to Figures 2, 3D, I, During the observation period, the WS was mainly concentrated between 2 m/s-9 m/s, and overall exhibited a trend of gradual increase as the season became colder. The maximum WS and the trend of WS changes were basically consistent, with the maximum WS occurring accompanied by an increase in overall WS. Excluding the abnormal increase in WS during TCs, the minimum WS generally occurred in SU, and the maximum WS occurred in AU. From June 19 to August 15, under the influence of summer monsoon, southwesterly winds prevail in the NSCS, and the average cloud cover observed at stations 1 and 2 is 69.42%, with an average RH of 79.56%. Summer monsoon seems to end on September 23, and the wind gradually transitions to a northeasterly direction around September 27, and overall WS increase and the WS fluctuations become relatively small afterward. For example, the average WS observed at station 2 during the prevalence of summer monsoon and winter monsoon is 5.9 m/s and 7.4 m/s, respectively. During the passage of a TC, the WS near the observation points obviously increases. During the passage of TC Rammasun, the WS at station 2 rapidly increased from 0.9 m/s to 27.5 m/s. During the passage of TC Kalmaegi, stations 2 and 5 exhibited a bimodal WS pattern, which is likely due to their proximity to the TC’s eye (Zhang et al., 2016). As TC moves away from the observation area, the WS gradually decreases and the wind direction gradually turns to southerly. It is worth noting that, station 1 is farther from the TC’s path (Figure 1), yet the WS is larger than that of station 5, possibly due to the asymmetric WS distribution and the fact that station 1 is on the right side of the TC’s path (Tamizi et al., 2020). Additionally, the WS increased and the wind direction changed dramatically at stations 1 and 4 around August 18 and at all four stations around September 6, which may be related to the tropical low-pressure system near the buoy array. The WS at stations 2, 4, and 5 increased around September 20, possibly due to the occurrence of a tropical depression about 157.8 km to the right of stations 4 and 5, and the presence of a strong tropical storm ‘Fung-wong’ about 247 km away.
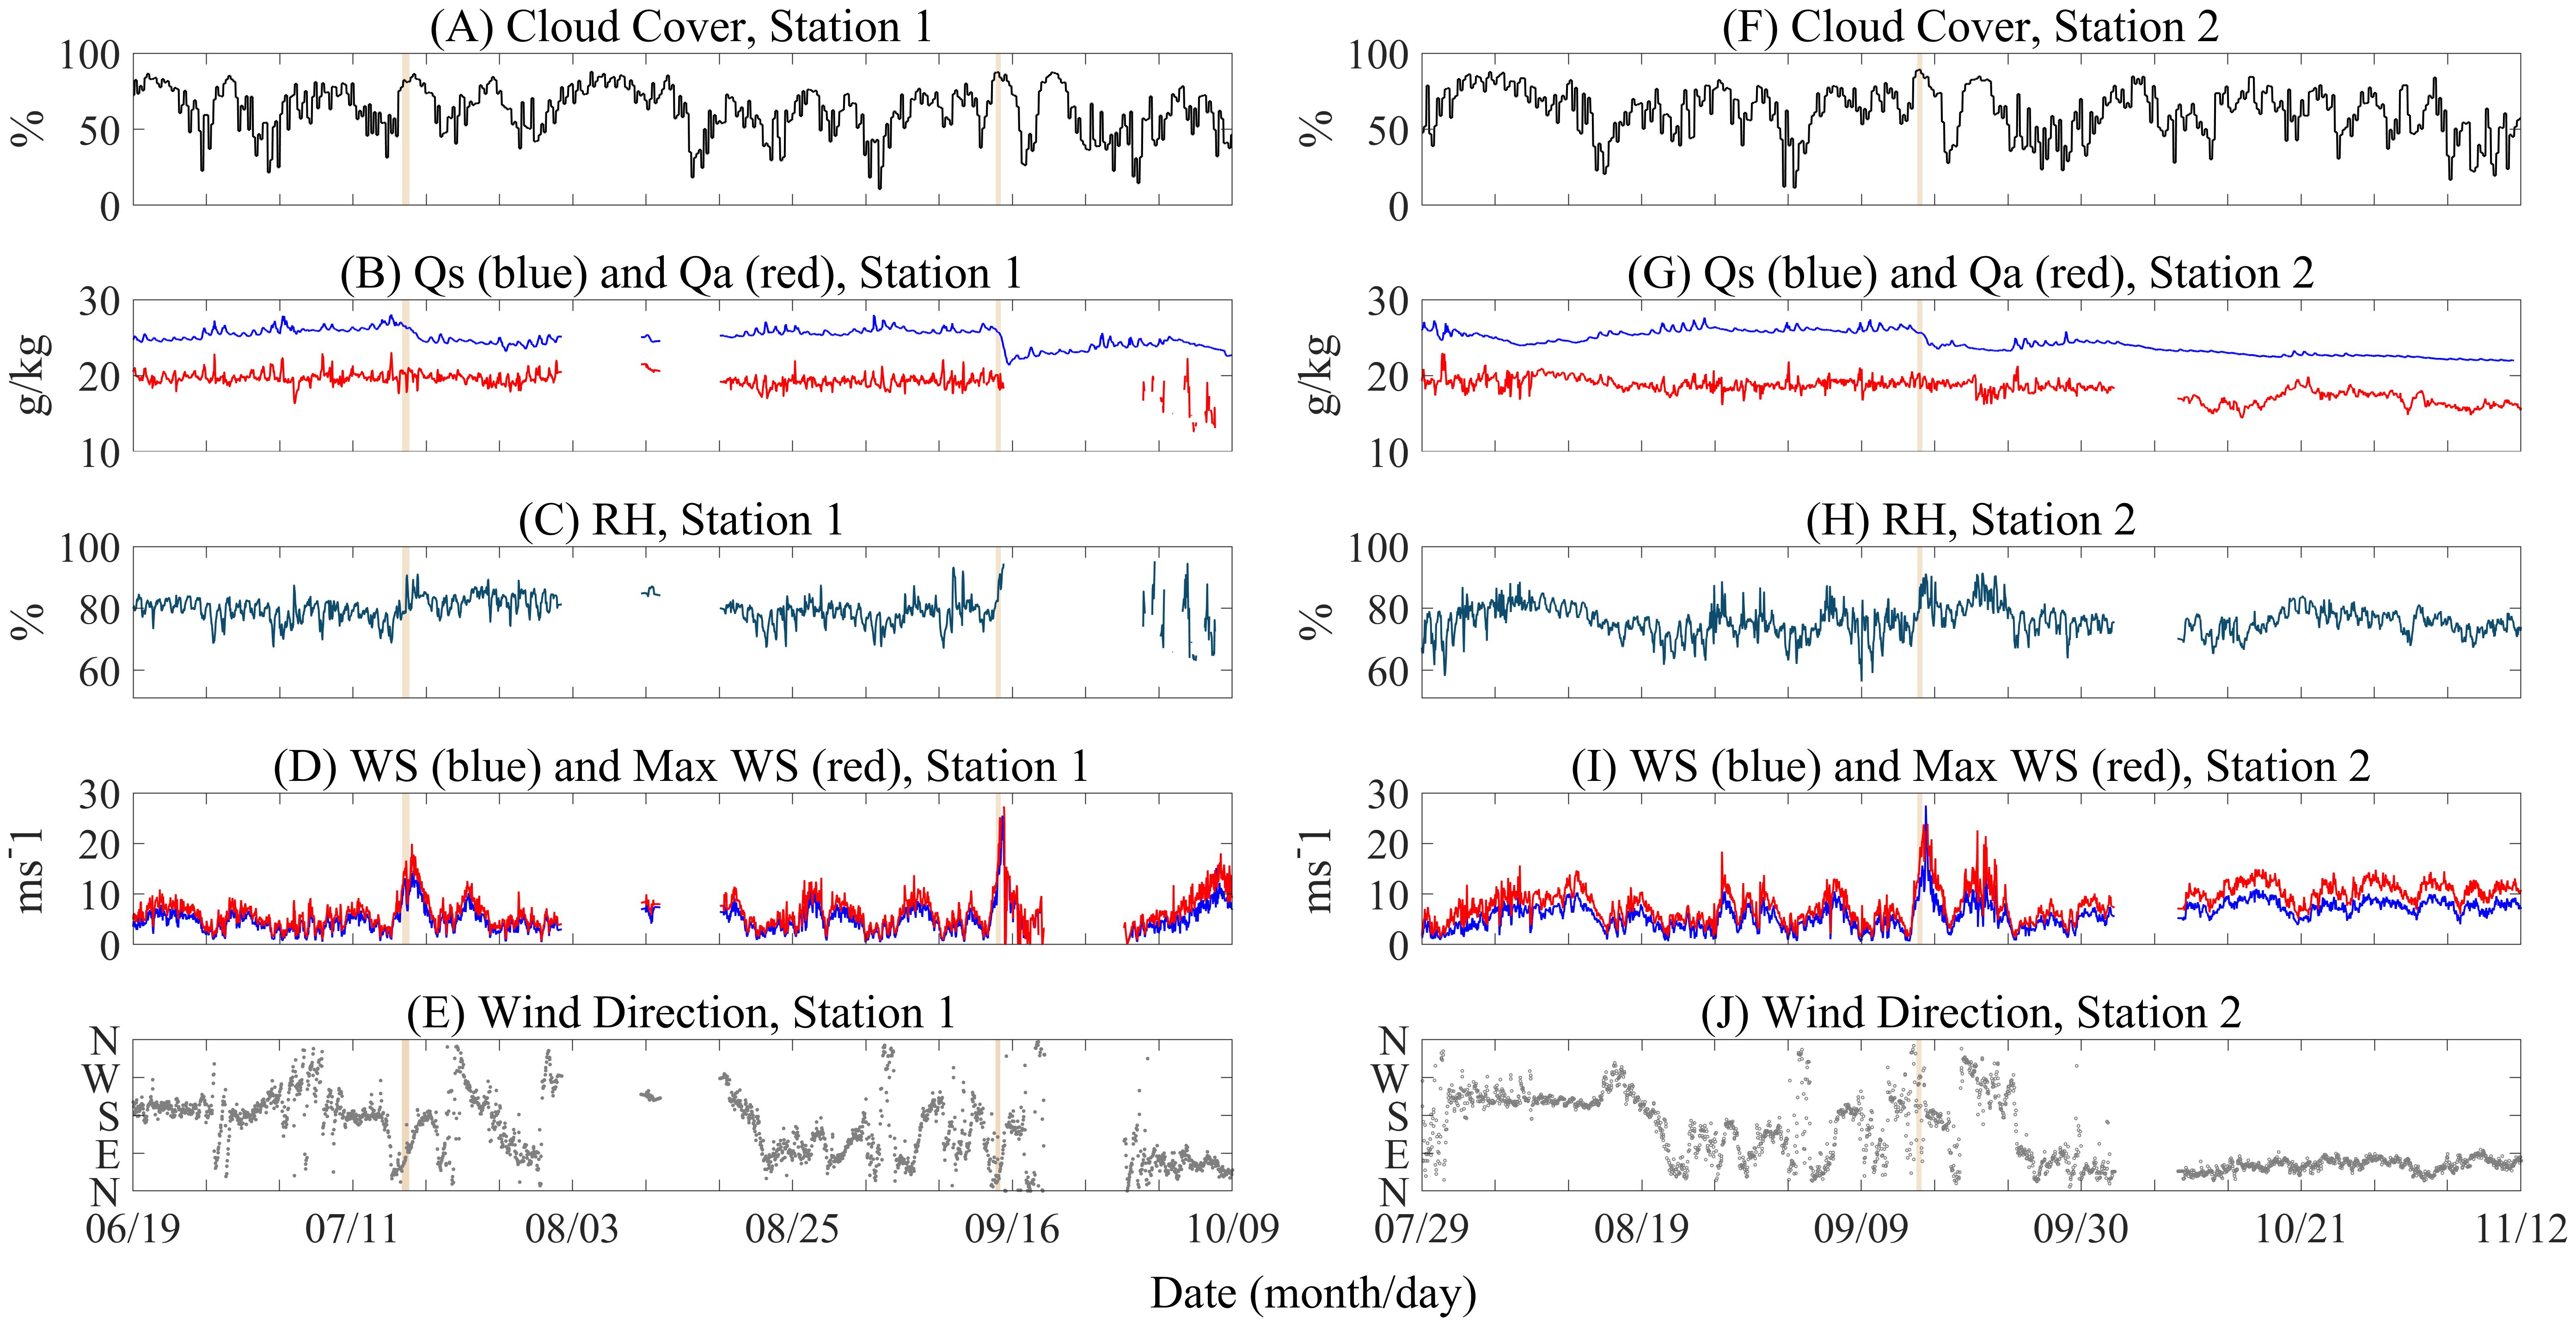
Figure 2. Time series plots of observed air-sea interface elements at Station 1 (A–E) and 2 (F–J). (B–G) stand for specific air humidity at a height of 4m (red) and specific humidity at sea surface (blue). The orange shaded areas indicate the time of the two TCs passing through the observation array. TC Rammasun is from 18:00 on July 16 to 12:00 on July 17; TC Kalmaegi is from 0:00 on September 15 to 12:00 on September 15.
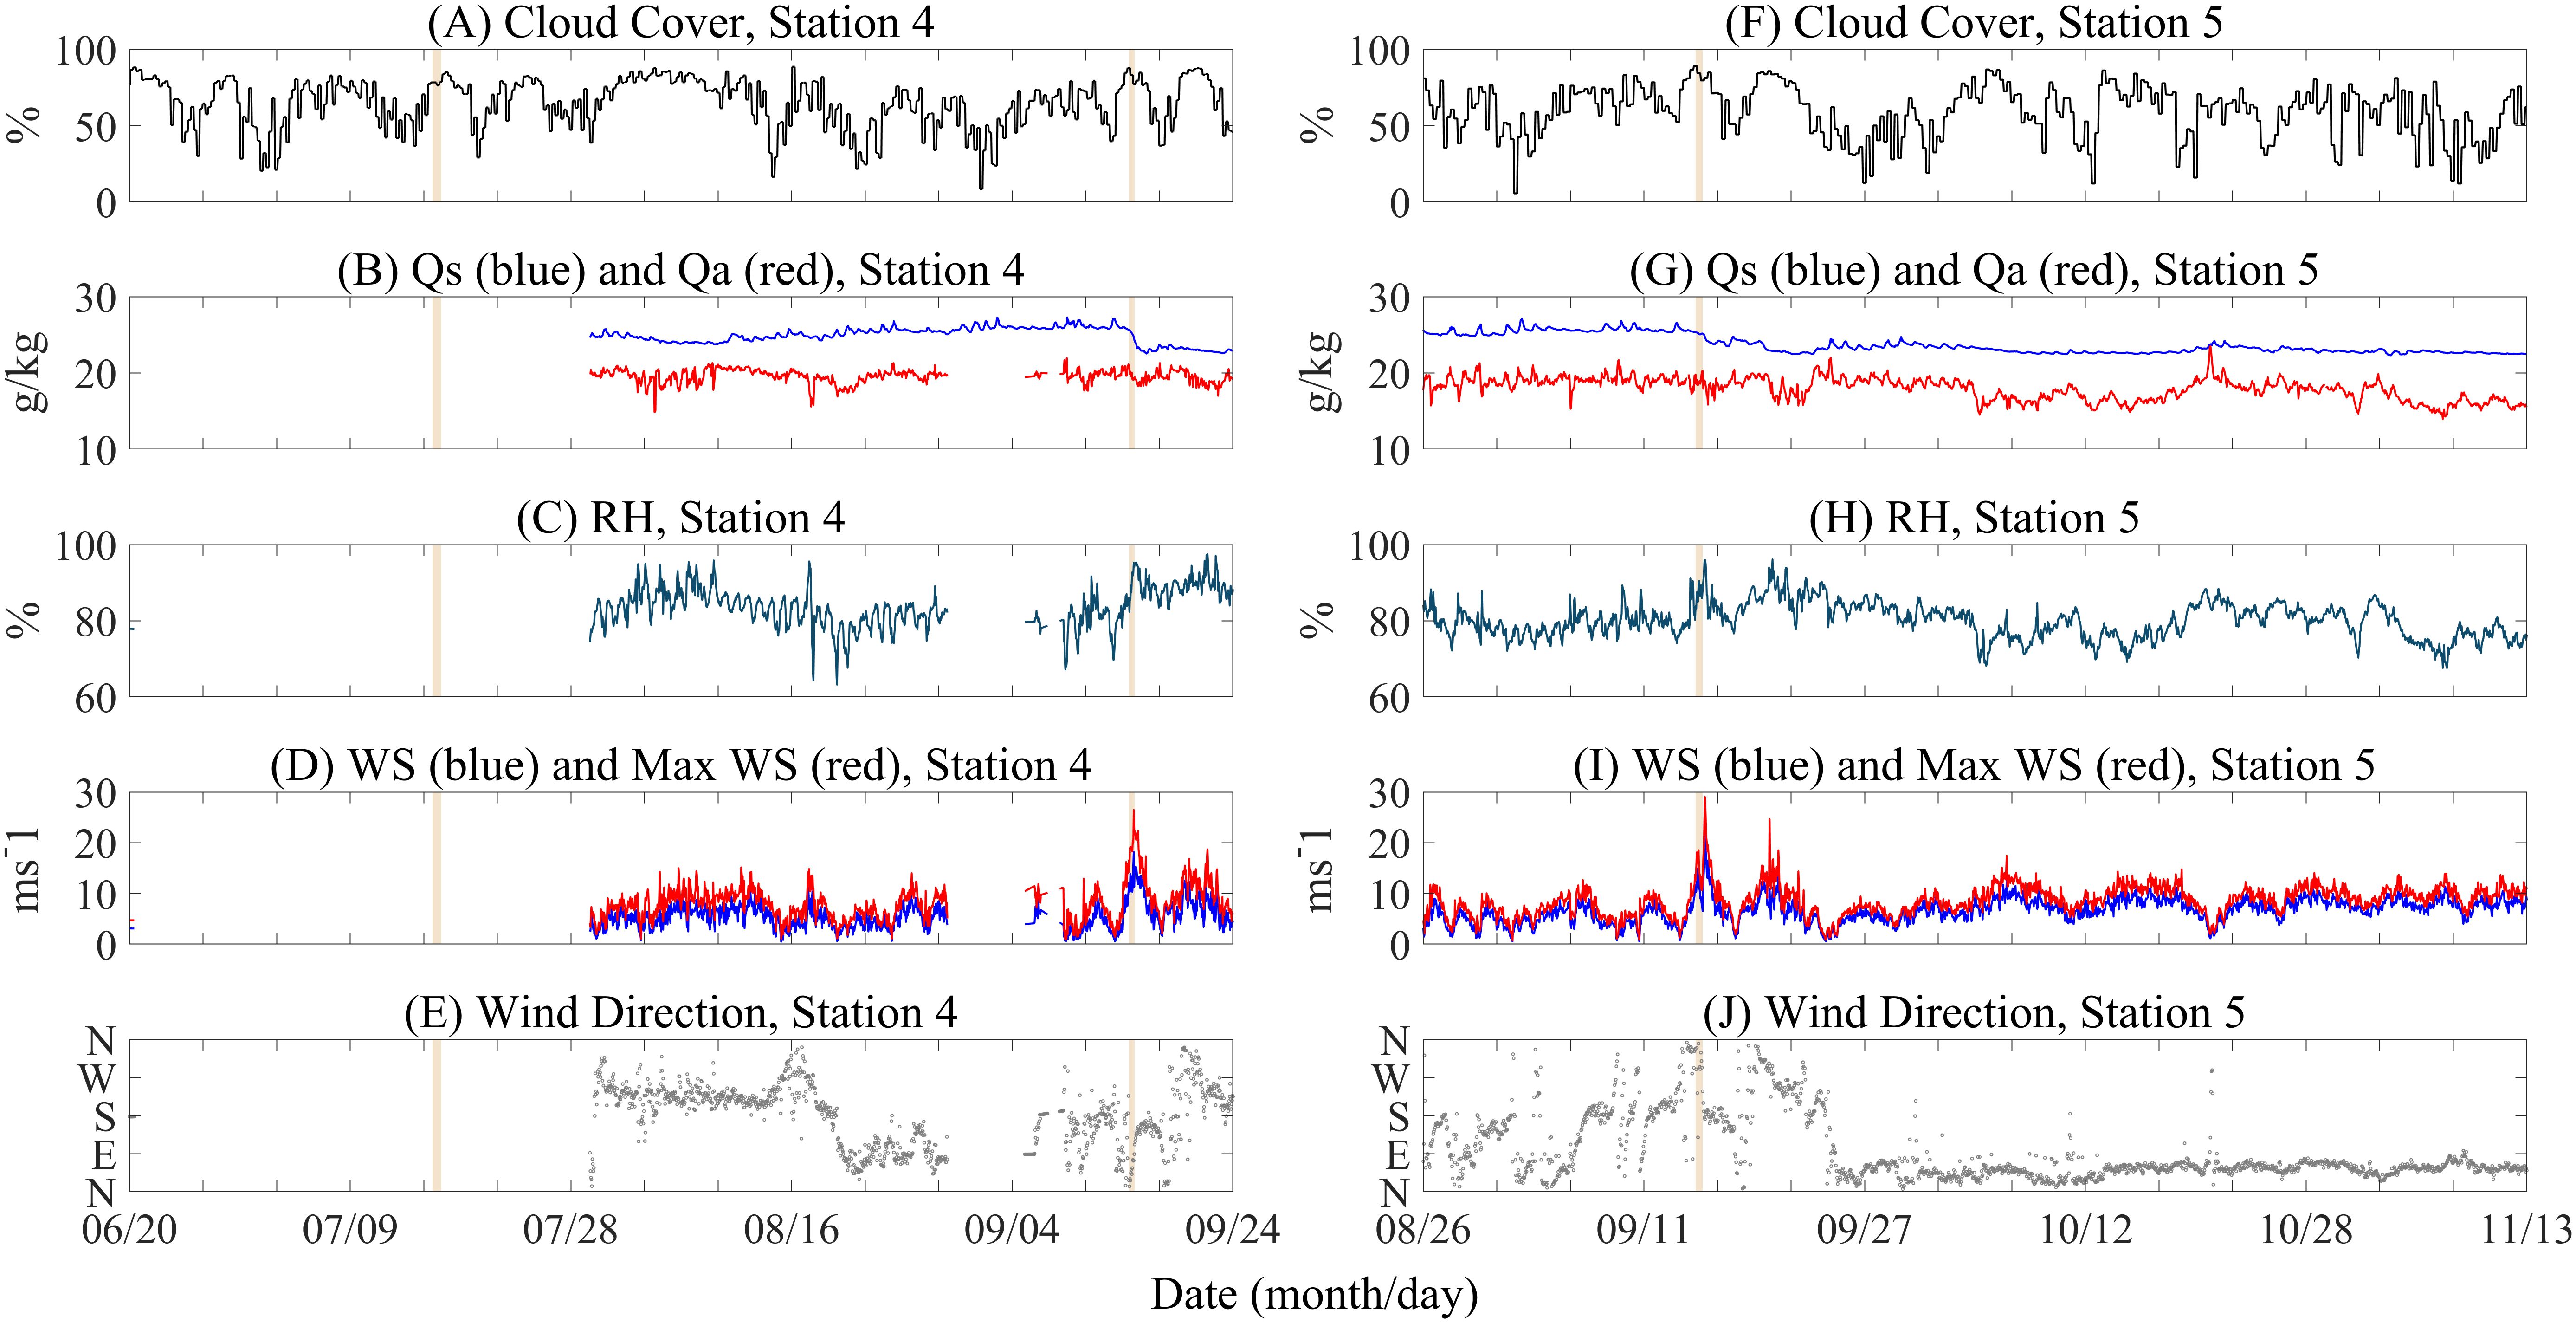
Figure 3. Same to Figure 2 but for Station 4 and 5.
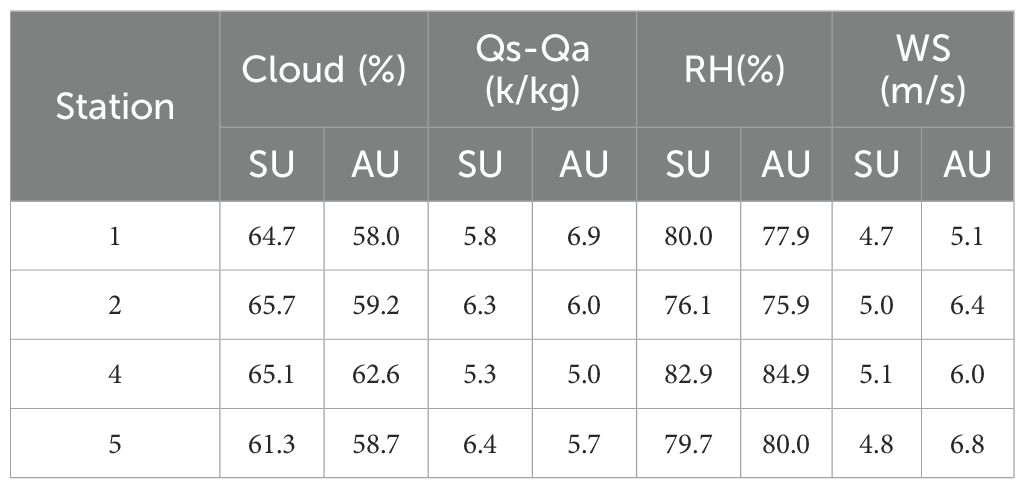
According to Figures 2, 3A, F, during the observation period, the cloud cover was generally higher in SU than in AU, but the seasonal difference was relatively small (Table 3). The maximum cloud cover occurred in August, and the minimum occurred in September. The cloud cover exhibited a significant diurnal cycle, reaching its daily maximum value between 13:00 UTC and 15:00 UTC on that day. Under the influence of summer monsoon, from July 30 to August 14, the cloud cover at all stations was above 81%, corresponding to high RH and low SAT. During the period from September 23 to September 27, which is the monsoon transition period, the overall cloud cover decreased. After gradually transitioning to winter monsoon, the cloud cover gradually increased. During TC periods, the cloud cover increased significantly, with the cloud cover increased from 51.1% to 85.7% during TC Rammasun, and the cloud cover at station 2 increased from 39.4% to 87.2%, and the cloud cover at station 4 increased from 39.2% to 87.5% during TC Kalmaegi. Throughout the TC period, the cloud cover was generally above 75%. As the TC moved away from the observation array, the cloud cover gradually recovered.
The SCS is a region of high SST, and the minimum area-averaged SST in February from 1979 to 1999 was 25.9°C (Chen et al., 2003). According to Figures 2, 3C, H, During the observation period, the RH generally ranged between 77.6% and 82.8% without significant seasonal variation (Table 3). At station 2, the average RH was 78.1% during summer monsoon and 75.4% during winter monsoon periods. During winter monsoon period, the diurnal variation of RH was relatively small. During the passage of TCs, RH increased significantly. Specifically, during the passage of TC Kalmaegi, station 4 recorded a maximum RH increase of 25.7%.
3.2 Air-sea heat fluxes
The turbulent heat flux includes SH and LH. SH refers to the heat exchange between the ocean and the atmosphere due to temperature changes, while LH refers to the water vapor heat exchange between the ocean and the atmosphere, which is closely related to sea surface evaporation and SST. In tropical oceans, LH primarily balances the incoming solar radiation to achieve heat balance at the ocean surface (Cayan, 1992; Carton and Zhou, 1997). The radiation flux includes SW and LW. The reduction in downward SW is a primary factor leading to SST cooling, with the cloud layer being the main physical factor limiting the downward solar radiation flux (Cess et al., 1993; McFarlane et al., 2008; Lubin and Vogelmann, 2011; Liu et al., 2023). Specific calculation method (Equations 1–6).
In the air-sea interaction processes, the upper ocean can provide heat to the atmosphere by regulating the humidity and temperature differences between the sea and the air (Figures 4, 5). During the observation period, LH values were negative, and SH was mainly negative (defined as the atmosphere gaining heat from the ocean, i.e., the ocean losing heat), indicating that the ocean mainly loses heat. All stations showed that LH was much larger than SH, indicating that the turbulent heat flux was dominated by LH loss, consistent with previous studies (Park et al., 2005; Andreas et al., 2013). During winter monsoon period, the NSCS was under control of the strong cold northeast airflow, leading to increased WS. The air-sea humidity and temperature differences also increased, resulting in greater turbulent heat losses in AU compared to SU (Table 4). Over the observation period, the trend of LH change aligned well with WS changes, consistent with LH being primarily influenced by WS during high SST periods (Zhang and Mcphaden, 1995). Previous studies have also shown that in the SCS region, LH is primarily influenced by WS rather than the air-sea humidity difference (Chen et al., 2003; Zeng and Wang, 2009). During the observation period, SH variation was smaller than LH, but its diurnal variation trend was more pronounced, reaching its maximum value around 10:00 UTC to 3:00 UTC of the day and showing fluctuating changes. After sunset, SAT decreased faster than SST, and the air-sea temperature difference decreased, leading to a decrease in SH. Additionally, precipitation during summer monsoon period can increase SH, with all four stations showing a good correspondence between changes in SH and RH. Moreover, increased WS led to the presence of more sea spray droplets at the air-sea interface. The evaporation of these sea spray droplets caused a decrease of SAT, which increases the air-sea temperature difference and promoted the transfer of SH from the ocean to the atmosphere. During TC periods, the sea surface mixing was enhanced due to increased WS, leading to a significant increase in turbulent heat flux, and LH was significantly greater than SH. For example, during TC Rammasun, LH rapidly increased from -121.7 W/m2 to -313.6 W/m2, and SH increased from -12.5 W/m2 to -70.5 W/m2; during TC Kalmaegi, the LH measured at station 4 rapidly increased from -128.1 W/m2 to -404.6 W/m2, and SH increased from -13.1 W/m2 to -127.1 W/m2.
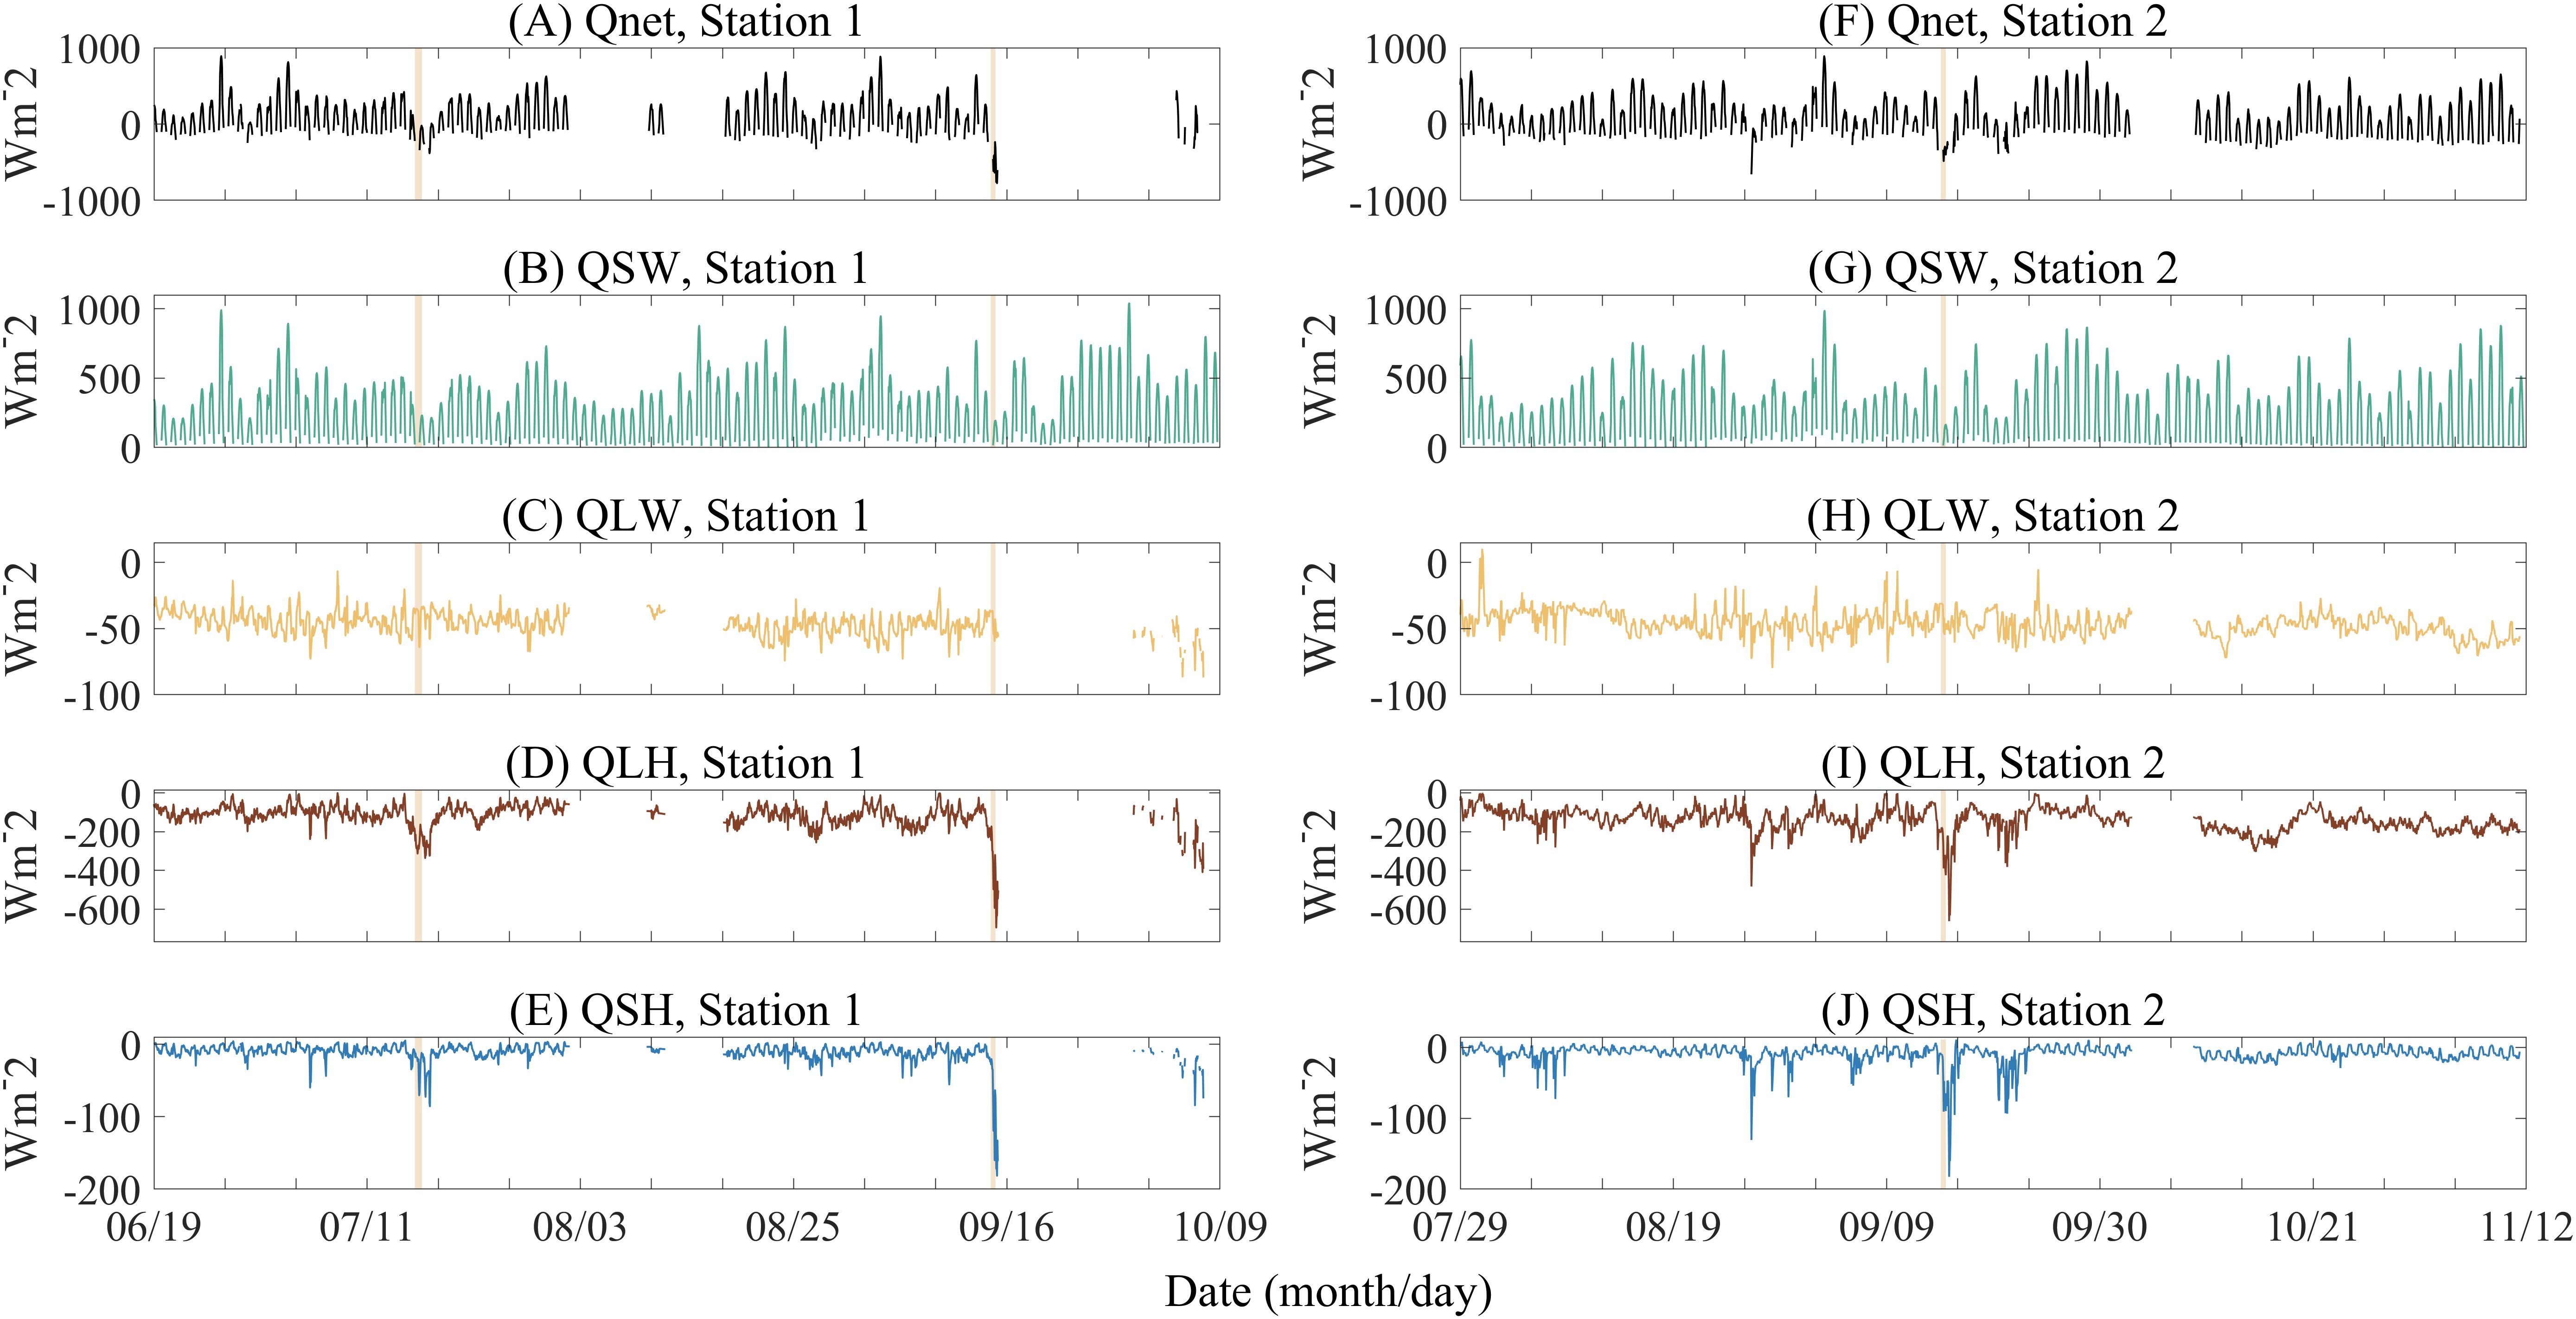
Figure 4. Time series air-sea heat fluxes at Station 1 (A–E) and 2 (F–J). The meaning of the orange shade is the same as in Figure 2.
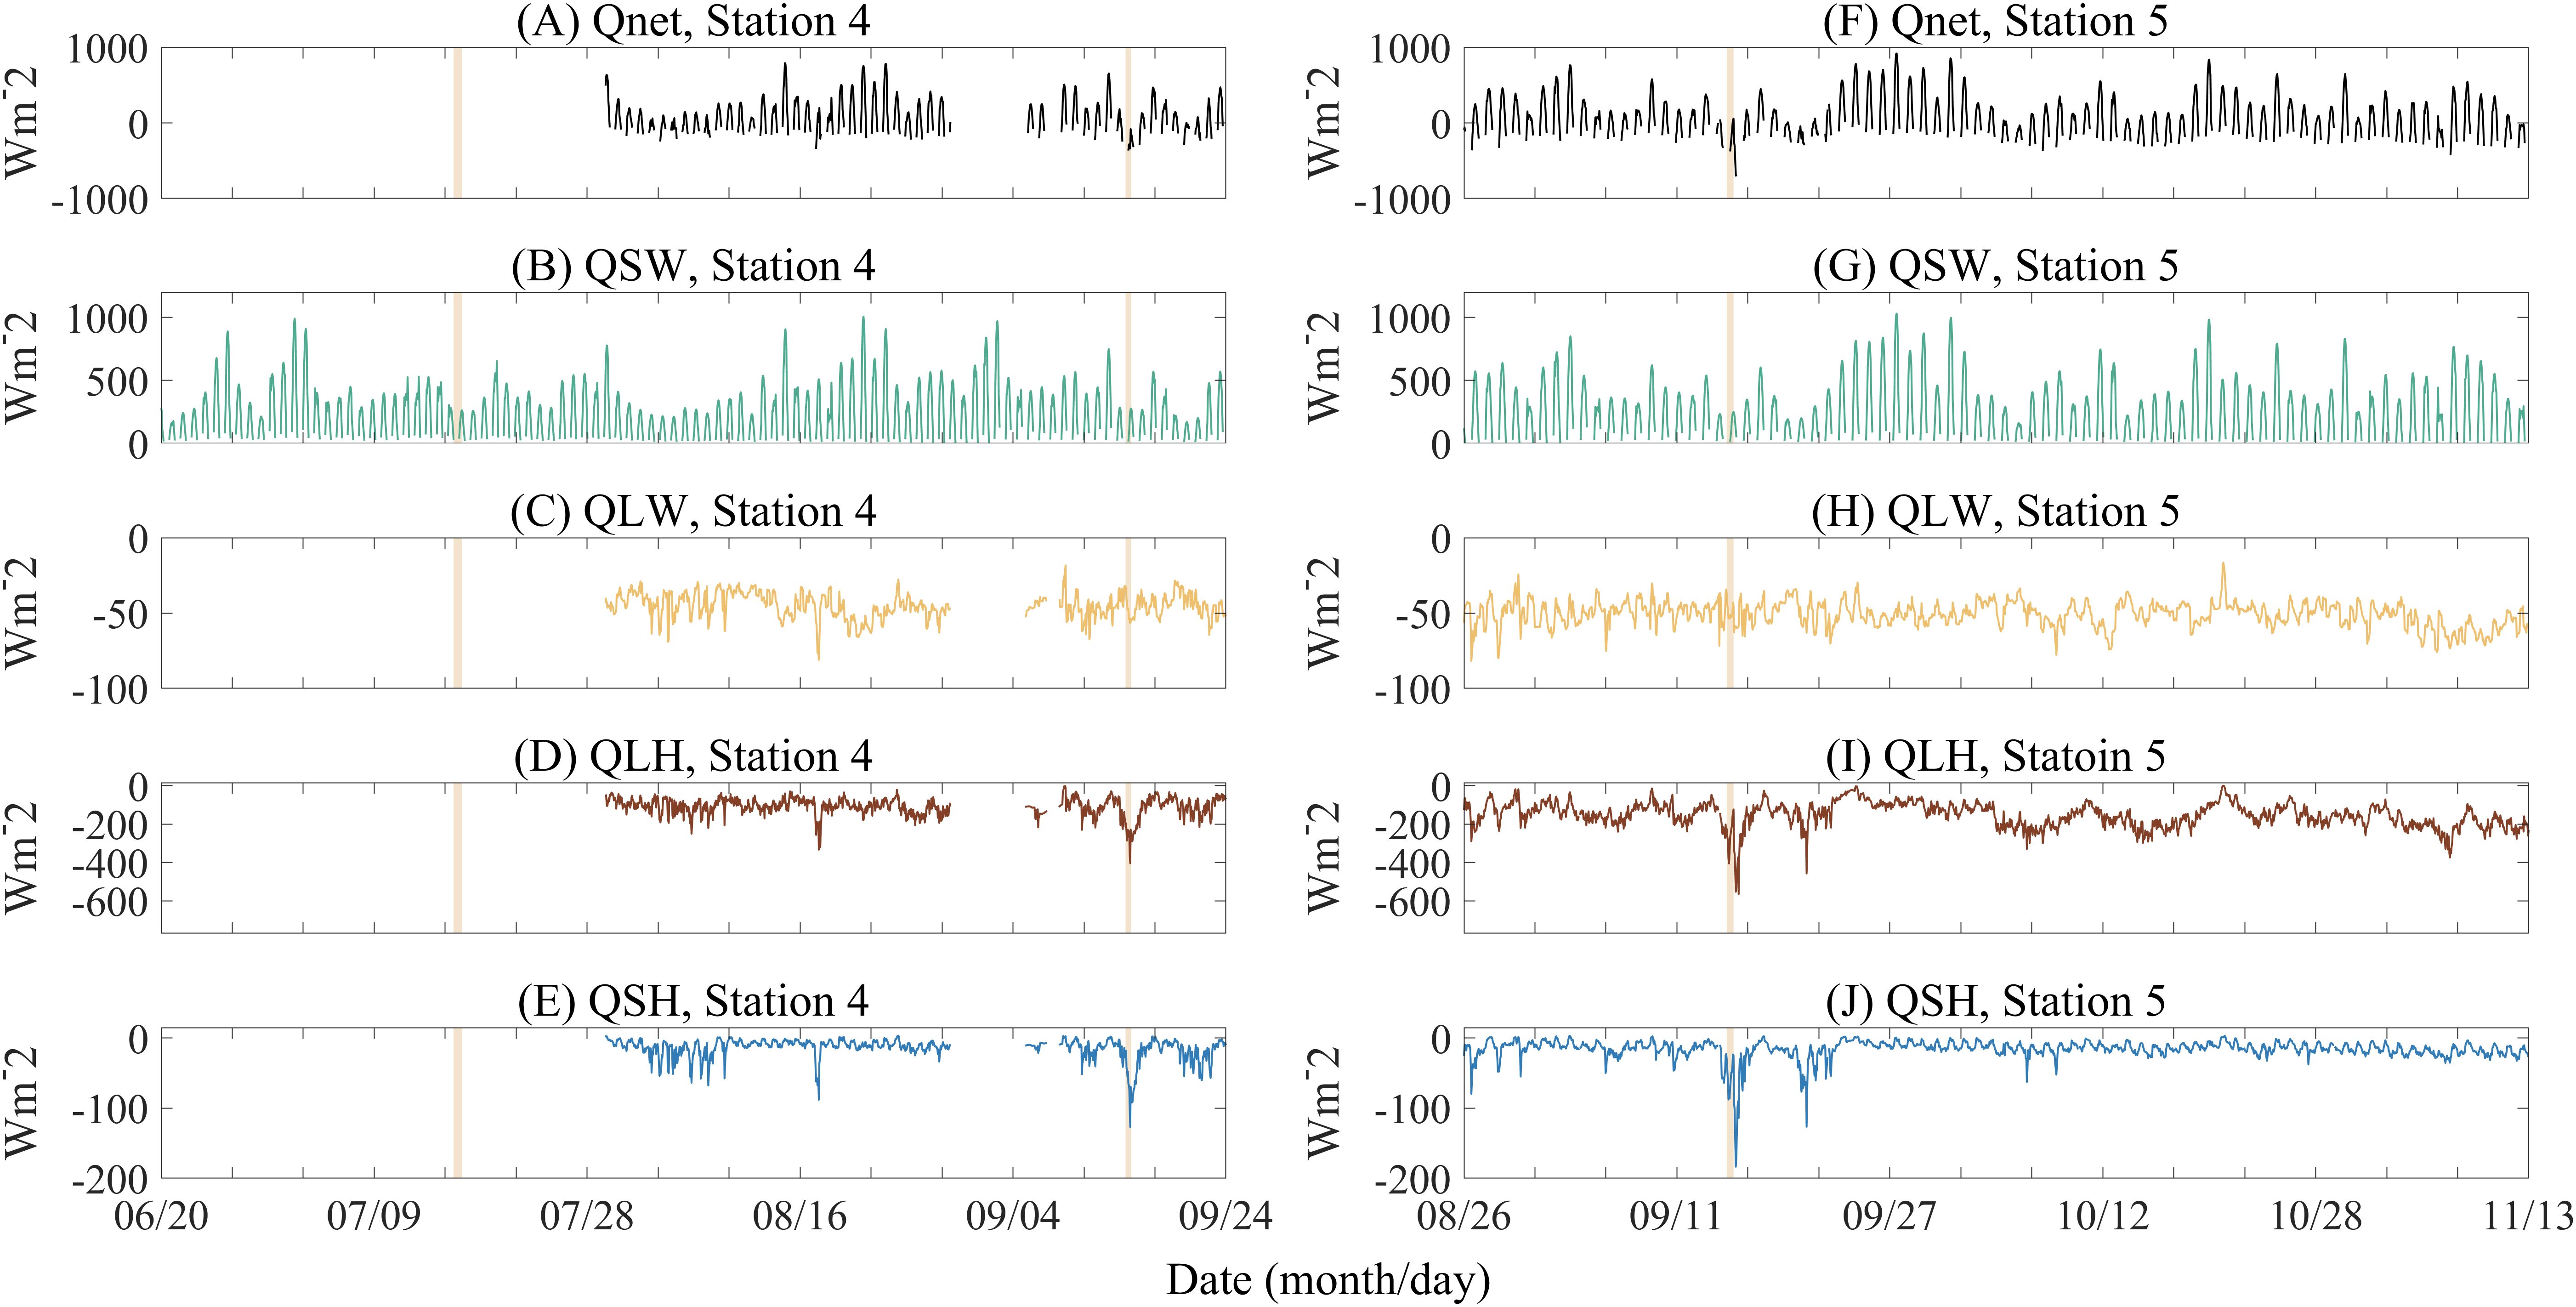
Figure 5. Same to Figure 3 but for Station 4 and 5.
According to Figures 4, 5, During the observation period, the radiation flux exhibits a clear diurnal cycle. The decrease in SW is well correlated with the increase in total cloud cover, with the overall trend being higher in AU than in SU (Table 4), and the maximum SW occurring in August and September. Changes in meteorological elements during the southwest summer monsoon period affect the changes in radiation flux. During summer monsoon period, the total cloud cover decreases, the RH is high, and the SW reaching the sea surface is generally lower. With the arrival of winter monsoon, the SW gradually increases. At station 2, the daily mean SW is 270.3 W/m2 during summer monsoon and 309.1 W/m2 during winter monsoon periods. During the passage of TCs, the SW decreases significantly. For example, during the passage of TC Rammasun, the daily maximum SW rapidly decreases from 401.1 W/m2 to 227.8 W/m2, and during the passage of TC Kalmaegi, the daily maximum SW rapidly decreases from 749.3 W/m2 to 242.6 W/m2. The downwelling SW decreases significantly, from 1690.0 W/m2 to 287.5 W/m2 (Figure 6C). Overall, the LW is higher in AU than in SU, but the seasonal variation is not significant (Table 4). Under the influence of summer monsoon, the increased water vapor and cloud cover suppress the release of LW from the ocean to the atmosphere. From Equation 4, it is known that LW is primarily influenced by SST. During winter monsoon period and TC periods, the decreased SST led to a reduction in the upward LW, resulting in an increase in LW (Figure 6D). Furthermore, the increase in cloud cover and the reduction in SW during TC passages suppress upward LW, leading to increased LW. At station 2, the daily mean LW was -25.7 W/m2 during summer monsoon and -39.9 W/m2 during winter monsoon periods. During the passage of TC Rammasun, the maximum increase recorded at the four stations is 25.7 W/m2. Additionally, station 3 shows that downward LW and upward LW are relatively stable, especially downward LW, with a diurnal variation of about 1W/m2-6 W/m2.
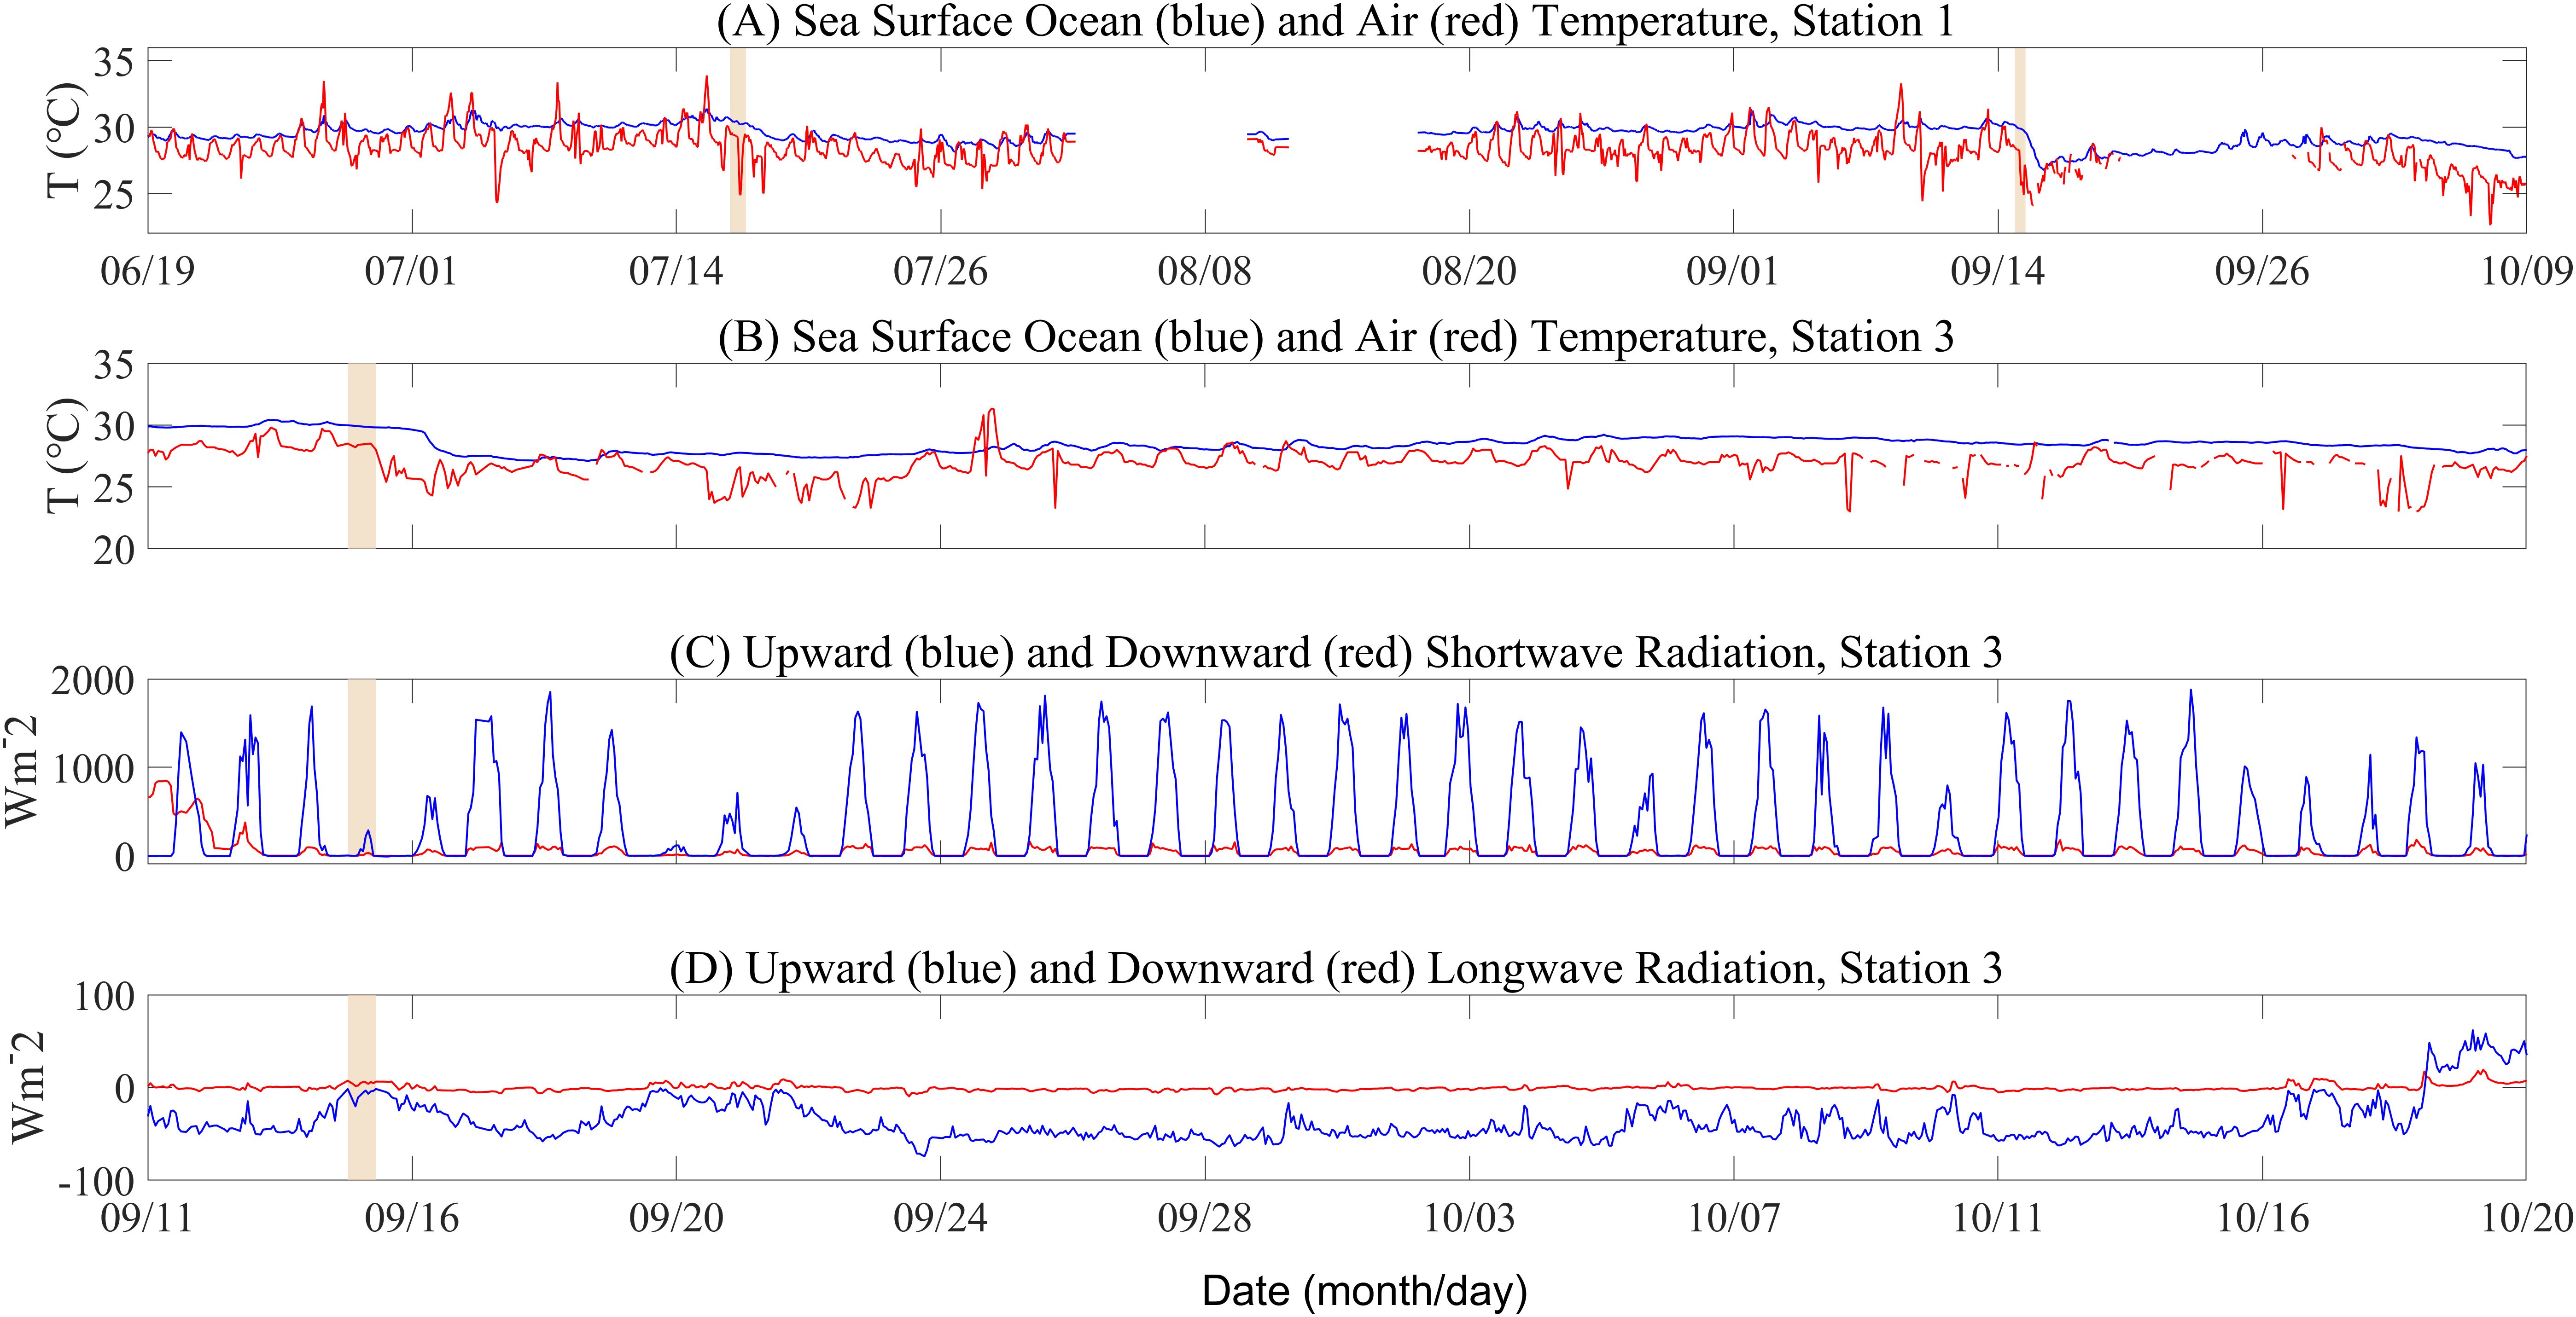
Figure 6. Time series of sea surface ocean and air temperature at Station 1 (A) and 3 (B), and the shortwave (C) and longwave (D) radiative flux at station 3.
During the observation period, the Qnet primarily results from the cancellation between the heating effect of SW and the cooling effect of LH and LW, while the contribution from SH is relatively small, consistent with previous studies (Zhang et al., 2012; Song et al., 2021). According to Figures 4, 5A, F, the calculated Qnet at the four stations was predominantly negative, indicating that the ocean mainly heated the atmosphere. Qnet increased by an average of 34.4 W/m2 as the seasons transition to colder conditions, primarily due to the stronger winter monsoon leading to an increase in LH driven by evaporation. During the TC period, Qnet decreased significantly. For example, during TC Rammasun, Qnet decreased from 177.6 W/m2 to -19.6 W/m2, and during TC Kalmaegi, Qnet at station 2 decreased from 280 W/m2 to -233.4 W/m2.
3.3 Near-surface ocean temperature
The tropical ocean receives a large amount of solar radiation and plays an important role in influencing the Earth’s climate system due to its huge heat capacity (Palmer and McNeall, 2014). Air-sea heat fluxes are a major driver of seasonal temperature variations in the mixed layer (Roberts et al., 2017). SST changes are due to changes in heat flux and internal dynamic processes in the ocean. On a short time scale, the ocean heat flux, especially the net ocean heat input, is the main factor causing SST changes. The net surface heat flux has a strong regulatory effect on the annual average sea temperature (Alexander et al., 2000). Changes in ocean heat content play an important role in regional and global climate variability (Roberts et al., 2015).
Figures 6A, B, 7A, 8A, 9A show that during the observation period, both SST and SAT exhibit seasonal cooling, with SST averaging between 27°C and 30°C and SAT ranging from 26°C to 29°C. SST gradually decreases with seasonal transitions, with an average of 29.6°C in SU and 28.5°C in AU. The air-sea temperature difference is an important parameter characterizing the heat exchange characteristics at the air-sea interface. The SAT is generally lower than the SST, indicating that the ocean is predominantly losing heat. The average air-sea temperature difference during the observation period is 1.2°C. During winter monsoon period, the increased wind speed leads to an intensification of the LH, resulting in a cooling of the SST (Wu and Chen, 2015). At station 2, the average SST is 29.4°C during summer monsoon period and 28.9°C during winter monsoon period. The SST begins to decrease one day before the passage of a TC. Before the passage of TC Kalmeagi, the SST at the observation point was 30.5°C, with the NSOT at around 26.9°C. During the TC passage, the decrease in SAT is larger than the decrease in SST, leading to an increased air-sea temperature difference and a greater heat transfer from the ocean to the atmosphere. After the passage of TC Kalmaegi, the SST at the observation point is 29.8°C, with the NSOT at around 25.4°C. The maximum cooling observed at all stations occurs 1-2 days after the TC passage, and the response of the NSOT to the TC also exhibits a time lag, reflecting the delayed impact of the TCs on the ocean (Wu et al., 2019). The lag is due to the time required for the accumulation of energy transferred from the TC to the ocean (Zhang et al., 2016). Furthermore, the cooling amplitudes observed at stations 1 and 4 are greater than that observed at stations 2 and 5 for both SST and NSOT, reflecting the right-bias in the ocean’s response to TCs (Jiang et al., 2009). For example, the SST cooling amplitude of station 1 is 0.6°C and 0.9°C greater than that of stations 2 and 5, respectively. The cooling range of NSOT at station 4 is 0.8°C and 1.0°C larger than that at stations 2 and 5, respectively. Furthermore, about one day after the passage of a TC, the NSOT exhibits a pronounced diurnal variation characteristic. The diurnal cycle of the SST is mainly influenced by the diurnal variation of solar shortwave radiation, while the diurnal cycle of the subsurface sea temperature shows obvious vertical variation, which is primarily influenced by tides. After experiencing the maximum cooling, the ocean gradually enters a recovery period. When SAT is higher than SST, it favors the recovery of the sea temperature. Due to the high heat capacity of the ocean, the recovery of SST is slower than that of SAT. It is worth noting that neither the SST nor the NSOT of TC Kalmaegi have fully recovered to their original states, which may be influenced by seasonal changes.
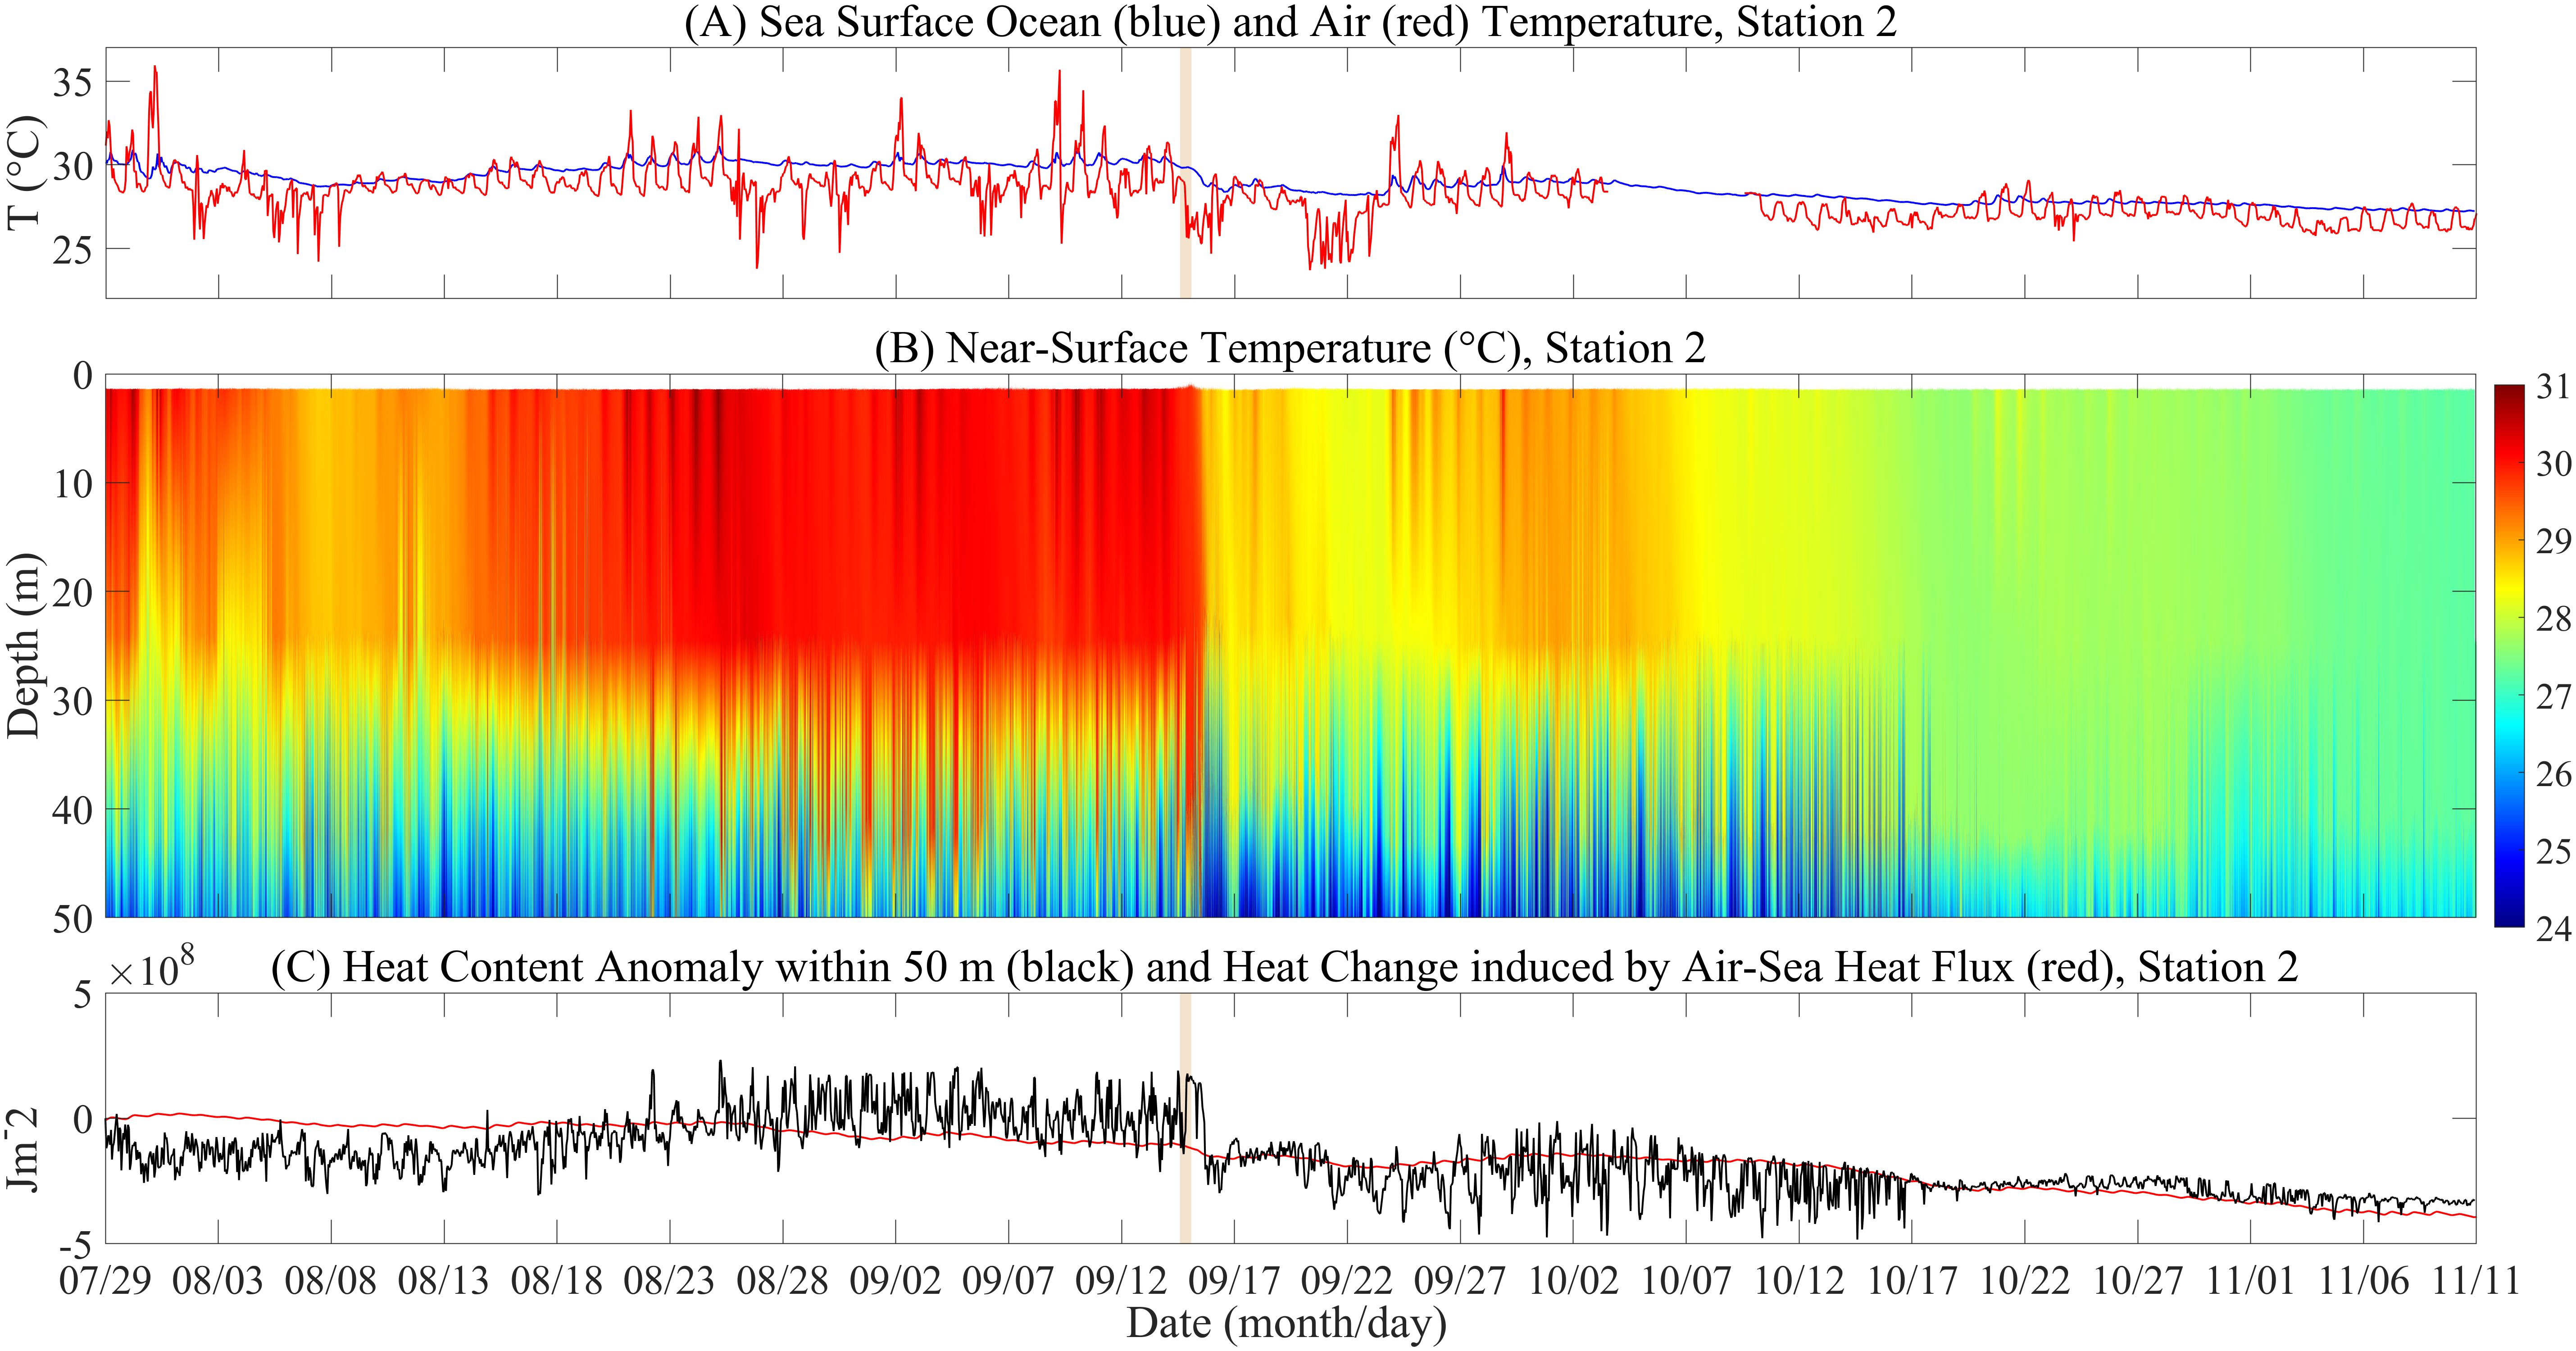
Figure 7. Time series of SST difference at Station 2 (A), as well as near-surface temperature (B) and heat content anomaly and cumulative heat flux from sea surface (C) to 50 m water depth. The heat content anomaly is the difference between the heat content array and the first value in the array.
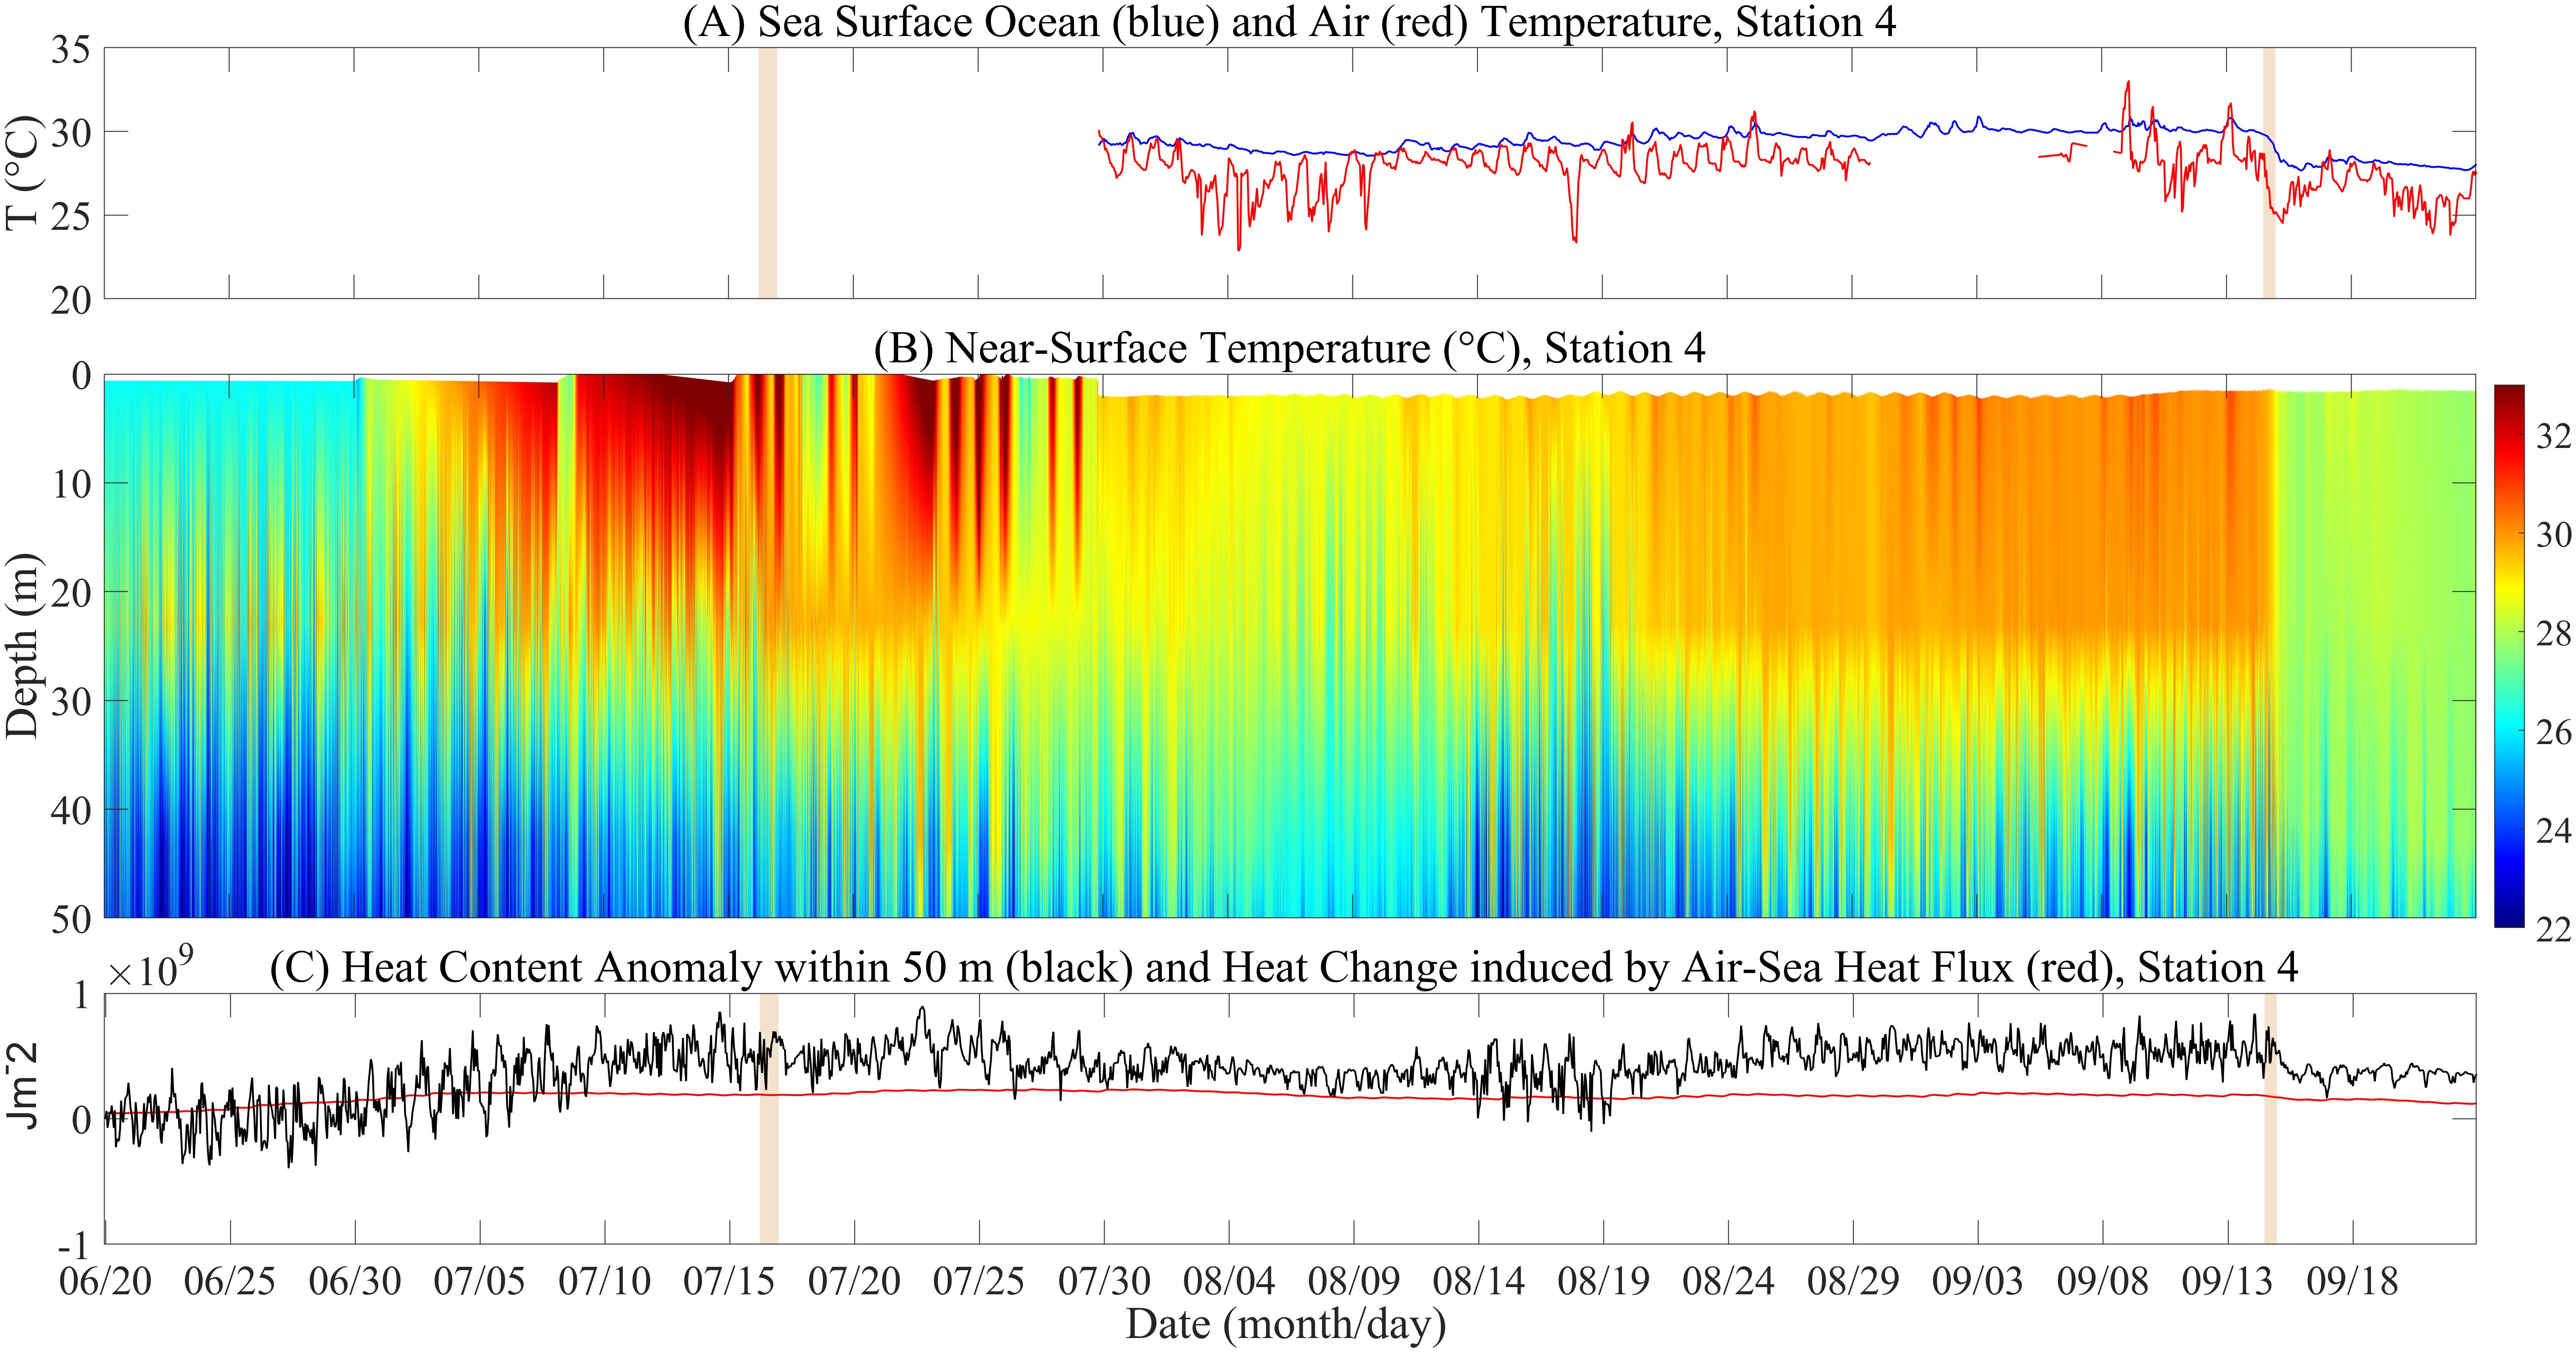
Figure 8. Same to Figure 7 but for Station 4.
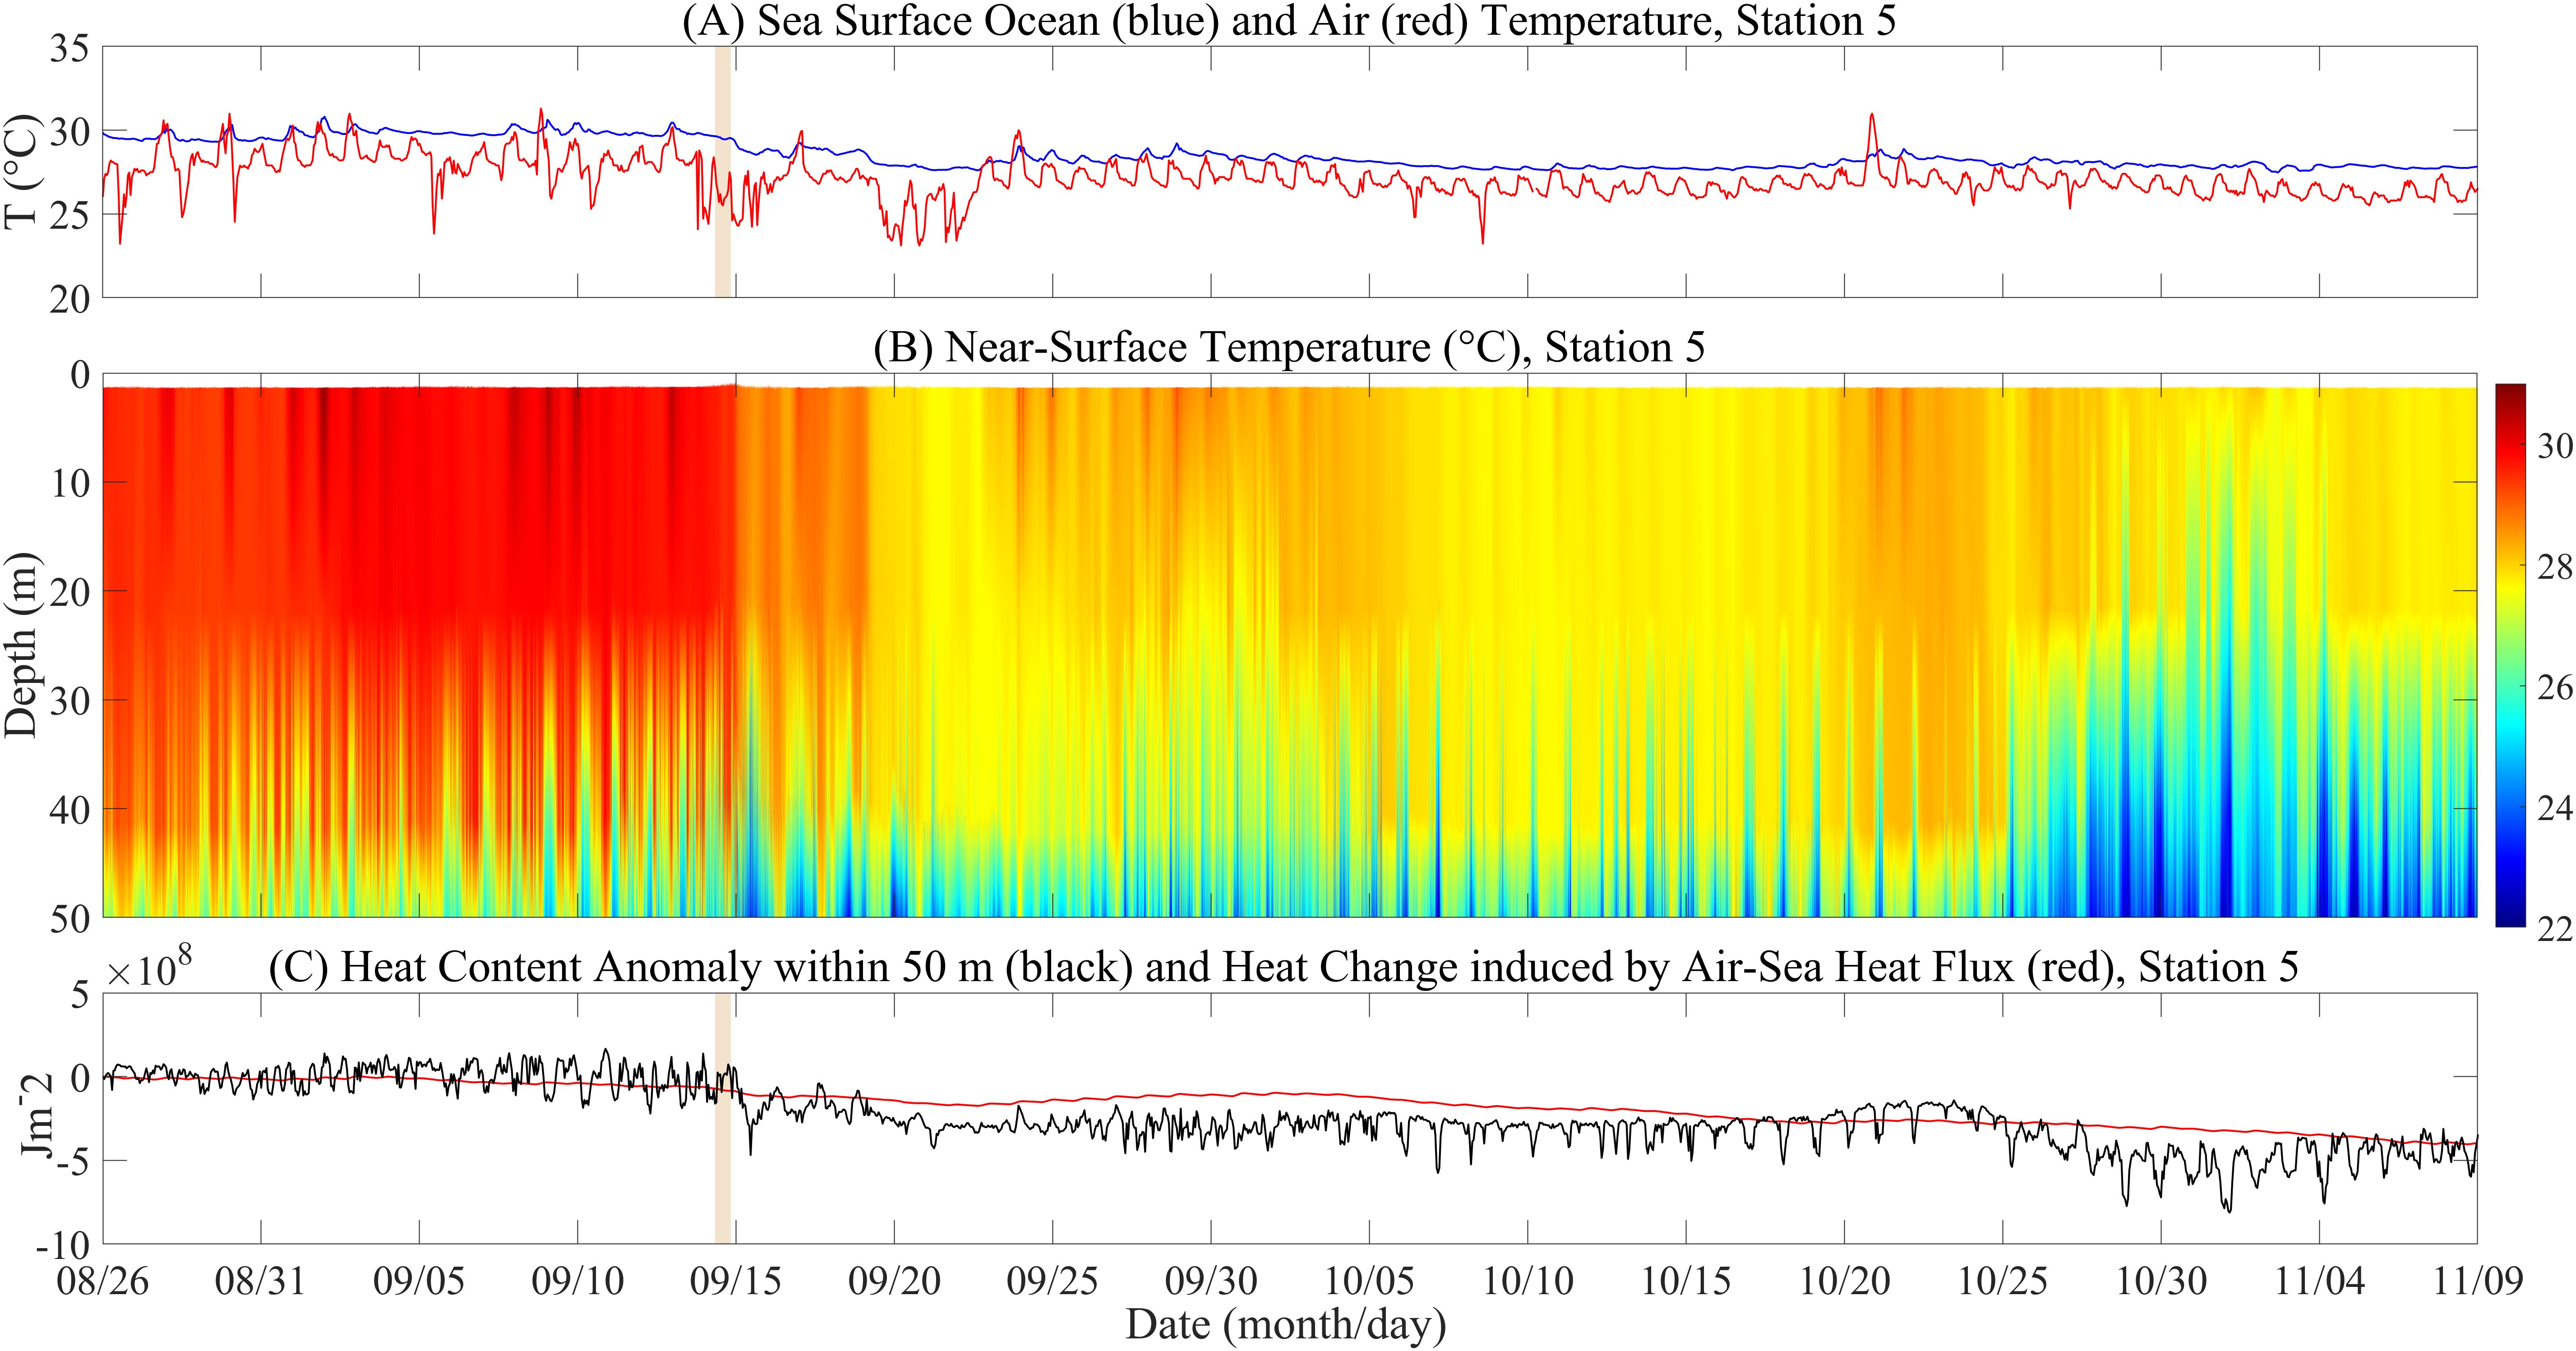
Figure 9. Same to Figure 7 but for Station 5.
Figures 7B, 8B, 9B show that the NSOT exhibits a clear seasonal cooling pattern. Stations 2 and 4 both display July 31 - August 14, with the prevailing summer monsoon in the NSCS (Figures 2J, 3J), and the NSOT showing a cooling trend (Figures 7B, 8B). The cumulative heat flux contributions to this cooling process measured at stations 2 and 4 are 2.31% and 49.36%, respectively. It is noteworthy that around September 22, a second cooling of the NOST was observed, which may be related to the strong tropical storm Fung-Wong that appeared to the right of station 4 (Zhang et al., 2016). Subsequently, during the monsoon transition period, the weaker wind leads to a less vigorous vertical mixing in the upper layer, resulting in a thinner mixed layer and a slight increase in sea temperature. The contributions of the air-sea heat flux measured at stations 2 and 5 to the NSOT rebound process during the monsoon transition period were 70.2% and 56.3%, respectively. Under the influence of winter monsoon, the vertical mixing is enhanced, and the NSOT gradually decreases, with the average temperature from the surface to a 5-meter depth being 27.9°C. The response of the NSOT also exhibits a time lag. Around one day after the TC passage, the NSOT shows a pronounced negative anomaly, as the vertical mixing is strengthened. For example, during the period of TC Kalmaegi, the maximum near-surface cooling can reach 3.1°C. The cumulative heat flux measured at stations 2, 4 and 5 contributed 22.7%, 13.7% and 40.1% to the NOST during the cooling process caused by TC Kalmaegi, respectively. During TC Rammasun, the cumulative heat flux measured at Station 4 contributed 34.4% to the NSOT.
Figures 7C, 8C, 9C show that the trend of the heat content anomaly and the cumulative heat flux is generally consistent, but the heat content anomaly is more consistent with the trends of SST and NSOT. During the observation period, the heat content anomaly gradually accumulates, showing an overall slowly increasing negative trend. In contrast, the heat content anomaly is generally positive during summer monsoon period. During winter monsoon period, the heat content anomaly is generally negative, with the cumulative heat flux loss to the overall cooling contributing 68.5% and 70.9% at stations 2 and 5, respectively, to the cooling of the near-surface ocean heat content. After the TC passage, the heat content decreases significantly, with a maximum reduction of up to 5.24×10⁸ J/m2.
4 Summary and discussion
This study analyzes the variability characteristics of SST, NSOT, and air-sea heat flux, as well as their relationships with relevant air-sea interface elements, and analyzed the contributions of air-sea heat fluxes during different periods within the observation time period to the NSOT, using data from a mooring array deployed in the northern SCS (12°N-24°N, 108°E-124°E) from June to November. The results show that the Qnet is mainly negative, indicating a net heat loss from the ocean. The LH is around 100W/m2-130 W/m2, while the SH is around 5W/m2-15 W/m2, with LH being much larger than SH, indicating that the turbulent heat flux is dominated by LH loss. The Qnet loss of the ocean is mainly affected by SW and LH. Qnet loss increases significantly in AU, averaging an increase of 34.4 W/m2. This increase is primarily due to the stronger winter monsoon, which enhances LH loss through evaporation. The SST decreases slowly with the seasonal changes, with an average of 29.6°C in SU and 28.5°C in AU. The NSOT exhibits a clear seasonal cooling trend, with the upper layer (surface to 5-meter depth) averaging 29.7°C in SU and 28.4°C in AU. During summer monsoon, the NSOT showed a slow decrease, and the contributions of the air-sea heat fluxes measured at stations 2 and 4 to this process were 2.31% and 49.36%, respectively. During Typhoon Rammasun, the contribution of the air-sea heat flux measured at station 4 to the significant decrease in NSOT caused by the TC was 34.4%. During Typhoon Kalmaegi, the accumulated heat fluxes measured at stations 2, 4, and 5 contributed 22.68%, 13.7%, and 40.1% to this process, respectively. Therefore, under TC weather conditions, the NSOT is mainly affected by dynamic processes. During monsoon transition period, the NSOT showed a rebound, and the contributions of the air-sea heat fluxes measured at stations 2 and 5 to this process were 70.2% and 56.3%, respectively. After transition to winter monsoon, water column mixing became more uniform. This leads to a decrease in temperature difference between the upper and lower layers of the near-surface decreases and an increase in mixed layer depth. Variations of heat content anomaly are consistent with changes in SST and NSOT. During the autumn part of winter monsoon, the near-surface heat content exhibits a negative anomaly, with the cumulative heat flux loss to the overall cooling, contributing 68.5% and 70.9% at stations 2 and 5, respectively, to the overall cooling. Therefore, the cooling of NSOT in the NSCS mainly depends on the loss of air-sea heat flux. During the TC period, Qnet is significantly suppressed, primarily due to the decreased SW and increased LH. Both the SST and the NSOT decrease significantly, and they both exhibit a lagged and right-biased response to the TC. The maximum sea surface cooling can reach 3.4°C, and the maximum near-surface cooling can reach 3.1°C. After TC passage, SST and NSOT have not fully recovered to their original states, possibly due to seasonal changes.
NSCS is mainly influenced by summer wind from June to the end of September, and by the northeast wind from October to November. During the summer monsoon period, the significant difference in the contributions of the air-sea heat flux measured at stations 2 and 4 to the NSOT suggests that other weather phenomena had an impact on the changes in NSOT, and this issue deserves further analysis in future work. During the monsoon transition period, the contribution of air-sea heat flux to sea temperature was relatively large. During winter monsoon period, the air-sea heat flux makes a significant contribution to the heat content. Based on the contribution of air-sea heat flux to the changes in NSOT during the two TC periods, the changes in NSOT are mainly influenced by the dynamic processes in the ocean under TC weather conditions. This study provides a quantitative description of temporal variability characteristics of SST, NSOT, and air-sea heat flux during SU and AU based on mooring observation data. Future studies will also describe the spatial variability characteristics of these variables in the SCS. The impact of different TC intensities also requires further analysis.
Data availability statement
The raw data supporting the conclusions of this article will be made available by the authors, without undue reservation.
Author contributions
ZW: Writing – original draft. HZ: Writing – review & editing.
Funding
The author(s) declare financial support was received for the research, authorship, and/or publication of this article. This research was funded by the National Key Research and Development Program of China (2023YFF0805300, 2023YFF0805301), the Scientific Research Fund of the Second Institute of Oceanography, MNR (JG2309), the National Natural Science Foundation of China (42176015, 42227901), the Key R&D Program of Zhejiang Province (2024C03257), the Project supported by Southern Marine Science and Engineering Guangdong Laboratory (Zhuhai) (SML2021SP207), the Innovation Group Project of Southern Marine Science and Engineering Guangdong Laboratory (Zhuhai) (316323005), the MEL Visiting Fellowship (MELRS2303), the Shanghai Science and Technology Commission Project (23DZ1204701), the Global Change and Air-Sea Interaction II Program (GASI-01-WPAC-STspr). This research is also supported by the Key Laboratory of Polar Atmosphere-ocean-ice System for Weather and Climate, Ministry of Education, as well as the CMA-FDU Joint Laboratory of Maine Meteorology.
Conflict of interest
The authors declare the research was conducted in the absence of any commercial or financial relationships that could be construed as a potential conflict of interest.
Publisher’s note
All claims expressed in this article are solely those of the authors and do not necessarily represent those of their affiliated organizations, or those of the publisher, the editors and the reviewers. Any product that may be evaluated in this article, or claim that may be made by its manufacturer, is not guaranteed or endorsed by the publisher.
References
Alexander M. A., Scott J. D., Deser C. (2000). Processes that influence sea surface temperature and ocean mixed layer depth variability in a coupled model. J. Geophys. Res.: Oceans 105, 16823–16842. doi: 10.1029/2000JC900074
Andersson A., Fennig K., Klepp C., Bakan S., Graßl H., Schulz J. (2010). The hamburg ocean atmosphere parameters and fluxes from satellite data – HOAPS-3. Earth Sys. Sci. Data 2, 215–234. doi: 10.5194/essd-2-215-2010
Andreas E. L., Emanuel K. A. (2001). Effects of sea spray on tropical cyclone intensity. J. Atmos. Sci. 58, 3741–3751. doi: 10.1175/1520-0469(2001)058<3741:EOSSOT>2.0.CO;2
Andreas E. L., Jordan R. E., Mahrt L., Vickers D. (2013). Estimating the Bowen ratio over the open and ice-covered ocean. J. Geophys. Res.: Oceans 118, 4334–4345. doi: 10.1002/jgrc.20295
Bedacht E., Gulev S. K., Macke A. (2007). Intercomparison of global cloud cover fields over oceans from the VOS observations and NCEP/NCAR reanalysis. Int. J. Climatol. 27, 1707–1719. doi: 10.1002/joc.1490
Bender M. A., Ginis I., Kurihara Y. (1993). Numerical simulations of tropical cyclone-ocean interaction with a high-resolution coupled model. J. Geophys. Res. 98, 23245–23263. doi: 10.1029/93JD02370
Carton J. A., Zhou Z. (1997). Annual cycle of sea surface temperature in the tropical Atlantic Ocean. J. Geophys. Res.: Oceans 102, 27813–27824. doi: 10.1029/97JC02197
Cayan D. R. (1992). Latent and sensible heat flux anomalies over the northern oceans: the connection to monthly atmospheric circulation. J. Climate 5, 354–369. doi: 10.1175/1520-0442(1992)005<0354:LASHFA>2.0.CO;2
Cess R. D., Nemesure S., Dutton E. G., Deluisi J. J., Potter G. L., Morcrette J.-J. (1993). The impact of clouds on the shortwave radiation budget of the surface-atmosphere system: interfacing measurements and models. J. Climate 6, 308–316. doi: 10.1175/1520-0442(1993)006<0308:TIOCOT>2.0.CO;2
Chen J.-M., Chang C.-P., Li T. (2003). Annual cycle of the South China sea surface temperature using the NCEP/NCAR reanalysis. J. Meteorol. Soc. Japan 81, 879–884. doi: 10.2151/jmsj.81.879
Cheng L., Zhu J., Sriver R. L. (2015). Global representation of tropical cyclone-induced short-term ocean thermal changes using Argo data. Ocean Sci. 11, 719–741. doi: 10.5194/os-11-719-2015
Dobson F. W., Smith S. D. (1988). Bulk models of solar radiation at sea. Q. J. R. Meteorol. Soc. 114, 165–182. doi: 10.1002/qj.49711447909
Fairall C. W., Bradley E. F., Hare J. E., Grachev A. A., Edson J. B. (2003). Bulk parameterization of air–sea fluxes: updates and verification for the COARE algorithm. J. Climate 16, 571–591. doi: 10.1175/1520-0442(2003)016<0571:BPOASF>2.0.CO;2
Hsu C.-W., DeMott C. A., Branson M. D., Reeves Eyre J., Zeng X. (2022). Ocean surface flux algorithm effects on tropical indo-pacific intraseasonal precipitation. Geophys. Res. Lett. 49, e2021GL096968. doi: 10.1029/2021GL096968
Jiang X., Zhong Z., Jiang J. (2009). Upper ocean response of the South China Sea to Typhoon Krovanh, (2003). Dynam. Atmos. Oceans - DYNAM. ATMOS. OCEANS 47, 165–175. doi: 10.1016/j.dynatmoce.2008.09.005
Li W. (2004). Modelling air-sea fluxes during a western Pacific typhoon: Role of sea spray. Adv. Atmos. Sci. 21, 269–276. doi: 10.1007/BF02915713
Liu C., Yang Q., Xu M., Yu W., Wu R., Chen X., et al. (2023). Response of sea surface heat fluxes to the South China Sea summer monsoon onset in 2021. Atmos. Res. 282, 106513. doi: 10.1016/j.atmosres.2022.106513
Lin I.-I., Chen C.-H., Pun I.-F., Liu W. T., Wu C.-C. (2009). Warm ocean anomaly, air sea fluxes, and the rapid intensification of tropical cyclone Nargis, (2008). Geophys. Res. Lett. 36. doi: 10.1029/2008GL035815
Lu X., Yu H., Ying M., Zhao B., Zhang S., Lin L., et al. (2021). Western north pacific tropical cyclone database created by the China meteorological administration. dqkxjz 38, 690–699. doi: 10.1007/s00376-020-0211-7
Lubin D., Vogelmann A. M. (2011). The influence of mixed-phase clouds on surface shortwave irradiance during the Arctic spring. J. Geophys. Res.: Atmos. 116. doi: 10.1029/2011JD015761
Ma Z., Fei J., Huang X., Cheng X. (2015). Contributions of surface sensible heat fluxes to tropical cyclone. Part I: evolution of tropical cyclone intensity and structure. J. Atmos. Sci. 72, 120–140. doi: 10.1175/JAS-D-14-0199.1
Ma Z., Fei J., Lin Y., Huang X. (2020). Modulation of clouds and rainfall by tropical cyclone’s cold wakes. Geophys. Res. Lett. 47, e2020GL088873. doi: 10.1029/2020GL088873
McFarlane S. A., Mather J. H., Ackerman T. P., Liu Z. (2008). Effect of clouds on the calculated vertical distribution of shortwave absorption in the tropics. J. Geophys. Res.: Atmos. 113. doi: 10.1029/2008JD009791
Oberhuber J. (1988). An Atlas Based on the COADS Data Set: the Budgets of Heat Buoyancy and Turbulent Kinetic Energy. Available online at: https://www.semanticscholar.org/paper/An-Atlas-Based-on-the-COADS-Data-Set%3A-the-Budgets-t-Oberhuber/331f73e1139d81a51722fb4c702b4a86e5943510 (Accessed June 21, 2024).
Palmer M. D., McNeall D. J. (2014). Internal variability of Earth’s energy budget simulated by CMIP5 climate models. Environ. Res. Lett. 9, 34016. doi: 10.1088/1748-9326/9/3/034016
Park S., Deser C., Alexander M. A. (2005). Estimation of the surface heat flux response to sea surface temperature anomalies over the global oceans. J. Climate 18, 4582–4599. doi: 10.1175/JCLI3521.1
Pasquero C., Desbiolles F., Meroni A. N. (2021). Air-sea interactions in the cold wakes of tropical cyclones. Geophys. Res. Lett. 48, e2020GL091185. doi: 10.1029/2020GL091185
Potter H., Drennan W. M., Graber H. C. (2017). Upper ocean cooling and air-sea fluxes under typhoons: A case study. J. Geophys. Res.: Oceans 122, 7237–7252. doi: 10.1002/2017JC012954
Roberts C. D., Palmer M. D., Allan R. P., Desbruyeres D., Hyder P., Liu C., et al. (2017). Surface flux and ocean heat transport convergence contributions to seasonal and interannual variations of ocean heat content. J. Geophys. Res.: Oceans 122, 726–744. doi: 10.1002/2016JC012278
Roberts C. D., Palmer M. D., McNeall D., Collins M. (2015). Quantifying the likelihood of a continued hiatus in global warming. Nat. Clim Change 5, 337–342. doi: 10.1038/nclimate2531
Simonot J. Y. R., Gautier C., Simonot J. Y. R., Gautier C. (1989). Satellite estimates of surface evaporation in the Indian Ocean during the 1979 monsoon. Ocean-Air Interact. 1, 239–256.
Song X., Ning C., Duan Y., Wang H., Li C., Yang Y., et al. (2021). Observed extreme air–sea heat flux variations during three tropical cyclones in the tropical Southeastern Indian ocean. J. Climate 34, 3683–3705. doi: 10.1175/JCLI-D-20-0170.1
Tamizi A., Young I. R., Ribal A., Alves J.-H. (2020). Global scatterometer observations of the structure of tropical cyclone wind fields. Month. Weather Rev. 148, 4673–4692. doi: 10.1175/MWR-D-20-0196.1
Volkov D. L., Lee T., Fu L.-L. (2008). Eddy-induced meridional heat transport in the ocean. Geophys. Res. Lett. 35. doi: 10.1029/2008GL035490
Wang H., Chen J., He Y. (2008). “Variability of Surface Heat Budget in China Coastal Seas,” in IGARSS 2008 - 2008 IEEE International Geoscience and Remote Sensing Symposium, IV-946-IV–949. doi: 10.1109/IGARSS.2008.4779880
Wu R., Chen Z. (2015). Intraseasonal SST variations in the South China Sea during boreal winter and impacts of the East Asian winter monsoon. J. Geophys. Res. (Atmospheres) 120, 5863–5878. doi: 10.1002/2015JD023368
Wu Z., Jiang C., Chen J., Long Y., Deng B., Liu X. (2019). Three-dimensional temperature field change in the South China Sea during typhoon kai-tak, (1213) based on a fully coupled atmosphere–wave–ocean model. Water 11, 140. doi: 10.3390/w11010140
Ying M., Zhang W., Yu H., Lu X., Feng J., Fan Y., et al. (2014). An overview of the China meteorological administration tropical cyclone database. J. Atmos. Ocean. Technol. 31, 287–301. doi: 10.1175/JTECH-D-12-00119.1
Yu L. (2019). Global air–sea fluxes of heat, fresh water, and momentum: energy budget closure and unanswered questions. Annu. Rev. Mar. Sci. 11, 227–248. doi: 10.1146/annurev-marine-010816-060704
Zeng L., Wang D. (2009). Intraseasonal variability of latent-heat flux in the South China Sea. Theor. Appl. Climatol. 97, 53–64. doi: 10.1007/s00704-009-0131-z
Zhang G. J., Mcphaden M. J. (1995). The relationship between sea surface temperature and latent heat flux in the equatorial pacific. J. Climate 8, 589–605. doi: 10.1175/1520-0442(1995)008<0589:TRBSST>2.0.CO;2
Zhang H. (2023). Modulation of upper ocean vertical temperature structure and heat content by a fast-moving tropical cyclone. J. Phys. Oceanogr. 53, 493–508. doi: 10.1175/JPO-D-22-0132.1
Zhang H., Chen D., Zhou L., Liu X., Ding T., Zhou B. (2016). Upper ocean response to typhoon Kalmaegi, (2014). J. Geophys. Res.: Oceans 121, 6520–6535. doi: 10.1002/2016JC012064
Zhang H., He H., Zhang W.-Z., Tian D. (2021). Upper ocean response to tropical cyclones: a review. Geosci. Lett. 8, 1. doi: 10.1186/s40562-020-00170-8
Zhang Y., Wang D., Xia H., Zeng L. (2012). The seasonal variability of an air-sea heat flux in the northern South China Sea. Acta Oceanol. Sin. 31, 79–86. doi: 10.1007/s13131-012-0238-4
Zhang Z., Wang W., Qiu B. (2014). Oceanic mass transport by mesoscale eddies. Science 345, 322–324. doi: 10.1126/science.1252418
Keywords: air-sea heat flux, heat content, sea surface temperature, mixing layer, seasonal variability
Citation: Wu Z and Zhang H (2024) Near-surface ocean temperature and air-sea heat flux observed by a buoy array during summer to autumn in year 2014 in the northern South China Sea. Front. Mar. Sci. 11:1457829. doi: 10.3389/fmars.2024.1457829
Received: 01 July 2024; Accepted: 31 July 2024;
Published: 20 August 2024.
Edited by:
Toru Miyama, Japan Agency for Marine-Earth Science and Technology, JapanReviewed by:
Lei Zhou, Shanghai Jiao Tong University, ChinaChangwei Liu, Sun Yat-sen University, China
Copyright © 2024 Wu and Zhang. This is an open-access article distributed under the terms of the Creative Commons Attribution License (CC BY). The use, distribution or reproduction in other forums is permitted, provided the original author(s) and the copyright owner(s) are credited and that the original publication in this journal is cited, in accordance with accepted academic practice. No use, distribution or reproduction is permitted which does not comply with these terms.
*Correspondence: Han Zhang, emhhbmdoYW5Ac2lvLm9yZy5jbg==
 Zixi Wu
 Han Zhang