- 1Australian Antarctic Program Partnership, Hobart, TAS, Australia
- 2Institute for Marine and Antarctic Studies, University of Tasmania, Hobart, TAS, Australia
- 3Environment, CSIRO, Hobart, TAS, Australia
- 4NORCE Norwegian Research Centre, Bjerknes Centre for Climate Research, Bergen, Norway
- 5Australian Research Council Centre of Excellence for Climate Extremes, University of Tasmania, Hobart, TAS, Australia
- 6Globe Institute, University of Copenhagen, Copenhagen, Denmark
- 7Australian Antarctic Division, Department of Climate Change, Energy, the Environment and Water, Kingston, TAS, Australia
- 8Monterey Bay Aquarium Research Institute, Moss Landing, CA, United States
Circulation and water masses in the greater Prydz Bay region were surveyed in the austral summer 2021 (January-March) during the ‘Trends in Euphausiids off Mawson, Predators and Oceanography’ (TEMPO) experiment, and are described in this paper. The Southern Antarctic Circumpolar Current Front is found in the northern part of the survey area, generally near 63-64°S, whereas the Southern Boundary Front is located between 64 and 65.5°S. The westward flowing Antarctic Slope Front (ASF) is found in the southern part of the survey area near the continental slope on most transects. Highest concentrations of oxygen (> 300 µmol kg−1) are found in shelf waters at stations in Prydz Bay, south of 67°S along 75°E, whereas the lowest oxygen values are found in the Circumpolar Deep Water layer, with an average of roughly 215 µmol kg−1. North of the northern extension of the ASF, surface mixed layers are between 20 and 60 m deep. Mixed layers tend to deepen slightly in the northern part of the survey, generally increasing north of 64°S where the ocean has been ice-free the longest. We find evidence of upwelling of waters into the surface layers, based on temperature anomaly, particularly strong along 80°E. Enhanced variability of biogeochemical properties - nutrients, DIC, DO - in the AASW layer is driven by a combination of sea-ice and biological processes. Antarctic Bottom Water, defined as water with neutral density > 28.3 kg m-3, was sampled at all the offshore full-depth stations, with a colder/fresher variety along western transects and a warmer/saltier variety in the east. Newly formed Antarctic Bottom Water – the coldest, freshest, and most recently ventilated – is mostly found in the deep ocean along 65°E, in the base of the Daly Canyon.
1 Introduction
The Southern Ocean plays a crucial role in Earth’s climate system through the modulation of the global meridional overturning circulation, global biogeochemical cycling, and biological productivity (Rintoul, 2018; Henley et al., 2020). The upwelling of nutrient-rich deep water supports primary production and the Southern Ocean ecosystem as a whole. The strong seasonal cycle in the upper ocean – dominated by the yearly growth and melt of sea ice – is a major control on light and phytoplankton growth, thereby influencing Southern Ocean ecosystem structure and function. The formation and export of Antarctic Bottom Water makes up a crucial limb of the meridional overturning circulation that is critical for the sequestration of anthropogenic heat and carbon, and the ventilation of the deep ocean.
Within the Southern Ocean, the eastward flowing Antarctic Circumpolar Current (ACC) connects all three major ocean basins, and separates the warm subtropical waters from the cold polar waters to the south (Orsi et al., 1995). The circumpolar flow of the ACC is steered by major bathymetric features, leading to complex circulation at the regional scale with localized hot spots of poleward heat fluxes and upwelling (Foppert et al., 2017; Tamsitt et al., 2017), and some recirculation within regional-scale subpolar gyres and smaller scale subgyres (McCartney and Donohue, 2007; Yamazaki et al., 2020). The greater Prydz Bay Gyre is located in the Indian Ocean sector within the Weddell-Enderby basin ∼55-80°E. This area lies to the east of the Weddell Gyre extension and to the southwest of the southern Kerguelen Plateau. Here, the two southernmost ACC fronts, the Southern ACC Front (SACCF) and Southern Boundary (SB) intrude into the domain from the northwest, and are steered southward by the Kerguelen Plateau and through the Princess Elizabeth Trough (e.g. Heywood et al., 1999). The subpolar gyre is partially closed by the westward flow of the Antarctic Slope Current along the Antarctic shelf break and continental slope. The regional circulation, alongside upper-ocean structure, plays an important role in structuring regional productivity and the marine ecosystem.
Within Prydz Bay, the Amery Ice shelf is also an important regional feature, feeding shelf and ice-shelf water into the survey region. These waters play an important preconditioning role (Herraiz-Borreguero et al., 2016; Williams et al., 2016), supporting a known region of Antarctic Bottom Water (AABW) formation at Cape Darnley Polynya on the western side of the bay (Ohshima et al., 2013). Recent work by Blackensee et al. (in review)1 provides a detailed review of AABW formation at Cape Darnley using a suite of available observations. Overall, the area between 55-80°E is known to be highly productive (Westwood et al., 2010; Wright et al., 2010; Pinkerton et al., 2021; Heidemann et al., 2024), especially relative to the overall Southern Ocean. While the Antarctic Slope Front (ASF) primarily acts as a barrier between shelf and oceanic environments, and the export of waters offshore from Prydz Bay, the additional influence of the West Ice Shelf near 80°E, and the interaction of fronts with the submarine Kerguelen Plateau (Bestley et al., 2018; Schallenberg et al., 2018) all serve to support heightened regional productivity.
In the Southern Ocean, phytoplankton growth is primarily limited by light and micro-nutrient availability, mainly iron (Nelson and Smith Jr., 1991; Boyd and Ellwood, 2010; Feng et al., 2010; Vives et al., 2022; Bazzani et al., 2023) and in some cases manganese (Latour et al., 2021). Characterization of the upper-ocean is therefore important when considering drivers that may influence productivity. Offshore, Circumpolar Deep Water (CDW) is the primary source of nutrients to surface waters through upwelling, with lateral advection also suggested for the Kerguelen Plateau region (Schallenberg et al., 2018). Closer to the Antarctic coast, melting sea ice, sediment resuspension, and melting glaciers and ice shelves may serve as additional nutrient inputs, leading to increased primary productivity (Westwood et al., 2010; Lannuzel et al., 2016; Dinniman et al., 2020; Smith et al., 2021; Herraiz-Borreguero et al., 2016). Light availability is largely controlled by mixed layer depths and sea ice cover, both of which are strongly influenced by the melting and formation of sea ice (e.g. Williams et al., 2010). Phytoplankton circulating in shallow mixed layers receive significantly higher light doses than those in deep mixed layers Morel (1991); Morel and Maritorena (2001). The ratio of mixed layer depth to euphotic depth also determines the extent to which phytoplankton are photo-limited (Westwood et al., 2010). At the retreating ice edge, light doses can be particularly high due to the formation of a meltwater lens that shallows the mixed layer (Arrigo et al., 2012). Thus, seasonal sea-ice retreat is particularly important for phytoplankton growth in the Southern Ocean.
The seasonal formation and melt of sea ice also exerts a dominant control on the carbonate chemistry of surface waters in Antarctic coastal regions (e.g. Roden et al., 2013; Shadwick et al., 2014), and contributes to the large seasonal variability observed there (e.g. Bates et al., 1998; DeJong et al., 2017). As described above, the return of sunlight in austral spring triggers the onset of under-ice and open water phytoplankton blooms (e.g. Arrigo and van Dijken, 2003; Sweeney, 2003), which convert inorganic carbon to organic carbon and promote the uptake of atmospheric CO2 (e.g. Shadwick et al., 2013). The delivery of carbon-rich CDW to the surface and/or the continental shelf influences the seasonality of the carbonate system, as does subsurface respiration of organic material produced during the productive season, with the balance of these processes determining the size of the ocean sink for CO2 in these regions (e.g. Arroyo et al., 2019; Roden et al., 2016; Shadwick et al., 2014).
This work describes the water-mass characteristics and frontal structure in the greater Prydz Bay region (55-80°E and south of 62°S) based on oceanography data collected during the ‘Trends in Euphausiids off Mawson, Predators and Oceanography’ (TEMPO) voyage in the austral summer of 2021. Section 2 describes the multidisciplinary survey, which repeated the eastern part of the BROKE-West survey (Meijers et al., 2010; Williams et al., 2010) at higher spatial resolution. Physical and biogeochemical water-mass properties and distribution of the regional oceanographic fronts are presented in Sections 3.2 and 3.3, respectively. Upper-ocean structure and its spatial variability is detailed in Section 3.4. Section 3.5 describes deep ocean properties and inferred pathways of locally formed Antarctic Bottom Water. This paper provides the physical environmental context for the TEMPO survey, including biogeochemical components (oxygen, carbon, nutrients), and discusses the system state in 2021 compared with the BROKE-West survey 15 years prior (Section 4).
2 Data and methods
2.1 Oceanographic survey
Data for this study were collected on the R/V Investigator in the austral summer of 2021, between January and March. The TEMPO survey occupied 66 stations mainly along six north-south transects in the greater Prydz Bay region. We surveyed from 62°S or 63°S to the Antarctic slope, every 5° of longitude from 55°E to 80°E (Figure 1), as well as a few stations offset from the main transect lines. Along 75°E, the survey extended well into Prydz Bay, to 68°S. Note that the R/V Investigator does not have ice-breaking capabilities, so the survey extended no further than the sea-ice edge and all stations can be considered to be in the seasonal ice zone. The maximum depth of the profiles varied throughout the survey region, with one to roughly 300 dbar in a krill super-swarm (slightly east of the 75°E line), nine to 1500 dbar, three to 2250 dbar, and 52 to full-depth (i.e. within 5-10 m from the seafloor). Shallow profiles (i.e. those not sampling to full-depth) are shown as white dots in Figure 1.
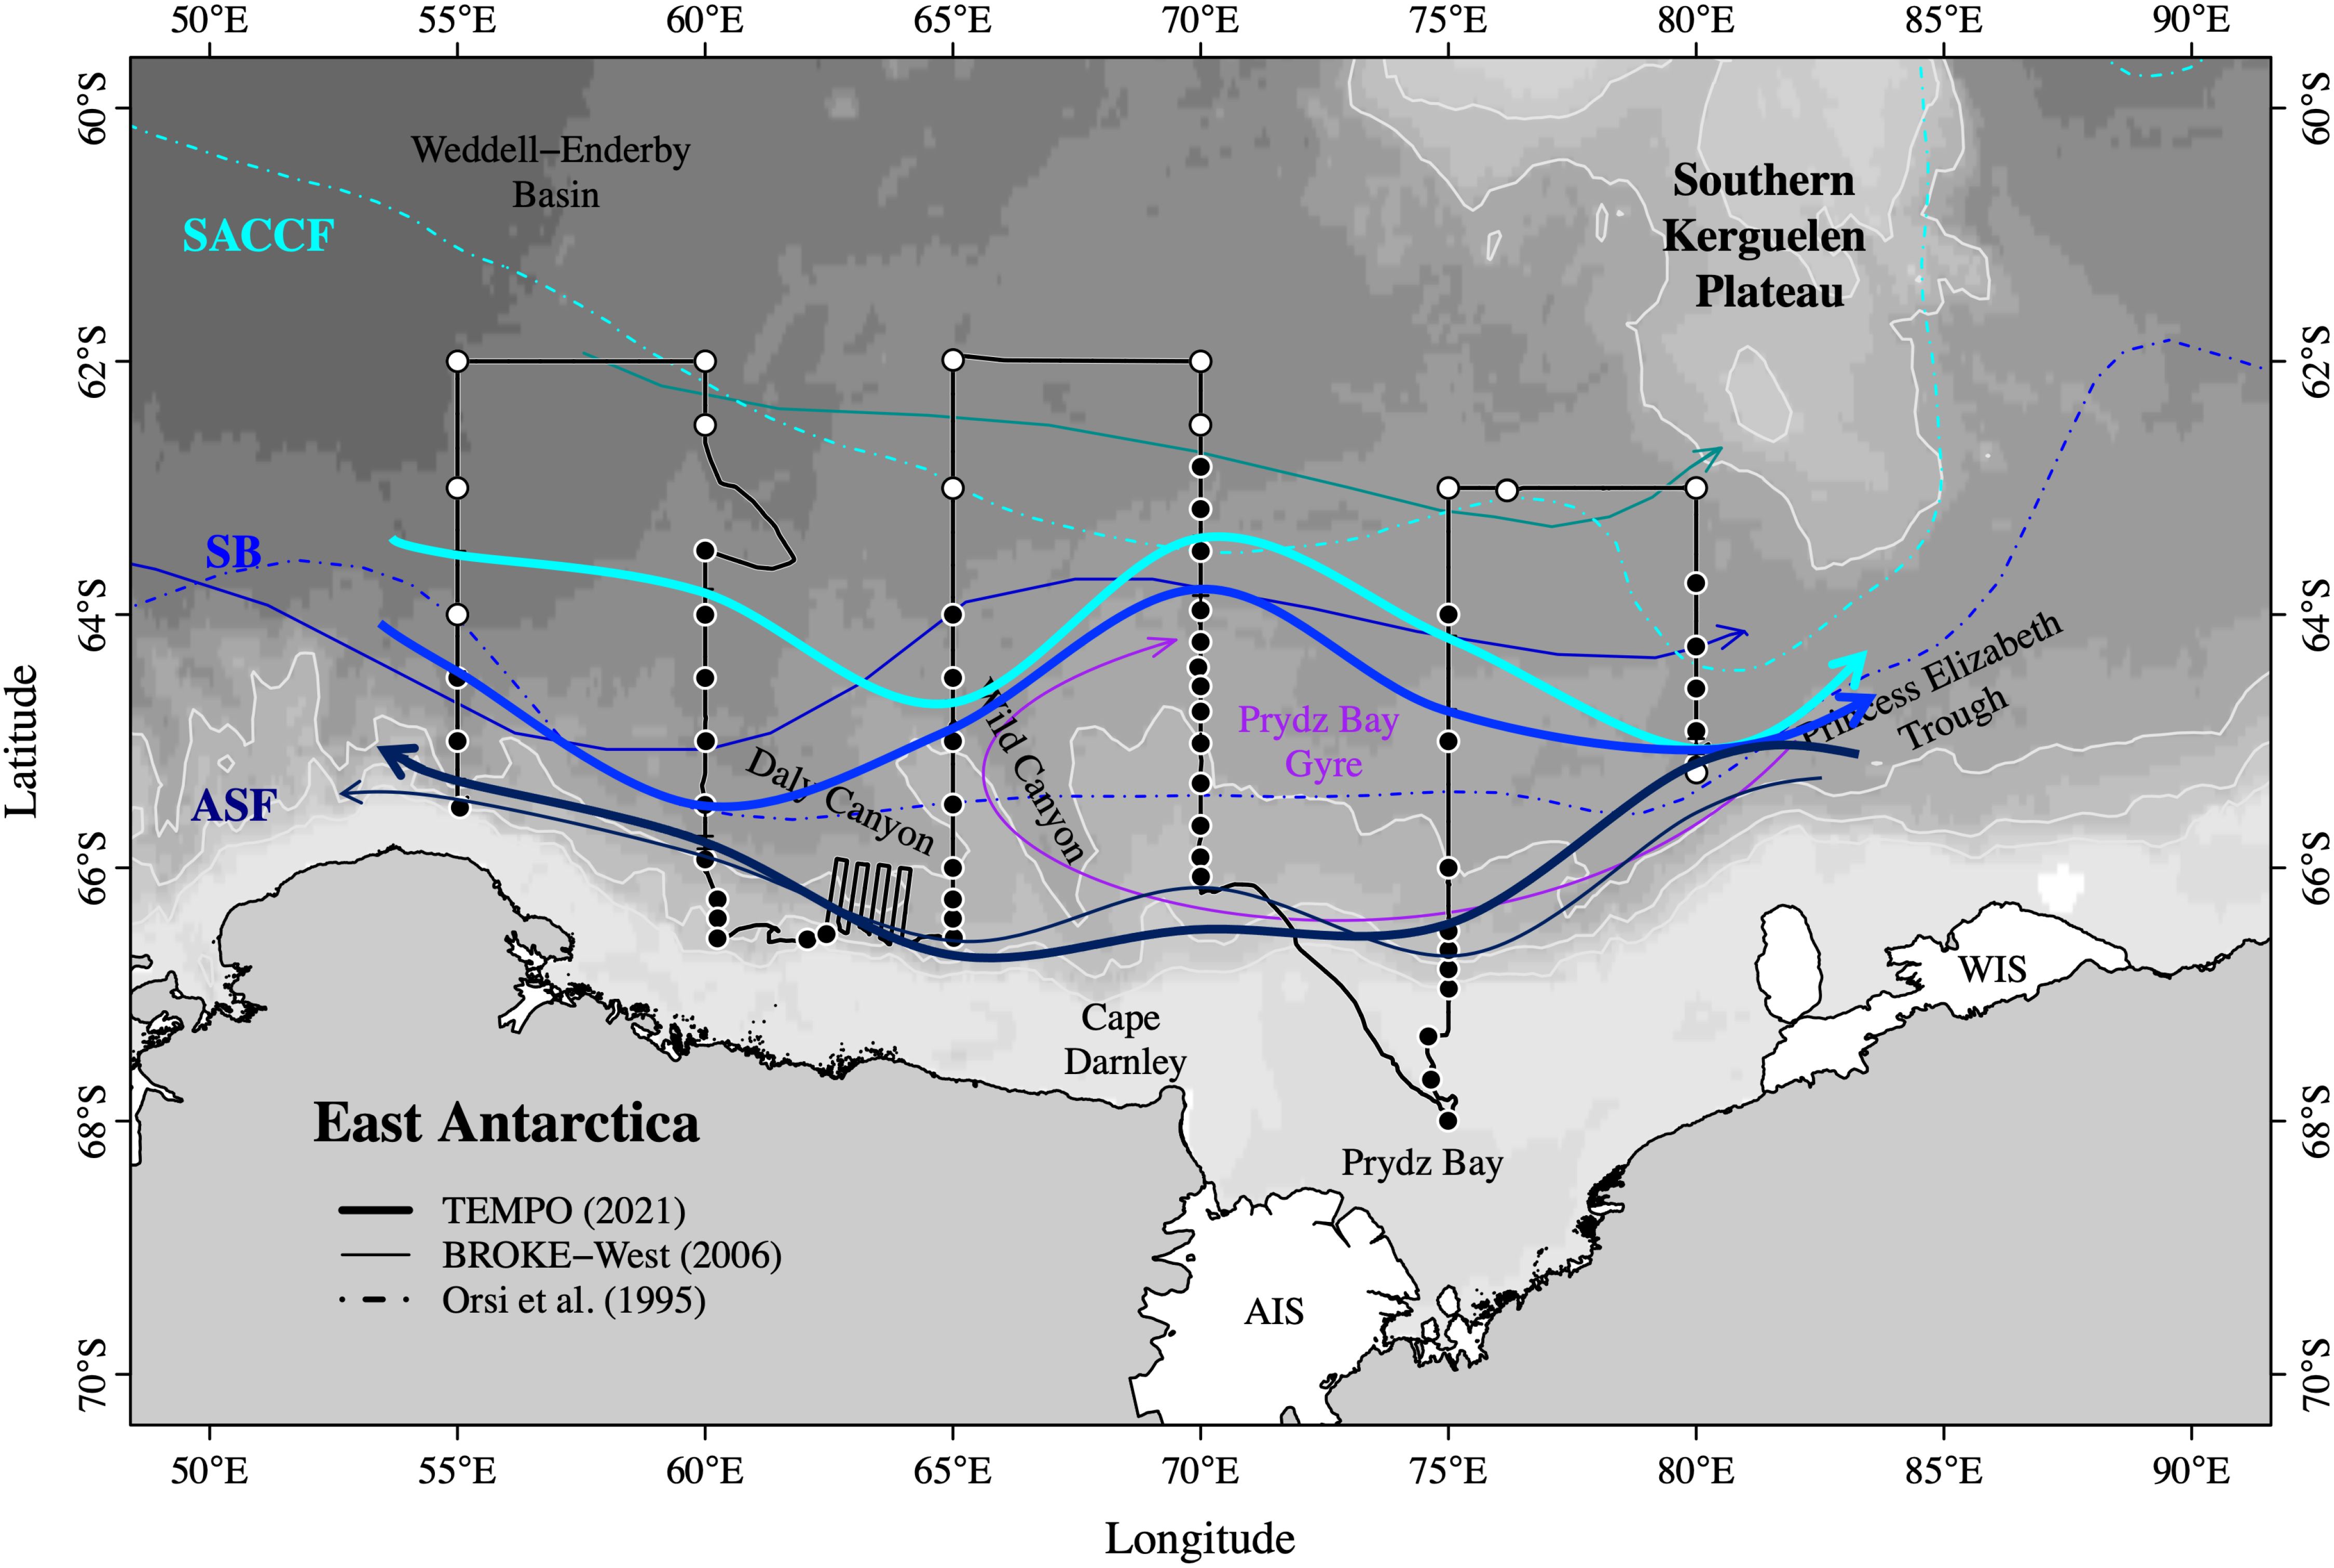
Figure 1. Map of the TEMPO survey region. Cruise track (black) proceeded from west to east 55-80°E. CTD station locations (circles) indicate full depth (black) and shallow (white) casts. Location of regional oceanic features compiled from this and previous studies. Major fronts shown include: the Antarctic Slope Front (ASF), the Southern Boundary (SB) and the Southern ACC Front (SACCF). Fronts are grouped by color with the line styles indicating associated references (bold lines – this study; dashed lines – Orsi et al. (1995); solid lines – BROKE-West (Meijers et al., 2010)). Background displays bathymetry at 500m intervals, with the 1000m, 2000m and 3000m isobaths (white contours) highlighting the submarine Southern Kerguelen Plateau and the Antarctic shelf break and foot of slope. Major geographical features are named, with the Antarctic continent and major ice features shown in grey and white, respectively. AIS, Amery Ice Shelf; WIS, West Ice Shelf.
Conductivity-temperature-depth (CTD, SBE9plus) profiles were collected at all stations and calibrated onboard against bottle samples to meet the Global Ocean Ship-based Hydrographic Investigations Program (GO-SHIP) standards; the accuracies of temperature and salinity were 0.002°C and 0.002 psu, respectively. Similarly, sensor measurements of dissolved oxygen (µmol l−1) were made with an SBE43 optode sensor and are within 1% of measurements on discrete bottle samples. This study also presents macro-nutrients (µmol l−1) – including nitrate (NO3, 1160 samples) and silicate (Si, 1164 samples) – from discrete bottle measurements following methods described in Rees et al. (2019). We convert the DO and nutrient data from µmol l−1 to µmol kg−1 based on potential density of the seawater referenced to the surface ().
Measurements of dissolved inorganic carbon (DIC, 508 samples) and total alkalinity (TA, 287 samples) were made for samples collected at discrete bottle depths. After sampling, a saturated solution of mercuric chloride was used to preserve the samples. The concentrations of DIC and TA were determined by coulometric and potentiometric titration, respectively following established procedures at CSIRO in Hobart (e.g. Dickson et al., 2007). All analyses were referenced to certified materials and have uncertainty (accuracy and precision) of less than 2 µmol kg−1. While a detailed partitioning of variability in DIC and TA across physical and biological drivers are beyond the scope of this work, some evaluation of these processes was done via the normalization to a constant salinity. Salinity-normalized DIC and TA (nDIC and nTA) were computed using a reference salinity of 35 (e.g. Friis et al., 2003; Shadwick et al., 2014). Additionally, once corrected for changes in salinity (which we are here assuming accounts for changes in horizontal and vertical mixing), potential alkalinity (pTA) was computed following Brewer and Goldman (1976), allowing relative variations in DIC and TA to be evaluated in the context of photosynthesis (respiration) and calcium carbonate (CaCO3) formation (dissolution).
Horizontal ocean current velocities were measured by a hull-mounted shipboard Acoustic Doppler Current Profiler (SADCP, RDI Ocean Surveyor 150kHz). The data were collected and post-processed onboard using the University of Hawaii’s Data Acquisition System (UHDAS) and the Data and Common Ocean Data Access System (CODAS), respectively. We only analyze velocity data while on station, and quasi-stationary, as the SADCP had reduced ping frequency – and therefore reduced data quality – during transit between stations when it was synchronized to the EK80 echo sounder for the krill biomass survey. We present zonal velocity data, averaged over the time the ship was on station, in the upper 350 m where the data is of high quality. We have not performed any detiding procedure on the data, as previous studies have observed tidal velocities to be small and have minimal impact on the velocity structure in the region, including both offshore in greater Prydz Bay (Meijers et al., 2010) and the continental slope and shelf (Ohshima et al., 2013; Liu et al., 2023)
2.2 Environmental data
We use satellite remote sensing data, synoptically available over greater spatial and temporal scales, to contextualize the TEMPO survey. We investigate how the seasonal cycle in 2020/2021 compared with other years by looking at area average monthly climatologies of sea-ice concentration (SIC; Cavalieri et al., 1996; http://nsidc.org) and chlorophyll-a (Chla; ESA Globcolour; https://www.globcolour.info/). SIC and Chla data have 25-km and 4-km spatial resolution, respectively. Monthly climatological Chla and SIC time series spanning 1998 to 2021 were calculated by averaging over the study area for each month (latitude ranging from 69°S to 61°S and longitude ranging from 54°E to 81°E). Monthly Chla and SIC timeseries for 2020/2021 were similarly calculated over the same region.
Sea surface temperature (SST) provides information about the spatial structure of the surface ocean. We use monthly Optimum Interpolation Sea Surface Temperature (OISST.v2) high resolution dataset (0.25°) from the National Oceanic and Atmospheric Administration (Banzon et al., 2016).
The 2-minute gridded bathymetry dataset of ETOPO2v2, available from NOAA’s National Centers for Environmental Information (National Geophysical Data Center, N, 2006), provides seafloor depth in the region.
3 Results
3.1 Oceanographic setting
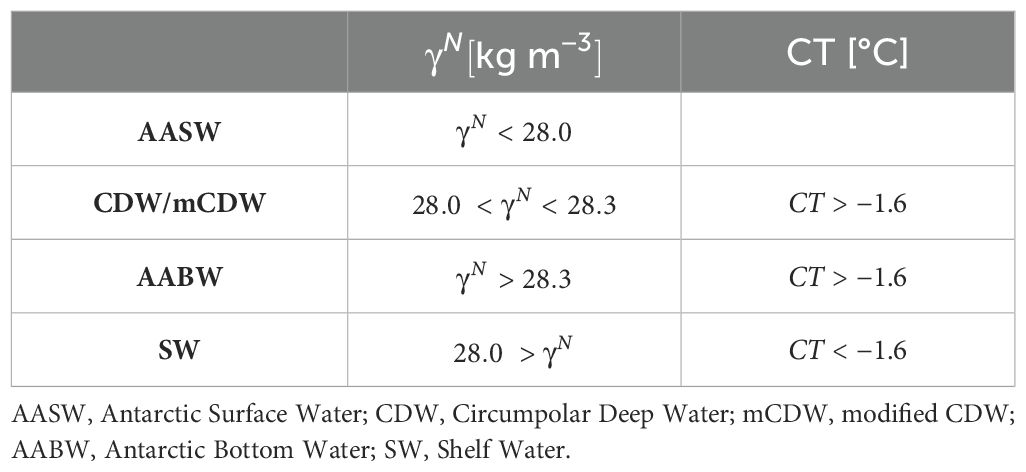
Water masses that were sampled during the TEMPO survey are Antarctic Surface Water (AASW), Circumpolar Deep Water (CDW) and modified CDW (mCDW), Antarctic Bottom Water (AABW), and Shelf Water (SW). Water masses are defined based on temperature and density criteria, as listed in Table 1. Several previous studies have defined the regional water masses in this area (e.g. Meijers et al., 2010; Bestley et al., 2020), each with slightly different definitions based on a combination of density, temperature, salinity, and dissolved oxygen concentration thresholds. Here, we use these studies as a guide and choose definitions accordingly. In the East Antarctic, the 1.5°C isotherm is typically used to demarcate between CDW and mCDW, with mCDW being colder. In this study, we discuss CDW and mCDW together as CDW/mCDW. Some shelf studies have gone further to include a heavily modified CDW with waters as cold as -1.85°C, distinct from Ice Shelf Water that is below the surface freezing point (e.g. Herraiz-Borreguero et al., 2015, 2016; Williams et al., 2016). As we have very few stations on the shelf in Prydz Bay, we use a more generic definition of SW that does not distinguish between heavily modified CDW, Ice Shelf Water, and Dense Shelf Water. Given the limited data on the shelf collected during TEMPO, our focus is on data from the slope and farther offshore; a recent review of observed water-mass properties on the shelf in this region can be found in Blackensee et al. (in review)1. AASW is defined here as all waters with . In the northern part of our study region, i.e. generally north of the Southern Boundary, this includes water with characteristics in the subsurface temperature-maximum layer that are typical of Upper CDW, whereas in the southern part of our study region, this includes water in the subsurface temperature-minimum layer. For simplicity and consistency with other studies, we do not make a latitudinal distinction when describing this water mass. However, we examine specific properties of the layers important in setting the summer stratification when investigating the spatial variability of upper-ocean properties, rather than using density-based definitions (Section 3.4).
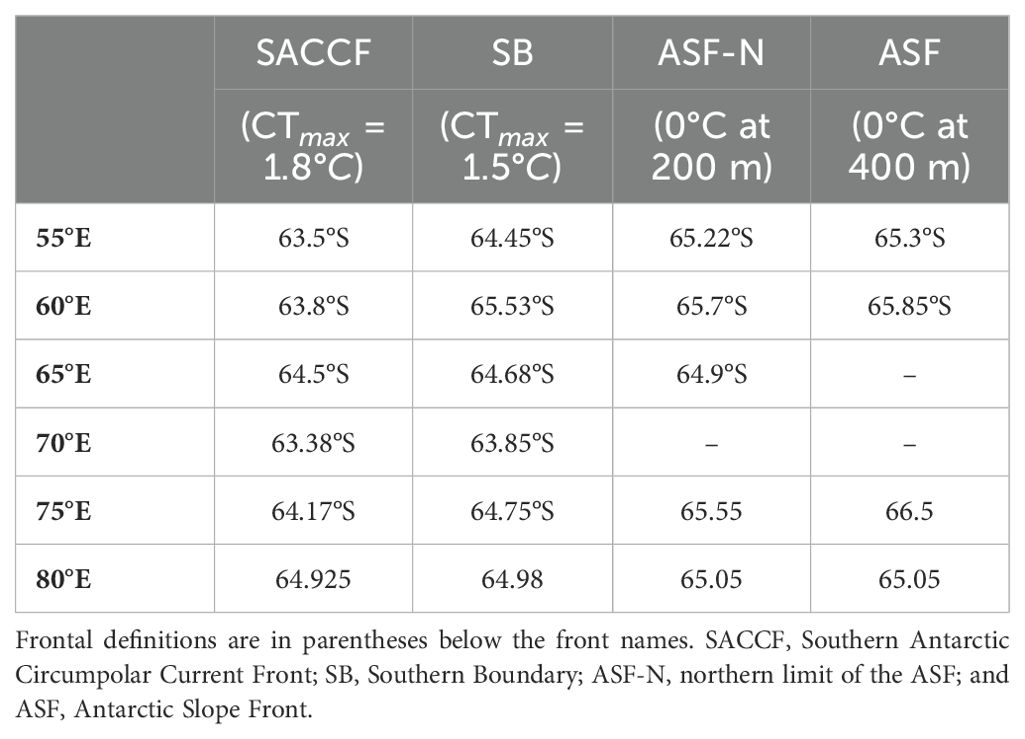
The Southern Ocean fronts relevant to this work are the Southern ACC Front (SACCF), Southern Boundary Front (SB), and Antarctic Slope Front (ASF). Table 2 summarizes the frontal definitions that we use and their observed locations throughout the TEMPO survey region. We define the SACCF and SB as the southernmost location where the subsurface temperature maximum equals 1.8°C and 1.5°C, respectively. These definitions are based on Meijers et al. (2010), who refined the circumpolar definitions of Orsi et al. (1995) for this region. We further refine the frontal definitions of Meijers et al. (2010), and consider the ASF to be where the base of the Winter Water layer (i.e. where the 0°C isotherm below the temperature minimum) reaches 400 m depth. We define the northern limit of the ASF (ASF-N) – which is relevant for biological studies and ecosystem processes – as the location where the base of the temperature minimum layer reaches 200 m depth.
Satellite remote sensing data provide a regional perspective of the greater Prydz Bay area during TEMPO (Figure 2). There are large surface blooms of chlorophyll-a (Chla) in the western and eastern parts of the study region, with low values of 0.1 mg m−3 found at 65°E and 70°E (Figure 2A). The largest values of Chla, reaching 5 mg m−3, are found along the 75°E and 80°E. Here, elevated SST values are found further south than in the western part of the survey, with values of 0.5°C found near 66°S on the 75°E transect (Figure 2B). There are also lower sea-ice concentrations (SIC < 20%) near the mouth of Prydz Bay relative to the other coastal regions where SIC reaches 80% (Figure 2C).
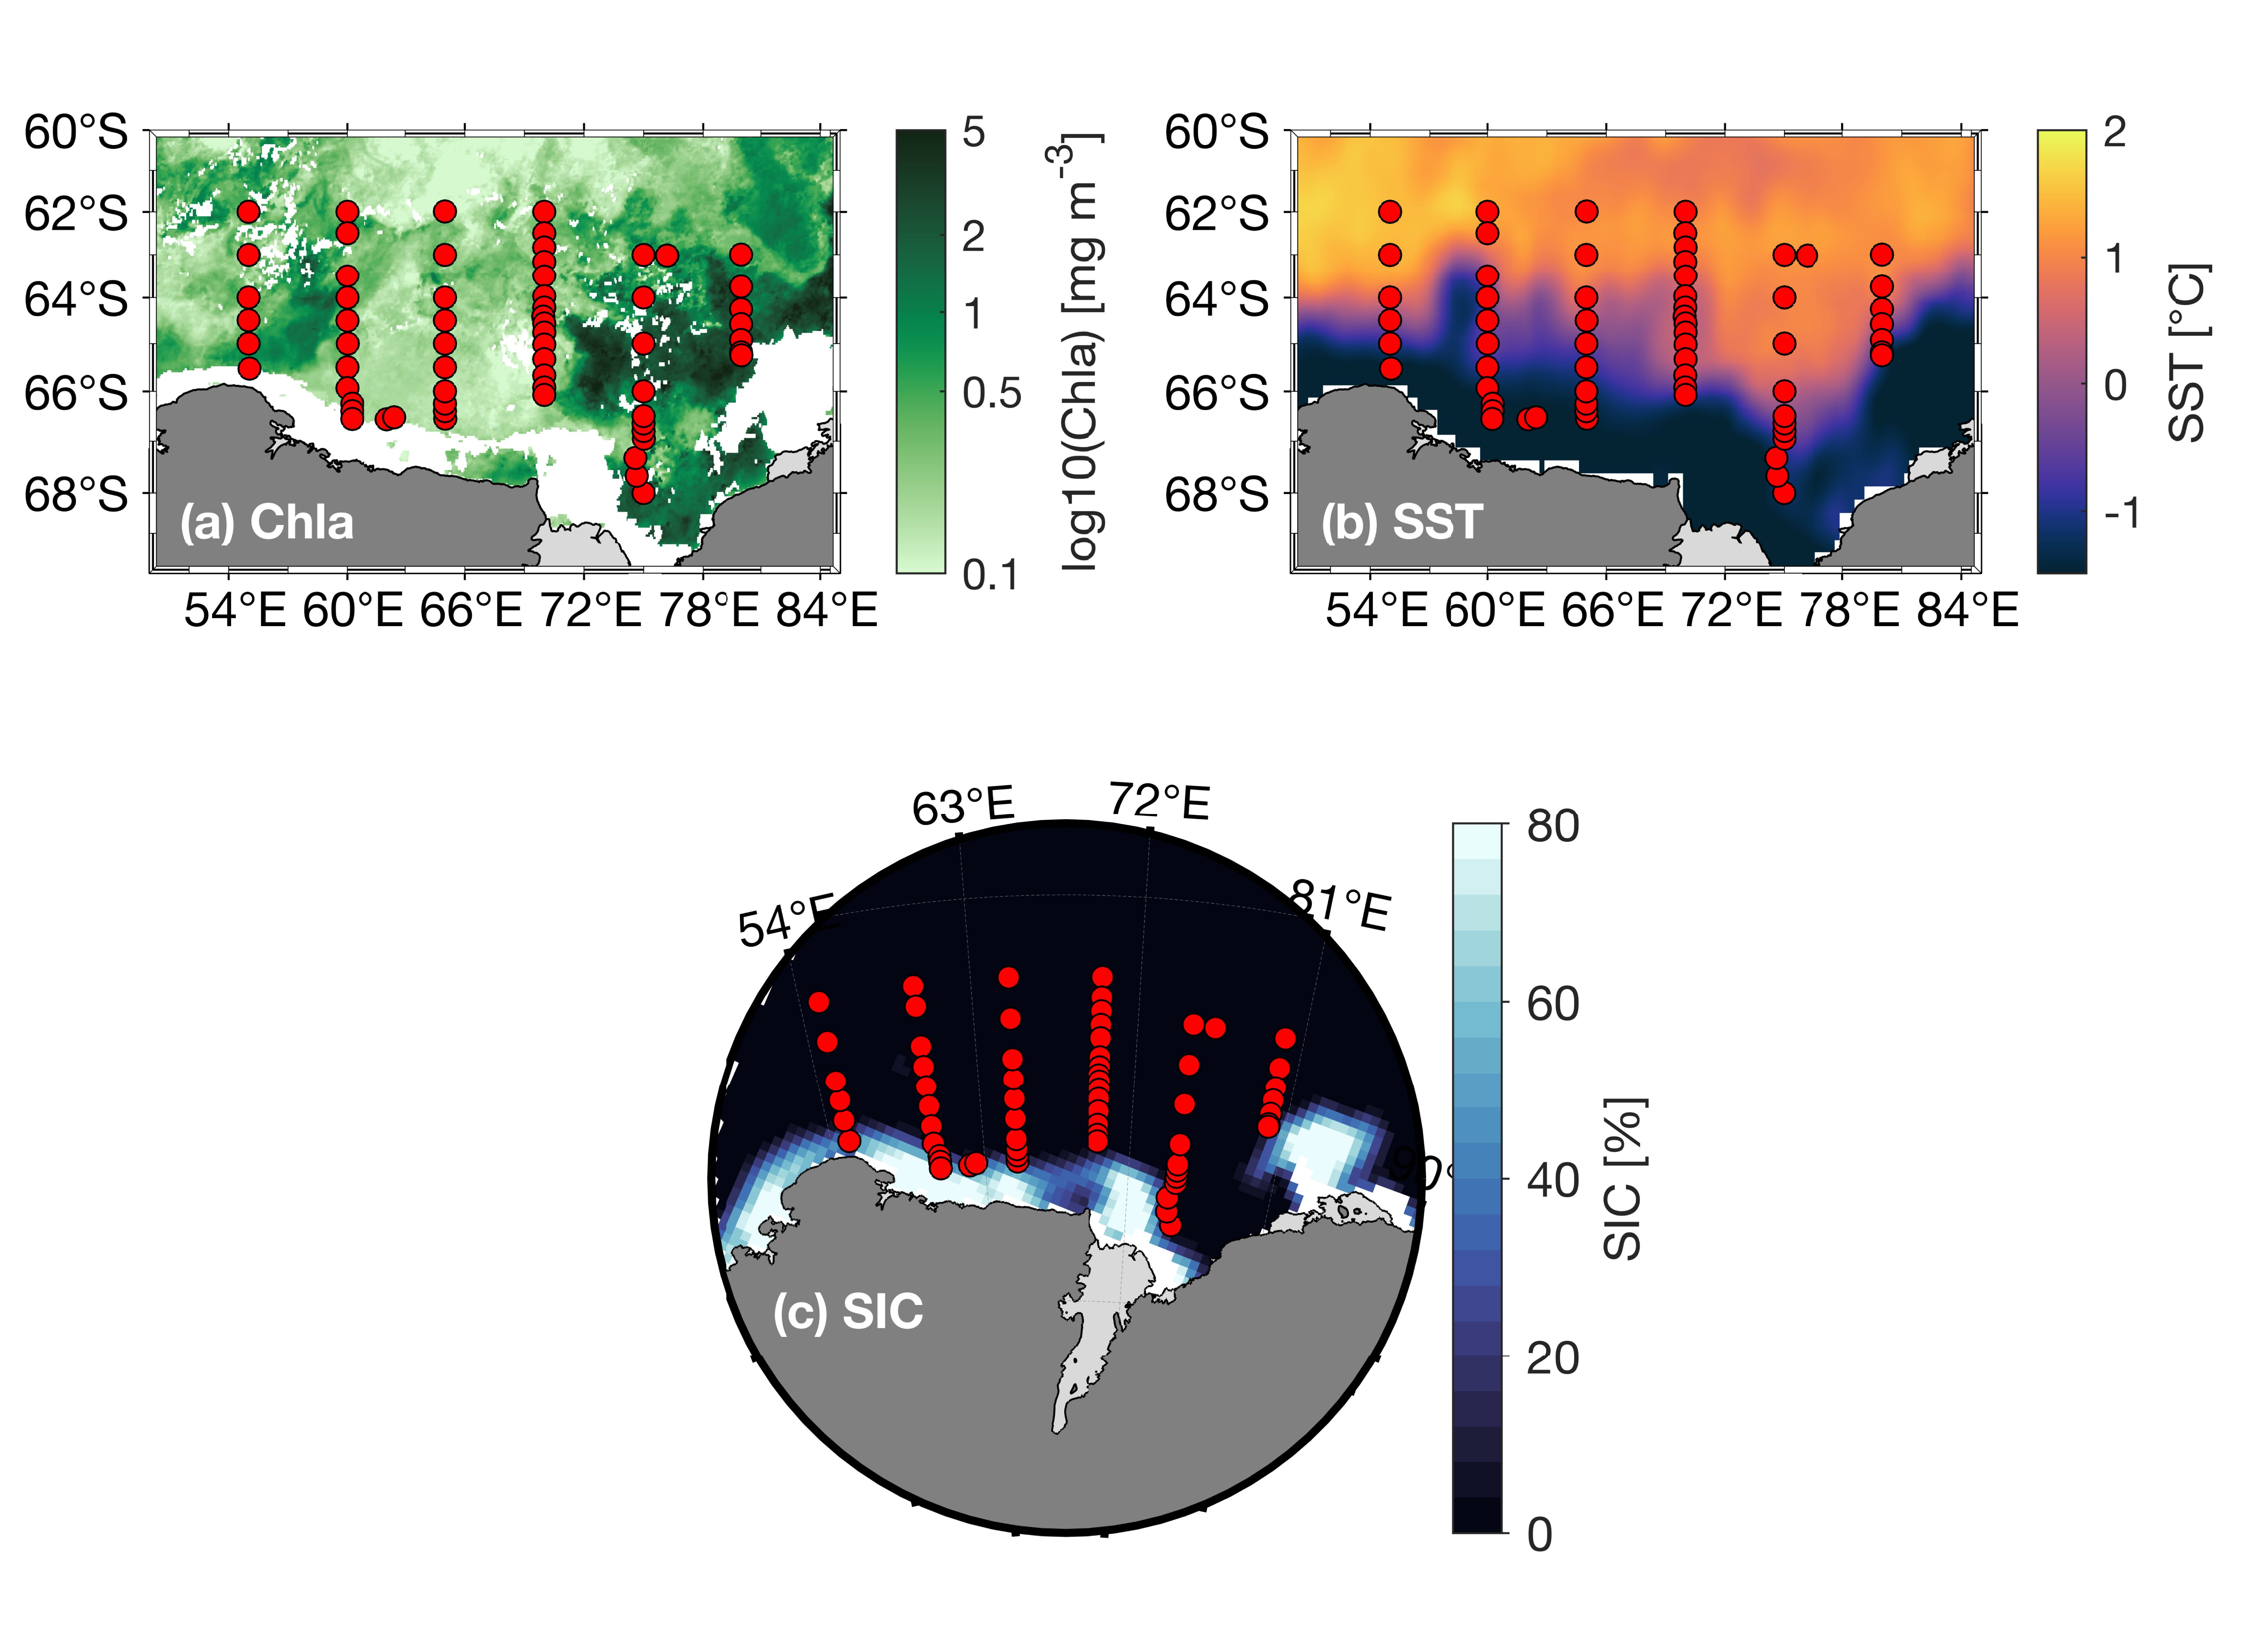
Figure 2. Regional remote sensing in February 2021: (A) Chlorophyll-a (Chla), (B) sea surface temperature (SST), and (C) sea-ice concentration (SIC). The red dots indicate the CTD sampling locations as in Figure 1. Note that SST data are present even in high sea-ice conditions because of the product that we used, which was gap-free interpolated.
The satellite observations of surface conditions during TEMPO are very close to the long-term climatologies of Chla and SIC for this region (Figure 3). There were no major anomalies evident leading up to, during, or immediately following the 2021 survey. Chla and SIC in February 2021 were slightly higher and lower, respectively, than climatological February values over the previous 24 years (Figure 3). Further, regional Chla and SIC are very close to historical record all year-round, and both can be considered normal for the 2020/2021 season. April 2021 Chla values are an exception, with slightly elevated values compared to the historical record, however, satellite observations are very limited during April as the sea ice expands and covers the ocean surface.
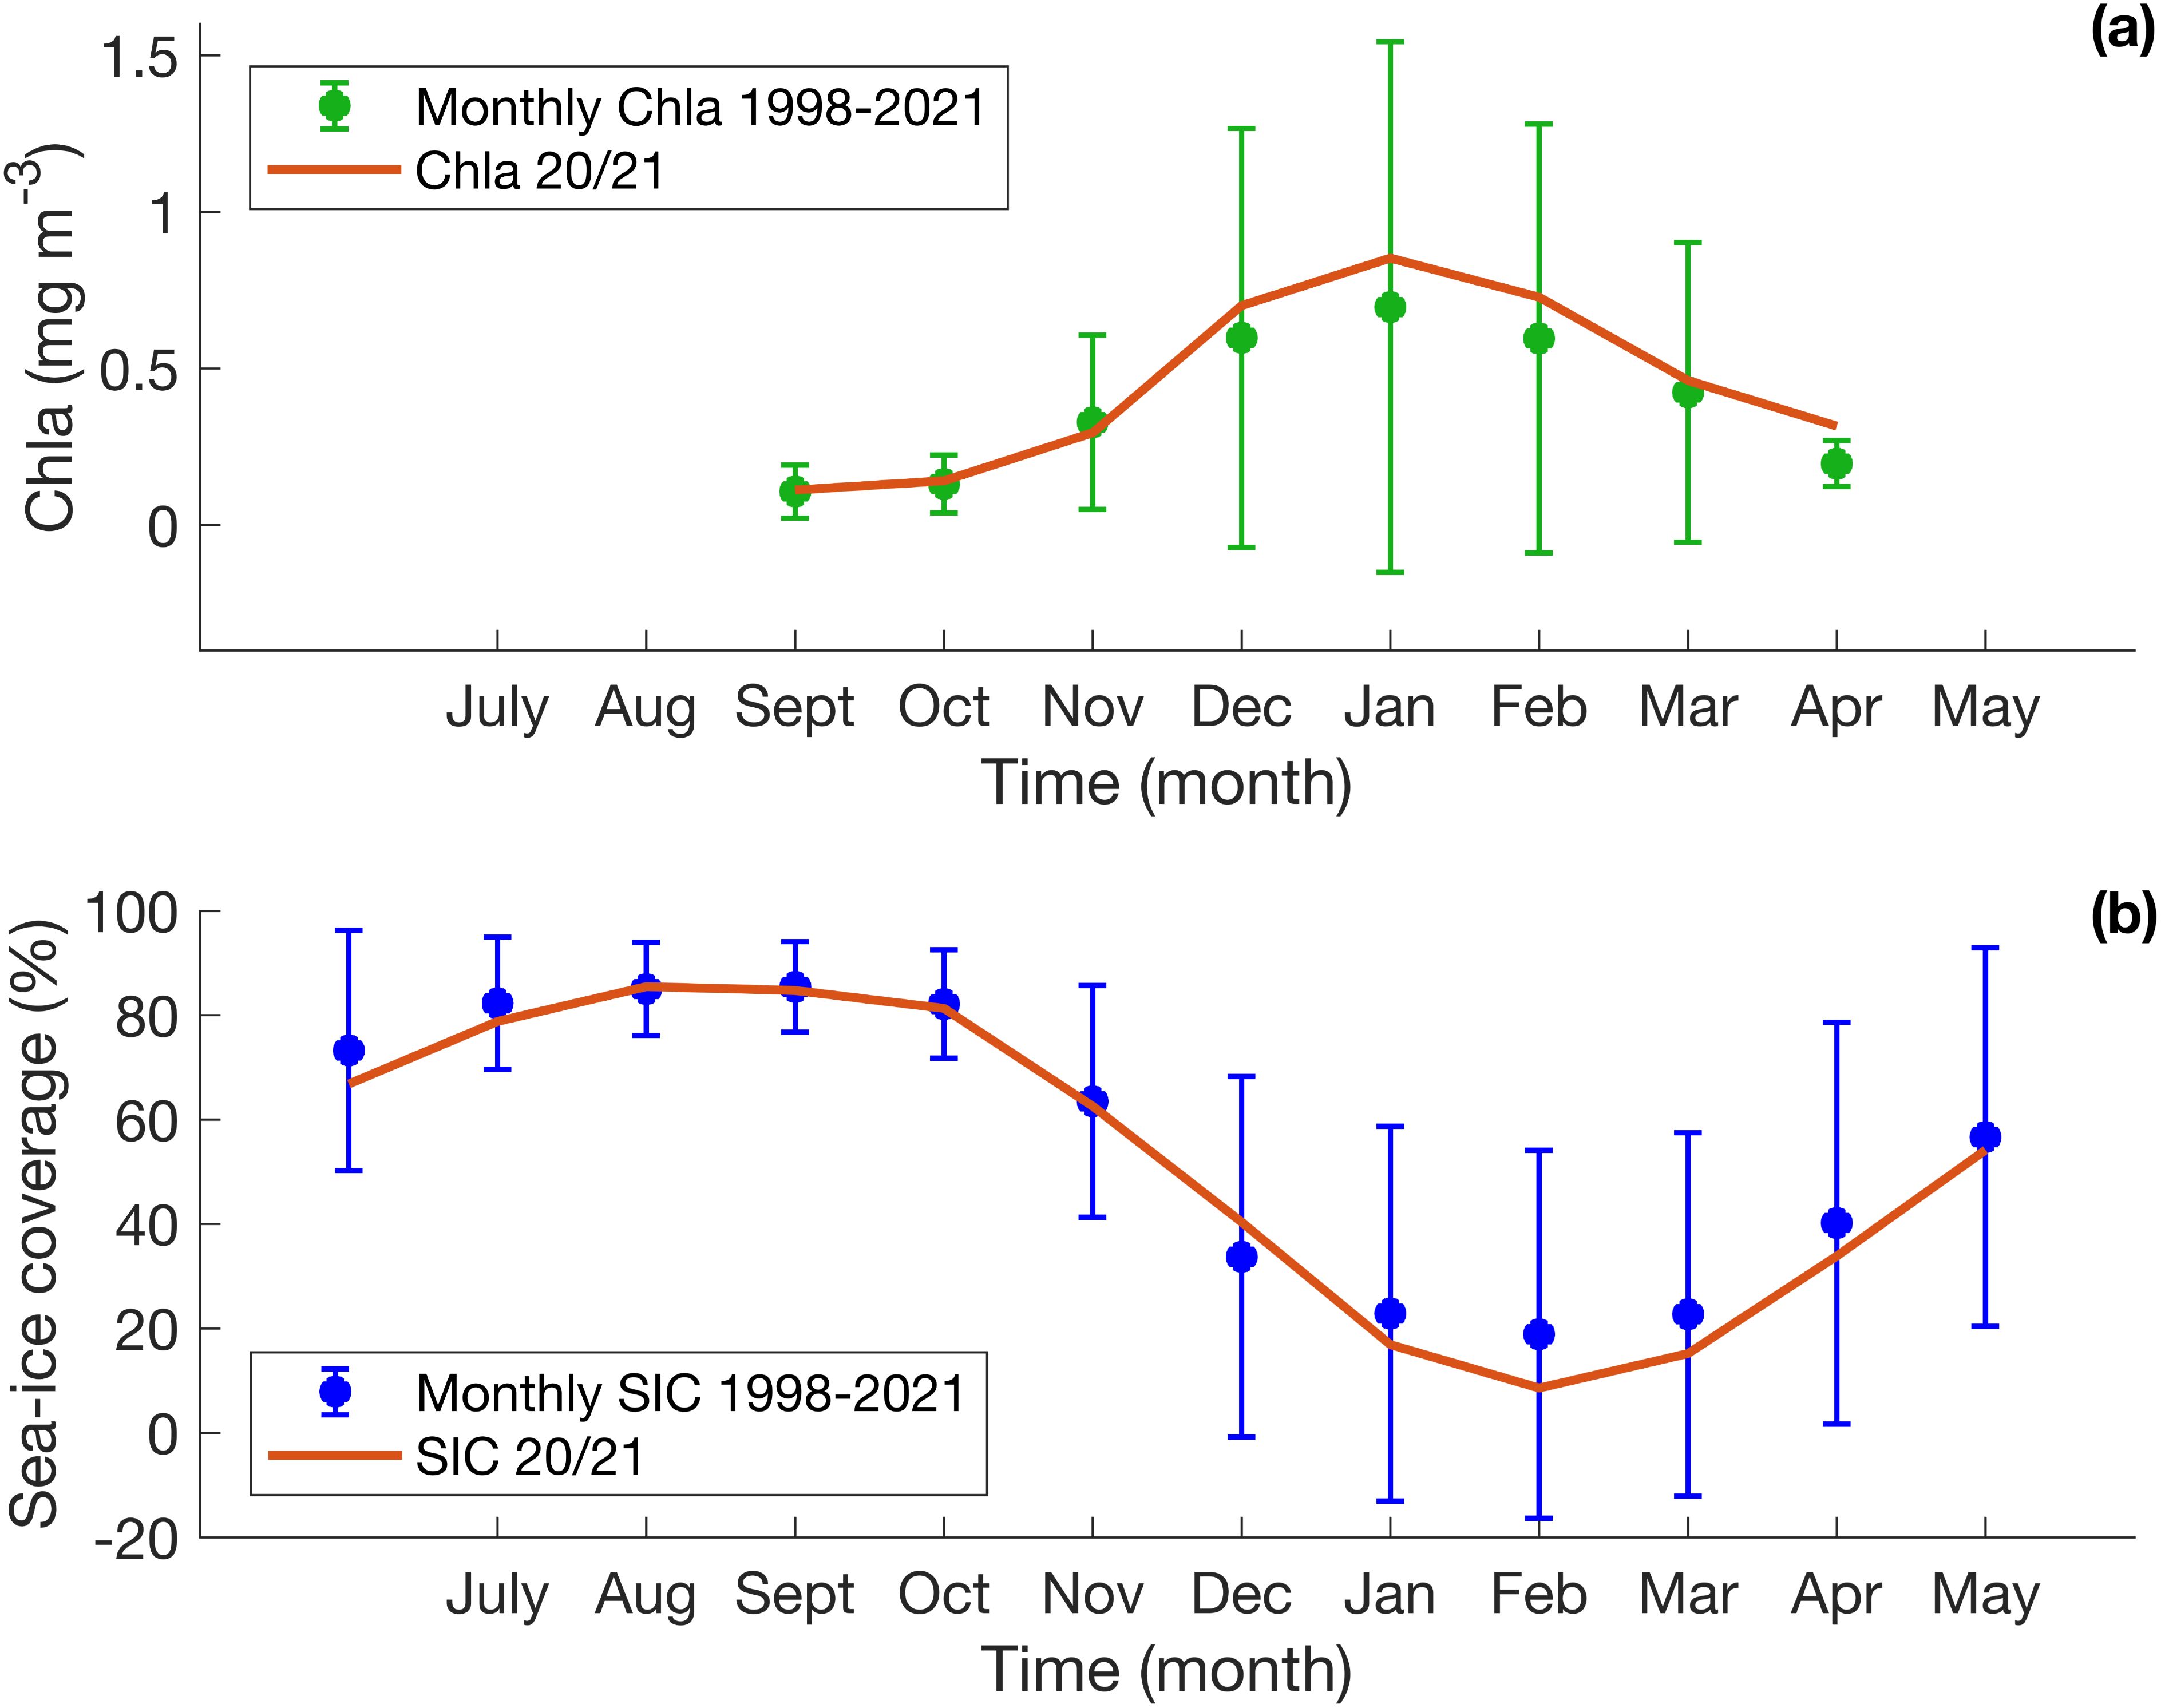
Figure 3. Monthly climatologies of (A) chlorophyll-a (Chla) and (B) sea-ice concentration (SIC) in the region defined as 61-69°S and 54-81°E during the 1998-2021 time period. The error bars represent the monthly standard deviation. The solid red lines represent the 2021 time series, showing that surface Chla and SIC state during the TEMPO voyage fit well within the historical spread.
3.2 Water-mass characteristics
Figure 4A shows the temperature and salinity distribution observed in the CTD data throughout the entire survey area, colored by DO concentrations. The AASW layer at the ocean’s surface is the lightest water mass, defined as waters lighter than 28.0 kg m−3. It is the freshest of all the regional water masses and spans the largest temperature range (Figure 4A; Table 3). Across the survey region, AASW exhibits the highest oxygen concentrations (with local concentrations > 300 µmol kg−1) and freshest salinities (SA < 34 g kg−1). Very fresh waters were found along 60°E and 80°E (SA < 33 g kg−1), associated with a surface meltwater lens from recent sea-ice melt. The variability of biogeochemical properties- nutrients, DIC, DO - is highest in the AASW layer (Table 3), reflecting the seasonal variations in these properties. This variability is driven by a combination of sea-ice processes (e.g. ice melt that also drives the large variations in salinity seen in the AASW) and biological processes (phytoplankton growth consuming inorganic carbon and nutrients to produce organic carbon).
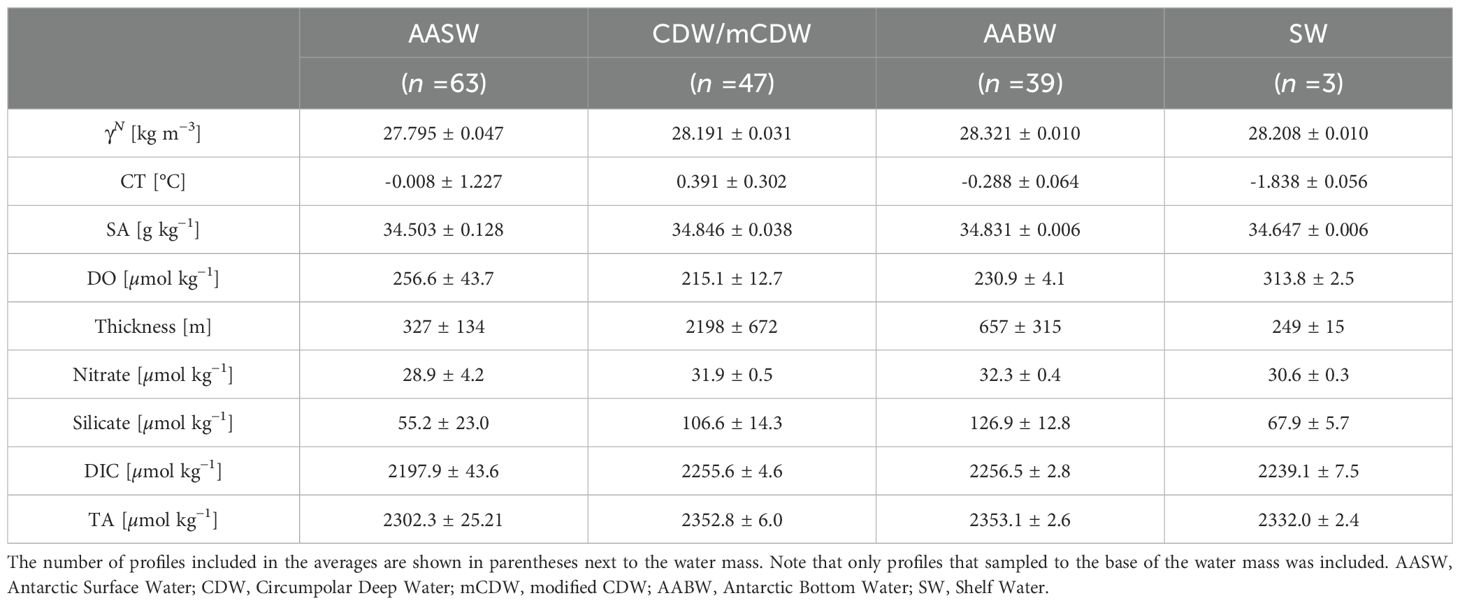
Table 3. Mean water-mass characteristics, as observed during the TEMPO survey, with uncertainty represented by the standard deviation.
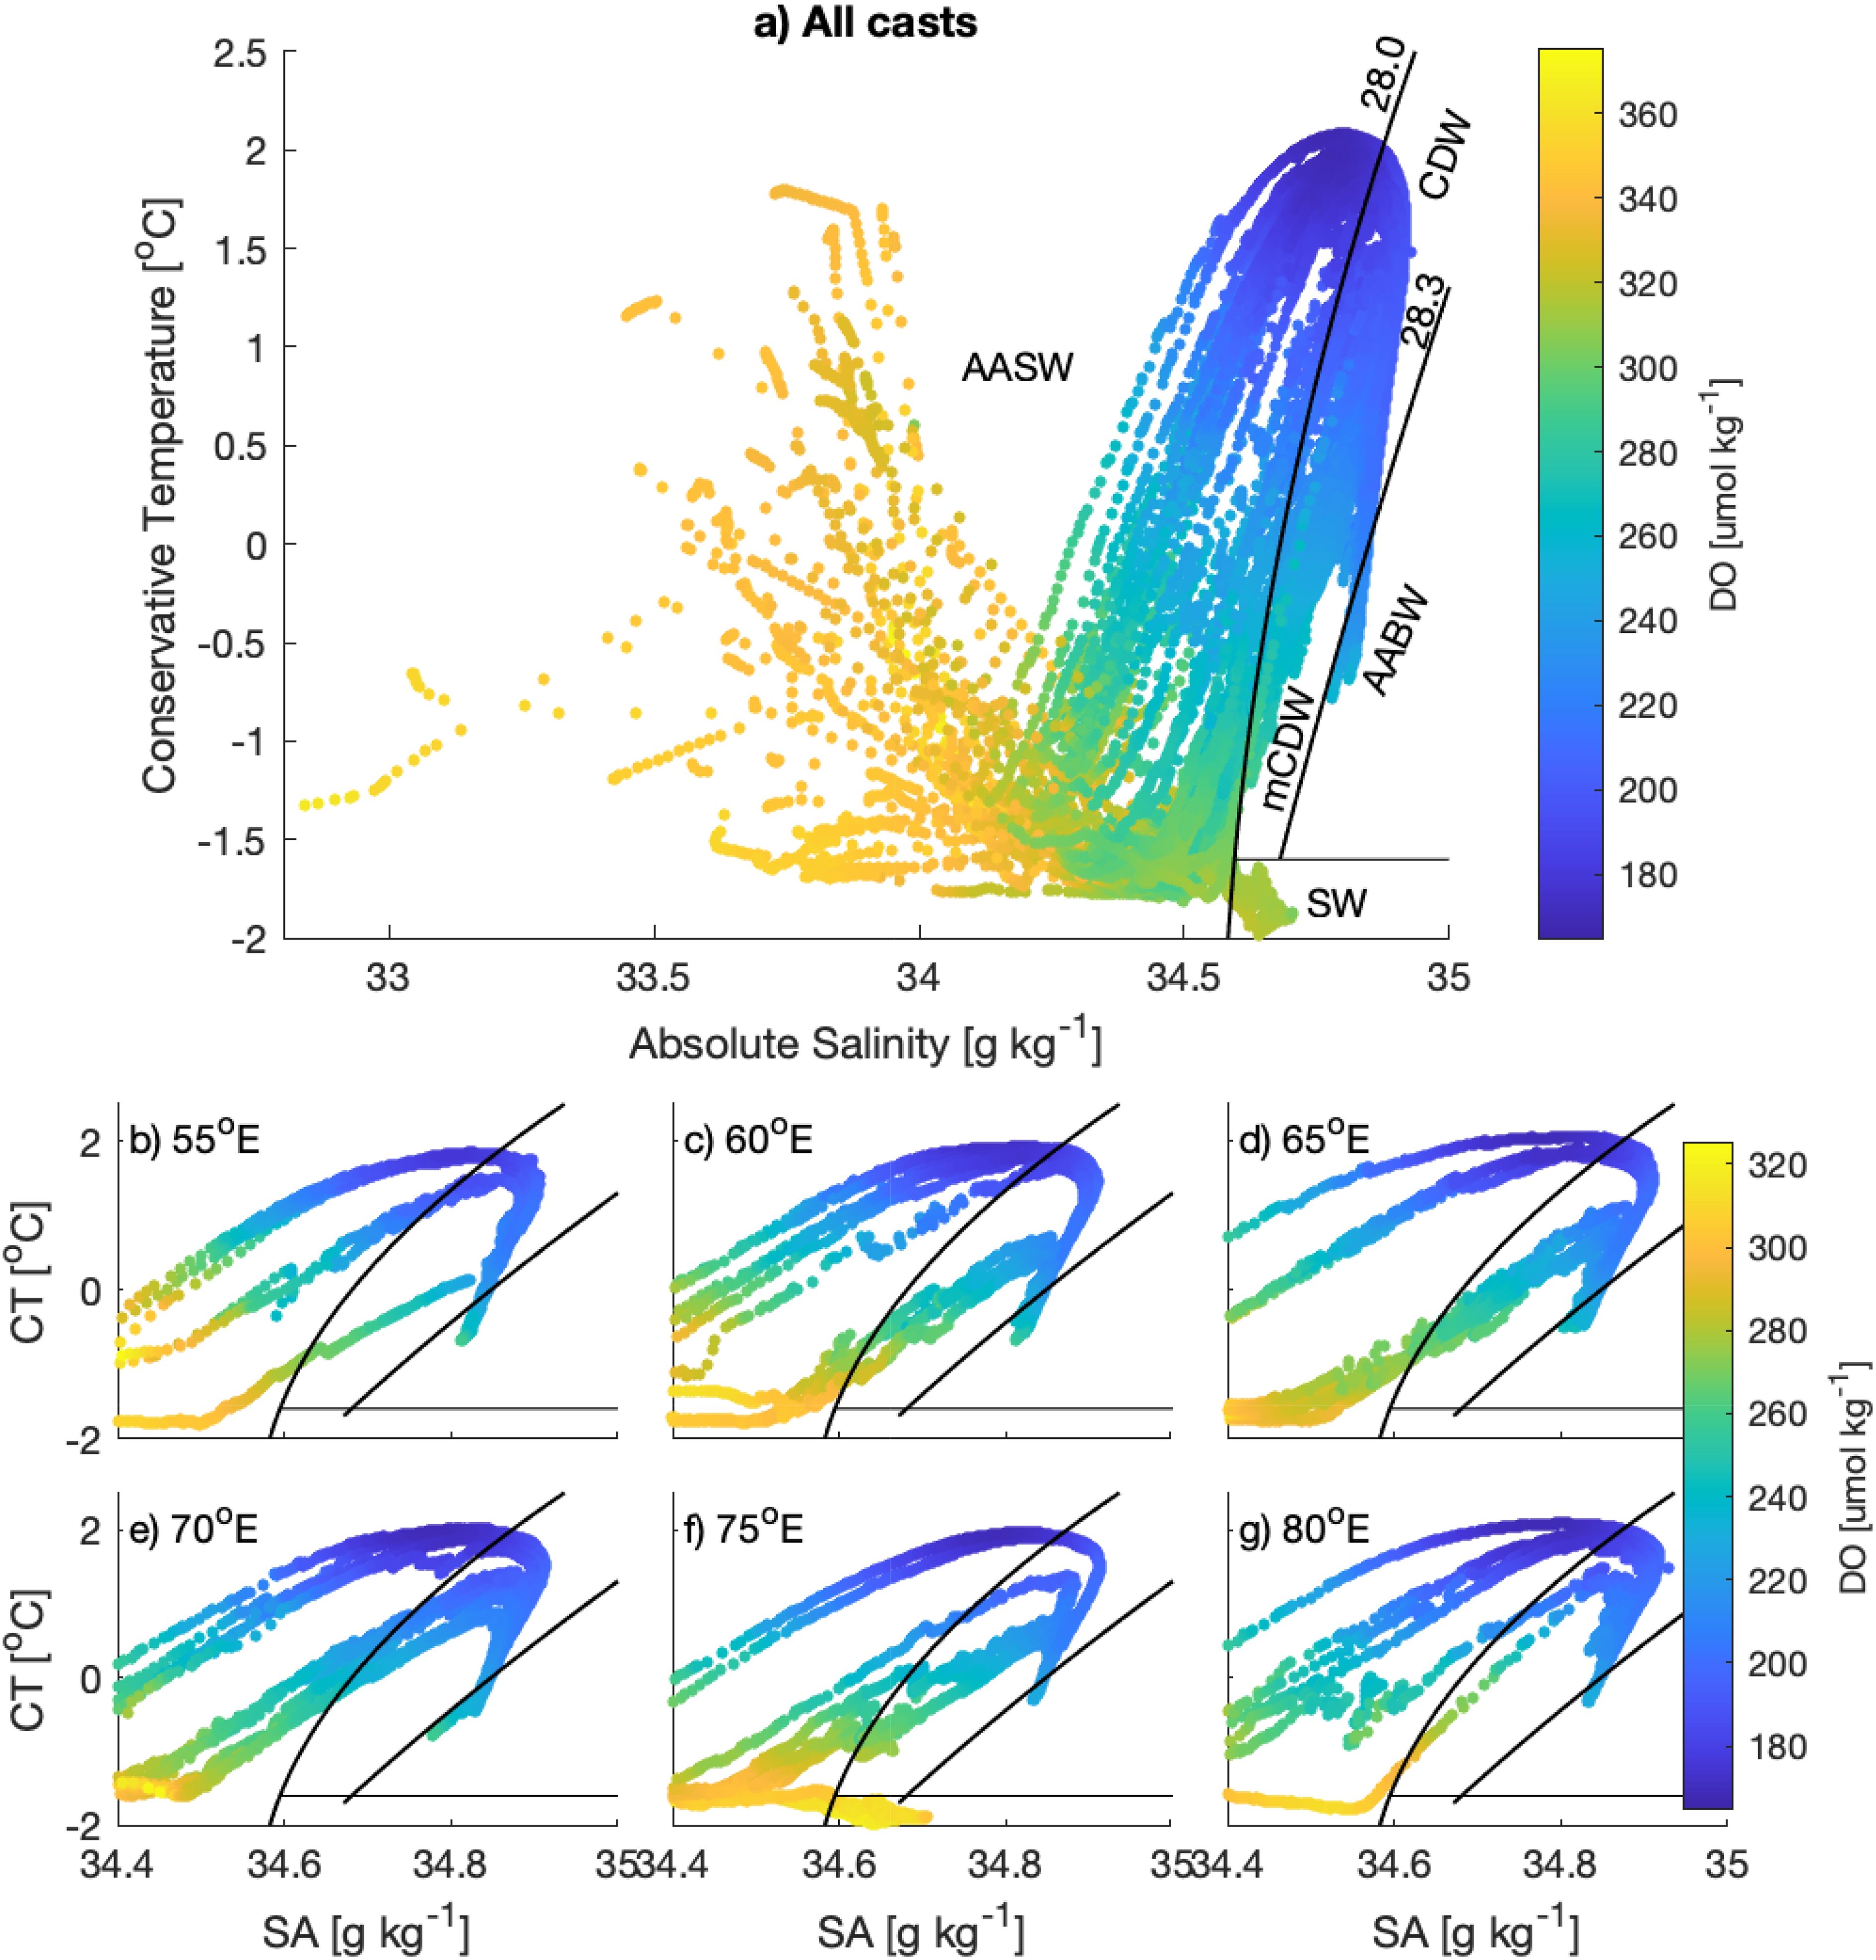
Figure 4. Temperature-salinity diagrams colored by dissolved oxygen concentrations (DO, [µmol kg−1]). (A) All profiles over the entire survey. (B–G) Profiles along individual transects. Note the different colorbar for the transect panels. Neutral density contours (γN =28 and 28.3 kg m−3) are drawn in each panel and labelled in (A) The -1.6°C isotherm is also shown in waters denser than 28 kg m−3 to distinguish Shelf Water (SW). Water masses, as defined in Table 1, are labelled in (A) Antarctic Surface Water (AASW), Circumpolar Deep Water (CDW), modified Circumpolar Deep Water (mCDW), Antarctic Bottom Water (AABW), and Shelf Water (SW).
Property plots of DIC, TA, salinity-normalized DIC (nDIC) and potential alkalinity (pTA) are shown in Figure 5. The relationship between TA and salinity is nearly conservative, as seen by its near-linear dependence, with low TA values associated with low salinity found in the upper ocean (Figure 5B). The relationship between DIC and salinity is similar, though the influence of biological processes, particularly in the AASW as described above, results in larger variability with respect to salinity (Figure 5A). The relationship between salinity normalized DIC and potential TA in the upper ocean indicates a dominance of photosynthesis which reduces nDIC without changing the pTA (Figure 5D), and causes the variable concentrations of both parameters in the AASW (relative to deeper waters) as described above. While quantifying the impact of calcification, or the formation of CaCO3 to the variability of the carbonate system goes beyond the scope of this work, the relationship between nDIC and pTA suggests that this process may also influence the upper ocean variability. Furthermore, when brine is rejected during sea ice formation, DIC may be expelled more efficiently than TA, resulting in ratios of DIC: TA in sea ice that are different from those observed in the underlying seawater (Rysgaard et al., 2007; Geilfus et al., 2012), and carbonate mineral precipitation during ice formation may have implications for TA concentrations in the upper ocean (e.g. Dieckmann et al., 2008; Moreau et al., 2016).
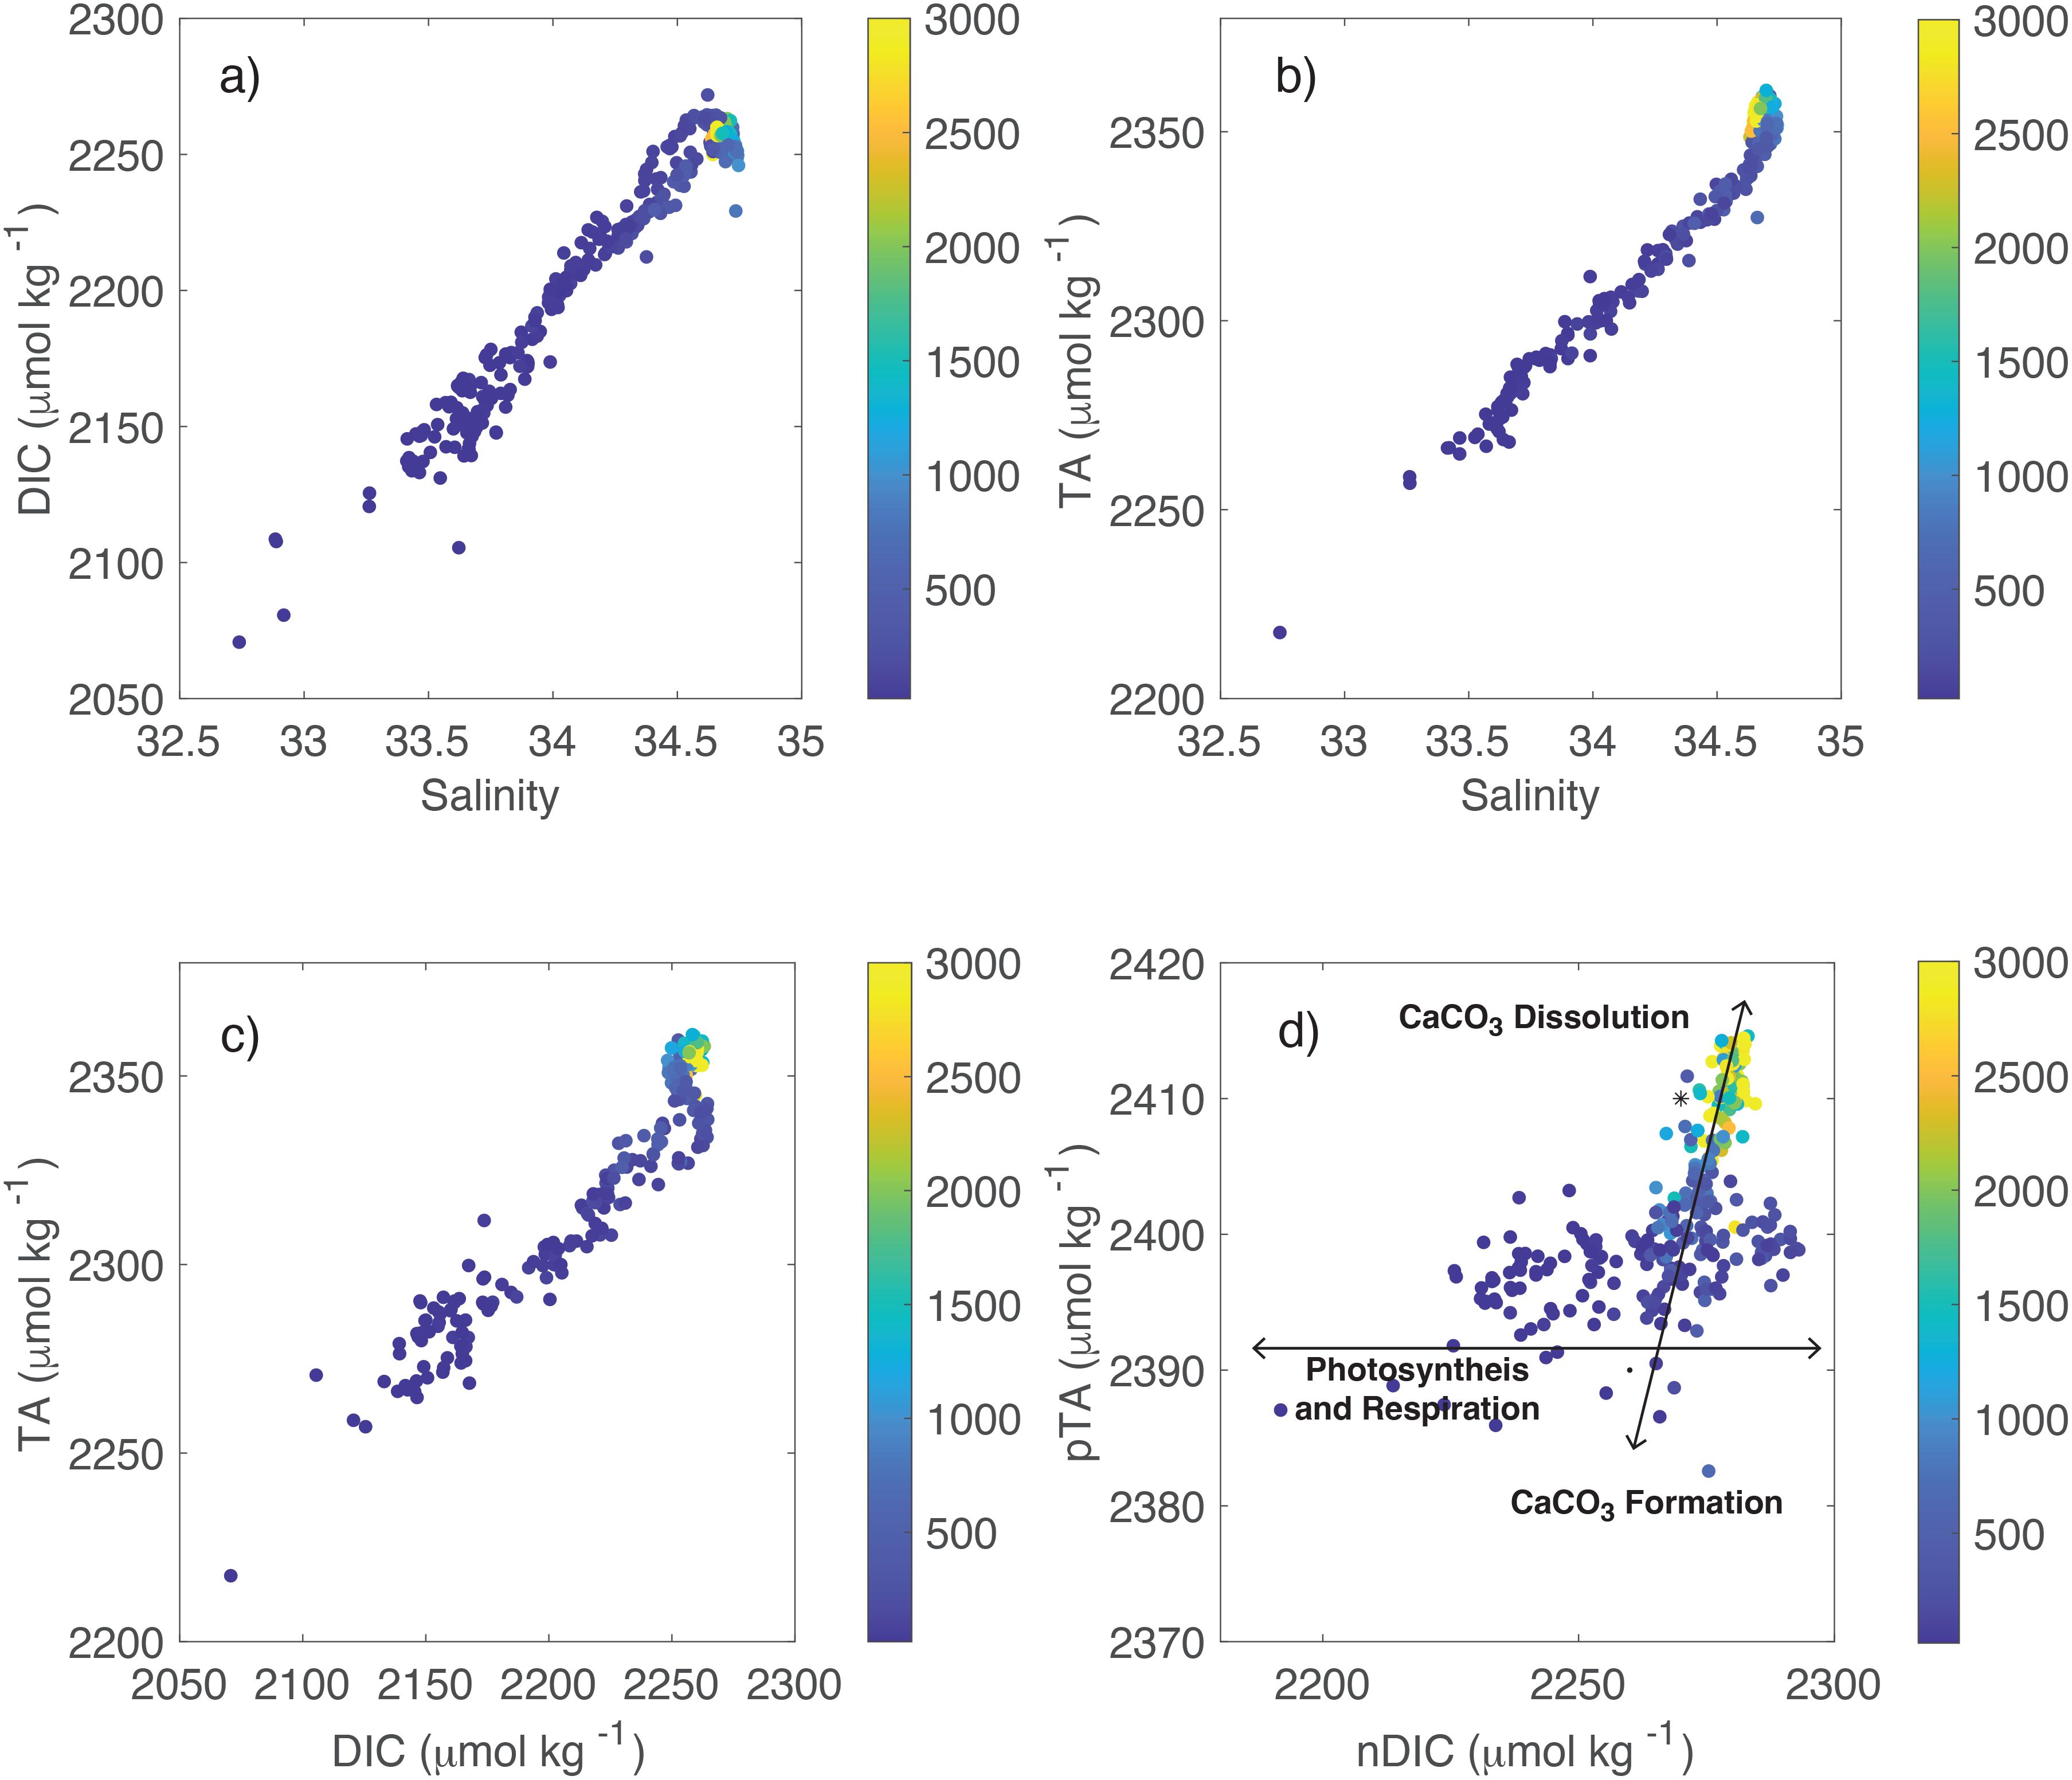
Figure 5. Property plots of the carbonate system. (A) DIC versus salinity, (B) TA versus salinity, (C) DIC versus TA, and (D) salinity-normalized DIC (nDIC) versus potential alkalinity (pTA). In (D) the effects of biological production and carbonate mineral processes are also shown schematically. Note that the colors represent depth of the samples.
The largest water mass in the region is CDW/mCDW, shown between the two gray lines in all panels of Figure 6, and found at every station with its characteristic maximum in salinity, low DO concentration, and relatively warm temperature. It occupies over 2000 m of the water column, on average, and is the most saline water mass in the region, with mean SA= 34.846 g kg −1 (Table 3). Note that profiles at shallow stations on the northern end of the transects (Figure 1, white dots) did not sample the entire CDW layer; only profiles that sampled to the base of the layer were included in these averages. It is not clear from many of the transects whether or not the CDW/mCDW layer is accessing the continental shelf, as the transects do not extend far enough south. Yet, there is a clear inhibition of CDW/mCDW access to the slope along 55°E, where the top of the CDW/mCDW layer (γN = 28.0 kg m−3 isopyncal) clearly intersects with the continental slope at roughly the 500 m isobath (Figure 6, top row). Interestingly, the γN =28.0 kg m−3 isopyncal is present on the continental shelf along 75°E where we surveyed well into Prydz Bay (Figure 6, fifth row). However, this water is classified as Shelf Water, as it is too cold to be CDW/mCDW (CT < −1.6°C).
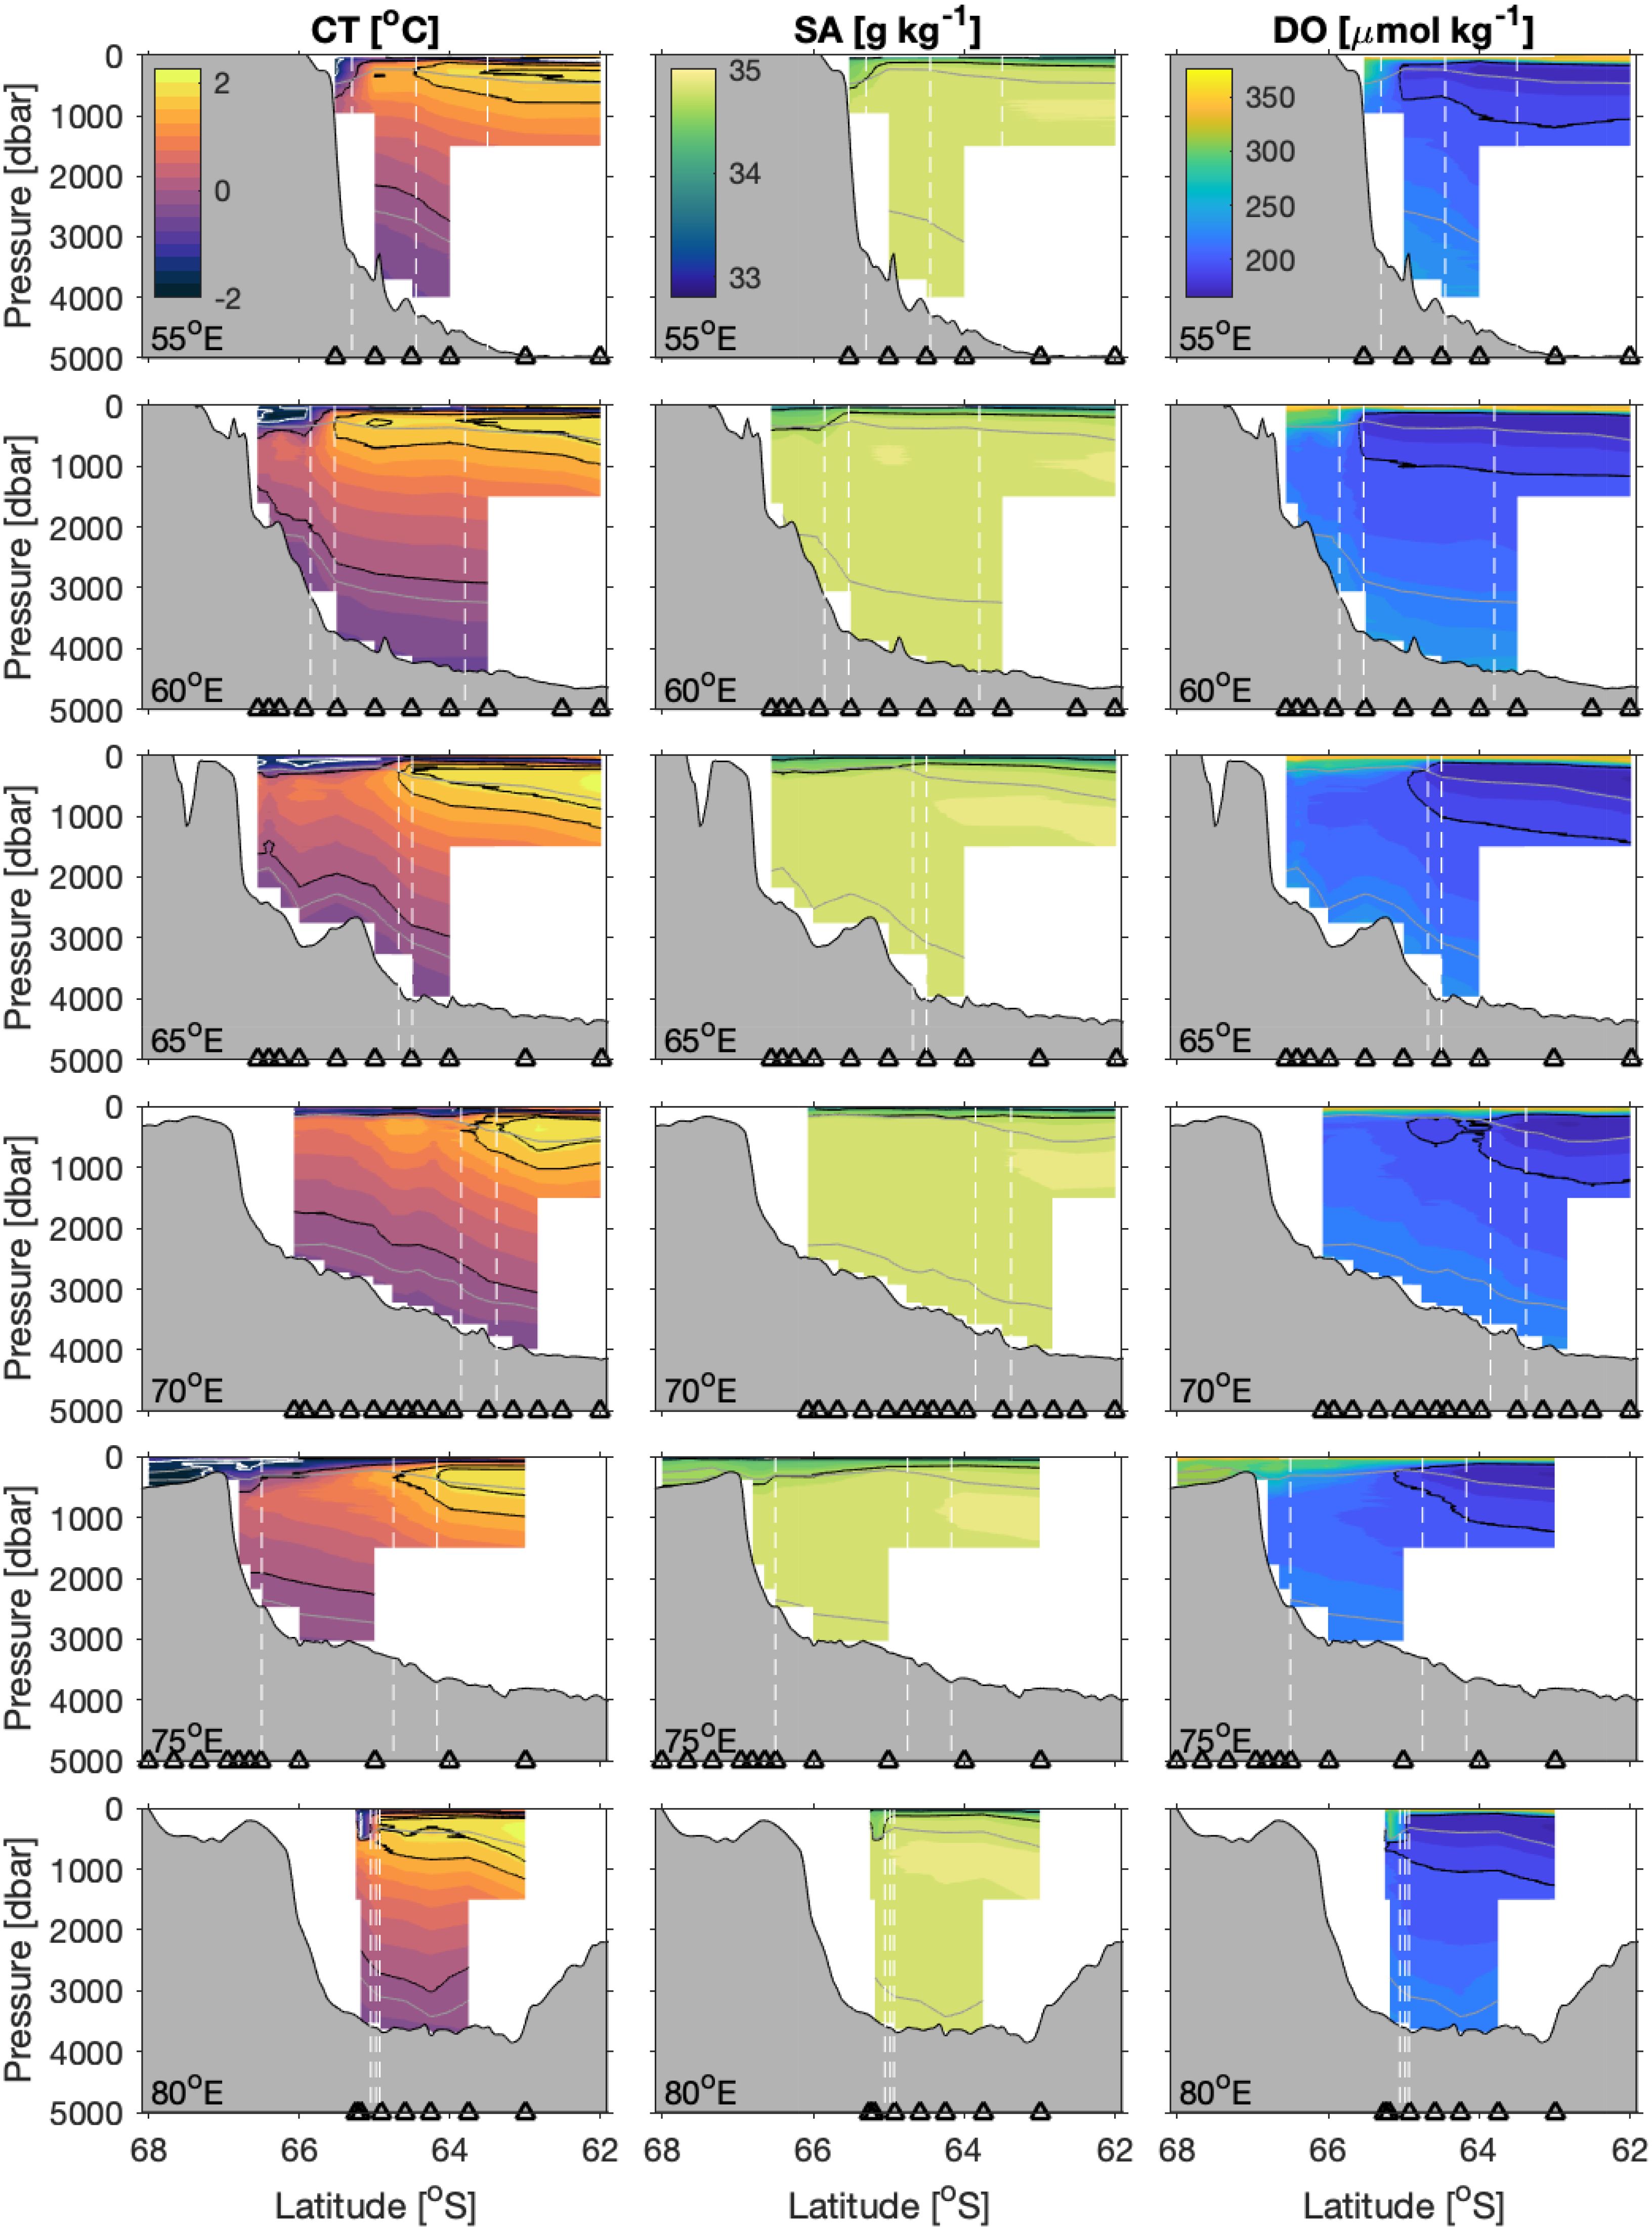
Figure 6. CTD data – temperature (left), salinity (center), and dissolved oxygen (right) – along the six transects. The transects are ordered with the western-most transect along the top row and eastern-most transect along the bottom row, with longitude denoted in bottom left corner. CT is contoured every 0.25°C, with the 0°C, 1.5°C, and 1.8°C isotherms as thin black lines and the -1.6°C as a thin white line; SA every 0.1 g kg−1, with the 34 and 34.7 g kg−1 isohalines as thin black lines; and DO every 10 µmol kg−1, with the 200 µmol kg−1 contour as a thin black line. Gray lines represent the γN = 28.0 and 28.3 kg m−3 isopycnals. Vertical dashed lines, from north to south, represent the Southern ACC Front, Southern Boundary, and Antarctic Slope Front (if sampled). The triangles along the bottom indicate station locations.
In contrast to the AASW described above, the variability in the biogeochemistry of the subsurface CDW/mCDW is much smaller, reflecting the dominance of processes occurring over longer than a single season. CDW/mCDW has elevated concentrations of inorganic carbon and nutrients (Figure 7), and minimum concentrations of dissolved oxygen resulting from both the respiration of organic matter in the interior ocean and the reduced ventilation of this water mass (see Table 3).
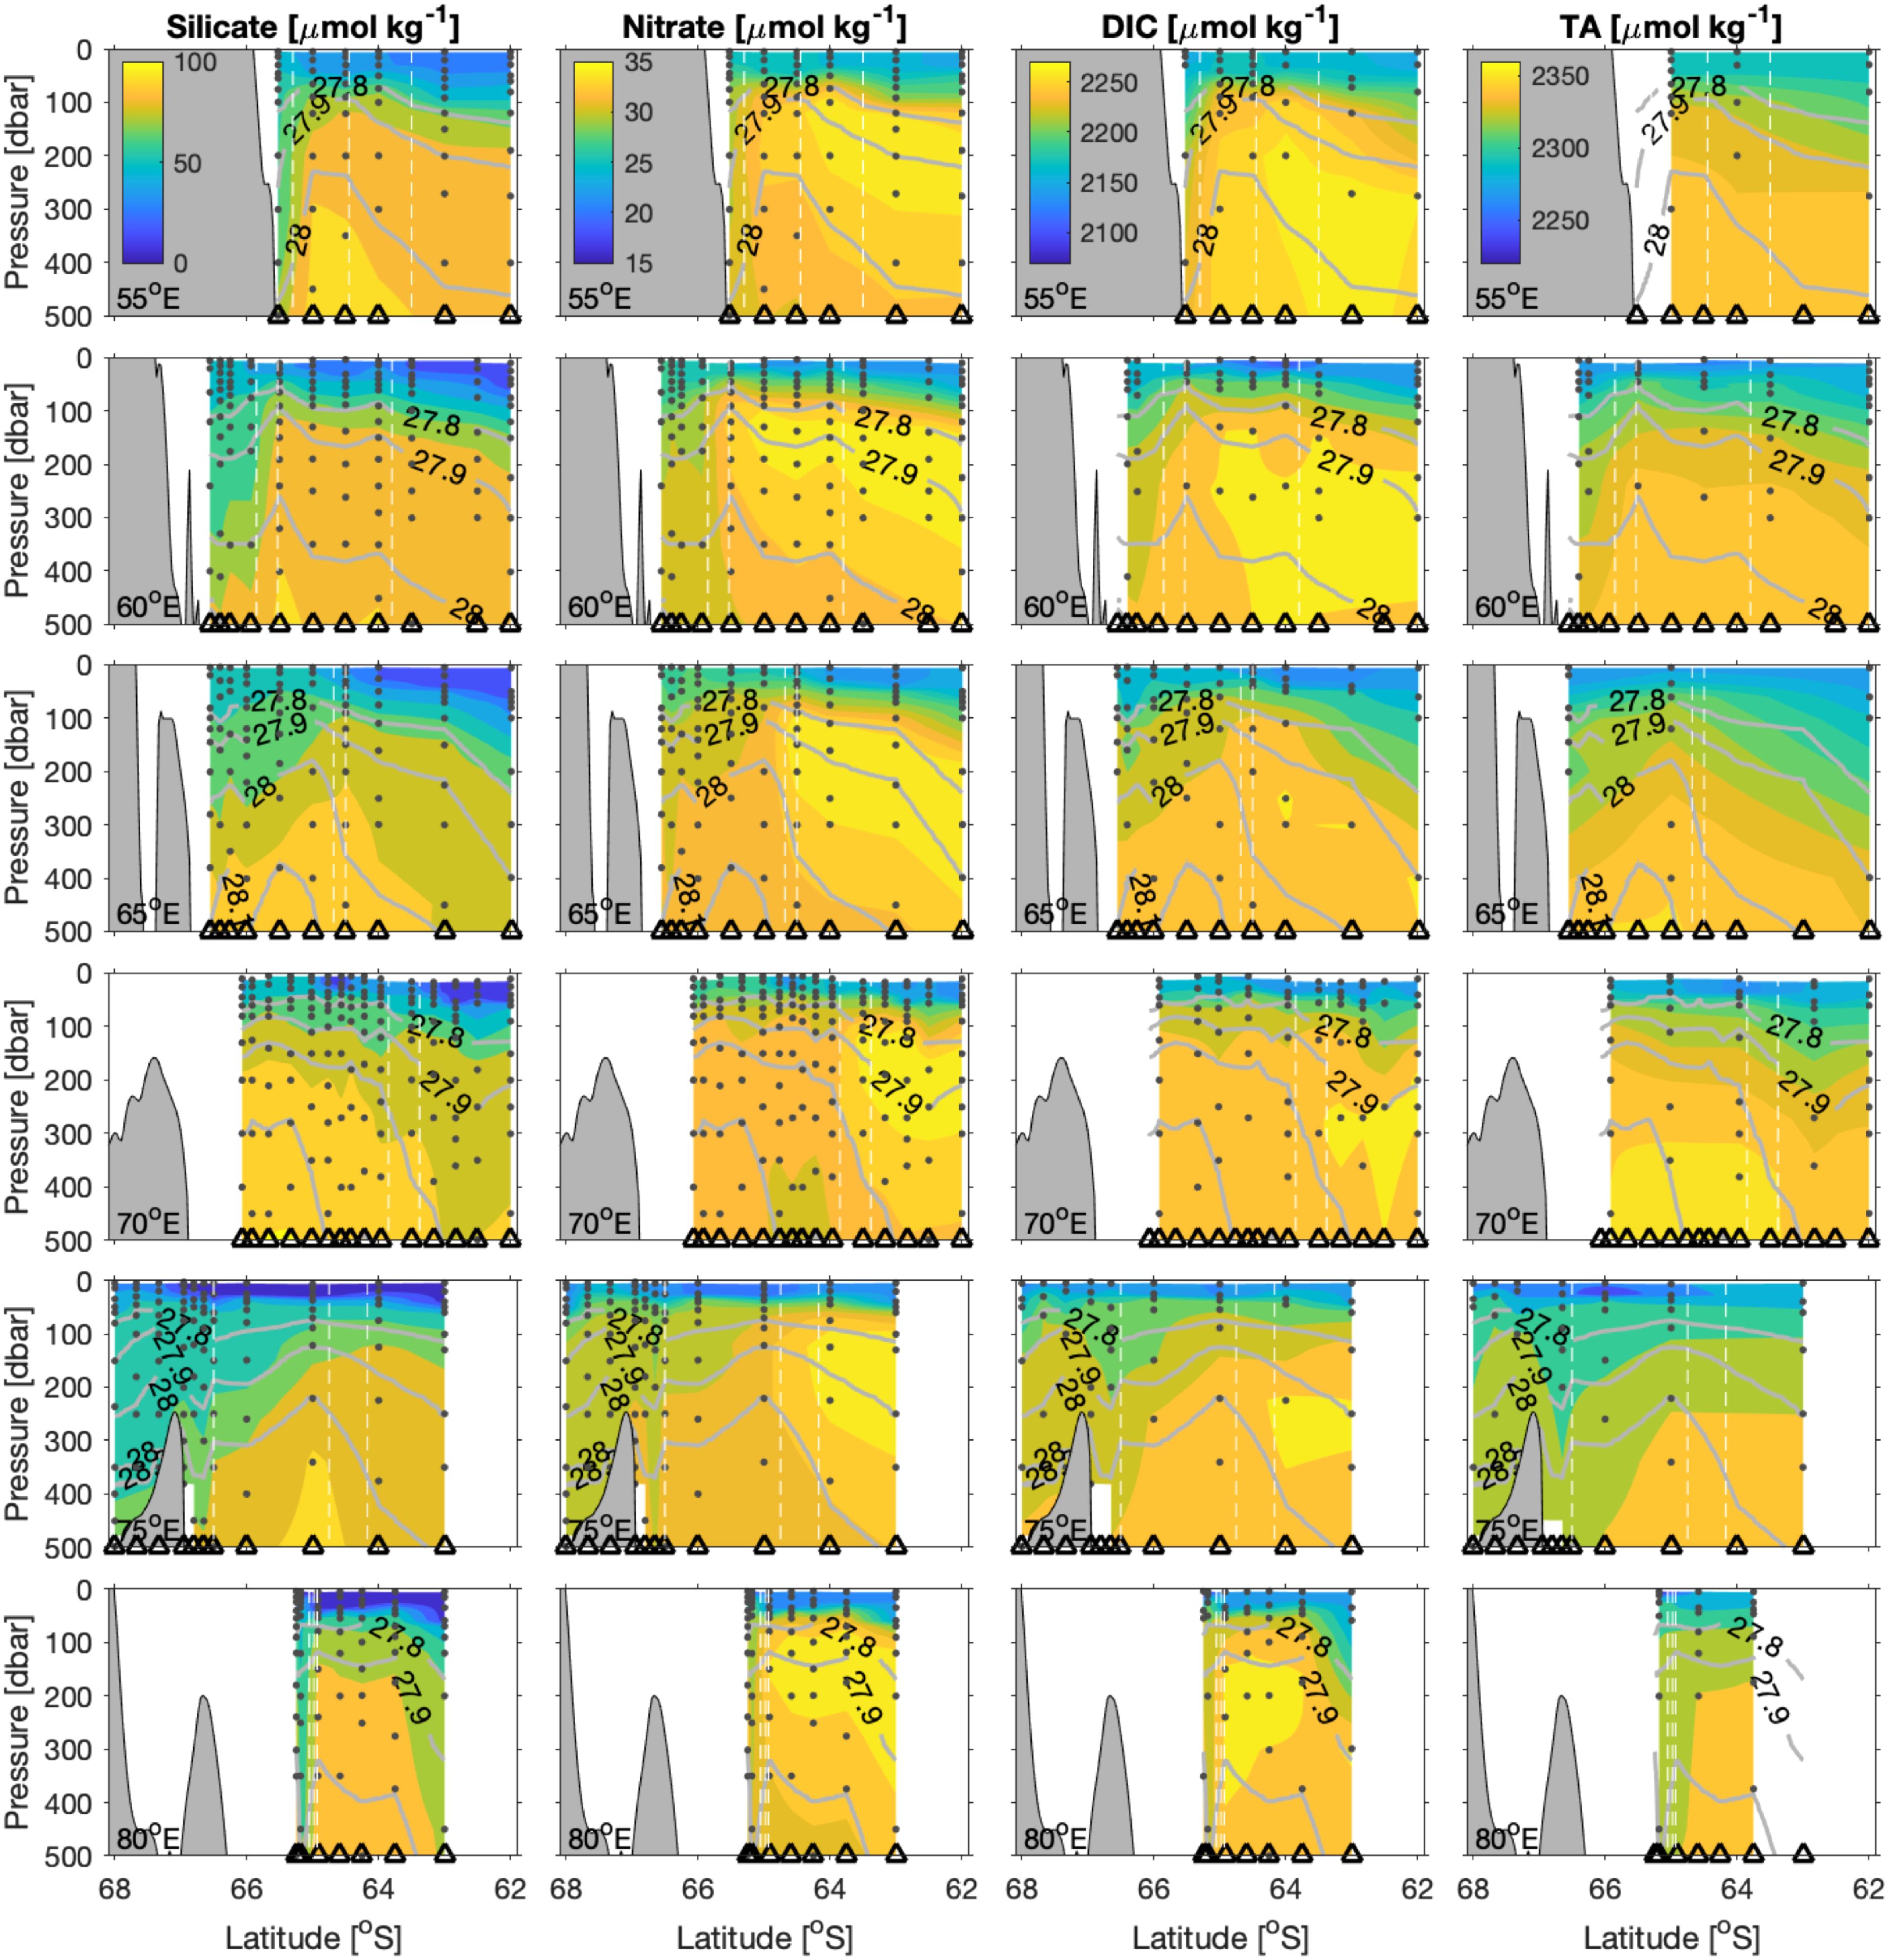
Figure 7. Upper-ocean biogeochemical properties – nitrate (left), silicate (center-left), DIC (center-right), TA (right) – along the six transects. The transects are ordered with the western-most transect along the top row and eastern-most transect along the bottom row, with longitude denoted in bottom left corner. Gray lines represent the isopycnals, as labeled. Black dots indicated bottle depths of the discrete samples taken for the respective quantities. Vertical dashed lines, from north to south, represent the Southern ACC Front, Southern Boundary, and Antarctic Slope Front (if sampled). The triangles along the bottom indicate station locations.
At the salinity maximum, there are elevated concentrations of TA, without associated maxima in DIC (Figures 5A, B). In contrast to the relationship between nDIC and pTA described in Section 3.4, the deeper waters (e.g., CDW/mCDW and AABW) indicate a dominance of CaCO3 dissolution (Figure 5D). This is consistent with the broad enrichment of the Southern Ocean with pTA (relative to the other ocean basins) which can be considered a proxy for water mass age, i.e., the CDW has accumulated TA (relative to DIC) due to carbonate dissolution occurring over long timescales.
The AABW layer, the densest layer in the deep ocean, is present along every transect (Figure 6), and is particularly evident in the western transects, west of Prydz Bay (55-65°E). The mean thickness of the AABW layer over the survey area is 663 ± 316 m (Table 3). Note that the quoted uncertainty here represents the standard deviation and only profiles to the seafloor, i.e. profiles that sampled the entire AABW layer, were included in these statistics. AABW is generally thicker further to the north, as shown by the γN = 28.3 kg m−3 isopycnal (Figure 6, gray line). This is especially clear along 60°E, where the layer goes from over 1000 m depth at 63.5°S to intersecting the seafloor near 66°S. The thickest AABW layers are found in the western transects. This is likely the signature of local AABW formation at Cape Darnley (western side of Prydz Bay) resupplying the abyss and/or a pooling of AABW to the west due to the deepening of the bathymetry (as found in the Australian Antarctic Basin by, e.g., Foppert et al. (2021). Along 75°E, very cold SW was present at the bottom of the profiles where the survey extended onto the shelf in Prydz Bay (CT < -1.6°C; Figure 4F).
Both AABW and SW have elevated concentrations of DIC (and nutrients), relative to the other water masses, which is likely associated with the higher salinity of these waters resulting from their formation in the winter season at a time of net sea ice formation and brine rejection (which includes rejection of both DIC and salinity; e.g. Shadwick et al., 2014). The silicate concentration is notably higher in AABW than in CDW/mCDW (Table 3). This reflects both that the source of AABW is south of the Polar Front while CDW/mCDW is likely to have originated further north, i.e. north of the ‘silica trap’ (e.g. Boyd et al., 2024), and the fact that while nitrate is remineralized throughout the water column, resulting in similar concentrations in both layers, most of the biogenic silicate will be transported to depth and remineralized close to the seafloor. The elevated oxygen concentration in the SW water indicates recent ventilation through interactions with the atmosphere.
3.3 Frontal distribution and transport
Evidence of an oceanographic front is present and manifests as a gap in the temperature-salinity diagram in Figure 4A (from roughly 1.5°C, 34.6 g kg−1 to -1.4°C, 34.4 g kg−1). The fronts become more clear in the individual transects, where water-mass properties exhibit large differences between stations (Figures 4B–G), and especially in the CDW/mCDW layer where water masses are more stable. Two fronts are clear in the temperature-salinity diagrams along some transects, e.g. 55°E and 75°E, whereas other transects only exhibit one clear front, e.g. 60°E and 70°E.
Frontal locations are found in Table 2 and are shown in Figures 6, 8 (white dashed lines). In all six transects, the SACCF and SB are found between 63°S and about 65.5°S. The SACCF is always farther north than the SB, by definition, and the distance between the two fronts varies; they can be separated by nearly 200 km (e.g. along 60°E) or be located between the same two stations (e.g. along 80°E).
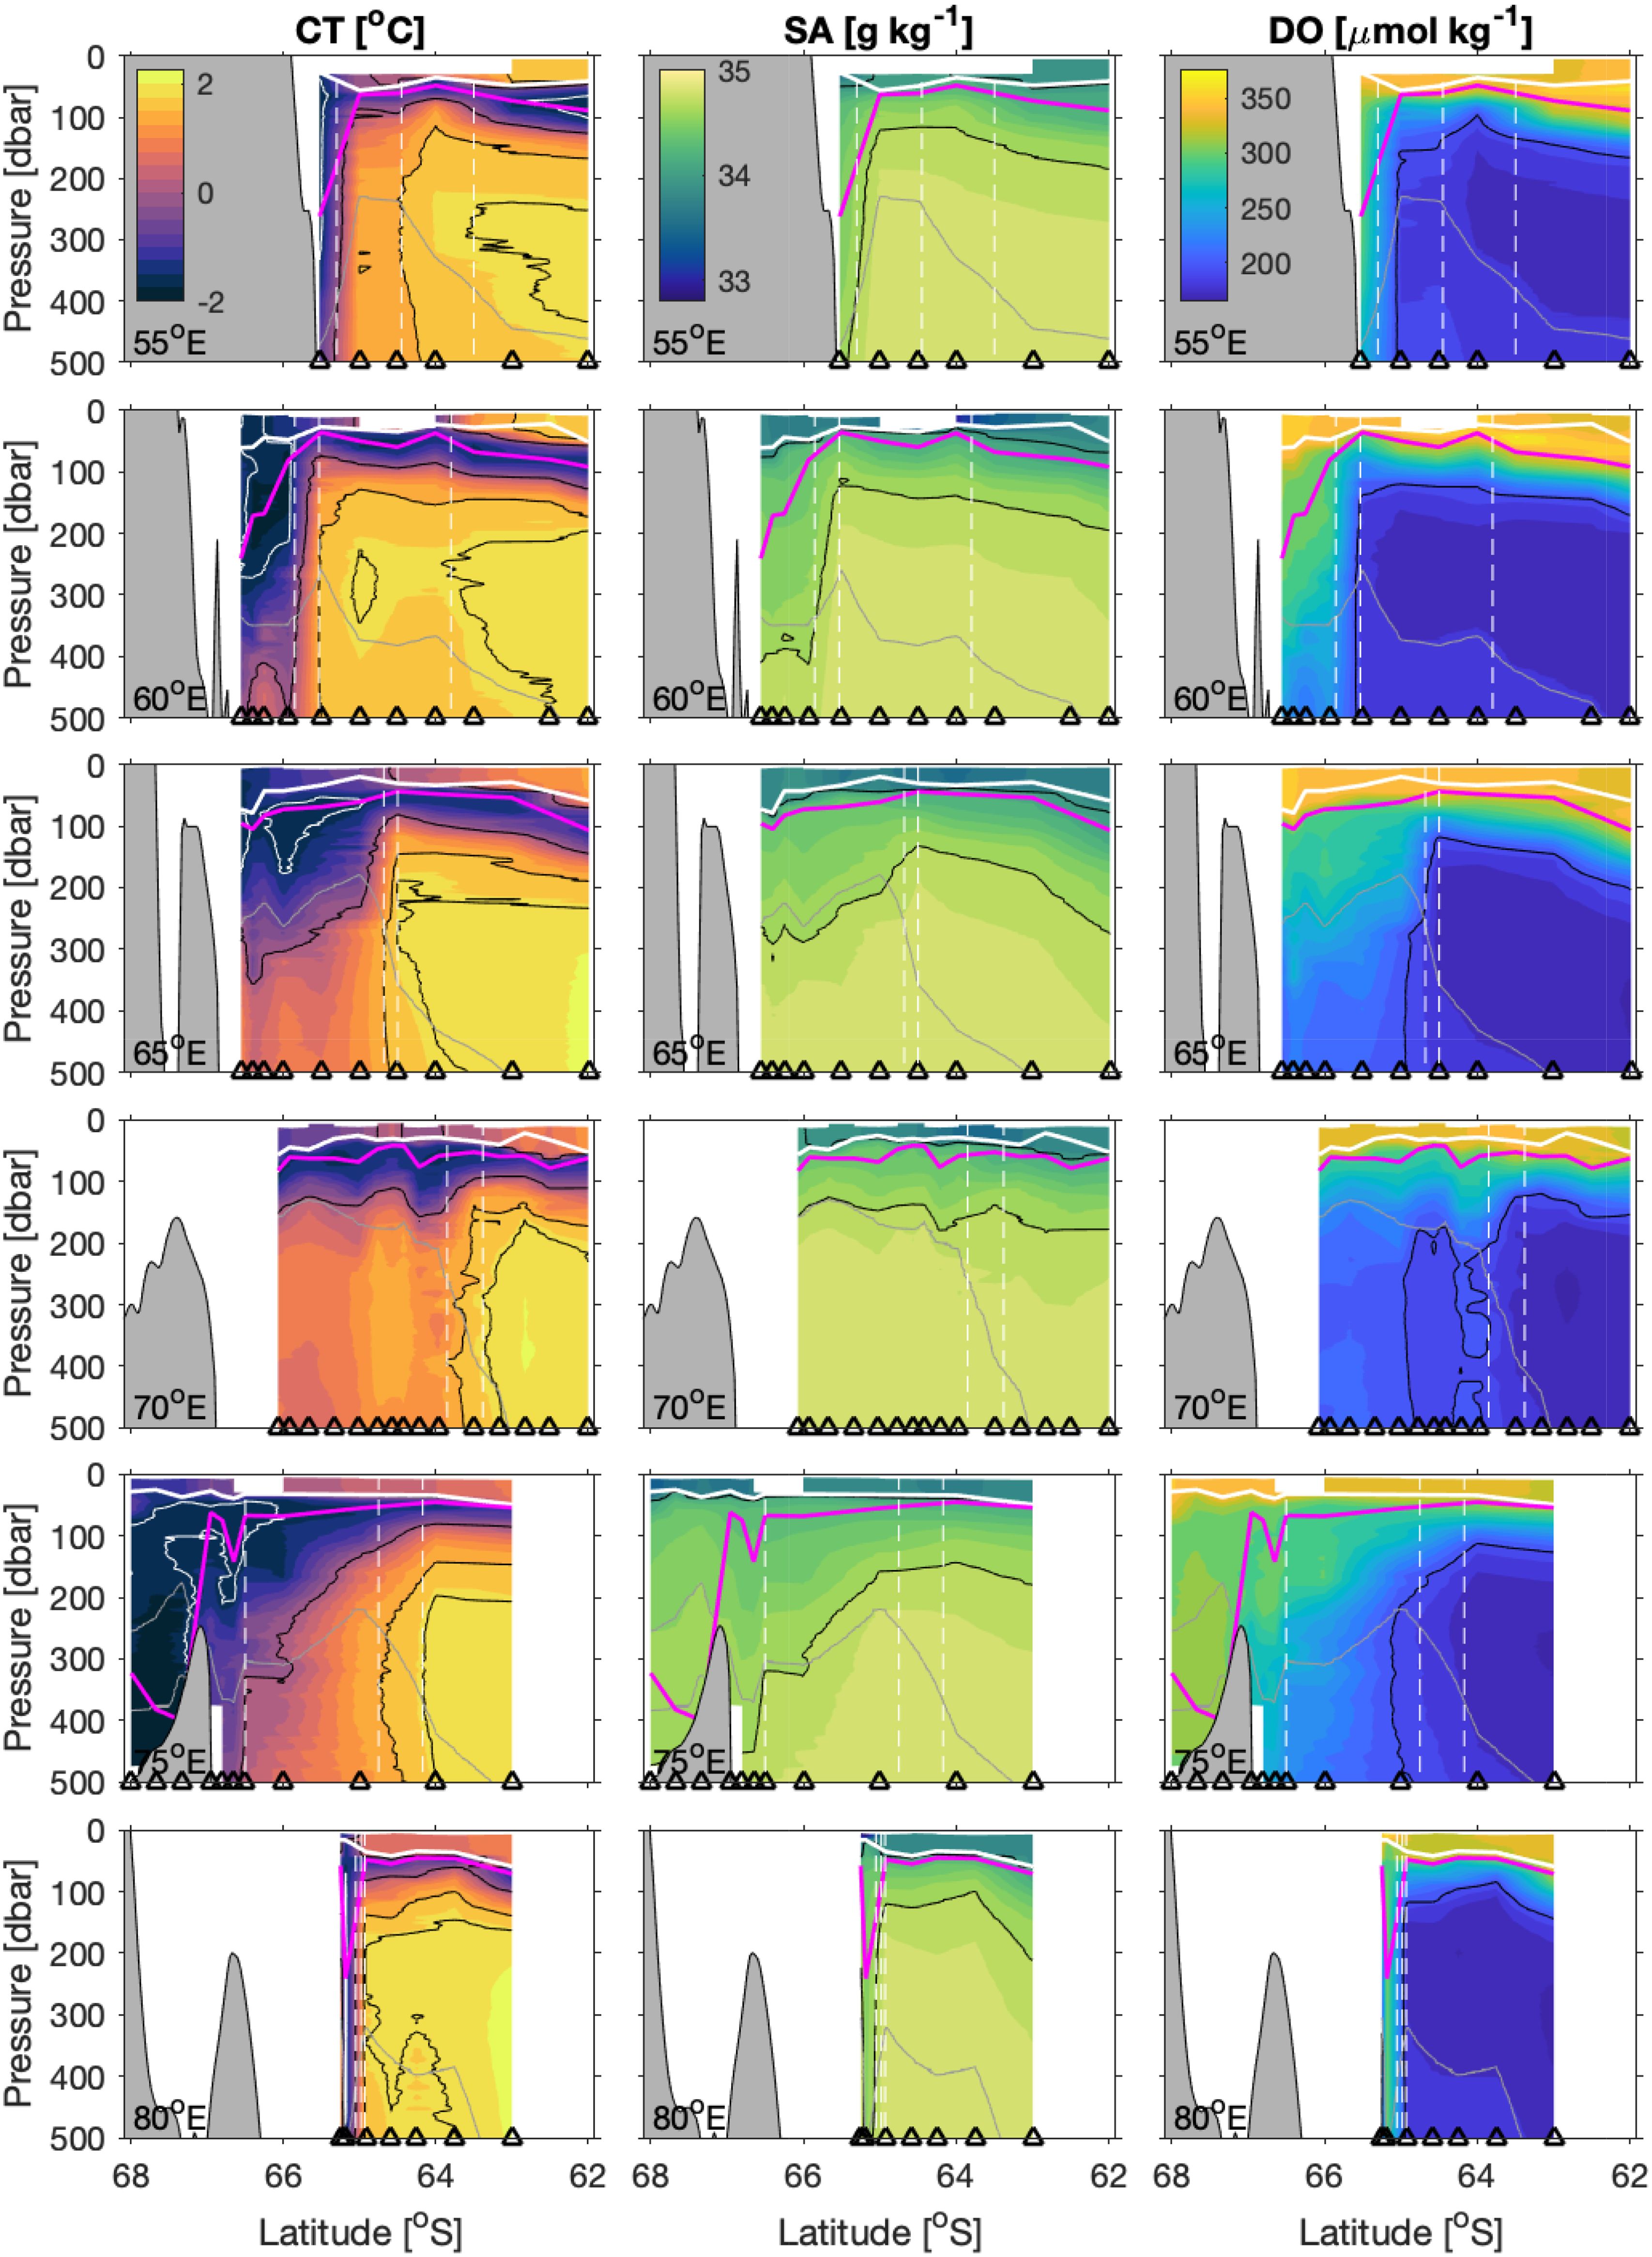
Figure 8. Upper-ocean CTD data – temperature (left), salinity (center), and dissolved oxygen (right) – along the six transects. The transects are ordered with the western-most transect along the top row and eastern-most transect along the bottom row, with longitude denoted in bottom left corner. CT is contoured every 0.25°C, with the 0°C, 1.5°C, and 1.8°C isotherms as thin black lines and the -1.6°C as a thin white line; SA every 0.1 g kg−1, with the 34 and 34.7 g kg−1 isohalines as thin black lines; and DO every 10 µmol kg−1, with the 200 µmol kg−1 contour as a thin black line. Mixed-layer depth is shown by the thick white line and temperature minimum by the thick magenta line. Gray lines represent the γN = 28.0 and 28.3 kg m−3 isopycnals (note the denser isopycnal only present along 75°E). Vertical dashed lines, from north to south, represent the Southern ACC Front, Southern Boundary, and Antarctic Slope Front (if sampled). The triangles along the bottom indicate station locations.
The SACCF is considered the southern limit of the Antarctic Circumpolar Current’s eastward flow, while the SB is the southern limit of the CDW in the meridional overturning circulation (Orsi et al., 1995). Therefore, we expect enhanced zonal flow at the SACCF and not at the SB. Figure 9 shows the zonal velocity in the upper ocean along the six transects. Note that the SADCP data shown here is measured while on station, and does not reflect continuous measurements along the entire transect. In general, there is a relatively strong eastward velocity at, or near, the SACCF, with speeds greater than 0.1 m s−1. This is evident along 65°E and 75°E. However, along 60°E, the SACCF is co-located with weak westward flow. Figure 8 shows that there is an eddy found along 60°E, seen as a detached closed contour in the temperature field near 65°S. This warm-core eddy is associated with anticyclonic circulation, i.e. westward flow to its north and eastward flow to its south. The westward flow of the eddy is therefore likely acting to reduce the eastward flow of the SACCF and the zonal velocity seen along 60°E reflects the interaction of this eddy with SACCF (Figure 9).
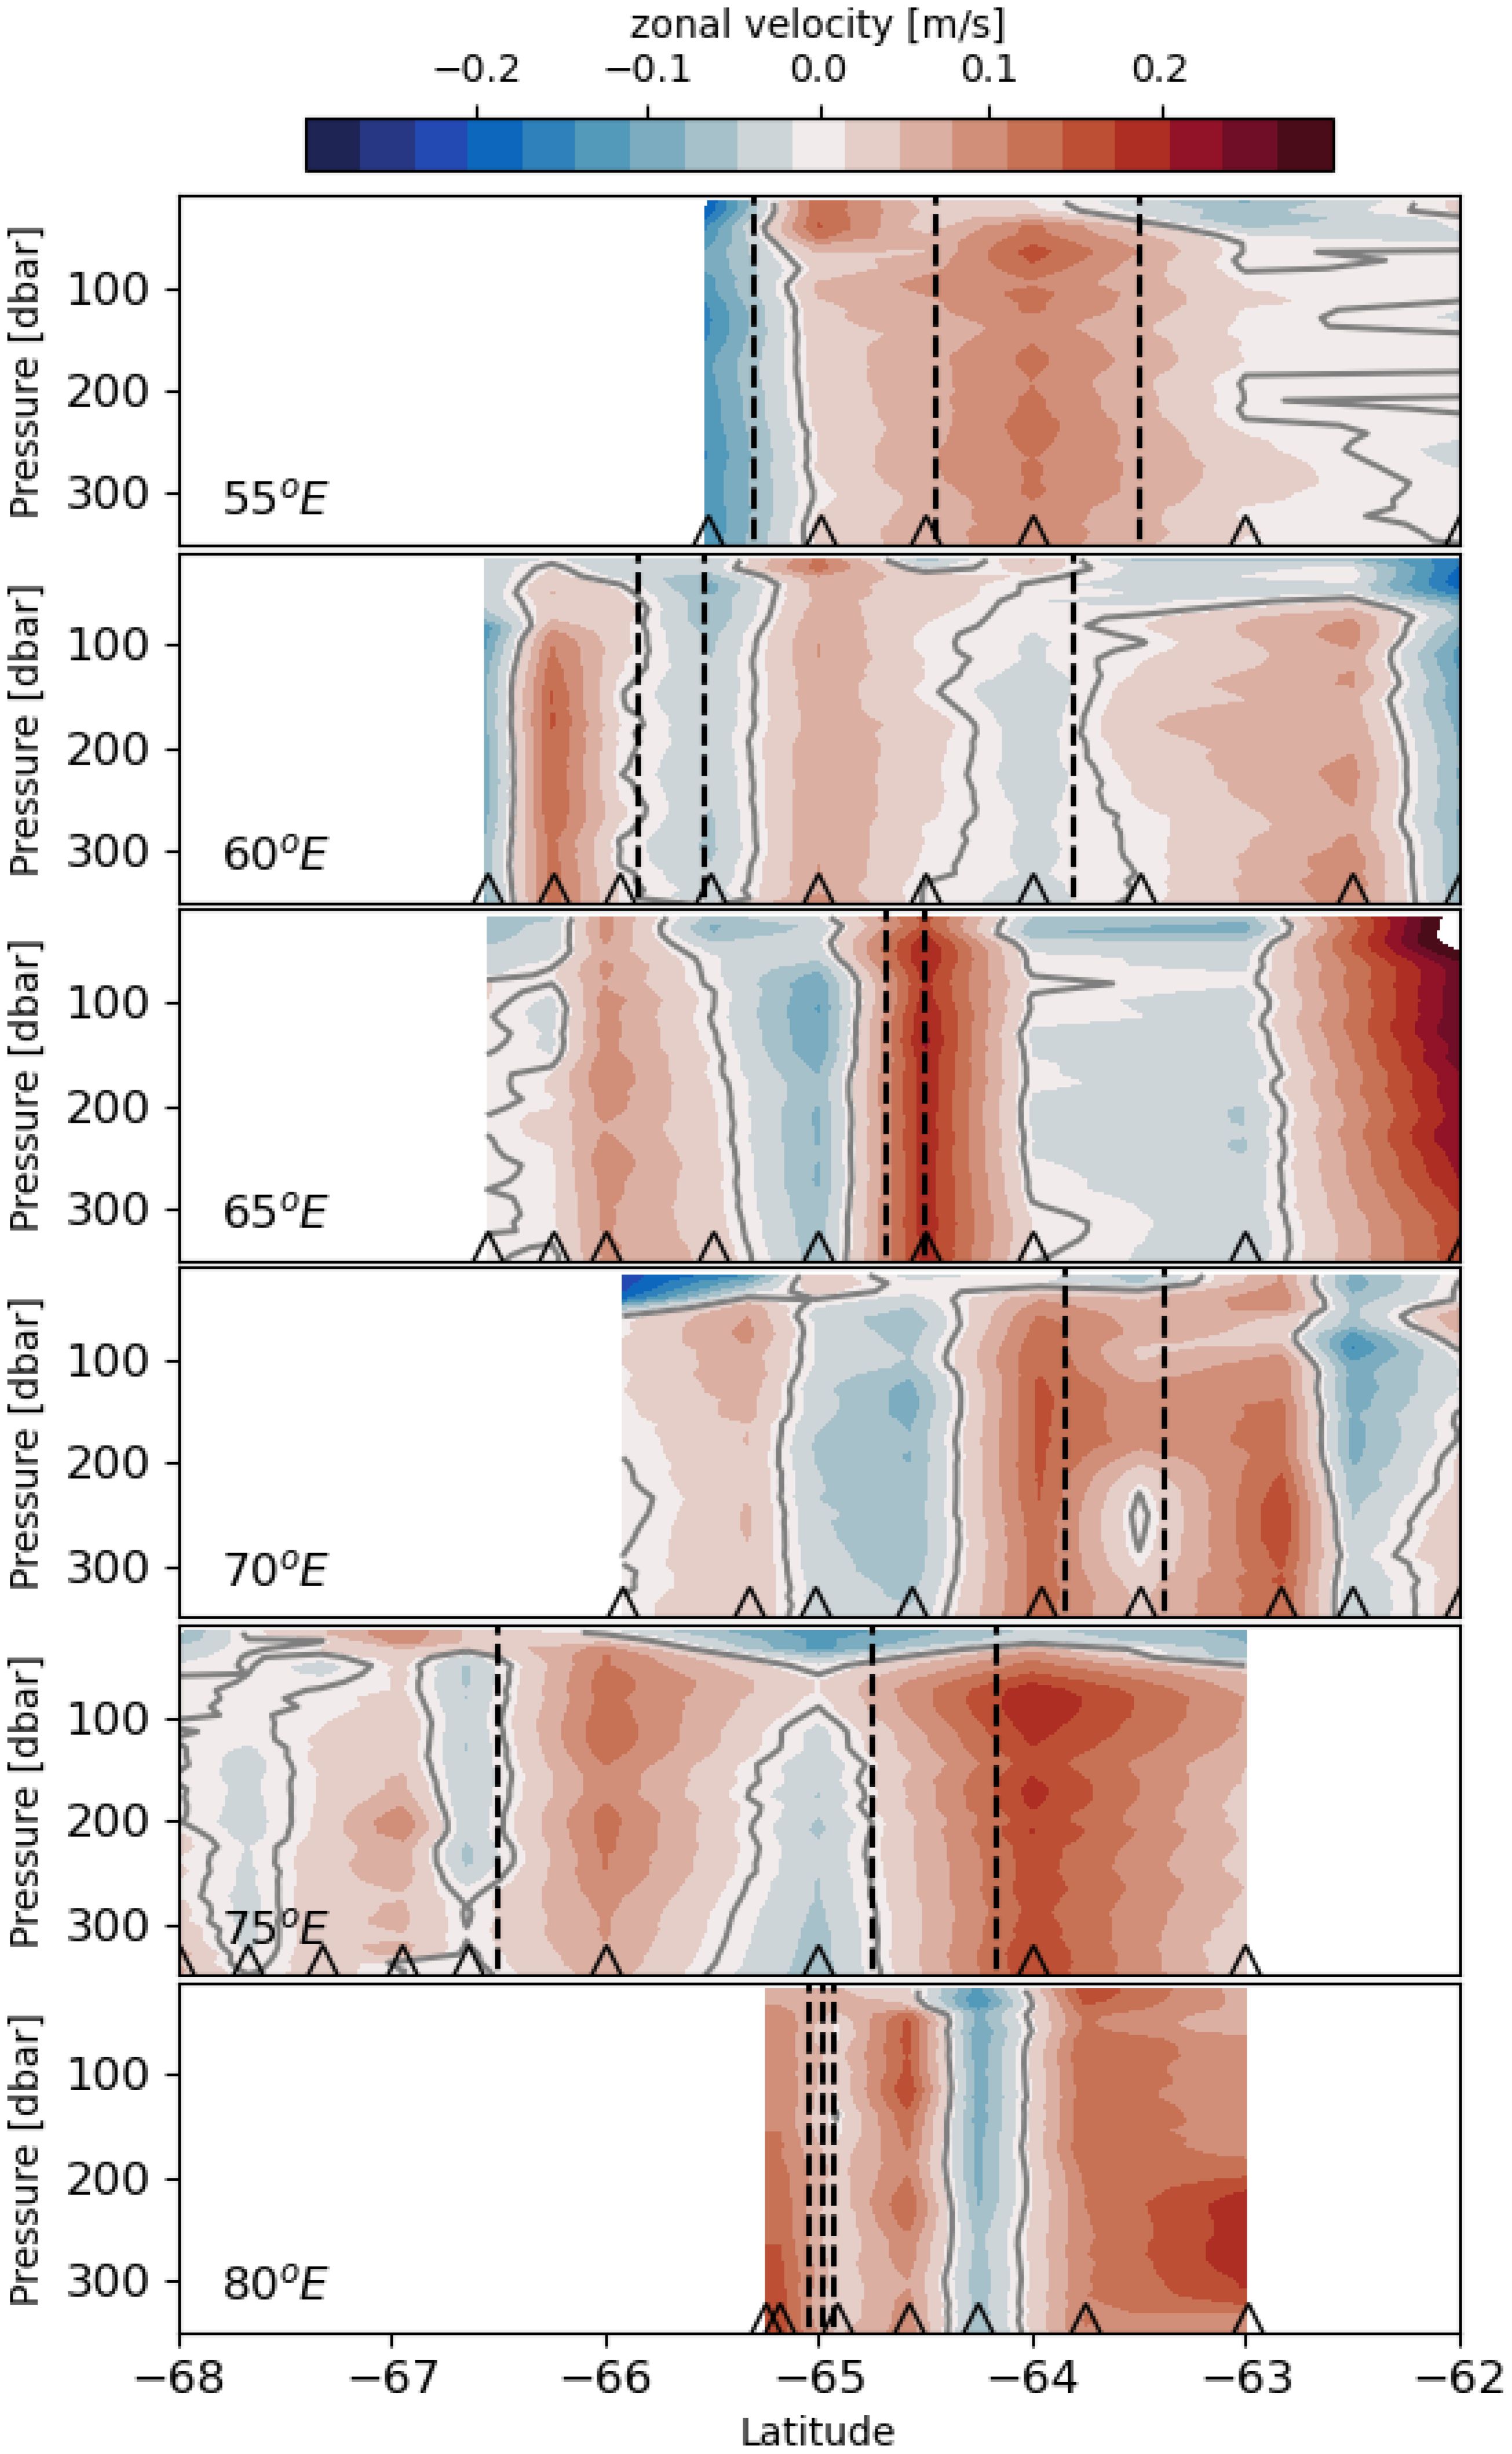
Figure 9. Zonal velocity in the upper ocean (upper 350 m) as measured by the shipboard ADCP while on station. Frontal locations are shown as dashed black lines. The grey line marks the zero contour. Vertical dashed lines, from north to south, represent the Southern ACC Front, Southern Boundary, and Antarctic Slope Front (if sampled). The triangles along the bottom indicate station locations. Note that the SADCP was only on and measuring velocities while on station, not during transit between stations.
The ASF-N and ASF, defined as the location where the subsurface 0°C isotherm reaches 200 m and 400 m, respectively, are found farther south between roughly 65°S and 66.5°S (Table 2). The ASF and ASF-N were not sampled on the 70°E transect; nor was the ASF sampled on 65°E. Note that the ASF and ASF-N are generally located in between the same stations, indicating a strong horizontal (north-south) temperature gradient extending throughout the upper ocean. The exceptions are along 65°E, where there is a strong horizontal temperature gradient associated with the ASF-N near 64.9°S, yet the 0°C isotherm doesn’t reach 400 m within our survey; and along 75°E, where the 0°C isotherm gradually descends poleward across about 2° of latitude (Figure 8).
The ASF is often associated with the westward flowing Antarctic Slope Current (ASC), that is generally found hugging the shelf break towards the southern flank of the ASF (e.g., see Figure 6 of Meijers et al., 2010). We find relatively strong westward flow at 55°E, with speeds of about 0.1 m s−1 (Figure 9). Along 75°E, there is weak westward flow at the ASF. Note that Meijers et al. (2010) found a strongly bottom-intensified ASC at 70°E, with much stronger westward flows at depth than near the surface. The weak upper-ocean speeds (around 0.05 m s−1) observed at 75°E in BROKE-West by Meijers et al. (2010) are similar to those seen here at 70°E in Figure 9. Along 60°E and 80°E, we did not reach the shelf break (see Figure 6), and therefore likely did not survey far enough south to measure the ASC.
3.4 Upper-ocean variability
The development of the upper ocean structure in the seasonal ice zone is described by Williams et al. (2010) as follows. During winter, strong convection due to brine rejection creates a deep mixed layer. As summer approaches and the sea ice melts, the surface layer freshens and warms, and a seasonal mixed layer is formed above a layer of remnant Winter Water (WW). Those authors identified two features in the upper ocean that are important for setting the summertime stratification: the seasonal mixed layer depth (MLD) and the base of the WW, or temperature minimum, layer. The latter which is generally associated with the permanent pycnocline and the former with the seasonal pycnocline (or thermocline). Here, we discuss the characteristics of the seasonal mixed layer and underlying WW in the TEMPO survey. Note that we only present data from stations north of the ASF-N, where the summer stratification is well developed and there is a clear signature of the summertime stratification with a seasonal mixed layer overlying a distinct temperature minimum layer.
Mixed-layer depths (MLD) are shown by the white lines in Figure 8. MLD is defined as the depth at which neutral density is 0.03 kg m−3 greater than its near-surface value, following de Boyer Montégut et al. (2004). Here, we use 15 dbar as the near-surface reference level, except in the few cases where the profile starts deeper we use the top of the profile. Figure 10A shows MLD at stations north of the ASF-N in plan view over the survey region. The average MLD north of the ASF-N is 38 ± 10 m (mean ± 1 standard deviation), and values range from approximately 20-60 m deep. The deepest mixed layers are generally found at the northern end of the transects (Figure 8, white line), where the surface ocean has been ice-free the longest. Yet, relatively deep mixed layers are also found just north of the ASF-N along 55°E and 70°E.
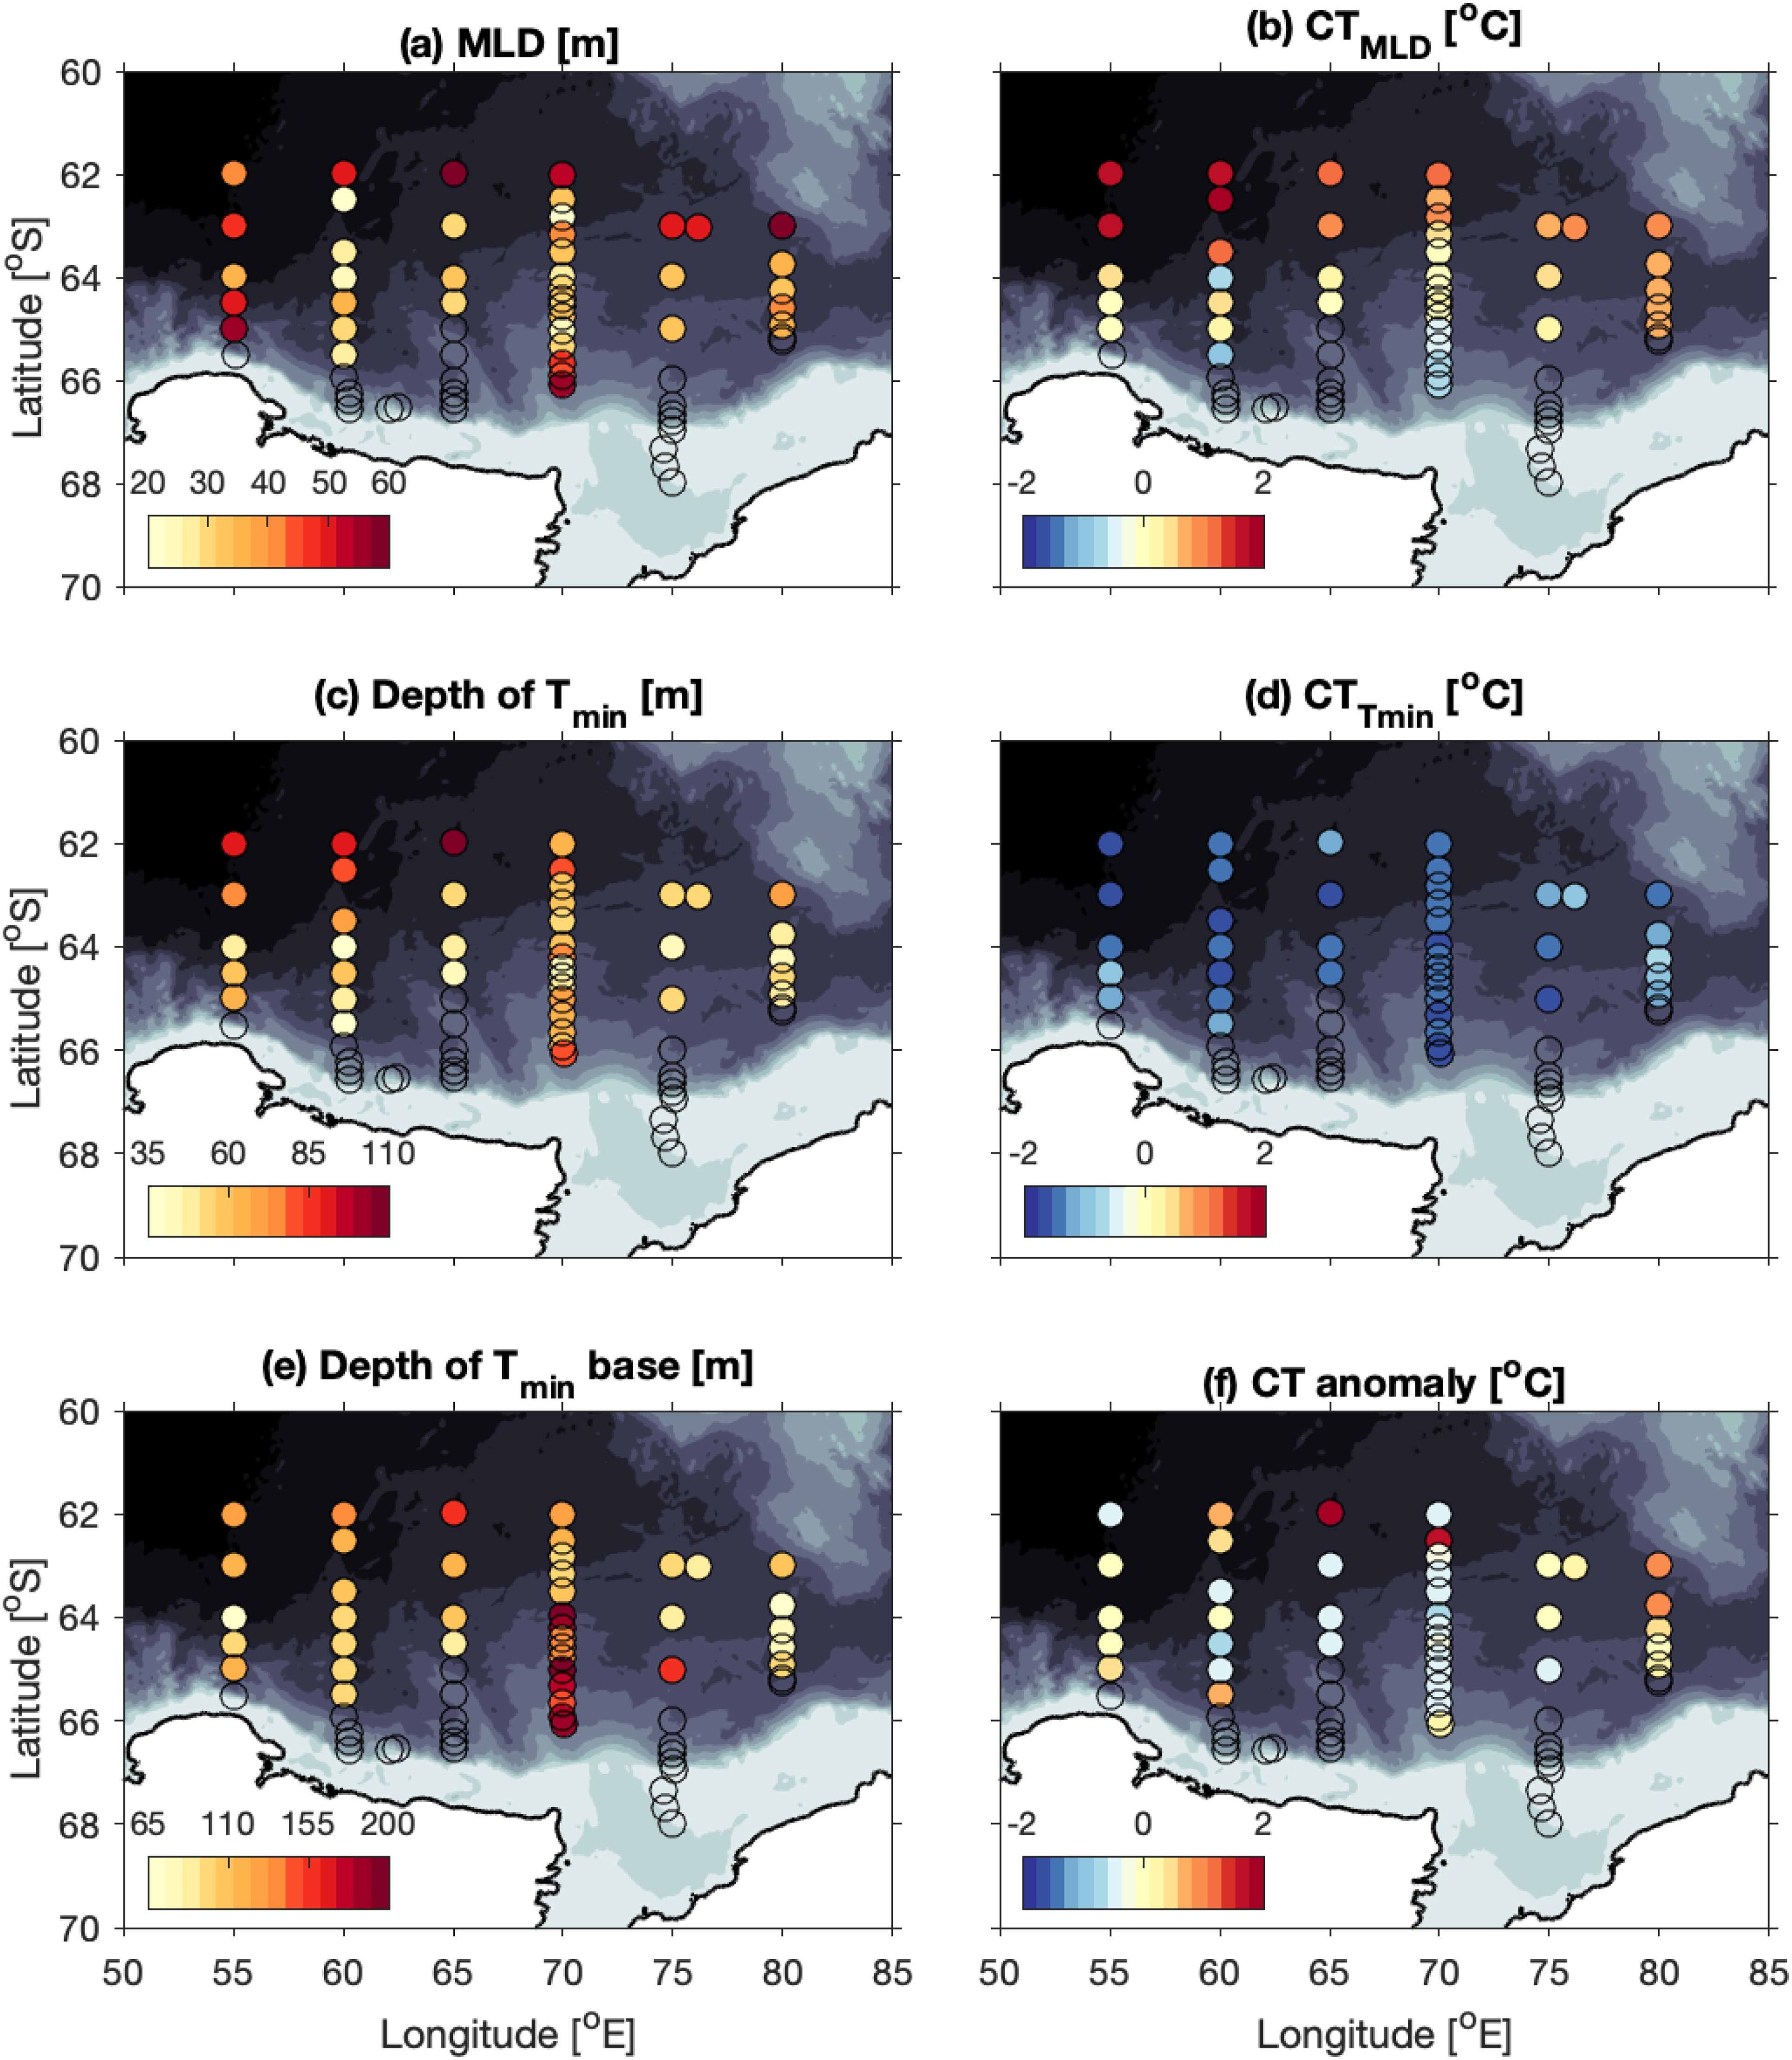
Figure 10. Upper-ocean characteristics. (A) Mixed layer depth, MLD [m]; (B) mean temperature in the mixed layer [°C]; (C) depth of the temperature minimum [m], indicative of the depth of the core of Winter Water; (D) minimum temperature [°C], indicative of the temperature at the WW core; (E) depth of the base of the temperature-minimum, or WW, layer [m]; (F) temperature anomaly [°C] at the mean depth of the WW core across the survey, with warm anomalies indicative of localized upwelling. Note that these maps only show data from stations north of the ASF (stations south of the ASF-N are shown as open circles.
Across the survey region, the average temperature in the mixed layer, , generally decreases to the south (Figure 10B), as clearly seen along 70°E. The largest exception is on the 60°E transect, where the station at 64°S is colder than the two stations to the south of it. Note that this station is found to the north of the warm-core eddy observed along this transect and the cold anomaly may be associated with the anticyclonic circulation of the eddy bringing cooler waters up from the south. The warmest seasonal mixed layers are found in the northwest corner of the survey region, where > 1.5°C.
The WW core, i.e. depth of the temperature minimum, generally deepens to the north (Figure 10C). The WW core is deepest in the northwest corner, with temperature minimum depths here being greater than 80 m. On average, the temperature minimum is -1.38 ± 0.22°C. The WW layer is warmest at the southern end (i.e. immediately north of the ASF-N) along 55°E and 80°E, reaching temperatures greater than -1°C (Figure 10D) whereas on other lines, the core of the WW cools to the south (i.e. 70°E and 75°E). The base of the WW layer – defined as the 0°C isotherm below to the temperature minimum – is notably deeper along the southern portion of 70°E (150-200m) than elsewhere (Figure 10E).
Williams et al. (2010) use temperature anomaly at 100 m depth as a proxy for local upwelling. Here, we consider the temperature anomaly at the mean depth of the WW core (60 m) and the temperature anomaly is therefore calculated from the mean temperature at 60 m across the survey region (-1.005°C). Relatively warm water in Figure 10F highlights areas where the water at the mean WW core is warmer than the survey average. There is a strong signal of anomalously warm water along 80°E. This, along with the depth of the WW base being relatively shallow there (Figure 10E), suggests localized upwelling at 80°E. There is some variability in the depth of the WW base along 70°E, with a shoaling of the WW base near 65°S, associated with warmer water at the mean WW core. The temperature field along 70°E shows the presence of a subsurface eddy here composed of CDW/mCDW (anomalously warm and low DO; Figure 8), associated with the upwelling and shoaling of isopycnals locally in the surface layers.
3.5 Deep-ocean variability
Figure 11 shows the bottom properties of each full-depth CTD cast located in waters deeper than 500 m. Overall, there is an east-west pattern with colder, fresher, and more oxygen-rich waters found along the western transects (55-65°E) than the eastern transects (70-80°E). This illustrates the disparity in the two flavors of AABW in this region, with older AABW in the eastern part of the survey and newly formed AABW – likely formed locally in the Cape Darnley Polynya (Ohshima et al., 2013) – in the western part of the survey. Note that stations on the shelf along 75°E (not shown) had even higher DO concentrations (DO > 300 µmol kg−1) as these shelf waters are actively ventilated through interactions with the atmosphere.
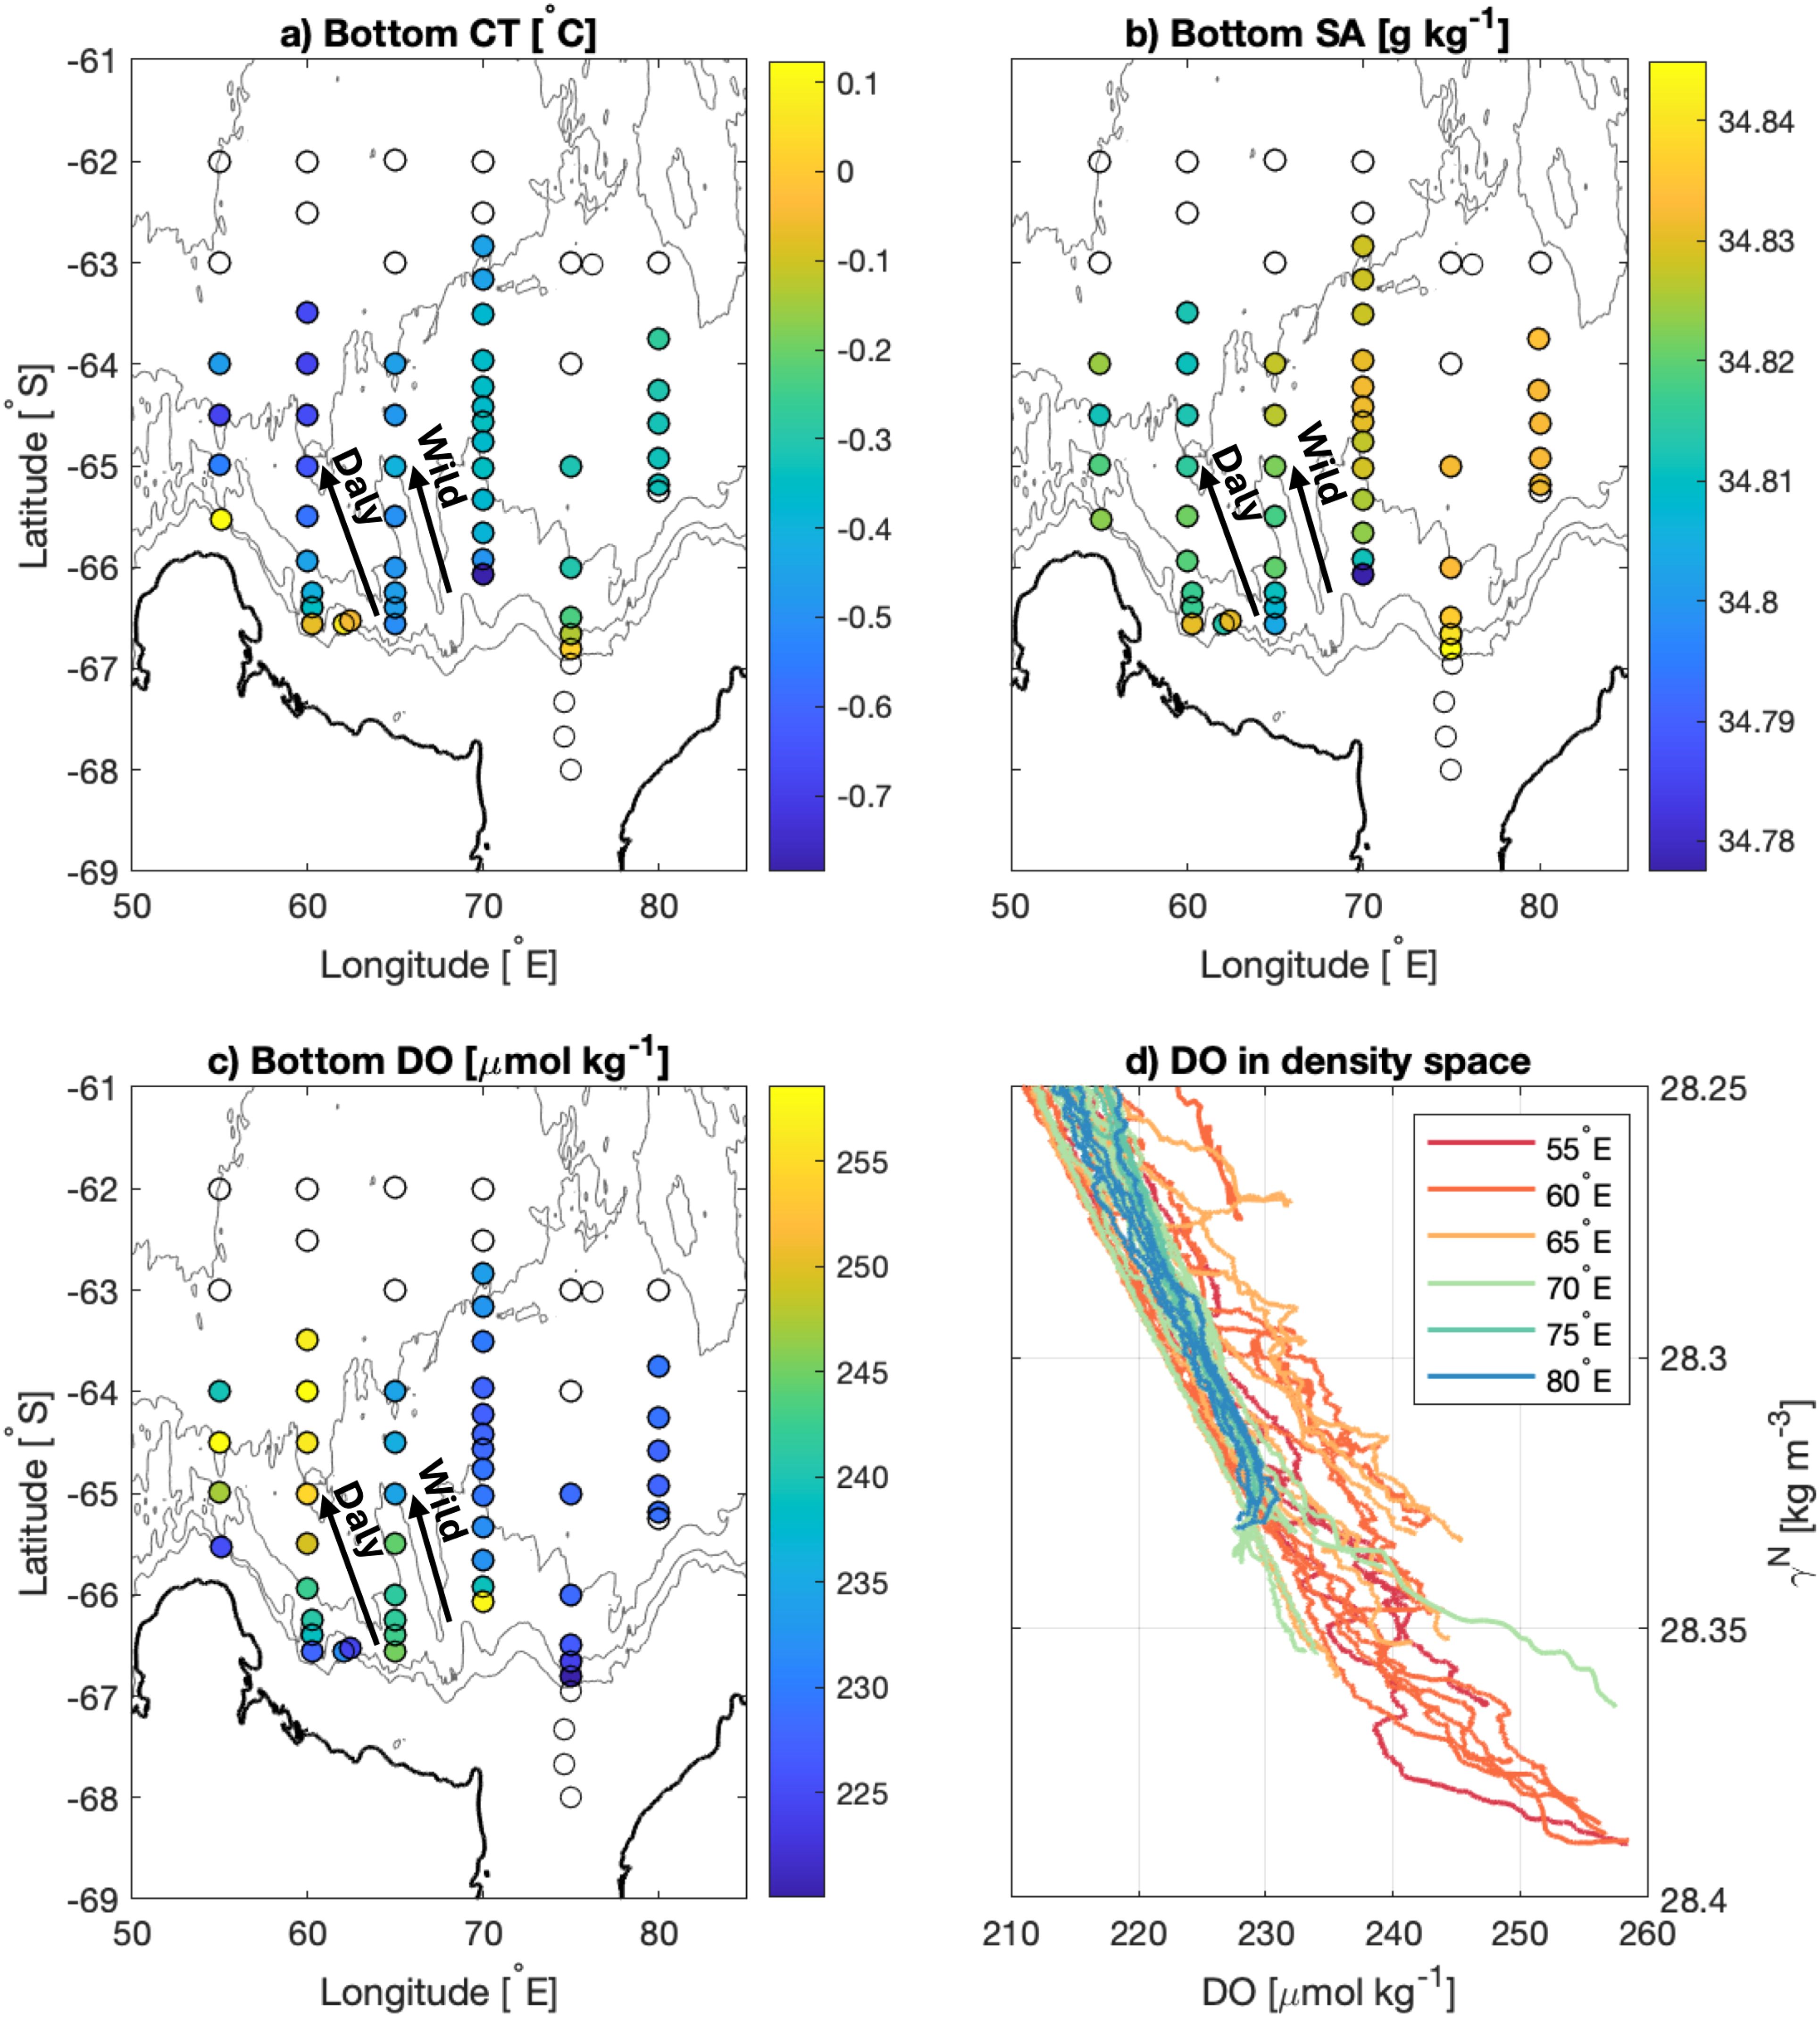
Figure 11. Bottom properties. (A) Conservative temperature [CT, °C], (B) absolute salinity [SA, g kg−1], and (C) dissolved oxygen concentration [DO, µmol kg−1] at the deepest point of the CTD profile. (D) Bottom of the DO profiles as a function of neural density [γN, kg m−3]. For all panels, only information from full-depth profiles off the shelf (i.e. with maximum pressures greater than 500 dbar) are shown. The Wild and Daly Canyons are shown schematically with arrows.
The most oxygen-rich bottom waters (DO > 250 µmol kg−1) are found in the deep ocean along 60°E and at the southern end of 70°E (Figures 11C, D). There is also a single station near the 4000-m isobath on 55°E with higher DO relative to its neighboring stations. The oxygen-rich waters at these stations are also colder and fresher than surrounding waters (Figures 11A, B) and trace the pathway of AABW from the Cape Darnley Polynya into the abyssal ocean.
These results indicate the main AABW export pathway from the Cape Darnley Polynya to be through the Daly Canyon, as the bottom waters near its base are highly oxygenated, and more oxygenated than the bottom waters at the base of the Wild Canyon to its east. It appears some Dense Shelf Water might spillover of the shelf break near 70°E, as there are also highly oxygenated waters deeper than 2000 meters there. Note that the enhanced DO at the station on 55°E (DO> 250 µmol kg−1 in water about 4300 m deep) is comparable to the DO concentrations in the deep ocean along 60°E. This suggests the AABW on 55°E was potentially funneled locally into the abyssal ocean, likely through a narrow canyon west of the Daly Canyon (as stations to its north and south show lower DO concentrations).
4 Discussion and conclusions
A shipboard oceanographic survey of the greater Prydz Bay region was conducted in the austral summer 2021 (January-March) as part of the ‘Trends in Euphausiids off Mawson, Predators and Oceanography’ (TEMPO) study undertaken on the R/V Investigator. This paper characterizes the regional water masses and circulation from direct measurements of physical and biogeochemical properties, and upper-ocean horizontal velocities. We describe the spatial variability of the upper-ocean and features important for setting the summertime stratification that, in turn, have a strong influence on regional primary productivity. Observations of deep ocean properties also provide insights regarding AABW formation and export pathways.
The fronts of the Southern Ocean separate the warmer waters to the north from the colder waters around Antarctica, acting as a barrier to poleward heat transport. Thus, a southward shift in the location of the fronts is associated with warm water moving south and impinging into the Antarctic margins, with implications for heat available for transport onto the shelf and basal melting of Antarctic Ice Shelves (e.g. Herraiz-Borreguero and Naveira Garabato, 2022). While the SB has widely been found to be trending southward, the location of the ASF has recently been posited to have shifted north in parts of East Antarctica Yamazaki et al. (2024). However, those conclusions only consider two surveys, more than 20 years apart, making a long-term trend tenuous in light of frontal meandering. It is well observed that Southern Ocean fronts meander latitudinally and can span 1-2 degrees of latitude at some locations (e.g. Sokolov and Rintoul, 2002).
Figure 1 shows the locations of the fronts observed during TEMPO in 2021 relative to the locations observed during the 2006 BROKE-WEST survey by Meijers et al. (2010) and in the historic climatology of Orsi et al. (1995). The longitudinal resolution of the CTD transects of TEMPO was twice that of BROKE-West (every 5°E compared to every 10°E), allowing for a greater detail in understanding the frontal structure and meandering. We find the SACCF entering the survey region earlier (i.e. intruding into the south farther west) than during BROKE-West and with a meander northward near 70°E that was not previously observed. At both 60°E and 80°E, we find the SACCF more than 1.5 degrees of latitude (over 150 km) farther south than documented by Meijers et al. (2010) and Orsi et al. (1995); it was found at a similar latitude to both previous studies at 70°E. The SB in 2021 was similar to its position during BROKE-West, with both surveys documenting a more northerly position along 70°E, by 1-2° latitude, than its position in the Orsi et al. (1995) climatology (Figure 1). This is likely due to the northward flow of the greater Prydz Bay Gyre, as suggested by Meijers et al. (2010). Note that there was a dearth of hydrographic data to support the early Orsi et al. (1995) climatology in this vicinity (see their Figure 2), potentially forcing interpolation across the Prydz Bay Gyre region.
The ASF was identified at roughly similar locations during TEMPO and BROKE-West (Figure 1). Note here that we have revisited the BROKE-West CTD data (available at 60, 70, and 80°E) and recalculated the ASF locations using the refined definition for consistency between surveys. The largest difference in ASF location was observed at 80°E, where the front was identified roughly 60 km farther north in 2021 compared to 2006. At 70°E, where sea ice prohibited the 2021 TEMPO survey from going beyond 66°S, the TEMPO survey did not encounter the ASF or ASF-N; that is, both were located south of this latitude. Therefore, both were located farther south in 2021 relative to their 2006 position, being 65°S (ASF-N), and 66°S (ASF), respectively (again, applying our refined ASF-N definition to BROKE-West data). These observed displacements of the ASF in 2021 relative to 2006 are likely due to frontal meandering, and associated eddy variability (e.g. Foppert et al., 2019), yet we cannot rule out a long-term change in frontal position as suggested by Yamazaki et al. (2024).
In the BROKE-West survey, Williams et al. (2010) found that mixed layer depths varied both meridionally and zonally within their survey area (average 29 ± 15 m; 30-80°E). Mixed layer depths were influenced by the number of ice free days, combined with accumulated wind stress once the ice had melted leading to exposure. Stations that had less ice free days had less time for mixed layer development, with the mixed layer also being cooler due to a higher proportion of ice and less time for warming from solar radiation. For BROKE-West, shallowest mixed layers were observed to the south near the retreating ice edge, and to the west where sampling was conducted earlier leading to shorter ice-free days compared to the east. In contrast, TEMPO mixed layer depths averaged 38 ± 10 m, with no obvious pattern across the survey area apart from the most northerly stations generally having deeper mixed layers (Figures 8, 10A). However, the TEMPO survey was conducted approximately a month later than BROKE-West, which meant that mixed layer depths had more time for development and influences from wind events. TEMPO mixed layer depths were most similar to eastern stations from BROKE-West (36 ± 15 m Legs 7-9, Westwood et al., 2010) which were conducted at a similar time in the season. Average temperatures within the mixed layer were also cooler to the south for TEMPO, similar to BROKE-West. Noticeably deeper mixed layers were found along 65°E compared to other eastern transects during BROKE-West, which was associated with a convergence of ocean circulation in this region Williams et al. (2010). However, this was not observed during the TEMPO survey.
Through the use of potential temperature anomalies, both the BROKE-West and TEMPO surveys showed evidence of localized upwelling of MCDW/CDW along 80°E in the area north of 64°S (north of the SACCF and SB). The upwelling of CDW is associated with increased nutrient availability to surface waters, including iron (Moreau et al., 2019; Smith et al., 2021), which may stimulate primary production (Westwood et al., 2010). While elevated values of surface chl-a are seen in this region in February (Figure 2A), Heidemann et al. (2024) showed that primary production in this region during TEMPO was noticeably lower than elsewhere within the survey, based on in-situ phytoplankton pigment data. However, large krill swarms and feeding whales (approximately 50) were observed in this region (M. Cox and S. Kawaguchi, pers. comm. March 2021), suggesting high production in terms of secondary and higher order predators. Heidemann et al. (2024) further showed strong evidence that the phytoplankton in this region had been grazed by krill, with clear depletion of large diatoms in surface waters and high phaeophytin:chlorophyll-a ratios (> 0.75; Wright et al., 2010). It is likely that high primary production here earlier in the season (February) was sustained through upwelling of nutrient-rich CDW and that the phytoplankton were grazed down by the time the TEMPO survey arrived at the eastern end of the survey (March).
A large phytoplankton bloom was observed on the slope and offshore along 70°E to 80°E, south of the SB (Heidemann et al., 2024). These southerly waters generally had a cold mixed layer and cold WW temperatures (i.e. cold minimum temperatures). We speculate that the influence of the West Ice Shelf and associated sea ice, and the cold shelf waters exported from Prydz Bay, is extended offshore via advection associated with the Prydz Bay Gyre circulation. Heidemann et al. (2024) showed this bloom to be late phase (high iron depletion i.e., high Si:N and high phaeo:chl ratios) suggesting these waters coming from the West Ice Shelf region may originally have been iron rich, to support the high phytoplankton biomass bloom still evident during the survey period. Another distinct bloom was observed north of the sACCF across 55°E to 65°E (Heidemann et al., 2024). This bloom may have had its origins farther west, and there was evidence of large diatoms sinking from surface waters to below the mixed layer as waters flowed from west to east.
The characteristic concentrations of DIC, TA, and nutrients observed during the TEMPO surveys are broadly consistent with the earlier BROKE-West survey (Roden et al., 2016). As described above, biological activity over the shelf and slope, along with input of freshwater from sea ice melt, resulted in low concentrations of DIC in the upper ocean, associated with AASW. The TEMPO observations indicated minimum surface concentrations of ≈2070 µmol kg−1, which is slightly lower than the minimum observed during the BROKE-West survey, as is the TA, though the density and temperature criteria used to define water masses also differed slightly (Roden et al., 2016). The conservative relationship between salinity and TA in the TEMPO observations is consistent with the BROKE-West observations, and while quantification of anthropogenic carbon accumulation in the deeper water masses (i.e., CDW and AABW) goes beyond the scope of the work presented here, the TEMPO observations do indicate characteristic concentrations of DIC in the deep ocean that are elevated relative to BROKE-West survey which occurred 15 years earlier.
We observed newly formed AABW concentrated along 60°E, at the base of the Daly Canyon, with considerably higher oxygen values there relative to farther east at 65°E (Figure 11). High oxygen waters were also found along 60°E during the BROKE-West survey (Meijers et al., 2010), however they did not survey 65°E and therefore could not make the distinction of where the newly formed AABW entered the deep basin. This recent oxygenation is indicative of Cape Darnley Bottom Water, formed locally in the Cape Darnley Polynya (Ohshima et al., 2013). While we cannot trace a continuous AABW pathway back to the shelf, Figure 11 strongly implies that the Dense Shelf Water is entering the deep basin mainly via the Daly Canyon, as opposed to the Wild Canyon (as suggested by mooring data in Ohshima et al., 2013). Gao et al. (2022) observed warming, freshening, and increasing dissolved oxygen in the Daly Canyon between 2003-2006 and 2013–2020, and attributed those changes to increased cascading of Dense Shelf Water plumes down Daly Canyon. Those results, along with the results shown in Figure 11, suggest the main pathway of Dense Shelf Water from Cape Darnley into the abyss is potentially shifting from the Wild to the Daly Canyon.
Data availability statement
The datasets presented in this study can be found in online repositories. The CTD, nutrient, and SADCP data used for this study can be found in the MNF Data Trawler https://www.cmar.csiro.au/data/trawler/survey_details.cfm?survey=IN2021_V01. Carbon data is available through personal communication with E. H. Shadwick. All environmental data (sea ice concentrations, surface cholorphyll-a, sea surface temperature, and bathymetry) are all publicly available. Monthly SIC data from the Nimbus-7 SMMR and SSMI/SSMIS passive microwave sensors were downloaded from the National Snow and Ice Data Center (http://nsidc.org; Cavalieri et al., 1996). Monthly surface satellite Chla were obtained from the European Space Agency (ESA) Globcolour website (https://www.globcolour.info/). Data consist of case 1 merged product from the SeaWiFS, MODIS-Aqua, VIIRS and MERIS sensors.
Author contributions
AF: Conceptualization, Data curation, Formal analysis, Investigation, Methodology, Visualization, Writing – original draft, Writing – review & editing. SB: Conceptualization, Data curation, Formal analysis, Investigation, Methodology, Visualization, Writing – original draft, Writing – review & editing. ES: Conceptualization, Data curation, Formal analysis, Investigation, Visualization, Writing – original draft, Writing – review & editing. AK: Visualization, Writing – review & editing. CV: Investigation, Writing – review & editing. GL: Visualization, Writing – review & editing. KW: Formal analysis, Investigation, Methodology, Project administration, Resources, Supervision, Writing – original draft, Writing – review & editing.
Funding
The author(s) declare financial support was received for the research, authorship, and/or publication of this article. This work was funded by the Australian Antarctic Program Partnership – a partnership of Australia’s leading Antarctic research institutions supported by the Australian Government Antarctic Science Collaboration Initiative. This project was also supported and funded by Australian Antarctic Science Project 4512 and 4636, and received financial support from Pew Charitable Trust and Antarctic Science Foundation. We acknowledge the use of the CSIRO Marine National Facility (MNF, https://ror.org/01mae9353) and grant of sea time on RV Investigator in undertaking this work. GL and CV would like to thank the University of Tasmania and the Australian Research Council (ARC) Centre of Excellence for Climate Extremes (CE170100023) for their financial support.
Acknowledgments
We would like to thank chief scientist So Kawaguchi and deputy-chief scientist Rob King for leading the voyage, and Linda Gaskell for voyage management. We thank Abe Passmore and the CSIRO Carbon Lab for the analysis of DIC and alkalinity samples. The authors also thank the captain and crew of the R/V Investigator, and all those who supported the TEMPO survey both onboard and ashore. We acknowledge the use of the CSIRO Marine National Facility (https://ror.org/01mae9353) and grant of sea time on RV Investigator in undertaking this research.
Conflict of interest
The authors declare that the research was conducted in the absence of any commercial or financial relationships that could be construed as a potential conflict of interest.
Publisher’s note
All claims expressed in this article are solely those of the authors and do not necessarily represent those of their affiliated organizations, or those of the publisher, the editors and the reviewers. Any product that may be evaluated in this article, or claim that may be made by its manufacturer, is not guaranteed or endorsed by the publisher.
Footnotes
- ^ Blackensee, S. N., Gwyther, D. E., Galton-Fenzi, B. K., Gunn, K. L., Herraiz-Borreguero, L., Ohshima, K. I., et al. A review of the oceanography and Antarctic Bottom Water formation offshore Cape Darnley, East Antarctica. J. Geophysical Research: Oceans.
References
Arrigo K. R., Lowry K. E., van Dijken G. L. (2012). Annual changes in sea ice and phytoplankton in polynyas of the Amundsen Sea, Antarctica. Deep Sea Res. Part II: Topical Stud. Oceanography 71-76, 5–15. doi: 10.1016/j.dsr2.2012.03.006
Arrigo K. R., van Dijken G. L. (2003). Phytoplankton dynamics within 37 Antarctic coastal polynya systems. J. Geophysical Research: Oceans 108. doi: 10.1029/2002JC001739
Arroyo M. C., Shadwick E. H., Tilbrook B. (2019). Summer carbonate chemistry in the dalton polynya, east Antarctica. J. Geophysical Research: Oceans 124, 5634–5653. doi: 10.1029/2018JC014882
Banzon V., Smith T. M., Chin T. M., Liu C., Hankins W. (2016). A long-term record of blended satellite and in situ sea-surface temperature for climate monitoring, modeling and environmental studies. Earth System Sci. Data 8, 165–176. doi: 10.5194/essd-8-165-2016
Bates N. R., Hansell D. A., Carlson C. A., Gordon L. I. (1998). Distribution of CO2 species, estimates of net community production, and air-sea CO2 exchange in the Ross Sea polynya. J. Geophysical Research: Oceans 103, 2883–2896. doi: 10.1029/97JC02473
Bazzani E., Lauritano C., Saggiomo M. (2023). Southern ocean iron limitation of primary production between past knowledge and future projections. J. Mar. Sci. Eng. 11. doi: 10.3390/jmse11020272
Bestley S., Raymond B., Gales N. J., Harcourt R. G., Hindell M. A., Jonsen I. D., et al. (2018). Predicting krill swarm characteristics important for marine predators foraging off east Antarctica. Ecography 41, 996–1012. doi: 10.1111/ecog.03080
Bestley S., van Wijk E., Rosenberg M., Eriksen R., Corney S., Tattersall K., et al. (2020). Ocean circulation and frontal structure near the southern Kerguelen Plateau: The physical context for the Kerguelen Axis ecosystem study. Deep-Sea Res. Part II: Topical Stud. Oceanography 174, 104479. doi: 10.1016/j.dsr2.2018.07.013
Boyd P. W., Arrigo K. R., Ardyna M., Halfter S., Huckstadt L., Kuhn A. M., et al. (2024). The role of biota in the Southern Ocean carbon cycle. Nat. Rev. Earth Environ. 5, 390–408. doi: 10.1038/s43017-024-00531-3
Boyd P. W., Ellwood M. J. (2010). The biogeochemical cycle of iron in the ocean. Nat. Geosci. 3, 675–682. doi: 10.1038/ngeo964
Brewer P. G., Goldman J. C. (1976). Alkalinity changes generated by phytoplankton growth. Limnology Oceanography 21, 108–117. doi: 10.4319/lo.1976.21.1.0108
Cavalieri D. J., Parkinson C. L., Gloersen P., Zwally H. J. (1996). Sea ice concentrations from nimbus-7 smmr and dmsp ssm/i-ssmis passive microwave data, version 1. doi: 10.5067/8GQ8LZQVL0VL
de Boyer Montégut C., Madec G., Fischer A. S., Lazar A., Iudicone D. (2004). Mixed layer depth over the global ocean: An examination of profile data and a profile-based climatology. J. Geophysical Research: Oceans 109. doi: 10.1029/2004JC002378
DeJong H. B., Dunbar R. B., Koweek D. A., Mucciarone D. A., Bercovici S. K., Hansell D. A. (2017). Net community production and carbon export during the late summer in the Ross Sea, Antarctica. Global Biogeochemical Cycles 31, 473–491. doi: 10.1002/2016GB005417
Dickson A., Sabine C., Christian J. E. (2007). Guide to best practices for ocean CO2 measurements. PICES Special Publ. 3. doi: 10.25607/OBP-1342
Dieckmann G. S., Nehrke G., Papadimitriou S., Göttlicher J., Steininger R., Kennedy H., et al. (2008). Calcium carbonate as ikaite crystals in Antarctic sea ice. Geophysical Res. Lett. 35. doi: 10.1029/2008GL033540
Dinniman M. S., St-Laurent P., Arrigo K. R., Hofmann E. E., van Dijken G. L. (2020). Analysis of iron sources in antarctic continental shelf waters. J. Geophysical Research: Oceans 125, e2019JC015736. doi: 10.1029/2019JC015736
Feng Y., Hare C., Rose J., Handy S., DiTullio G., Lee P., et al. (2010). Interactive effects of iron, irradiance and CO2 on Ross Sea phytoplankton. Deep Sea Res. Part I: Oceanographic Res. Papers 57, 368–383. doi: 10.1016/j.dsr.2009.10.013
Foppert A., Donohue K. A., Watts D. R., Tracey K. L. (2017). Eddy heat flux across the Antarctic Circumpolar Current estimated from sea surface height standard deviation. J. Geophysical Research: Oceans 122, 6947–6964. doi: 10.1002/2017JC012837
Foppert A., Rintoul S. R., England M. H. (2019). Along-slope variability of cross-slope eddy transport in east Antarctica. Geophysical Res. Lett. 46, 8224–8233. doi: 10.1029/2019GL082999
Foppert A., Rintoul S. R., Purkey S. G., Zilberman N., Kobayashi T., Sallèe J.-B., et al. (2021). Deep argo reveals bottom water properties and pathways in the Australian-antarctic basin. J. Geophysical Research: Oceans 126. doi: 10.1029/2021JC017935
Friis K., Körtzinger A., Wallace D. W. R. (2003). The salinity normalization of marine inorganic carbon chemistry data. Geophysical Res. Lett. 30. doi: 10.1029/2002GL015898
Gao L., Zu Y., Guo G., Hou S. (2022). Recent changes and distribution of the newly-formed Cape Darnley Bottom Water, East Antarctica. Deep Sea Res. Part II: Topical Stud. Oceanography 201, 105119. doi: 10.1016/j.dsr2.2022.105119
Geilfus N.-X., Carnat G., Papakyriakou T., Tison J.-L., Else B., Thomas H., et al. (2012). Dynamics of pCO2and related air-ice CO2 fluxes in the Arctic coastal zone (Amundsen Gulf, Beaufort Sea). J. Geophysical Research: Oceans 117. doi: 10.1029/2011JC007118
Heidemann A. C., Westwood K. J., Foppert A., Wright S. W., Klocker A., Vives C. R., et al. (2024). Drivers of phytoplankton distribution, abundance and community composition off East Antarctica, from 55-80°E (CCAMLR division 58.4.2 East). Front. Mar. Sci. 11, 1454421. doi: 10.3389/fmars.2024.1454421
Henley S. F., Cavan E. L., Fawcett S. E., Kerr R., Monteiro T., Sherrell R. M., et al. (2020). Changing biogeochemistry of the southern ocean and its ecosystem implications. Front. Mar. Sci. 7. doi: 10.3389/fmars.2020.00581
Herraiz-Borreguero L., Church J. A., Allison I., Peña-Molino B., Coleman R., Tomczak M., et al. (2016). Basal melt, seasonal water mass transformation, ocean current variability, and deep convection processes along the Amery Ice Shelf calving front, East Antarctica. J. Geophysical Research: Oceans 121, 4946–4965. doi: 10.1002/2016JC011858
Herraiz-Borreguero L., Naveira Garabato A. C. (2022). Poleward shift of Circumpolar Deep Water threatens the East Antarctic Ice Sheet. Nat. Clim. Chang. 12, 728–734. doi: 10.1038/s41558-022-01424-3
Herraiz-Borreguero L., R. C., Allison I., Rintoul S. R., Craven M., Williams G. D. (2015). Circulation of modified Circumpolar Deep Water and basal melt beneath the Amery Ice Shelf, East Antarctica. J. Geophysical Research: Oceans 20, 3098–3112. doi: 10.1002/2015jc010697
Heywood K. J., Sparrow M. D., Brown J., Dickson R. R. (1999). Frontal structure and Antarctic Bottom Water flow through the Princess Elizabeth Trough, Antarctica. Deep Sea Res. Part I: Oceanographic Res. Papers 46, 1181–1200. doi: 10.1016/S0967-0637(98)00108-3
Lannuzel D., Vancoppenolle M., van der Merwe P., de Jong J., Meiners K. M., Grotti M., et al. (2016). Iron in sea ice: Review new insights. Elementa: Sci. Anthropocene 4, 1–19. doi: 10.12952/journal.elementa.000130
Latour P., Wuttig K., van der Merwe P., Strzepek R. F., Gault-Ringold M., Townsend A. T., et al. (2021). Manganese biogeochemistry in the southern ocean, from tasmania to Antarctica. Limnology Oceanography 66, 2547–2562. doi: 10.1002/lno.11772
Liu C., Wang Z., Liang X., Li X., Cheng C., Wu Y., et al. (2023). Observed tidal currents in prydz bay and their contribution to the amery ice shelf basal melting. Ocean-Land-Atmosphere Res. 2, 20. doi: 10.34133/olar.0020
McCartney M. S., Donohue K. A. (2007). A deep cyclonic gyre in the Australian-Antarctic Basin. Prog. Oceanography 75, 675–750. doi: 10.1016/j.pocean.2007.02.008
Meijers A. J., Klocker A., Bindoff N. L., Williams G. D., Marsland S. J. (2010). The circulation and water masses of the Antarctic shelf and continental slope between 30 and 80E. Deep-Sea Res. Part II: Topical Stud. Oceanography 57, 723–737. doi: 10.1016/j.dsr2.2009.04.019
Moreau S., Lannuzel D., Janssens J., Arroyo M. C., Corkill M., Cougnon E., et al. (2019). Sea ice meltwater and circumpolar deep water drive contrasting productivity in three antarctic polynyas. J. Geophysical Research: Oceans 124, 2943–2968. doi: 10.1029/2019JC015071
Moreau S., Vancoppenolle M., Bopp L., Aumont O., Madec G., Delille B., et al. (2016). Assessment of the sea-ice carbon pump: Insights from a three-dimensional ocean-sea-ice biogeochemical model (NEMO-LIM-PISCES). Elementa: Sci. Anthropocene 4. doi: 10.12952/journal.elementa.000122
Morel A. (1991). Light and marine photosynthesis: a spectral model with geochemical and climatological implications. Prog. Oceanography 26, 263–306. doi: 10.1016/0079-6611(91)90004-6
Morel A., Maritorena S. (2001). Bio-optical properties of oceanic waters: A reappraisal. J. Geophysical Research: Oceans 106, 7163–7180. doi: 10.1029/2000JC000319
National Geophysical Data Center, N (2006). National geophysical data center 2006. 2-minute gridded global relief data (ETOPO2) v2. doi: 10.7289/V5J1012Q
Nelson D. M., Smith W. Jr. (1991). Sverdrup revisited: Critical depths, maximum chlorophyll levels, and the control of Southern Ocean productivity by the irradiance-mixing regime. Limnology Oceanography 36, 1650–1661. doi: 10.4319/lo.1991.36.8.1650
Ohshima K. I., Fukamachi Y., Williams G. D., Nihashi S., Roquet F., Kitade Y., et al. (2013). Antarctic Bottom Water production by intense sea-ice formation in the Cape Darnley polynya. Nat. Geosci. 6, 235–240. doi: 10.1038/ngeo1738
Orsi A. H., Whitworth T., Nowlin W. D. (1995). On the meridional extent and fronts of the Antarctic Circumpolar Current. Deep-Sea Res. Part I 42, 641–673. doi: 10.1016/0967-0637(95)00021-W
Pinkerton M. H., Boyd P. W., Deppeler S., Hayward A., Höfer J., Moreau S. (2021). Evidence for the impact of climate change on primary producers in the southern ocean. Front. Ecol. Evol. 9. doi: 10.3389/fevo.2021.592027
Rees C., Pender L., Sherrin K., Schwanger C., Hughes P., Tibben S., et al. (2019). Methods for reproducible shipboard SFA nutrient measurement using RMNS and automated data processing. Limnology Oceanography: Methods 17, 25–41. doi: 10.1002/lom3.10294
Rintoul S. R. (2018). The global influence of localized dynamics in the Southern Ocean. Nature 558, 209–218. doi: 10.1038/s41586-018-0182-3
Roden N. P., Shadwick E. H., Tilbrook B., Trull T. W. (2013). Annual cycle of carbonate chemistry and decadal change in coastal Prydz Bay, East Antarctica. Mar. Chem. 155, 135–147. doi: 10.1016/j.marchem.2013.06.006
Roden N. P., Tilbrook B., Trull T. W., Virtue P., Williams G. D. (2016). Carbon cycling dynamics in the seasonal sea-ice zone of East Antarctica. J. Geophysical Research: Oceans 121, 8749–8769. doi: 10.1002/2016JC012008
Rysgaard S., Glud R. N., Sejr M. K., Bendtsen J., Christensen P. B. (2007). Inorganic carbon transport during sea ice growth and decay: A carbon pump in polar seas. J. Geophysical Research: Oceans 112. doi: 10.1029/2006JC003572
Schallenberg C., Bestley S., Klocker A., Trull T. W., Davies D. M., Gault-Ringold M., et al. (2018). Sustained upwelling of subsurface iron supplies seasonally persistent phytoplankton blooms around the southern kerguelen plateau, southern ocean. Journal of Geophysical Research: Oceans, 123, 5986–6003. doi: 10.1029/2018JC013932
Shadwick E. H., Rintoul S. R., Tilbrook B., Williams G. D., Young N., Fraser A. D., et al. (2013). Glacier tongue calving reduced dense water formation and enhanced carbon uptake. Geophysical Res. Lett. 40, 904–909. doi: 10.1002/grl.50178
Shadwick E. H., Tilbrook B., Williams G. D. (2014). Carbonate chemistry in the Mertz Polynya (East Antarctica): Biological and physical modification of dense water outflows and the export of anthropogenic CO2. J. Geophysical Research: Oceans 119, 1–14. doi: 10.1002/2013JC009286
Smith A. J. R., Ratnarajah L., Holmes T. M., Wuttig K., Townsend A. T., Westwood K., et al. (2021). Circumpolar deep water and shelf sediments support late summer microbial iron remineralization. Global Biogeochemical Cycles 35, e2020GB006921. doi: 10.1029/2020GB006921
Sokolov S., Rintoul S. R. (2002). Structure of Southern Ocean fronts at 140°E. J. Mar. Syst. 37, 151–184. doi: 10.1016/S0924-7963(02)00200-2
Sweeney C. (2003). The annual cycle of surface water CO2 and O2 in the Ross Sea: A model for gas exchange on the continental shelves of Antarctica. Biogeochemistry Ross Sea Antarctica Research Series, 78, edited by: Dunbar R. B., DiTullio G. R. AGU, Washington, D. C., 295–312. doi: 10.1029/078ars19
Tamsitt V., Drake H. F., Morrison A. K., Talley L. D., Dufour C. O., Gray A. R., et al. (2017). Spiraling pathways of global deep waters to the surface of the Southern Ocean. Nat. Commun. 8, 1–10. doi: 10.1038/s41467-017-00197-0
Vives C. R., Schallenberg C., Strutton P. G., Westwood K. J. (2022). Iron and light limitation of phytoplankton growth off East Antarctica. J. Mar. Syst. 234, 103774. doi: 10.1016/j.jmarsys.2022.103774
Westwood K. J., Brian Griffiths F., Meiners K. M., Williams G. D. (2010). Primary productivity off the Antarctic coast from 30°-80°E; BROKE-West surve. Deep-Sea Res. Part II: Topical Stud. Oceanography 57, 794–814. doi: 10.1016/j.dsr2.2008.08.020
Williams G. D., Herraiz-Borreguero L., Roquet F., Tamura T., Ohshima K. I., Fukamachi Y., et al. (2016). The suppression of Antarctic Bottom Water formation by melting ice shelves in Prydz Bay. Nat. Commun. 7. doi: 10.1038/ncomms12577
Williams G. D., Nicol S., Aoki S., Meijers A. J., Bindoff N. L., Iijima Y., et al. (2010). Surface oceanography of BROKE-West, along the Antarctic margin of the south-west Indian Ocean (30 - 80ring operator E). Deep-Sea Res. Part II: Topical Stud. Oceanography 57, 738–757. doi: 10.1016/j.dsr2.2009.04.020
Wright S. W., van den Enden R. L., Pearce I., Davidson A. T., Scott F. J., Westwood K. J. (2010). Phytoplankton community structure and stocks in the Southern Ocean (30-80°E) determined by CHEMTAX analysis of HPLC pigment signatures. Deep-Sea Res. Part II: Topical Stud. Oceanography 57, 758–778. doi: 10.1016/j.dsr2.2009.06.015
Yamazaki K., Aoki S., Shimada K., Kobayashi T., Kitade Y. (2020). Structure of the subpolar gyre in the Australian-antarctic basin derived from argo floats. J. Geophysical Research: Oceans 125. doi: 10.1029/2019JC015406
Keywords: Southern Ocean fronts, Antarctic margin, Prydz Bay Gyre, water masses, Antarctic Bottom Water, carbon cycling, summer stratification, upwelling
Citation: Foppert A, Bestley S, Shadwick EH, Klocker A, Vives CR, Liniger G and Westwood KJ (2024) Observed water-mass characteristics and circulation off Prydz Bay, East Antarctica. Front. Mar. Sci. 11:1456207. doi: 10.3389/fmars.2024.1456207
Received: 01 July 2024; Accepted: 23 August 2024;
Published: 04 October 2024.
Edited by:
Zhaomin Wang, Hohai University, ChinaReviewed by:
Andrew Meijers, British Antarctic Survey (BAS), United KingdomChengyan Liu, Southern Marine Science and Engineering Guangdong Laboratory (Zhuhai), China
Copyright © 2024 Foppert, Bestley, Shadwick, Klocker, Vives, Liniger and Westwood. This is an open-access article distributed under the terms of the Creative Commons Attribution License (CC BY). The use, distribution or reproduction in other forums is permitted, provided the original author(s) and the copyright owner(s) are credited and that the original publication in this journal is cited, in accordance with accepted academic practice. No use, distribution or reproduction is permitted which does not comply with these terms.
*Correspondence: Annie Foppert, YW5uaWUuZm9wcGVydEB1dGFzLmVkdS5hdQ==
 Annie Foppert
 Sophie Bestley
 Elizabeth H. Shadwick
 Andreas Klocker
 Clara R. Vives
 Guillaume Liniger
 Karen J. Westwood