Abstract
Knowledge of the reproductive biology of fishes is essential for effective fisheries management. Information derived from an understanding of fish reproduction, such as size and age at maturity, is used in models to assess fish stocks and can affect estimates of important ecological processes such as recruitment, abundance, and trophic interactions. Common practices for determining the reproductive status of teleost fishes include macroscopic evaluation of gonads as well as histological analysis. However, macroscopic evaluation can be biased and histological analysis is time-consuming, resulting in limitations to spatial and temporal data availability. Here, we explore Raman spectroscopy of ovaries as a novel approach to rapidly determine the reproductive status of walleye pollock (Gadus chalcogrammus), a commercially and ecologically important species in the North Pacific. We used a two-stage partial least-squares (PLS) regression analysis followed by a linear discriminant analysis (LDA) to classify walleye pollock ovary samples as physiologically mature or immature and to subsequently predict their histologically-determined reproductive stage based on the Raman spectra. Biologically mature samples with visible yolk differentiated from mature and immature samples (non-yolked; 99% accuracy). Non-yolked ovaries that were physiologically mature (either mature non-developing or previously spawned) were further differentiated from physiologically immature ovaries (93% accuracy). In addition, detailed, histologically-determined reproductive stages of yolked samples also differentiated via Raman spectroscopy, but with reduced accuracy (79% - 86% accuracy). Our results indicate that accurate identification of maturity status and the reproductive staging of oocytes of walleye pollock based on spectral data from ovaries is possible. This can provide a fast and efficient way to increase the availability of a key component of reproductive data to inform fisheries research and management.
1 Introduction
Knowledge of the reproductive status of fishes is vital to the successful management of fish stocks. Catch quotas are informed by estimates of stock status calculated using spawning stock biomass (SSB) or the proportion of the stock contributing to reproduction. Estimates of SSB are obtained, in part, through the construction of maturation schedules from field and laboratory-based observations of ovarian development to estimate the proportion of reproductively immature versus mature females in a stock or population. In addition to providing estimates of spawning potential, knowledge of reproductive strategy and the geography and phenology, or timing, of spawning can greatly benefit our understanding of interactions between a species and its environment. Reproductive patterns in fish species, such as gonad maturation and ovulation, are often tied to temperature thresholds (Alix et al., 2020). In recent decades, climate-driven warming trends have impacted fish distributions, growth rates, and spawning phenology (McClure et al., 2023; Hollowed et al., 2013; Vitale et al., 2006). Climate change will likely continue to affect fish reproductive biology, increasing the need for tools that facilitate efficient and accurate data collection to monitor ecologically and economically important species.
Histological analysis, considered the most accurate tool for identifying reproductive status (West, 1990), involves the microscopic examination of ovary tissues which have been fixed, stained, and mounted on a slide. This process allows for the identification of microscopic structures related to ovary development, such as seasonal maturation, to identify the physiological maturity and reproductive status of oocytes within an ovary. For this work, we focus on physiological maturity, defined here as the advancement of immature fish prior to their first spawning season to a mature fish that is capable of participating in seasonal spawning through yolk acquisition and ovary development (Brown-Peterson et al., 2011). As the ovary matures, structural changes can be observed through histological evaluation, including the development and increased complexity of oocyte structures, magnitude increases in the size of oocytes, and material accumulations such as lipid in the form of yolk. However, histological processing is effort-intensive, requires the use of hazardous chemicals, and incurs costly processing fees from specialized laboratories. These factors often limit the temporal and spatial coverage of data collected using this approach.
Spectroscopy is an emerging technology in ecological research that may provide an efficient alternative to determine the physiological maturity and reproductive status of fishes (Talari et al., 2014; De Gelder et al., 2007). Ovary tissue, like most biological tissues, comprises molecular structures that can be measured using spectroscopic approaches: proteins, lipids, carbohydrates, and RNA/DNA with levels that fluctuate throughout development (Guraya, 1986). Several spectroscopic techniques have been applied to ovarian tissue. For example, Fourier Transform Infrared Imaging (FTIRI) has been used to characterize macromolecular components such as lipids, proteins, carbohydrates, and phosphates during ovarian maturation and resorption (Carnevali et al., 2019). Fourier Transform near infrared (FT-NIR) spectroscopy was used to differentiate non-spawning from spawning-capable fish (TenBrink et al., 2022). Raman spectroscopy has been used to discriminate egg quality and viability by tracking macromolecule fluctuations during specific developmental stages post fertilization in fish (Ishigaki et al., 2016). Of these approaches, none have yet been applied to track the ovarian maturation process for ecological and fisheries management applications.
In Raman spectroscopy, a laser is used to irradiate material, which on contact, scatters a spectrum of light which is subsequently measured. This provides a molecular “fingerprint” with patterns or bands unique to the composition and configuration of the sample. The intensity of the Raman scattering is proportional to this scatter change and can be used to quantify chemical components of a sample. An advantage of Raman spectroscopy is that it is less sensitive to water than other spectroscopic techniques (Butler et al., 2016). These features of Raman spectroscopy, combined with portable instrumentation, rapid data collection (seconds to minutes), and probe-based measurement capabilities, make it uniquely suited to determine molecular constituents in biological tissues and a promising tool to assess ovary maturation in the laboratory or in situ.
In this study, we evaluate the potential for Raman spectroscopy to provide information on the physiological maturity and reproductive status of walleye pollock (Gadus chalcogrammus), referred to as “pollock” hereafter. Pollock are a semi-pelagic, schooling fish widely distributed in the North Pacific Ocean and support lucrative commercial fisheries in the Bering Sea and the Gulf of Alaska. Reproductive information used in pollock stock assessments is based on macroscopic evaluation of gonads (Monnahan et al., 2023; Ianelli et al., 2023; Williams, 2007). Visual maturity estimates are collected at the point of capture and used to estimate maturation status and spawning phenology. Because pollock spawn in multiple batches each year, ovaries may contain oocytes at varying levels of maturation and can be challenging to stage macroscopically (Williams, 2007). While macroscopic assessments of maturation allow for extensive data collection, differentiating between immature, developing, and spent fish is particularly difficult for this species. Misidentifying these stages can impact the accuracy of maturation schedules used for the estimation of SSB and management reference points (Flores et al., 2019). Additionally, climate change is expected to exacerbate shifts in pollock spawning behavior and phenology (Eisner et al., 2020; Rogers and Dougherty, 2018; Kotwicki et al., 2005) which has the potential to impact growth, survival, and recruitment (Cushing, 1990; Frank and Leggett, 1982).
This study tests the efficacy of Raman spectroscopy to determine the maturation state (physiologically immature vs. mature) and reproductive stage (ovary development progression toward spawning) of pollock in efforts to improve data collection efficiency and availability for the species. Hence, we address three questions to evaluate the efficacy of this technology:
-
Based on biochemical changes in ovary development associated with yolk formation, can Raman spectroscopy be used to differentiate mature pollock ovaries with histologically visible yolk development (hereinafter referred to as “yolked” ovaries) from pollock ovaries with little to no visible yolk development (hereinafter referred to as “non-yolked” ovaries)?
-
Ovaries with no yolk development can signify a biologically immature fish, a fish that recently spawned, or a fish that spawned in a previous year but lacks signs of development in a current spawning season. These categories are often misclassified using macroscopic approaches but can impact estimates of SSB. Therefore, among non-yolked ovaries: can immature and very early developing ovaries be differentiated from mature, non-developing and mature recently-spent ovaries based on the Raman spectra of their oocytes?
-
Finally, can this tool differentiate among more advanced yolked stages for informing ecological and spawning phenology studies that require more detailed data on reproductive status than stock assessment applications?
2 Methods
2.1 Fish collection and laboratory preparation
Ovary specimens were collected aboard the NOAA ship Oscar Dyson during acoustic-trawl pollock stock assessment surveys conducted by the Alaska Fisheries Science Center’s Midwater Assessment and Conservation Engineering (MACE) Program. Samples were collected in the Gulf of Alaska (GOA) during February and March 2017 (Figure 1; McCarthy et al., 2018). Ovaries were removed from the fish, weighed to the nearest mg, placed in a mesh bag and preserved in 10% formalin. Few immature pollock were collected during the MACE cruises, therefore, physiologically immature pollock, which were collected and reared at NOAA’s Little Port Walter Research Station (LPW) on Baranof Island, Alaska, were added to our collections. Combined, these collections comprised a range of ovary stages to encompass a balanced dataset representing all maturation stages (Supplementary Figure 1).
Figure 1

Map of transect line locations for the Alaska Fisheries Science Center’s acoustic-trawl walleye pollock stock assessment surveys and the location of the Little Port Walter Research Station on Baranof Island, Alaska.
In preparation for histological analysis, specimens were soaked in multiple water baths to remove excess formalin, and a cross-section of tissue from each ovary was processed and stained. Specimens collected at LPW were stained using hematoxylin and eosin (H&E) by Histology Consultation Services (Emerson, WA) while specimens collected at sea were sent to Histologistics (Dudley, MA) and stained with Schiff’s Mallory using periodic acid stains (PAS). Staining aids in the microscopic identification of the different stages of oocyte development and is particularly useful for differentiating mature from immature ovaries during the non-spawning season.
2.2 Reference data: histological analysis
Histologically determined reproductive stages were used as reference data to analyze spectral patterns. Reproductive stages were determined microscopically from histologically prepared slides. We applied standardized terminology for staging from Brown-Peterson et al. (2011). Histological images show examples of advancing stages of maturation and the microscopic structures seen within each ovary stage (Figure 2). Immature (IMM) fish are those which have not reached first maturity. Developing stage (DEV) fish show increased oocyte sizes, the development of cortical alveoli and may include very early signs of yolk development. Vitellogenic stages (VIT) include a further increase in oocyte size and increasing yolk concentrations. During late vitellogenesis, nuclear migration denotes the transition from yolk accumulation to shifts in the composition of yolk in preparation for spawning. The prespawning stage (PSWN) includes a brief period in the annual cycle when yolk droplets and the nucleus break down and coalesce. Hydration, or the rapid increase in size due the uptake of water, marks the early spawning stage (SWN). As the spawning season progresses through ovulation, oocytes are released from the follicles and there is a resulting increase in empty or post-ovulatory follicles (POFs). The partial spent stage (PSNT) accounts for the batch spawning strategy of pollock and occurs when both vitellogenic stages and POFs are present. Spent stage (SNT) ovaries are composed mostly of POFs and possibly a few atretic yolk stages that failed to ovulate. Finally, mature but not developing (MND) ovaries were identified as having spawned previously, but showed no signs of development at capture. Pollock is a multi-batch spawning fish and often has multiple stages of oocyte development present concurrently (Supplementary Figure 2). For this work, ovary stage assignments were made using the predominant oocyte structures present as opposed to the most advanced oocyte structure (Neidetcher et al., 2014). This decision was made a priori because Raman spectroscopy measures molecular composition, and focusing on predominant structures rather than most advanced should better reflect composition that might be measured in the spectra. For yolked stage ovaries where multiple stages were present at similar levels and the predominant stage was less clear, labeling deferred to the more advanced structures. In addition, each specimen was identified with either the presence or absence of visible yolk development.
Figure 2
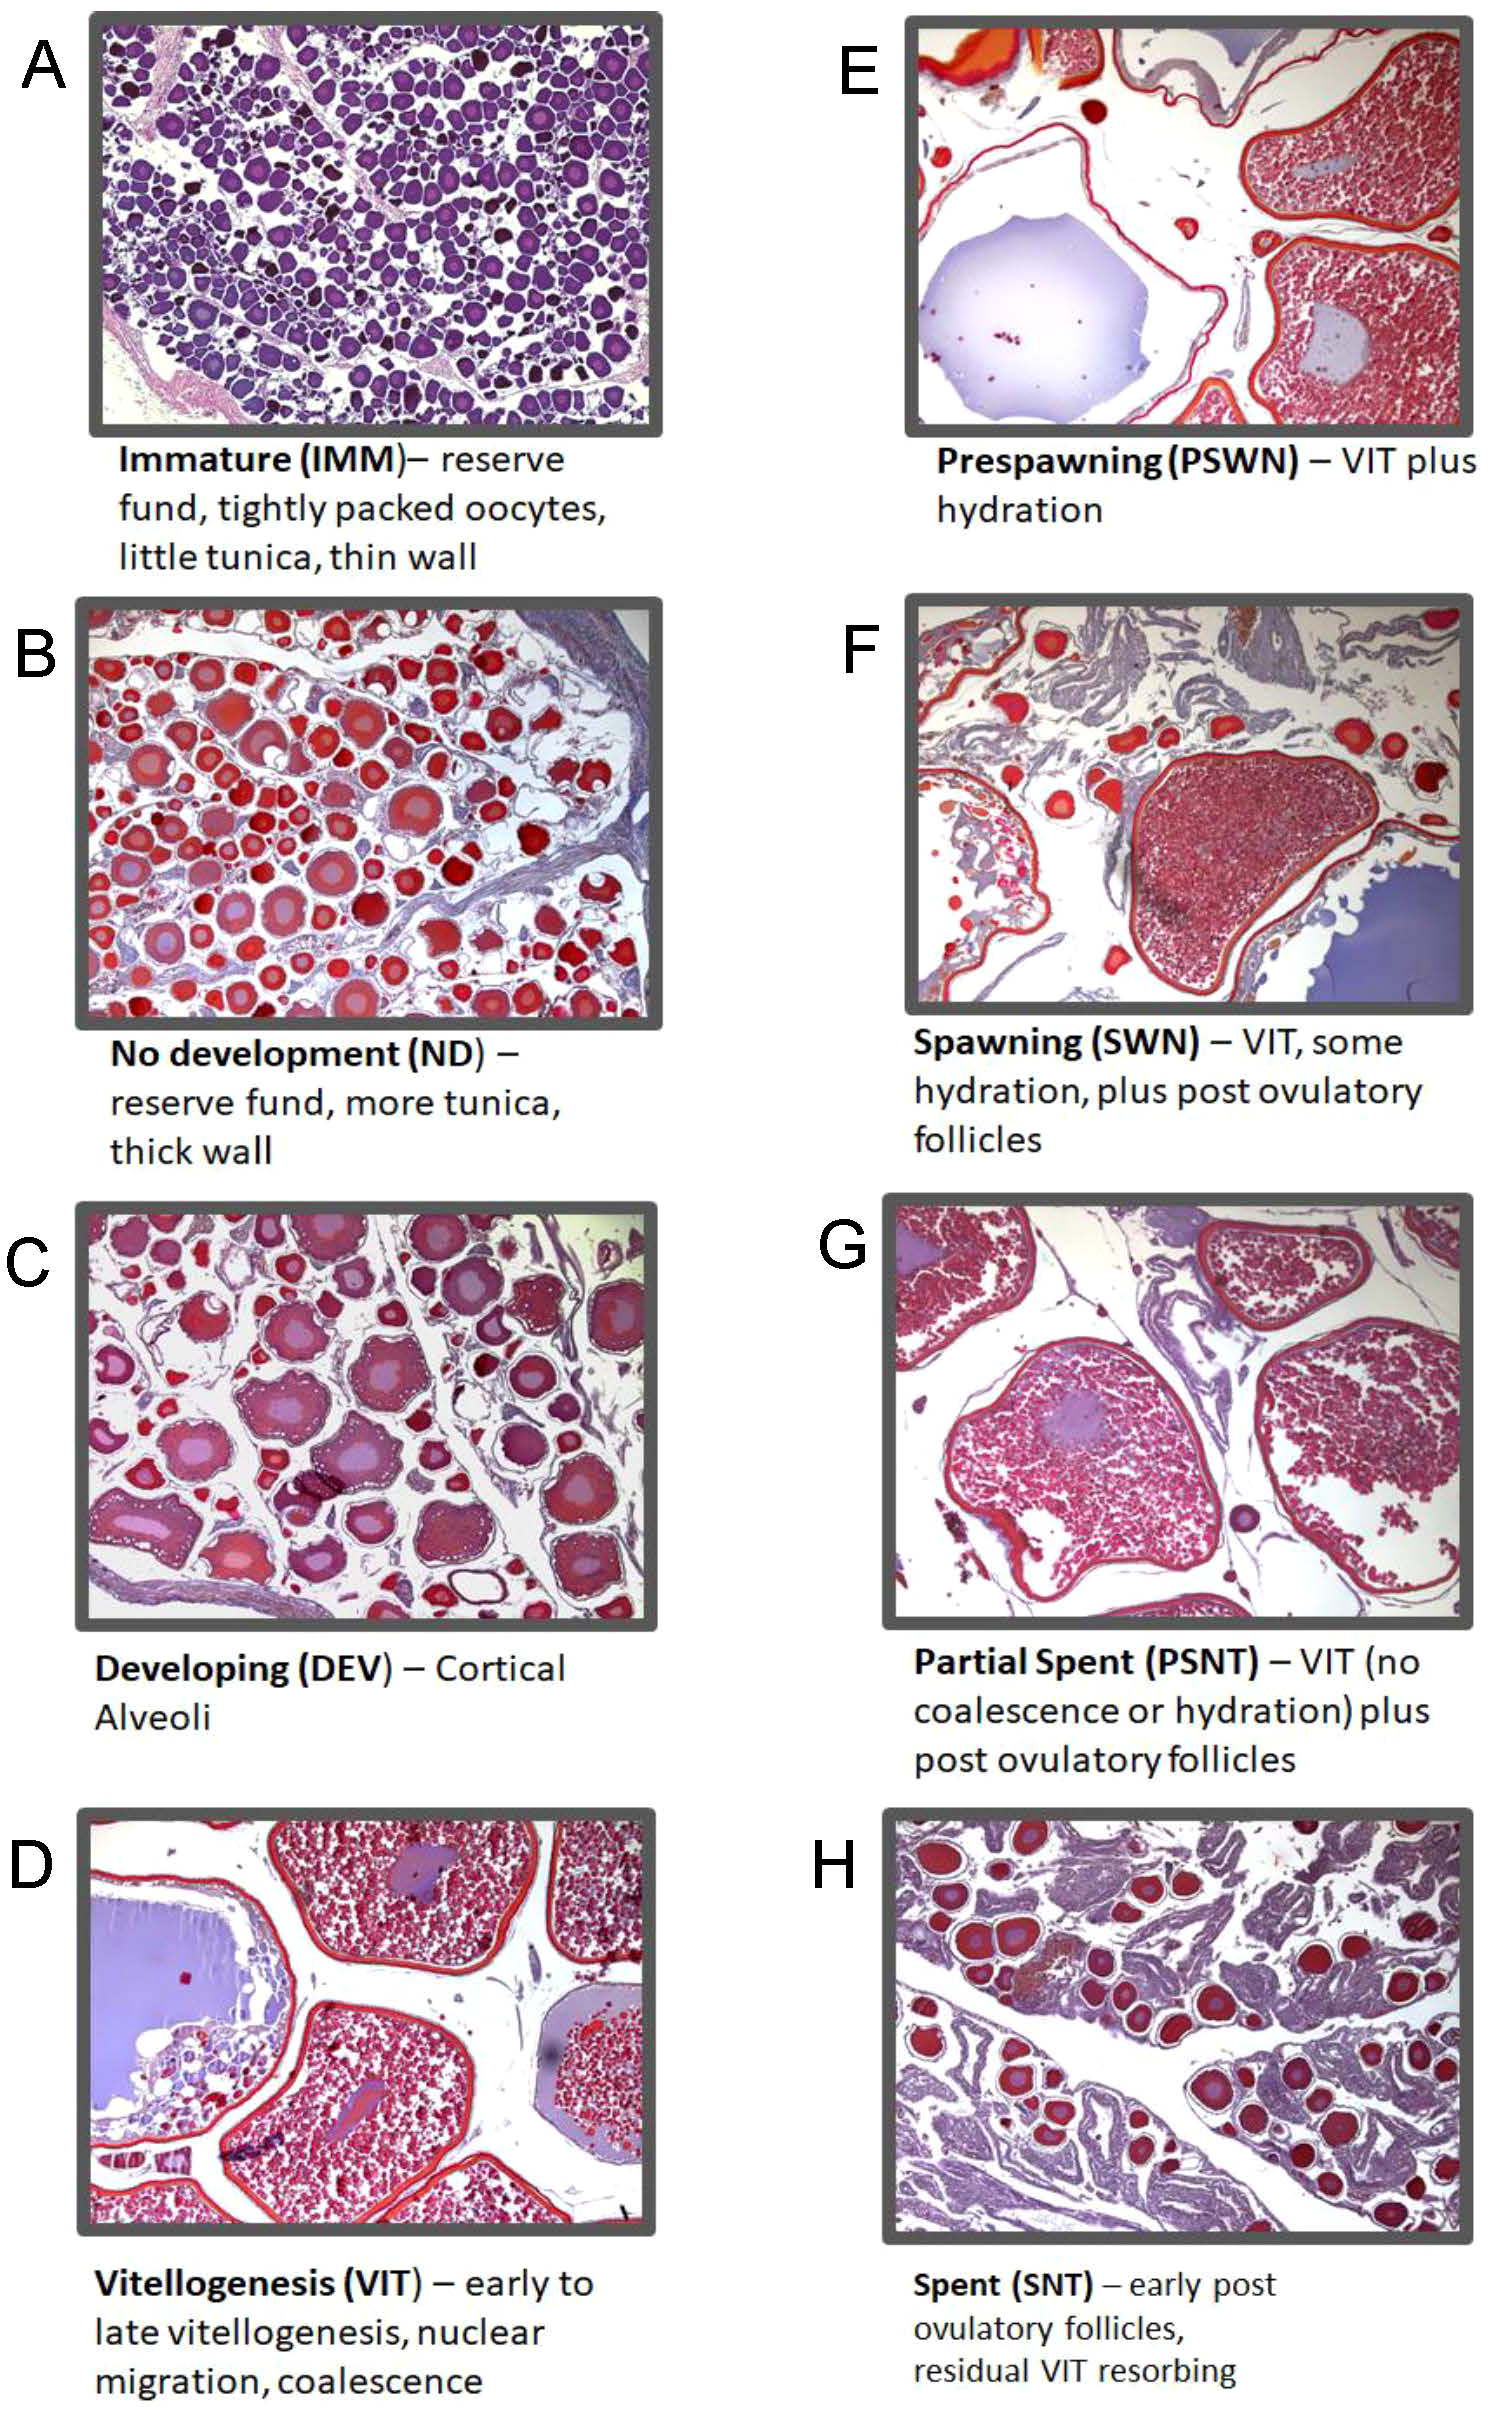
Images illustrate oocyte structures and components used to assign ovary maturation stages. Immature stage ovaries (A) are characterized by small, tightly grouped previtellogenic oocytes. Resting or reproductively inactive ovaries (no development; B) are most often observed for the length of time between spent and developing where the ovary appears inactive or with signs of late resorption and early perinuclear development. In developing stage ovaries (C) oocytes enter the maturation cycle and begin to develop with cortical alveoli and early vitellogenesis (yolk accumulation). During the vitellogenesis stage (D), yolk continues to accumulate and oocyte increases exponentially in size until nuclear migration and yolk coalescence. An increase in yolk transformation and beginning signs of hydration identifies ovaries in the pre-spawning stage (E). The spawning stage is defined with predominately hydrated oocytes with an increase in post ovulatory follicles (F). Partial spent stage ovaries (G) occur when batches of oocytes are spawned and additional batched in less developed vitellogenic oocytes remain. Spent stage ovaries (H) contain primarily post ovulatory follicles and yolked oocyte remnants in the process of resorption.
2.3 Spectra collection and processing
We acquired Raman spectral data from ovary tissue using a Raman Process BallProbe® with a 780 nm laser and a wavenumber range of 50-3300 cm-1 (MarqMetrix®) (Figure 3). A representative subsample of tissue (< 1 g) was collected from a location adjacent to the histology tissue sample for spectral data acquisition. These tissue samples were collected from within each ovary and excluded the ovary wall. The samples were soaked in deionized water to remove residual formalin and because deionized water does not interact with Raman scattering (Adiks et al., 2008). Raman spectroscopy is not sensitive to sample mass (Butler et al., 2016); however, for each sample, roughly 0.050 g of tissue (or if the ovary was too small, as much tissue as could be collected) was placed in the center of a 22 mm diameter quartz vial for spectral interrogation. The laser power on the samples was 400 mW with an exposure time of 1000 ms to optimize information versus noise. Ten repeat measurements were collected, with the spherical sapphire lens on the fiber optic probe touching the sample, and averaged to create one representative spectrum per sample. Fluorescent lights were turned off during Raman spectra collection.
Figure 3

Image includes an example of specimen processing using the MarqMetrix® Raman instrument, the Process BallProbe® (on the right), a monitor presenting spectral patterns, and specimenpresentation to the probe (inset).
Prior to data analysis, the Raman spectra were preprocessed. We subtracted a blank spectrum (measured with >.6 m between the probe and closest object) from each sample spectrum to eliminate peaks due to the sapphire in the fiber optic probe (Raml et al., 2011). Spectra were truncated into the fingerprint region (200-1800 cm-1) and high frequency region (2600-3250 cm1). We then applied extended multiplicative signal correction (EMSC) to normalize spectra (Martens and Stark, 1991) and polynomial subtraction using the modified polyfit method to remove fluorescent background (Lieber and Mahadevan-Jansen, 2003). For the fingerprint region, we parameterized EMSC and modified polyfit with seventh-order polynomials. For the high frequency region, we parameterized EMSC with a fifth-order polynomial and modified polyfit with a third-order polynomial. Savitzky-Golay smoothing, with a second-order polynomial and a window size of 25 points, was applied to both regions to reduce unwanted noise in spectra (Delwiche and Reeves, 2010).
2.4 Statistical analyses
We used principal component analysis (PCA) as an exploratory analysis for data visualization and to identify spectral outliers. Detection and elimination of outliers was performed based on robust calculation of outlier limits (Pomerantsev and Ye Rodionova, 2014). Values that fell outside a significance level of 0.01 were considered outliers and removed from the data set (n = 2).
We used a two-step analysis to classify samples as physiologically mature or immature from their Raman spectra and compare to histologically determined reference data. First, we used a partial least-square (PLS) regression analysis followed by a linear discriminant analysis (LDA) to classify yolked and non-yolked samples (Boulesteix, 2004). A PLS regression is a multivariate method commonly used in chemometric analysis for dimensionality reduction and to linearize spectral data (Wold et al., 1984; Boulesteix, 2004). In PLS, the independent (here, spectral data) and dependent (here, yolk presence as determined by histological analysis) data matrices are decomposed into a set of scores and loadings (hereinafter referred to as latent variables). The latent variables are then used as predictors in LDA. This approach is preferable to applying other multivariate techniques such as PCA for dimension reduction prior to LDA because PLS maximizes covariance between independent and dependent variables. LDA performs well on a smaller number of uncorrelated variables (Dudoit et al., 2002). In LDA, the independent variables (here, latent variables from PLS) are assumed to have normally distributed probability density functions with respect to the dependent variable. Yolked v. non-yolked membership is determined from the class with maximum posterior probability. All samples classified as yolked in the PLS-LDA were considered biologically mature. Second, we applied a PLS-LDA to classify the non-yolked samples as either physiologically mature (if histology indicated it was MND or SNT) or immature (if histology indicated it was IMM or DEV). To evaluate the ability to further predict the spawning progression of pollock ovaries with visual yolk development from their Raman spectra, we used a PLS-LDA to classify yolked specimens to their histologically determined reproductive stage (VIT, PSWN, SWN, and PSNT). While visible yolk at barely discernible levels may be seen in DEV ovaries and in small amounts of residual, yolked oocytes in SNT ovaries, yolk occurs in these stages at minute levels compared to the yolk contained in VIT, PSWN, SWN, or PSNT ovaries we maintain their characterization as non-yolked.
Variable importance in projection (VIP) scores were calculated for each wavenumber to identify the spectral regions most important for classification in each model (Goldstein et al., 2021). The calculation of VIP includes the covariance between independent and dependent variables and reflects how much a variable contributes to describing both independent and dependent data (Andersen and Bro, 2010). A VIP score describes the relative importance of the dependent variable in predicting the independent variable (i.e. yolk presence or absence). Using a threshold of one, VIP scores were used to identify wavenumbers most important for prediction (VIP score > 1) (Lazraq et al., 2003), however all wavenumbers were included in predictive models.
Cross-validation was used to determine the optimal number of latent variables (Boulesteix, 2004) and the predictive ability of the three models on new data. In cross-validation, one sample was systematically left out, and a PLS-LDA applied to the remaining samples. The parameter estimates were then used to estimate the classification of the left-out sample. Model predictive ability on new data was then estimated based on several metrics that compare model-based classification to traditionally determined reference data from histological analysis.
For all categories, we report specificities, or the accuracy of rejecting a sample from an incorrect category, sensitivities, or the accuracy of assigning a sample to the correct category, and overall balanced model accuracy. Balanced accuracy (henceforth referred to as accuracy) was used due to unequal sample sizes in each class, and is a summary metric calculated as the average between sensitivity and specificity for each model. Area under the receiver operating characteristic curve (AUC) is also reported as an evaluation of model performance across all possible classification thresholds. It is calculated as the area under the curve of True Positive Rates plotted against False Positive Rates, and a value of 1 represents perfect classification. Multiple metrics are calculated and compared to robustly evaluate model performance. Data analysis was conducted in R statistical computing software version 4.1.0 (R Core Team, 2021), with packages mdatools (ver. 0.11.5, Kucheryavskiy (2020), https://github.com/svkucheryavski/mdatools), plsgenomics (ver. 1.5-2, Boulesteix et al. (2018), see https://CRAN.R-project.org/package=plsgenomics), and mixOmics (ver. 6.26.0 Gautier et al. (2017), see http://mixomics.org/).
3 Results
In total, n = 226 specimens were analyzed to evaluate the utility of Raman spectra in classifying pollock as physiologically immature or mature and differentiating yolked reproductive stages (Table 1). The wavenumbers most important for classification (VIP>1) in each model are summarized in Supplementary Table 1.
Table 1
| Length | IMM | DEV | VIT | PSWN | SWN | PSNT | SNT | MND | Total |
|---|---|---|---|---|---|---|---|---|---|
| 15 | 2 | 2 | |||||||
| 20 | 9 | 9 | |||||||
| 25 | 6 | 6 | |||||||
| 30 | 21 | 21 | |||||||
| 35 | 4 | 4 | |||||||
| 40 | 1 | 5 | 5 | 1 | 3 | 7 | 8 | 30 | |
| 45 | 7 | 26 | 19 | 18 | 18 | 10 | 11 | 109 | |
| 50 | 9 | 4 | 8 | 4 | 3 | 4 | 32 | ||
| 55 | 1 | 2 | 2 | 2 | 7 | ||||
| 60 | 1 | 3 | 2 | 6 | |||||
| Total | 42 | 8 | 41 | 29 | 32 | 27 | 24 | 23 | 226 |
Sample distribution by fish fork length in 5 cm length bins per histologically determined ovary stage immature (IMM), developing (DEV), vitellogenic (VIT), pre-spawning (PSWN), Spawning (SWN), partial-spent (PSNT), spent (SNT), mature not developing (MND).
3.1 Maturity status
The Raman spectra of physiologically mature ovaries with yolk development were differentiable from the spectra of ovaries with little to no yolk development (Figure 4A). Spectral data showed clear separation between yolked and non-yolked samples along latent variables (LV) 1 and 3 from PLS used for dimensionality reduction (Figure 5A). The optimal number of latent variables from PLS was 8, which explained 96.34% of variance in the spectral data matrix and 88.72% of variance in the response data (here, yolked vs. non-yolked). Using these 8 latent variables, all but two samples were correctly classified in the LDA (92.8% accuracy, AUC = 0.98 (Table 2). Wavenumber regions 450-558, 776-818, 838-851, 1192-1214, 1296-1426, 1474-1510, 1582-1628, 1751-1778, and 2794-2831 cm-1 contributed substantially to variation in spectra related to the response variable (VIP > 1) (Figure 4A, Supplementary Table 1). All samples classified as yolked were considered mature.
Figure 4

Raman spectra preprocessed with extended multiplicative scatter correction, polynomial subtraction, and Savitzky-Golay smoothing shows variable intensity per maturity over VIP regions. The left column shows all spectra and the right column shows average spectra and standard error for (A) yolked vs. non-yolked samples, (B) the maturity status of samples predicted as non-yolked, and (C) the finer scale stage progression for samples predicted as yolked. Wavenumbers identified as important for projection (VIP score > 1) with respect to the response variables are shown highlighted in the white spaces. All other wavenumbers are grayed out (VIP scores < 1).
Figure 5
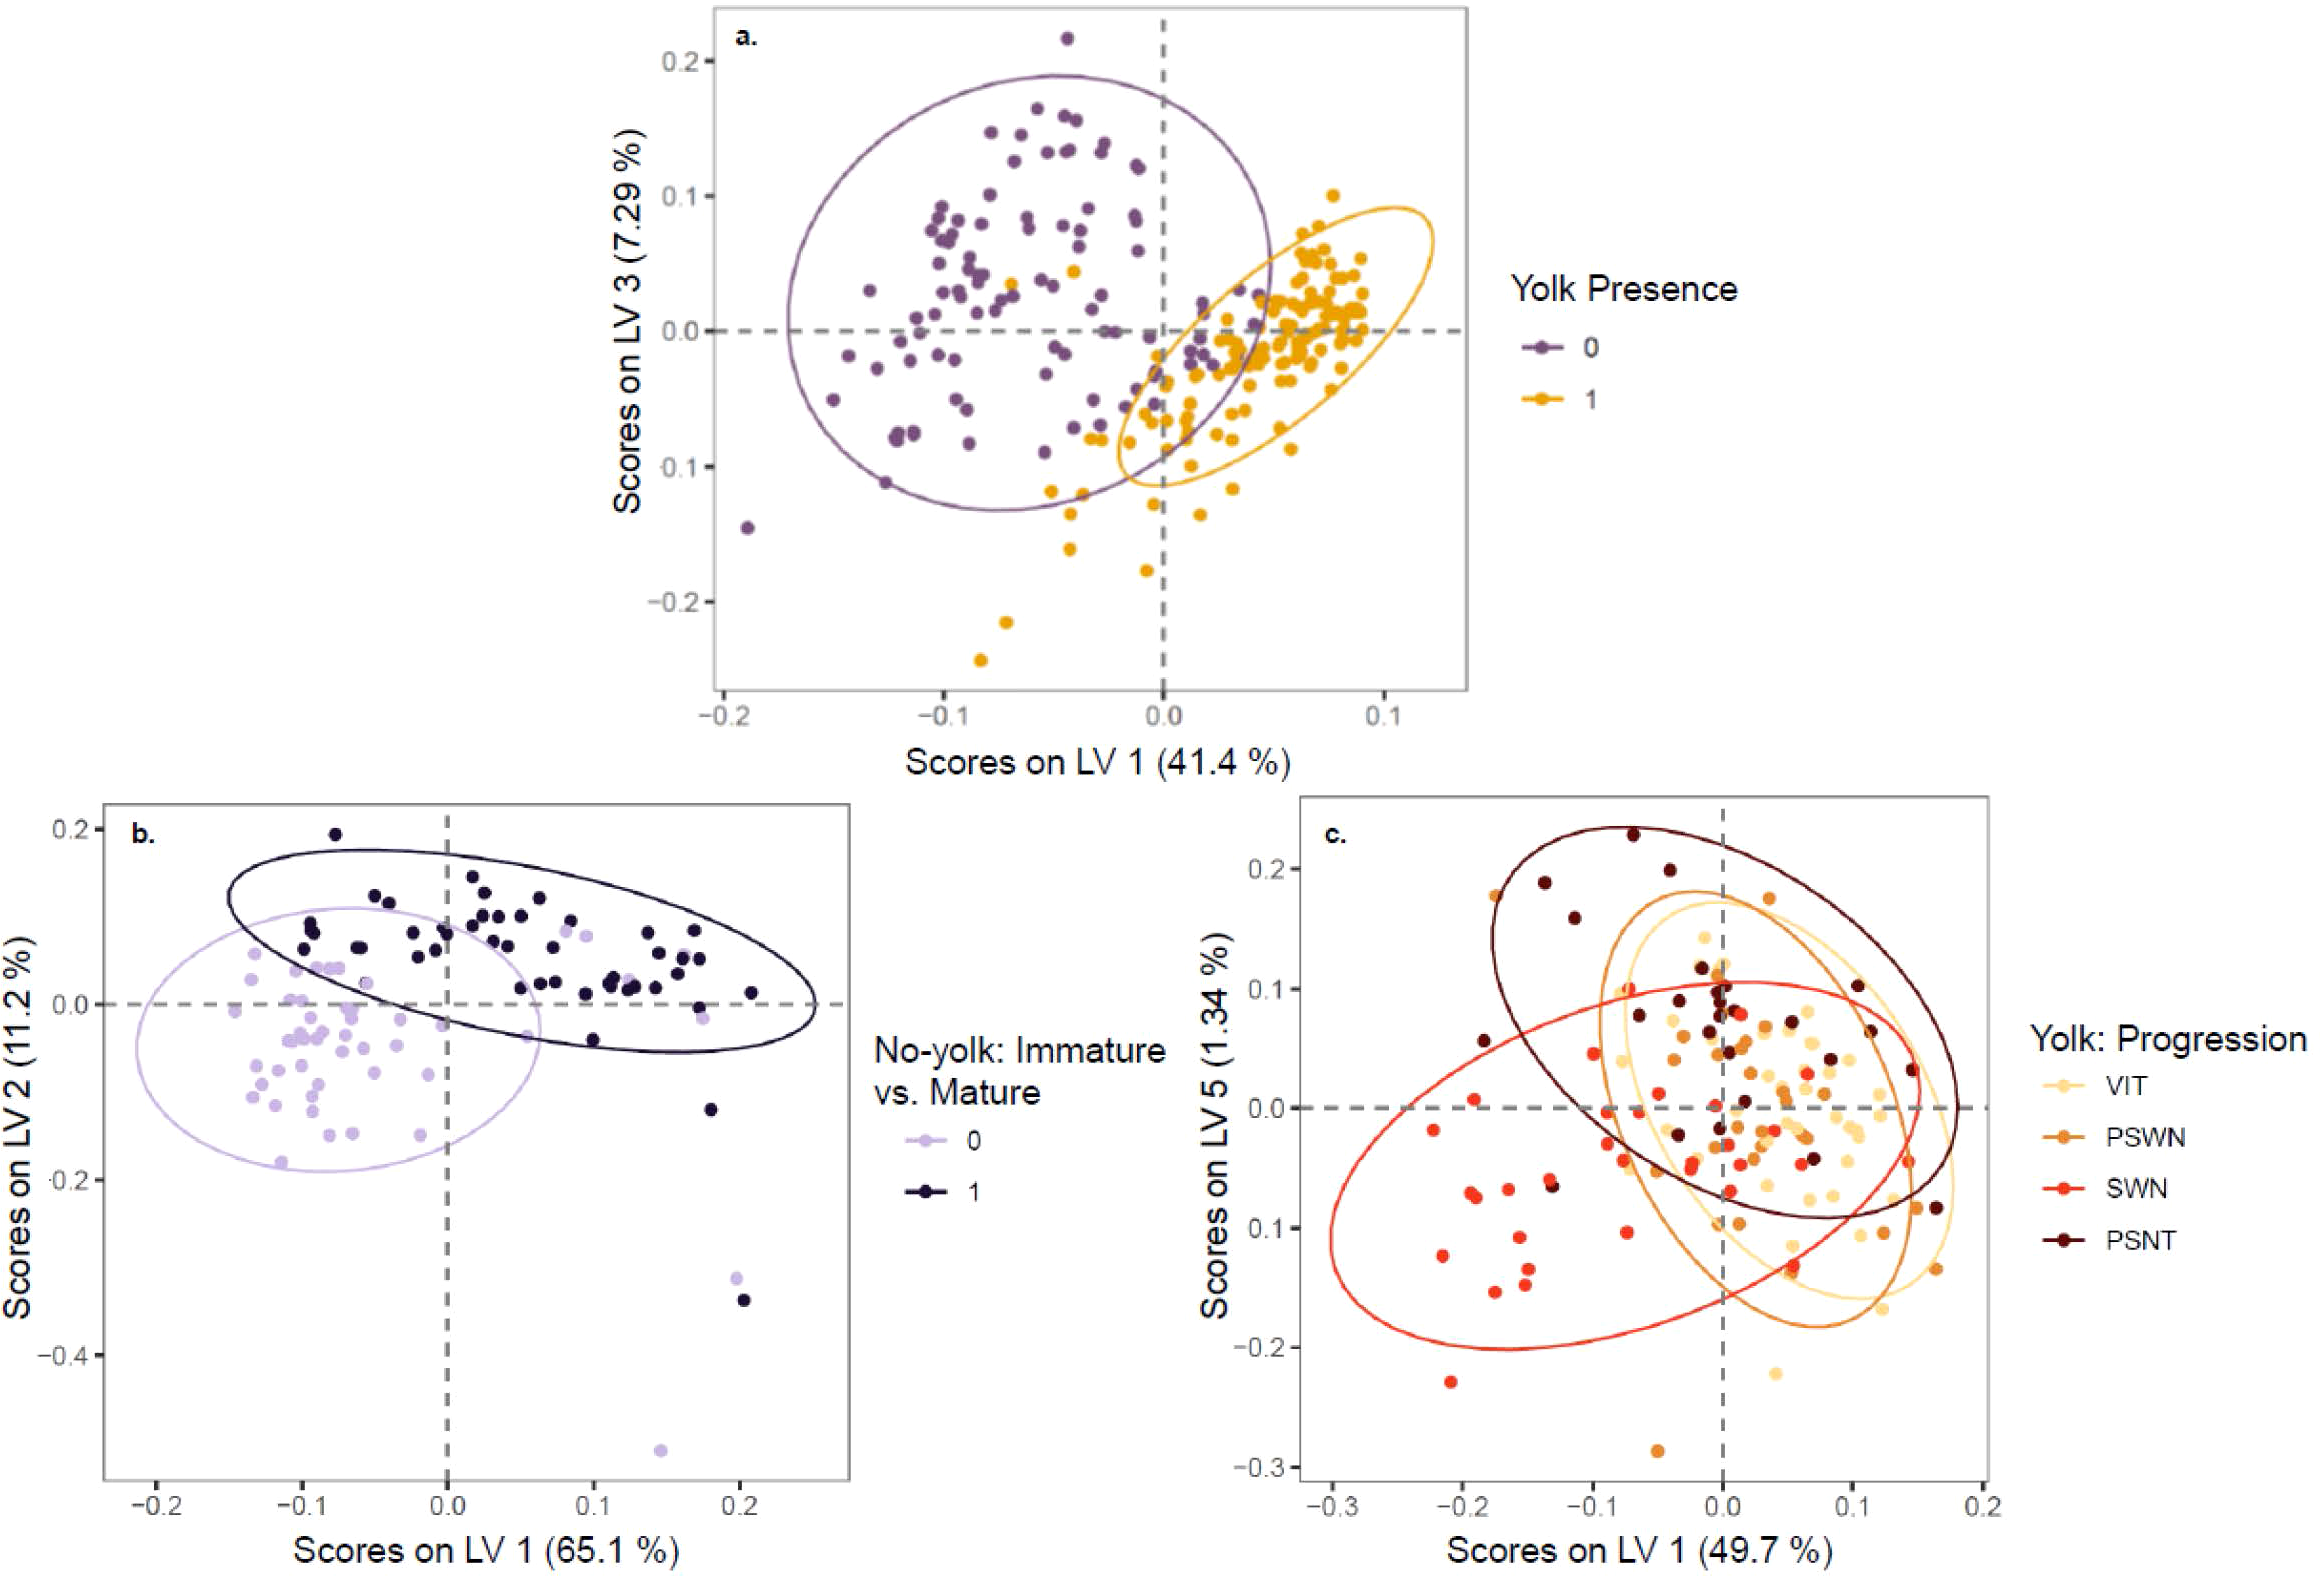
Scores on latent variables with 95% confidence ellipses shown from partial least squares dimensionality reduction for (A) yolked vs. non-yolked samples, (B) the maturity status of samples predicted as non-yolked, and (C) the spawning phenology of samples predicted as yolked. The latent variables with the most differentiation by response variable are shown for each analysis.
Table 2
| Analysis | Class | Proportion | Sensitivity | Specificity | Balanced Accuracy% | AUC | No information rate |
|---|---|---|---|---|---|---|---|
| Yolk presence | non-yolked yolk present |
95/96 129/130 |
0.99 | 0.99 | 99.1 | 0.99 | 0.58 |
| Non-yolked: Maturity status | immature mature |
43/49 46/47 |
0.88 | 0.98 | 92.8 | 0.98 | 0.51 |
| Yolk: Progression | vitellogenic prespawning spawning partial spent |
33/41 20/29 23/32 21/26 |
0.80 0.69 0.72 0.81 |
0.90 0.89 0.98 0.91 |
85.1 78.9 85.0 86.0 |
0.95 0.90 0.93 0.92 |
0.32 0.32 0.32 0.32 |
The proportion of correctly predicted samples relative to total sample size, the sensitivity (true positive rate), the specificity (true negative rate), the balanced accuracy, and area under the curve (AUC) relative to the no information rate of the model predictions from cross validation.
Results shown as proportions of total samples.
The Raman spectra of mature but non-yolked ovaries (MND or SNT) were differentiable from the spectra of non-yolked immature ovaries (IMM or DEV) (Figure 4B). There was separation between non-yolked immature and mature ovaries along LV1 and LV2 (Figure 5B). The optimal number of LVs from PLS used for LDA was 5, which explained 95.03% of variance in the spectral data matrix and 71.09% of variance in the response data (here, mature vs. immature). Of samples classified as non-yolked, 98.0% of mature samples were correctly classified by PLS-LDA and 88% of immature samples (92.8% accuracy, AUC = 0.98) (Table 2). Wavenumber regions 437-553, 666-755, 770-784, 873-924, 1062-1130, 1242-1299, and 1455-1465 cm-1 contributed most substantially to variation in spectra related to the response variable (VIP > 1) (Figure 4B, Supplementary Table 1). Overall, 43 out of 50 (86.0%) total biologically immature samples and 175 out of 177 (98.9%) total physiologically mature samples were correctly classified and classification accuracies all exceeded the No Information Rate (Table 2).
3.2 Yolked stage progression
There was less differentiation in Raman spectra among yolked samples that were a priori grouped by histologically determined reproductive stage. Progression in stages with yolk present was visible along LV1 and LV5, especially for SWN and PSNT samples, but with overlap among stages (Figure 5C, Supplementary Figure 3). The optimal number of LVs from PLS was 9, which explained 94.90% of variance in the spectral data matrix but only 42.63% of variance in the response data. The highest classification accuracy was for PSNT samples (86.0% accuracy; AUC = 0.92) followed by SWN samples (85.0% accuracy; AUC = 0.93) and VIT samples (85.1% accuracy; AUC = 0.95) (Table 2). The PSWN samples had the lowest classification accuracy (78.9% accuracy; AUC = 0.90). Wavenumber regions 324-339, 422-528, 1573-1587, 2873-2877 cm-1 contributed most substantially to variation in spectra related to the response variable (VIP > 1) (Figure 4C, Supplementary Table 1).
4 Discussion
Fish maturity information is an essential metric for stock assessment. Efficient data collection tools would further advance fisheries management by expanding the capacity to collect maturity data and track climate-associated spatial and temporal shifts in spawning and maturity (Rørvik et al., 2022; Rogers and Doughtery, 2018; Kjesbu et al., 2014). Application of Raman spectroscopy to assess pollock maturity indicates that this approach is an effective alternative to laborious histological approaches, and provides additional insight beyond macroscopic maturity assessments. Raman spectroscopy was successful at identifying yolked and non-yolked individuals, and subsequently discriminating between non-yolked immature and mature individuals. This is an improvement over gross visual approaches that frequently misidentify non-yolked immature and non-yolked mature specimens (Williams, 2007). Given that correct classification of mature and immature individuals is central to estimating spawning stock biomass in stock assessments, employing Raman spectroscopy in this context could improve both the quantity and quality of maturity data available for stock assessments.
Several spectral regions identified as important (VIP > 1) for differentiating between yolked and non-yolked specimens are associated with molecular components that fluctuate with oocyte maturation (Guraya, 1986). Pollock ovaries, comprised of lipids, proteins, and carbohydrates, vary by maturation stage (Gorbatenko and Lazhentsev, 2016). Lipid and protein values in ovaries peak at the advanced yolked stages and are lowest in post-spawning fish (Gorbatenko and Lazhentsev, 2016). This coincides with our results, which showed higher Raman intensity for yolked compared to non-yolked ovaries in regions associated with proteins and lipid fatty acids (Figure 3, Table 3). Spectral band regions for yolked ovaries also showed a higher intensity in bands associated with glucose and saccharides, which are involved with energy storage (Mishra and Joy, 2004), and tryptophan, which is associated with yolk coalescence in ovaries (Sahu et al., 2020). The spectra of non-yolked samples show higher intensity in broad, overlapping regions that correspond to polysaccharides, RNA, DNA, glycogen, collagen, Amide II, and phospholipids (Figure 3, Table 3), and are consistent with high levels of these molecules in non-yolked fish ovaries (Guraya, 1986). These molecular associations suggest that spectra are capturing differences between yolk and non-yolked stages that we would expect based on previously observed physiological and macromolecular changes in ovaries.
Table 3
| Staging (maturation sequence) | Q 1 yolk vs. non yolk |
Q 2 mature vs. mature, not developing | Q 3 yolked progression |
Physiology | Macro- molecular components |
VIP Spectral region Q1 | VIP Spectral region Q2 | VIP Spectral region Q3 |
|---|---|---|---|---|---|---|---|---|
| Immature | No yolk | Immature | Chromatin to perinuclear stage | DNA/RNA Organelle development |
450-558 776-818 Amino Acids, RNA/DNA, glycogen, Collagen 1192-1214 nucleic acid, Amide III protein group, 1296-1426 CH2,CH3; collagen, fatty acid, Amide III, lipid 1476-1510 Amino acids, DNA, Amides 838-851 Amino acid, glucose, saccharides (5) 1582-1628 Amino acids. Amide I, protein 1751-1778 lipid, fatty acid 2794-2831 lipid and protein |
439 -549 DNA/RNA .668 - 712 Phospholipid Collagen Carbohydrate Protein 875 - 918 Lipid Amide Triglyceride Collagen 1254 - 1305 1430-1450 deformation CH2, CH3 lipids 1605 - 1690 Phenyl groups Amide I Lipids |
422-428 Phospholipid Cholesterol (lipid) 495-528 glycogen, disulfide stretching of protein and collagen 1573-1638: nucleic acids in tissue, amino acids, Amide I, RBC 2872-2886 lipids and proteins 1397-1428 Amide II AmideI |
|
| Mature Not Developing | No yolk | Mature Not Developing | Perinuclear stage oocytes interspersed with follicle remnants and miscellaneous tunica | A lack of oocyte development, presence of |
||||
| Developing | No yolk | Mature Not Developing | Perinuclear to cortical alveoli, oocyte enlargement, potentially early yolk accumulation | Structural protein collagen |
||||
| Vitellogenesis | Yolk | Mature | Vitellogenesis | Oocyte growth with accumulation of yolk droplets around the periphery to greatly expanded with nuclear migration | Protein and lipid increase in yolk accumulation | |||
| Prespawning | Yolk | Mature | Prespawning | Coalescence; breakdown of yolk droplets | Protein pyrolysis | |||
| Spawning | Yolk | Mature | Spawning | Hydration, ovulation and the presence of post ovulatory follicles | Uptake water | |||
| Partial Spent | Yolk | Mature | Partial Spent | Ovulation event evidenced by presence of post-ovulatory follicles along with vitellogenic stages oocytes | Follicle atresia combined with yolk accumulation | |||
| Spent | No yolk | Mature Not Developing | Predominantly post-ovulatory follicles with few residual mature stages | Follicle atresia |
Descriptions of the maturity stage histology, physiology, and prominent molecular shifts that occur during maturation.
Columns to the left show stage groupings per Question 1: yolk vs non-yolk; Question 2: Immature vs. mature; and Question 3: yolk progression. The physiology column describes changes that occur in the composition of oocyte structures and accumulations that occur during maturation. Broad scale shifts in the molecular components of these changes are provided in the adjacent column to the right. VIP band regions and corresponding molecule assignments available through prior research reviews (Talari et al., 2014) highlight areas of overlap and an alignment with histology grouping and spectral patterns.
Compared to the large variation in the spectral data between yolk and non-yolked samples, non-yolked stages of immature, developing, spent, and mature-not-developing showed considerably less variability in their spectra. This is not wholly unexpected given relative dearth of fatty acids, which were critical to distinguishing yolked from non-yolked ovaries. While perinuclear (i.e. pre-yolk) oocytes are present in all maturation stages, immature ovaries contain only perinuclear stage oocytes and are differentiated histologically from mature non-yolked ovaries by a tighter packing configuration of the oocytes in the ovary and a thinner ovary wall. In addition, immature ovaries lack oocyte and follicular remnants which are present at varying levels of resorption in spent and mature non-yolked stages. The follicular envelope and the zona pellucida develop from a single layer of squamous cells into a multi-layered structure. Levels of polysaccharides, glycoproteins, carbohydrate-protein matrix or protein and polysaccharide combinations change throughout development and differences in Raman spectra are associated with these molecular changes (Guraya, 1986). At ovulation, the follicle ruptures as a result structural changes and fluid uptake during hydration. The remaining post-ovulatory follicle and residual unspawned oocytes are broken down through apoptosis and are seen at varying levels of resorption. These atretic POFs and remnant oocytes delineate spent stage ovaries. Given that these processes occur gradually and often in concert, sub-classification of non-yolked stages by Raman spectroscopy shows great promise, particularly in successfully differentiating between immature and mature non-yolked ovaries with 98% accuracy.
Compared to the classification success of yolked vs. non-yolked and non-yolked stages from our first two tests, classification of yolked progression was considerably less accurate. However, accuracy still exceeded 75%, suggesting that Raman spectroscopy can be used to rapidly assess shifts in spawning phenology, albeit with increased uncertainty. Raman spectroscopy could be particularly useful in assessing yolk progression when fixing and transporting samples in formalin is not feasible due to its hazardous nature. Additionally, alternative methods of reference data collection such as detailed oocyte composition using microscopic Raman may improve calibration models potentially increasing classification accuracy. Similar to the examination of yolked v non-yolked and the non-yolked stages, wavenumber regions that are correlated with yolked stage progression were associated with changes in the oocyte and molecules that are relevant to reproductive development, such as increased blood supply in vitellogenesis and higher levels of lipid, protein, and collagen during the spawning stage (De Gelder et al., 2007). This suggests Raman spectroscopy is measuring molecular changes during oocyte development and the reduced ability to classify stages may simply reflect the continuous, rather than categorical, process of ovary maturation. Greater overlap in the spectra suggests reduced molecular variability among yolked stages. This may also be due to the batch spawning strategy of pollock where multiple batches of oocytes at different levels of maturation may occur in the ovary at the same time. While the determination of reproductive stage progression from Raman was less accurate than determining maturity status, the approach shows substantial promise and highlights the possibility for more detailed maturity information such as phenological shifts to be incorporated into long-term and large-scale maturity datasets.
5 Conclusion
The results of this study suggest that Raman spectroscopy can be used as an effective tool in differentiating 1) yolked from non-yolked stages and 2) immature fish from mature fish. These results alone provide the ability to rapidly update outdated maturity ogives (proportion of mature fish at age or length), which is a critical data input for stock assessments. Further research is needed to identify specific molecular constituents, functional groups, and relevant spectral bands to further improve yolked stage subclassification based on Raman spectra, but initial results are promising (≥ 78.9% accuracy). Our results also suggest that Raman spectroscopy may be used as a tool to monitor more dynamic changes in fish reproductive processes allowing researchers to track shifts associated with location, timing, and periodicity of spawning marked by the presence of later-stage yolked oocytes, partially spent ovaries and potentially skipped spawning. Climate-change impacts to the ecosystem will require efficient tools to monitor important reproductive aspects of natural resources. Raman spectroscopic methods show promise to meet those needs.
Statements
Data availability statement
The raw data supporting the conclusions of this article will be made available by the authors, without undue reservation.
Ethics statement
The animal study was approved by Alaska Fisheries Science Center, NOAA. The study was conducted in accordance with the local legislation and institutional requirements.
Author contributions
SN: Writing – original draft, Writing – review & editing. MA: Writing – original draft, Writing – review & editing. TH: Writing – original draft, Writing – review & editing. EG: Writing – review & editing. IB: Writing – review & editing. CW: Writing – review & editing.
Funding
The author(s) declare financial support was received for the research, authorship, and/or publication of this article. This project was supported by the NOAA Strategic Initiative “A revolutionary approach for improving age determine efficiency in fish using Fourier Transform Near Infrared Spectroscopy (FT-NIRS)” (https://repository.library.noaa.gov/view/noaa/56377) and by Alaska Sea Grant Project “A transformative approach to rapidly assess critical life history and energetic responses of fish to environmental change” #R/2022-03.
Acknowledgments
We thank the scientists and crew of the NOAA ship Oscar Dyson and the staff at Little Port Walter.
Conflict of interest
The authors declare that the research was conducted in the absence of any commercial or financial relationships that could be construed as a potential conflict of interest.
Publisher’s note
All claims expressed in this article are solely those of the authors and do not necessarily represent those of their affiliated organizations, or those of the publisher, the editors and the reviewers. Any product that may be evaluated in this article, or claim that may be made by its manufacturer, is not guaranteed or endorsed by the publisher.
Author disclaimer
The findings and conclusions in the paper are those of the authors and do not necessarily represent the views of the National Marine Fisheries Service, NOAA. Reference to trade names does not imply endorsement by the National Marine Fisheries Service, NOAA.
Supplementary material
The Supplementary Material for this article can be found online at: https://www.frontiersin.org/articles/10.3389/fmars.2024.1455514/full#supplementary-material
References
1
Adiks T. G. Bunkin A. F. Luk’yanchenko V. A. Pershin S. M. (2008). Variation in the fluorescent background in Raman spectra of distilled water purified by different methods. Phys. Wave Phen.16, 1–6. doi: 10.1007/s11975-008-1001-z
2
Alix M. Kjesbu O. S. Anderson K. C. (2020). From gametogenesis to spawning: How climate-driven warming affects teleost reproductive biology. J. Fish Biol.97, 607–632. doi: 10.1111/jfb.14439
3
Andersen C. M. Bro R. (2010). Variable selection in regression-a tutorial. J. Chemometr.24, 728–737. doi: 10.1002/cem.1360
4
Boulesteix A.-L. (2004). PLS dimension reduction for classification with microarray data. Stat. Appl. Genet. Molec. Biol.3, 1–30. doi: 10.2202/1544-6115.1075
5
Boulesteix A.-L. Durif G. Lambert-Lacroix S. Peyre J. Strimmer K. (2018) plsgenomics: PLS Analyses for Genomics. Available at: https://CRAN.R-project.org/package=plsgenomics.
6
Brown-Peterson N. J. Wyanski D. M. Saborido-Rey F. Macewicz B. J. Lowerre-Barbieri S. K. (2011). A standardized terminology for describing reproductive development in fishes. Mar. Coast. Fish.3, 52–70. doi: 10.1080/19425120.2011.555724
7
Butler H. J. Ashton L. Bird B. Cinque G. Curtis K. Dorney J. et al . (2016). Using Raman spectroscopy to characterize biological materials. Nat. Protoc.11, 664–687. doi: 10.1038/nprot.2016.036
8
Carnevali O. Candelma M. Sagrati A. Pignalosa P. Giorgini E. Gioacchini G. (2019). Macromolecular characterization of swordfish oocytes by FTIR imaging spectroscopy. Sci. Rep.9, 8850. doi: 10.1038/s41598-019-45065-7
9
Cushing D. H. (1990). Plankton production and year-class strength in fish populations: an update of the match/mismatch hypothesis. Adv. Mar. Biol.26, 249–293. doi: 10.1016/s0065-2881(08)60202-3
10
De Gelder J. De Gussem K. Vandenabeele P. Moens L. (2007). Reference database of Raman spectra of biological molecules. J. Raman Spectrosc.38, 1133–1147. doi: 10.1002/jrs.1734
11
Delwiche S. R. Reeves J. B. (2010). A graphical method to evaluate spectral preprocessing in multivariate regression calibrations: example with Savitzky—Golay filters and partial least squares regression. Appl. Spectrosc.64, 73–82. doi: 10.1366/000370210790572007
12
Dudoit S. Fridlyand J. Speed T. P. (2002). Comparison of discrimination methods for the classification of tumors using gene expression data. J. Am. Stat. Assoc.97, 77–87. doi: 10.1198/016214502753479248
13
Eisner L. B. Zuenko Y. I. Basyuk E. O. Britt L. L. Duffy-Anderson J. T. Kotwicki S. et al . (2020). Environmental impacts on walleye pollock (Gadus chalcogrammus) distribution across the Bering Sea shelf. Deep Sea Res. Pt. II: Top. Stud. Oceanogr.181-182, 104881. doi: 10.1016/j.dsr2.2020.104881
14
Flores A. Wiff R. Ganias K. Marshall C. T. (2019). Accuracy of gonadosomatic index in maturity classification and estimation of maturity ogive. Fish. Res.210, 50–62. doi: 10.1016/j.fishres.2018.10.009
15
Frank K. T. Leggett W. C. (1982). Environmental Regulation of Growth Rate, Efficiency, and Swimming Performance in Larval Capelin (Mallotus villosus), and its Application to the Match/Mismatch Hypothesis. Can. J. Fish. Aquat. Sci.39, 691–699. doi: 10.1139/f82-098
16
Gautier R. F. Singh B. A. Lê Cao K. A. (2017). mixOmics: An R package for ‘omics feature selection and multiple data integration. PloS Comput. Biol.13, e1005752. doi: 10.1371/journal.pcbi.1005752
17
Goldstein E. D. Helser T. E. Vollenweider J. J. Sreenivasan A. Sewall F. F. (2021). Rapid and reliable assessment of fish physiological condition for fisheries research and management using fourier transform near-infrared spectroscopy. Front. Mar. Sci.8. doi: 10.3389/fmars.2021.690934
18
Gorbatenko K. M. Lazhentsev A. E. (2016). The biochemical composition and calorie density of the walleye pollock Theragra chalcogramma in the Sea of Okhotsk. Russ. J. Mar. Biol.42, 591–601. doi: 10.1134/s1063074016070038
19
Guraya S. S. (1986). The cell and molecular biology of fish oogenesis. Monogr. Dev. Biol.18, 1–223.
20
Hollowed A. B. Barange M. Beamish R. J. Brander K. Cochrane K. Drinkwater K. et al . (2013). Projected impacts of climate change on marine fish and fisheries. ICES J. Mar. Sci.70, 1023–1037. doi: 10.1093/icesjms/fst081
21
Ianelli J. Honkalehto T. Wassermann S. Lauffenburger N. McGilliard C. Siddon S. (2023). Assessment of the eastern Bering Sea walleye pollock (Anchorage, AK: North Pacific Fishery Management Council).
22
Ishigaki M. Kawasaki S. Ishikawa D. Ozaki Y. (2016). Near-infrared spectroscopy and imaging studies of fertilized fish eggs: in vivo monitoring of egg growth at the molecular level. Sci. Rep.6, 20066. doi: 10.1038/srep20066
23
Kjesbu O. S. Bogstad B. Devine J. A. Gjøsæter H. Howell D. Ingvaldsen R. B. et al . (2014). Synergies between climate and management for Atlantic cod fisheries at high latitudes. Proc. Natl. Acad. Sci.111, 3478–3483. doi: 10.1073/pnas.1316342111
24
Kotwicki S. Buckley T. Honkaletho T. Walters G. (2005). Variation in the distribution of walleye pollock with temperature and implications for seasonal migration. Fish. Bull. U. S.103, 574–587.
25
Kucheryavskiy S. (2020). mdatools – R package for chemometrics. Chemom. Intell. Lab. Syst.198, 103937. doi: 10.1016/j.chemolab.2020.103937
26
Lazraq A. Cleroux R. Gauchi J. P. (2003). Selecting both latent and explanatory variables in the PLS1 regression model. Chemometrics Intelligent Lab. Syst.66 (2), 117–126. doi: 10.1016/S0169-7439(03)00027-3
27
Lieber C. A. Mahadevan-Jansen A. (2003). Automated Method for Subtraction of Fluorescence from Biological Raman Spectra. Appl. Spectrosc.57 (11), 1363–1367. doi: 10.1366/000370203322554518
28
Martens H. Stark E. (1991). Extended Multiplicative Signal Correction and Spectral Interference Subtraction: New Preprocessing Methods for near Infrared Spectroscopy. J. Pharm. Biomed. Anal.9 (8), 625–635. doi: 10.1016/0731-7085(91)80188-F
29
McCarthy A. Stienessen S. Levine M. Jones. D. (2018). Results of the acoustic-trawl surveys of walleye pollock (Gadus chalcogrammus) in the Gulf of Alaska, February-March 2017 (DY2017-01, DY2017-02, and DY2017-03). AFSC Processed Rep. (7600 Sand Point Way NE, Seattle WA 98115) 2018-04, 126.
30
McClure M. M. Haltuch M. A. Willis-Norton E. Huff D. D. Hazen E. L. Crozier L. G. et al . (2023). Vulnerability to climate change of managed stocks in the California Current large marine ecosystem. Front. Mar. Sci.10. doi: 10.3389/fmars.2023.1103767
31
Mishra A. Joy K. P. (2004). Ovarian monosaccharides (glucose and fructose): hormonal effects and their role in final oocyte maturation and egg quality in catfish Heteropneustes fossilis. Bloch. Indian J. Exp. Biol.42, 1084–1090.
32
Monnahan C. C. Adams G. D. Ferriss B. E. Shotwell S. K. McKelvey D. R. McGowan D. W. (2023). “Assessment of the walleye pollock stock in the Gulf of Alaska,” in Stock Assessment and Fishery Evaluation Report for Groundfish Resources of the Gulf of Alaska (Anchorage, Ak: Prepared by the Gulf of Alaska Groundfish Plan Team, North Pacific Fishery Management Council, P.O. Box 103136. North Pacific Fisheries Management Council, Anchorage).
33
Neidetcher S. K. Hurst T. P. Ciannelli L. Logerwell E. (2014). Spawning phenology and geography of Aleutian Islands and eastern Bering Sea Pacific cod (Gadus macrocephalus). Deep Sea Res. Pt. II: Top. Stud. Oceanogr.109, 204–214. doi: 10.1016/j.dsr2.2013.12.006
34
Pomerantsev A. L. Ye Rodionova O. (2014). Concept and role of extreme objects in PCA/SIMCA. J. Chemometr.28, 429–438. doi: 10.1002/cem.2506
35
Raml C. He X. Han M. Alexander D. R. Lu Y. (2011). Raman spectroscopy based on a single-crystal sapphire fiber. Opt. Lett.36, 1287. doi: 10.1364/ol.36.001287
36
R Core Team (2021). R: A Language and Environment for Statistical Computing (Vienna: R Foundation for Statistical Computing). Available at: https://www.R-project.org.
37
Rogers L. A. Dougherty A. B. (2018). Effects of climate and demography on reproductive phenology of a harvested marine fish population. Global Change Biol.25, 708–720. doi: 10.1111/gcb.14483
38
Rørvik C. J. Bogstad B. Ottersen G. Kjesbu O. S. (2022). Long-term interplay between harvest regimes and biophysical conditions may lead to persistent changes in age at sexual maturity of Northeast Arctic cod (Gadus morhua). Can. J. Fish. Aquat. Sci.79, 576–586. doi: 10.1139/cjfas-2021-0068
39
Sahu S. Ngasotter S. Mog M. Tesia S. Sharma S. Dayakar B. et al . (2020). A review on physiological, behavioral and metabolic role of dietary tryptophan in fish. Int. J. Chem. Stud.8, 2411–2417. doi: 10.22271/chemi.2020.v8.i3ai.9571
40
Talari A. C. S. Movasaghi Z. Rehman S. Rehman I. (2014). Raman spectroscopy of biological tissues. Appl. Spectrosc. Rev.50, 46–111. doi: 10.1080/05704928.2014.923902
41
TenBrink T. Neidetcher S. Arrington M. Benson I. Conrath C. Helser T. (2022). Fourier transform near infrared spectroscopy as a tool to predict spawning status in Alaskan fishes with variable reproductive strategies. J. Near Infrared Spectrosc.30, 179–188. doi: 10.1177/09670335221097005
42
Vitale F. Svedäng H. Cardinale M. (2006). Histological analysis invalidates macroscopically determined maturity ogives of the Kattegat cod (Gadus morhua) and suggests new proxies for estimating maturity status of individual fish. ICES J. Mar. Sci.63, 485–492. doi: 10.1016/j.icesjms.2005.09.001
43
West G. (1990). Methods of assessing ovarian development in fishes: a review. Aust. J. Mar. Freshw. Res.41, 199. doi: 10.1071/mf9900199
44
Williams K. (2007). Evaluation of the macroscopic staging method for determining maturity of female walleye pollock Theragra chalcogramma in Shelikof Strait, Alaska. Alaska Fish. Res. Bull.12, 252–263.
45
Wold S. Ruhe A. Wold H. Dunn W. J. III . (1984). The collinearity problem in linear regression. The partial least squares (PLS) approach to generalized inverses. SIAM J. Sci. Stat. Comput.5, 735–743. doi: 10.1137/0905052
Summary
Keywords
maturity, spawning stock biomass, histology, spectroscopy, oocyte
Citation
Neidetcher SK, Arrington MB, Helser TE, Goldstein ED, Benson IM and Waters CD (2024) A novel approach for rapidly determining the reproductive status of walleye pollock (Gadus chalcogrammus) using Raman spectroscopy. Front. Mar. Sci. 11:1455514. doi: 10.3389/fmars.2024.1455514
Received
27 June 2024
Accepted
03 September 2024
Published
08 October 2024
Volume
11 - 2024
Edited by
Tomaso Fortibuoni, Istituto Superiore per la Protezione e la Ricerca Ambientale (ISPRA), Italy
Reviewed by
Rosalia Ferreri, National Research Council (CNR), Italy
Markus Min, University of Washington, United States
Updates
Copyright
© 2024 Neidetcher, Arrington, Helser, Goldstein, Benson and Waters.
This is an open-access article distributed under the terms of the Creative Commons Attribution License (CC BY). The use, distribution or reproduction in other forums is permitted, provided the original author(s) and the copyright owner(s) are credited and that the original publication in this journal is cited, in accordance with accepted academic practice. No use, distribution or reproduction is permitted which does not comply with these terms.
*Correspondence: Sandra K. Neidetcher, sandi.neidetcher@noaa.gov
Disclaimer
All claims expressed in this article are solely those of the authors and do not necessarily represent those of their affiliated organizations, or those of the publisher, the editors and the reviewers. Any product that may be evaluated in this article or claim that may be made by its manufacturer is not guaranteed or endorsed by the publisher.