- 1College of Oceanic and Atmospheric Sciences, Ocean University of China, Qingdao, China
- 2Yazhou Bay Innovation Institute, Hainan Tropical Ocean University, Sanya, China
- 3Jiangsu Research Center of Tidal Flat, Nanjing, China
In recent years, the position of the Yellow River Estuary (YRE) entrance has changed frequently, and human activities such as land reclamation have contributed to the transformation of the deltaic topography. These combined factors have resulted in altered hydrodynamics and tidal shear fronts (TSFs) in the surrounding sea area. However, there are few studies on the characteristics of the TSFs before and after diversion, so this paper establishes a hydrodynamic model based on the Finite Volume Coastal Ocean Model (FVCOM) for the years 2005, 2014, and 2020 and analyzes the characteristics of the changes in the tidal currents and the TSFs before and after diversion and the long-term evolution trends. The results reveal that the M2 amphidromic point near the YRE shifted eastward by 4.9 km from 2005 to 2014 and migrated southeastward by 6.8 km between 2014 and 2020. Additionally, significant changes were observed in the maximum and residual currents within the active mouth (AM), the old Qing 8 (Q8) channel, the old QingShuiGou (QSG) channel, and the southeastern region. Notably, the residual currents exhibit vertical fronts with substantial current velocity differences across the slopes. After the diversion of the YRE, the northern TSFs disappeared. The TSFs in the AM gradually shifted landward, while the TSFs in the southeastern region shifted offshore. In the vertical direction, the frontal centerlines of the TSFs gradually moved offshore from top to bottom. The intensity of the TSFs at the same latitude was positively correlated with the offshore distance. Generally, steeper slopes were associated with larger bottom stress gradients, which in turn corresponded to stronger TSFs.
1 Introduction
Estuaries are critical zones for sea-land interaction, characterized by complex geomorphological evolution mechanisms (Wang et al., 2015). Variations in water depth and estuarine geometry can lead to spatial changes in tidal currents and significant asymmetries in tidal fluctuations (Jiang et al., 2013). In the Lingdingyang estuary, the deepening and narrowing of the channel have resulted in increased wave speeds, amplified tidal waves, elevated flow velocities, and enhanced standing wave characteristics, whereas dredging and land reclamation have diminished residual flow (Zhang et al., 2021; Chen et al., 2024). The sediment accumulation outside the Yangtze River Estuary has led to increased shoal formation, thereby decreasing tidal prism and weakening tidal currents (Zhang et al., 2018). The alteration of estuarine location in the Yellow River Delta (YRD), along with human activities such as land reclamation, has similarly modified the hydrodynamic environment of adjacent sea areas. Wang et al. (2015) reported a southward migration of the M2 amphidromic point between 1996 and 2012, while Zhu et al. (2016) reported a southeastward shift of the amphidromic point between 1980 and 2019. The amplitude change reached a maximum of 20 cm between 1976 and 2011 (Pelling et al., 2013). Shoreline and water depth are significant factors causing these changes (Zhu et al., 2018). Moreover, shoreline modifications can lead to diminished residual currents and reduced water exchange and material transport capacity, consequently impairing the pollutant dispersion capability (Jia et al., 2018).
There are two types of fronts in the YRE: reverse TSFs and homogenous TSFs. The reverse TSFs are stronger than the homogenous TSFs, and the homogenous TSFs are more pronounced during ebb tides (Wang et al., 2024). Li et al. (1994) classified the reverse tide shear fronts (TSFs) into inner-flood-outer-ebb (IFOE) and inner-ebb-outer-flood (IEOF) TSFs. The formation of TSFs is influenced by a combination of factors, including tides, topography, and river runoff (Qiao et al., 2008). A shear front is an obvious flow gradient formed on both sides of the front due to the asymmetry of the rising and falling tides. This tidal phase gradient is caused by the large bottom friction gradient generated by the slope of the delta front. The intensity of the TSFs decreases with increasing distance offshore (Wang et al., 2024). When the flow increases, the TSFs move seaward, the width decreases, and the shear strength is concentrated (Ji et al., 2020). The low-flow TSFs zones significantly reduce the suspended body flux, allowing most of the sediment to be deposited in the arc near the delta (Zhan et al., 2020; Mao et al., 2022). Less than 1% of the sediment can be transported to the outer ocean via TSFs (Bi et al., 2010; Qiao et al., 2016; Wang et al., 2019). TSFs are also affected by climate change. Storm surges enhance tidal residual currents and weaken tidal TSFs (Fan et al., 2020). Frontal activity is significantly enhanced after El Niño events, whereas the opposite is true after La Niña events (Du et al., 2023). TSFs have significant onshore movement in the long term, and the frequency of occurrence generally shows an interannual weakening trend (Wang et al., 2017; Du et al., 2023).
Among the above studies, most studies on the hydrodynamics of the Yellow River Estuary (YRE) and the long-term evolution of the TSFs were concentrated in the last century and the beginning of this century, and most of the attention was focused on the active mouth (AM) in the corresponding period. However, since water and sand transfer, estuarine location, water depth, and shoreline have changed, fewer systematic studies have investigated tidal current changes at different estuarine locations in this century, and fewer studies have investigated the response of each feature of TSFs to the direction of the estuary. Therefore, in this work, numerical simulations are carried out in 2005, 2014 and 2020 as examples, aiming to explore the laws and trends of ocean dynamics and TSFs evolution with topography along various flow paths in the YRD over the past two decades. This is informative for a comprehensive understanding of the changing dynamic trends in the YRD.
2 Study area
The YRE is situated between Bohai Bay and Laizhou Bay, with an offshore depth typically less than 15 m (Figure 1). The YRD is endowed with fertile soils, abundant water resources, and extensive tidal flats and wetlands, which possess significant ecological value (Kuenzer et al., 2014). However, the ecosystem in this region is sensitive and fragile because of the impacts of human activities and natural factors (Fagherazzi et al., 2015). The YRE is classified as a microtidal estuary, that is characterized predominantly by irregular semidiurnal tides, with an average tidal range of 0.73-1.77 m (Yang et al., 2011). There exists an amphidromic point near Dongying Port, around which the tidal wave circulates in a counterclockwise direction. Coastal currents along the YRD exhibit reciprocating flow, whereas a rotating current is observed in the center of Bohai Bay (Hu and Cao, 2003; Fan and Huang, 2005). The flood tide flows toward the southeast, whereas the ebb tide moves northwest-north (Fan et al., 2006). The Yellow River transports a substantial amount of sediment into the sea, with the accumulation and erosion of these sediments influencing the geomorphological changes in the Delta. Owing to climate change and human activities, the water and sediment discharge of the Yellow River into the sea has significantly diminished (Yu et al., 2013). In recent years, the YRD has experienced frequent river diversions. The modern YRD primarily refers to the subdelta lobes formed since the river redirected to the QingShuiGou (QSG) in 1976. In 1996, an engineering project was implemented at the Qing8 (Q8), redirecting the river into the sea through this channel. Subsequently, the delta has evolved, with the QSG regions experiencing coastal erosion and retreat due to the loss of sediment supply and seawater abrasion. In 2007, the river mouth was artificially redirected from east to the current northern flow route, and in 2013, a natural outflow route was established, resulting in a dual channel configuration. Under the interaction of tidal currents and TSFs, sediments rapidly accumulate near the AM, leading to the swift extension of the coastline into the sea (Li et al., 2001; Wang et al., 2007).
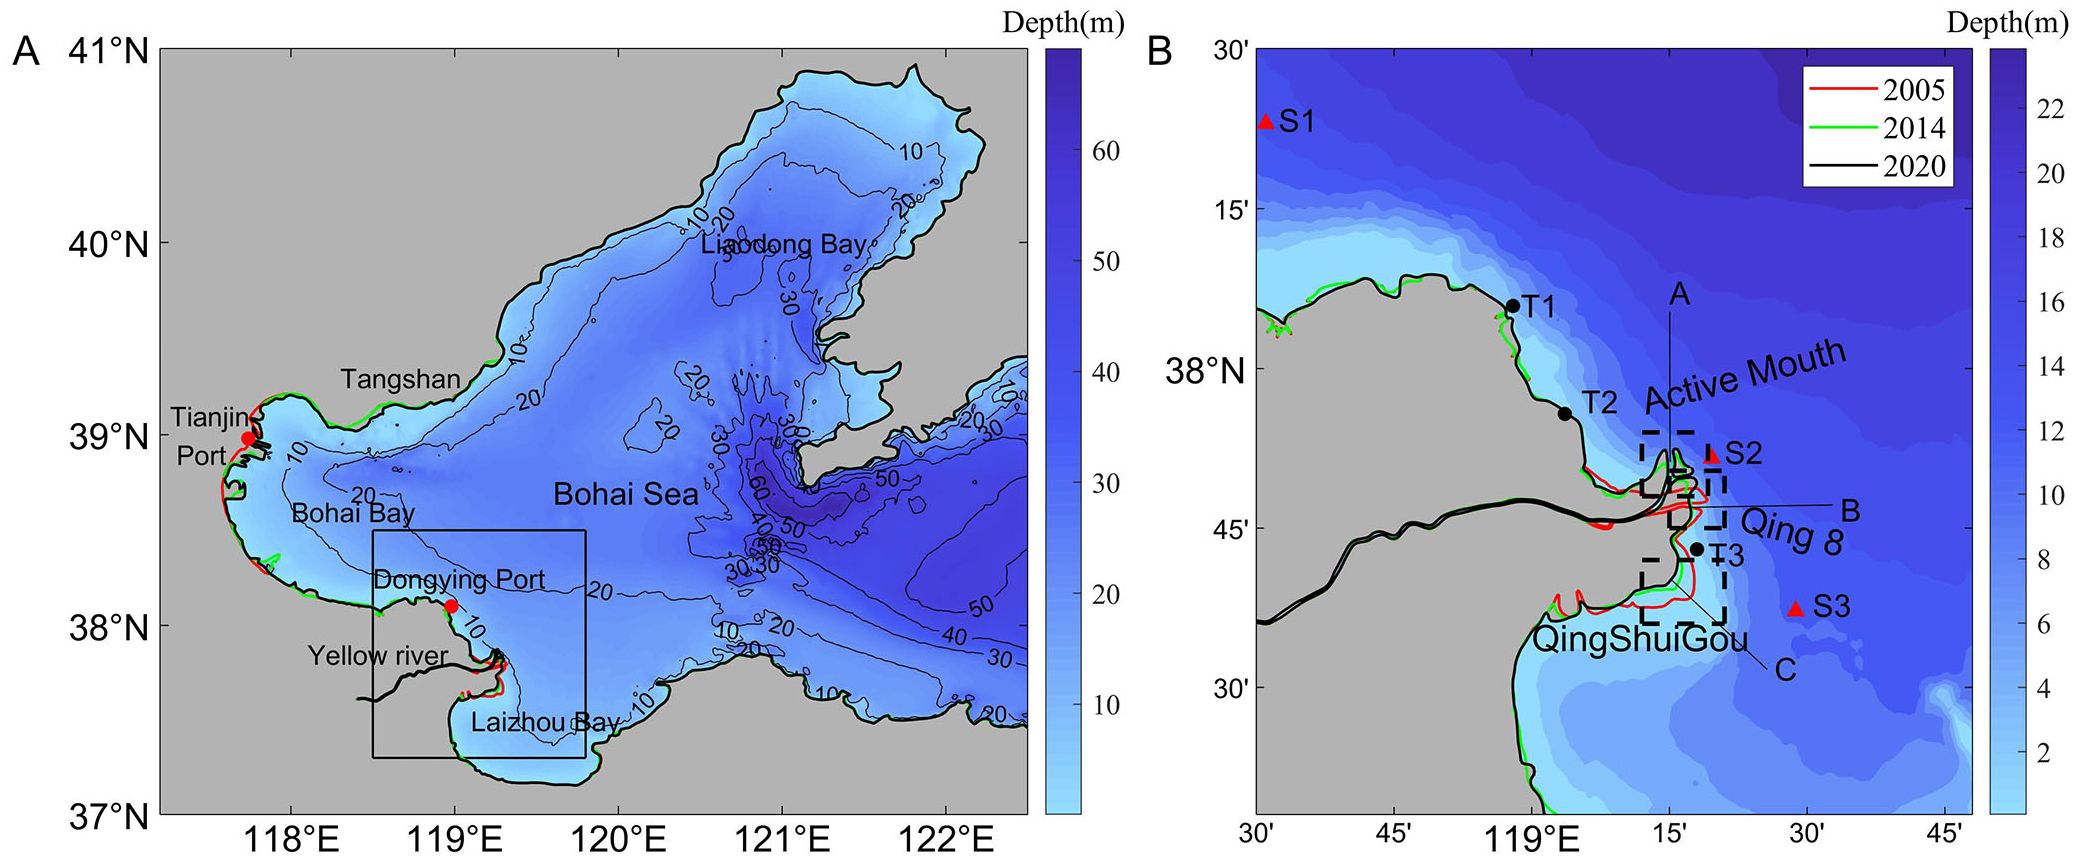
Figure 1. Study area and measurement site locations. (A) Bathymetry and shoreline of the Bohai Sea in 2020. (B) Location of the Yellow River Delta. The shorelines for the years 2005, 2014, and 2020 are represented by red, green, and black lines, respectively. T1, T2 and T3 are measured tide stations; S1, S2 and S3 are measured current velocity and direction stations; and (A, B) and (C) are three cross-sections.
3 Materials and methods
3.1 Data
The coastline data were obtained from Landsat TM/OLI_TIRS satellite remote sensing images from the Geospatial Data Cloud (http://www.gscloud.cn/). To minimize the impacts of seasonal variations and storm surges on interpretation, low-cloud images from the spring and summer of 2005, 2014, and 2020 were selected. Bathymetric data for 2005 were derived from the 2005 Laizhou Bay and 2009 Bohai Bay nautical charts published by the Naval Command’s Hydrographic Department and digitized after datum correction. Bathymetric data for 2014 were obtained from the Maritime Safety Administration’s electronic nautical charts for Laizhou Bay and the Bohai Sea. 2020 Electronic Chart Download from ShipNews.com. Elevation, current velocity and direction data for model validation were acquired from the 2020 summer survey data of the group in the YRD waters.
3.2 Model simulation
In this paper, a three-dimensional orthostatic tidal current model applicable to the Bohai Sea and the YRE was established based on the Finite Volume Coastal Ocean Model (FVCOM). This model is computed via the finite volume method, which combines the characteristics of the finite element method and the finite difference method to discretize the control equations. Combining an unstructured triangular grid for the horizontal plane with a σ coordinate system vertically allows for efficient modeling of complex terrain near the shore. The FVCOM further enhances computational efficiency through a technique called inner and outer mold separation calculations (Chen et al., 2003). Based on the above features, the FVCOM is widely used in nearshore areas with irregular shorelines and complex topography (Chen et al., 2006, 2007).
The model encompasses the entire Bohai Sea, with the eastern Bohai Strait from the Shandong Peninsula to the Dalian coast defining the open boundary. The resolution is approximately 10 km at the open boundary, 2 km in the central Bohai Sea, and 300 m in the nearshore area of the YRE. The inverse distance interpolation method was used for grid water depth interpolation. The area was divided vertically into 11 layers, and the surface and bottom layers were discretized using the GEOMETRIC method. The turbulent mixing model of Mellor-Yamada of order 2.5 was used for vertical mixing, and the bottom friction coefficient was 0.0001 (Mellor and Yamada, 1982). The model is tidally driven and does not account for surface winds. The tidal forcing at the open boundary incorporated thirteen tidal constituents: M2, S2, K1, O1, P1, Q1, K2, N2, MF, MM, M4, MS4, and MN4. The model river open boundary was set at the Lijin Hydrological Station of the Yellow River, the monthly runoff from the China Sediment Bulletin (www.mwr.gov.cn) was used for the runoff in 2005, and the daily measured runoff from the Yellow River Conservancy Commission (yrcc.gov.cn) was used for the runoff in 2014 and 2020. The model was calculated for July and August in 2005, 2014 and 2020. The model was cold-started and initialized for 2 days to reduce the influence of the initial shock on the subsequent results. The initial temperature was 25°C and the salinity was 35‰. The outer mold time step was 1 s and the inner mold time step was 10 s.
3.3 Analysis methods
ENVI software was used to preprocess the remote sensing images, including radiometric and atmospheric corrections. Following preprocessing, the normalized difference water body index (NDWI) method was employed to distinguish the land−water boundaries effectively, which can provide water body information to obtain the approximate shoreline. Finally, image binarization and visual interpretation were combined to obtain high-precision shoreline data. The NDWI is calculated as follows (McFeeters, 1996),
where Gre is the reflectance of the green band and NIR is the reflectance of the near-infrared band. The combination of the green band and NIR band can suppress vegetation information and enhance water body information.
The shear strength of a TSF is the most important characteristic for describing the TSF. This shear strength is defined as the difference between the current velocities on either side of the front and can be calculated as the gradient of the current (GC) (Wang et al., 2017).
Where x1 and x2 represent two positions on either side of the front equidistant from the center of the grid cell, the line connecting x1 and x2 is approximately perpendicular to the centerline of the front, and U and d are the velocity vector and distance between the two positions, respectively.
The Euler residual flow reflects the overall net transport trend exhibited by all substances passing through a given spatial point, playing a crucial role in the dissemination of pollutants and their long-term stable distribution. The Euler tidal residual flow is defined as the average current velocity at a fixed point over n tidal cycles. The calculation formula is as follows:
where and represent the Eulerian mean velocities in the x and y directions, respectively, denotes the time at the i-th moment, T is a tidal cycle, and are the velocities at the fixed point in the x and y directions at the i-th moment, n is the number of tidal cycles, and dt is the time step for the numerical simulation. This study calculates the Euler residual flow over 60 tidal cycles, spanning from the beginning of the spring tide at the start of the month to the conclusion of the spring tide a month later.
The TSF formation mechanism is closely related to the water depth and bottom stress in the study area (Qiao et al., 2008). Therefore, the bottom stress can be used to explore the long-term response of the TSFs to topographic changes, and the bottom stress can be calculated as follows (Malarkey and Davies, 2012):
where = 1.025 kg/m3 is the density of water, u is the current velocity near the seafloor, is the drag coefficient, M = 78 m1/3/s is the Manning number, and h is the depth of the water. The equation shows that the bottom stress is mainly affected by the current velocity of the seafloor and the depth of the water.
3.4 Model validation
The performance of the model was evaluated using the root mean square error (RMSE) and correlation coefficient (CC). The formulas for these two parameters are as follows.
where and are the simulated and observed values, respectively, n is the number of variables, and and are the arithmetic means of the simulated and observed values, respectively.
In Figure 2, the simulated values are validated against the measured tide levels, current velocity, and current direction from 2020. The model results for elevation in Figure 2A all have CC values of 0.92 or greater between the model results and the observed values, and the RMSE values range from 9.5 to 12.7 cm. The observed values of the current velocity and current direction in Figure 2B are vertical averages. The RMSE values of the current velocity range from 7 to 12 cm/s, and the CC values are all greater than 0.84. The current direction simulations were not as good as the tide level and current velocity simulations, but the CC values were greater than 0.72 and had similar trends. Overall, the model validation showed that the model generally performed well in terms of tidal dynamics.
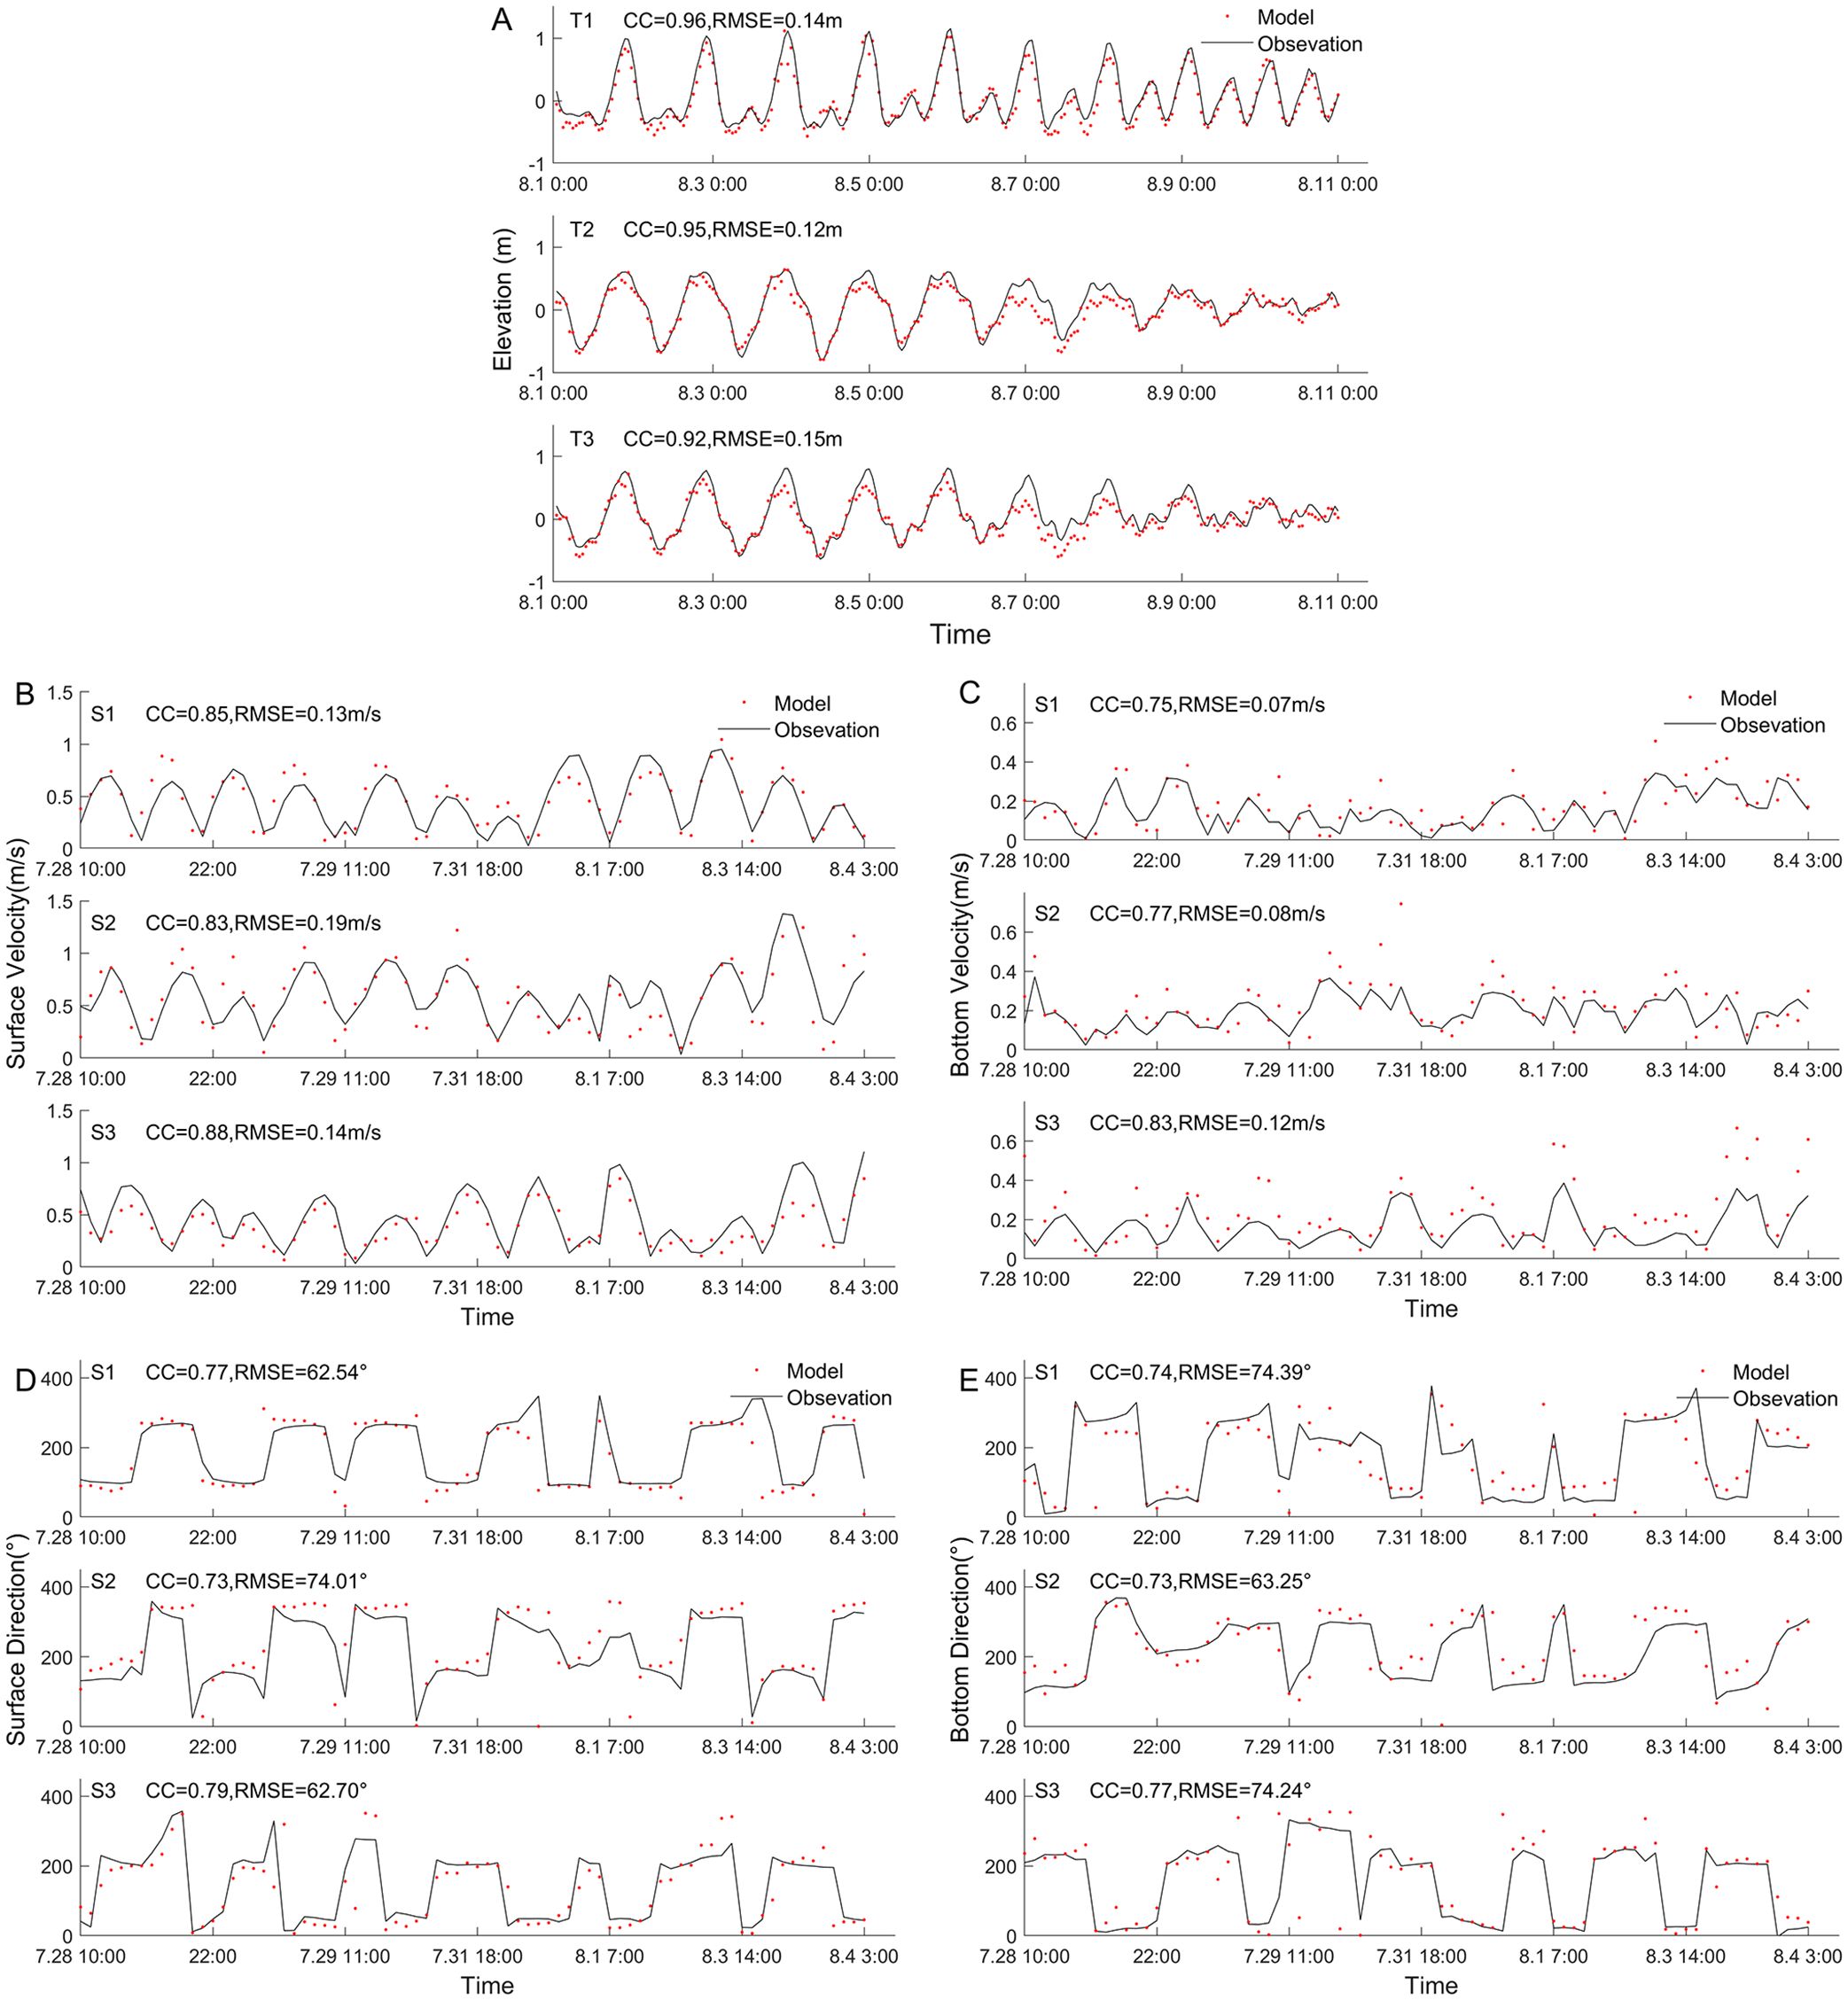
Figure 2. Comparison of the measured and simulated values. (A) Tide elevation validation. (B) Surface current velocity validation. (C) Bottom current velocity validation. (D) Surface current direction validation. (E) Bottom current direction validation.
4 Results and discussion
4.1 M2 amphidromic points
As shown in Figure 3, the M2 amphidromic point near Dongying Harbor degraded shoreward in 2005, moved eastward by 4.9 km in 2014, and then moved southeastward by 6.8 km in 2020. The movement of the amphidromic point is closely linked to changes in the tidal flat area. These flats act as both reservoirs and dissipators of tidal energy. At high tide, they store tidal and kinetic energy, releasing it again during low tide (Song et al., 2013; Wu et al., 2023). As mudflat areas shrink due to reclamation, the tidal energy previously stored within them will redistribute throughout the surrounding sea. This redistribution causes the amphidromic point to shift away from the coastline (Zhu et al., 2016).

Figure 3. Changes in the amplitude and latency angle of the M2 tidal component. The colors indicate amplitude changes, and the contours are isochronous time lines. (A) Changes from 2005 to 2014; (B) Changes from 2014 to 2020; (C) Total change from 2005 to 2020.
With the migration of the M2 amphidromic point, the synoptic timeline near it rotated clockwise, resulting in an increase in the delay angle near the YRE in the range of 0-20°, while the synoptic timeline in Bohai Bay rotated counterclockwise, resulting in a decrease in the delay angle in Bohai Bay in the range of 0-15°. The amplitude in Bohai Bay west of the amphidromic point increased, and the amplitude in the far west increased within the range of 2-10 cm. The primary driver of this M2 amplitude amplification was the changes in the Bohai Bay coastline due to land reclamation for development projects such as the Tianjin Port and the Tangshan coastal industrial zone (Sun et al., 2017; Lu et al., 2022). The amplitude decreased in the direction of the central Bohai Sea and Laizhou Bay east of the amphidromic point, with a range of 4-12 cm. From 2005-2015, the reclamation project was active, and the length of the coastline increased rapidly, and the growth rate decreased only until 2015. While the reclamation activities were strictly controlled from 2018 onward, which slowed the change in the coastline between 2014 and 2020, and the magnitude of the amplitude change decreased (Wei et al., 2022; Huang et al., 2023).
The variation in the amplitude of the S2 tide was consistent with that of the M2 tide, and the variations in the K1 and O1 tidal constituents were smaller than those in the semidiurnal tides, suggesting that topographical alterations have a more pronounced impact on semidiurnal tides than on diurnal tides (Pan et al., 2022).
4.2 Tidal ellipses
4.2.1 Surface changes
The M2 tide is the dominant tide in this area, and the other three tidal components are relatively small. The M2 and S2 tidal constituents are mainly clockwise (Figures 4A-C); the K1 and O1 tidal constituents are clockwise in the Ludong and Laizhou Bay waters and counterclockwise in most other areas (Figures 4D-F). After the diversion of the YRE, the M2 tides exhibited a counterclockwise ellipse at AM, and the K1 tide formed a clockwise current. The direction of the tidal ellipse is related to the topography (Miao et al., 2017). Therefore, this may be due to the pulling effect between the high topography of the estuary and the low topography of the small area, but the exact reason needs to be further investigated.
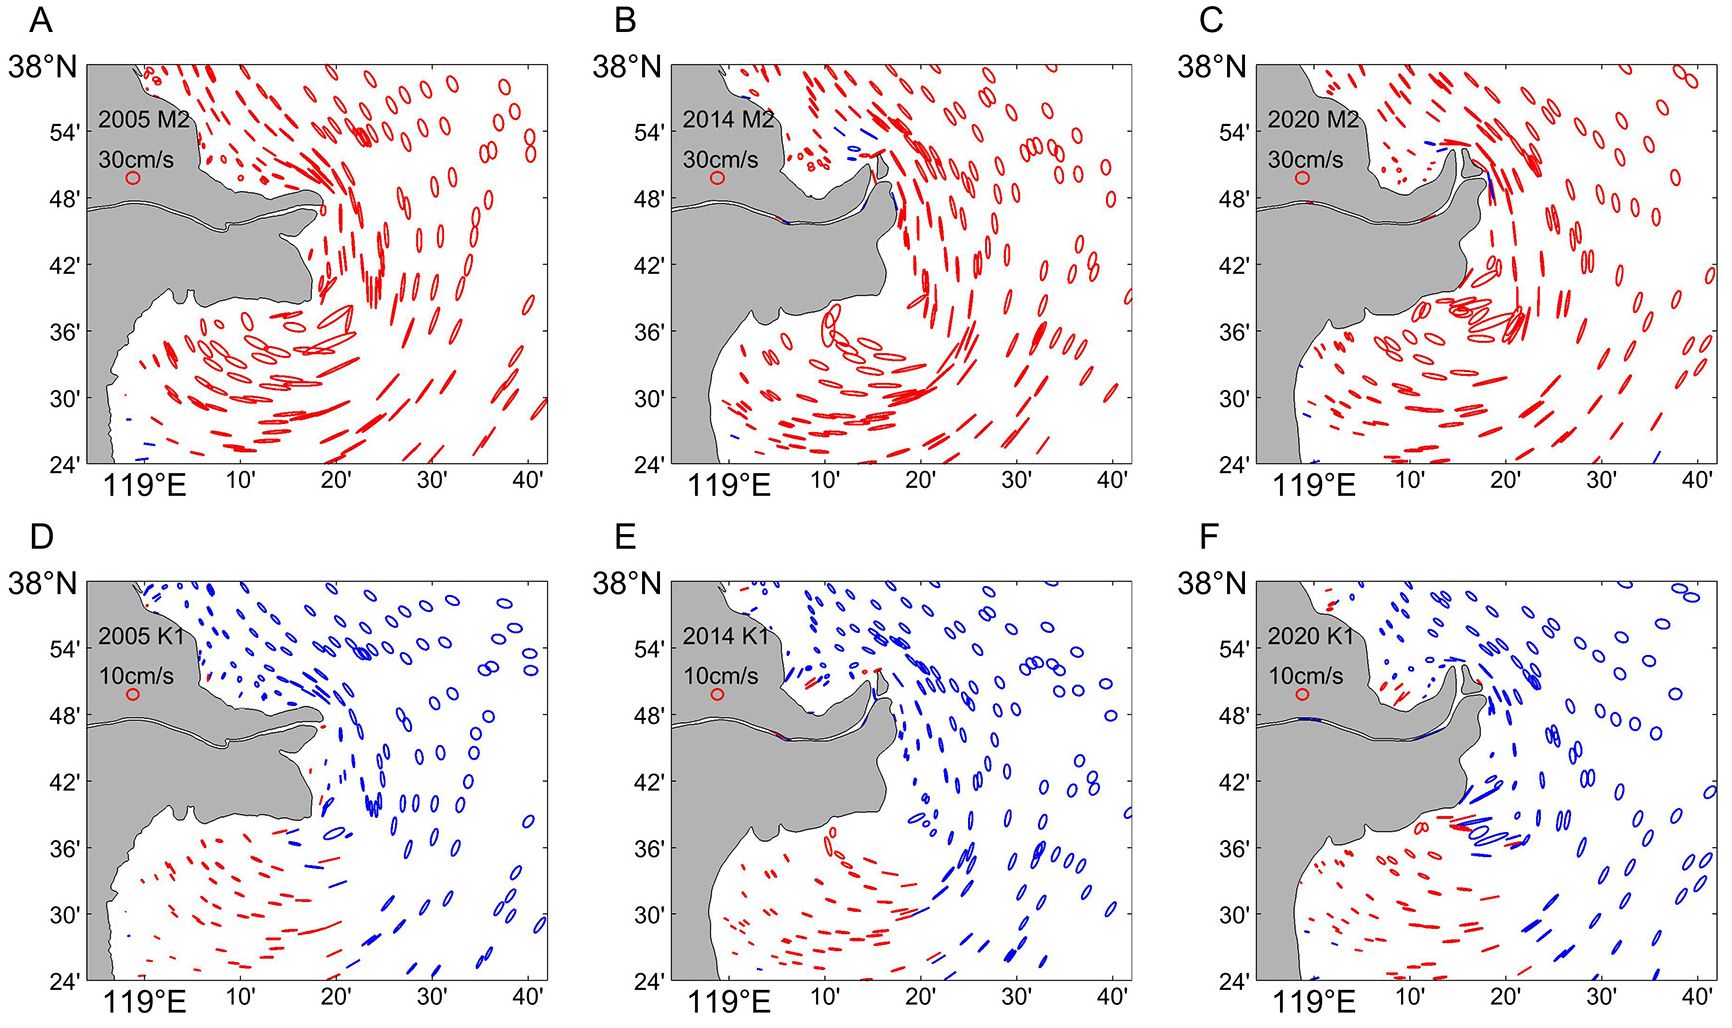
Figure 4. M2 and K1 tidal ellipses. Clockwise ellipses in red, counterclockwise ellipses in blue. (A-C) M2 tidal ellipses in 2005, 2014, and 2020. (D-F) K1 tidal ellipses in 2005, 2014, and 2020.
The direction of the long axis of the tidal ellipse is basically consistent with the direction of the shoreline, showing a north-south direction. Near the YRE, the direction of the long axis is perpendicular to the mouth of the river. In addition, the direction of the long axis of the tidal current ellipse in Laizhou Bay is perpendicular to the coastline, which is related to the extensive mudflat and the movement of large amounts of seawater toward the shore in this region. The length of the long axis of the ellipse represents the magnitude of the velocity of the maximum tidal current. The maximum tidal velocity of each subtide is mainly distributed in AM, the old QSG channel and its southeastern sea area. The highest values of maximum tidal velocities for semidiurnal tides occurred in the southeastern part of the old QSG channel, with maximum tidal velocities of up to 1.81 m/s, 1.27 m/s, and 1.46 m/s for the M2 tides in 2005, 2014, and 2020, respectively. The highest values of maximum tidal velocities for all-day tides occurred in the old QSG channel, with maximum tidal velocities as high as 0.44 m/s, 0.31 m/s and 0.52 m/s for K1 in 2005, 2014 and 2020, respectively.
Figures 5A, B show that the maximum current velocity of the M2 tidal constituent tended to decrease within Laizhou Bay, but the range of maximum current velocity growth in the north gradually extended to the south. Figures 5D, E reveal that the maximum current velocity of the K1 tidal constituent exhibited a small decrease followed by an increase over time. However, this variation was relatively minor. The most significant changes in maximum tidal velocities were concentrated in three key areas: the AM, the old QSG channel, and the southeastern high-current zone. At the AM, the M2 and K1 tidal constituents continued to decrease at the northern outlet, but the maximum tidal velocity at the northern end of the river outlet increased. Analysis of the maximum tidal velocities reveals a decreasing trend in the old Q8 channel. In the old QSG channel, the M2 tidal constituent also decreased, while the K1 tidal constituent showed an initial decrease followed by an increase. Southeast of the old QSG channel (an area with a high current velocity), the M2 tidal constituent continued to decrease. The K1 tidal constituent in this area exhibited a decrease in maximum velocity between 2005 and 2014, followed by a slight increase from 2014 to 2020. In summary, the maximum tidal current velocities exhibited a distinct spatial pattern. The continuous outward extension of the estuarine sand spit increases the current velocity so that at the northern end of the AM, the tidal current velocity tends to increase (Li et al., 2014). In contrast, in the old Q8 channel, the old QSG channel and the southeast highway area, tidal current velocities tend to decrease because of continuous erosion and shoreline retreat.
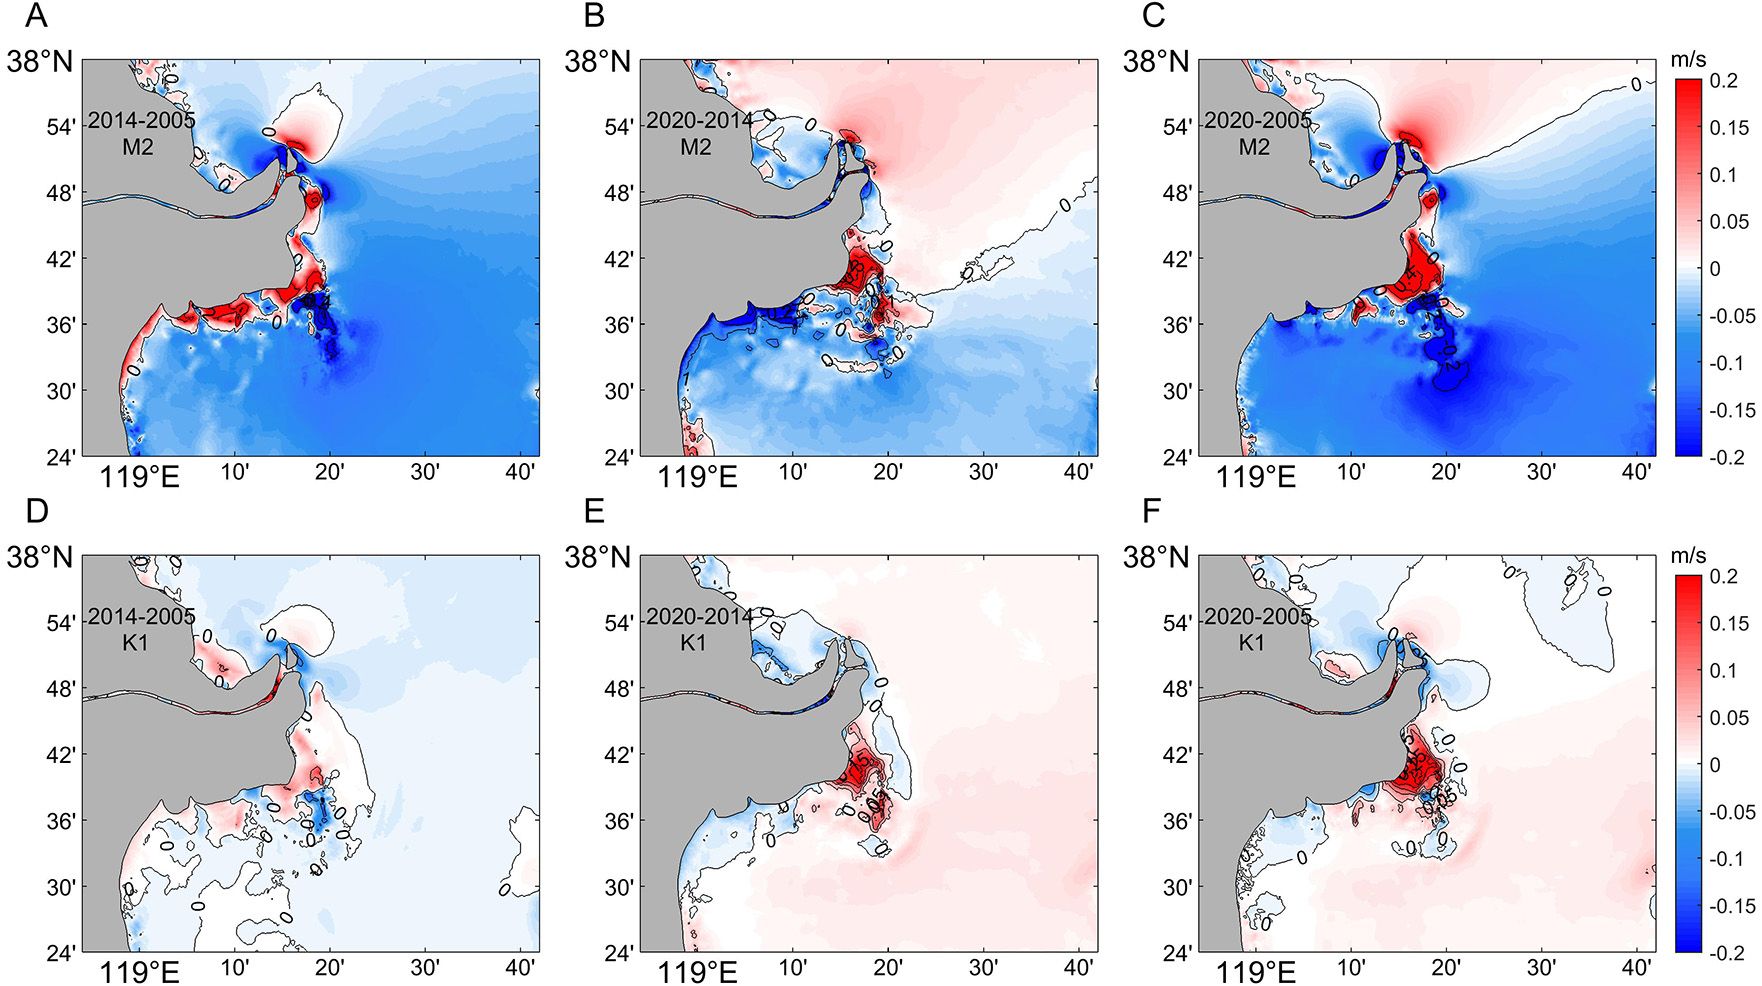
Figure 5. Variation in the maximum current velocity for the M2 and K1 tidal stations. (A-C) Changes in M2 tidal constituents from 2005 to 2020. (D-F) Changes in K1 tidal constituents from 2005 to 2020.
4.2.2 Vertical changes
Due to the different topography and scouring conditions, the surface changes may differ from those in the vertical direction, therefore, to study the changes in vertical tidal currents, three sections parallel to the direction of the estuary were established in the area of the AM, the old Q8 channel, and the old QSG channel with the shoreline as the starting point. The M2 tide constituent was used as an example to study the distribution of the vertical maximum current velocity due to the M2 tide constituent with the topography along the three sections, and the results are shown in Figure 6.
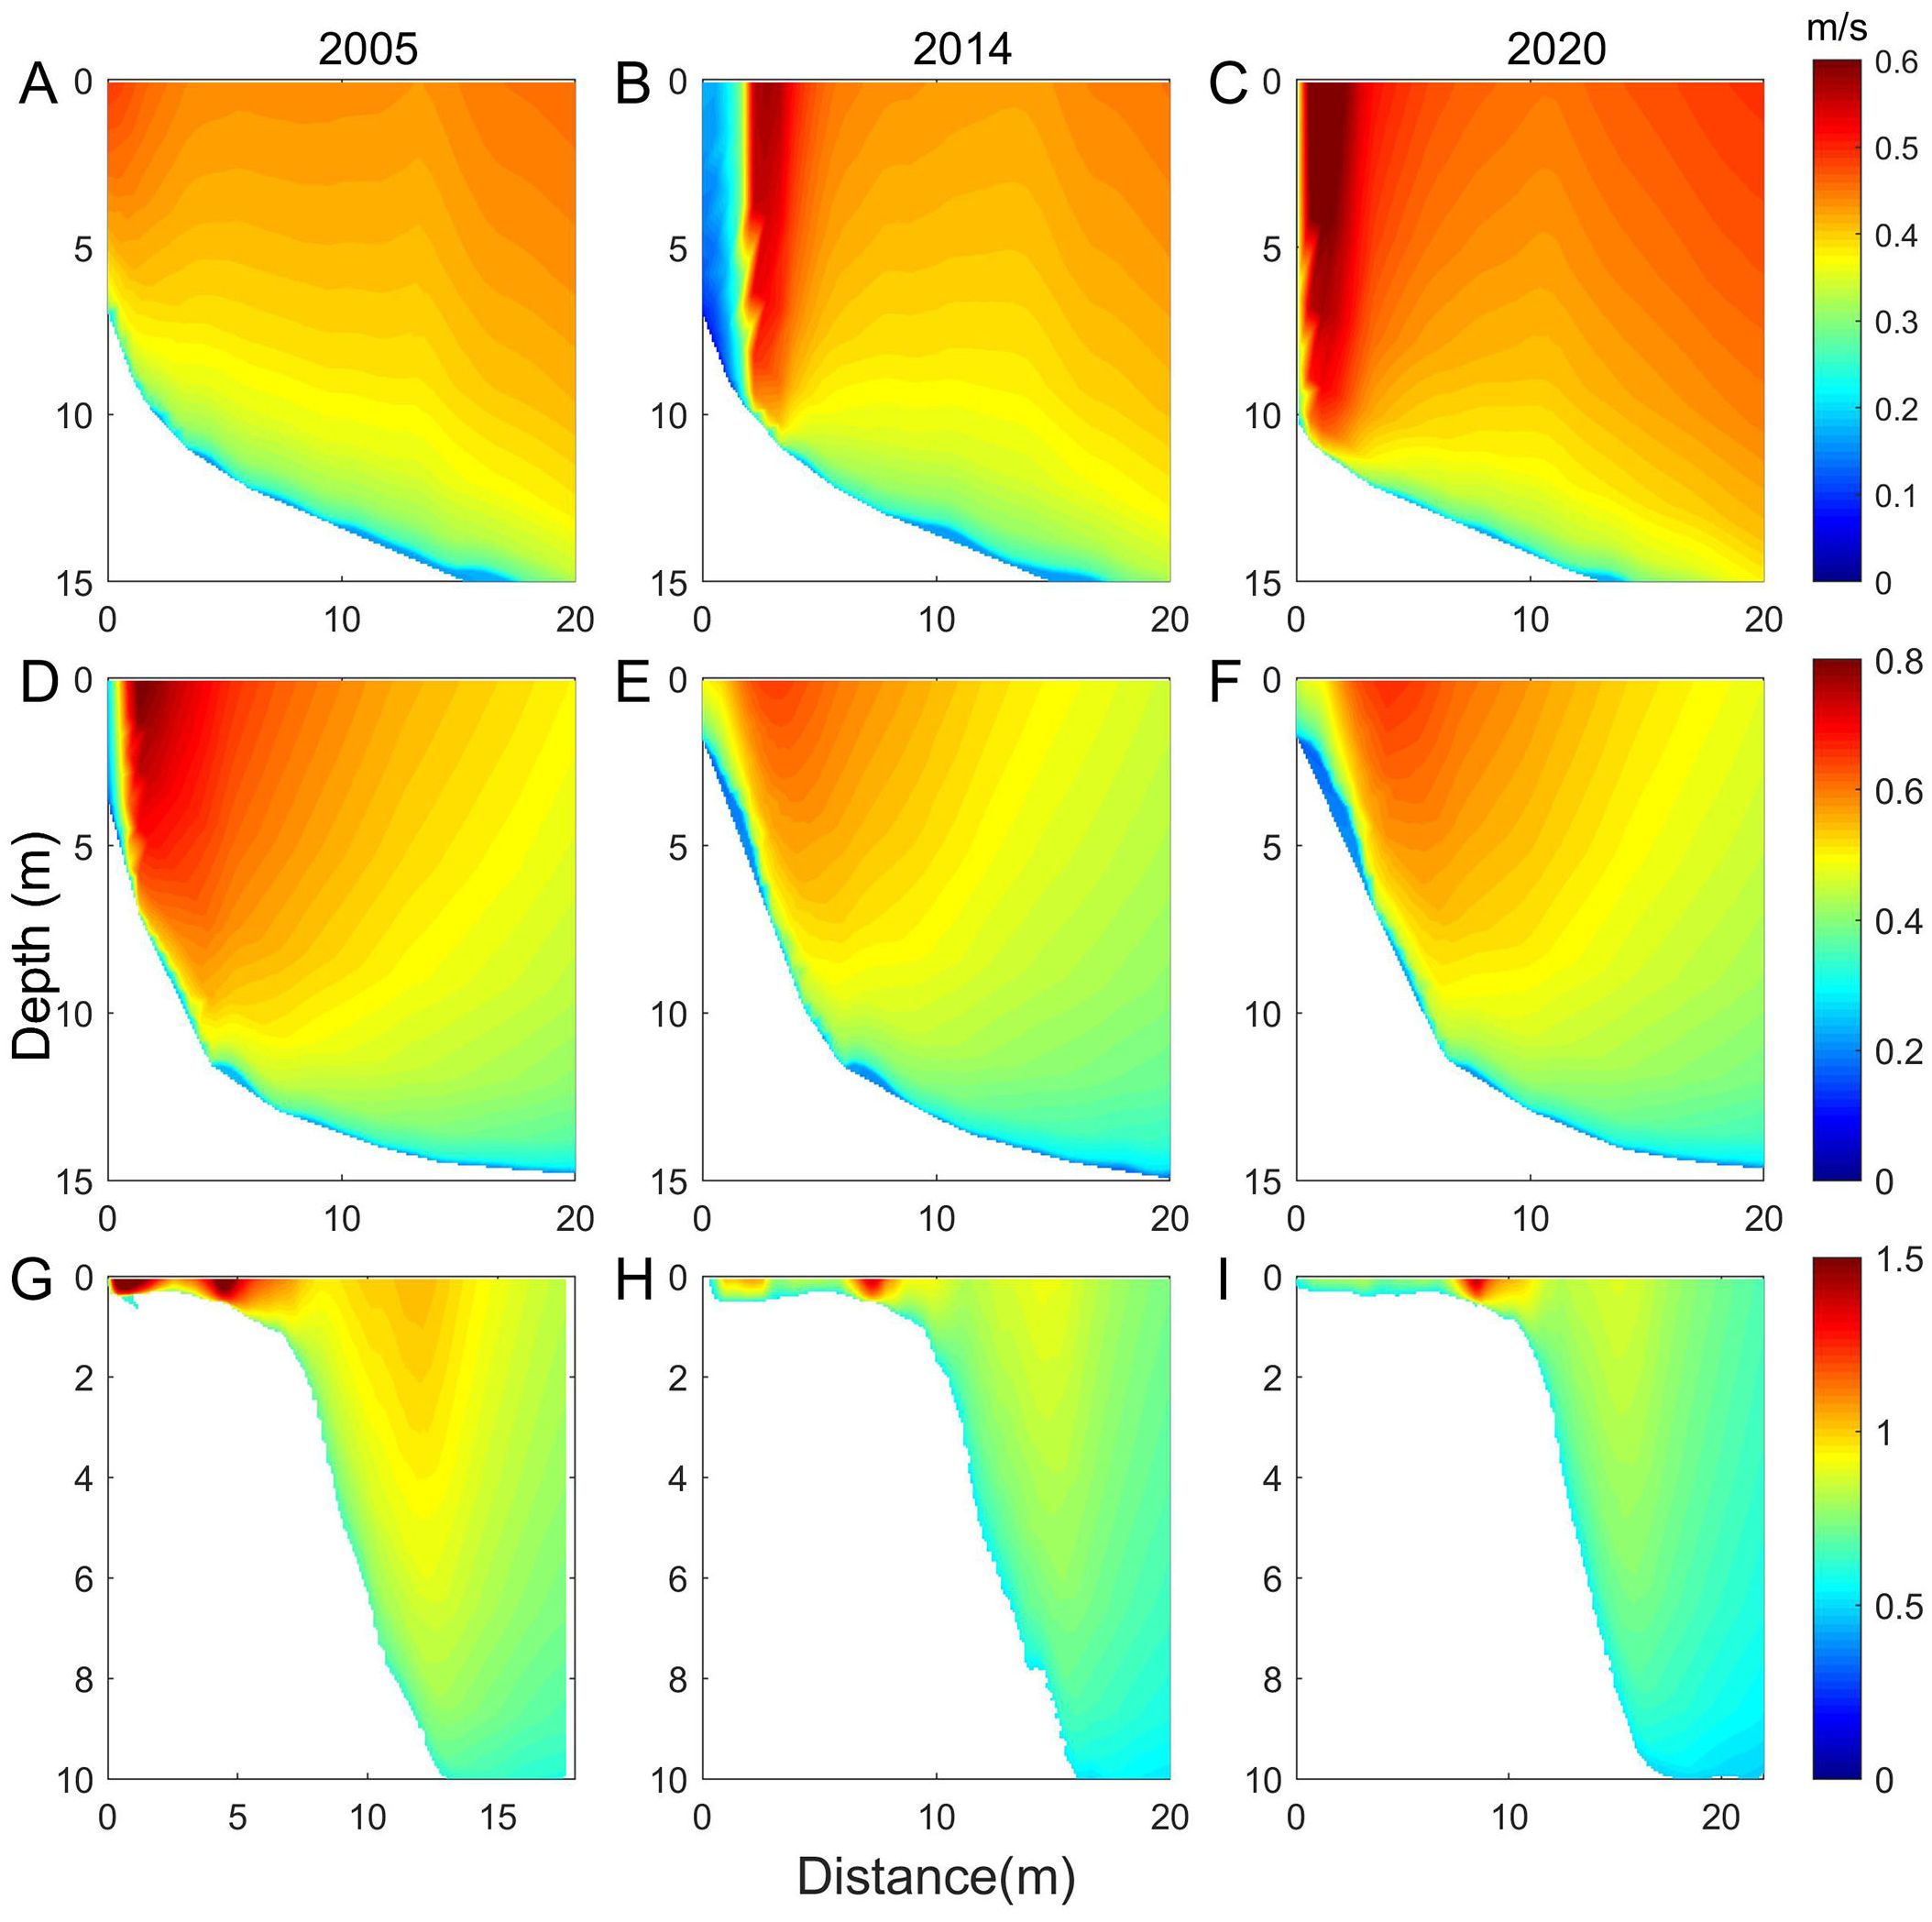
Figure 6. Changes in the maximum current velocity in the vertical direction of the three sections. (A-C) Changes in section (A) in 2005, 2014, and 2020. (D-F) changes in section (B) in 2005, 2014, and 2020. (G-I) Changes in section C in 2005, 2014, and 2020.
Section A (Figures 6A-C) reveals a distinct high-low-high distribution pattern of the maximum current velocities in the vertical direction. Following diversion, the velocities throughout the section exhibited a continuous increase. This trend intensified over time, with a more pronounced high-low-high pattern and a more significant increase in near-shore velocities. This pattern mirrors the changes observed in surface current velocities. This trend may be due to the change in topography after diversion, where the prominent estuarine topography increased the tidal current velocity. In the vertical direction, the velocity gradient increased with depth and increased with time at the same depth. Section B (Figures 6D-F) exhibits a significant decrease in the maximum current velocity following the diversion. This decline can be attributed to the erosion of the prominent old Q8 bank, which transitioned to a gentler slope after the diversion, thereby reducing the current velocity. In Section C, there are areas with current velocities significantly greater than 1 m/s, which we refer to as zones of maximum current velocities. There were two distinct zones of maximum current velocities along the leading edge of the delta in 2005, with an additional zone of higher velocities offshore of the slope. However, these zones all exhibit a gradual decrease in velocity over time. Notably, the high-velocity zone near the mouth disappears entirely by 2020. This decrease in velocity coincides with the erosion of the protruding shoreline. Importantly, Section C consistently exhibits higher current velocities than the other two sections. Furthermore, the underwater slope becomes steeper approximately 10 km from the shoreline in 2020, with the water depth rapidly reaching 10 meters. This steeper slope contributed to a significant difference in the current velocity between the areas inside and outside the slope. Overall, these results highlight the substantial influence of topography on the magnitude of tidal current velocity.
4.3 Residual current
4.3.1 Surface changes
The residual currents in the Bohai Sea are generally weak, typically below 2 cm/s. However, some areas exhibit significantly higher velocities. These zones are primarily concentrated in the AM and the southeastern portion of the old QSG channel. The AM has residual current velocities of approximately 10 cm/s due to prominent headland topography, and velocities in the southeastern part of the delta tend to be in the 15-25 cm/s range. Prior to the diversion in 2005, the residual current within the estuary primarily flowed eastward (Figure 7A). However, after diversion, the increased curvature at the estuarine mouth introduced a centrifugal effect, causing the residual current to disperse outward and form a counterclockwise rotating current in conjunction with the surrounding seawater (Figures 7B, C). Tidal currents in the southern delta initially flow eastward following the shoreline before turning southward and gradually weaken after pooling in the southeastern part of the old QSG, and the southward-flowing residual currents are contained within the 4-8 m isobath (Miao et al., 2022).

Figure 7. Residual current distribution. The direction of the arrow is the direction of the residual flow, and the size of the arrow is the residual flow rate magnitude. (A–C) Times are for 2005, 2014, and 2020, respectively.
After diversion at the AM, the residual current velocity increased significantly, by approximately 10 cm/s in 2014 compared to that in 2005 (Figure 8A), and then decreased as the shoreline continued to extend outward, decreasing by approximately 8 cm/s by 2020 (Figure 8B). Postdiversion, the current velocity at the old Q8 outlet exhibited a continuous decline, with the rate of decrease becoming progressively less pronounced. The current velocity in the old QSG channel was more variable, with values above 10 cm/s and decreasing. Within the high-velocity residual current zone between the 4 and 8 m isobaths, the residual current velocities decreased, and the extent and value of the decrease increased, with a 4 cm/s decrease in 2014 compared to 2005 and a 4-8 cm/s decrease in 2020. In summary, the residual current velocities exhibited distinct spatial patterns. The AM experienced an initial increase followed by a decrease. Conversely, the mouth of the old Q8 channel, the old QSG channel, and the high-velocity zone southeast of the old QSG channel all exhibited consistent decreasing trends (Figure 8C).

Figure 8. Residual current velocity variations. The color indicates the magnitude of the flow rate difference, and the arrow indicates the direction of the flow rate difference. (A) Changes from 2005 to 2014. (B) Changes from 2014 to 2020. (C) Total change from 2005 to 2020.
4.3.2 Vertical changes
As shown in Figure 9, several fronts formed in the vertical direction, and the residual currents at the fronts were very small, with opposite current directions on either side of the fronts. The residual current in the inner part of the front in the nearshore area is a downward offshore current, and the residual current in the outer part of the front is an upward nearshore current, forming a complete circulation pattern. The position of this front changed only slightly with changes in topography.
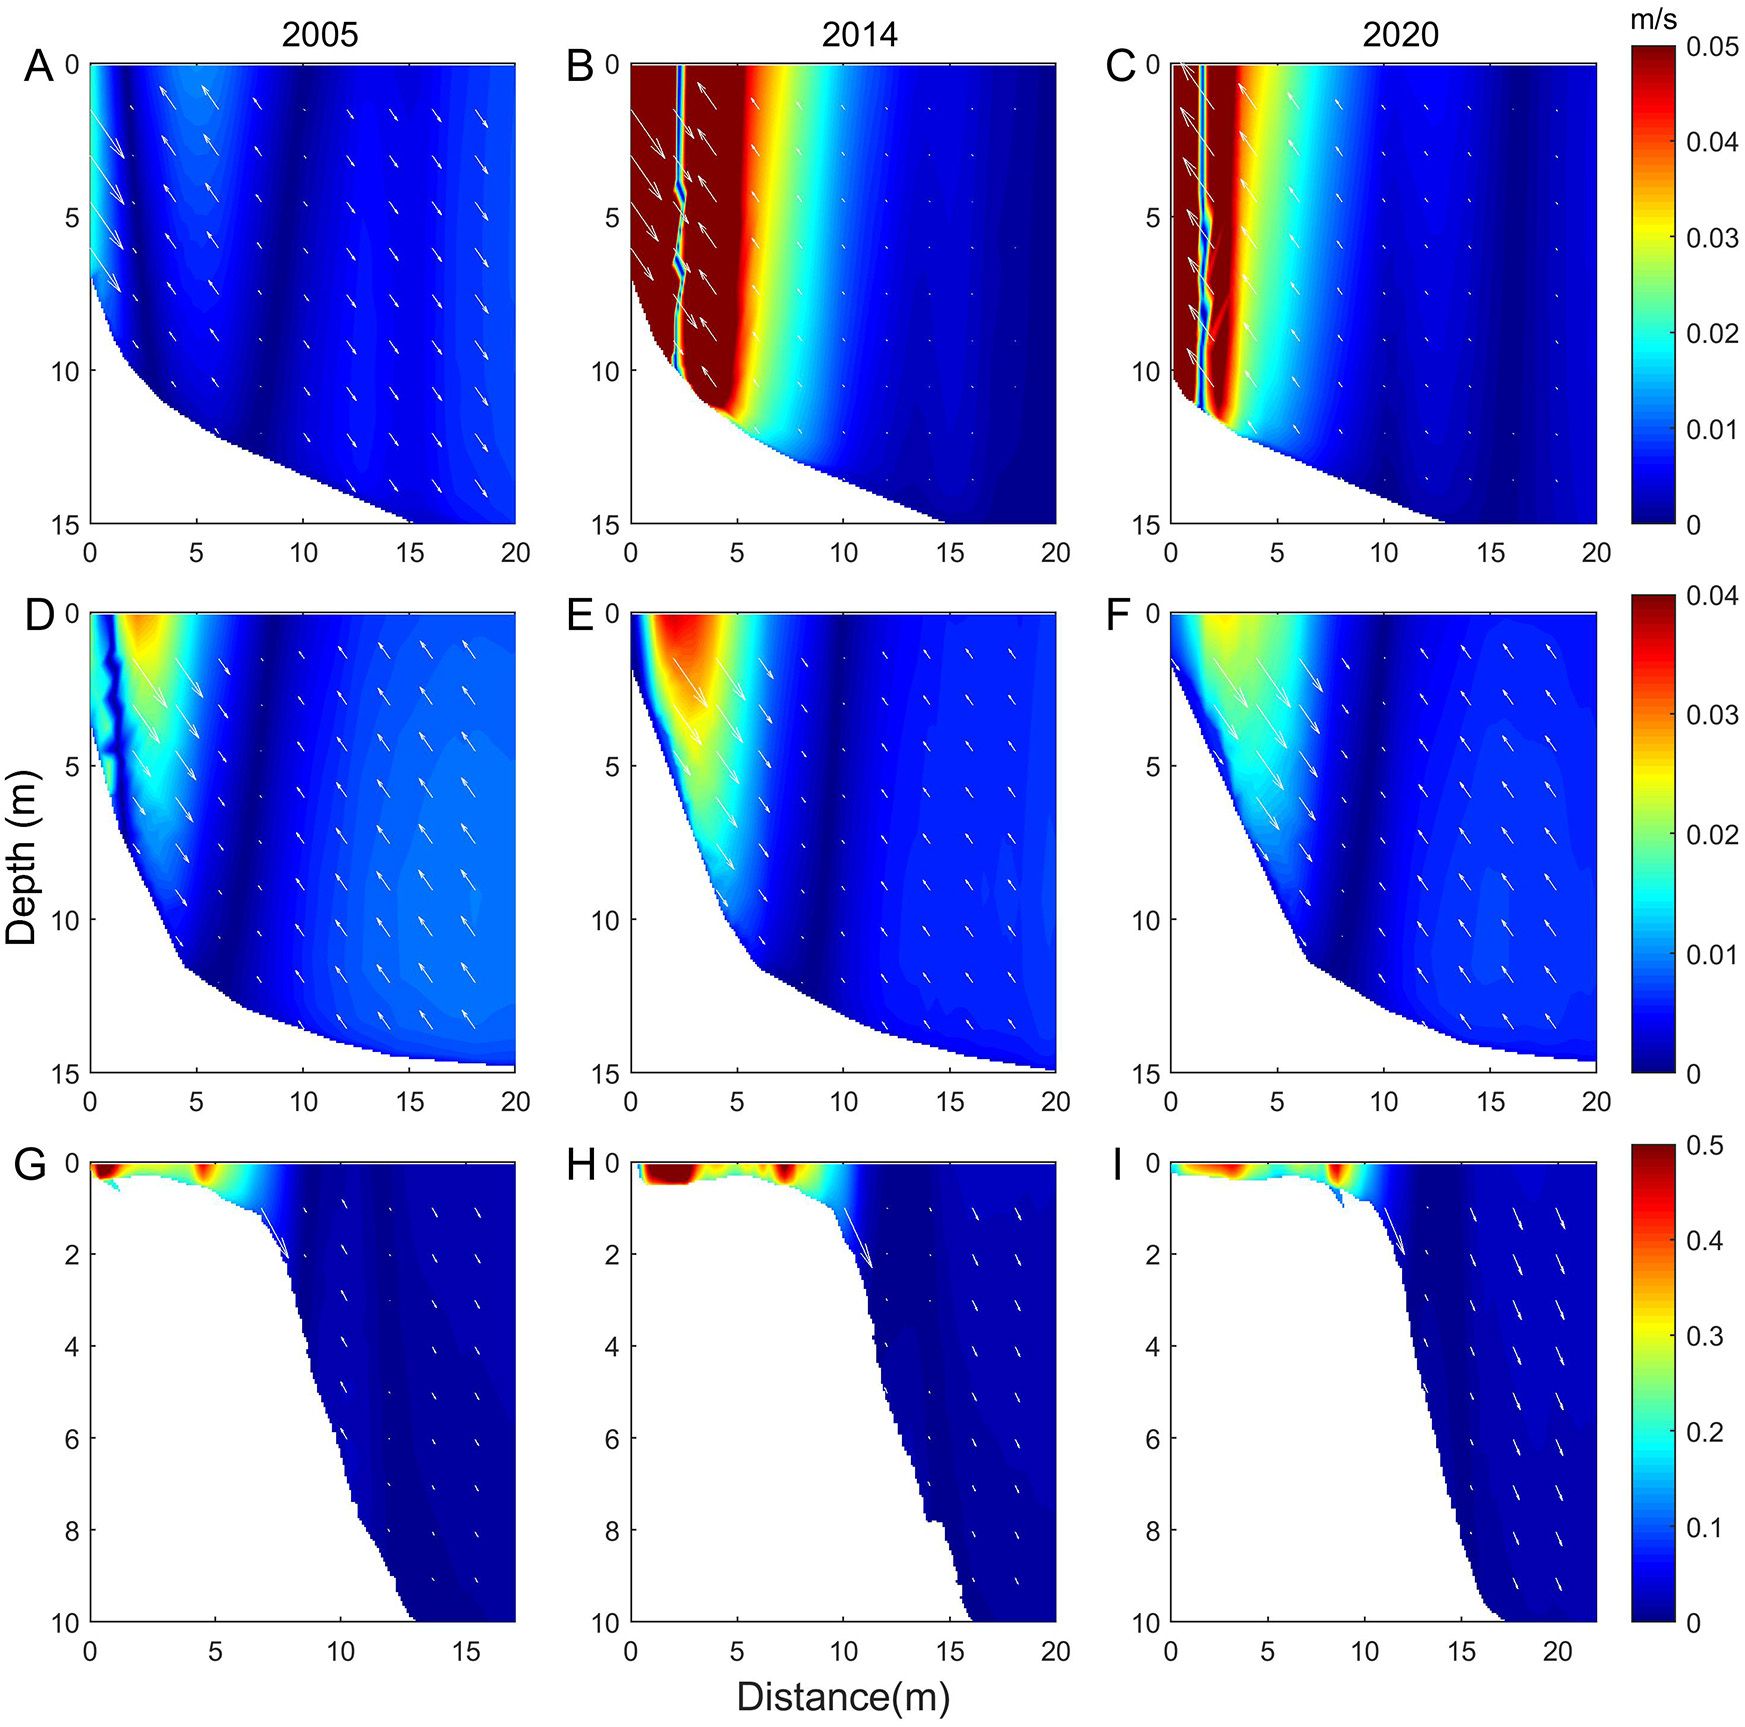
Figure 9. Changes in the vertical residual current velocity and current direction in the three sections. (A-C) Changes in section (A) in 2005, 2014, and 2020. (D-F) Changes in section (B) in 2005, 2014, and 2020. (G-I) Changes in section (C) in 2005, 2014, and 2020.
The distribution of the residual current velocity is similar to the distribution of the maximum current velocity; the higher area is located in the nearshore area where the water depth is shallower. The slope becomes more gradual as the demarcation line of the current velocity magnitude changes, and the current velocity magnitude of each layer is consistent with the change in the surface layer. The residual current in the old QSG area formed two high-current velocity zones on the leading edge of the YRD, and the current velocity in the two high-current velocity zones tended to decrease, but the residual current velocity in the area was still greater than that in the first two zones.
4.4 Shear fronts
4.4.1 Surface changes in position
The tidal currents within one high-tide cycle (i.e., 25 hours) beginning on August 3rd. to August 4th. in three years were simulated to determine the positional distribution of the reverse TSFs and to explore their spatial and temporal variation characteristics, and the results are shown in Figure 10. TSFs occur mainly in the northern and eastern parts of the YRD, and the density of TSFs is greater offshore than offshore. After diversion, the length of TSFs in the northern part of the delta decreases, and the TSFs in the eastern part of the AM move northward with the estuary. The change in the estuarine location caused the shoreline to become prominent in the north, blocking the transition between high and low tides and reducing the length of TSFs on the left side of the AM. As the coastline of AM extends northward continuously, TSFs at the estuary become increasingly dense. Qiao et al. (2008) removed the coastline of the protruding sections of both the estuary and Laizhou Bay, and concluded that the formation of TSFs was not sensitive to the shoreline. However, from the conclusions of this paper, it is clear that changes in the shoreline at the estuary can have an impact on the location of TSFs.

Figure 10. Temporal and spatial distributions of TSFs during a tidal cycle. The red lines indicate the IFOE TSFs, and the blue lines indicate the IEOF TSFs; the black numbers represent the integer moments on August 3rd. (A–C) Times are for 2005, 2014, and 2020, respectively.
The TSFs occur from the estuary, gradually propagate southeast toward the outer sea and finally disappear, which is consistent with the findings of Wang et al. (2007). The difference is that the TSFs are distributed on both sides of the AM, as shown clearly in Figure 10, and the TSFs first occur from the left side of the AM and propagate offshore because the alternation of high and low tides first starts from the northern part of the AM. The TSFs are distributed in an arc in the north-south direction, which is consistent with the direction of the isobaths. Between 1991 and 1996, when the estuarine inlet was located eastward, the TSFs gradually moved to the sea as the estuary extended seaward (Wang et al., 2017). However, the degree of aggregation of the TSFs at various moments during this period did not change significantly. In contrast, when the river inlet is also oriented north-south, the resulting TSFs gradually gather near the estuary with the northward extension of the estuary and produce an obvious shoreward movement. Wang et al. (2017) suggested that long-term changes of the TSFs are caused by changes in the shoreline, bathymetry, and bottom stress due to morphological evolution. The morphology that causes changes in the position of the TSFs includes not only the distance that the estuary protrudes seaward but also the direction in which the estuary enters the sea. Two types of TSFs are formed during high and low tides: the IFOE TSFs are located in the estuary at the northern end and extend to the QSG area at the southern end, whereas the IEOF TSFs are located relatively southward and extend southeast of the QSG within the high current zone at the southern end. The IEOF TSFs propagate farther southeast than the IFOE TSFs.
4.4.2 Changes in time and length
To study the time and phase variation of the TSFs occurrence, points S and S’ are set at the front and rear ends of the TSFs in the southeast, and the locations are shown in Figure 10. From Figure 11A, it shows that two types of TSFs, IFOE and IEOF, occur alternately in each tidal cycle, and IFOE TSFs occur in the period when point S is in the high phase and point S’ is in the low phase. The corresponding tidal currents are upwelling currents at point S and downwelling currents at point S’. The S point changes from rising to falling during that time period and ends at the moment when the S’ point changes from falling to rising. The IEOF TSFs are just the opposite. After the flow path at YRE changed to the north, the time of occurrence of the TSFs remained unchanged, but the duration increased. The duration of the TSFs in the first half of the tidal cycle is one hour longer than that in the second half of the cycle, and the duration of the IEOF is slightly longer than that of the IFOE. In the long term, the occurrence time of the TSFs is approximately the same, but the duration slightly increases. Therefore, changes in the topography of the YRE have little effect on the occurrence and duration of TSFs.
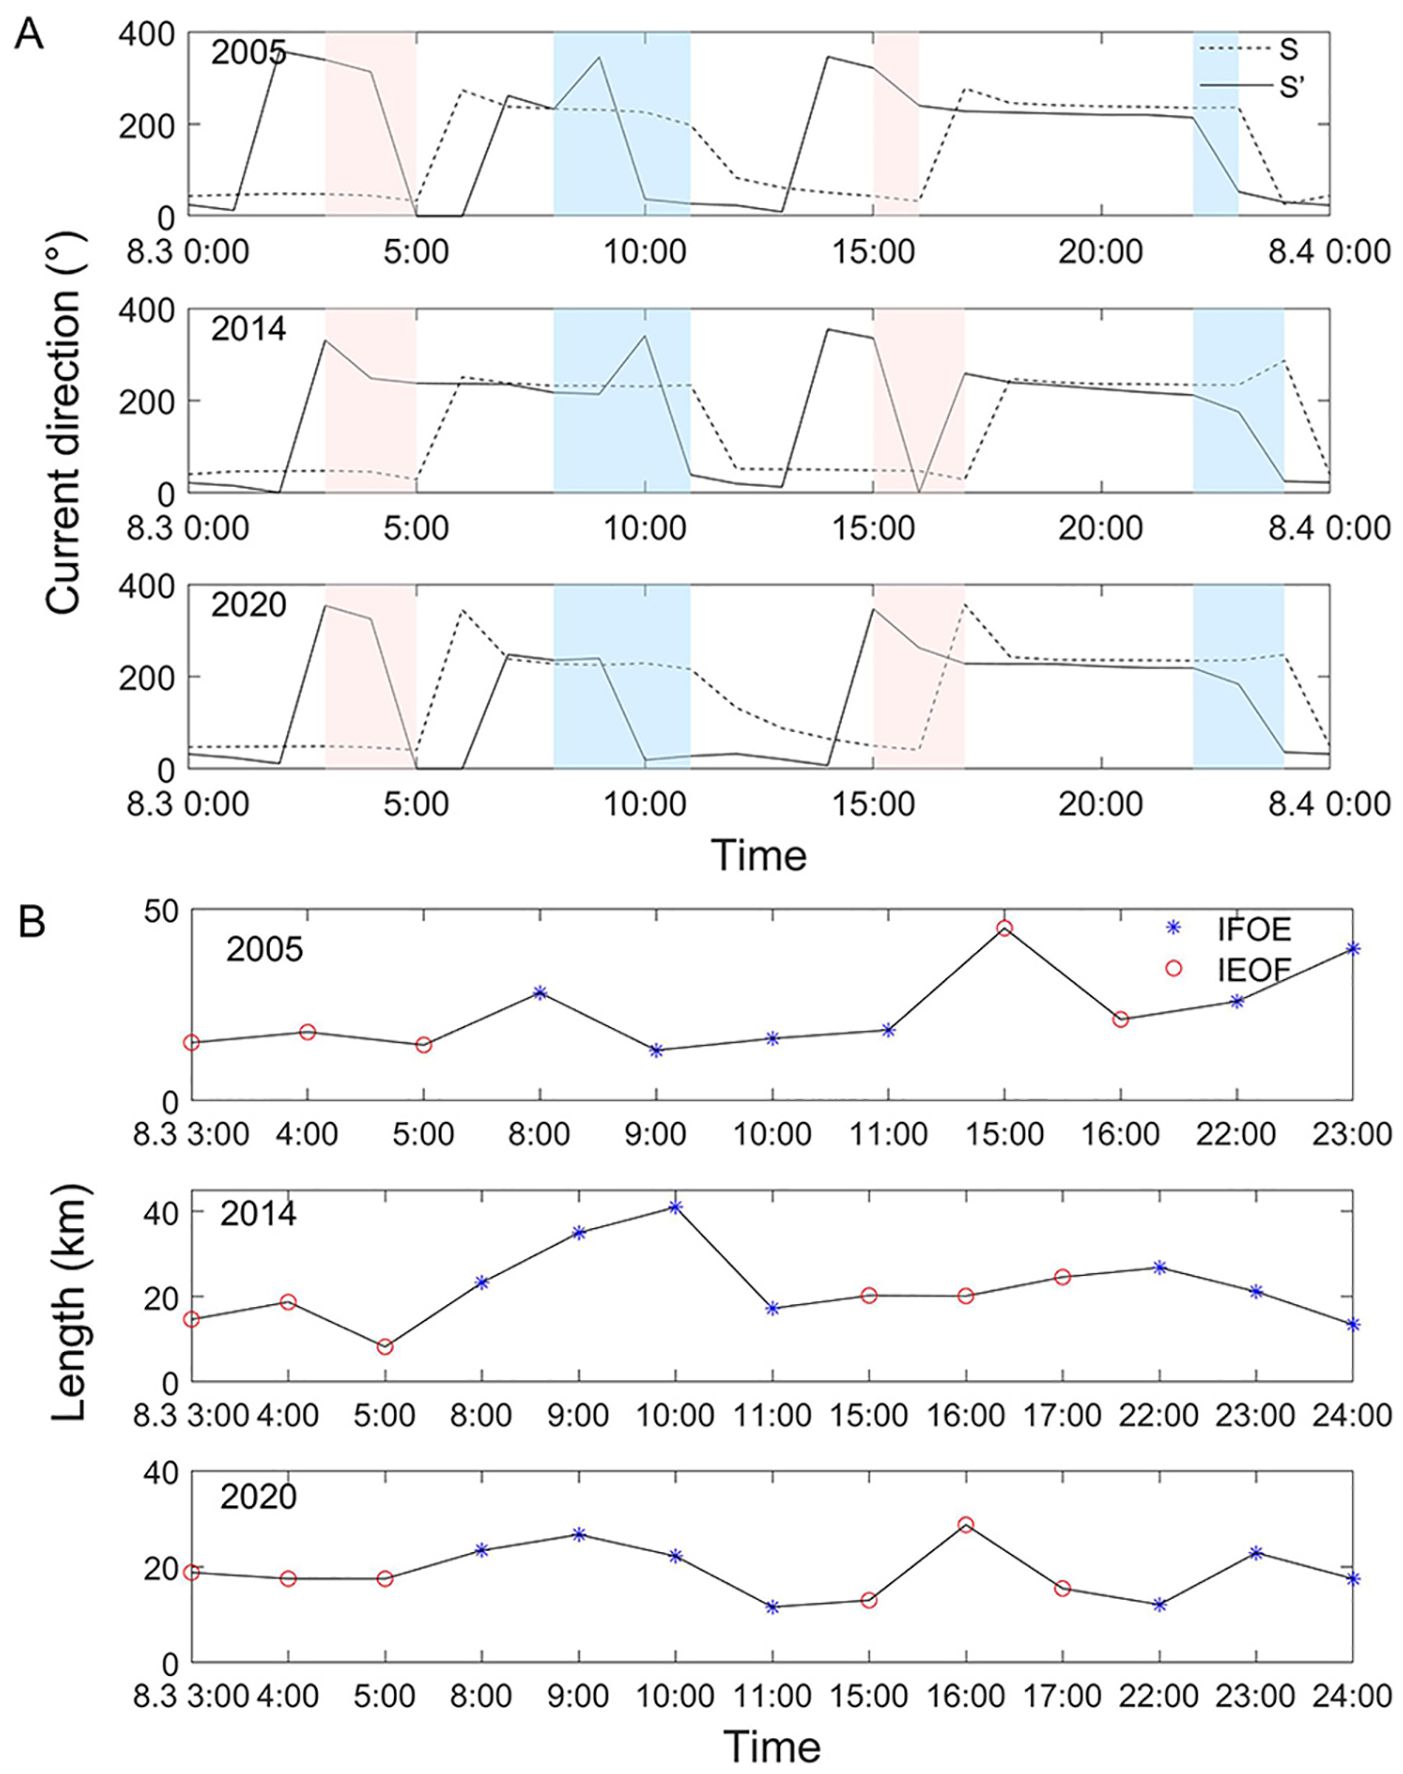
Figure 11. Changes in the timing and length of shear fronts over a tidal cycle in 2005, 2014, and 2020. (A) Phase changes at points S and S'. (B) Length variation of the shear front. Red lines indicate the IFOE TSFs, and blue lines indicate the IEOF TSFs; black numbers represent the moments of August 3rd.
Figure 11B shows the variation in the length of the TSFs within a tidal cycle. Most of the TSFs are within 10-30 km in length, and the length of the TSFs occurring simultaneously on both sides of the estuary is relatively long. Averaging the lengths in Figure 11B yields an average length of 19.79 km for IFOE TSFs and 23.06 km for IEOF TSFs; thus, the IEOF is longer than the IFOE during this tidal cycle. The average length of TSFs decreased from 32.34 km to 24.42 km from 1976 to 1996 (Wang et al., 2017). The average lengths of the TSFs were 23.15 km, 21.86 km, and 19.65 km in the same tidal cycle in 2005, 2014, and 2020, respectively, as shown in Figure 11B. Overall, the lengths of the TSFs tended to decrease. The change in estuary location did not affect the development of this trend, indicating that the length of the TSFs is not related to the location of the estuary. According to Wang et al. (2017), the length of the TSFs is related to the increase in bottom stress due to changes in water depth.
4.4.3 Surface changes in strength
The spatial and temporal variations in the intensity of the TSFs are analyzed according to the intensity calculation method introduced in section 3.3. The results in Figure 12 indicate that the intensity is greater in the southeast part of QSG and AM, at approximately 0.15 m/s/km. The TSFs produce the largest current velocity gradient in the cross-bank direction where the water depth strongly changes (Wang et al., 2007; Qiao et al., 2008). The steeper slopes in the estuary and the dense bathymetric gradient lines in the southeastern part of the river result in higher intensities in these two regions, whereas the intensity of TSFs in the central part of the delta is relatively small. Moreover, the prevailing high tide outside the estuary is the dominant flow, while the low tide dominates in Laizhou Bay (Yang et al., 2021). Therefore, IFOE TSFs generally have a relatively high intensity in the southeastern part of the QSG, whereas IEOF TSFs are relatively high at the AM. In the north-south direction, the intensity of the TSFs decreases gradually with increasing distance from these two locations, and in the east-west direction, the intensity of the TSFs at the same latitude decreases gradually with increasing distance from the shore.
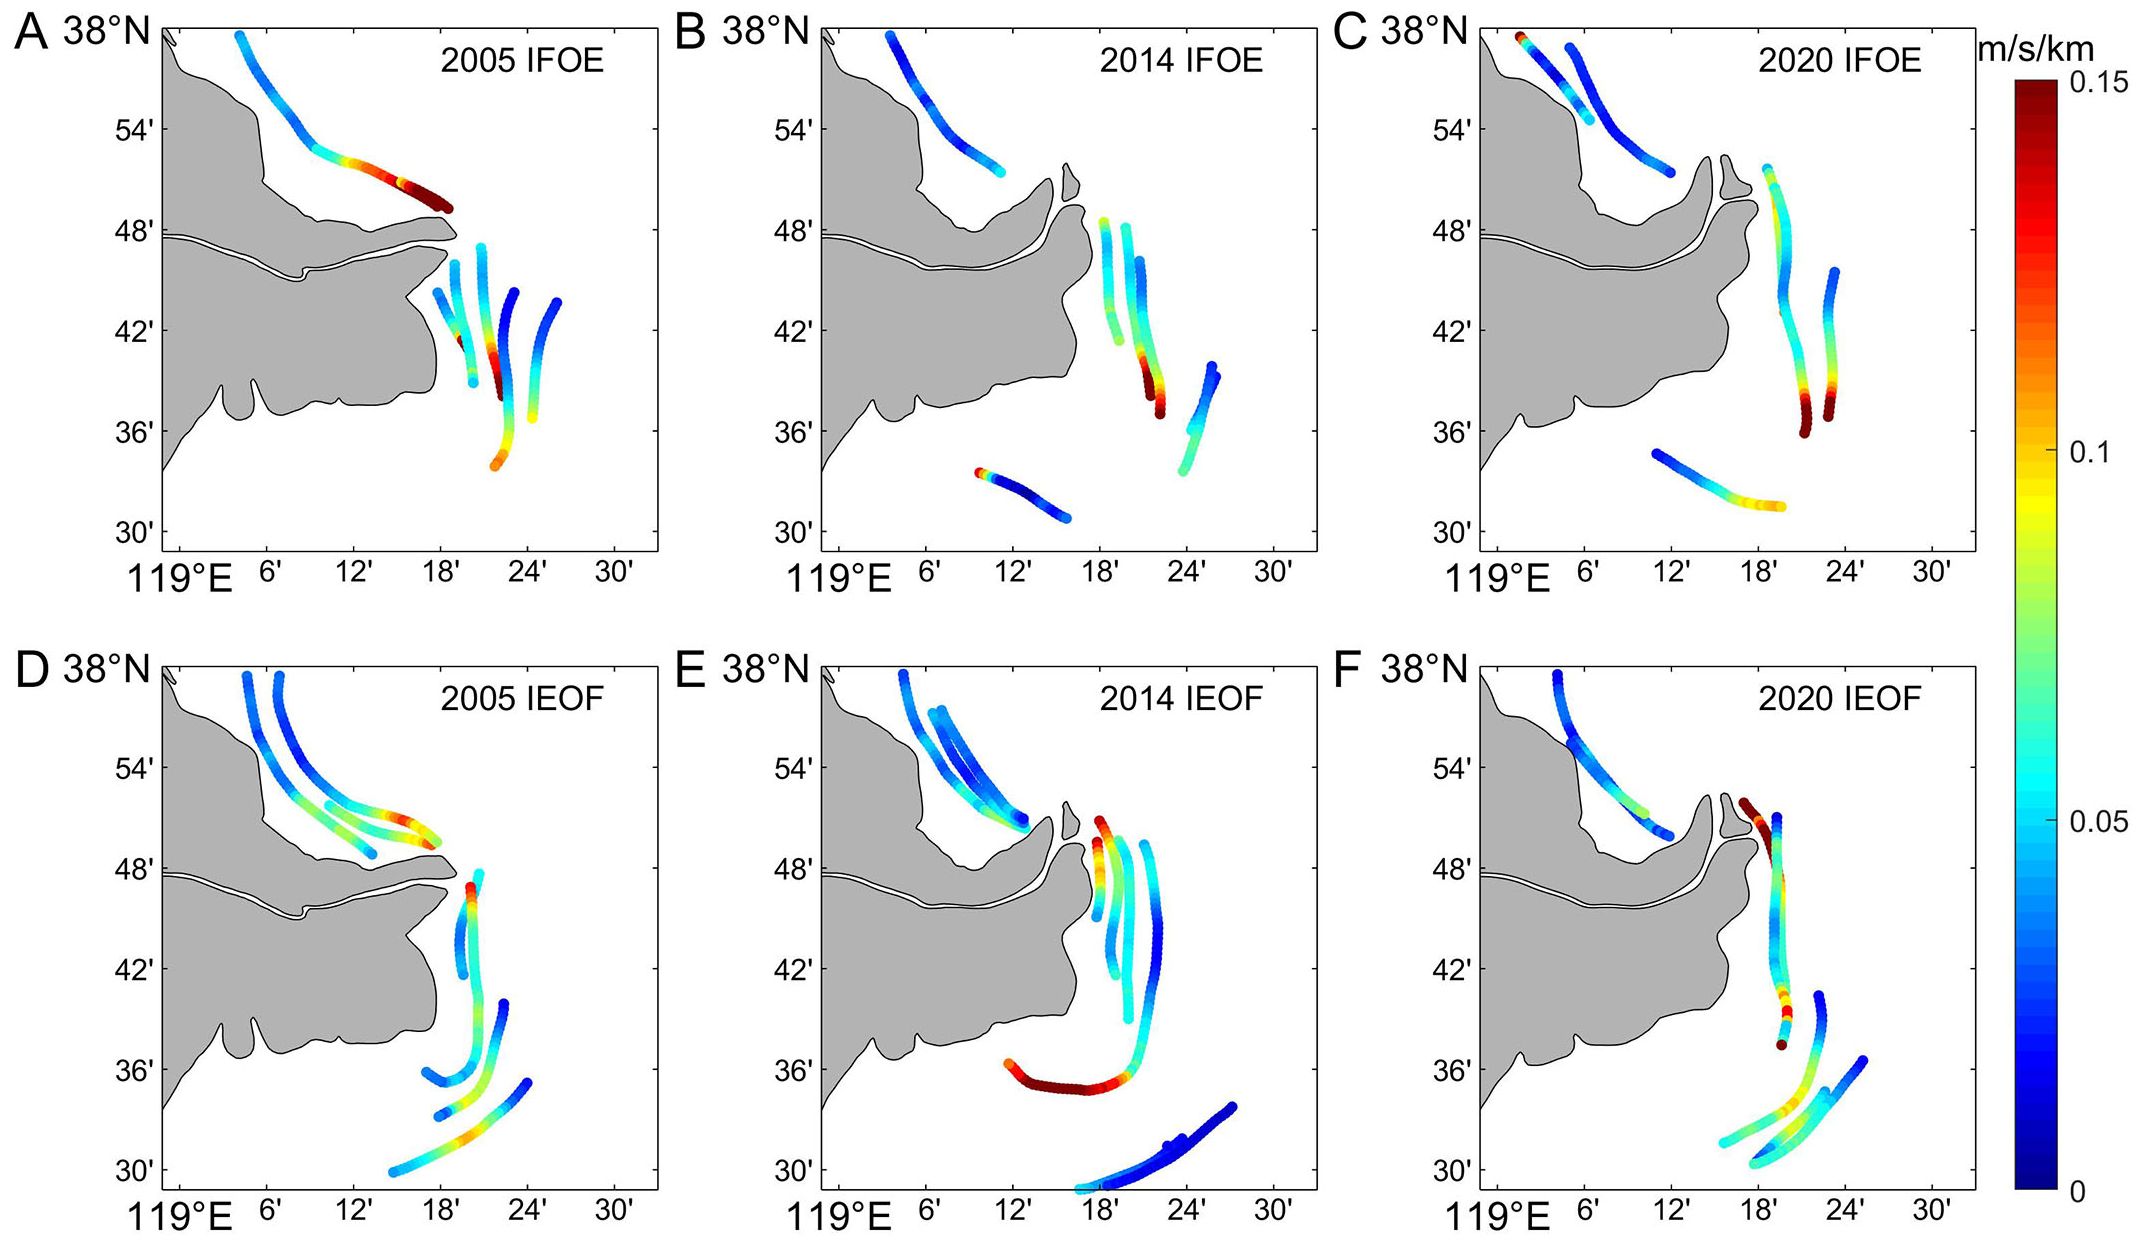
Figure 12. Distribution of TSF intensities. (A-C) IFOE TSF intensities in three years. (D-F) IEOF TSF intensities in three years.
After rerouting, the prominent estuarine headland changes the direction of the tidal currents, which decreases the maximum current velocity on the left side of the estuary (Figure 5), and the gradient of the current velocity decreases, which leads to a rapid decrease in the intensity of the TSFs on the left side. The intensity of the IFOE TSFs varies more than that of the IEOF TSFs in this region. As the estuary continues to extend northward, the maximum current velocity on the right side of the estuary increases, and the intensity of the TSFs increases. At this time, the increase in the intensity of the IEOF TSFs is greater than that of the IFOE TSFs. The maximum current velocity in the high-current zone in the southeastern part of the QSG decreases and then increases, and the corresponding intensity of the TSFs also decreases and then increases, but the change in the intensity of the TSFs is not particularly obvious because the maximum current velocity is above 1 m/s and does not change much.
4.4.4 Vertical changes
The location of the centerline of the TSFs varies from layer to layer in the vertical direction. Because the bottom layer has greater friction and a lower inertia force, high and low tides occur first in the bottom layer. Therefore, the positions of the bottom TSFs are closer to the sea than those of the surface layer, and they are in the form of a seaward step in the vertical direction, with their length decreasing gradually and direction perpendicular to the TSFs. The same TSFs move farther from the north than from the south in the vertical direction. At the same time, the farther offshore the TSFs are, the farther the bottom move. This also reflects the changing pattern of rising and falling tides in the vertical direction.
To investigate the change in vertical upward strength and its relationship with topography, shear front profiles with similar locations in the estuary and the southeastern sea area are selected for comparison. Since the centerline of the shear fronts of each layer moves at a distance of approximately 1km, the profile of the surface shear fronts locations is adopted for the study. The distance of the gradient is calculated to be 1.5 km. The gradient of the bottom stress is related to the depth of the water and the current velocity. Therefore, the gradient of the bottom stress can be utilized to investigate the relationship between strength and topography, and the effect of water depth on strength can be explored via the gradient changes. The selected IFOE TSFs are at 4 points in 2005, 2014, and 2020, and the IEOF TSFs are at 11 points in 2005, 2014, and 2020, with the northern end of the TSFs as the starting point.
As shown in Figures 13, 14, the variation in TSFs with distance in each layer is consistent with the variation in the surface layer, and the magnitude of the intensity of the lower TSFs is influenced by the intensity of the surface TSFs, which decreases with increasing depth. The strength of the TSFs in the AM decreases and then increases after diversion. The bottom stress gradient in the southeastern ocean is less than 0.002 , and the strength of the TSFs is less than 0.1 m/s/km, both of which are smaller than those in the eastern part of the estuary. The change in the bottom stress gradient is directly proportional to the change in the TSFs intensity, and the peak of the bottom stress gradient generally occurs at locations with larger slopes. The closer the river is to the estuary or the closer it is to the coast, the greater the slope and the greater the bottom stress gradient. The slopes in the southeast are more variable than those in the eastern part of the estuary, suggesting that the topographic changes in the high-current zone in the southeast are more dramatic, as can also be seen in the previous profiles of sections A and C. The gradient is more variable in the eastern part of the estuary than in the eastern part of the estuary.
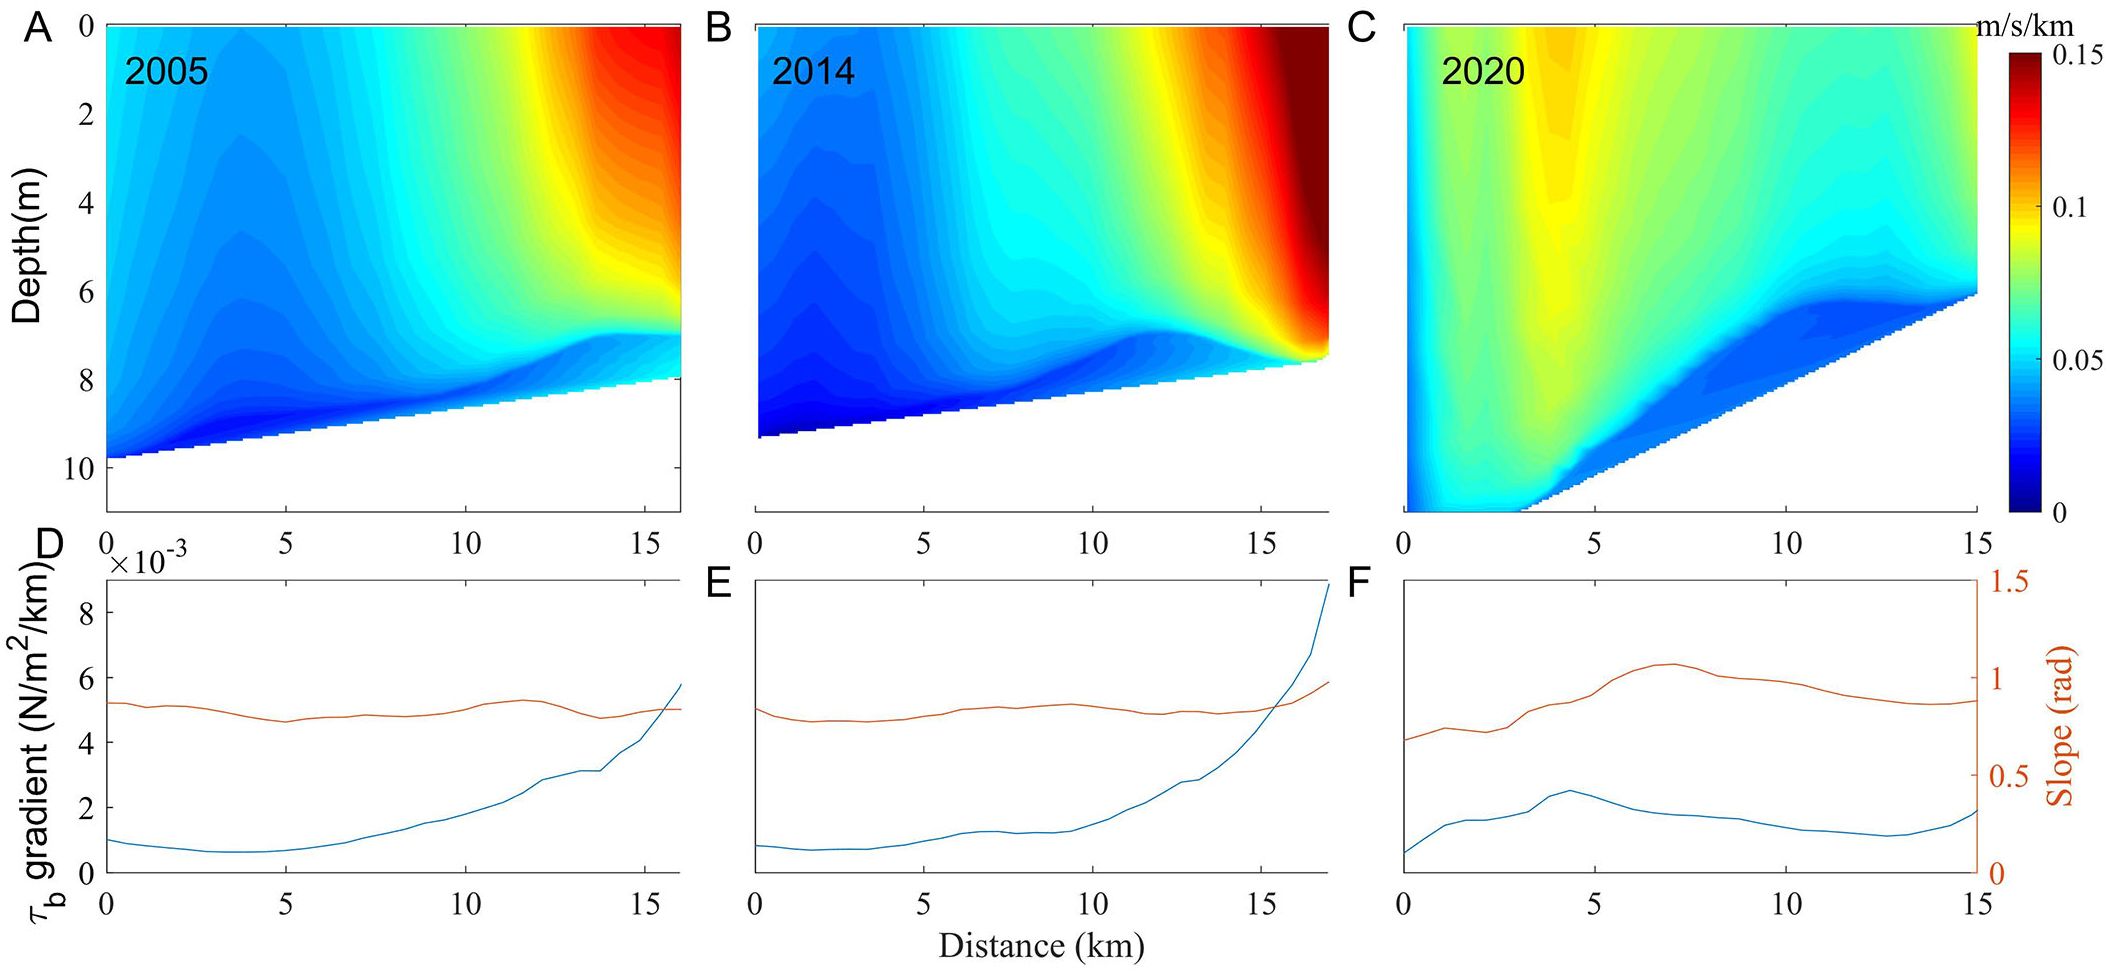
Figure 13. The IFOE TSFs’ vertical strength and change in the base stress gradient and slope. (A-C) The vertical strength of the TSFs. (D-F) Changes in the base stress gradient in blue and changes in the slope in orange.
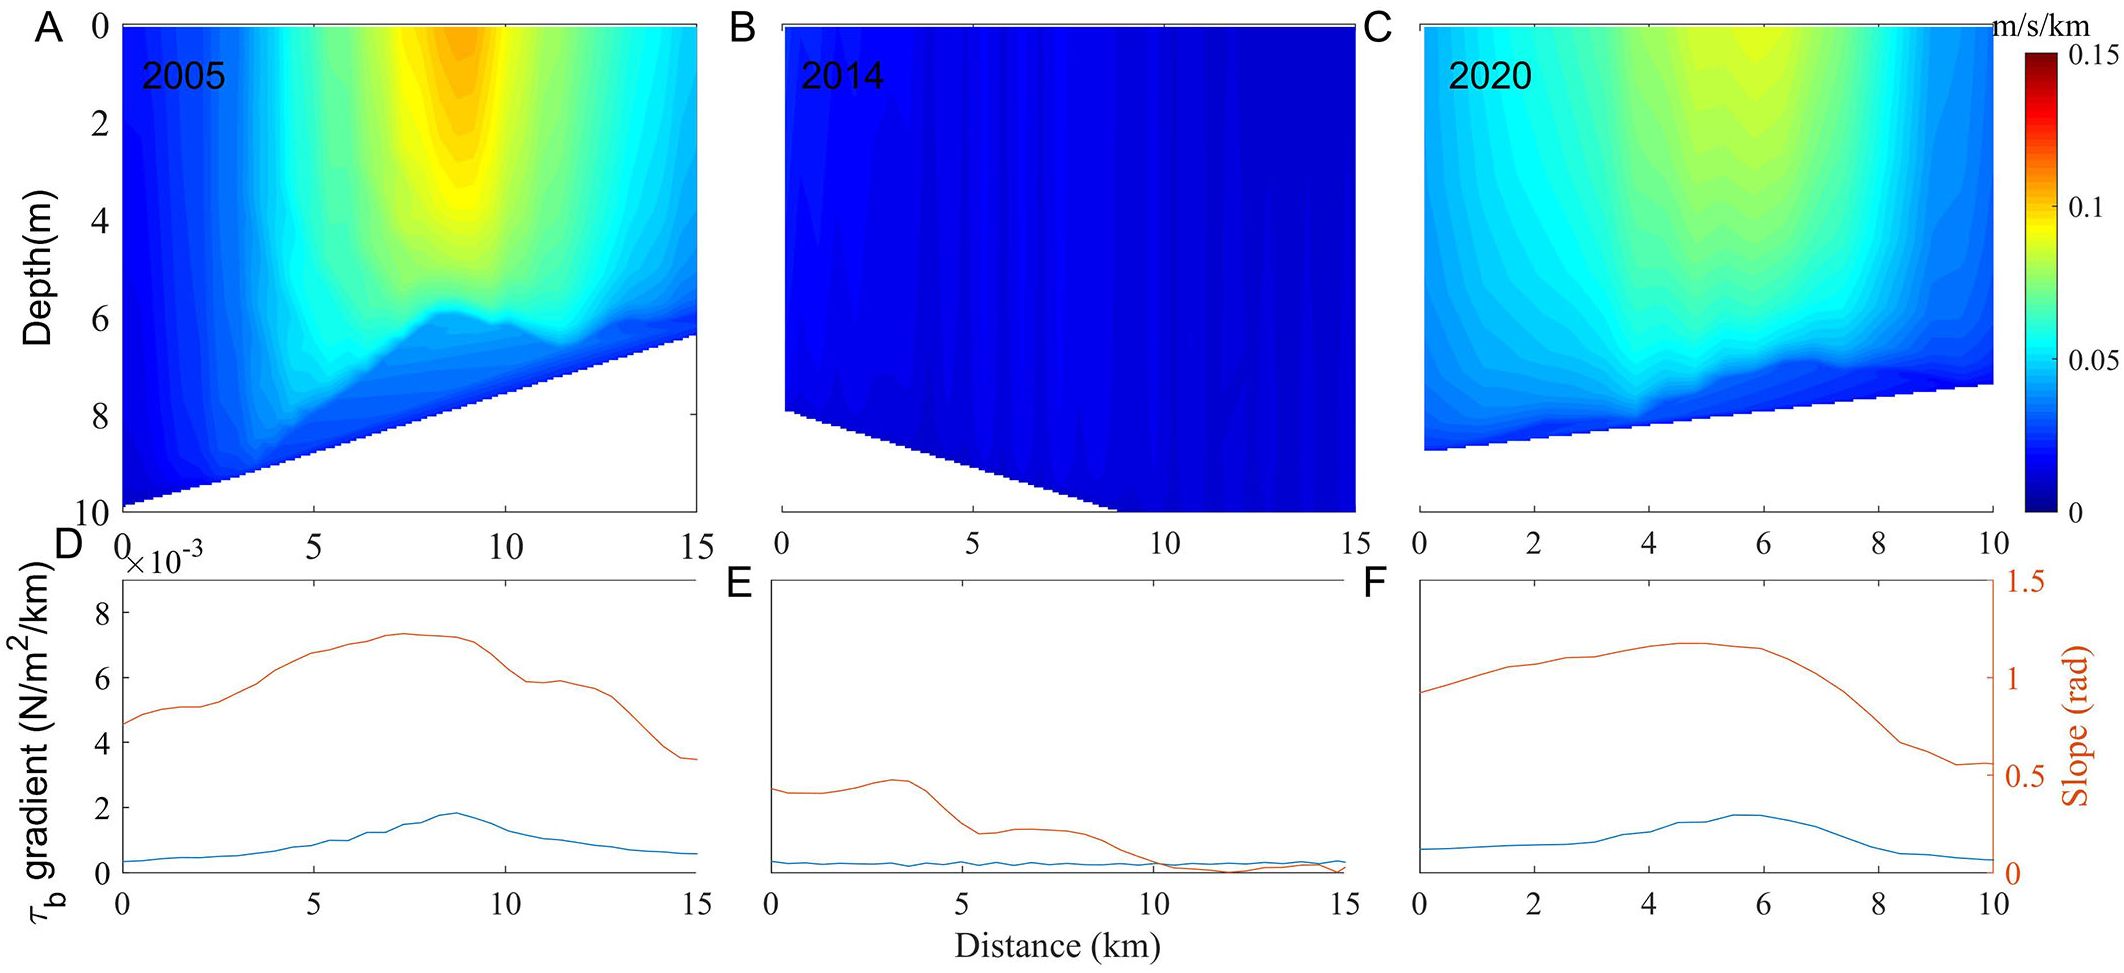
Figure 14. Vertical strength of the IEOF TSFs and changes in the base stress gradient and slope. (A-C) The vertical strength of the TSFs. (D-F) Changes in the base stress gradient in blue and changes in the slope in orange.
5 Conclusions
To study the spatial and temporal evolution characteristics of tidal currents and TSFs caused by topographic changes in the past two decades, the hydrodynamics of different periods were simulated on the basis of the FVCOM numerical model, and the three-dimensional variation rules and trends of the M2 amphidromic point, tidal ellipse, maximum current velocity of the split tides, residual currents, and TSFs were analyzed. The main conclusions of this paper are as follows:
(1) Following the diversion of the YRE, the M2 amphidromic point is displaced toward the east and southeast. Within the old Q8 river channel, the old QSG river channel, and the southeastern zones of high current velocity, both the maximum tidal current velocity and residual current velocity increase. At point AM, the maximum tidal current velocity increases, whereas the residual flow velocity initially increases before it decreases, with the residual current exhibiting a counterclockwise rotation.
(2) The alteration of the estuarine location induces a shift in the position of the TSFs, although it has minimal impact on its length and duration. As the river mouth gradually extends northward, the TSFs tend to concentrate near the estuary. The vertical position of the TSF’s centerline varies, the bottom layer, which is affected by the earlier onset of tidal fluctuations, positions the TSFs closer to the open sea than does the surface layer, resulting in a stepped formation that gradually diminishes in length, with a movement direction perpendicular to the TSFs.
(3) Variations in topography and the influence of areas dominated by tidal fluctuations lead to a generally higher intensity of the IFOE TSFs in the southeastern region of the QSG, whereas the IEOF TSFs exhibit greater intensity at AM. In regions with steeper gradients, the bottom stress gradient is greater, resulting in an intensified shear front.
Data availability statement
The raw data supporting the conclusions of this article will be made available by the authors, without undue reservation.
Author contributions
FD: Data curation, Formal analysis, Methodology, Validation, Visualization, Writing – original draft. SH: Conceptualization, Data curation, Funding acquisition, Investigation, Project administration, Resources, Supervision, Writing – review & editing. HS: Formal analysis, Methodology, Supervision, Writing – review & editing. DW: Supervision, Formal analysis, Validation, Writing – review & editing. XL: Formal analysis, Funding acquisition, Validation, Writing – review & editing.
Funding
The author(s) declare financial support was received for the research, authorship, and/or publication of this article. This research was funded by Jiangsu Province Marine Science and Technology Innovation Project (No. JSZRHYKJ202304).
Acknowledgments
We thank the reviewers and editor for their insightful comments and suggestions.
Conflict of interest
The authors declare that the research was conducted in the absence of any commercial or financial relationships that could be construed as a potential conflict of interest.
Publisher’s note
All claims expressed in this article are solely those of the authors and do not necessarily represent those of their affiliated organizations, or those of the publisher, the editors and the reviewers. Any product that may be evaluated in this article, or claim that may be made by its manufacturer, is not guaranteed or endorsed by the publisher.
References
Bi N. S., Yang Z. S., Wang H. J., Hu B. Q., Ji Y. J. (2010). Sediment dispersion pattern off the present Huanghe (Yellow River) subdelta and its dynamic mechanism during normal river discharge period. Estuar. Coast. Shelf Sci. 86, 352–362. doi: 10.1016/j.ecss.2009.06.005
Chen C., Beardsley R. C., Cowles G. (2006). An unstructured grid, finite-volume coastal ocean model: FVCOM User Manual, 2nd ed. Oceanography. 19(1):78–89. doi: 10.5670/oceanog.2006.92
Chen C., Liu H., Beardsley R. C. (2003). An unstructured grid, finite-volume, three-dimensional, primitive equations ocean model: application to coastal ocean and estuaries. J. Atmos. Ocean. Technol. 20, 159–186. doi: 10.1175/1520-0426(2003)020
Chen C. S., Huang H. S., Beardsley R. C., Liu H. D., Xu Q. C., Cowles G. (2007). A finite volume numerical approach for coastal ocean circulation studies: Comparisons with finite difference models. J. Geophys. Res. 112. doi: 10.1029/2006jc003485
Chen K. L., Lin Y. T., Liu J., He Z. X., Jia L. W. (2024). Combined effects of massive reclamation and dredging on the variations in hydrodynamic and sediment transport in Lingdingyang Estuary, China. Front. Earth Sci. 18, 127–147. doi: 10.1007/s11707-022-1050-x
Du Y. F., Zhang J. C., Bian C. W., Fang X. Y., Cheng J., Wang G. S., et al. (2023). Multiscale spatio-temporal variations of suspended sediment fronts in the semi-enclosed Bohai sea, China. J. Geophys. Res. 128. doi: 10.1029/2023jc019773
Fagherazzi S., Edmonds D. A., Nardin W., Leonardi N., Canestrelli A., Falcini F., et al. (2015). Dynamics of river mouth deposits. Rev. Geophys. 53, 642–672. doi: 10.1002/2014rg000451
Fan Y. S., Chen S. L., Pan S. Q., Dou S. T. (2020). Storm-induced hydrodynamic changes and seabed erosion in the littoral area of Yellow River Delta: A model-guided mechanism study. Cont. Shelf Res. 205. doi: 10.1016/j.csr.2020.104171
Fan H., Huang H. (2005). Changes in Huanghe (Yellow) River estuary since artificial re-routing in 1996. Chin. J. Oceanol. Limnol. 23, 299–305. doi: 10.1007/BF02847152
Fan H., Huang H. J., Zeng T. Q., Wang K. R. (2006). River mouth bar formation, riverbed aggradation and channel migration in the modern Huanghe (Yellow) River delta, China. Geomorphology 74, 124–136. doi: 10.1016/j.geomorph.2005.08.015
Hu C., Cao W. (2003). Variation, regulation and control of flow and sediment in the yellow river estuary I: mechanism of flow-sediment transport and evolution. J. Sediment Res. 0, 1–8. doi: 10.16239/j.cnki.0468-155x.2003.05.001
Huang Z., Xu H. J., Bai Y. C., Shi F. S., Wen Z. C. (2023). Coastline changes and tidal current responses due to the large-scale reclamations in the Bohai Bay. J. Oceanol. Limnol. 41, 2045–2059. doi: 10.1007/s00343-022-2235-6
Ji H. Y., Pan S. Q., Chen S. L. (2020). Impact of river discharge on hydrodynamics and sedimentary processes at Yellow River Delta. Mar. Geol. 425. doi: 10.1016/j.margeo.2020.106210
Jia H., Shen Y. M., Su M. R., Yu C. X. (2018). Numerical simulation of hydrodynamic and water quality effects of shoreline changes in Bohai Bay. Front. Earth Sci. 12, 625–639. doi: 10.1007/s11707-018-0688-x
Jiang A. W., Ranasinghe R., Cowell P. (2013). Contemporary hydrodynamics and morphological change of a microtidal estuary: a numerical modelling study. Ocean Dyn. 63, 21–41. doi: 10.1007/s10236-012-0583-z
Kuenzer C., Ottinger M., Liu G. H., Sun B., Baumhauer R., Dech S. (2014). Earth observation-based coastal zone monitoring of the Yellow River Delta: Dynamics in China’s second largest oil producing region over four decades. Appl. Geogr. 55, 92–107. doi: 10.1016/j.apgeog.2014.08.015
Li G. X., Cheng G. D., Wei H. L., Pan W. G., Zhao J. R. (1994). Shearing zone of the current field off the modern Yellow River mouth. Chin. Sci. Bull. 39, 928–932. doi: CNKI:SUN:KXTB.0.1994-10-017
Li G. X., Tang Z. S., Yue S. H., Zhuang K. L., Wei H. L. (2001). Sedimentation in the shear front off the Yellow River mouth. Cont. Shelf Res. 21, 607–625. doi: 10.1016/s0278-4343(00)00097-2
Li M., Wang Q., Zhang A., Wang H., Liu Y., Wang L. (2014). Study on the evolution of the tidal morphodynamic processes in south-western Laizhou Bay based on numerical simulation in the past 50 years. Acta Oceanol. Sin. 36, 68–76. doi: 10.1007/s13131-014-0519-1
Lu J. F., Zhang Y. B., Lv X. Q., Shi H. H. (2022). The temporal evolution of coastlines in the bohai sea and its impact on hydrodynamics. Remote Sens. 14 (21), 5549. doi: 10.3390/rs14215549
Malarkey J., Davies A. G. (2012). A simple procedure for calculating the mean and maximum bed stress under wave and current conditions for rough turbulent flow based on Soulsby and Clarke’s, (2005) method. Comput. Geosci. 43, 101–107. doi: 10.1016/j.cageo.2012.02.020
Mao Z., Wang N., Song D., Bao X., Zhong Y. (2022). Study on the characteristics of shear front and current transport of sediment in the yellow river estuary based on GOCI and FVCOM. J. Ocean Univ. China 52, 13–26.
McFeeters S. K. (1996). The use of the normalized difference water index (NDWI) in the delineation of open water features. Int. J. Remote Sens. 17, 1425–1432. doi: 10.1080/01431169608948714
Mellor G. L., Yamada T. (1982). Development of a turbulence closure model for geophysical fluid problems. Rev. Geophys. 20, 851–875. doi: 10.1029/RG020i004p00851
Miao H., Qiao L., Zhong Y., Li G. (2022). Evolution of tidal system and material transport off the Huanghe River Delta induced by human activities and natural evolution. Acta Oceanol. Sin. 44, 73–86. doi: 10.12284/hyxb2022071
Miao Q. S., Yang J. K., Yang Y., Wan F., Yu J. (2017). Observation and analysis of tidal and residual current in the North Yellow Sea in the spring. IOP Conference Series. 121 (5), 052040. doi: 10.1088/1755-1315/121/5/052040
Pan H., Jiao S., Xu T., Lv X., Wei Z. (2022). Investigation of tidal evolution in the Bohai Sea using the combination of satellite altimeter records and numerical models. Estuar. Coast. Shelf Sci. 279. doi: 10.1016/j.ecss.2022.108140
Pelling H. E., Uehara K., Green J. (2013). The impact of rapid coastline changes and sea level rise on the tides in the Bohai Sea, China. J. Geophys. Res. 118, 3462–3472. doi: 10.1002/jgrc.20258
Qiao L. L., Bao X. W., Wu D. X., Wang X. H. (2008). Numerical study of generation of the tidal shear front off the Yellow River mouth. Cont. Shelf Res. 28, 1782–1790. doi: 10.1016/j.csr.2008.04.007
Qiao L. L., Zhong Y., Wang N., Zhao K., Huang L. L., Wang Z. (2016). Seasonal transportation and deposition of the suspended sediments in the Bohai Sea and Yellow Sea and the related mechanisms. Ocean Dyn. 66, 751–766. doi: 10.1007/s10236-016-0950-2
Song D., Wang X. H., Zhu X., Bao X. (2013). Modeling studies of the far-field effects of tidal flat reclamation on tidal dynamics in the East China Seas. Estuar. Coast. Shelf Sci. 133, 147–160. doi: 10.1016/j.ecss.2013.08.023
Sun B., Zuo S., Xie H., Li H., Yang Z. (2017). Analysis of impact effects and changes of the coastline in the Bohai Bay during the past 40 years. J. East China Normal Univ. (04), 139-148. doi: 10.3969/j.issn.1000-5641.2017.04.012
Wang N., Li G. X., Qiao L. L., Shi J. H., Dong P., Xu J. S., et al. (2017). Long-term evolution in the location, propagation, and magnitude of the tidal shear front off the Yellow River Mouth. Cont. Shelf Res. 137, 1–12. doi: 10.1016/j.csr.2017.01.020
Wang N., Li K., Song D. H., Bi N. S., Bao X. W., Liang S. K., et al. (2024). Impact of tidal shear fronts on terrigenous sediment transport in the Yellow River Mouth: Observations and a synthesis. Mar. Geol. 469. doi: 10.1016/j.margeo.2024.107222
Wang N., Li G. X., Xu J. S., Qiao L. L., Dada O. A., Zhou C. Y. (2015). The marine dynamics and changing trend off the modern Yellow River mouth. J. Ocean Univ. 14, 433–445. doi: 10.1007/s11802-015-2764-0
Wang N., Qiao L. L., Li G. X., Zhong Y., Song D. H., Ding D., et al. (2019). Numerical study on seasonal transportation of the suspended sediments in the modern yellow river mouth effected by the artificial water and sediment regulation. J. Ocean Univ. 18, 20–30. doi: 10.1007/s11802-019-3646-7
Wang H., Yang Z., Li Y., Guo Z., Sun X., Wang Y. (2007). Dispersal pattern of suspended sediment in the shear frontal zone off the Huanghe (Yellow River) mouth. Cont. Shelf Res. 27, 854–871. doi: 10.1016/j.csr.2006.12.002
Wei F., Han M., Han G. X., Wang M., Tian L. X., Zhu J. Q., et al. (2022). Reclamation-oriented spatiotemporal evolution of coastal wetland along Bohai Rim, China. Acta Oceanol. Sin. 41, 192–204. doi: 10.1007/s13131-022-1987-3
Wu Z. C., Zhou C. Y., Wang P., Fei Z. H. (2023). Responses of tidal dynamic and water exchange capacity to coastline change in the Bohai Sea, China. Front. Mar. Sci. 10. doi: 10.3389/fmars.2023.1118795
Yang Y., Chen S., Xu C. (2021). Morphodynamics and tidal flow asymmetry of the Huanghe River Estuary. Acta Oceanol. Sin. 43, 13–25. doi: 10.12284/hyxb2021094
Yang Z. S., Ji Y. J., Bi N. S., Lei K., Wang H. J. (2011). Sediment transport off the Huanghe (Yellow River) delta and in the adjacent Bohai Sea in winter and seasonal comparison. Estuar. Coast. Shelf Sci. 93, 173–181. doi: 10.1016/j.ecss.2010.06.005
Yu Y., Shi X., Wang H., Chengkun Y., Shenliang C., Yanguang L., et al. (2013). Effects of dams on water and sediment delivery to the sea by the Huanghe (Yellow River): The special role of Water-Sediment Modulation. Anthropocene 3, 72–82. doi: 10.1016/j.ancene.2014.03.001
Zhan C., Wang Q., Cui B. L., Zeng L., Dong C., Li X. Y., et al. (2020). The morphodynamic difference in the western and southern coasts of Laizhou Bay: Responses to the Yellow River Estuary evolution in the recent 60 years. Glob. Planet. Change 187 (3), 103138. doi: 10.1016/j.gloplacha.2020.103138
Zhang X. H., Fagherazzi S., Leonardi N., Li J. F. (2018). A positive feedback between sediment deposition and tidal prism may affect the morphodynamic evolution of tidal deltas. J. Geophys. Res.-Earth Surf. 123, 2767–2783. doi: 10.1029/2018jf004639
Zhang P., Yang Q. S., Wang H., Cai H. Y., Liu F., Zhao T. T. G., et al. (2021). Stepwise alterations in tidal hydrodynamics in a highly human-modified estuary: The roles of channel deepening and narrowing. J. Hydrol. 597 (1). doi: 10.1016/j.jhydrol.2021.126153
Zhu L. H., Hu R. J., Zhu H. J., Jiang S. H., Xu Y. C., Wang N. (2018). Modeling studies of tidal dynamics and the associated responses to coastline changes in the Bohai Sea, China. Ocean Dyn. 68, 1625–1648. doi: 10.1007/s10236-018-1212-2
Keywords: Yellow River Estuary, tidal dynamics, tide shear fronts, topographic changes, trends over the last two decades
Citation: Dong F, Han S, Su H, Wu D and Liang X (2024) Response of tidal dynamics and shear fronts to topographic changes in the Yellow River Delta. Front. Mar. Sci. 11:1454527. doi: 10.3389/fmars.2024.1454527
Received: 25 June 2024; Accepted: 21 October 2024;
Published: 08 November 2024.
Edited by:
Chunyan Li, Louisiana State University, United StatesCopyright © 2024 Dong, Han, Su, Wu and Liang. This is an open-access article distributed under the terms of the Creative Commons Attribution License (CC BY). The use, distribution or reproduction in other forums is permitted, provided the original author(s) and the copyright owner(s) are credited and that the original publication in this journal is cited, in accordance with accepted academic practice. No use, distribution or reproduction is permitted which does not comply with these terms.
*Correspondence: Shuzong Han, aGFuc3pAb3VjLmVkdS5jbg==
 Fengjiao Dong
 Shuzong Han1,2*