- 1College of Chemistry and Environment, Guangdong Ocean University, Zhanjiang, China
- 2College of Electronic and Information Engineering, Guangdong Ocean University, Zhanjiang, China
In coastal erosion studies, the erosion and accretion index is a vital research tool for analyzing types of erosion and accretion. This index is primarily empirical or semi-empirical and is usually validated through tank experiments or open beach datasets, resulting in significant variation across different beach environments. In this study, 11 beach profiles of eight beaches measured along the Qiongzhou Strait in China, measured from 2018 to 2021, were analyzed to quantitatively determine coastal erosion or accretion by calculating each profile’s volume change per unit width. Additionally, sediment and wave data were used to calculate five erosion and accretion indices monthly to determine erosion and accretion conditions. These conditions were then compared with actual beach erosion and accretion data to evaluate the applicability of various discriminant indices. Furthermore, optimizing the threshold values of discriminant indices. The results show that: (1) Overall annual erosion and accretion are minimal, but seasonal variation is significant for beaches on both sides of the Qiongzhou Strait; (2) The five discriminant indices have some limitations in this study area, necessitating careful consideration when applying them to headland bay arc-shaped beaches with fetch-limited environments like the Qiongzhou Strait; (3) The selection of discriminant index parameters and their respective contribution degree of each parameter affects the formula’s applicability, with two-parameter formulas proving superior to the three-parameter formula in the study area; (4) Beach environmental factors, particularly those influenced by headlands and fetch-limited environments, impact the indices’ applicability; (5) Increasing the threshold value to a certain extent can improve the formula’s applicability.
1 Introduction
The coastal zone marks the interface between land and ocean, characterized by heightened human activity. With the escalation of global warming and the frequency of severe oceanic weather events, natural disasters in these areas are becoming more prevalent. Among the most common geological hazards are erosion and accretion (Fu et al., 2022; Hamza et al., 2019; Pantusa et al., 2022). The erosion and accretion discriminant index plays a pivotal role in forecasting shifts in coastal erosion and accretion, thus holding significant importance in understanding beach erosion mechanisms and guiding coastal management.
Initially, researchers identified wave steepness as a key factor influencing coastal erosion, leading to its utilization as a discriminant index. When wave steepness exceeds 0.025, the beach is erosive; conversely, it is accretive (Johnson, 1949). Subsequent validation on natural beaches revealed that beach erosion and accretion status could not be accurately determined using only the wave steepness parameter (Smith et al., 1976; Dong, 1981). Thus, to improve the applicability of the discriminant index, additional parameters such as wave characteristics, sediment properties, and beach slope were sequentially introduced and combined in various forms (Iwagaki and Noda, 1962; Dean, 1973; Horikawa et al., 1973; Sunamura and Horikawa, 1974; Swart, 1974), generating some representative discriminant indices (Dean, 1973; Hattori and Kawamata, 1980; Sunamura and Horikawa, 1974; Ahrens and Hands, 1998; Dalrymple, 1992). Based on previous researchers, Dong (1981) explored the erosion and accretion discriminant indices of sandy beaches using prototype data and proposed a new discriminant index. Xu (1988) employed the Bagnold energy model to derive another new erosion and accretion discriminant index. However, neither of these indices has been extensively validated with additional field measurement data. Due to the observation conditions and instrumentation limitations, the discriminant index was initially derived from wave tank experiments. Since the 1970s, it has been gradually applied to natural beaches, leading to further development and refinement. The discriminant index has some limitations when applied to natural beaches due to the scale effect and tank effects (Dong, 1981; Jackson, 1999; Rojals Mainar, 2016; Seymour and Castel, 1989). However, adjusting the empirical coefficients can improve its applicability (Xu, 1988; Jackson, 1999; Kriebel et al., 1986). Previous studies have mostly explored the applicability of discriminant indices in open beaches, with little research on their applicability in the headland bay arc-shaped beaches with fetch-limited environments. However, there are significant differences in discriminant results under different geological backgrounds and dynamic environments (Jackson, 1999; Rojals Mainar, 2016; Seymour and Castel, 1989; Mendoza and Jiménez, 2006). In addition, most studies only discuss the applicability of discriminant indices in specific locations, without threshold correction to improve their applicability.
For beaches along the Qiongzhou Strait, the geologic background and dynamic environment often differ from those of open seas (Eliot and Clarke, 1986; Shenoi et al., 1987; Hegge et al., 1996; Burvingt et al., 2017). These beaches on both sides of the strait typically feature headland bay arc-shaped beaches with fetch-limited environments. Consequently, they are influenced not only by the sheltering effect of headlands but also by the constraints imposed by limited fetch conditions. In this study, five representative discriminant indices are selected: Dean parameter (Dean formula), Hattori and Kawamata formula (HK formula), Sunamura and Horikawa formula (SH formula), Ahrens formula (Ah formula), Dalrymple parameter (P formula). The applicability of these five indices is examined for beaches on both sides of the Qiongzhou Strait, and the factors influencing their applicability are analyzed. The thresholds of the discriminant indices are then optimized to improve their performance, providing a theoretical basis and support for applying erosion and accretion discriminant indices to beaches in China.
2 Materials and methods
2.1 Study area
The Qiongzhou Strait is situated between the Leizhou Peninsula of Guangdong Province and Hainan Island of Hainan Province (19°52′–20°16′ N, 109°42′–110°41′ E), flanked by the Gulf of Tonkin to the west and the northern part of the South China Sea to the east. The strait lies in the southern part of the Leiqiong Graben Basin, a long and narrow rectangular basin oriented northeast-southwest. It has a central water depth of 80–100 meters, with flat terrain and shallow waters at its eastern and western entrances. The shoreline is jagged, featuring headlands and bays, predominantly with sandy beaches (Hu, 2022). Many shoreline segments along the strait are experiencing severe erosion, with annual erosion setbacks of up to several meters (Liu et al., 2007).
Waves in the Qiongzhou Strait are primarily dominated by wind waves, occurring more than 76.7% of the time. The wave patterns vary significantly with the seasons, with common wave directions and strong waves generally from the same direction of NE–ENE. The average wave height is 0.60 m in the west, 0.40 m in the center, and 0.90 m in the east (Teng and Wu, 1993; Xu et al., 2020). The strait is dominated by south-directed wind waves in summer and NE and ENE waves in winter, and when a storm surge attacks the strait, it is often accompanied by large waves, with the wave direction following the path of the storm surge (Wright and Short, 1984).
The tidal current in the strait is controlled by the tidal wave system of the Beibu Gulf and influenced by the tidal waves of the northern branch of the South China Sea. The tidal waves in the strait have the nature of both advancing waves and standing waves, which show a certain degree of complexity (Wang et al., 2006). The tidal nature of the eastern and western entrances of Qiongzhou Strait are obviously different. The eastern entrance is an irregular semi-diurnal tide, the western entrance to Haikou Bay is an irregular diurnal tide, and the western entrance to Houshui Bay is a typical regular diurnal tide. The coastal tidal range gradually increases from east to west, with an average range of 0.80–1.10 m in the eastern section and 1.50 m in the western section. The maximum tidal range in the western part of Ma Niao port was 4.56 m (Wang et al., 2006).
In the Qiongzhou Strait, southwest wind prevails in summer and northeast wind in winter, with variable wind direction in fall and mainly east wind in spring. The topography and monsoon winds affect the beaches on both sides of the strait. The beaches on the south coast are in a sheltered state in summer and the beaches on the north coast are in a sheltered state in winter. Meanwhile, the central coast of the strait is a typical beach in the fetch-limited zone, as it is mainly subject to the waves’ refraction and diffraction action.
2.2 Data gathering and processing
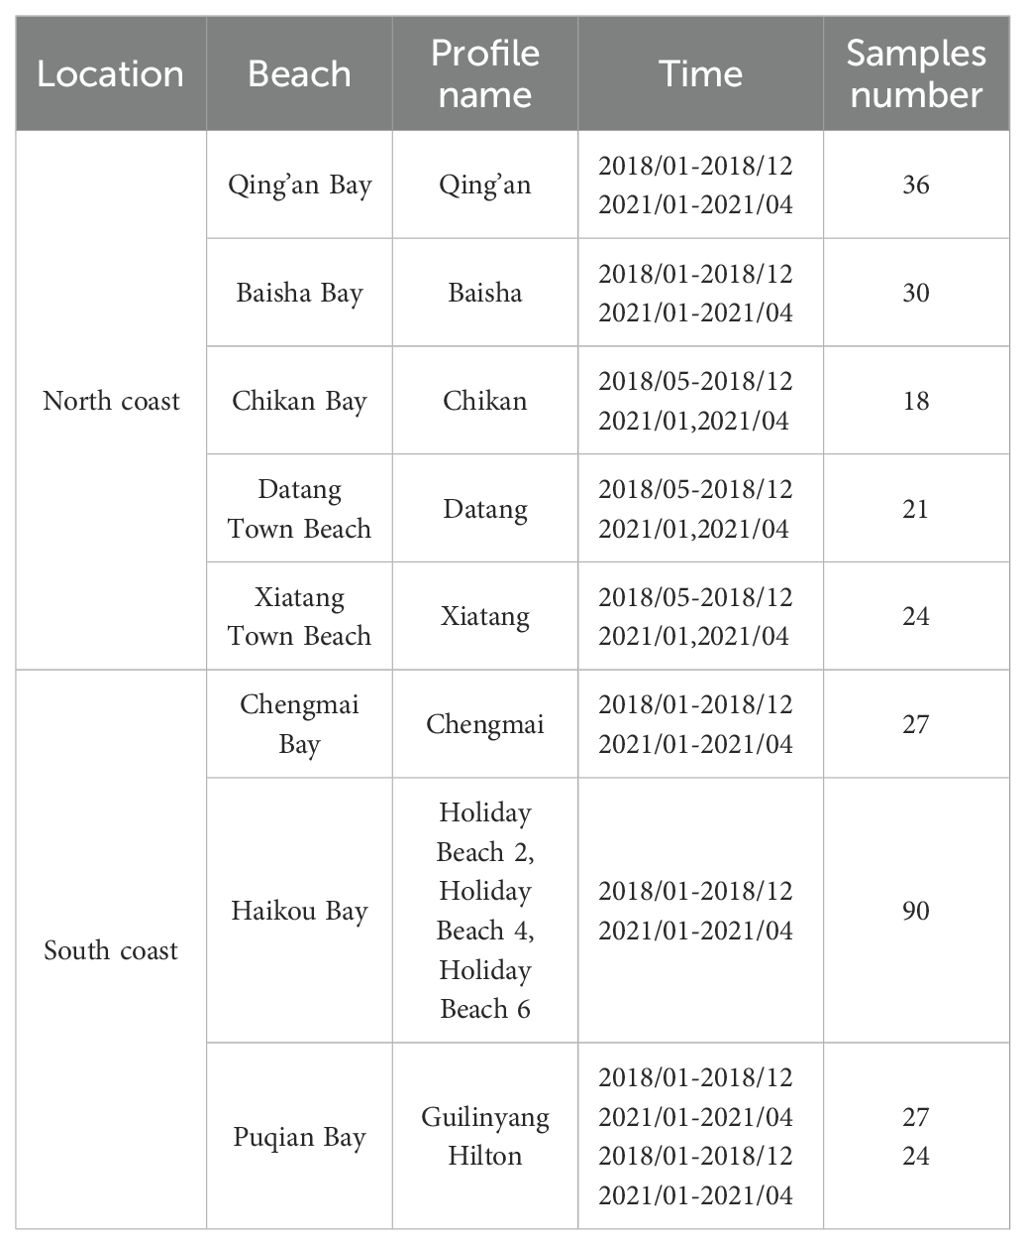
The measured beaches on the north coast of the Qiongzhou Strait include Qing’an Bay, Baisha Bay, Chikan Bay, Datang Bay, and Xiatang Bay; the measured beaches on the south coast include Puqian Bay, Chengmai Bay, and Holiday Beach, and the specific distribution of beaches is shown (Figure 1). Based on the actual beach planform, combined with naturalness and representativeness, the specific location of each profile is determined. At least one profile is laid out for each beach, with two profiles laid out for Puqian Bay and three for Holiday Beach. In total, 11 profiles are measured. The profile measurement time, location, sediment collection, etc., are shown in Table 1. Field measurements of the characteristic beaches on the north and south sides of the Qiongzhou Strait were conducted from January 2018 to December 2018 and January 2021 to April 2021.
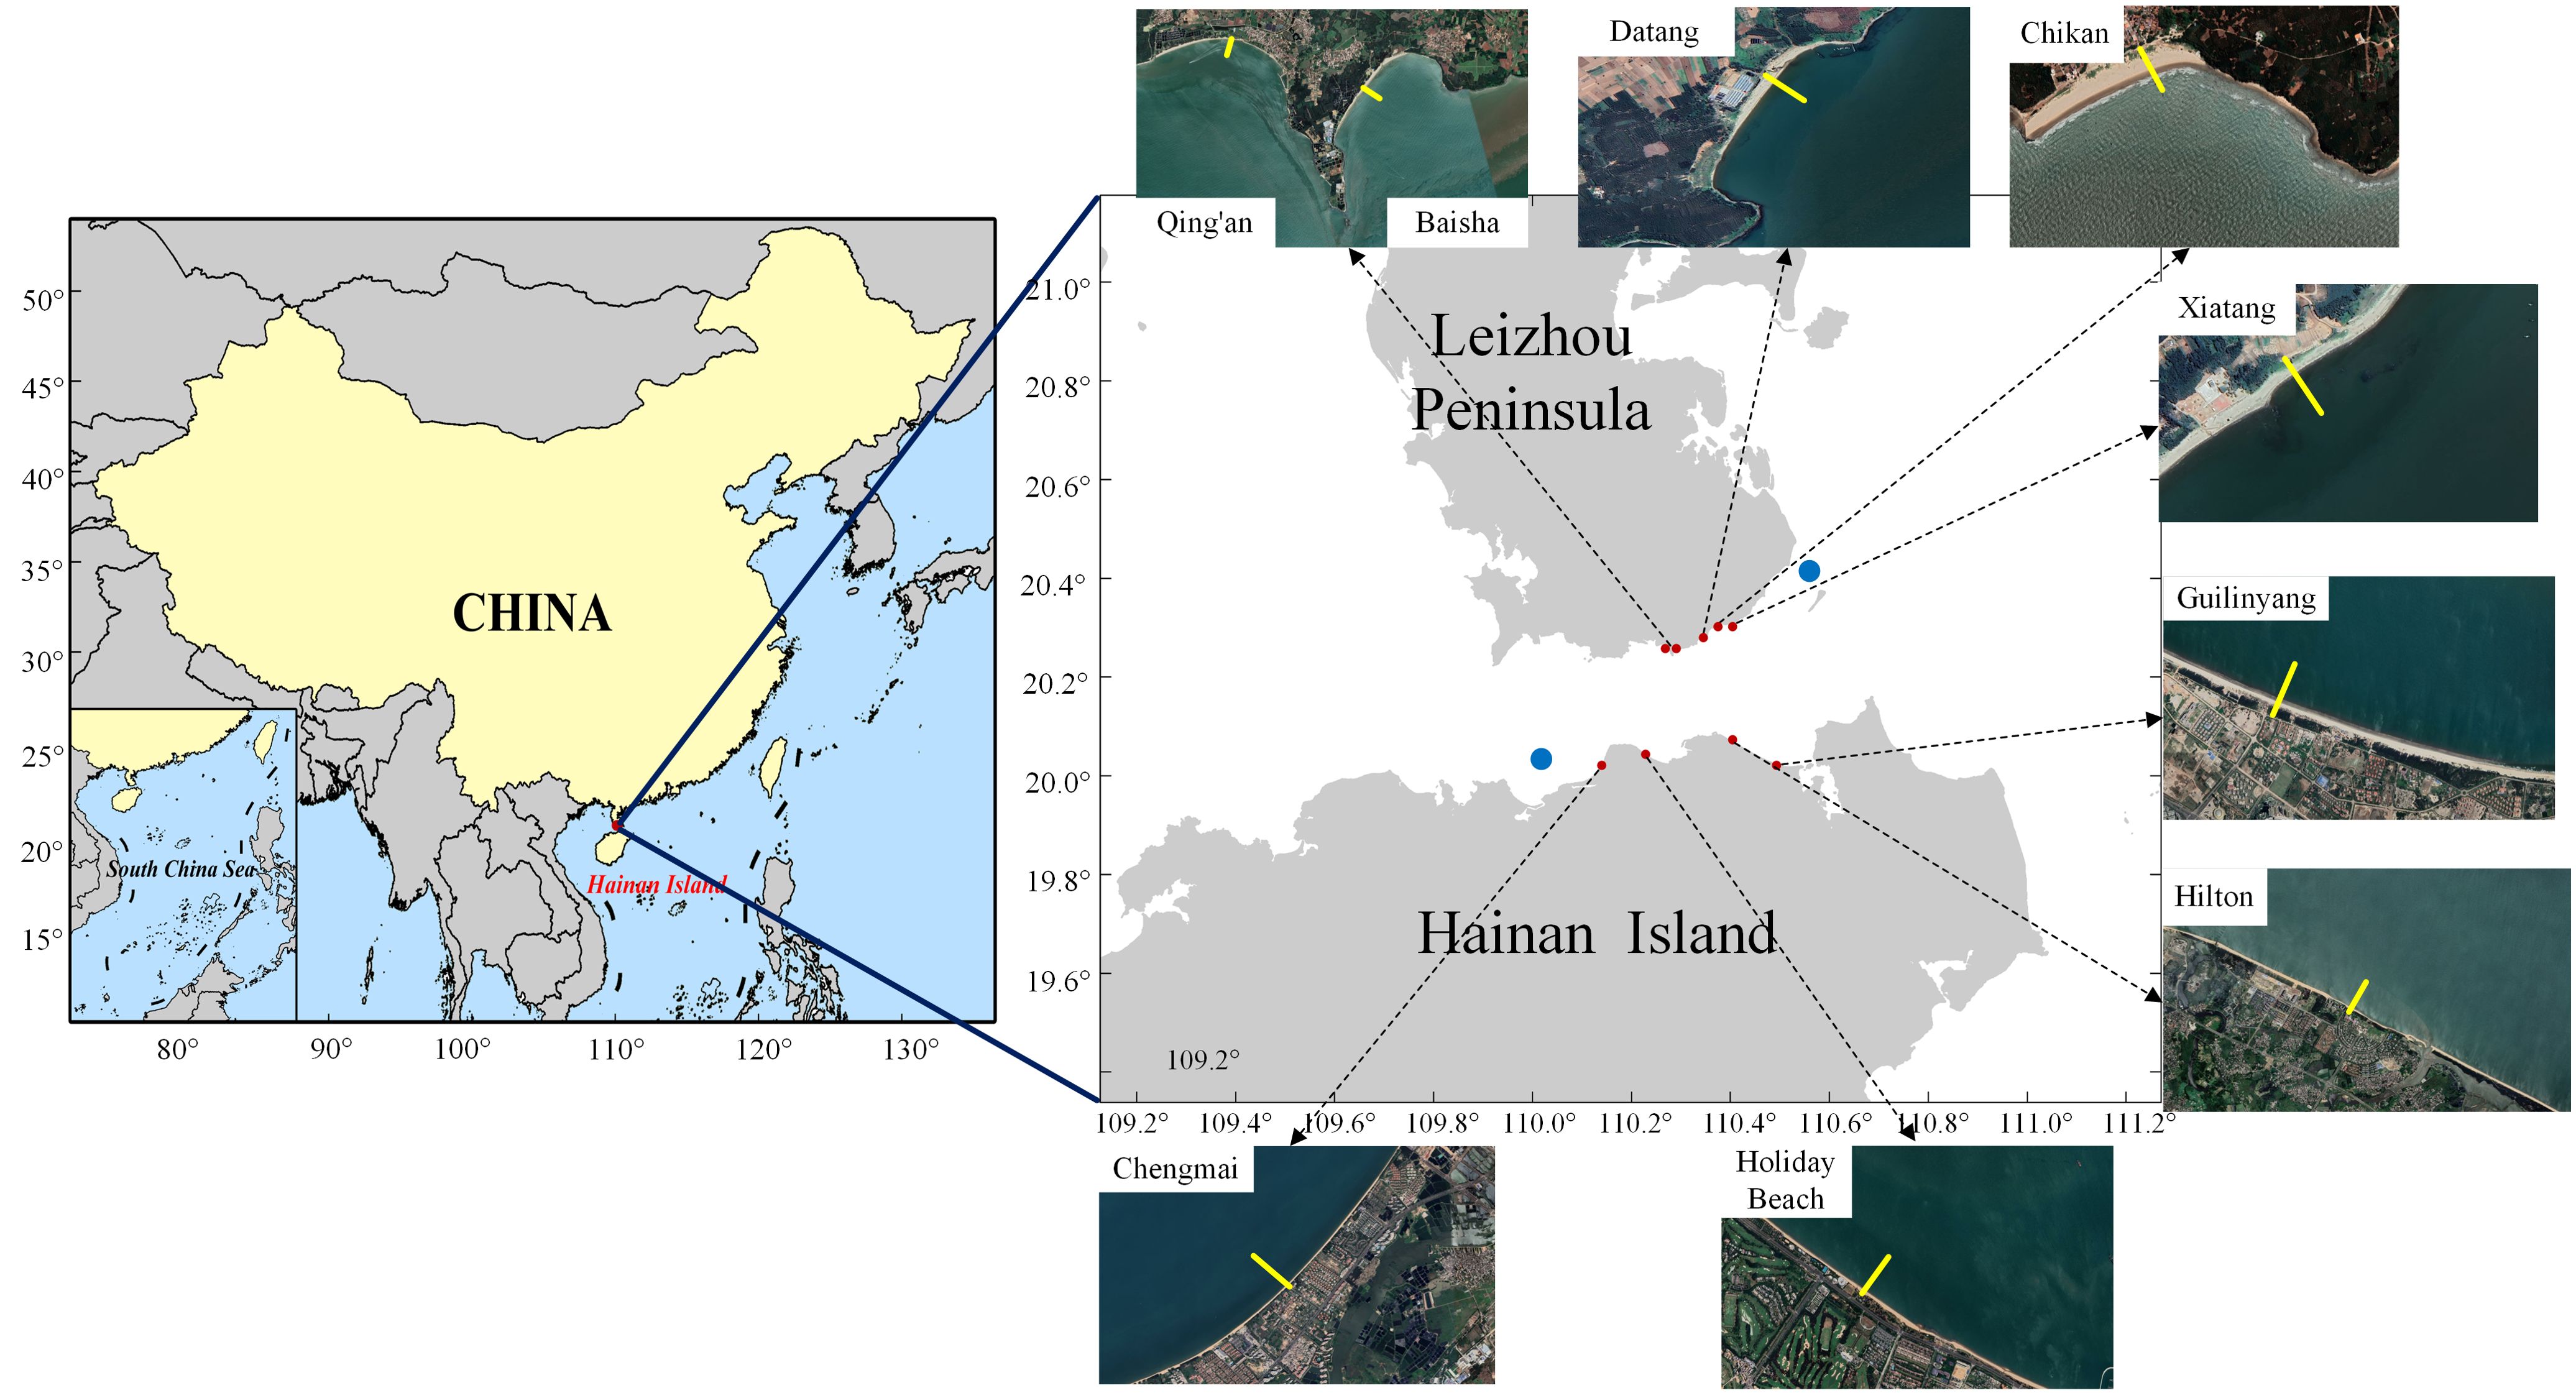
Figure 1. Geographic location of the study area and images of the beach (the red points are the location of the beach, the blue points are wave measurement points, and the yellow straight line is the location of the profile).
The beach profiles were measured using the GPS-RTK method (Scott et al., 2016), with CGCS-2000 geodetic coordinates for the planimetric coordinate system and the 1985 National Elevation Datum for the elevation. Each beach profile is measured manually step-by-step, with the distance between measurement points not exceeding 5 m in principle, to obtain the latitude, longitude, and elevation data of the place. Beach profile measurement starts from the beach backshore dune, along the direction perpendicular to the shoreline until the beach at low tide near the waterline. Encrypted measurements were conducted at beach berms and scarp locations where there are significant changes in beach topography. The locations of the repeated measurements were as close as possible to the same position, and by setting up stable relative datums on the embankment, it was ensured that each monitoring point was on the same profile every time.
Alongside the profile elevation measurements, surface sediment samples were collected from the supratidal, intertidal, and subtidal zones, totaling 297 surface samples. For processing the sediment samples, the collected beach surface sediments underwent pre-treatment to remove organic matter, calcium cement, and salt. The samples were then dried in an oven. The dried samples were subsequently sieved using a vibrational sifter with a grain size interval of 0.25 φ. During the sieving process, the weight of each fraction was recorded, and the grain size parameters were calculated using the method of moments proposed by Friedman (Friedman, 1962).
Wave data for the study area were obtained from the European Centre for Medium-Range Weather Forecasts (ERA5) dataset (https://cds.climate.copernicus.eu/cdsapp#/dataset/). The ERA5 dataset is the fifth generation of global climate and weather reanalysis data, covering the past 40-70 years with real-time updates from 1979 to the present. It has a spatial resolution of 0.5°, which is sufficient to meet the accuracy requirements of this study. The dataset’s applicability in the relevant sea area has been verified and shows good agreement with buoy data (Shi et al., 2021).
2.3 Study methodology
2.3.1 Volumes of unit width
Beach profile unit width volumes were utilized to compare and monitor profile erosion and accretion quantitatively. The volume of the unit width of the profile was calculated by Equation 1.
Where, m is the measurement order, and represents the volume area value of the m time measurement; is the lower limit of integration, is the upper limit of integration; indicates the horizontal distance between the two points and , and is the horizontal distance between the two neighboring points and (); is the adjusted elevation, . Because h has a negative value, to prevent the negative value of the direct integration, the value two was added according to the profile elevation to all the h uniformly; ()/2 represents the average elevation value of the two adjacent measurement points after adjustment (Zhong, 2021).
2.3.2 Sediment settling velocity
Sediment settling velocity (Ferguson and Church, 2004) was calculated using Equation 2:
Where ω is the sediment settling velocity, R sediment submerged specific gravity, taken as 1.65 for quartz in water, g = 9.8 m/s2, D is the median grain size of sediment, , are constants, Ferguson and Church suggested = 18, = 1, and v is the kinematic viscosity of the fluid, ν = 1.0×10⁻⁶ kg/m/s (the water temperature is 20 °C).
2.3.3 Beach erosion and accretion discriminant index
2.3.3.1 Dean formula
In 1973, Robert G. Dean considered the basic assumption that sediment was suspended during the wave crest phase position. So if the fall time were less or greater than one half of the wave period, the net transport would be landward or seaward, respectively. Then, he utilized a small-scale tank experiment to propose an equation for discriminating between erosive and accretive profiles that fitted wave steepness and sediment settling velocity (Dean, 1973).
Where H0 is the deep-water wave height, L0 is the deep-water wave length, C1 = 1.7, Wf is the sediment settling velocity, and T is the wave period. Combining the deep-water wave length formula L0= gT2/2π in linear wave theory, the previous formula is re-expressed as a dimensionless Dean parameter.
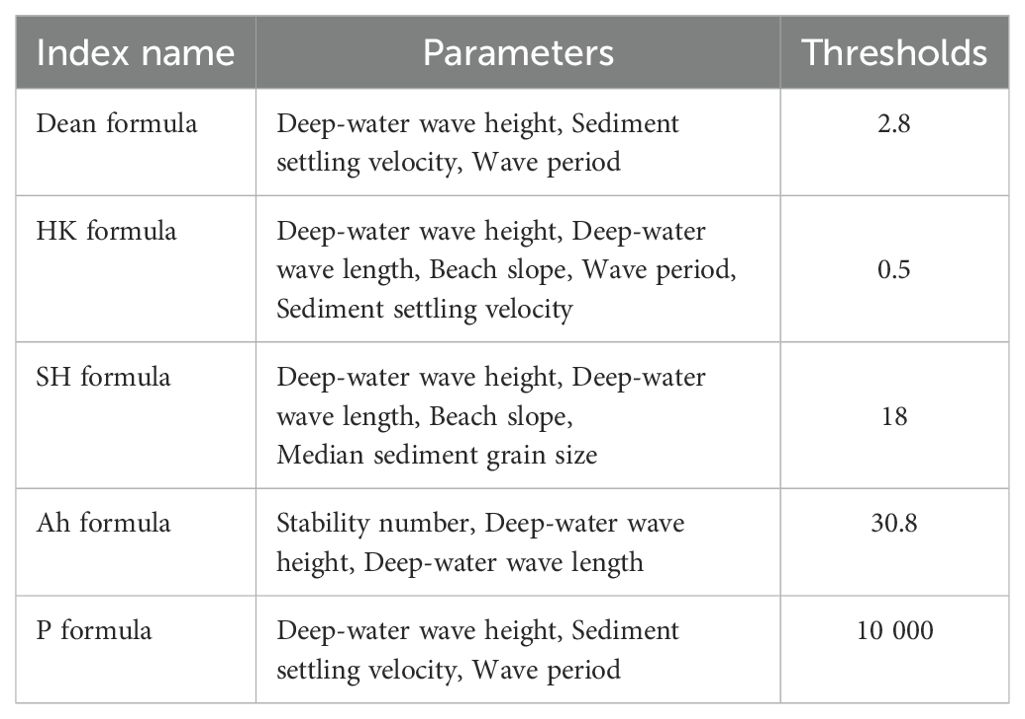
Initially, the discriminating threshold for the Dean parameter was set at 0.85, with values greater than 0.85 indicating an erosion profile and values less than 0.85 indicating an accretive profile. In 1986, Kriebel, Dally, and Dean re-examined the field and large-scale laboratory tests using newer and more reliable data. These tests included only prototype and large-scale laboratory data, leading to a revised threshold of 2.8 for the Dean parameter (Rojals Mainar, 2016).
2.3.3.2 HK formula
In 1980, Hattori and Kawamata proposed a model for offshore-onshore sand transport in the surf zone based on the relationship between the sediment suspension force caused by the turbulence generated by breaking waves and the gravity-induced resistance to sediment suspension, which discriminates the erosion and accretion state of the beach profile. Then Hattori and Kawamata (1980) proposed a formula for determining the erosion or accretion of a beach. This formula is very similar to Dean’s formula in that it takes deep-water wave steepness, Sediment settling velocity, and wave period into account. However, the formula also incorporates a new parameter, beach slope.
Since it is difficult to measure the sediment and wave parameters in the surf zone when waves are breaking, and also wave steepness is related to the deep-water wave elements, Hattori and Kawamata modified the formula to obtain the following (Rojals Mainar, 2016):
Where Ws is the sediment settling velocity determined by the median grain size of the sediment, the beach slope is defined as the water depth at wave breaking divided by the width of the surf zone. When HK > 0.5, the profile is erosive; when HK < 0.5, the profile is accretive; and when HK = 0.5, the profile is in equilibrium.
2.3.3.3 SH formula
Due to the tendency of bar and shoreline migration and the complexity of beach pattern, it is challenging to categorize beach profiles into bar type and step type. Considering the influence of plane profiles, Sunamura and Horikawa (1974) proposed a relational equation for discriminating between beach erosion and accretion in 1974 based on small-scale laboratory data.
Where C is a constant and d is the median grain size of the sediment. Initially, C > 8 is an erosion profile, C < 4 is an accretion profile, and 4 < C < 8 is an equilibrium profile.
In subsequent studies, Sunamura tested the above equations using newer, more reliable data and proposed a new threshold for discriminating beach erosion or accretion, i.e., C = 18. When C > 18, it is an erosion profile; when C < 18, it is an accretion profile; and when C = 18, it is an equilibrium profile.
2.3.3.4 Ah formula
In 1988, Ahrens and Hands (1998) applied nonlinear wave theory to predict nearshore sediment movement under shallow-water wave action. Based on the combined effects of wave theory and sediment incipient motion, it was suggested that two dimensionless parameters—the stability number and deep-water wave steepness could be used to describe the nearshore sediment transport process. This approach provides a new method for distinguishing between beach erosion and accretion.
Where Ns is the stability number commonly used to measure the stability of rubble structures, , is the density of sediment, is the density of water, and Hs0/L0 is the wave steepness in deep-water. This formula is not only applicable to sandy beaches but also to gravel beaches (Ahrens and Hands, 1998). When Ah > 30.8, it is an erosion profile; when Ah < 30.8, it is an accretion profile; when Ah = 30.8, the profile is in equilibrium.
2.3.3.5 P formula
Sediment transport offshore can lead to the formation of the bar, based on which Dean proposed parameters to discriminate the state of the profile. Dalrymple (1992) proposed a new profile parameter, the P formula, based on the Dean parameter, a formula that can also be used to discriminate beach erosion or accretion.
The variables involved in the equations have the same physical meaning as those in the Dean parameters. When P > 10,000, it is an erosion profile; when P < 10,000, it is an accretion profile; and when P = 10,000, the profile is in equilibrium.
3 Results
3.1 Volume of unit width variation
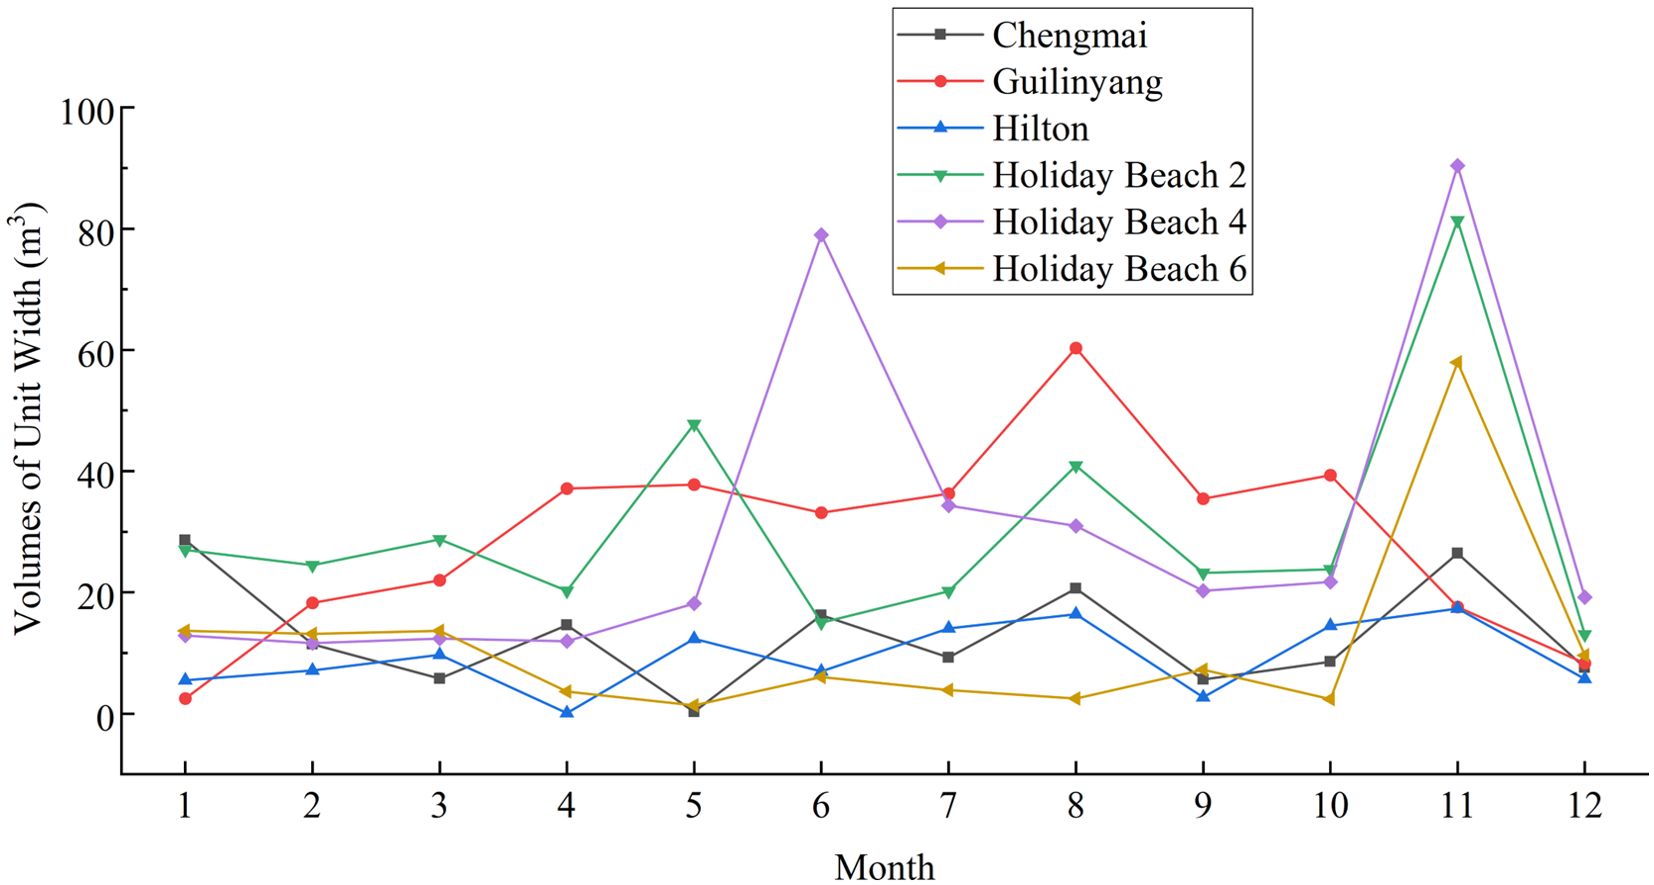
On the beaches on both sides of the Qiongzhou Strait, the overall annual change in erosion and accretion ranges from -41.70 to 20.17 m³. However, the change in unit width volume varies significantly between different seasons due to the combined influence of monsoons, waves, and currents. Figures 2, 3 illustrate the change in unit width volume for each beach in the Qiongzhou Strait. It is evident that Holiday Beach 4 exhibits the highest oscillation amplitude, followed by Holiday Beach 2 and Holiday Beach 6. Contrarily, the oscillation amplitudes of Chikan, Datang, Xiatang, Chengmai, and Hilton are comparatively smaller. Therefore, in terms of the magnitude of change in unit width volumes, Holiday Beach 4 and Holiday Beach 2 experience more significant changes, followed by Holiday Beach 6. Conversely, the changes in Chikan, Datang, Xiatang, Chengmai, and Hilton are relatively minor. The changes in the volumes of unit width for each beach are as follows:
1. Changes in beach volume along the north coast of the strait are illustrated in Figure 2. Qing’an primarily exhibits a pattern of decreasing, then increasing, and then decreasing, whereas Baisha demonstrates an opposite trend of increasing, then decreasing, and then increasing. Notably, Qing’an experienced a significant trough during March-May and a pronounced peak area during July–September, while Baisha showed a notable upward trend and a significant peak area during March-May. Chikan Bay and Datang Bay generally undergo a decrease followed by an increase and then another decrease. Similarly, Xiatang Bay exhibits a decrease followed by an increase, then a decrease, and finally another increase. These areas, including Chikan, Datang, and Xiatang, display a significant peak in July-September.
2. Changes in beach volume along the south coast of the strait are depicted in Figure 3. Chengmai Bay and Hilton Beach both exhibit a multi-peak trend overall, with a notable peak area appearing in October-December. Guilinyang Beach shows an overall increase followed by a decrease, with a significant peak observed in July-September and a smoother change in April-July. Notably, during the March-July period, Chengmai Bay and Hilton Beach display three opposite trends, where Chengmai Bay shows a peak while Hilton Beach shows a trough, and vice versa. Holiday Beach 2 and Holiday Beach 4 display multiple peaks, with Holiday Beach 2 showing significant peak areas in April-June and October-December and Holiday Beach 4 showing a significant peak area in October-December. Holiday Beach 6 exhibits a generally smoother profile with occasional peaks. Furthermore, it is noteworthy that Holiday Beach 3 profiles all demonstrate the same trend in October-December, with each showing a peak during this period.
3.2 Results of erosion and accretion discriminant
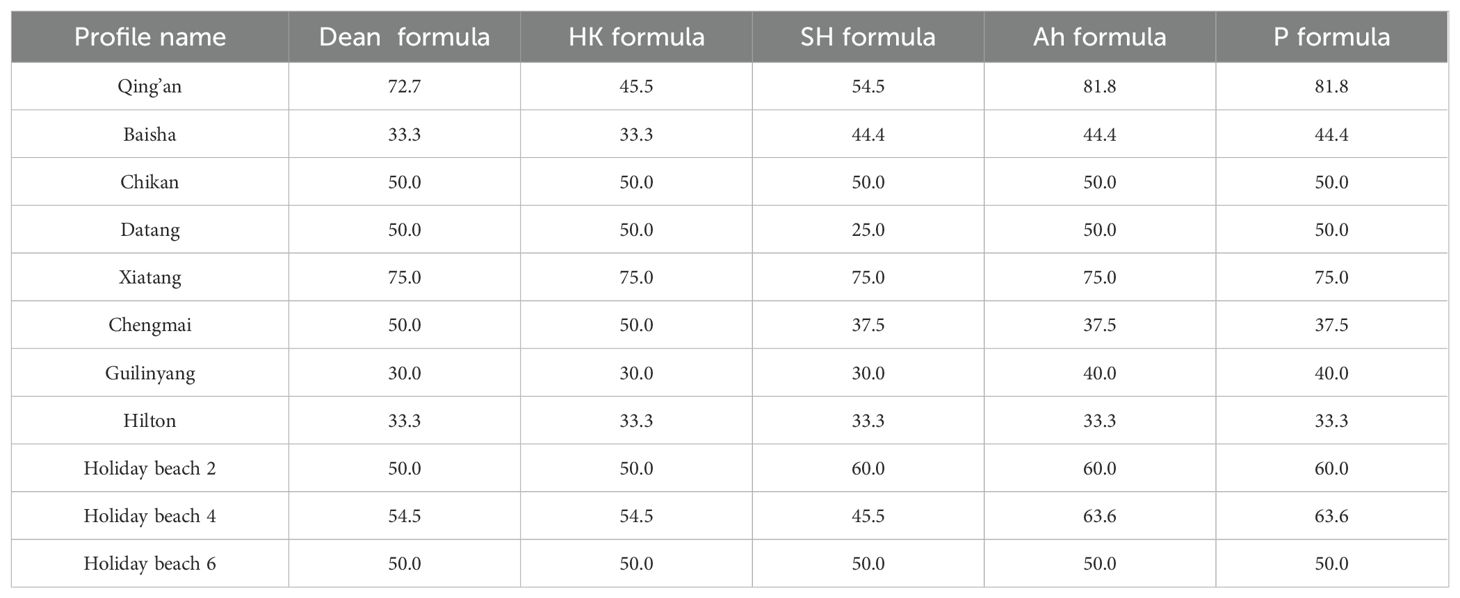
The results of the applicability of five erosion and accretion discriminant indices on the north and south beaches of the Qiongzhou Strait are presented in Tables 2, 3. The formula calibrated with tank experiment data and open beaches seems to have reduced applicability on beaches in the headland bay arc-shaped beaches with fetch-limited environments. Overall, the Ah formula demonstrates the highest applicability rate at 53.3%, followed by the Dean formula at 48.9%, while the P formula shows relatively poor applicability.

Table 2. Applicability of discriminant indexes on the north and south coasts or in different seasons (%).

Table 3. Discriminant index application rates (%) for different seasons on the north coast/south coast.
When considering the north and south coasts separately, it is evident that the applicability of each discriminant index is generally higher on the north coast compared to the south coast. For instance, the Ah formula exhibits an applicability rate of 62.5% on the north coast, whereas it is only 48.3% on the south coast. Similarly, the P formula shows an applicability rate of 56.3% on the north coast, contrasting with 37.9% on the south coast. In terms of different seasons, the applicability of discriminant indices is higher in fall and winter compared to spring and summer. For example, the Ah formula demonstrates a high applicability rate of 92.9% in fall and 54.2% in winter. However, in spring and summer, the applicability rates decrease to 39.1% and 44.8%, respectively.
The applicability of each discriminant index to different beaches is shown in Table 4. For the Dean formula, Xiatang has the highest applicability rate of 75.0%, followed by Qing’an, with an applicability rate of 72.7%, and Guilinyang has the worst applicability rate of 30.0%. As for the P formula, Qing’an has the highest applicability rate of 81.8%, followed by Xiatang, with an applicability rate of 75.0%, respectively. Hilton has the lowest applicability rate of 33.3%, followed by Chengmai Bay.
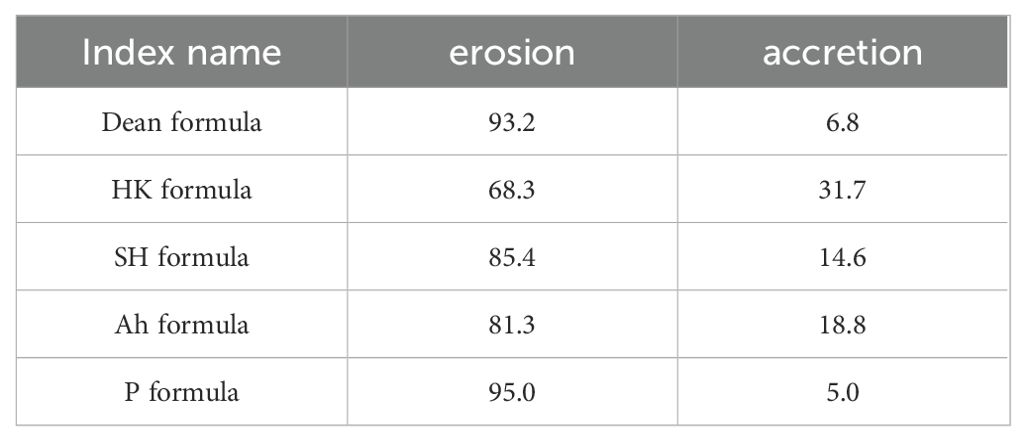
The discriminant indexes have different discriminant accuracy for erosion and accretion events, but all the discriminant indexes have better discriminant ability for erosion events than accretion events (Table 5). For example, the Dean formula has a discriminatory accuracy of 93.2% for erosion events but a discriminatory accuracy of 6.8% for accretion events. P formula has a discriminatory accuracy of 95.0% for erosion events but only 5.0% for accretion events.
4 Discussion
The validation of the applicability of the discriminant indexes to the beaches of the Qiongzhou Strait revealed that the performance of all five discriminant indexes was inferior to that in the laboratory validation. This is due to the scale problems and tank effects from small-scale laboratory tests (Kriebel et al., 1986), as well as differences in monochromatic waves generated in wave tanks and naturally found random waves, which may reduce the applicability of these discriminant indexes in natural environments (Seymour and King, 1982).
4.1 Influence of parameter selection on the applicability of discriminant indexes
The beach erosion and accretion discriminant indices are empirical or semi-empirical formulas, each considering various factors such as wave characteristics, sediment properties, and beach slope (refer to Table 6). Overall, It is observed that discriminant indices utilizing two parameters are more applicable than those relying on a single or triple parameter (Jackson, 1999), a trend supported by measured data. The Dean formula selects parameters accounting for wave dynamics and sediment factors, thus reflecting the relationship between wave dynamics and sediment settlement to a certain extent, resulting in better applicability. However, while considering a comprehensive range of factors, including wave height, period, beach slope, and sediment settlement, the HK formula overly emphasizes beach slope, potentially leading to an inadequate characterization of the relationships between these influences, thus demonstrating poorer applicability in this study area. Similarly, the SH formula considers factors such as wave height, wavelength, beach slope, and sediment grain size, featuring a complex structure with numerous input parameters. However, it does not account for the influence of wave period and employs a different approach to considering sediment factors compared to the HK formula. Contrastingly, the Ah formula embodies the combined effect of wave and sediment incipient motion, quantifying the influence of sediment grain size based on critical initiation shear stress. This method is particularly suitable for characterizing bed load transport caused by non-breaking wave bottom shear stress (Wang et al., 2023). It is noteworthy that the formulation of each parameter’s participation in formulas with the same parameters selected can also influence the applicability of the formulas. The P formula shares parameter selection and a similar expression form with the Dean formula but adjusts only the exponent of each parameter. However, the applicability of the P formula is lower than that of the Dean formula and exhibits the lowest applicability rate in the present study area.
4.2 Influence of beach environmental factors on the applicability of discriminant indexes
The beach profile constantly changes its morphology under the joint action of construction and destructive stress. When the beach profile adapts to the stable hydrodynamic properties and sediment characteristics, its morphology tends to stabilize; that is, the so-called equilibrium profile is formed, and the morphology of the beach profile is a concentration of the wave characteristics and sediment movement (Li and Chen, 2002). Nordstrom (1977) and Gao et al. (2023) also pointed out that wave steepness, sediment movement, and wind direction significantly influence the beach profile’s response. The five discriminant indexes were all validated by wave tank experiments or other data sets (Dean, 1973; Ahrens and Hands, 1998; Hattori and Kawamata, 1980; Ahrens and Hands, 1998; Dalrymple, 1992). By observing these data, it was noted that the ranges or mean values of wave height, wave period, and sediment grain size differed somewhat from those observed in the present study area (Dong, 1981; Iwagaki and Noda, 1962; Rector, 1954; Hashimoto and Uda, 1979; Raman and Earattupuzha, 1972; Watts, 1954; Eagleson et al., 1963; Horikawa et al., 1973; Monroe, 1969; Kraus et al., 1991; Larson and Kraus, 1989; Kraus and Mason, 1991). This disparity likely contributed to the low performance of the discriminant indices in the present study area. For example, in most of the data selected for Dean formula, the wave height is concentrated in 0.0121–0.354 m, the wave period is concentrated in 0.92–3.58 s, and the maximum value of sediment grain size reaches 0.93 mm (Dong, 1981; Iwagaki and Noda, 1962; Rector, 1954), which is smaller in wave height, shorter in wave period, and larger in span of sediment grain size than the data in this study area.
4.2.1 Influence of waves and sediment grain size
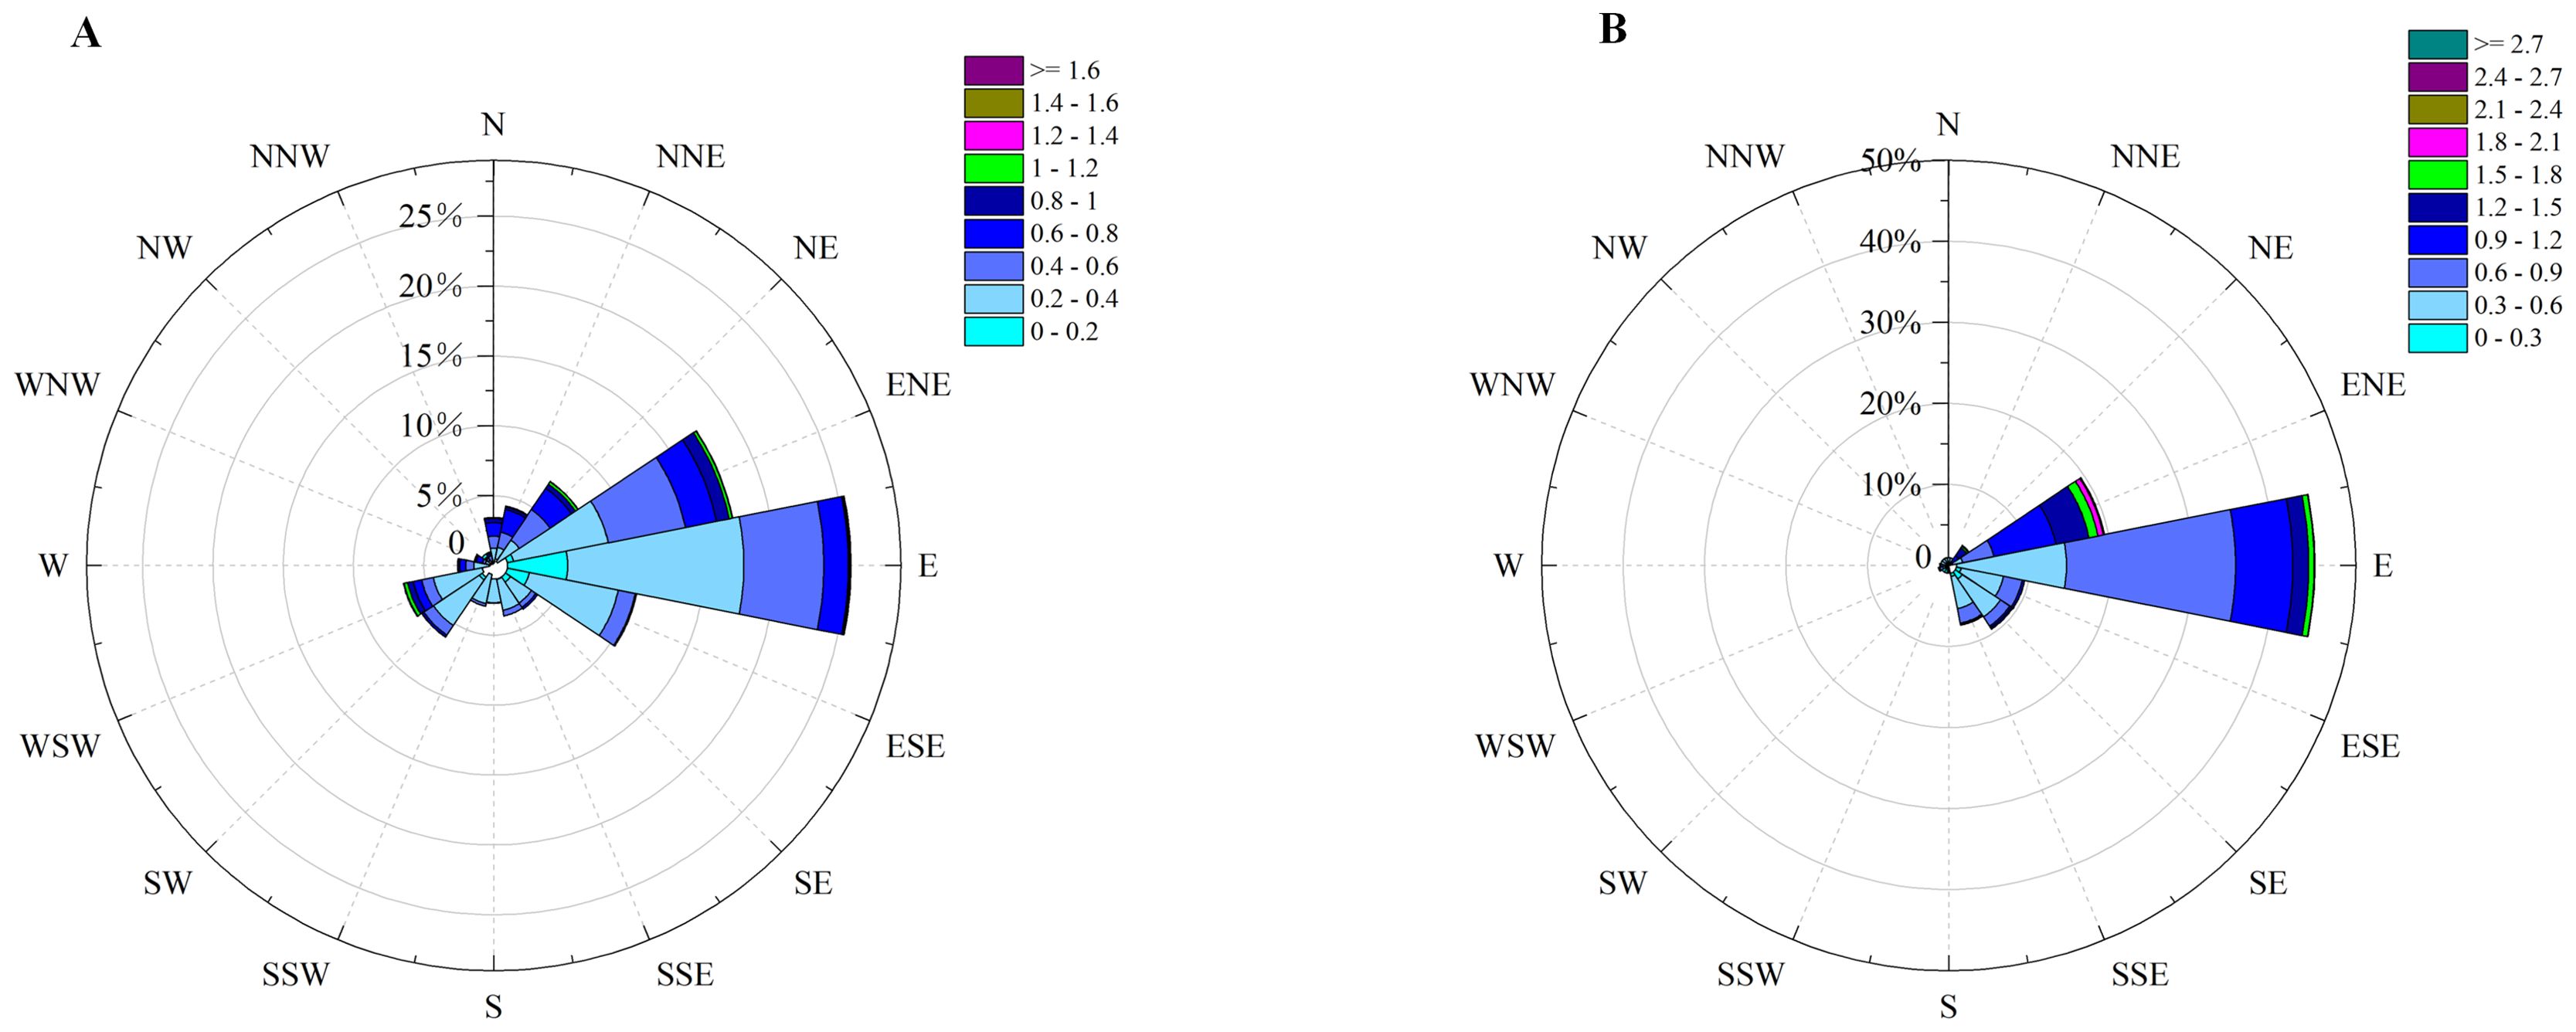
The different environmental factors on both sides of the strait are mainly reflected in the influence of wave dynamics, sediment grain size, wind direction, and other factors in the equation. First of all, the wave environments on the north and south coasts are different. The waves in the Qiongzhou Strait are mainly eastward. The incoming waves from the east side of the Qiongzhou Strait are controlled by the headland, which cuts down the wave intensity. The wave intensity has been reduced when reaching the beaches in the study area, while the beaches on the north coast suffer from the incoming eastward waves from the Qiongzhou Strait in addition to the westward waves from Beibu Gulf, which further weakened the wave intensity (Zhu et al., 2019; Zhu and Li, 2019). As shown in Figure 4, the wave intensity on the south coast is overall higher than that on the north coast, and when the waves are stronger, breaking is more likely to occur, which can produce an undertow, leading to offshore sediment transport. In general, the wave height on the north coast is smaller, concentrating on 0.2–0.5 m, and the wave period is shorter, concentrating on 2–4 s. The wave height on the south coast is higher than that on the north coast, and the wave period is shorter than that on the south coast.
Secondly, the sediment grain sizes differ between the north and south coasts. The south coast beaches have larger sediment grain sizes than the north coast beaches, with the sediment grain size on the south coast mainly concentrated in the 0.2–0.3 mm range. Contrastingly, the sediment grain size on the north coast beaches is primarily concentrated in the 0.1–0.2 mm range. Additionally, the grain sizes of the data sets used for calibrating the five discriminant indices are generally large, as illustrated in Figure 5. Specifically, out of the 32 data points for the P formula (Dalrymple, 1992; Larson and Kraus, 1989), 18 have sediment grain sizes centered around 0.22–0.27 mm, while 14 have grain sizes centered around 0.4–0.47 mm. This disparity in sediment grain sizes also impacts the applicability of the discriminant index.
4.2.2 Influence of “headland effect”
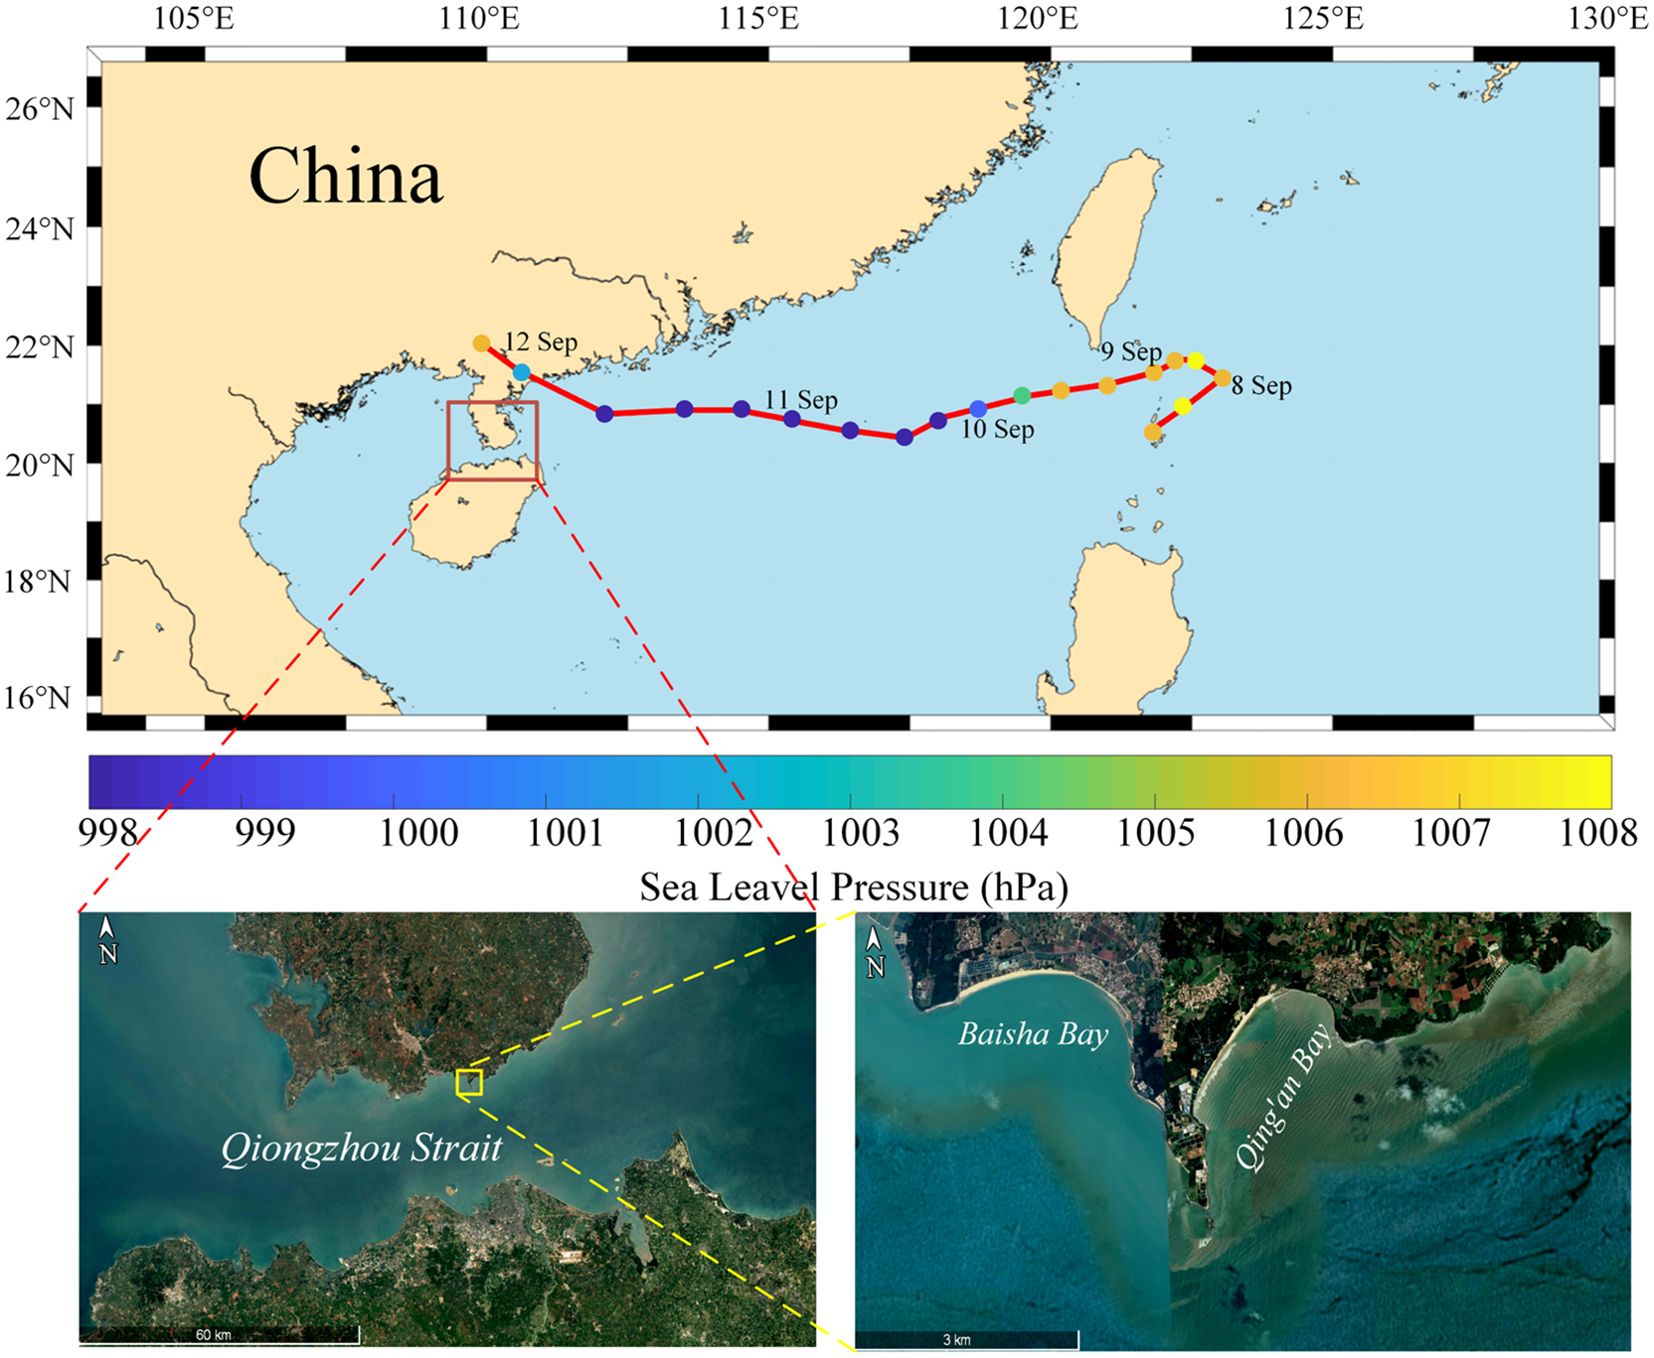
The erosion and accretion patterns along the northern coast of the Qiongzhou Strait vary across different sections of the same beach, influenced by factors such as typhoons, headlands, and the orientation of bay entrances (Zhu and Li, 2019; Zeng et al., 2021). Qing’an Bay and Baisha Bay, situated on adjacent headland bay arc-shaped beaches less than 2 km apart, share median grain sizes ranging between 0.1 mm and 0.2 mm and exhibit similar yearly trends in change. However, their applicability differs. The Dean formula demonstrates a higher applicability rate in Qing’an Bay (72.7%), indicating a better response to the erosion and accretion conditions in the area. Conversely, the applicability rate in Baisha Bay (33.3%) is lower, potentially influenced by headland shelter. As depicted in Figure 6 shows, Typhoon 1823 (Barijat) occurred from east to west, and Qing’an Bay on the eastern side experienced direct exposure to eastward incoming winds and waves, resulting in severe beachface erosion due to the cyclonic wind field. Contrarily, Baisha Bay, sheltered by a sandy headland, experienced less severe erosion. The headland acted as a barrier, blocking most waves and dissipating wave energy through diffraction before reaching the bay entrance profile (Zhu and Li, 2019). Consequently, Baisha Bay experienced milder erosion than Qing’an Bay. Furthermore, beaches sheltered by headlands exhibit significant differences in beach processes compared to open or semi-open beaches, influenced by topographic control (Eliot and Clarke, 1986; Shenoi et al., 1987; Hegge et al., 1996; Burvingt et al., 2017). Contrastingly, beaches along the south coast of the strait are relatively open, experiencing less severe sheltering effects from headlands than those on the north coast.
4.2.3 Influence of fetch-limited environments
On the north coast of the Qiongzhou Strait, southward winds act as onshore winds, while northward winds serve as offshore winds, significantly impacting the north coast. Additionally, both sides of the strait are sheltered by land areas, restricting wind speed and its range over the sea surface—a characteristic feature of fetch-limited beaches (Wang et al., 2006; Nordstrom and Jackson, 2012). Previous studies have highlighted significant differences in the morphodynamic processes between fetch-limited beaches and those in open seas (Nordstrom and Jackson, 2012; French and Burningham, 2011; Jimenez et al., 2009; Jacob et al., 2009; Freire et al., 2009; Oliveira and Vargas, 2009; Silveira and Psuty, 2009). Local wind fields in fetch-limited beaches often induce substantial sediment transport along the coast (Nordstrom and Jackson, 2012; French and Burningham, 2011). During spring and summer, prevailing southeast and southwest winds dominate the Qiongzhou Strait. Although the beaches on the north coast face southward, the greater sheltering effect of the headlands compared to the south coast constrains wind speed and blowing range to a greater extent. Consequently, beaches along the north coast are more affected by fetch-limited environments during spring and summer. This leads to reduced cross-shore sediment transport and less variability in beach profiles during these seasons, thereby reducing the applicability of discriminant indices.
4.3 Discriminant index threshold optimization
By exploring the applicability of the five discriminant indexes, it was found that they have some limitations in this study area. However, the physical relationships between different parameters reflected by the discriminant indexes still apply in this study area (Jackson, 1999; Rojals Mainar, 2016). For this situation, it is necessary to re-calibrate the empirical coefficients of the discriminant index. Increasing the threshold value to some extent can improve the applicability of the formula. The threshold optimization of five discriminant indexes was carried out based on a large amount of field measurement data. Firstly, the discriminant formula was deformed and transformed into a “unitary function,” and the corresponding parameters were set as x and y. As in the Dean formula, let , , and the threshold . In this case, the slope of the straight line represents the threshold value of the discriminant formula, and the points above the line represent erosion, and the points below the line represent accretion. Then, using the graphical method, the number of scatter points above and below the straight line was counted, and the threshold with the highest applicability rate was found. The optimized thresholds enable the accuracy of the discriminant index to be improved, in which the optimized thresholds of the HK formula, SH formula, and P formula were 0.92, 26.8, and 53,768, respectively. The applicability rate was improved by 5.5%, 4.4%, and 10.0%, respectively, whereas the applicability of the Ah formula and Dean formula itself is relatively good, so the optimized improvement rate was not obvious.
5 Conclusions
In this study, we investigate 11 profiles from eight beaches along the north and south coasts of the Qiongzhou Strait. We utilize 222 sets of profile and wave data, as well as 297 surface sediment samples collected between 2018 and 2021 to assess the applicability of five representative erosion and accretion discriminant indices. Our aim is to explore the effectiveness of these indices in these beach environments and optimize their thresholds accordingly. The main conclusions drawn from our analysis are as follows:
1. On the beaches on both sides of the Qiongzhou Strait, the overall change in annual erosion and accretion is not large, ranging from -41.70 –20.17 m3; between different seasons during the year, the change in the volumes of unit width is more drastic due to the combined effects of monsoons, waves, currents, and other environmental factors.
2. The five discriminant indexes have some limitations when applied in this study area, and careful consideration should be made when using these discriminant indexes in the headland bay arc-shaped beach with fetch-limited environments similar to the Qiongzhou Strait. Specifically, the Ah formula has the best applicability, followed by the Dean formula, and the worst applicability is the P formula; the applicability of each discriminant index is better in the north coast than that of the south coast, and the applicability in the autumn and winter is higher than that in the spring and summer.
3. The applicability of the discriminant index reflects the response relationship between wave dynamics, sediment grain size, and beach morphology. The selection of parameters and the contribution of each parameter in the formula affect the applicability of the formula, and the two-parameter formula is better than the three-parameter formula in this study area.
4. In addition to the influence of the parameters of the discriminant index affecting its applicability, environmental factors of the beach can also play a significant role. When applying the discriminant index to headland beaches, the effects of headland shelter must be considered. Furthermore, the applicability of the discriminant index is influenced by fetch-limited environments.
5. Increasing the threshold value to some extent can improve the formula’s applicability. The threshold optimization of the discriminant index was carried out, and the optimization improved the applicability rates of HK, SH, and P formulas by 5.5%, 4.4%, and 10.0%, respectively, providing theoretical support for applying the erosion and accretion discriminant index in China beaches.
Data availability statement
The original contributions presented in the study are included in the article/supplementary material. Further inquiries can be directed to the corresponding author.
Author contributions
LL: Conceptualization, Data curation, Formal analysis, Investigation, Methodology, Validation, Visualization, Writing – original draft. YS: Conceptualization, Investigation, Methodology, Project administration, Writing – review & editing. RL: Investigation, Writing – review & editing. XW: Investigation, Writing – review & editing. ZL: Conceptualization, Data curation, Formal analysis, Funding acquisition, Investigation, Methodology, Project administration, Resources, Supervision, Writing – review & editing.
Funding
The author(s) declare financial support was received for the research, authorship, and/or publication of this article. This work was supported by the National Natural Science Foundation of China (No. 42176167); the Guangdong Basic and Applied Basic Research Foundation (No. 2024A1515011427).
Acknowledgments
We would like to thank other students and teachers in the group for their contributions to the collection of data. We would like to thank wave data from “European Centre for Medium-Range Weather Forecasts dataset”.
Conflict of interest
The authors declare that the research was conducted in the absence of any commercial or financial relationships that could be construed as a potential conflict of interest.
Publisher’s note
All claims expressed in this article are solely those of the authors and do not necessarily represent those of their affiliated organizations, or those of the publisher, the editors and the reviewers. Any product that may be evaluated in this article, or claim that may be made by its manufacturer, is not guaranteed or endorsed by the publisher.
References
Ahrens J. P., Hands E. B. (1999). Parameterizing beach erosion/accretion conditions. Proceedings of the 26th International Conference on Coastal Engineering. 1, 22–26. doi: 10.1061/9780784404119.179
Burvingt O., Masselink G., Russell P., Scott T. (2017). Classification of beach response to extreme storms. Geomorphology. 295, 722–737. doi: 10.1016/j.geomorph.2017.07.022
Dalrymple R. A. (1992). Prediction of storm/normal beach profiles. J. Waterw. Port Coast. Ocean Eng. 118, 193–200. doi: 10.1061/(ASCE)0733-950X(1992)118:2(193
Dean R. G. (1973). "Heuristic models of sand transport in the surf zone," in Proceedings of the Conference on Engineering Dynamics in the Surf Zone. 208–214.
Dong F. (1981). Exploration of discriminant indexes for sandy coast erosion and accretion. J. Sediment Res. 2, 52–59. doi: 10.16239/j.cnki.0468-155x.1981.02.005
Eagleson P. S., Glenne B., Dracup J. A. (1963). Equilibrium characteristics of sand beaches. J. Hydraul. Eng. 89, 35–57. doi: 10.1061/jyceaj.0000841
Eliot I. G., Clarke D. J. (1986). Minor storm impact on the beachface of a sheltered sandy beach. Mar. Geology. 73, 61–83. doi: 10.1016/0025-3227(86)90111-8
Ferguson R. I., Church M. (2004). A simple universal equation for grain settling velocity. J. Sedimentary Geology. 74, 933–937. doi: 10.1306/051204740933
Freire P., Ferreira Ó., Taborda R., Oliveira F. S. B. F., Carrasco A. R., Silva A., et al. (2009). Morphodynamics of fetch-limited beaches in contrasting environments. J. Coast. Res. 56, 183–187. doi: 10.2307/25737562
French J. R., Burningham H. (2011). Coastal geomorphology. Prog. Phys. Geography. 35, 535–545. doi: 10.1177/0309133311414606
Friedman G. M. (1962). Comparison of moment measures for sieving and thin-section data in sedimentary petrological studies. J. Sedimentary Res. 32, 15–25. doi: 10.1306/74D70C36-2B21-11D7-8648000102C1865D
Fu G., Song Y., Yuan K., Wang Z., Fu K. (2022). A study on the erosion and siltation evolution of the neighboring coast caused by the enclosure of Boao Coral island. Mar. Environ. Sci. 41, 174–179. doi: 10.13634/j.cnki.mes.2022.02.016
Gao S., Jia J., Yu Q. (2023). Theoretical framework for coastal accretion-erosion analysis: material budgeting, profile morphology, shoreline change. Mar. Geology Quaternary Geology 43, 1–17. doi: 10.16562/j.cnki.0256-1492.2023021501
Hamza W., Tomasicchio G. R., Ligorio F., Lusito L., Francone A. (2019). A nourishment performance index for beach erosion/accretion at Saadiyat Island in Abu Dhabi. J. Mar. Sci. Engineering. 7, 173. doi: 10.3390/jmse7060173
Hashimoto H., Uda T. A. (1979). Analysis of beach profile changes at Ajigaura by empirical eigenfunctions. Coast. Eng. Japan. 22, 47–57. doi: 10.1080/05785634.1979.11924282
Hattori M., Kawamata R. (1980). Onshore-offshore transport and beach profile change. Coast. Eng. Proc., 1175–1193. doi: 10.1061/9780872622647.072
Hegge B., Eliot I., Hsu J. (1996). Sheltered sandy beaches of southwestern Australia. J. Coast. Res. 12, 748–760. doi: 10.1144/SP346.3
Horikawa K., Sunamura T., Kitoh H. (1973). "A study of beach transformation by wave action," in Proceedings of the 20th Japanese Conference on Coastal Engineering. 357–363.
Hu T. (2022). Study on multi-scale morphodynamic characteristics of sandy coasts along the Qiongzhou Strait (Guangdong, China: Guangdong Ocean University).
Iwagaki Y., Noda H. (1962). Laboratory study of scale effects in two-dimensional beach processes. Coast. Eng. Proc. 1, 194–210. doi: 10.9753/icce.v8.14
Jackson N. L. (1999). Evaluation of criteria for predicting erosion and accretion on an estuarine sand beach, Delaware Bay, New Jersey. Estuaries. 22, 215–223. doi: 10.2307/1352978
Jacob J., Gama C., Salgado R., Liu J. T., Silva A. (2009). Shadowing effects on beach morphodynamics during storm events on Tróia-Sines embayed coast, southwest Portugal. J. Coast. Res. 56, 73–77. doi: 10.2307/25737540
Jimenez J. A., Ciavola P., Balouin Y., Armaroli C., Bosom E., Gervais M. (2009). Geomorphic coastal vulnerability to storms in microtidal fetch-limited environments: application to NW Mediterranean & N Adriatic Seas. J. Coast. Res. 56, 1641–1645. doi: 10.2307/25738068
Johnson J. W. (1949). Scale effects in hydraulic models involving wave motion. Eos Trans. Am. Geophysical Union. 30, 517–525. doi: 10.1029/TR030i004p00517
Kraus N. C., Larson M., Kriebel D. L. (1991). Evaluation of beach erosion and accretion predictors. In Coastal Sediments’91. American Society of Civil Engineers., 572–587.
Kraus N. C., Mason J. M. (1991). Data from : Field data set for testing beach erosion and accretion predictive criteria. Memorandum for Record.
Kriebel D. L., Dally W. R., Dean R. G. (1986). Undistorted Froude model for surf zone sediment transport. Coast. Eng. Proc. 1, 1296–1310. doi: 10.1061/9780872626003.095
Larson M., Kraus N. C. (1989). Data from: SBEACH: Numerical model for simulating storm-induced beach change (Technical Memorandum 41. U.S. Army Corps of Engineers).
Li Z., Chen Z. (2002). Progress in the studies on beach profile shapes. Mar. Sci. Bull. 21, 82–89. doi: 10.3969/j.issn.1001-6392.2002.05.012
Liu M., Zheng X., Han L., Lin D., Luo Y., Fang H., et al. (2007). The status, reasons and countermeasures for the coastal erosion of the important coasts in the South China Sea. Mar. Sci. Bull. 26, 80–84. doi: 10.3969/j.issn.1001-6392.2007.04.011
Mendoza E. T., Jiménez J. A. (2006). "A storm classification based on the beach erosion potential in the Catalonian Coast," in Proceedings of the fifth International Conference on Coastal Dynamics, 1–11. doi: 10.1061/40855(214)98
Monroe F. F. (1969). Oolitic aragonite and quartz sand: laboratory comparison under wave action (Washington: U.S. Army Coastal Engineering Research Center).
Nordstrom K. F. (1977). Bayside beach dynamics: implications for simulation modeling on eroding sheltered tidal beaches. Mar. Geology. 25, 333–342. doi: 10.1016/0025-3227(77)90061-5
Nordstrom K. F., Jackson N. L. (2012). Physical processes and landforms on beaches in short fetch environments in estuaries, small lakes and reservoirs: a review. Earth-Science Rev. 111, 232–247. doi: 10.1016/j.earscirev.2011.12.004
Oliveira F. S. B. F., Vargas C. I. C. (2009). Dynamics of a fetch-limited beach: A numerical modelling based analysis. J. Coast. Res. 56, 193–197. doi: 10.2307/25737564
Pantusa D., D’Alessandro F., Frega F., Francone A., Tomasicchio G. R. (2022). Improvement of a coastal vulnerability index and its application along the Calabria Coastline, Italy. Sci. Rep. 12, 21959. doi: 10.1038/s41598-022-26374-w
Raman H., Earattupuzha J. J. (1972). Equilibrium conditions in beach wave interaction. In Proceedings of the 13th International Conference on Coastal Engineering, 1237–1256. doi: 10.1061/9780872620490.069
Rector R. L. (1954). Laboratory study of equilibrium profiles of beaches (Mississippi: Technical Memorandum 41. U.S. Army Corps of Engineers).
Rojals Mainar A. (2016). Beach recovery capacity along Catalan Beaches (Barcelona, Spanish: Universitat Politècnica de Catalunya).
Scott T., Austin M., Masselink G., Russell P. (2016). Dynamics of rip currents associated with groynes—field measurements, modelling and implications for beach safety. Coast. Engineering. 107, 53–69. doi: 10.1016/j.coastaleng.2015.09.013
Seymour R. J., Castel D. (1989). “Modeling cross shore transport,” in Nearshore sediment transport (Plenum Press, New York).
Seymour R. J., King D. B. Jr. (1982). Field comparisons of cross-shore transport models. J. Waterway Port Coast. Ocean Division. 108, 163–179. doi: 10.1061/JWPCDX.0000291
Shenoi S. S. C., Murty C. S., Veerayya M. (1987). Monsoon-induced seasonal variability of sheltered versus exposed beaches along the west coast of India. Mar. geology. 76, 117–130. doi: 10.1016/0025-3227(87)90021-1
Shi H., Cao X., Li Q., Li D., Sun Q. (2021). Evaluating the accuracy of ERA5 wave reanalysis in the water around China. J. Ocean Univ. China. 20, 1–9. doi: 10.1007/s11802-021-4496-7
Silveira T. M., Psuty N. P. (2009). Morphological responses of adjacent shoreline segments on a fetch-restricted estuarine beach. J. Coast. Res. 56, 208–212. doi: 10.2307/25737567
Smith D. C., Herbich J. B., Spence T. W. (1976). Factors influencing equilibrium of a model sand beach (Texas: U.S. Texas A&M University COE Report).
Sunamura T., Horikawa. K. (1974). Two-dimensional beach transformation due to waves. Coast. Eng. Proc. 1, 920–938. doi: 10.9753/icce.v14.53
Swart D. H. (1974). Offshore sediment transport and equilibrium beach profiles (Delft, The Netherlands: Delft University of Technology).
Wang B., Chen S., Gong W., Lin W., Xu Y. (2006). Formation and evolution of the harbor coast of Hainan Island, first ed (Beijing: Ocean Press).
Wang N., Han X., Sun B., Xin W., Zhang C., Chen D. (2023). A review on longshore sediment transport rate formulas in sandy coast. Ocean Eng. 41, 171–186. doi: 10.16483/j.issn.1005-9865.2023.06.016
Watts G. M. (1954). Laboratory study of effect of varying wave periods on beach profiles (Washington: US Beach Erosion Board).
Wright L. D., Short A. D. (1984). Morphodynamic variability of surf zones and beaches: a synthesis. Mar. geology. 56, 93–118. doi: 10.1016/0025-3227(84)90008-2
Xu S., Ma M., Yin K., Tang S. (2020). Risk evaluation system of navigation security based on coupled wind and wave model: a case of study of Qiongzhou strait. IET Intelligent Transport Systems. 14, 1311–1318. doi: 10.1049/iet-its.2019.0418
Xu X. (1988). Types of two-dimension sandy beaches and their criterion. Ocean Eng. 6, 51–62. doi: 10.16483/j.issn.1005-9865.1988.04.007
Zeng C., Hu T., Zhang H., Li Z., Li G., Tian Y. (2021). Wave motion response characteristics of swash zone to typhoon wipha at qing’an bay in Xuwen, Guangdong Province, China. J. Guangdong Ocean Univ. 41, 74–83. doi: 10.3969/j.issn.1673-9159.2021.05.010
Zhong C. (2021). The evolution process and stability analysis of the Yanda beach profile (Shandong, China: Ludong University).
Zhu S., Hu D., Zhang H., Zeng C., Li Z., Li Z. (2019). Analysis of short-term temporal and spatial changes and sedimentary dynamics at the middle section of Haikou Bay Beach. J. Trop. Oceanography 38, 77–85. doi: 10.11978/2018120
Keywords: Qiongzhou Strait, coastal erosion, erosion and accretion discriminant index, applicability evaluation, threshold optimization
Citation: Liu L, Sun Y, Liu R, Wei X and Li Z (2024) Evaluation of the applicability of beach erosion and accretion index in Qiongzhou Strait of China. Front. Mar. Sci. 11:1453439. doi: 10.3389/fmars.2024.1453439
Received: 23 June 2024; Accepted: 24 September 2024;
Published: 23 October 2024.
Edited by:
Achilleas G. Samaras, Democritus University of Thrace, GreeceReviewed by:
Giuseppe Tomasicchio, University of Salento, ItalyHuimei Cao, State Oceanic Administration, China
Copyright © 2024 Liu, Sun, Liu, Wei and Li. This is an open-access article distributed under the terms of the Creative Commons Attribution License (CC BY). The use, distribution or reproduction in other forums is permitted, provided the original author(s) and the copyright owner(s) are credited and that the original publication in this journal is cited, in accordance with accepted academic practice. No use, distribution or reproduction is permitted which does not comply with these terms.
*Correspondence: Zhiqiang Li, cWlhbmd6bDE5NzRAMTYzLmNvbQ==
 Lulu Liu
 Yan Sun
 Run Liu
 Xiaobo Wei
 Zhiqiang Li