- Fisheries Resources Institute (Kushiro Station), Japan Fisheries Research and Education Agency, Kushiro, Japan
Unprecedented catastrophic damage to coastal fisheries attributable to harmful Karenia outbreaks were reported in Pacific coastal shelf waters off the southern coast of Hokkaido from late summer to autumn in 2021. To understand the spatiotemporal variability of the Karenia blooms, we analyzed Sentinel 3-derived abundances of Karenia spp. together with marine environmental variables. Karenia spp. were very widely distributed over a maximum of more than 400 km along the shelf from the easternmost Pacific coast of Hokkaido to Cape Erimo, where there was a nearly stable water-mass front, to the west, where pure subtropical water inhibited the westward expansion of Karenia spp. blooms. The duration of the appearance of Karenia spp. at a fixed point was very long—about 45 days—in the middle part of the shelf. East of the Tokachi River, the time-averaged abundances of Karenia spp. were robustly correlated with the time-averaged alongshore velocity and stability of the Coastal Oyashio, a coastal boundary current; more intense and stable alongshore currents were associated with less developed Karenia spp. blooms. Time-averaged abundances of Karenia spp. were the highest in the middle part of the shelf, west of the Tokachi River, where low-salinity water from the river suppressed the development of the surface winter mixed layer and might have fostered favorable growth conditions and supplied nutrients of land origin. During the period of Karenia spp. blooms, abundances changed rapidly on a small scale (typically, ≤2 days and ≤50 km) in association with physical-biochemical coupled submesoscale variations. Subsampling of these variations of Karenia spp. abundances at 1-day intervals showed that the maxima and center of gravity of Karenia spp. abundances moved slowly westward along the coast at a typical velocity of 4 cm s−1. This velocity was one-third that of the time-averaged alongshore velocity of the Coastal Oyashio. Particle-tracking experiments implied that horizontal advection by the Coastal Oyashio, which supplied Karenia spp. eliminated from the upstream shelf to the downstream shelf, contributed to the long duration of Karenia spp. blooms on the middle part of the shelf.
1 Introduction
Human-induced climate change, including global warming, is already affecting weather and climate extremes in every region across the globe (IPCC [Intergovernmental Panel on Climate Change], 2019). In oceans, there has been a gradual increase in seawater temperature on a timescale of 100 years, but extremely high seawater temperatures persisting for more than 5 days are also frequently observed; these are known as “marine heatwaves” (MHWs) and are recognized as extreme climatic events (Hobday et al., 2016). The number of MHW days per year are increasing globally and are projected to increase under climate change as a consequence of long-term ocean warming (Frölicher and Laufkötter, 2018; Oliver et al., 2018, 2019). In general, basin-scale MHWs have been occurring with increasing frequency since the early 2010s and are altering ecosystems globally, often with profound socioeconomic impacts (Smith et al., 2021). According to Smith et al. (2021), basin-scale MHWs at the mid-latitudes in the Pacific Ocean tend to accompany large-scale harmful algal blooms (HABs), causing devastating damage to marine ecosystems, fisheries, and human well-being (e.g., Ryan et al., 2017; Roberts et al., 2019; Trainer et al., 2019).
Historically intensive and extensive basin-scale MHWs occurred in the northwestern Pacific Ocean including coastal shelf waters off the southeastern Hokkaido coast in summer 2021 (Kuroda and Setou, 2021). In September 2021, about a month after the MHWs subsided, unprecedented large-scale HABs (>300 km long in the alongshore direction) occurred suddenly in the Pacific waters off the southeastern Hokkaido coast (Kuroda et al., 2021a), which had previously seen little serious coastal pollution and had been maintained in a natural, healthy condition. Ocean circulation was not unusual around Pacific coastal shelf waters at the beginning of the 2021 HABs (Kuroda et al., 2021a), except for a stable, persistent front among subtropical and subarctic waters in the downstream area of the HABs (Higashi and Nakada, 2022). The 2021 HABs were particularly concentrated around pathways of subarctic or modified subarctic waters transported by the Coastal Oyashio on the continental shelf and by the Oyashio offshore (Figure 1; Kuroda et al., 2022). In contrast, they were less distributed in pure subtropical waters (Kuroda et al., 2021a). For example, Karenia spp. abundances clearly differed west and east of a water-mass front south of Cape Erimo (Figure 1B), where pure subtropical water was stably distributed west of the front (Figure 1A). The 2021 HAB was composed of Karenia selliformis, Karenia mikimotoi, Karenia longicanalis, and other dinoflagellates (Iwataki et al., 2022). Karenia selliformis is an invasive species that had its first-ever outbreaks in Japanese waters in 2021. Particle-tracking experiments (Kuroda et al., 2021a) and rDNA sequence analysis (Iwataki et al., 2022) suggested that K. selliformis could be transported from the east coast of the Kamchatka Peninsula, which also had unprecedented outbreaks of mainly K. selliformis in autumn 2020 (Orlova et al., 2022).
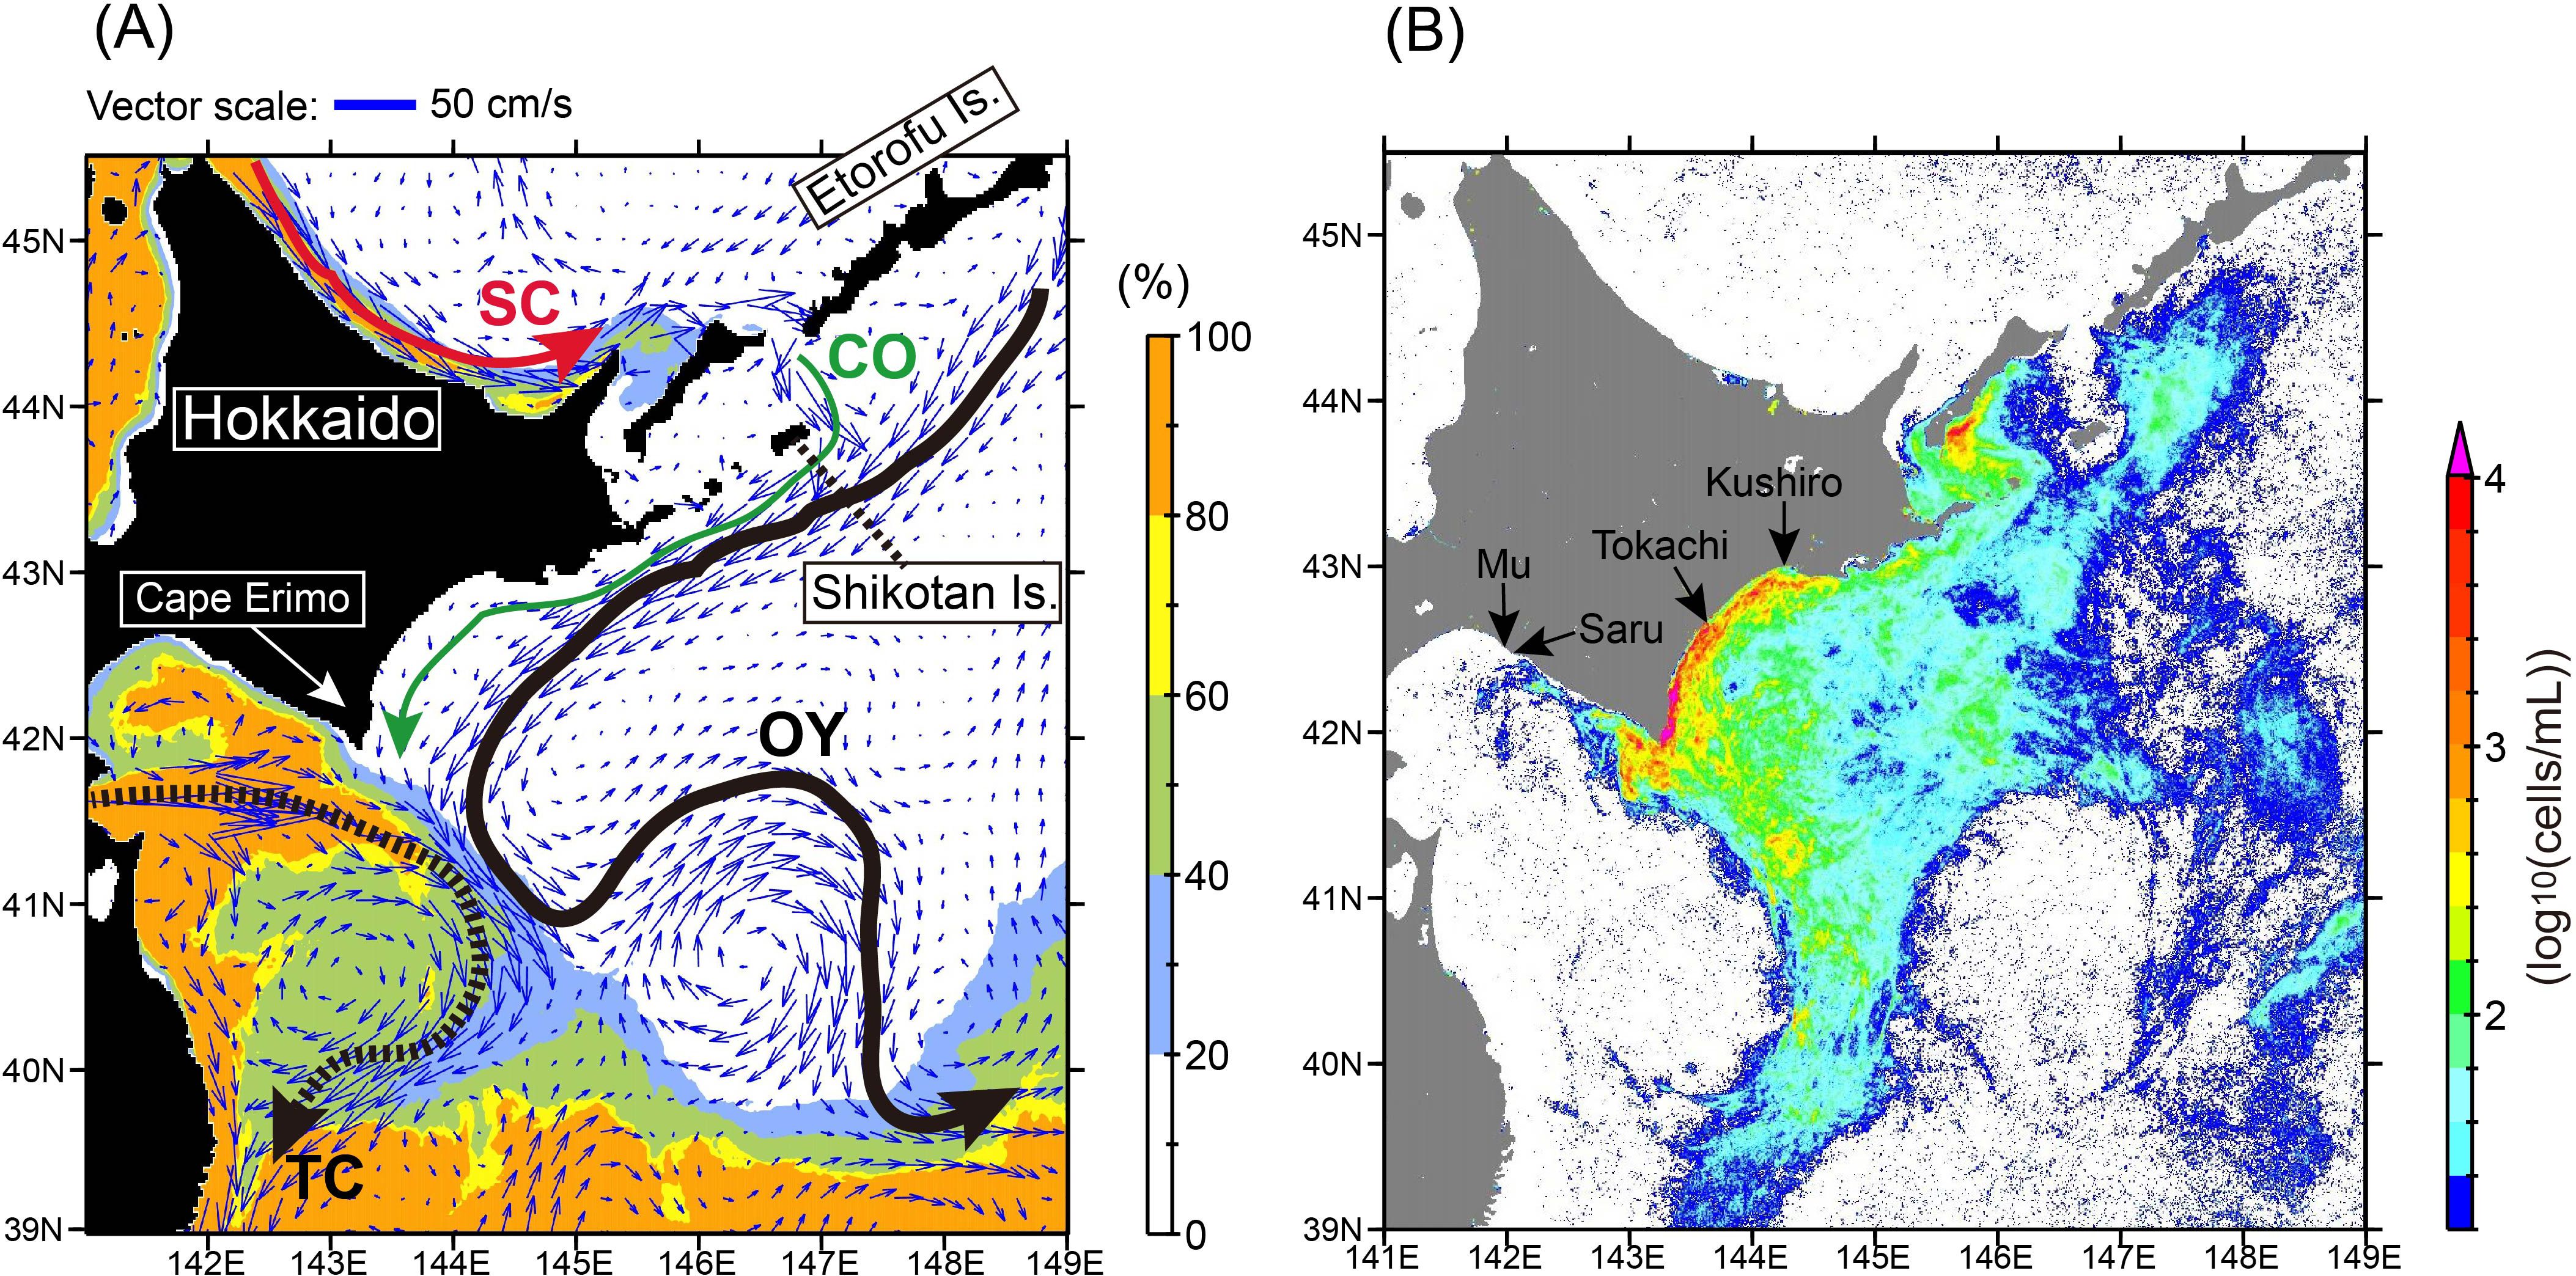
Figure 1. (A) Map of simulated velocity at the sea surface averaged over September–November 2021 (blue arrows). Appearance frequency of high-salinity water (>33.6) at the sea surface is indicated by the background color, as defined in the legend at the right. Schematic representations of ocean currents are depicted by thick arrows. SC, Soya Warm Current; CO, Coastal Oyashio; OY, Oyashio; TC, Tsugaru Warm Current. (B) Map of the 90th percentile of Karenia spp. abundance estimated from the red-band difference (RBD) of Sentinel-3 data from 20 August to 31 December. Locations of the mouths of first-class rivers in Hokkaido that discharge onto the Pacific shelf are denoted by arrows.
According to a hypothesis proposed by Yamaguchi et al. (2022) for development of the 2021 HABs, MHWs were accompanied by intense stratification (Kuroda and Setou, 2021) and depleted nutrients near the sea surface. Near the sea surface, diatoms are dominant in normal years around coastal shelf waters off the southeastern Hokkaido coast (Taniuchi et al., 2023) but coexisted with K. selliformis in summer 2021. These conditions provided an advantage to K. selliformis over diatoms in terms of interspecies competition for nutrients, because K. selliformis can migrate vertically in a day–night cycle and absorb nutrients from the subsurface during nighttime. Moreover, strong vertical mixing during the retreatment process of the MHWs in mid-August (Kuroda and Setou, 2021) entrained nutrient-rich waters to the vicinity of the sea surface from the subsurface, further enhancing the growth of K. selliformis, and triggered the outbreaks.
During and after the 2021 HABs, serious damage to coastal fisheries was reported near the Pacific coast along southeast Hokkaido. As of 16 February 2023, total economic damage to coastal fisheries was estimated to be more than 9 billion JPY (about 59 million USD; exchange rate = 155 JPY/USD), the largest in the recorded history of Japanese fisheries (Hokkaido prefecture, 2023). For instance, near-coast damage included mass die-offs of sea urchins, which are commercially captured about <20 m off the southeast Hokkaido coast; the death of adult chum salmon in fixed nets deployed on the shelf at water depths of 10–50 m; and the death of juvenile fish in rearing facilities. In addition, trawl surveys by the Hokkaido Research Organization (HRO) recorded other deaths at two stations with a water depth of 130 m off the southeast Hokkaido coast (HRO [Hokkaido Research Organization], 2021). Hence, coastal shelf waters with water depths of <130 m could be regarded as areas of potential damage by the 2021 HABs in terms of coastal fisheries.
To date, there has been no study based on quantitative datasets with adequately high resolution that describes the spatiotemporal transition of the 2021 HABs from their initial to final stages or of the properties of their spatiotemporal variability along the Pacific coast of Hokkaido. Such analyses are instructive to appropriately monitor HABs that might occur in future and mitigate their damage.
This study analyzed the abundances of Karenia spp. at the sea surface along the Pacific coast of Hokkaido, as estimated from Sentinel-3A/3B data by using the methods of Kuroda et al. (2022). The aim was to describe the (1) spatiotemporal transition of the 2021 HABs from development to decay, (2) properties of the short-term and small-scale variability of the HABs, and (3) relationships between the HABs and environmental variables. This study points out a westward movement of the center of gravity of the HABs, which is associated with the combined effects of horizontal advection and biogeochemical variability. The roles of the horizontal advection by the Coastal Oyashio were also evaluated by conducting particle-tracking experiments.
2 Materials and methods
2.1 Satellite-derived abundance of Karenia spp.
We estimated the abundance of Karenia spp. at the sea surface from Sentinel-3A/3B data by using the same methods applied by Kuroda et al. (2022). Ocean color imagery based on Sentinel-3A/3B Ocean and Land Color Instrument Level-2 Full Resolution data was downloaded from Copernicus Online Data Access. The horizontal resolution was about 300 m, and the time interval between images was near-daily. Ocean color imagery was bi-linearly interpolated onto 1/400° spherical grids. The data period analyzed was from 20 August to 31 December 2021, which covered the entire period when Karenia spp. were identified near the Pacific coast of Hokkaido (Hasegawa et al., 2022; Miyazono et al., 2023). Sentinel-3 data analyzed in this study were sampled at 23:56–1:16 UTC. During the data period, the time of sunrise changed from 19:32 to 21:52 UTC. According to laboratory experiments and field observations (e.g., Koizumi et al., 1996; Shikata et al., 2016; Shikata, 2017), red-tide flagellates, including K. mikimotoi, migrate upward before sunrise from the subsurface to the vicinity of the water surface. Because the measurement time was 2–5.75 h after sunrise, the Sentinel-3 measurements were anticipated to observe Karenia spp. suspended near the sea surface. In general, the rate of visual light attenuation in water is greatest for red light, the attenuation of which requires that the phytoplankton be in the top ~2 m for the fluorescence to be observed (Xing et al., 2007; Jordan et al., 2021).
We used normalized water-leaving reflectance () for a wavelength band centered at . Two kinds of surface abundances of Karenia spp. were estimated: satellite-derived reflectance-based red band difference (RBD; Jordan et al., 2021) and reflectance-based maximum line height (MLH; Smith and Bernard, 2020). RBD and MLH are defined as follows:
where is defined as
Kuroda et al. (2022) reported bias between the two abundances; the MLH-derived abundances were about twice as high as those derived from RBD, although the spatial patterns of the two abundances were similar. In addition, the two abundance datasets sporadically had erroneous, extremely large values, the spatial distributions of which were clearly different between the two datasets. To remove the erroneous data, the MLH- and RBD-derived abundances were cross-calibrated by using a threshold that was determined by trial and error; for a pair of snapshot images at a specific time, erroneous values were determined and eliminated when an MLH-derived (RBD-derived) value at a grid point exceeded 10 times (5 times) the value of an RBD-derived (MLH-derived) value at the same grid point. The erroneous data of RBD-derived abundances tended to be scattered around the cloud edges, whereas those for MLH-derived abundances tended to be near the coast (Supplementary Figure 1). Because this study focused on Karenia spp. abundances in coastal shelf waters, we analyzed the RBD-derived abundances after removing the erroneous values.
To examine the spatiotemporal variability of Karenia spp. abundances along the Pacific coast of Hokkaido, we defined cross-shelf 20-km-long transects normal to the coastline set at an interval of 1 km in the along-shelf direction (Figure 2). The transects were indexed from 1 (westernmost) to 600 (easternmost), and the RBD-derived abundances were averaged along each transect. The water depth at the southernmost edge of these transects ranges from 73 to 702 m, the average, median, and 25/75 percentiles of which are 181, 114, and 96/172 m, respectively. Therefore, the batch of transects roughly cover a potential damage area by the 2021 HABs associated with water depths of less than 130 m.
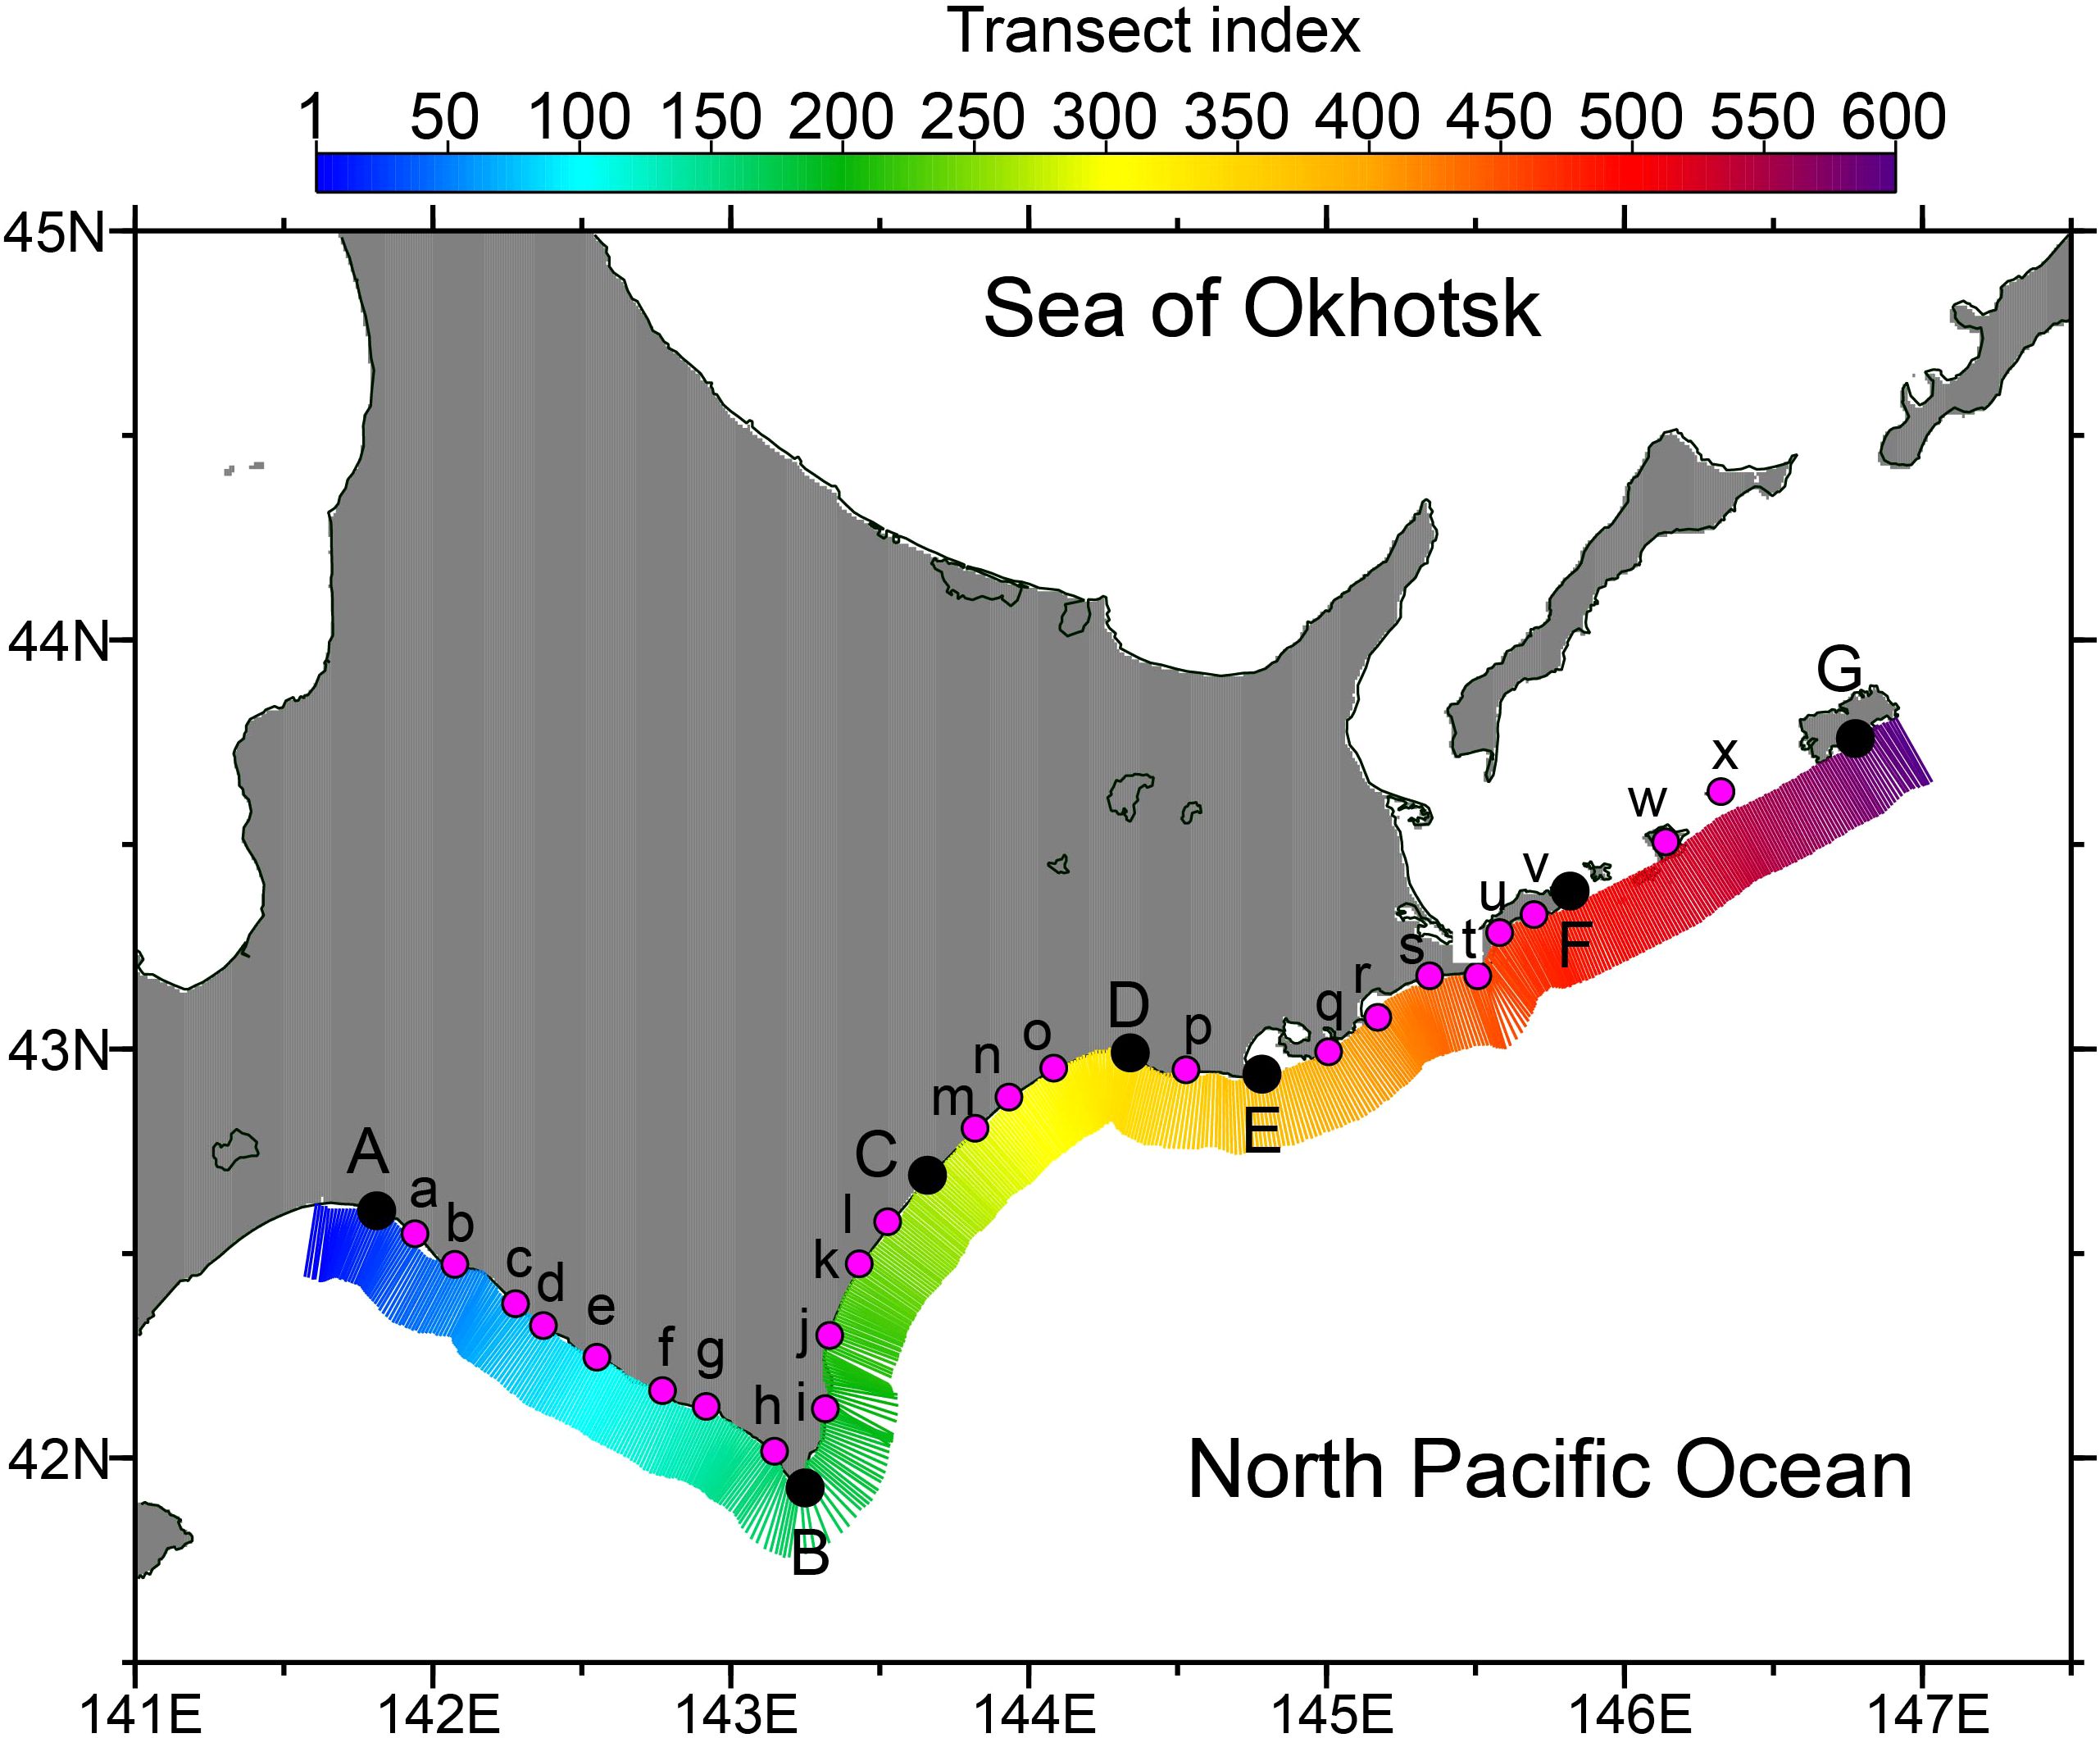
Figure 2. Cross-shelf transects 1–600 over the Pacific shelf south of Hokkaido. Representative locations of the transects at points A–G and a–x are listed in Supplementary Table 1.
Representative sites are indicated by points A–G and a–x in Figure 2. Points A, B, C, D, E, F, and G correspond to Tomakomai Port, Cape Erimo-misaki, the mouth of the Tokachi River, Kushiro Port, Cape Shirepa-misaki, Cape Nossapu-misaki, and Shikotan Island, respectively. Information about points a–x is summarized in Supplementary Table 1.
It should be noted that RBD-derived abundances include uncertainty, as we discussed previously (Kuroda et al., 2022). To avoid incorrectly estimating the presence of Karenia spp., we determined a threshold value that accurately discriminated between the presence and absence of Karenia spp. For this purpose, similar cross-shelf transects were set along the Okhotsk coast of Hokkaido (Supplementary Figure 2A), where Karenia spp. blooms were never reported in autumn 2021. RBD-derived abundances were also averaged along these individual transects in the Sea of Okhotsk. For the averages, the mode of the frequency distribution was 0.4–0.5 log10 (cells mL−1), and 99.96% of the abundances were less than 1.0 log10 (cells mL−1) (Supplementary Figure 2B). Hence, we used the value of 1.0 log10 (cells mL−1) (i.e., 10 cells mL−1) as the threshold to discriminate between the presence and absence of Karenia spp. from RBD-derived abundances.
2.2 Marine environmental variables
We analyzed the outputs of daily means (i.e., temperature, salinity, and current velocity) from a 1/50° ocean model to characterize oceanographic conditions. The model was driven by realistic forcings such as momentum and heat fluxes. Eight major tidal constituents and discharges from all Japanese rivers were also incorporated into the model. In addition, a scale-selective data assimilation method like a spectral nudging was applied to modify mesoscale variations about 50 km away from the coast by using reanalysis products from the 1/10° ocean forecast system “FRA-ROMS” (Kuroda et al., 2017). Most of the configurations of the 1/50° ocean model were identical to those used previously (Kuroda et al., 2021a), and the model domain was expanded from a 1/50° ocean model applied earlier (Kuroda et al., 2021b, c). According to our previous research (Kuroda et al., 2021b, c), the overall structures of oceanographic conditions—particularly temperature, salinity, and current velocity near the surface of Pacific coastal shelf waters off the southeastern coast of Hokkaido—were reasonably well reproduced.
Surface mixed-layer depth was estimated as the depth at which the density in the upper layer exceeded a threshold value of 0.125 kg m−3 relative to the density at the surface, following Kuroda et al. (2021a). Moreover, to evaluate the contribution rate of salinity to the formation of the surface mixed layer, salinity-dependent density change within the mixed layer was calculated as
where is the density of seawater with temperature (T) and salinity (S), and the subscripts 0 and BM denote the sea surface and bottom depth of the surface mixed layer, respectively. Finally, we evaluated the ratio as the contribution rate of salinity to the surface mixed-layer depth.
2.3 Particle-tracking experiments
To examine residual Karenia spp. within shelf waters along the Pacific coast of Hokkaido and the effects of horizontal advection on the spatial distribution of the HABs, offline particle-tracking experiments were performed by using daily mean outputs of the 1/50° ocean models. For the particle-tracking simulations (e.g., Kuroda, 2023), we used the Larval TRANSport (LTRANS) model (North et al., 2008), which is configured for ROMS output, but the source codes were modified to suit our model’s configuration and purpose.
In total, 50,400 particles were initially set evenly spaced at each of three depths (1, 5, and 10 m) below the sea surface along the cross-shelf transects off Hokkaido. Initial conditions were updated daily from 13 September to 12 November 2021, when the HABs occurred. Particles were passively transported at a fixed depth forward in time for 10 days from the initial condition. A small horizontal diffusion constant (5.0 m2 s–1) was assumed. To estimate residual particles and horizontal advection of particles, an area consisting of a group of transects (i.e., 1–30, 31–60, …, 541–570, and 571–600) was referred to as a “segment”, within which the number of particles was counted to estimate the number of residual particles and the horizontal advection of particles.
In this study, “residual particles” means the particles remaining in a segment from the initial conditions. In this estimation, inflow of particles from other segments is not considered. In contrast, the horizontal advection of particles signifies the net number of particles in a segment at a given time as the summation of residual particles, the inflow of particles from other segments into a given segment (positive), and the outflow of particles from that segment (negative).
3 Results
3.1 Transition of Karenia spp. abundance
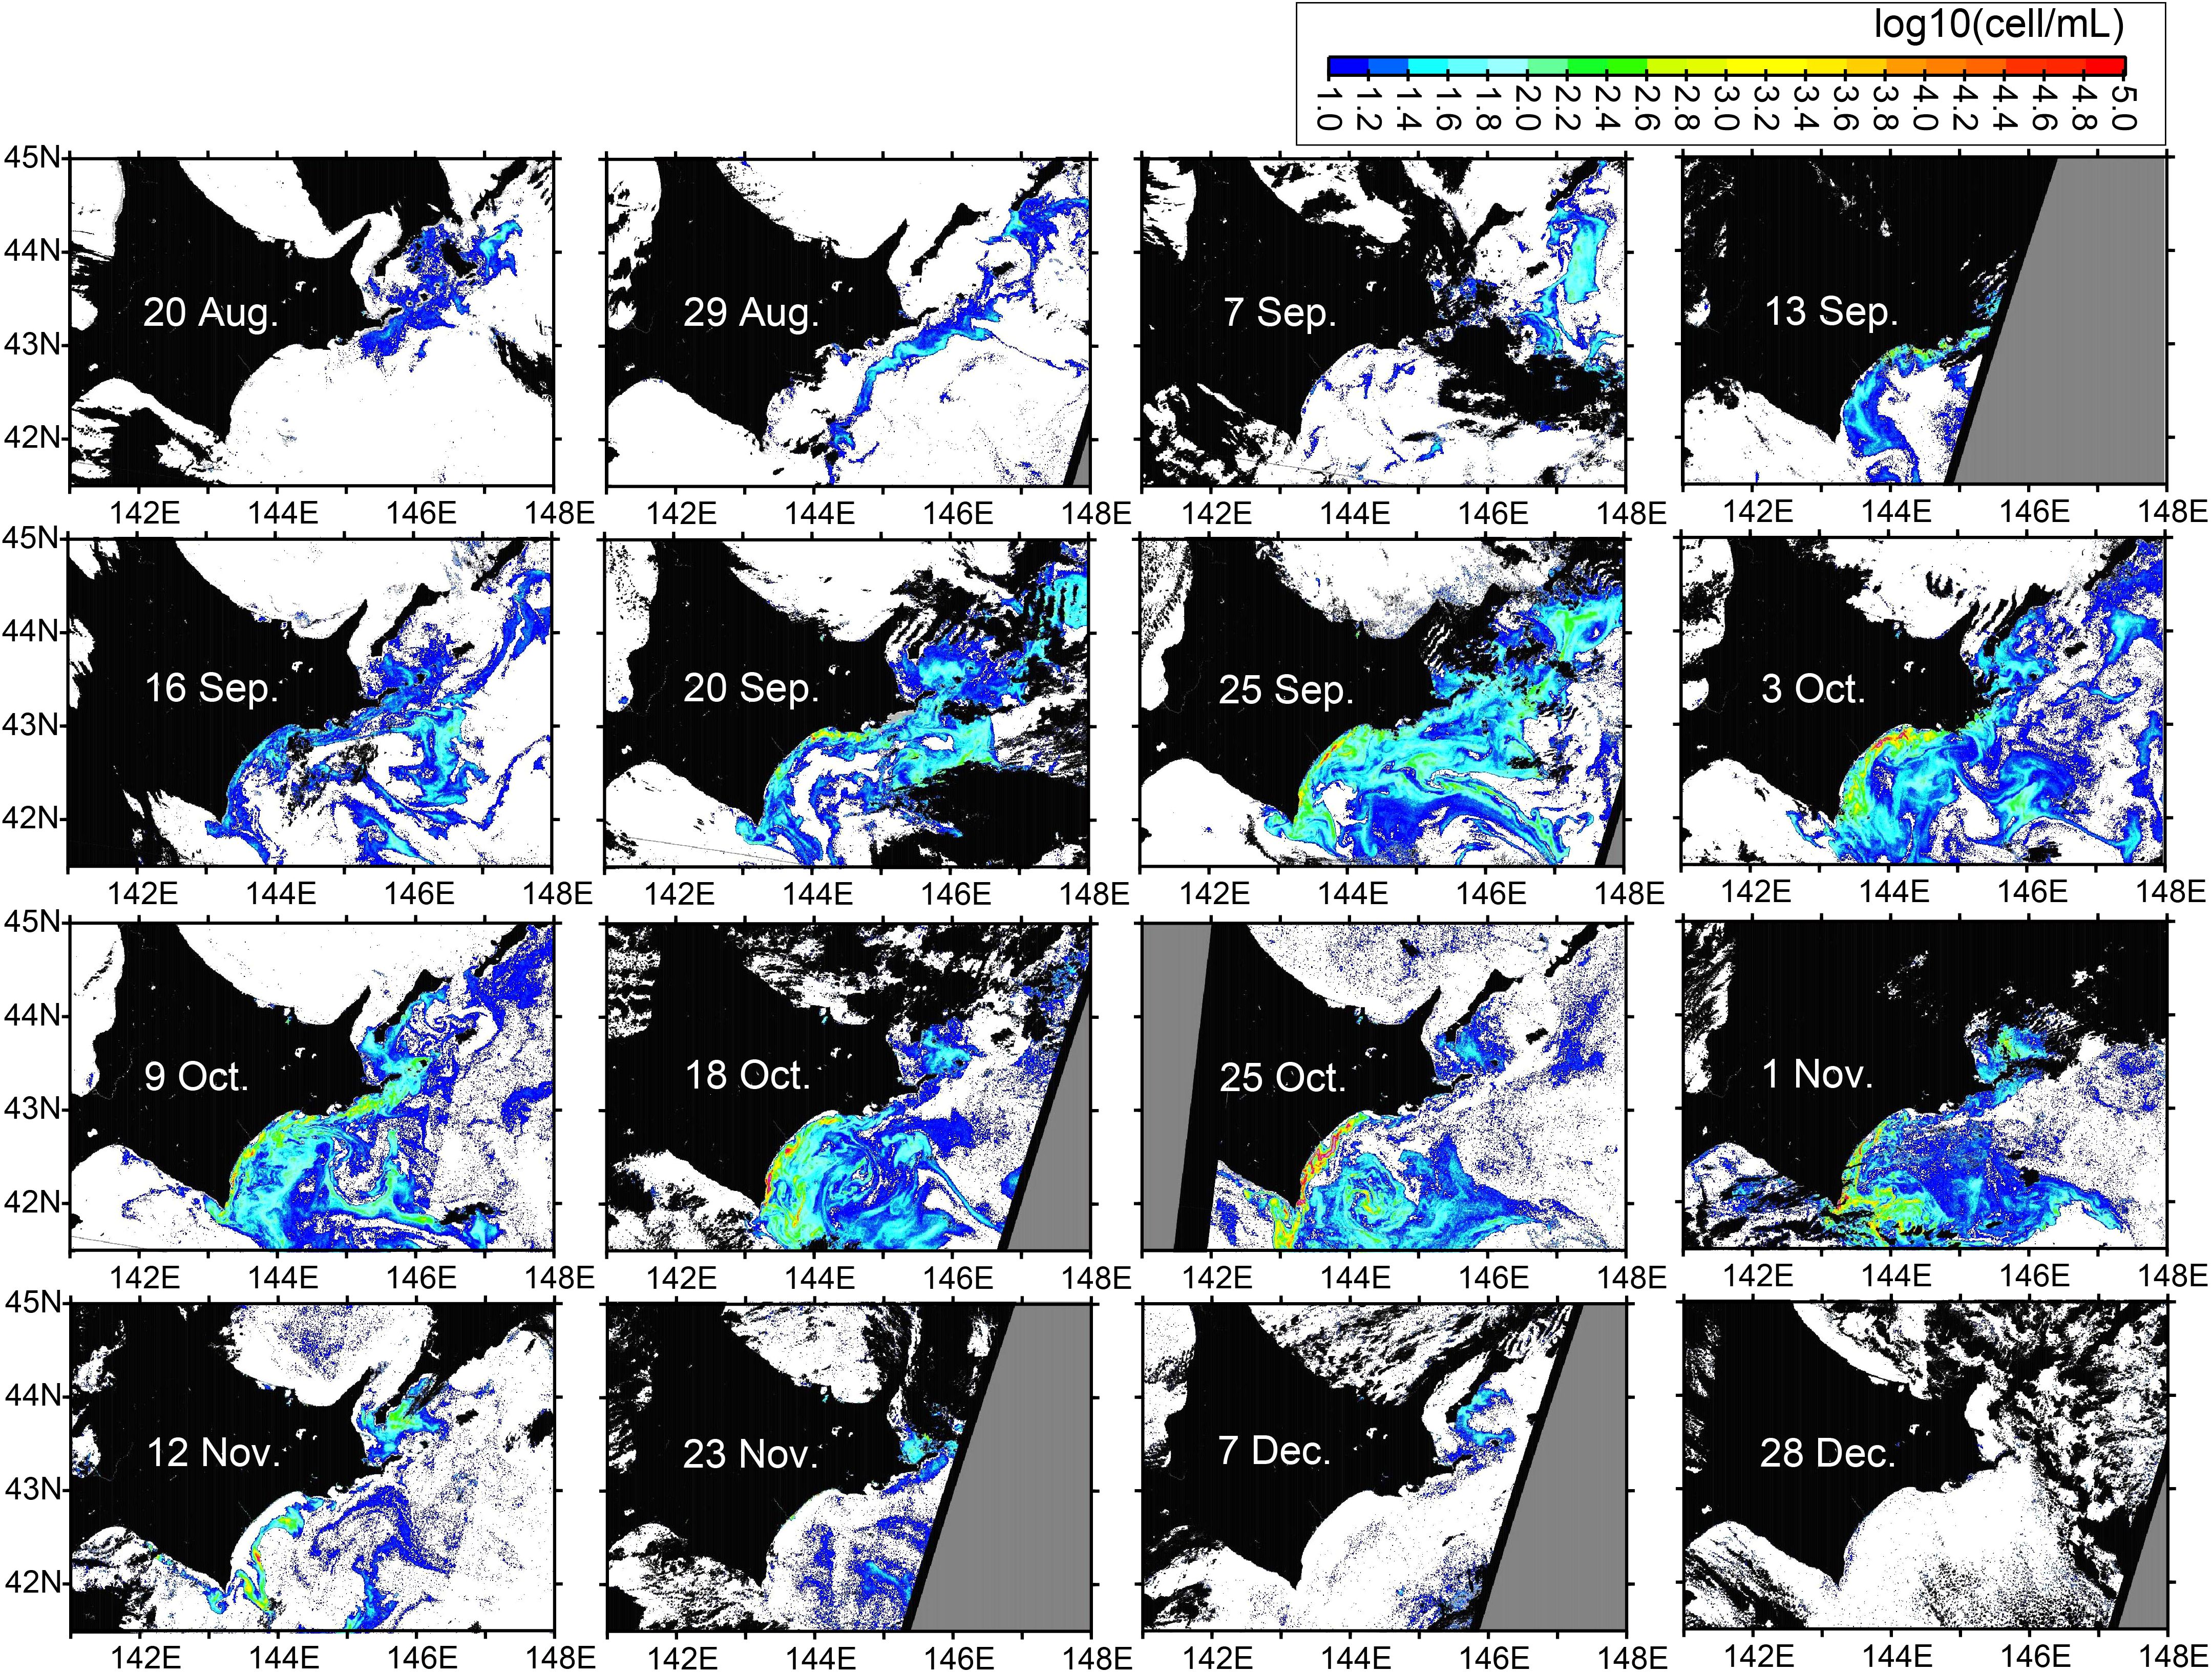
We analyzed images of RBD-derived abundance of Karenia spp., focusing mainly on coastal shelf waters during the study period in 2021 (Figure 3). More extensive images are shown in Supplementary Figure 3 to give a more comprehensive understanding of the overall picture of the 2021 HABs. On 20 August, Karenia spp. began to occur in Pacific shelves to the east of Hokkaido. On 29 August, Karenia spp. were distributed along the shelf-break, just offshore from the southeast Hokkaido coast. On 13 September, Karenia spp. appeared suddenly in the Pacific waters near the entire southeastern coast of Hokkaido. After 20 September, the area of Karenia spp. expanded widely offshore, and Karenia spp. abundances along the southeastern coast of Hokkaido further intensified. The offshore expansion and coastal intensification were maintained until 1 November, after which abundances decreased, particularly near the southeastern coast of Hokkaido. On 12 and 23 November, Karenia spp. remained to the east of Hokkaido and in the offshore areas. Karenia spp. finally disappeared on 28 December.
3.2 Comparison with in-situ measurements
To reconfirm the validity of our datasets, we compared the RBD-derived abundances of Karenia spp. along the Hokkaido coast with the abundances determined in situ. Miyazono et al. (2023) listed in situ maximum abundances of K. selliformis at weekly intervals from 4 October to 26 December 2021 in four sub-prefectural administrative districts (Hidaka, Tokachi, Kushiro, and Nemuro). In our datasets of Karenia spp. along the Pacific coast, the sub-prefectural administrative districts of Hidaka, Tokachi, Kushiro, and Nemuro corresponded to transects 35–189, 190–289, 290–439, and 440–495, respectively (Figure 2). There was a relatively high positive correlation (R2 = 0.59) between the two values (Figure 4), indicating that the RBD-derived abundances were reasonably well estimated. The two values were more consistent at around 102 cells mL−1, but the satellite-derived abundances tended to be overestimated (underestimated) for values greater than (less than) 102 cells mL−1; for 101, 102, 103, and 104 cells mL−1 of satellite-derived abundance, the regression line passed through 101.15, 102.00, 102.86, and 103.71 cells mL−1, respectively, of in situ abundances.
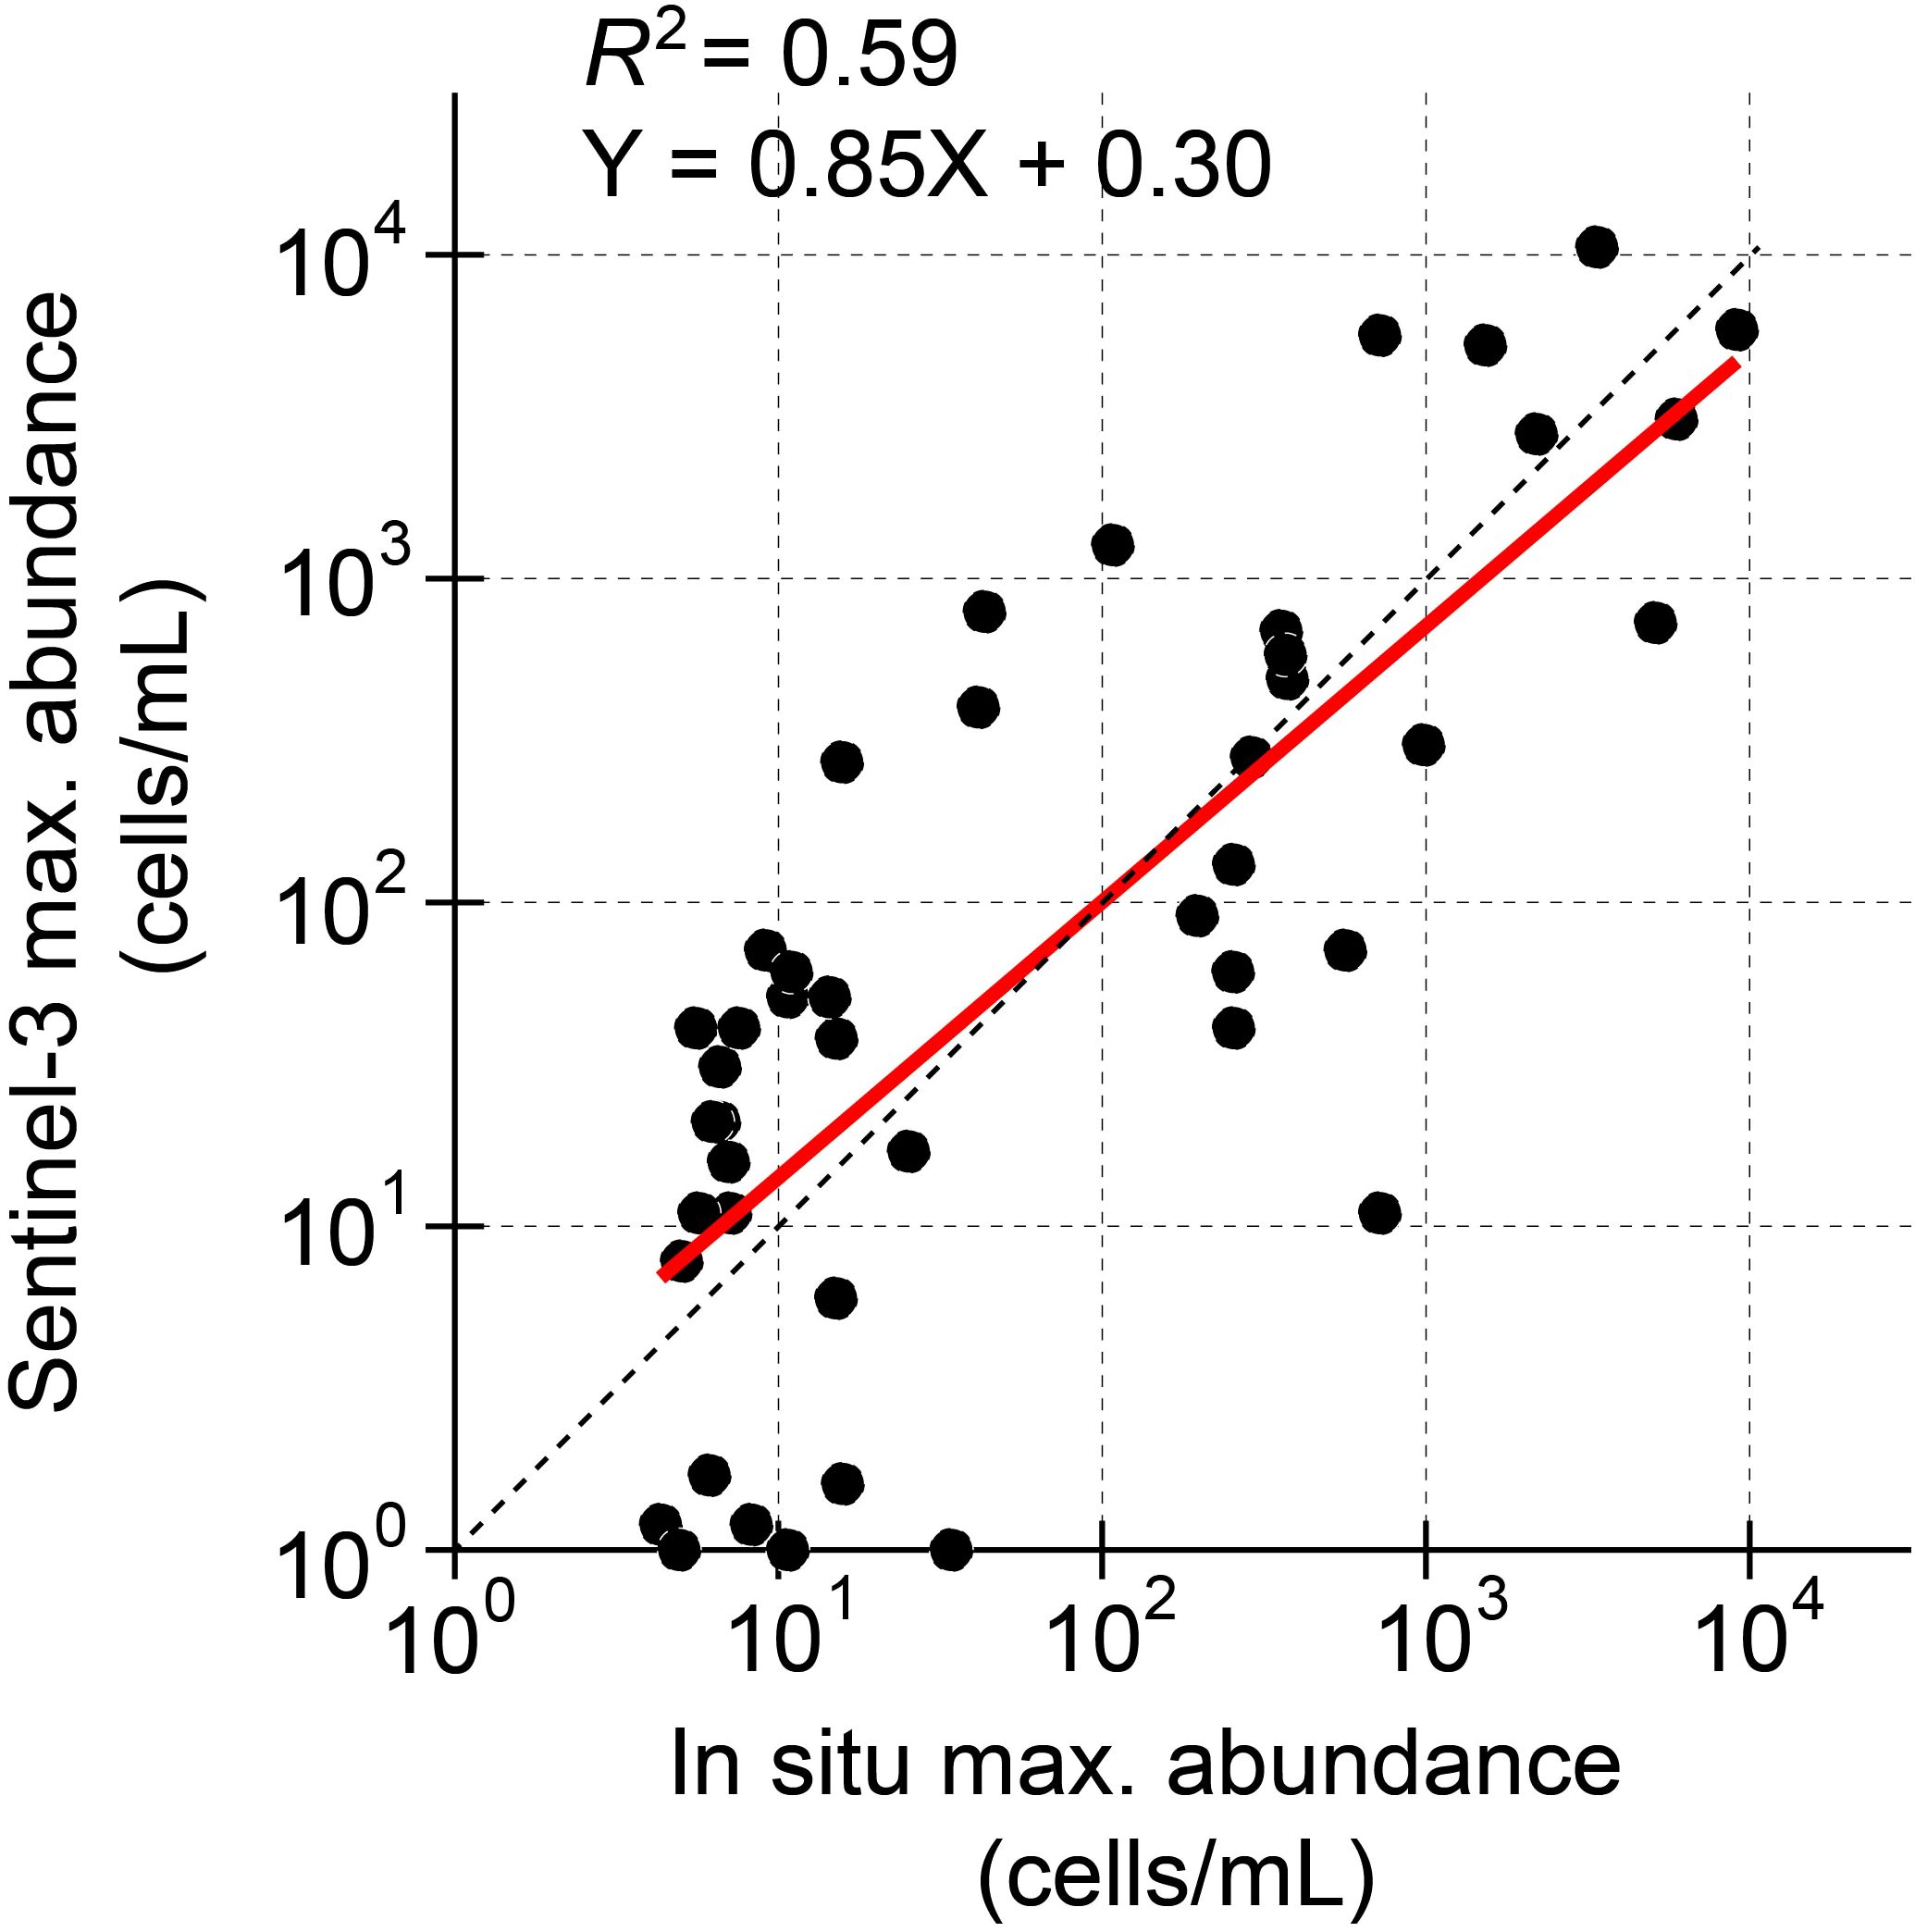
Figure 4. Scatter plots of the maximum in situ abundances of K. selliformis (Miyazono et al., 2023) and maximum RBD-derived abundances of Karenia spp. In situ abundances were reported in weekly intervals for four sub-prefectural administrative districts (Hidaka, Tokachi, Kushiro, and Nemuro). The thick black line and thin dashed line shows the regression line and Y = X, respectively.
3.3 Spatiotemporal variability of Karenia spp. along the coast
We constructed a Hovmöller diagram of Karenia spp. abundance along the Pacific coast of Hokkaido (Figure 5). Karenia spp. were distributed widely over transects 50–600 for more than 3 months from 20 August to 30 November. In addition, Karenia spp. were especially abundant in transects 120–540 and from 13 September to 12 November (bold dashed line in Figures 5A, B). We counted the transects with Karenia spp. abundances >10 cells mL−1 (black bars in Figure 6A) and referred to these as “Karenia transects”. We now can emphasize the fact that Karenia spp. appeared suddenly near the Hokkaido coast on 13 September, although the official announcement from Hokkaido Prefecture was that outbreaks began on about 20 September (HRO [Hokkaido Research Organization], 2021). The timing of 13 September is consistent with the timing of massive deaths of marine organisms (e.g., sea urchins) in rearing tanks at the Kushiro Station of the Japan Fisheries Research and Education Agency near transect 351. After 13 September, the number of Karenia transects increased and reached a maximum of more than 400 on 20–30 September (Figure 6A). Namely, the maximum alongshore scale of Karenia occurrence was more than 400 km. The number of Karenia transects tended to decrease after that, as they fluctuated and then declined abruptly in the beginning of November. The Karenia transects virtually disappeared in December 2021. The spatial mean abundance of Karenia spp. also exhibited a similar variation pattern (red points in Figure 6A), but the increase and decrease phases of the spatial mean abundance were different from those of the number of Karenia transects; that is, the spatial mean abundance increased gradually beginning on 20 August, reached a maximum on 20–30 October, and decreased thereafter, except for an abrupt increase on 10 November.
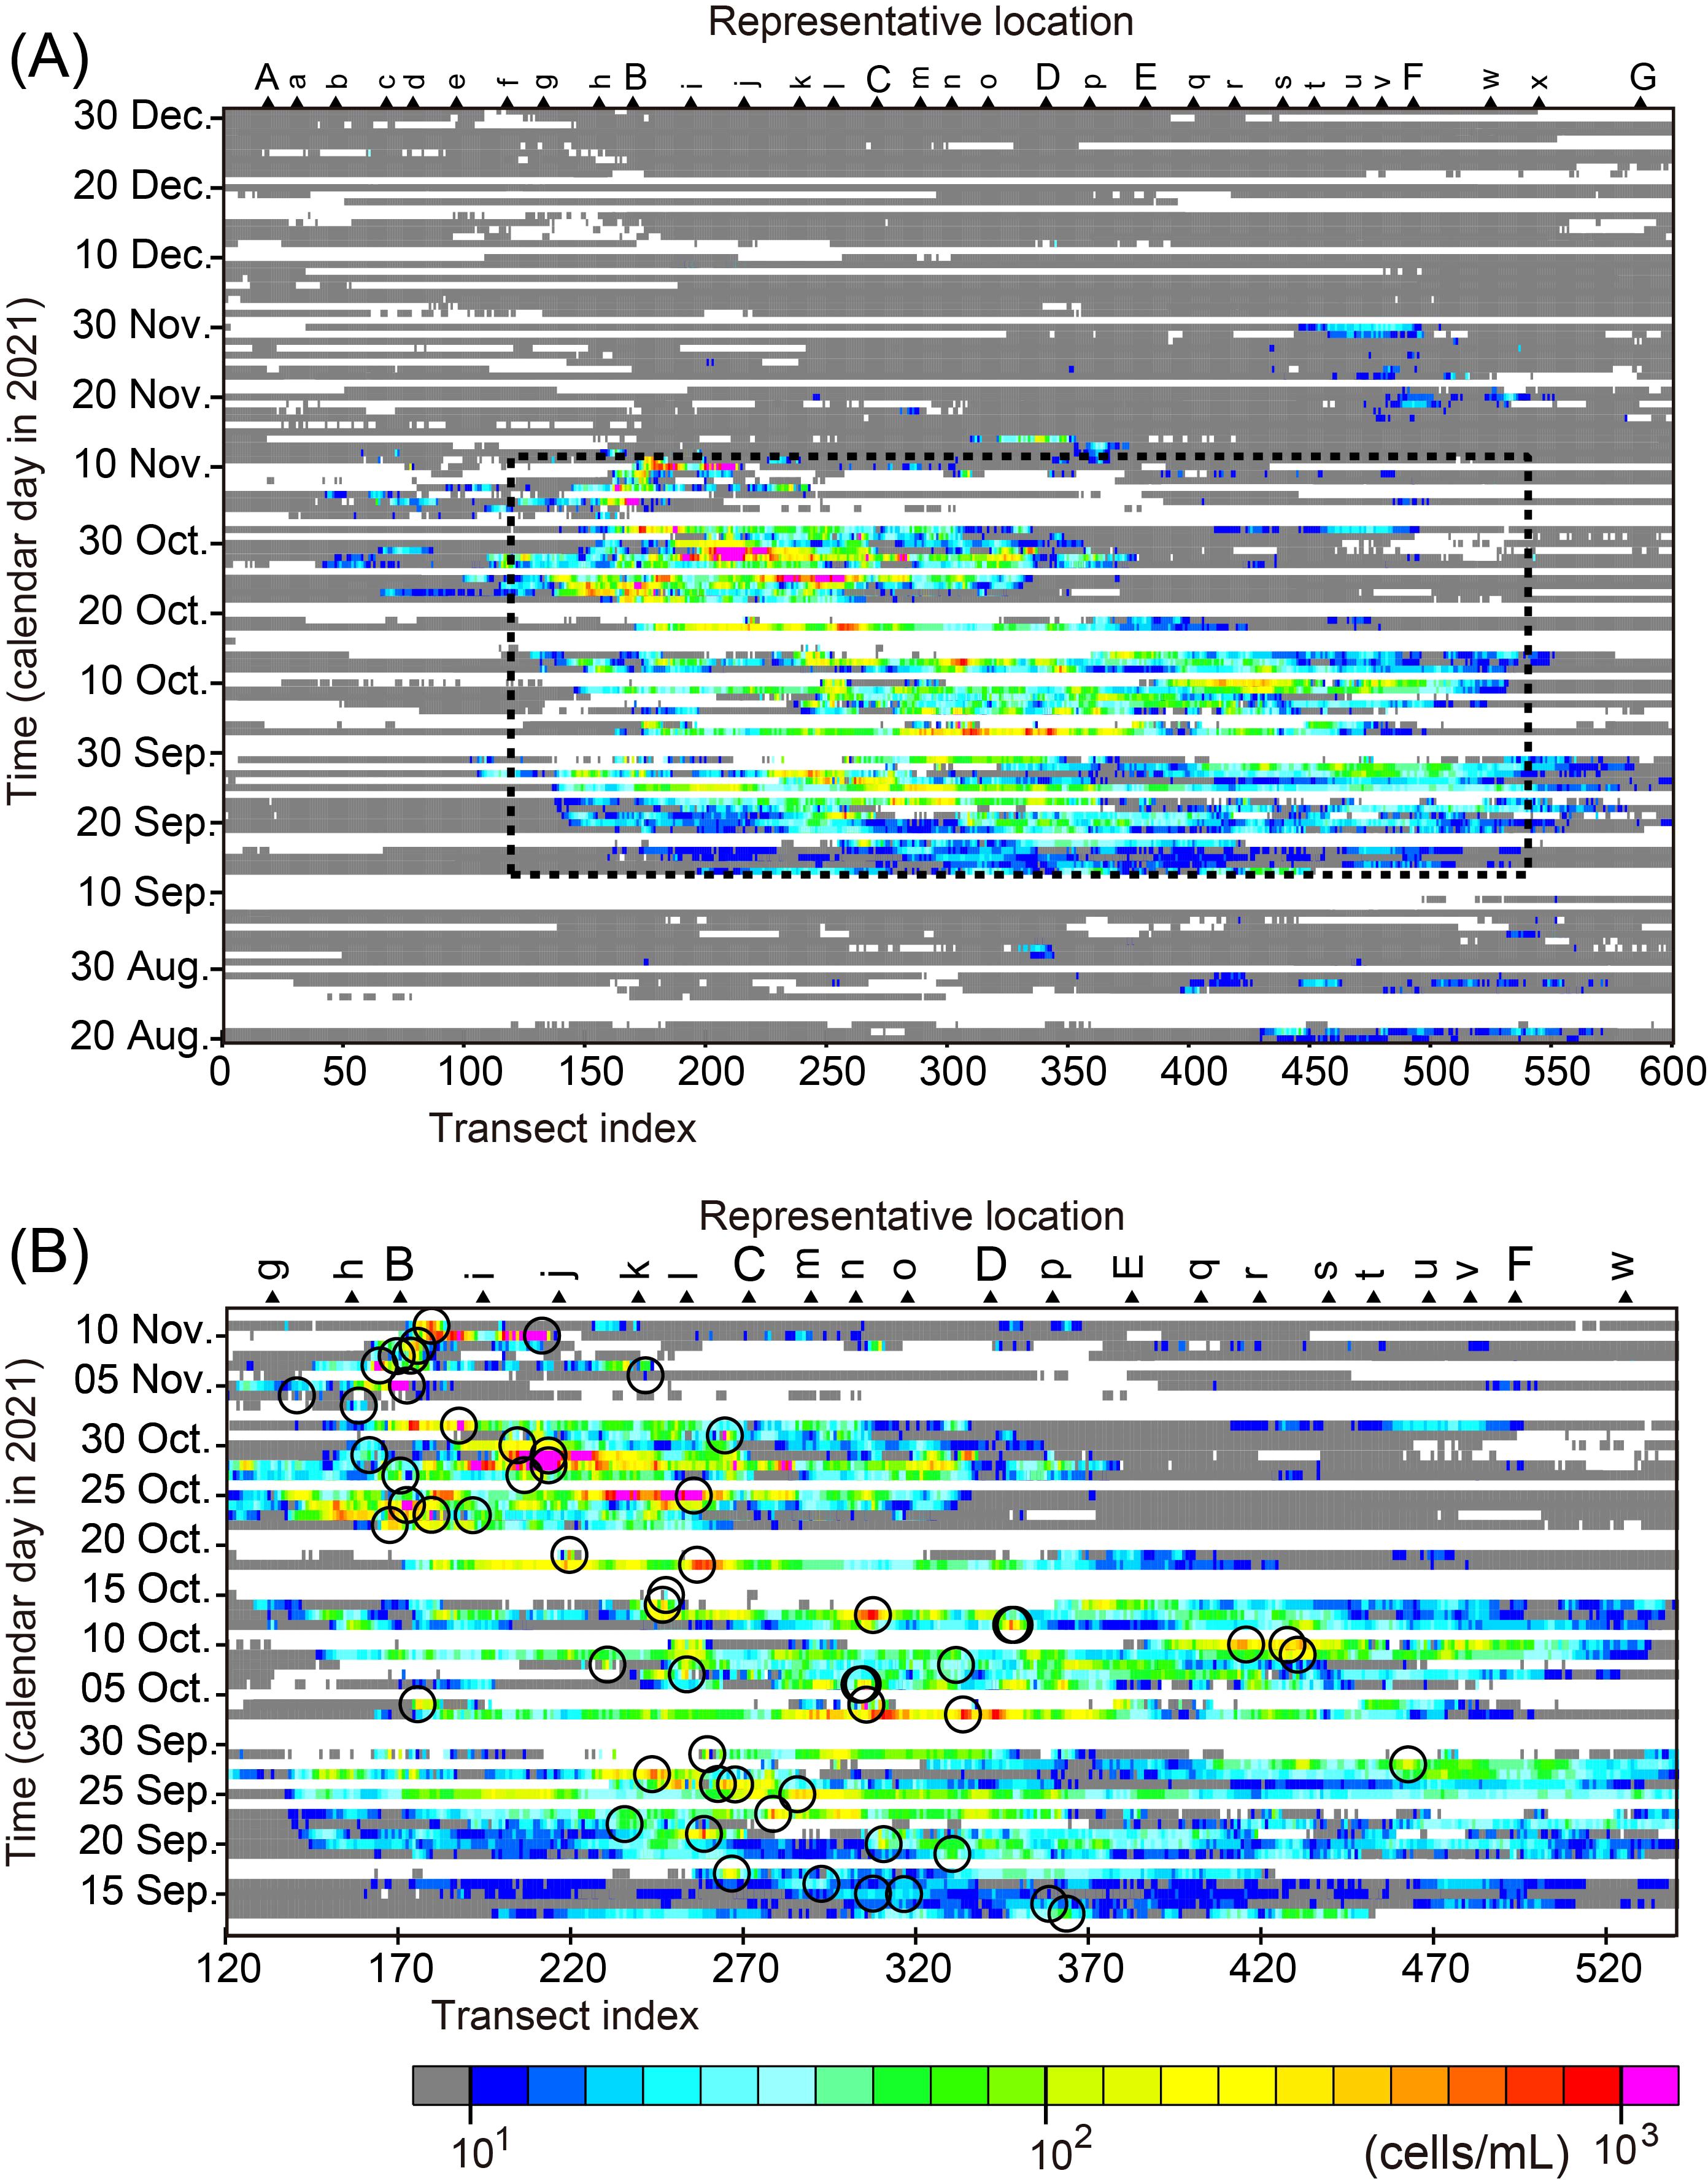
Figure 5. Hovmöller diagrams of Karenia spp. abundance averaged over each cross-shelf transect in the Pacific waters south of Hokkaido. White areas denote missing measurements and gray areas indicate the abundances <10 cells mL−1. The 2021 HABs occurred mainly within the dotted rectangle in panel (A), the area of which are magnified in panel (B). In panel (B), the maximum of Karenia spp. abundances for each image is surrounded by an open circle.
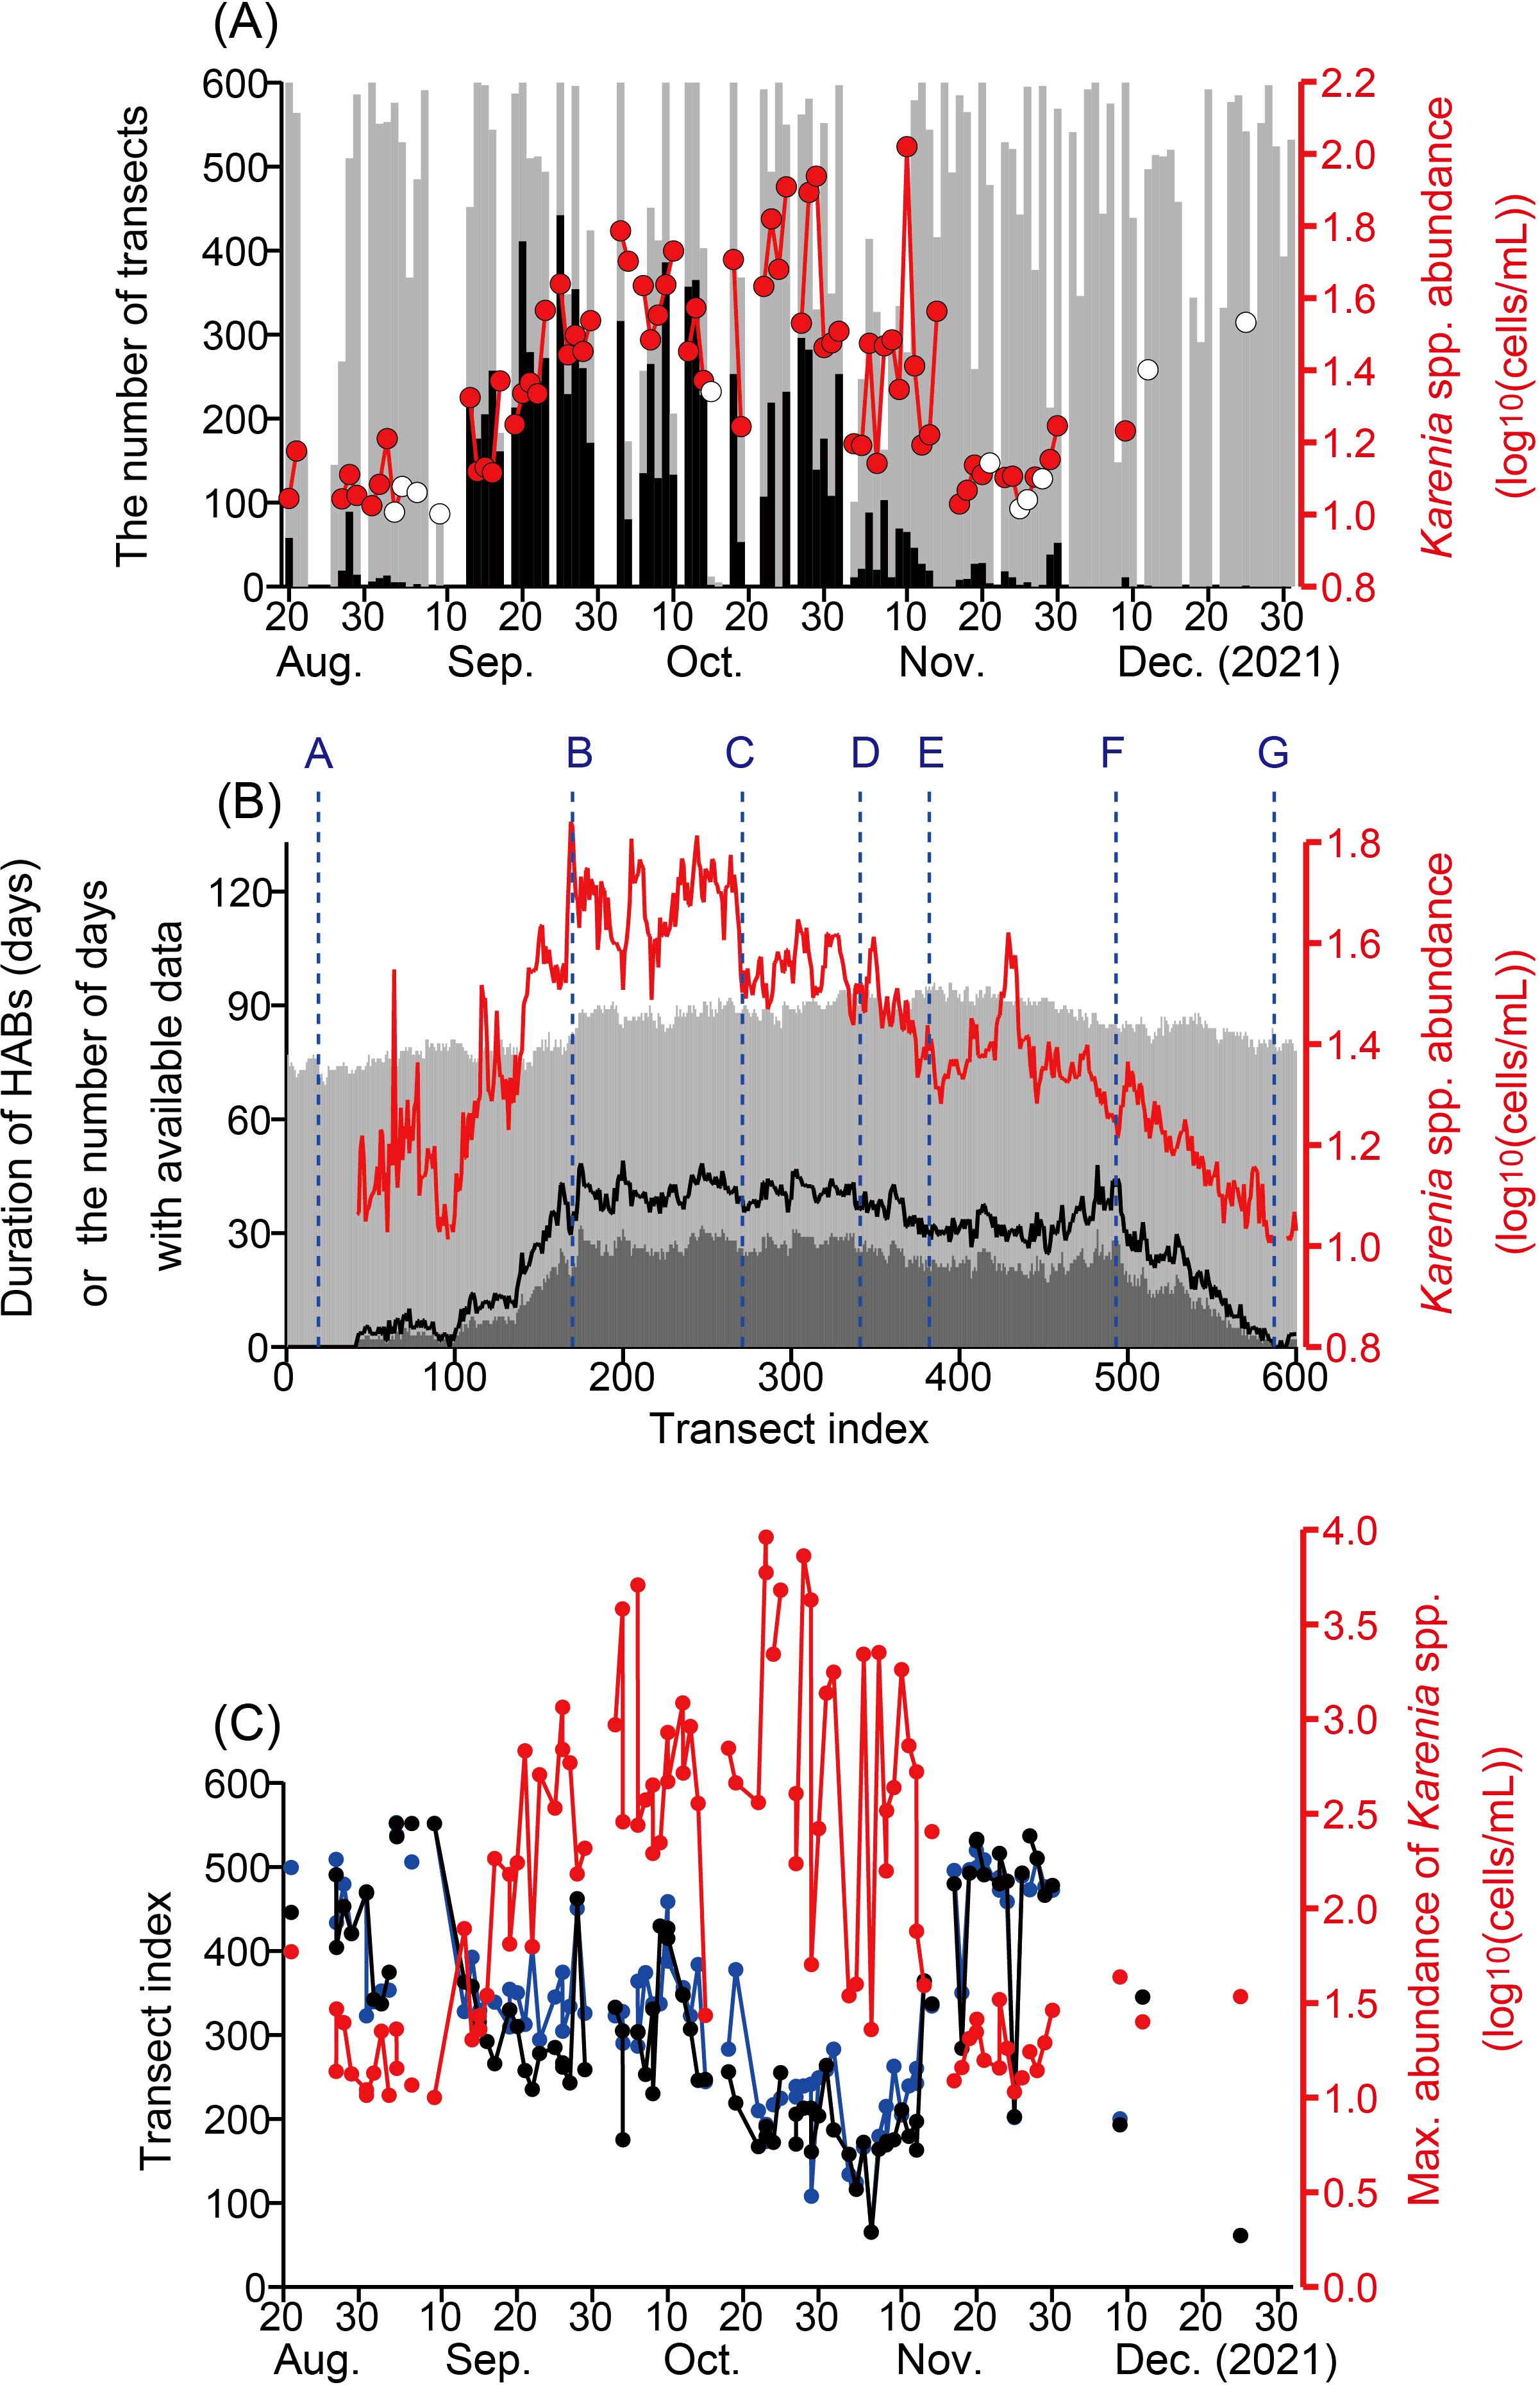
Figure 6. (A) Numbers of transects with Karenia spp. abundances >10 cells mL−1 (referred to as “Karenia transects” in the main text) (black bars) and the number of transects with available data (gray bar). Karenia spp. abundance >10 cells mL−1 averaged over transects for each snapshot image (red line). Red closed circle and open circle indicates that the number of data for the average was <5 and ≥5, respectively. (B) Duration of Karenia spp. abundances >10 cells mL−1 (dark gray bar), which was corrected (black line) by data acquisition rate based on the number of days with available data (gray bar). Red line denotes mean abundance of Karenia spp. (>10 cells mL−1) for each transect. (C) Location of the maximum abundances of Karenia spp. for each image (black), center of gravity of Karenia spp. abundances (blue), and maximum abundance (red).
The duration of the Karenia spp. appearance at each transect that was corrected by a data acquisition rate (black line in Figure 6B) exhibited broad maximums ~45 days for transects between the Cape Erimo and the Cape Nossapu-misaki (points B and F). Temporal mean abundance of Karenia spp. at each transect exceeded 1.6 log10(cells mL−1) for transects between the Cape Erimo and the mouth of the Tokachi River (points B and C). The temporal mean decreased rapidly west of the Cape Erimo (point B) and gradually east of the mouth of the Tokachi River (point C). Hence, shelf waters in point B–C suffered from the longest and the most abundant (i.e., the severest) conditions of the HABs 2021.
The maximum abundance of Karenia spp. appeared sporadically in the eastern transects (300–570) at the beginning stage of the 2021 HABs, before 13 September (Figures 5A, 6C). Then, the maximum position gradually moved westward (Figures 5B, 6C), but it fluctuated and had short-term variability. After 10 November, the maximum position jumped abruptly eastward to the vicinity of transect 500 (point F). A map of Karenia spp. abundances on 23 November suggests that relatively high abundances of Karenia spp. were newly transported into the easternmost area from upstream (Figure 3). The center of gravity, like an epicenter of Karenia spp. blooms, was here defined as , where i is the transect index and N is the number of transects out of 600 with . The transition of the maximum position was also consistent with that of the center of gravity of Karenia spp. abundance (Figure 6C) (r = 0.92). The maximum value increased gradually from the beginning stage to 20–31 October and fluctuated greatly, and then it decreased to the end of November. After the maximum position jumped to the east, the maximum value was close to the threshold of data accuracy (~10 cells mL−1). In addition, the maximum abundance during December was mostly lower than the threshold. We roughly estimated the westward movement speeds of the maximum position and the center of gravity of Karenia spp. abundance by fitting a regression line from 20 August to 12 November (4.4 cm s−1 and 4.0 cm s−1, respectively). The direction of these movements was consistent with the flow direction of the Coastal Oyashio, which is dominant along the Pacific shelf (e.g., Figure 1A).
In addition to the slow westward movement of the center of gravity of Karenia spp. on the entire target shelf, short-term and small-scale variations of Karenia spp. abundance were apparent for local shelves (Figure 5). Decorrelation scales of Karenia spp. abundances were estimated for space and time to understand the representative scale of their localized variations during the central period of the 2021 HABs (Figure 7). Autocorrelation coefficients were estimated between the common logarithm of Karenia spp. abundances limited to ≥1 log10 cells mL−1 and that of Karenia spp. abundances with a time or space lag. A time or space lag was sequentially increased until the autocorrelation coefficient was judged as decorrelation by Student’s t-test with a 95% confidence limit, as long as the number of data points for estimating a correlation coefficient was greater than 20. The time search interval was about 1 day and the space interval was one transect (1 km). Decorrelation scales were estimated separately for positive and negative lags. They are summarized in Figure 7 as positive lags because of their nearly symmetrical feature. The decorrelation time scale ranged from 1 to 4 days, mostly 1 or 2 days, and the cumulative frequency was greater than 95% for 2 days. Decorrelation on the along-shelf scale ranged from 1 to 150 km, and 80% and 94% of the decorrelation scales were within 50 km and 100 km, respectively. Hence, using an 80% cumulative frequency as the benchmark/threshold, a representative scale of time and space was ≤2 days and ≤50 km, respectively.
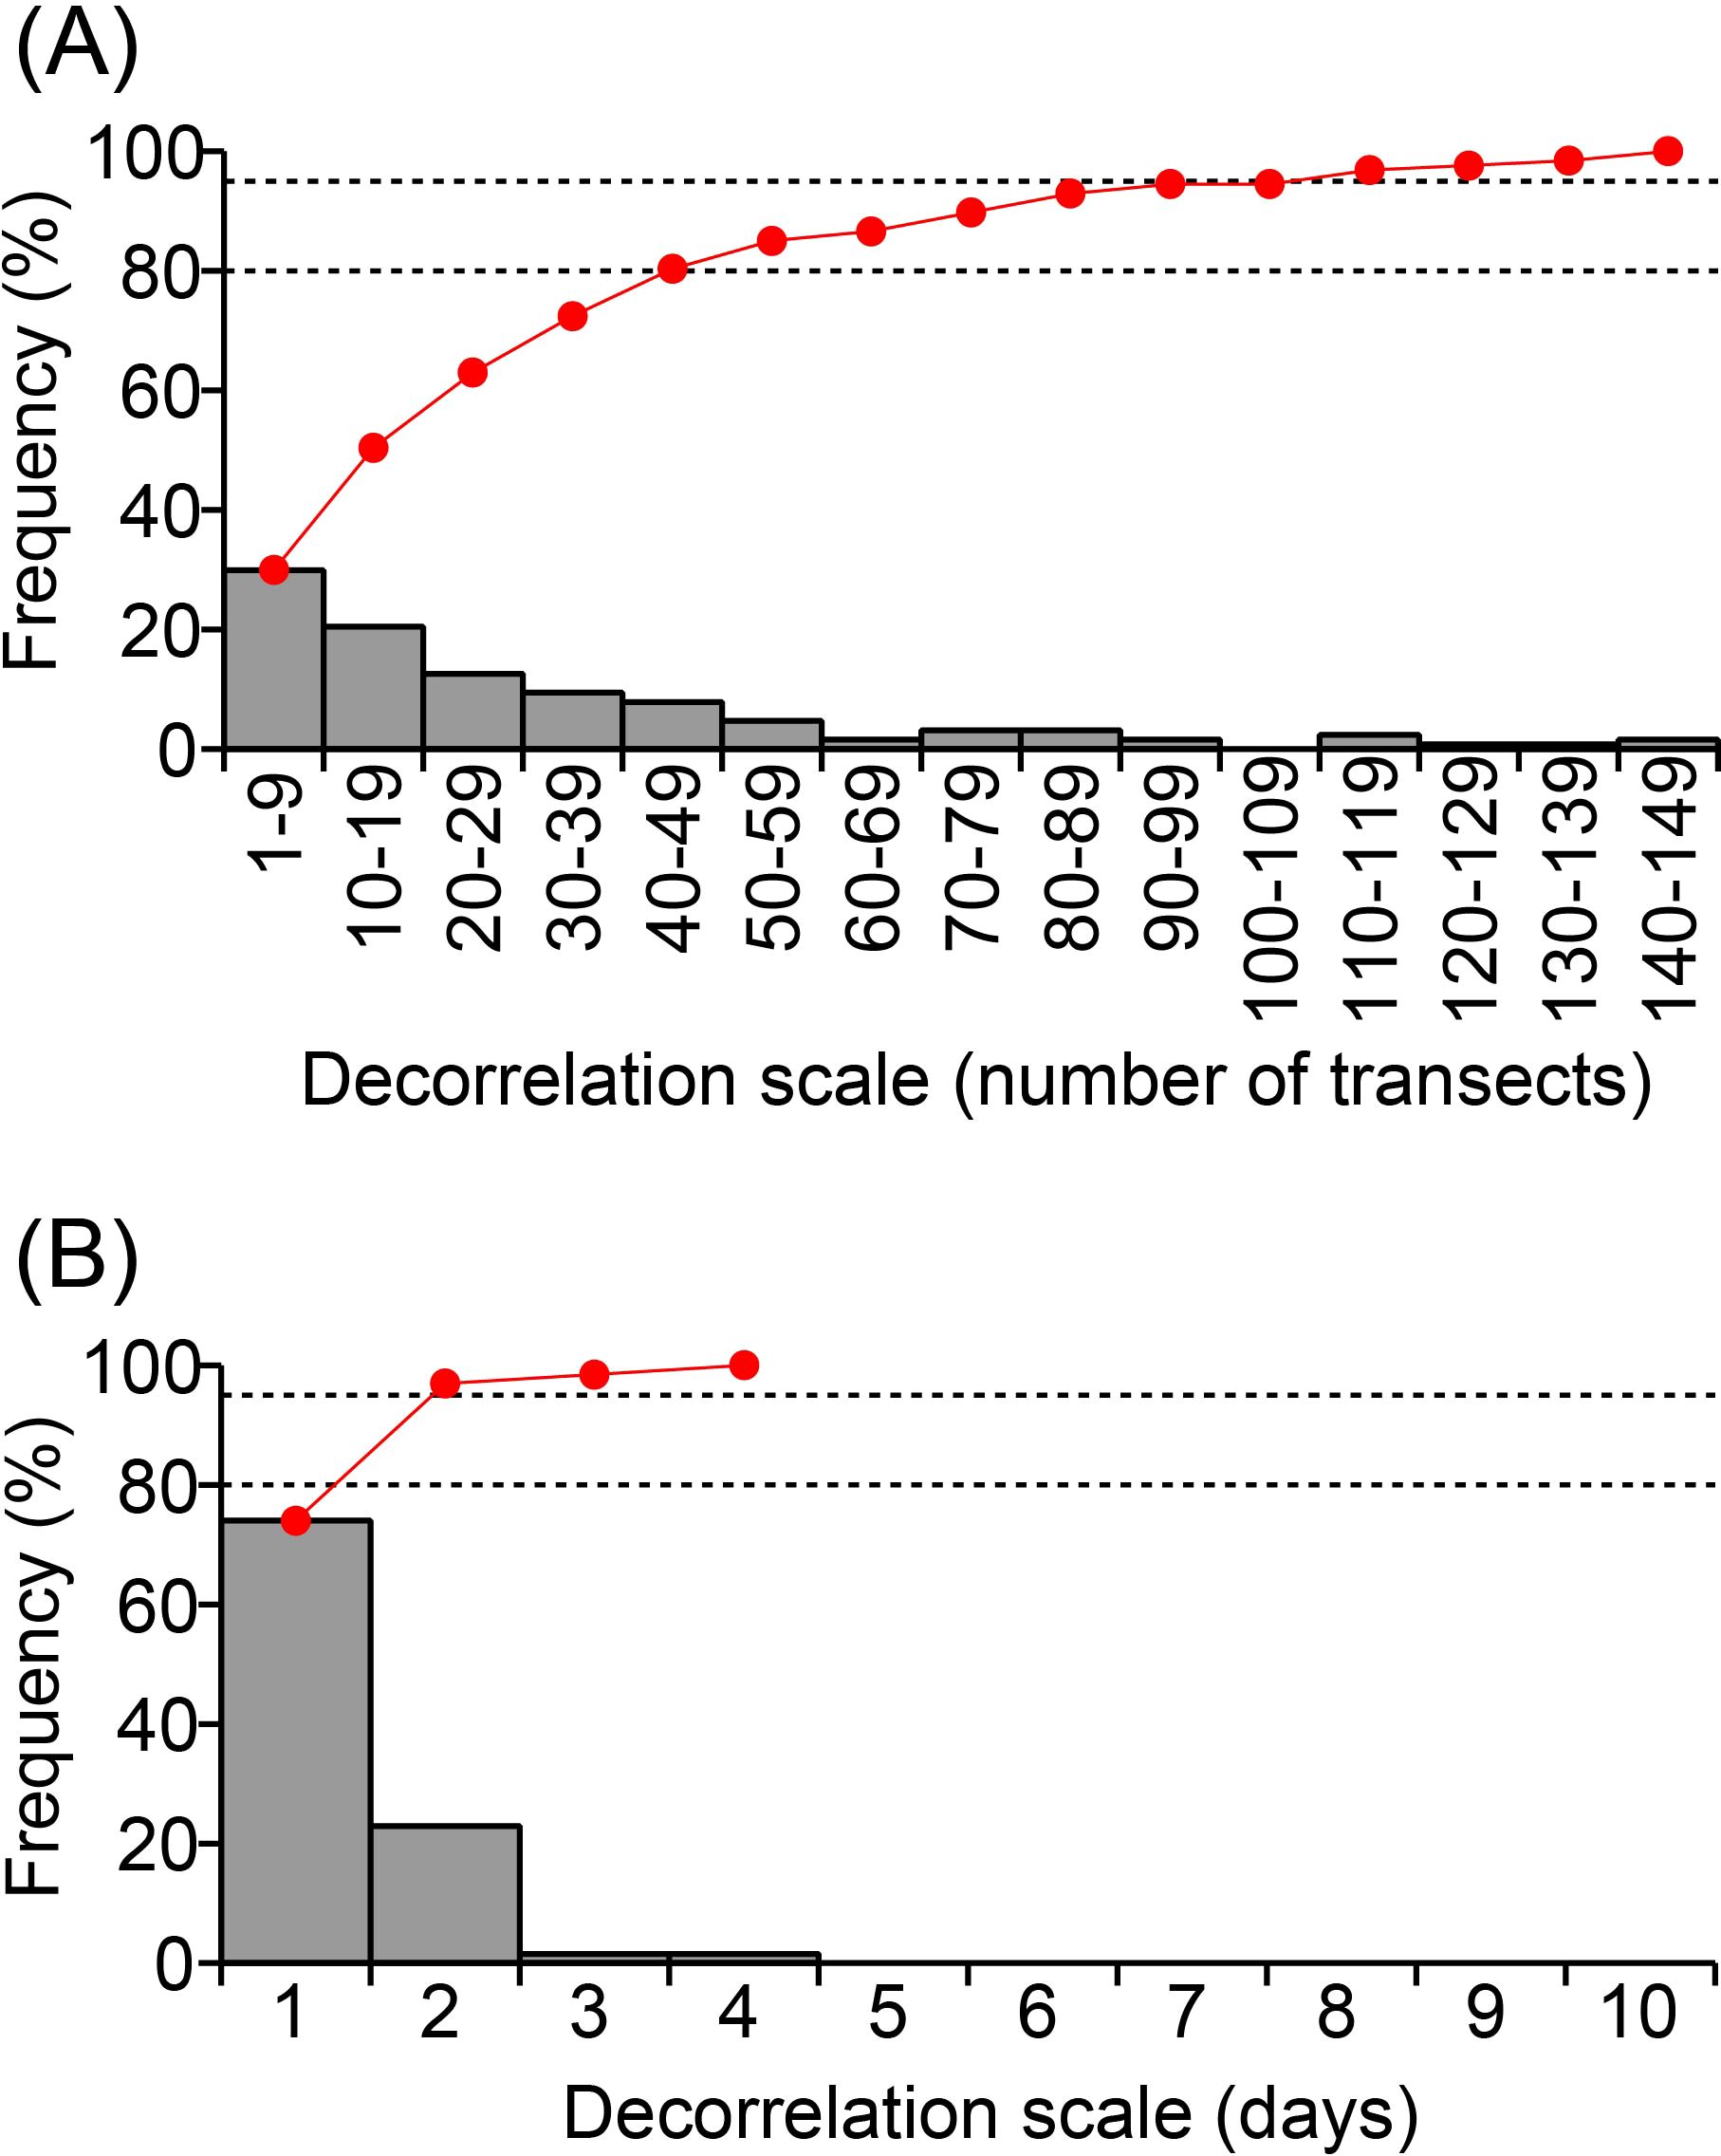
Figure 7. (A) Frequency distribution of the spatial decorrelation scale (bar chart), which was described by the number of transects (almost consistent with kilometers). Red line is the cumulative frequency distribution; 80% and 95% are indicated by horizontal dashed lines. (B) Same as panel (A), but for the temporal decorrelation scale.
3.4 Relationships with marine environmental variables
Marine environmental conditions were also examined, because similar analyses by Kuroda et al. (2021a) based on satellite-derived chlorophyll images were limited to the development stage of the 2021 HABs through the end of September 2021. Frequency distributions and class-averaged values of environmental variables on transects 1–600 from 20 August to 31 December are illustrated as a function of sea-surface temperature (SST), sea-surface salinity (SSS), mixed layer depth (MLD), and current velocity normal to each transect (Figure 8). Positive (negative) current velocity was defined as flow to the east (west). Frequency distributions for Karenia spp. abundances ≥10 cells mL−1 differed markedly from those for all abundances, implying active preference for certain growth conditions of Karenia spp. Particularly strong selectivity was identified for SST, as pointed out by Takagi et al. (2022) (Figure 8A); Karenia spp. appeared with a high probability at 11–18°C. Karenia spp. abundance averaged for the SST class reached a maximum of 1.8 log10 cells mL−1 near 13°C, where a local maximum of frequency distribution appeared. Meanwhile, Karenia spp. appeared less frequently at high temperatures (>18°C). For SSS (Figure 8B), Karenia spp. appeared less frequently at high salinities (>33.6)—levels that are associated with pure subtropical waters. Karenia spp. abundances averaged for SSS class increased moderately at low salinity and exhibited a maximum at 30.8, which is associated with seawater that has been seriously affected by river discharge. Karenia spp. appeared with a higher probability in shallow MLDs (Figure 8C); 93% of Karenia spp. appeared in an MLD of 0–30 m, implying that a shallower mixed layer affected by river discharge fostered particularly favorable conditions for growth. Karenia spp. appeared with a higher probability for westward velocities, and the maximum frequency was between −0.2 and −0.1 m s−1. This suggested that Karenia spp. was basically transported to the west by the Coastal Oyashio coastal boundary current on the Pacific shelf (e.g., Figure 1A). An interesting point, however, is that Karenia spp. abundance averaged by alongshore velocity class tended to be higher for eastward flow, a point that is discussed in the Section 4.1.
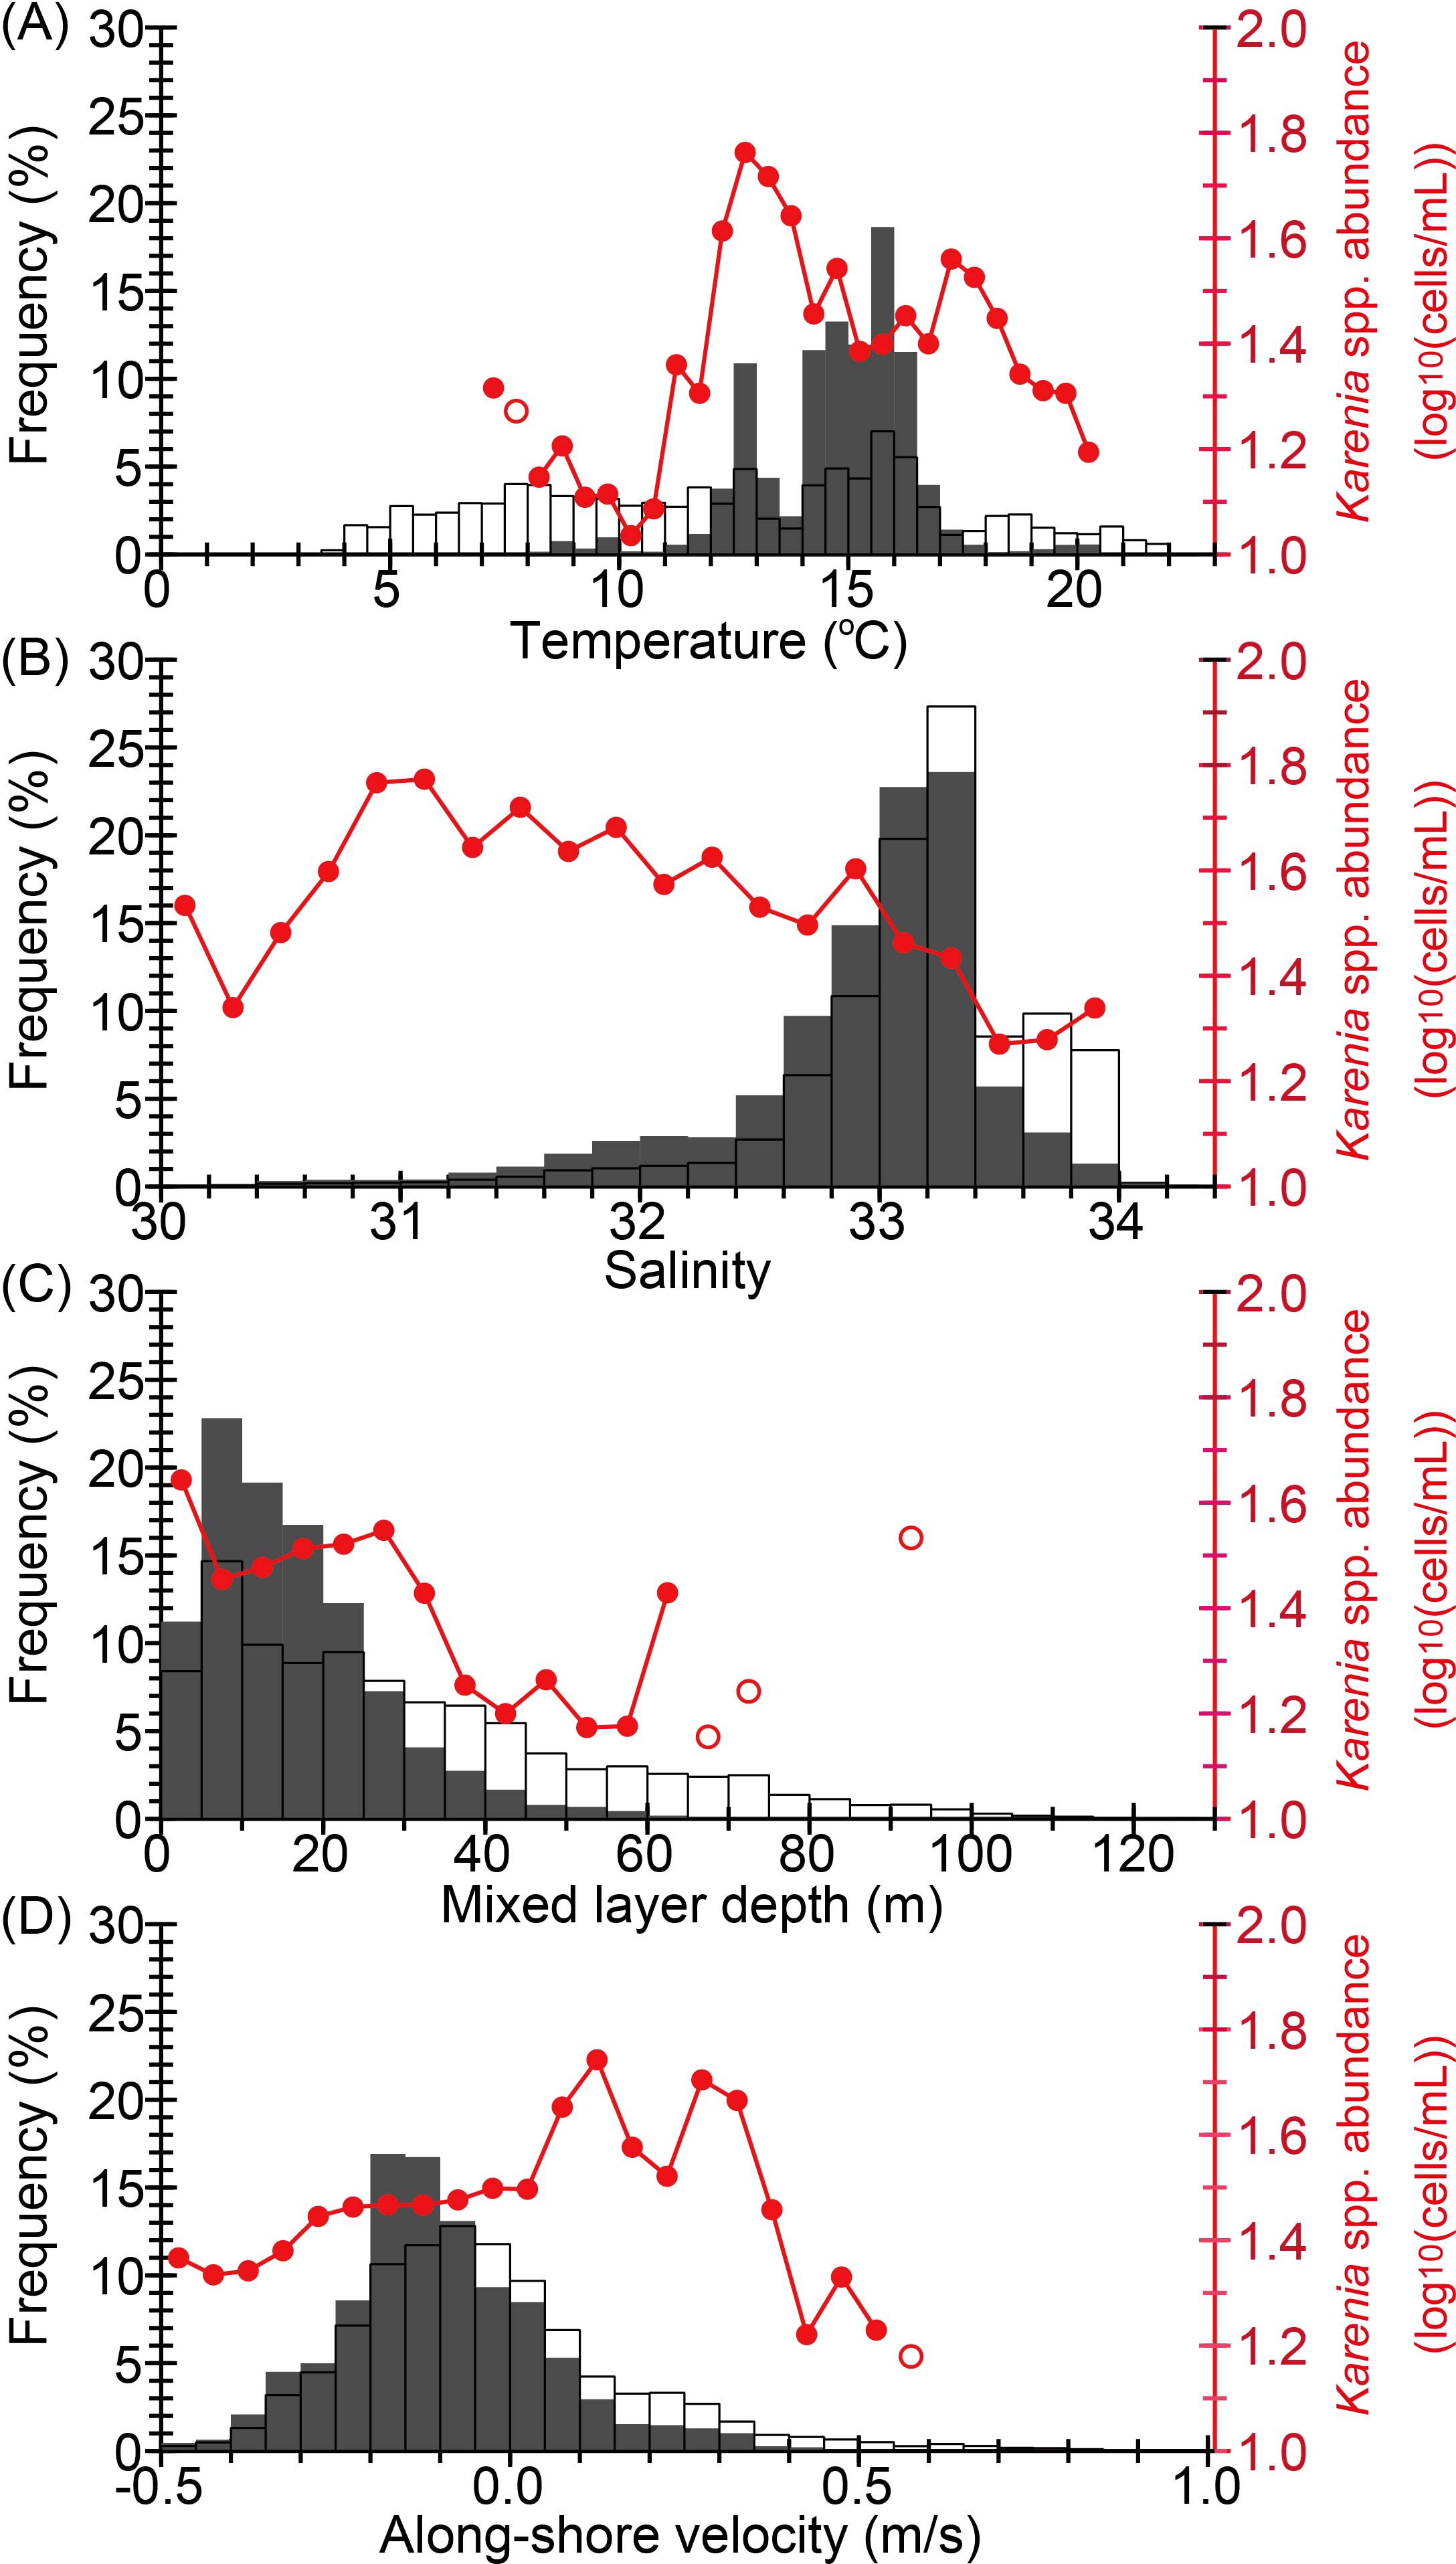
Figure 8. Frequency distribution of Karenia spp. abundance (bar chart) and class-averaged abundance of Karenia spp. as a function of marine environmental variables (red line with open or closed circles): (A) sea surface temperature, (B) sea surface salinity, (C) surface mixed-layer depth, and (D) alongshore velocity normal to the cross-shelf transect. Red closed circles and open circles indicate that the number of data points for the average was <5 and ≥5, respectively. The frequency distribution indicated by the gray bars corresponds to Karenia spp. abundance >10 cells mL−1 (N = 11,637), and the frequency distribution indicated by open bars corresponds to all values of Karenia spp. abundance (N = 60,532) from 20 August to 31 December 2021 (i.e., Figure 5A).
Environmental variables were averaged for each transect from 13 September to 12 November (Figure 9), when the HABs were especially dominant (Figure 5). Time-averaged SSTs increased drastically to the west at a nearly stable water-mass front (see Figure 1A) south of Cape Erimo (point B), where the time-averaged abundance of Karenia spp. decreased dramatically to the west (Figure 9A). Time-averaged SSSs tended to be lower between Cape Erimo (point B) and Kushiro Port (point D) near the mouth of the Kushiro River. Extremely low salinity (~31) was apparent at the mouth of the Tokachi River (point C). Downstream of the river mouth, time-averaged salinity increased rapidly to the west and further increased at the front near Cape Erimo. Time-averaged MLDs tended to be shallower between Cape Erimo and the Kushiro Port (Figure 9C), where low-salinity water attributable to river discharge contributed to the maintenance of shallow MLDs (the green line in Figure 9C). Therefore, particularly high abundances of Karenia spp. between Cape Erimo and the mouth of the Tokachi River corresponded to shallow MLDs (<20 m) downstream of the Tokachi River.
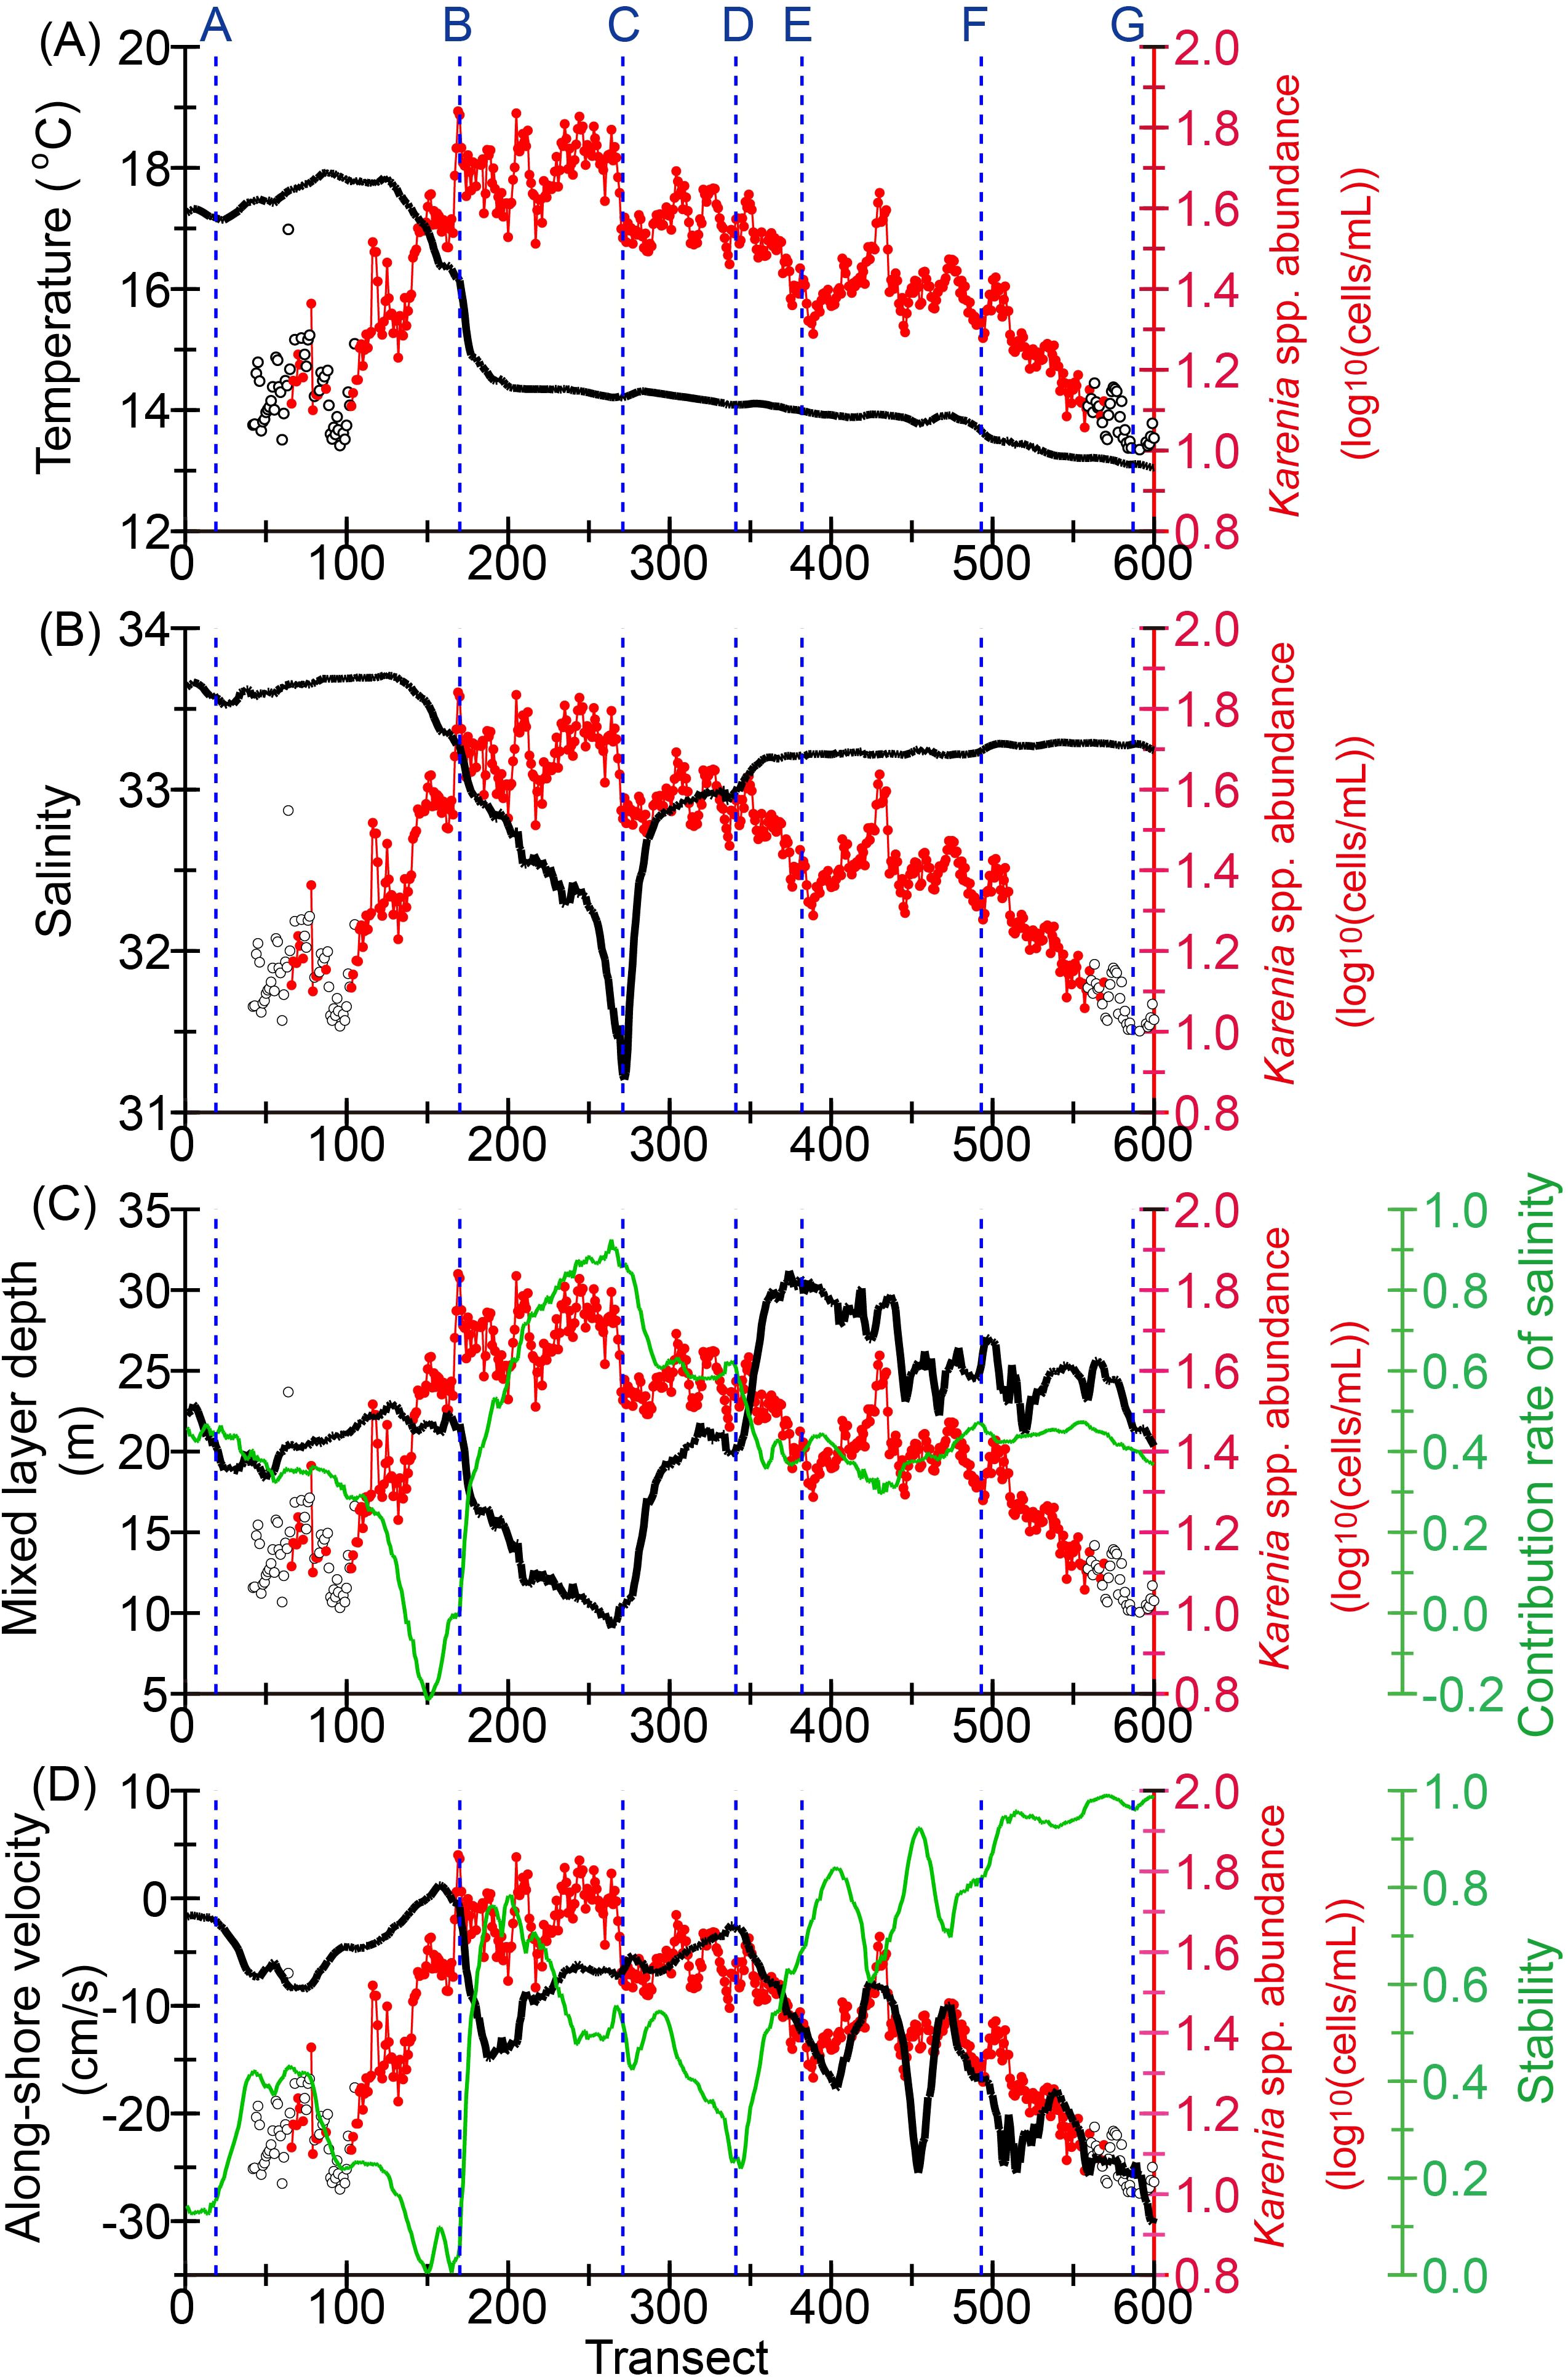
Figure 9. Time-averaged abundance of Karenia spp. from 13 September to 12 November, when Karenia spp. blooms mainly occurred (red), and time-averaged value of environmental variables (black): (A) sea surface temperature, (B) sea surface salinity, (C) surface mixed-layer depth, and (D) alongshore velocity normal to the cross-shelf transect. Red closed circles and black open circles indicate that the number of data points for the average was ≥5 and <5, respectively. In (C) and (D), the contribution rate of salinity to the surface mixed-layer depth, and the stability of the alongshore velocity, respectively, are denoted by the green line. The stability was defined by the ratio of the absolute value of vector-mean velocity to that of scalar-mean velocity.
Throughout the shelf, the time-averaged alongshore westward velocity normal to each transect tended to be intensified to the east, and high (low) stability of the alongshore flows corresponded with strong (weak) westward flow (Figure 9D). There was a high negative correlation between the two variables (r = −0.94). Particularly intense westward flows (<−15 cm s−1) with high stability (>0.8) were apparent east of Cape Nossapu-misaki (point F). East of the mouth of the Tokachi River (point C), the time-averaged alongshore velocity, and its stability, exhibited large positive and negative correlations, respectively, with Karenia spp. abundance (r = 0.89 and −0.85) (Figure 9D). These robust correlations indicated that more intense and stable alongshore westward boundary currents were associated with less developed Karenia spp. blooms in the shelves upstream/east of the Tokachi River. In other words, stagnation of the coastal boundary current on the shelf appears to be needed for the favorable growth or aggregation, or both, of Karenia outbreaks east of the mouth of the Tokachi River. In contrast, the above robust relationships were not apparent downstream/west of the Tokachi River. This fact suggests that low-salinity water from the Tokachi River suppressed the development of the surface winter mixed layer and had a greater contribution to the growth of Karenia spp. than did the magnitude and stability of the alongshore flows. In fact, even when the westward flows strengthened just east of Cape Erimo (point B), Karenia spp. abundance exhibited the highest values (Figure 9D).
It should be noted that the above environmental features were limited to the period ending on 12 November. For example, alongshore velocity over the Pacific shelf changed drastically on about 12 November (Figure 10), just after which the spatial distribution of Karenia spp. changed greatly and declined immediately (Figures 1A, 5).
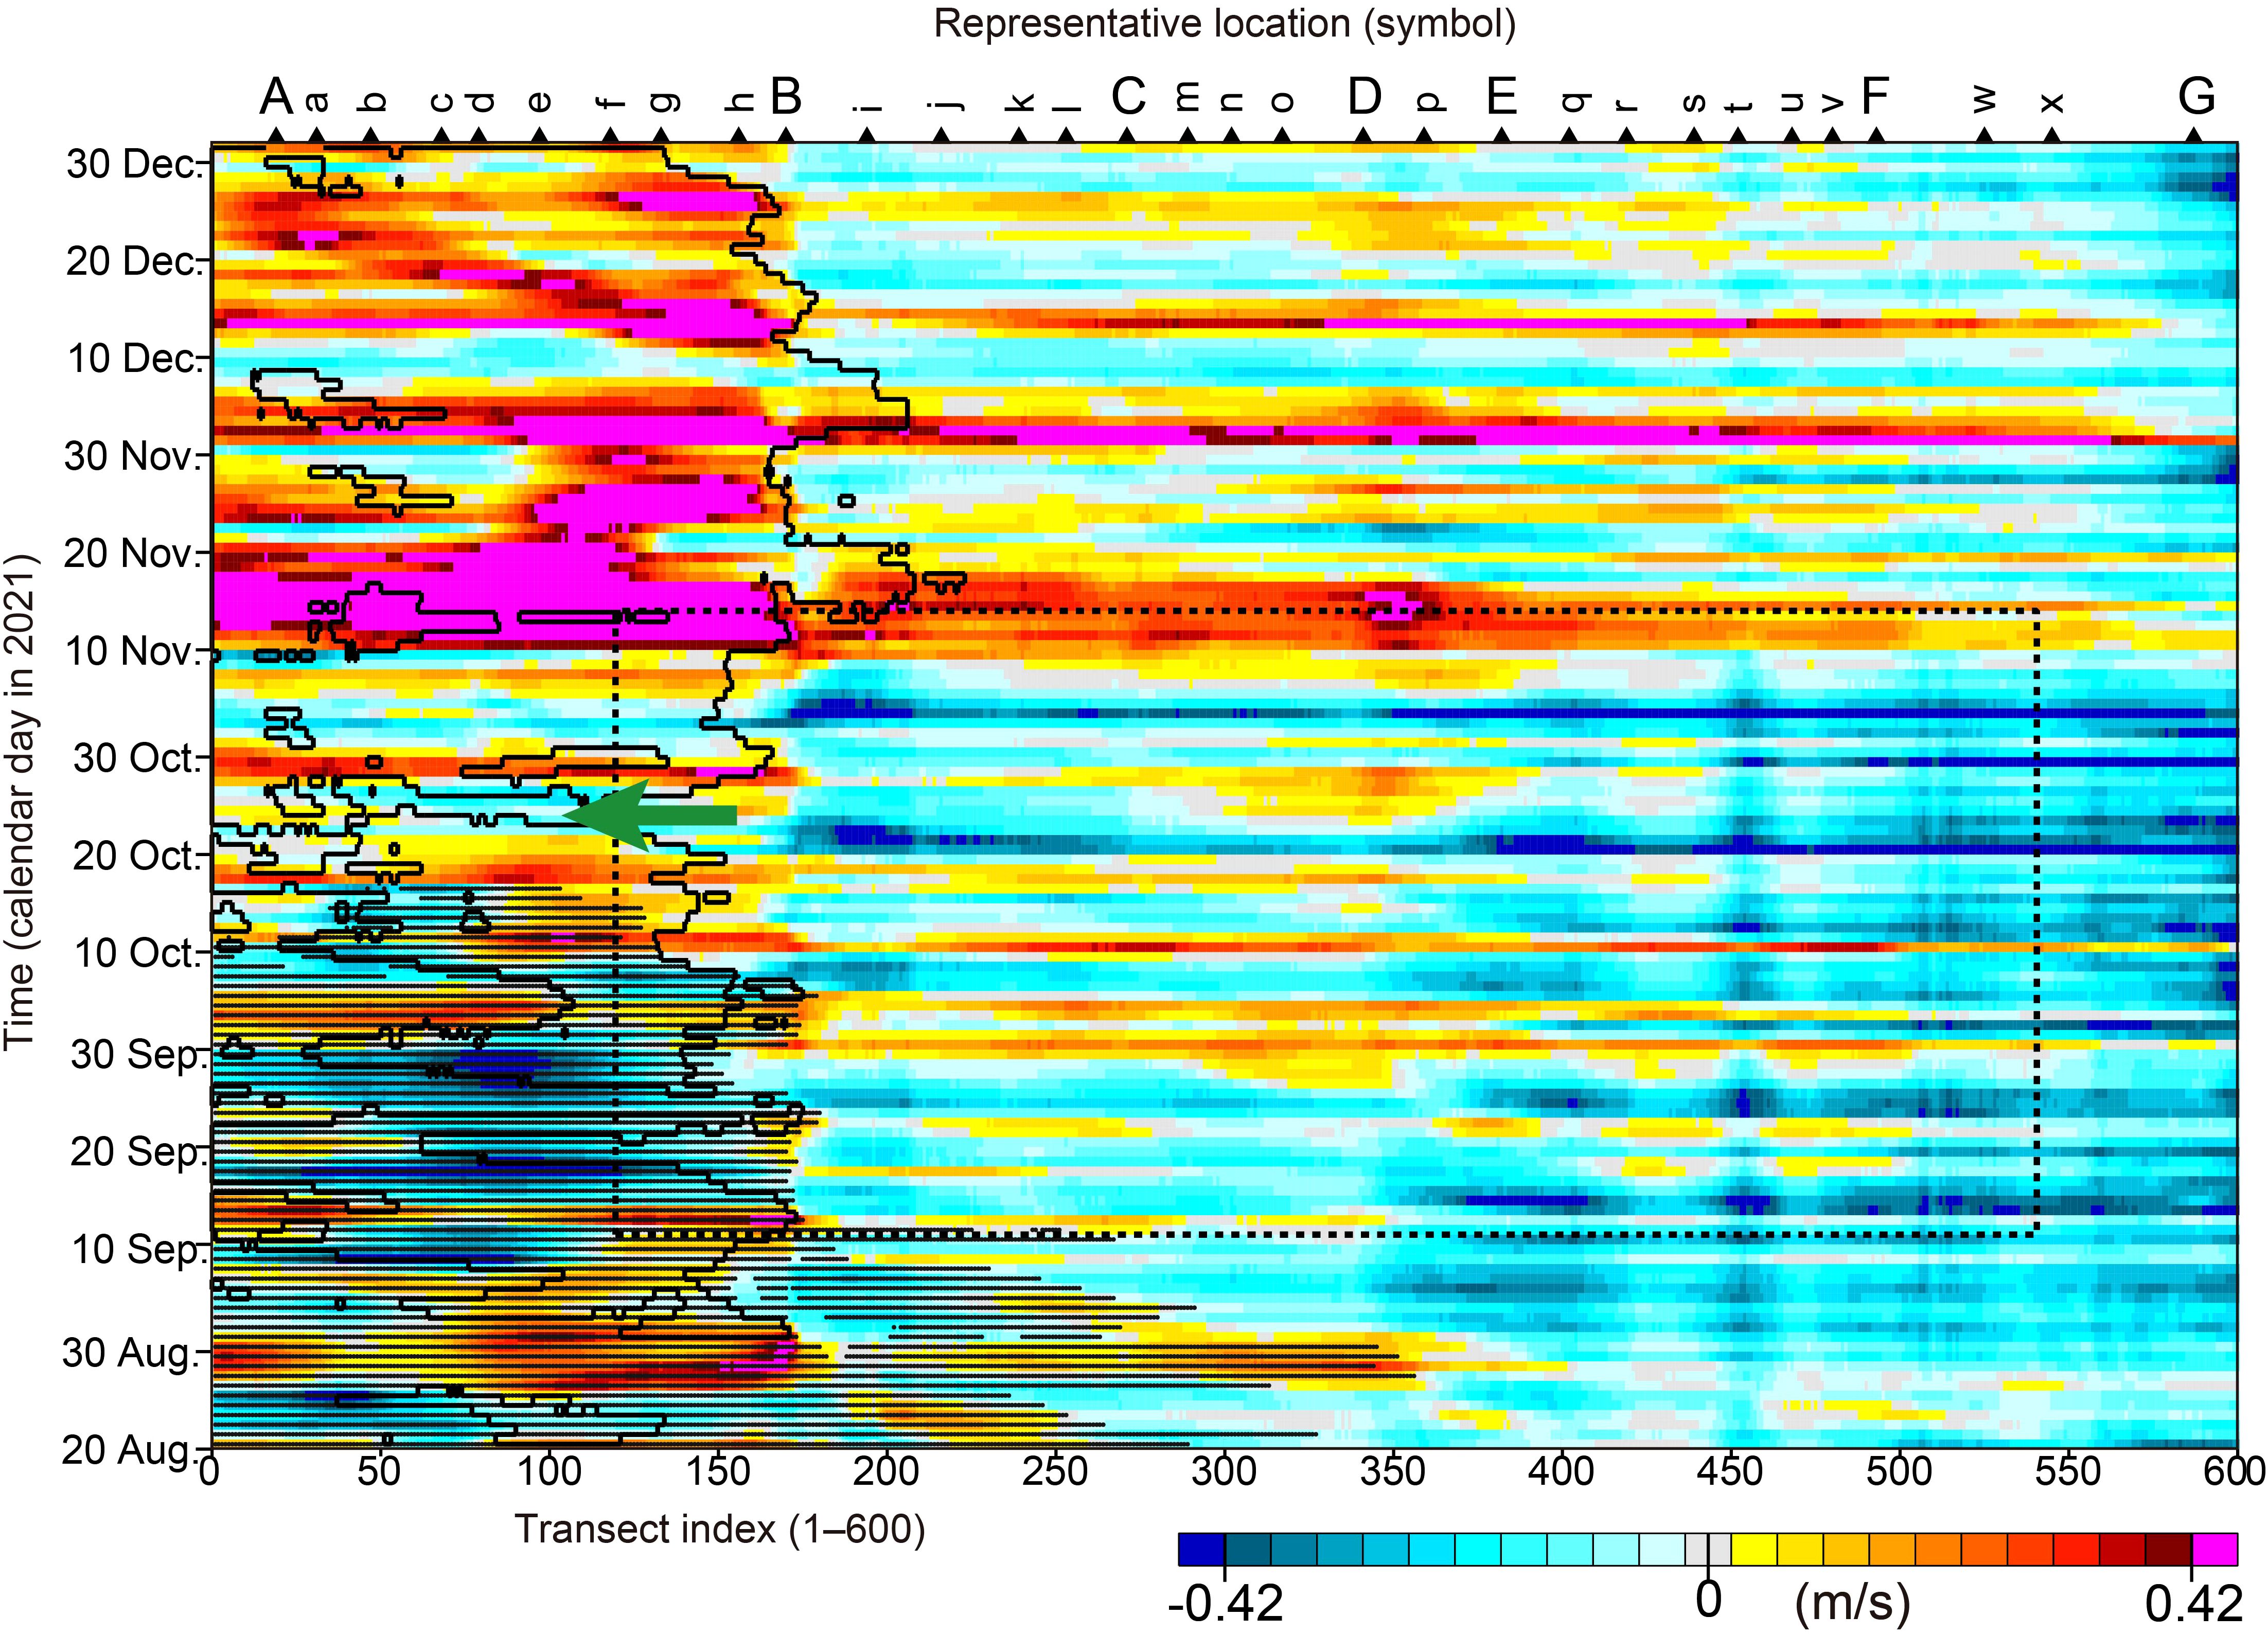
Figure 10. The same as Figure 5A, but for simulated velocity normal to each transect. There are no missing data, which were included in the satellite-derived abundances of Karenia spp. (i.e., the white areas in Figure 5A). Approximately eastward velocity is defined as a positive value. Black solid line and black dots denote simulated sea surface salinity of 33.6 and simulated sea surface temperature >18°C, respectively. Green arrow indicates a sudden westward shift of the water-mass front near the Cape Erimo (point B) incidental with westward flows around 25 October.
3.5 Particle-tracking experiments
To understand the effects of horizontal advection on the distribution of Karenia spp. by a coastal boundary current (Coastal Oyashio) along the shelf, we analyzed the results of particle-tracking experiments. Figure 11A shows the number of residual particles for each segment (group of transects) averaged over 61 cases with a different initial time from 13 September to 12 November. For a tracking time of 1 day from the initial time, residual particles were reduced to about 50% of the initial amount. As a spatial feature, a particularly large number of particles were transported out of the segments east of transect 480, where particularly stable strong westward flows were present (Figure 9D); they were reduced to <10% after 5 days. Although some particles were transported offshore, to areas that were not part of any of the transects or segments, most were transported along the Hokkaido coast to the west by the Coastal Oyashio (Figure 10).
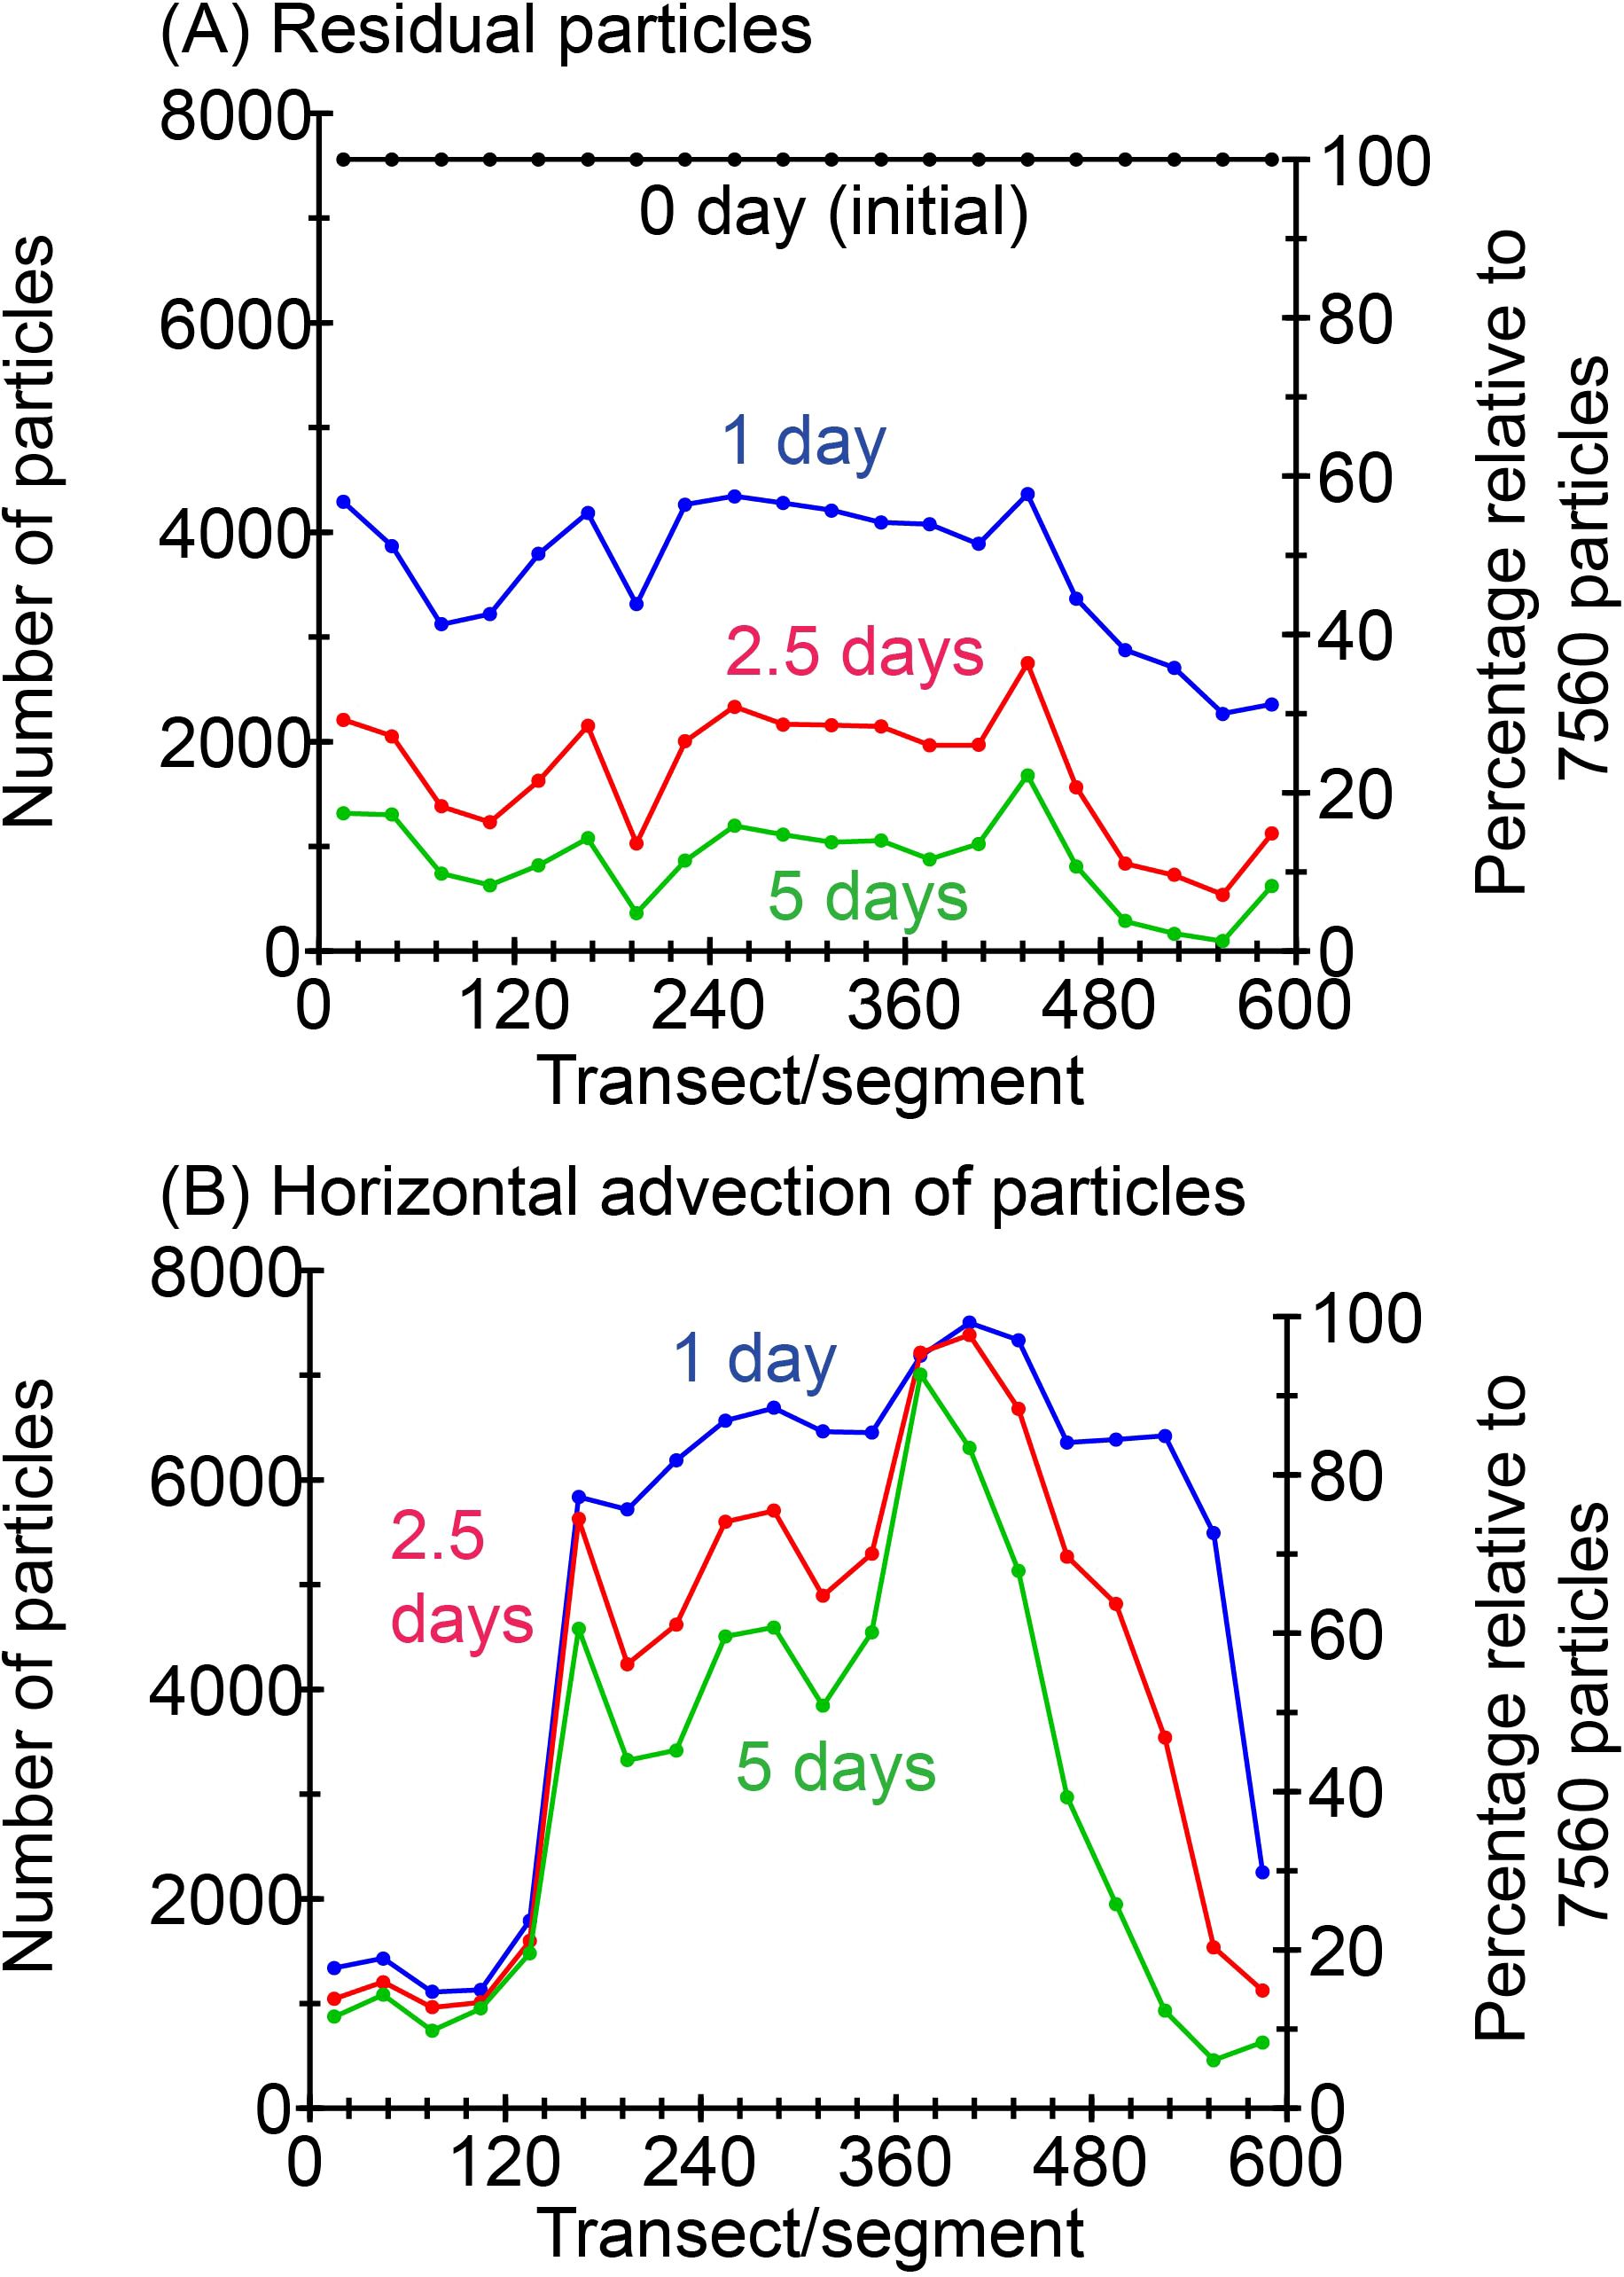
Figure 11. (A) Residual particles and (B) horizontal advection of particles for each segment averaged over 61 cases from 13 September to 12 November. For panel (B), particles that experienced temperature >18°C and salinity >33.6 are eliminated.
Figure 11B shows the horizontal advection of particles for each segment averaged over 61 cases with a different initial time from 13 September to 12 November under the condition that particles that experienced a high temperature (>18°C) or a high salinity (>33.6) were excluded (Figures 8A, B). For each tracking time, the numbers of particles in Figure 11B (i.e., advected particles) were larger than those in Figure 11A (i.e., residual particles). This pattern indicates that particles that were in a segment at an initial time were immediately transported from that segment downstream by the Coastal Oyashio; as a result, particles were sequentially supplied from upstream segments by the Coastal Oyashio, thereby compensating for the loss of original particles. In this regard, however, the number of particles in the segments east of transect 480 rapidly decreased because there were particularly stable strong westward flows (Figure 9D) and sufficient additional particles were not supplied from upstream. Moreover, particle numbers were smaller west of transect 150, where there was persistently high temperatures >18°C or high salinity >33.6 (Figures 9A, B). Horizontal advection of particles also exhibited a broad maximum in transects 150–480 (Figure 11B), which was qualitatively similar to the distribution of the Karenia spp. occurrence of long duration (black lines in Figure 6B). This similarity implies that horizontal advection by the Coastal Oyashio, which supplied Karenia spp. eliminated from the upstream shelf to the downstream shelf, contributed to the long duration of Karenia spp. blooms on the middle part of the shelf.
4 Discussion
4.1 Gaps between slow westward movement and short-term variations
The maxima and center of gravity of Karenia spp. abundances moved slowly westward with a typical velocity of about −4 cm s−1 (Figure 6C). However, these slow movements detected from Sentinel-3 data (Figures 5, 6C) with a 1-day resolution must be interpreted with care. In fact, individual maxima changed rapidly and rarely persisted for more than 2 days at the same position (Figure 5), as indicated by Figure 7B. In addition, the maximum abundances shifted both westward and eastward (Figure 12). This feature was qualitatively consistent with our finding that Karenia spp. abundance averaged by the along-shelf velocity class tended to be higher for eastward velocities, even though Karenia spp. appeared more frequently in westward flows (Figure 8D). In any case, the 1-day sampling interval of Sentinel-3 could not continuously trace the trajectory of the Karenia spp. maxima along the shelf when individual maxima moved rapidly or developed or decayed dramatically (e.g., Stumpf et al., 2008). A representative time scale for the development/decay of Karenia spp. maxima should be shorter than the 1-day sampling interval of the satellite. An example of the rapid development of Karenia spp. blooms was reported by Kuroda et al. (2022). Their study inferred that such rapid and small-scale variability of Karenia spp. abundances on the shelf could be regulated by coupled physical-biochemical processes on a submesoscale (e.g., Hernández-Carrasco et al., 2020).
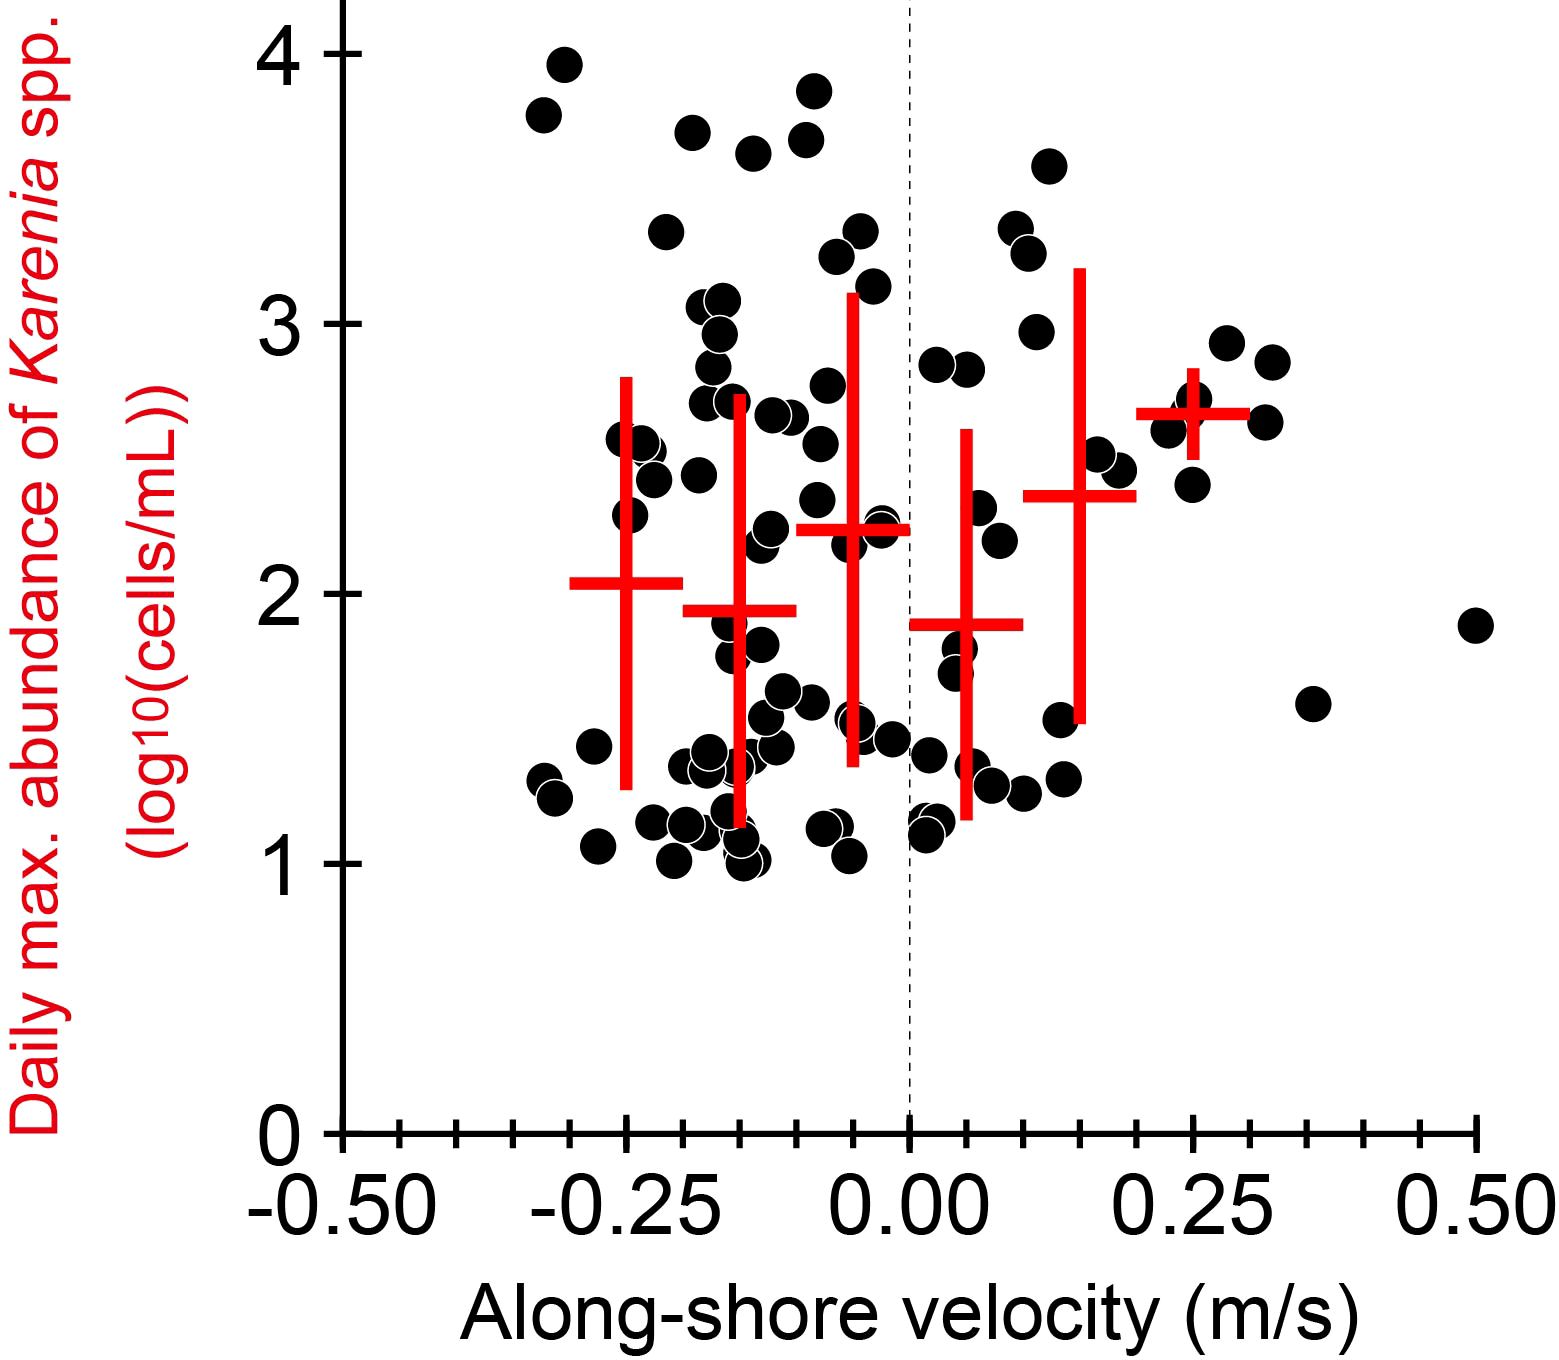
Figure 12. Scatter plots of alongshore velocity normal to cross-shelf transects versus the maximum abundance of Karenia spp. for transects 1–600 at a daily interval. Red cross indicates the class-averaged value (horizontal bar) ± 1 standard deviation (vertical bar).
We now average the alongshore current velocities (Figure 9D) over transects 50–600 from 13 September to 12 November and obtain the mean velocity of −12.2 cm s−1. It should be emphasized that the westward movement of the center of gravity and the maxima (about −4 cm s−1) was about 1/3 the current velocity (−12.2 cm s−1) averaged over transects 50–600. This indicated that the along-shelf advection by the Coastal Oyashio alone was not consistent with the speed of the westward movement. We speculate that, when biogeochemical processes are being coupled with the physical advective process and Karenia spp. abundances are subsampled at 1-day intervals, the horizontal movement speed of Karenia spp. maxima may be slower than that inferred from the physical advection. To quantitatively validate this hypothesis, numerical experiments and analyses will be most instructive when based on a three-dimensional ocean model coupled with a lower-trophic-level ecosystem model that includes K. selliformis (Takagi et al., 2022).
4.2 Particle-tracking simulation
There were limitations to our idealized particle-tracking simulation. First, we assumed a spatially homogeneous initial particle distribution over the entire focal shelf. This was not consistent with the observed data, because Karenia spp. abundances exhibited spatial heterogeneity along the shelf (Figure 5). Therefore, it may be necessary to evaluate the number of particles weighted by satellite-derived abundances. In addition, because of the assumption of a homogeneous initial particle distribution, time variations in horizontal advection of particles by the particle-tracking experiments (Supplementary Figure 4) could not quantitatively account for the observed variations of Karenia spp. abundances (e.g., the red line of Figure 6A). Secondly, there was an unrealistic condition in which particles were initially set west of Cape Erimo (point B), where Karenia spp. blooms were observed less frequently (Figure 5). Furthermore, the growth, mortality, and diel vertical migration of Karenia spp. were not incorporated into our particle-tracking simulation.
The initial homogeneous conditions and the exclusion of biological growth and mortality were needed to simply and equally evaluate the spatial distribution of residual particles for the entire focal shelf (Figure 11A). The growth, mortality, and diel vertical migration of K. selliformis have not been reported from any incubation experiments using the strain isolated from the 2021 HABs and are still uncertain. Additionally, the particles initially set on the shelf east of Cape Erimo were virtually excluded by the actual temperature (>18°C) and salinity (>33.6) conditions (Figure 11B). In contrast, our initial conditions in which particles were not placed to the east of the easternmost shelf, were less unrealistic (Figure 5).
It should be noted that the results of the particle-tracking simulation (Figure 11B) do not quantitatively account for our finding that the spatial distribution of the time-averaged abundance of Karenia spp. was highly correlated with the time-averaged alongshore velocity and stability (Figure 9D). This occurs because, in addition to the above idealizations of particle-tracking simulation, Karenia spp. abundance might be more directly regulated by the localized alongshore velocity of coastal boundary currents, rather than by the horizontal advection. Our results (Figure 9D) implied that more stagnant horizontal flows were associated with larger HABs, although the key processes were not specified. A similar result was reported in a freshwater study, which showed that intensified flow velocity, turbidity, and sheer stress restricted algal blooms (Sin and Lee, 2020; Song, 2023). Similar examples have also been found in the Seto Inland Sea of southwest Japan, where HABs historically have occurred frequently in “nada” (e.g., Imai et al., 2006), which are semi-enclosed basins with weak flows and are more stratified than straits (e.g., Takeoka, 2002). In the case of the Seto Inland Sea, however, horizontal flows seem to affect the occurrence of HABs via water exchange (e.g., Kobayashi et al., 2019), which can control eutrophication in semi-enclosed basins.
A relatively large number of particles were transported from the east to the west of Cape Erimo beyond the stable water-mass front of our particle-tracking simulation in some cases (e.g., frequently in late September, when westward flows were continuous from the vicinity of the cape to the west; Figure 10). Most of the particles were eliminated by the temperature (>18°C) and salinity (>33.6) conditions, and the number of particles west of the cape averaged over about 2 months was much smaller than east of it (Figure 11B). In fact, sporadic westward flows intruding westward from the cape occurred concurrently with drastic westward shift of the front around 25 October (green arrow in Figure 10). At the same time, Karenia spp. expanded intermittently along the shelf to the west of the cape (point B) (Figure 5A). These results indicated that expansion of Karenia spp. to the west of the cape occurred actually as a rare case. Karenia spp. abundances were also apparent along the shelf west of the cape around 5 November (Figure 5A), but drastic westward shift of the front was not identified (Figure 10). Although this case is exceptional and the reason is not specified, our study clarified that pure subtropical waters did not completely inhibit occurrence of Karenia spp., which very rarely appeared in sea surface salinity ≥ 33.6 (e.g., Figure 8B).
4.3 Study limitations and future visions
The vertical migration and distribution of Karenia spp. could influence the organisms’ horizontal advection and distribution. Vertical migration might be also affected by stratification, the vertical position of the pycnocline, and weather conditions at the sea surface (e.g., Hu et al., 2016). Weather conditions are a particular concern (e.g., Hartman et al., 2014; Li et al., 2019), because our satellite-derived abundance data had limitations due to intrinsic sampling bias—not only were the data restricted to the sea surface, but also the data quality was strongly dependent on the weather conditions. Satellite-derived abundances of Karenia spp. were obtained only under cloud-free or low-cloud conditions in the presence of sunlight on the sea surface. Therefore, our satellite-derived data were obtained less frequently under weak sunlight conditions in cloudy and rainy days. Moreover, strong winds tended to frequently occur when low-pressure systems passed through the study area, and low-pressure systems were also associated with the presence of thick clouds and therefore missing satellite-derived abundances. Hence, to examine the vertical migration of Karenia spp. in association with weather conditions, analyses of in situ observations of vertical profiles of Karenia spp. (Taniuchi et al., 2024, under review1) or experiments using cultures (e.g., Shikata, 2017; Yuasa and Shikata, 2024) would be more informative than using satellite-derived data.
Moreover, this study focused only on the sea-surface conditions of Karenia spp. and environmental variables. However, some subsurface damage has been reported in coastal fisheries, including damage to sea urchins, peanut worms, and whelks that inhabit the vicinity of the sea bottom on the shelf (HRO [Hokkaido Research Organization], 2021). Therefore, the vertical sinking processes of both Karenia spp. and the surrounding water should be examined. We have been working on particle-tracking experiments in combination with a realistic sinking velocity and a diel vertical migration of K. selliformis, as estimated by experiments using cultures. We hope to report the results of these experiments shortly.
Another limitation of this study was the in situ data availability. The satellite-derived abundances that we generated need to be further calibrated by the in situ abundances of Karenia spp. Although this study confirmed consistency with in situ maximum abundances of K. selliformis at weekly intervals along the Pacific coast of Hokkaido (Figure 4), the horizontal distribution of satellite-derived abundances, including their offshore distribution over a wide area, needs additional calibration. Despite the establishment of HAB monitoring arrangements and networks, which are poised to collect an array of in situ data in the study area, Karenia blooms have not occurred since 2022. This situation differs greatly from those in other waters (e.g., on the West Florida Shelf) where Karenia blooms occur almost annually and in situ data for calibration of satellite-derived values are more comprehensive (e.g., Hu et al., 2008; Soto et al., 2015; Hu et al., 2022). To compensate for the shortage of data availability in our area of study, an inter-regional comparative study might be helpful. For example, our satellite-derived abundances captured the spatiotemporal variability of outbreaks of K. selliformis east of the Kamchatka Peninsula in autumn 2020 (Orlova et al., 2022), and the oceanographic conditions in that area have many elements in common with those of our study region (e.g., mid-latitude, subarctic water, river discharge, and inshore area of a western boundary current) (Bondur et al., 2021). International scientific collaboration in this case would be key to compensating for the insufficient availability of in situ data.
4.4 Roles of discharge from the Tokachi River in the 2021 HABs
Two first-class rivers, Tokachi and Kushiro (Figure 1B), discharge onto the shelf between Cape Erimo and Cape Nossapu-misaki (points B and F). Annual mean discharge is about 30 and 220 m3 s−1 from the Kushiro and Tokachi rivers, respectively. In addition, because the Kushiro River passes through the Kushiro Mire (the largest mire in Japan) with a gentle river-bed slope in the downstream portion, inundation occurs in response to heavy rain and moderates peak runoff (Sakaguchi et al., 2020). Hence, the influences of river discharge on coastal waters were greater for the Tokachi River. For example, SSSs near the mouth of the Tokachi River (point C) were much lower than those near the mouth of the Kushiro River (point D) (Figure 9B).
Low-salinity waters from the Tokachi River also corresponded to the time-averaged highest abundance of Karenia spp. on the shelf between Cape Erimo and the mouth of the river (points B and C) (Figure 9B). Likewise, Bondur et al. (2021) reported that Nalycheva River runoff could have contributed to Karenia outbreaks around the east coast of Kamchatka Peninsula during autumn 2020 via supplemental land-origin nutrients. In contrast, Miyazono et al. (2023) indicated that nutrients from the Tokachi River were not enough to maintain the 2021 HABs and that oceanic nutrients were the main source, although river discharge might have affected the occurrence of the 2021 HABs. Our results suggested that discharge from the Tokachi River affected the surface mixed layer; low-salinity water from the river effectively suppressed the development of the mixed layer and maintained stratification. A Hovmöller diagram for the contribution rate of salinity to the surface mixed-layer depth (Supplementary Figure 5) revealed that the contribution rate frequently exceeded 1 after mid-October on the shelf between Cape Erimo and the mouth of the Tokachi River. This indicates the presence of vertical thermal inversion within the surface mixed layer due to strong salinity stratification. Thus, river runoff-induced strong salinity stratification might have played an important role in controlling Karenia swimming behavior, diel vertical migration, and photoadaptations for the 2021 HABs (Koizumi et al., 1996; Heil et al., 2014; Baldrich et al., 2024). Intense stratification may trap Karenia spp. into the surface water because they no longer can easily migrate across the bottom boundary of the surface mixed layer.
In terms of Karenia spp. abundance, the importance of river-runoff-induced low-salinity waters has been reported in many previous studies (e.g., Maier Brown et al., 2006; D’Silva et al., 2012; Soto et al., 2018; Medina et al., 2022; Turley et al., 2022; Phlips et al., 2023). Some studies have also reported the important roles of a coastal boundary current and its related physical dynamics, such as the role of coastal upwelling in the occurrence and horizontal advection of Karenia blooms on a shelf that faces the open ocean and has little influence from river runoff (e.g., shelf waters around Ireland) (Raine, 2014; Jordan et al., 2021). However, the contributions of the speed and stability of a coastal boundary current to Karenia spp. abundances have been scantily reported by previous studies, and here we emphasized again their importance in the eastern area of the 2021 HABs.
5 Conclusion
In late summer to autumn 2021, Karenia spp. blooms, composed mainly of K. selliformis, occurred in coastal shelf waters off the Pacific coast of Hokkaido, Japan, which faces the open ocean. Large-scale and long-term duration of Karenia spp. blooms (400 km and about 45 days at maximum, respectively) were especially characteristic. Time-averaged abundance of Karenia spp. was the highest on the shelf west of the Tokachi River to the stable water-mass front near the Cape Erimo, where low-salinity water from the river suppressed the development of the surface winter mixed layer. This might have offered favorable conditions for the growth of Karenia spp., as well as a supplemental source of land-origin nutrients.
A notable point is that Karenia spp. abundance was robustly correlated with the alongshore velocity and stability of a coastal boundary current (Coastal Oyashio) on the shelf east of the Tokachi River. More intense and stable alongshore currents were associated with less developed Karenia spp. blooms. Horizontal advection by the Coastal Oyashio, with stable and strong westward flows, also eliminated Karenia spp. from the easternmost shelf. This supply of Karenia spp. from the upstream shelf compensated for the loss of original particles downstream. The effect of horizontal advection might have contributed to the long duration of the 2021 HABs in the middle part of the shelf.
Short-term and small-scale variability was dominant for Karenia spp. abundance during their bloom period. In this regard, however, satellite data with a 1-day interval were probably insufficient to trace the trajectory and time evolution (i.e., development and decay) of Karenia spp. blooms. To compensate for this shortage of satellite measurements, numerical studies using a three-dimensional ocean model coupled with a lower-trophic-level ecosystem model need to be implemented. Moreover, measurements from aircrafts have been proposed for practical operational monitoring (Kasai and Ueno, 2023).
It remains unclear whether the 2021 HABs were a special occurrence or whether they can be more generally applicable to global coastal waters facing the open ocean. Karenia spp. blooms have not reoccurred around the study area since 2022. Nevertheless, it will be informative to continue to examine the 2021 HABs as a case study and to compare them with the other blooms in the world ocean to mitigate severe damage from Karenia spp. outbreaks in the future and protect human well-being.
Data availability statement
The raw data supporting the conclusions of this article will be made available by the authors, without undue reservation.
Author contributions
HK: Conceptualization, Data curation, Formal analysis, Methodology, Validation, Visualization, Writing – original draft, Writing – review & editing. ST: Validation, Writing – review & editing. TA: Validation, Writing – review & editing. NH: Validation, Formal analysis, Writing – review & editing.
Funding
The author(s) declare financial support was received for the research, authorship, and/or publication of this article. This work was funded by the Fisheries Resources Institute of the Japan Fisheries Research and Education Agency (no grant number) and by the Ministry of Education, Science, and Culture (KAKEN grant 22H05203).
Acknowledgments
For numerical simulation based on ocean forecast systems, we used the supercomputer of the Agriculture, Forestry and Fisheries Research Information Technology Center, Ministry of Agriculture, Forestry and Fisheries, Japan.
Conflict of interest
The authors declare that the research was conducted in the absence of any commercial or financial relationships that could be construed as a potential conflict of interest.
Publisher’s note
All claims expressed in this article are solely those of the authors and do not necessarily represent those of their affiliated organizations, or those of the publisher, the editors and the reviewers. Any product that may be evaluated in this article, or claim that may be made by its manufacturer, is not guaranteed or endorsed by the publisher.
Supplementary material
The Supplementary Material for this article can be found online at: https://www.frontiersin.org/articles/10.3389/fmars.2024.1452762/full#supplementary-material
Footnotes
- ^ Taniuchi, Y., Kodama, T., and Okumura, Y. (2024). Possibility of identification of spatiotemporal variations of the phytoplankton community and Karenia blooms using an in-situ multi-wavelength excitation fluorometer. Japan Jpn. Agr. Res. Quart. submitted.
References
Baldrich Á.M., Díaz P. A., Rosales S. A., Rodríguez-Villegas C., Álvarez G., Pérez-Santos I., et al. (2024). An unprecedented bloom of oceanic dinoflagellates (Karenia spp.) inside a fjord within a highly dynamic multifrontal ecosystem in Chilean Patagonia. Toxins 16, 77. doi: 10.3390/toxins16020077
Bondur V., Zamshin V., Chvertkova O., Matrosova E., Khodaeva V. (2021). Detection and analysis of the causes of intensive harmful algal bloom in Kamchatka based on satellite data. J. Mar. Sci. Eng. 9, 1092. doi: 10.3390/jmse9101092
D’Silva M. S., Anil A. C., Naik R. K., D’Costa P. M. (2012). Algal blooms: a perspective from the coasts of India. Nat. Hazards 63, 1225–1253. doi: 10.1007/s11069-012-0190-9
Frölicher T. L., Laufkötter C. (2018). Emerging risks from marine heat waves. Nat. Commun. 9, 650. doi: 10.1038/s41467-018-03163-6
Hartman S. E., Hartman M. C., Hydes D. J., Smythe-Wright D., Gohn F., Lazure P. (2014). The role of hydrographic parameters, measured from a ship of opportunity, in bloom formation of Karenia mikimotoi in the English Channel. J. Mar. Sys. 140, 39–49. doi: 10.1016/j.jmarsys.2014.07.001
Hasegawa N., Watanabe T., Unuma T., Yokota T., Izumida D., Nakagawa T., et al. (2022). Repeated reaching of the harmful algal bloom of Karenia spp. around the Pacific shoreline of Kushiro, eastern Hokkaido, Japan, during autumn 2021. Fish. Sci. 88, 787–803. doi: 10.1007/s12562-022-01642-w
Heil C. A., Bronk D. A., Mulholland M. R., O’Neil J. M., Bernhardt P. W., Murasko S., et al. (2014). Influence of daylight surface aggregation behavior on nutrient cycling during a Karenia brevis (Davis) G. Hansen & Ø. Moestrup bloom: Migration to the surface as a nutrient acquisition strategy. Harmful Algae 38, 86–94. doi: 10.1016/j.hal.2014.06.001
Hernández-Carrasco I., Alou-Font E., Dumont P.-A., Cabornero A., Allen J., Orfila A. (2020). Lagrangian flow effects on phytoplankton abundance and composition along filament-like structures. Prog. Oceanogr. 189, 102469. doi: 10.1016/j.pocean.2020.102469
Higashi H., Nakada S. (2022). Specificity of ocean current and water mass off the eastern Hokkaido, Japan, in the summer and autumn 2021 when the harmful algal bloom occurred. J. JSCE Ser. B2 (Coast. Eng.) 78, I_823–I_828. doi: 10.2208/kaigan.78.2_I_823
Hobday A. J., Alexander L. V., Perkins S. E., Smale D. A., Straub S. C., Oliver E. C., et al. (2016). A hierarchical approach to defining marine heatwaves. Prog. Oceanogr. 141, 227–238. doi: 10.1016/j.pocean.2015.12.014
Hokkaido prefecture (2023). Information of redtide. Available online at: https://www.pref.hokkaido.lg.jp/sr/sky/akashio_info.html (Accessed June 16, 2024).
HRO [Hokkaido Research Organization] (2021). Pilot studies now 943. Available online at: https://www.hro.or.jp/upload/31617/ima943.pdf (Accessed April 26, 2024).
Hu C., Barnes B. B., Qi L., Lembke C., English D. (2016). Vertical migration of Karenia brevis in the northeastern Gulf of Mexico observed from glider measurements. Harmful Algae 58, 59–65. doi: 10.1016/j.hal.2016.07.005
Hu C., Luerssen R., Muller-Karger F. E., Carder K. L., Heil C. A. (2008). On the remote monitoring of Karenia brevis blooms of the west Florida shelf. Cont. Shelf Res. 28, 159–176. doi: 10.1016/j.csr.2007.04.014
Hu C., Yao Y., Cannizzaro J. P., Garrett M., Harper M., Markley L., et al. (2022). Karenia brevis bloom patterns on the west Florida shelf between 2003 and 2019: Integration of field and satellite observations. Harmful Algae 117, 102289. doi: 10.1016/j.hal.2022.102289
Imai I., Yamaguchi M., Hori Y. (2006). Eutrophication and occurrences of harmful algal blooms in the Seto Inland Sea, Japan. Plankton Benthos Res. 1, 71–84. doi: 10.3800/pbr.1.71
IPCC [Intergovernmental Panel on Climate Change] (2019). IPCC Special Report on the Ocean and Cryosphere in a Changing Climate. (Geneva, Switzerland: IPCC). Available online at: https://www.ipcc.ch/srocc (Accessed December 12, 2021).
Iwataki M., Lum W. M., Kuwata K., Takahashi K., Arima D., Kuribayashi T., et al. (2022). Morphological variation and phylogeny of Karenia selliformis (Gymnodiniales, Dinophyceae) in an intensive cold-water algal bloom in eastern Hokkaido, Japan in September–November 2021. Harmful algae 114, 102204. doi: 10.1016/j.hal.2022.102204
Jordan C., Cusack C., Tomlinson M. C., Meredith A., McGeady R., Salas R., et al. (2021). Using the red band difference algorithm to detect and monitor a Karenia spp. bloom off the south coast of Ireland, June 2019. Front. Mar. Sci. 8. doi: 10.3389/fmars.2021.638889
Kasai A., Ueno H. (2023). Summary of 51st symposium on the subarctic fisheries and oceanography “Dynamics of red tide around Hokkaido. Bull. Jpn. Soc Fish. Oceanogr. 87, 38–39.
Kobayashi S., Nakada S., Futamura A., Nagamoto K., Fujiwara T. (2019). Observation and modeling of seawater exchange in a strait-basin system in the Seto Inland Sea, Japan. J. Water Environ. Tech. 17, 141–152. doi: 10.2965/jwet.18-042
Koizumi Y., Uchida T., Honjo T. (1996). Diurnal vertical migration of Gymnodinium mikimotoi during a red tide in Hoketsu Bay, Japan. J. Plankton Res. 18, 289–294. doi: 10.1093/plankt/18.2.289
Kuroda H. (2023). History, current status, and future vision of particle-tracking simulation applied to marine biology, fisheries science, and ecological engineering around Japan. Fish. Sci. 89, 129–146. doi: 10.1007/s12562-023-01673-x
Kuroda H., Azumaya T., Setou T., Hasegawa N. (2021a). Unprecedented outbreak of harmful algae in Pacific coastal waters off southeast Hokkaido, Japan, during late summer 2021 after record-breaking marine heatwaves. J. Mar. Sci. Eng. 9, 1335. doi: 10.3390/jmse9121335
Kuroda H., Setou T. (2021). Extensive marine heatwaves at the sea surface in the northwestern Pacific Ocean in summer 2021. Remote Sens. 13, 3989. doi: 10.3390/rs13193989
Kuroda H., Setou T., Kakehi S., Ito S., Taneda T., Azumaya T., et al. (2017). Recent advances in Japanese fisheries science in the Kuroshio-Oyashio region through development of the FRA-ROMS ocean forecast system: overview of the reproducibility of reanalysis products. Open J. Mar. Sci. 7, 62–90. doi: 10.4236/ojms.2017.71006
Kuroda H., Tanaka T., Ito S., Setou T. (2021c). Numerical study of diurnal tidal currents on the Pacific shelf off the southern coast of Hokkaido, Japan. Cont. Shelf Res. 230, 104568. doi: 10.1016/j.csr.2021.104568
Kuroda H., Taniuchi Y., Kasai H., Nakanowatari T., Setou T. (2021b). Co-occurrence of marine extremes induced by tropical storms and an ocean eddy in summer 2016: Anomalous hydrographic conditions in the Pacific shelf waters off southeast Hokkaido, Japan. Atmosphere 12, 888. doi: 10.3390/atmos12070888
Kuroda H., Taniuchi Y., Watanabe T., Azumaya T., Hasegawa N. (2022). Distribution of harmful algae (Karenia spp.) in October 2021 off southeast Hokkaido, Japan. Front. Mar. Sci. 9. doi: 10.3389/fmars.2022.841364
Li X., Yan T., Yu R., Zhou M. (2019). A review of karenia mikimotoi: Bloom events, physiology, toxicity and toxic mechanism. Harmful Algae 90, 101702. doi: 10.1016/j.hal.2019.101702
Maier Brown A. F., Dortch Q., Van Dolah F. M., Leighfield T. A., Morrison W., Thessen A. E., et al. (2006). Effect of salinity on the distribution, growth, and toxicity of Karenia spp. Harmful Algae 5, 199–212. doi: 10.1016/j.hal.2005.07.004
Medina M., Kaplan D., Milbrandt E. C., Tomasko D., Huffaker R., Angelini C. (2022). Nitrogen-enriched discharges from a highly managed watershed intensify red tide (Karenia brevis) blooms in southwest Florida. Sci. Total Environ. 827, 154149. doi: 10.1016/j.scitotenv.2022.154149
Miyazono A., Takashima T., Nishida Y., Arima D., Yasunaga T., Inagawa R., et al. (2023). Large-scale harmful red tide in Hokkaido in autumn 2021 –Its damage, generation process and characteristics– Monthly Kaiyo. Monthly Kaiyo. 55, 514–521.
North E. W., Schlag Z., Hood R. R., Li M., Zhong L., Gross T., et al. (2008). Vertical swimming behavior influences the dispersal of simulated oyster larvae in a coupled particle-tracking and hydrodynamic model of Chesapeake Bay. Mar. Ecol. Prog. Ser. 359, 99–115. doi: 10.3354/meps07317
Oliver E. C., Burrows M. T., Donat M. G., Sen Gupta A., Alexander L. V., Perkins-Kirkpatrick S. E., et al. (2019). Projected marine heatwaves in the 21st century and the potential for ecological impact. Front. Mar. Sci. 6. doi: 10.3389/fmars.2019.00734
Oliver E. C., Donat M. G., Burrows M. T., Moore P. J., Smale D. A., Alexander L. V., et al. (2018). Longer and more frequent marine heatwaves over the past century. Nat. Commun. 9, 1–12. doi: 10.1038/s41467-018-03732-9
Orlova T. Y., Aleksanin A. I., Lepskaya E. V., Efimova K. V., Selina M. S., Morozova T. V., et al. (2022). A massive bloom of Karenia species (Dinophyceae) off the Kamchatka coast, Russia, in the fall of 2020. Harmful Algae 120, 102337. doi: 10.1016/j.hal.2022.102337
Phlips E. J., Badylak S., Mathews A. L., Milbrandt E. C., Montefiore L. R., Morrison E. S., et al. (2023). Algal blooms in a river-dominated estuary and nearshore region of Florida, USA: the influence of regulated discharges from water control structures on hydrologic and nutrient conditions. Hydrobiologia 850, 4385–4411. doi: 10.1007/s10750-022-05135-w
Raine R. (2014). A review of the biophysical interactions relevant to the promotion of HABs in stratified systems: The case study of Ireland. Deep-Sea Res. Part-II 101, 21–31. doi: 10.1016/j.dsr2.2013.06.021
Roberts S. D., Van Ruth P. D., Wilkinson C., Bastianello S. S., Bansemer M. S. (2019). Marine heatwave, harmful algae blooms and an extensive fish kill event during 2013 in south Australia. Front. Mar. Sci. 6. doi: 10.3389/fmars.2019.00610
Ryan J. P., Kudela R. M., Birch J. M., Blum M., Bowers H. A., Chavez F. P., et al. (2017). Causality of an extreme harmful algal bloom in Monterey Bay, California, during the 2014–2016 northeast Pacific warm anomaly. Geophys. Res. Lett. 44, 5571–5579. doi: 10.1002/2017GL072637
Sakaguchi S., Nakayama K., Kobayashi K., Komai K. (2020). Inundation analysis using coupling storage function model with a distributed hydrological model in Kushiro marsh, Japan. Hydrol. Res. Lett. 14, 75–80. doi: 10.3178/hrl.14.75
Shikata T. (2017). Effects of light on diurnal vertical migration in the red-tide flagellates. Bull. Plankton Soc Japan 64, 56–60. doi: 10.24763/bpsj.64.1_56
Shikata T., Onitsuka G., Abe K., Kitatsuji S., Yufu K., Yoshikawa Y., et al. (2016). Relationships between light environment and subsurface accumulation during the daytime in the red-tide dinoflagellate Karenia mikimotoi. Mar. Biol. 164, 18. doi: 10.1007/s00227-016-3042-4
Sin Y., Lee H. (2020). Changes in hydrology, water quality, and algal blooms in a freshwater system impounded with engineered structures in a temperate monsoon river estuary. J. Hydrology: Reg. Stud. 32, 100744. doi: 10.1016/j.ejrh.2020.100744
Smith M. E., Bernard S. (2020). Satellite ocean color based harmful algal bloom indicators for aquaculture decision support in the southern Benguela. Front. Mar. Sci. 7. doi: 10.3389/fmars.2020.00061
Smith K. E., Burrows M. T., Hobday A. J., Gupta A. S., Moore P. J., Thomsen M., et al. (2021). Socioeconomic impacts of marine heatwaves: Global issues and opportunities. Science 374, eabj3593. doi: 10.1126/science.abj3593
Song Y. (2023). Hydrodynamic impacts on algal blooms in reservoirs and bloom mitigation using reservoir operation strategies: A review. J. Hydrology 620, 129375. doi: 10.1016/j.jhydrol.2023.129375
Soto I. M., Cambazoglu M. K., Boyette A. D., Broussard K., Sheehan D., Howden S. D., et al. (2018). Advection of Karenia brevis blooms from the Florida Panhandle towards Mississippi coastal waters. Harmful Algae 72, 46–64. doi: 10.1016/j.hal.2017.12.008
Soto I. M., Cannizzaro J., Muller-Karger F. E., Hu C., Wolny J., Goldgof D. (2015). Evaluation and optimization of remote sensing techniques for detection of Karenia brevis blooms on the West Florida Shelf. Remote Sens. Environ. 170, 239–254. doi: 10.1016/j.rse.2015.09.026
Stumpf R. P., Litaker R. W., Lanerolle L., Tester P. A. (2008). Hydrodynamic accumulation of Karenia off the west coast of Florida. Cont. Shelf Res. 28, 189–213. doi: 10.1016/j.csr.2007.04.017
Takagi S., Kuroda H., Hasegawa N., Watanabe T., Unuma T., Taniuchi Y., et al. (2022). Controlling factors of large-scale harmful algal blooms with Karenia selliformis after record-breaking marine heatwaves. Front. Mar. Sci. 9. doi: 10.3389/fmars.2022.939393
Takeoka H. (2002). Progress in Seto Inland Sea research. J. Oceanogr. 58, 93–107. doi: 10.1023/A:1015828818202
Taniuchi Y., Watanabe T., Azumaya T., Takagi S., Kasai H., Nakanowatari T., et al. (2023). Drastic changes in a lower-trophic-level ecosystem attributed to unprecedented harmful algal outbreaks in 2021 on the Pacific shelf off southeast Hokkaido, Japan. Cont. Self Res. 267, 105114. doi: 10.1016/j.csr.2023.105114
Trainer V. L., Moore S. K., Hallegraeff G., Kudela R. M., Clement A., Mardones J. I., et al. (2019). Pelagic harmful algal blooms and climate change: lessons from nature’s experiments with extremes. Harmful Algae 91, 101591. doi: 10.1016/j.hal.2019.03.009
Turley B. D., Karnauskas M., Campbell M. D., Hanisko D. S., Kelble C. R. (2022). Relationships between blooms of Karenia brevis and hypoxia across the West Florida Shelf. Harmful Algae 114, 102223. doi: 10.1016/j.hal.2022.102223
Xing X. G., Zhao D. Z., Liu Y. G., Yang J. H., Xiu P., Wang L. (2007). An overview of remote sensing of chlorophyll fluorescence. Ocean Sci. J. 42, 49–59. doi: 10.1007/BF03020910
Yamaguchi A., Hamao Y., Matsuno K., Iida T. (2022). Horizontal distribution of harmful red-tide Karenia selliformis and phytoplankton community along the Pacific coast of Hokkaido in autumn 2021. Bull. Jpn. Soc Fish. Oceanogr. 86, 41–49. doi: 10.34423/jsfo.86.2_41
Keywords: harmful algal bloom, Karenia spp., Sentinel-3, coastal boundary current, horizontal advection
Citation: Kuroda H, Takagi S, Azumaya T and Hasegawa N (2024) Spatiotemporal variability of satellite-derived abundance of Karenia spp. during 2021 in shelf waters along the Pacific coast of Hokkaido, Japan. Front. Mar. Sci. 11:1452762. doi: 10.3389/fmars.2024.1452762
Received: 21 June 2024; Accepted: 18 September 2024;
Published: 07 October 2024.
Edited by:
Qinsheng Wei, Ministry of Natural Resources, ChinaReviewed by:
Peter Leslie Croot, University of Galway, IrelandJennifer L. Wolny, United States Food and Drug Administration, United States
Copyright © 2024 Kuroda, Takagi, Azumaya and Hasegawa. This is an open-access article distributed under the terms of the Creative Commons Attribution License (CC BY). The use, distribution or reproduction in other forums is permitted, provided the original author(s) and the copyright owner(s) are credited and that the original publication in this journal is cited, in accordance with accepted academic practice. No use, distribution or reproduction is permitted which does not comply with these terms.
*Correspondence: Hiroshi Kuroda, a3Vyb2NhbkBhZmZyYy5nby5qcA==; a3Vyb2RhX2hpcm9zaGkyM0BmcmEuZ28uanA=
 Hiroshi Kuroda
 Satomi Takagi
 Tomonori Azumaya