 Wenxiang Ding
 Qiong Wu
 Yongxin Chen
- Marine Science and Technology College, Zhejiang Ocean University, Zhoushan, China
The increasing ocean warming due to climate change significantly threatens regional marine ecosystems by raising the frequency and severity of extreme temperature events. This study examines patterns and trends of maximum annual sea surface temperature (Tmax) in the Eastern China Seas from 1985 to 2022. The results show a significant warming trend in Tmax, exceeding the global average, with notable differences between southern and northern regions. The northern Tmax warming rate is faster, with occurrence times significantly advancing, while the southern Tmax warming rate is slower, with occurrence times significantly delayed. The southern Tmax and its timing are closely correlated with the annual maximum air temperature and its timing. In the north, Tmax timing is influenced by latent heat flux (QLH); a significant increase in August QLH inhibits the continued rise of SST, causing Tmax to advance. The study also highlights a significant increase in marine heatwaves at Tmax timing, with higher Tmax indicating a higher occurrence probability. By elucidating these Tmax trends and dynamics, our study enhances understanding of regional climate impacts, supporting targeted conservation efforts and adaptive ecosystem management strategies in the Eastern China Seas.
Highlights
● The Eastern China Seas show significant warming trends in Tmax, with higher warming rates observed in the northern region.
● The Tmax timing in the northern regions significantly advances, while in the southern regions, it notably delays.
● In the northern region, Tmax occurs notably earlier due to increased QLH in August.
1 Introduction
The intensification of ocean warming due to climate change has become a significant concern worldwide because of its profound implications for marine ecosystems and coastal communities (Bronselaer and Zanna, 2020; Lyu et al., 2021). Sea surface temperature (SST) is a key indicator of ocean warming, showing how the surface ocean responds to atmospheric heating (Cai et al., 2018; Zhang et al., 2023). In recent decades, many studies have documented global SST warming trends, with some regions warming faster than the global average (Cai et al., 2017; Tang et al., 2020; Wang et al., 2023). Analyzing regional SST warming is crucial for understanding the local impacts of climate change on marine ecosystems and coastal communities. The frequency of extreme heat events has significantly increased (Schlegel et al., 2017; Lee et al., 2023), greatly affecting biodiversity and marine ecosystems (Schlegel et al., 2017; Hayashida et al., 2020). Most previous studies have focused on mean SST when examining warming trends or extreme events (Wu et al., 2012; Bao and Ren, 2014; Cai et al., 2017), but maximum annual SST (Tmax) is also important. Tmax can be more relevant for certain studies, such as thermal collapse, where organisms are affected by the maximum temperature they experience rather than the mean temperature (Chaidez et al., 2017). Understanding the patterns and trends of Tmax is essential for studying the impacts of ocean warming on regional marine environments and ecosystems.
SST is influenced by various physical mechanisms, ranging from local phenomena to remote sources, alongside the long-term trends linked to human activities (Holbrook et al., 2019; Oliver et al., 2021; Tan et al., 2023). Local atmospheric and oceanic dynamics that contribute to extreme SST events include increased solar radiation due to reduced cloud cover, greater horizontal advection of warm water, decreased vertical mixing due to stronger stratification, and reduced release of latent and sensible heat from the ocean (Holbrook et al., 2019, 2020). These physical processes, whether acting individually or together, are often affected by large-scale climate phenomena like the El Niño-Southern Oscillation (ENSO) and the Indian Ocean Dipole (IOD) (Holbrook et al., 2019; Xiao et al., 2020). Overall, the mechanisms affecting extreme SST are varied and specific to different regions. Tmax serves as a crucial metric for evaluating extreme temperature occurrences, with significant implications for marine biodiversity, fisheries, and ecosystem dynamics. Given the distinct driving factors of Tmax in different marine regions, detailed studies are necessary.
The Eastern China Seas (Figure 1), consisting mainly of the Bohai Sea, Yellow Sea and East China Sea, are located to the east of China and in the northwest Pacific Ocean, represent a crucial region characterized by diverse ecosystems and significant socio-economic activities with a wide continental shelf (< 200 m depth) and a dynamic hydrological environment (Cai et al., 2017; Yang et al., 2017; Guo et al., 2023). There are areas with complex ocean circulation patterns (Figure 1B). Major summer currents include the Taiwan Strait Current, Taiwan Warm Current, Kuroshio Current, Yangtze Diluted Water, Bohai Coastal Current, Yellow Sea Coastal Current, West Korea Coastal Current, and Tsushima Warm Current (Guo et al., 2023). The hydrography of the Eastern China Seas is influenced by various natural elements, such as surface winds, SST, ocean stratification, surface currents (Liu et al., 2021; Guo et al., 2023). Additionally, the region is impacted by large-scale climate phenomena such as ENSO, which have been observed to influence both oceanic and atmospheric dynamics in this area (Liu et al., 2013; Tan and Cai, 2018; Sun et al., 2019; Wang et al., 2020b). Many studies have consistently reported a significant warming trend in SST within the Eastern China Seas (i.e., 0.10-0.14°C decade-1 during 1950-2021, 0.14-0.16°C decade-1 during 1982-2021, Wang et al., 2023; 0.15°C decade-1 in summer during 1958-2014, Cai et al., 2016, 2017), with the warming rate exceeding the global average (Cai et al., 2017; Tang et al., 2020; Wang et al., 2023).
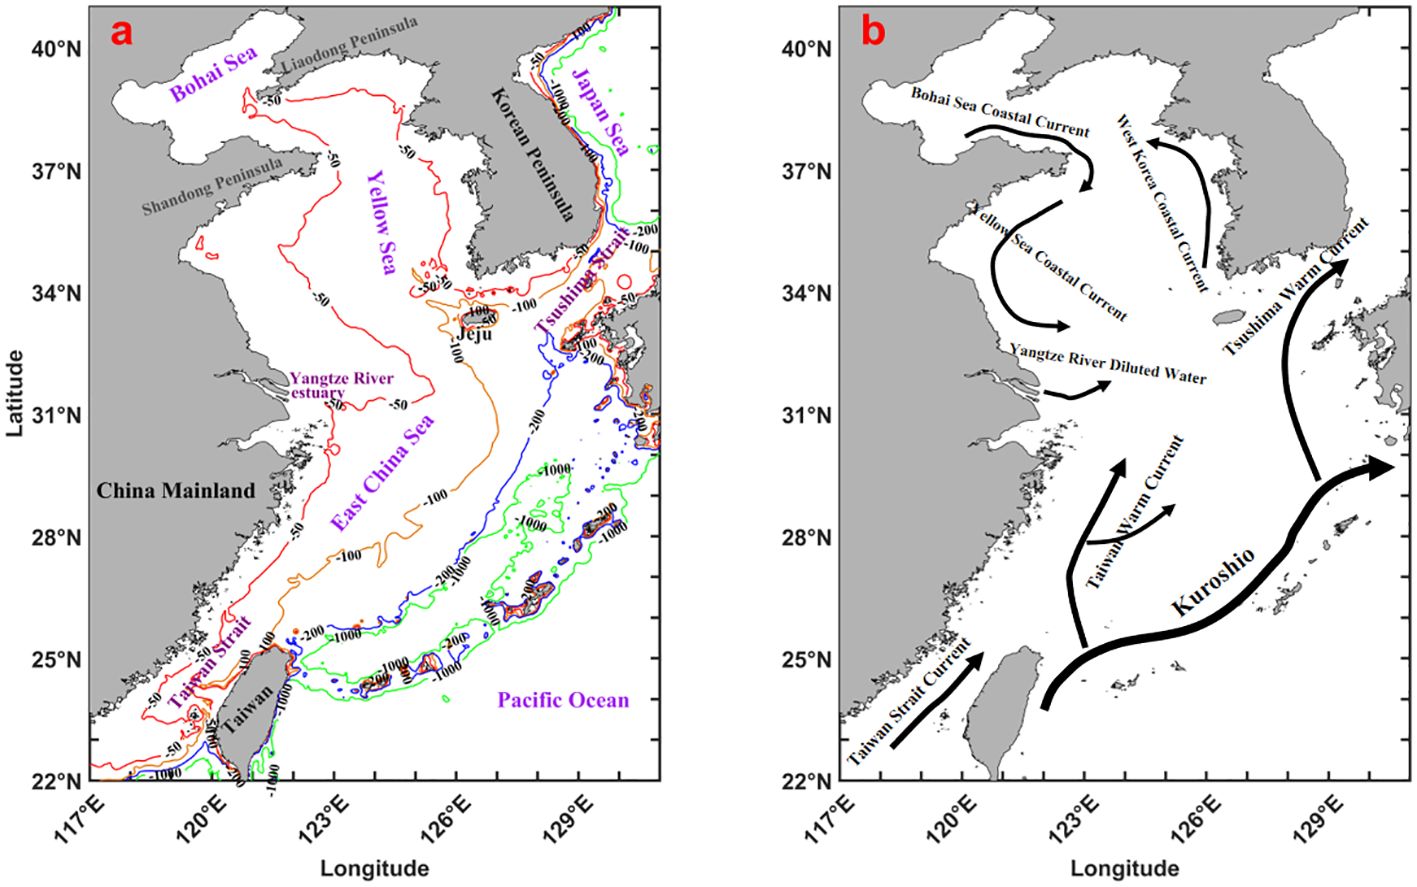
Figure 1. (A) Map and bathymetry of the Eastern China Seas. (B) Schematic plot of the circulation of the Eastern China Seas in summer.
In previous studies on the warming trends of SST in the Eastern China Seas, the emphasis has mainly been on mean SST trends (Cai et al., 2017; Wang et al., 2023). However, there remain some deficiencies in understanding regarding the trends in Tmax, particularly in comparison to mean SST trends. The Eastern China Seas are rich in fisheries resources (Hu and Wang, 2016; Yin et al., 2022), and Tmax has significant impacts on fisheries resources and the ecological environment (Chaidez et al., 2017). This necessitates a detailed analysis to understand the specific drivers and dynamics of Tmax warming in this region. This study aims to comprehensively analyze the patterns and trends of Tmax in the Eastern China Seas over a period from 1985 to 2022. This research seeks to delineate the spatial distribution of Tmax, examine its interannual variability, and investigate its correlations with local and remote factors. Analyzing the trends in Tmax and its primary influencing factors can provide theoretical support for the subsequent prediction and early warning of extreme temperatures. This holds significant implications for the conservation of the regional ecological environment and offers a new perspective for studying the regional oceanic response to global warming. Our study will contribute to guiding specific conservation initiatives and adaptive management strategies for ecosystems in the Eastern China Seas.
2 Materials and methods
2.1 Data
In this study, the Operational Sea Surface Temperature and Sea Ice Analysis (OSTIA) SST products with a 0.05° resolution, covering the 1985-2022 period in the Eastern China Seas, were downloaded from the Europe Copernicus program (http://marine.copernicus.eu). The cloud-free, global SST product provided by the global ocean data assimilation experiment High-Resolution SST Pilot Project (GHRSST-PP) merges OSTIA SST data from multi-sensor satellite remote sensing observations (Donlon et al., 2012). This has been previously validated against in situ observations within the study area, showing strong agreement with a correlation coefficient of 0.94 and a slight bias of 0.12°C, confirming its reliability and accuracy in local conditions and outperforming other SST products (Wang et al., 2020a).
Daily National Centers for Environmental Prediction (NCEP) meteorological products for 1985-2022 were obtained from the Asia-Pacific Data-Research Center (http://apdrc.soest.hawaii.edu/data/data.php). The collected parameters are air temperature at 2 m and latent heat flux (QLH). NCEP is a third-generation global coupling seasonal forecast reanalysis data with a spatial resolution of 0.3125° (~38 km). It adopted advanced global data assimilation system and database, carried out quality control and assimilation processing of observation data from various sources (ship, aircraft, satellite, etc.), and obtained a set of reanalysis data (He and Zhao, 2018; Zhu et al., 2021). NCEP’s daily meteorological products are widely used by meteorologists, climate scientists, and researchers for studying weather patterns, climate variability, and long-term climate trends (He and Zhao, 2018). Their accuracy and reliability make them invaluable tools for understanding and predicting weather phenomena on regional and global scales (He and Zhao, 2018; Zhu et al., 2021).
The numerical values of the Multivariate ENSO (El Niño/Southern Oscillation) Index Version 2 (MEI) were obtained from the Physical Sciences Division (PSD) of the Earth System Research Laboratory, part of the National Oceanic and Atmospheric Administration (NOAA) (https://psl.noaa.gov/enso/mei/). Negative MEI values indicate the cold ENSO phase (La Niña), whereas positive MEI values indicate the warm ENSO phase (El Niño; Wolter and Timlin, 1998).
In our analysis, several assumptions were made to ensure the robustness and validity of the results. We assumed that the data from different sources, such as the OSTIA and NCEP datasets, are homogeneous and compatible for combined analysis. This assumption is based on the standardization procedures and calibration techniques employed by these data providers, ensuring that their datasets are consistent over the study period. For missing data points, we employed a linear interpolation method, assuming that the changes between observed values are linear. This approach is commonly used in climatological studies and helps in maintaining the continuity of the time series (Sattari et al., 2017). We assumed that the underlying statistical properties of the climate variables, such as the mean and variance, remain constant over the period of study. This assumption is crucial for the validity of trend analysis and is typically justified in climatological studies over decadal timescales. These assumptions were carefully considered and tested to minimize potential biases in our analysis.
2.2 The calculation of annual maximum SST and decadal trends
The SST in the Eastern China Seas exhibits seasonal characteristics, with the highest SST typically occurring in summer (Si et al., 2016). The specific day when SST reaches its peak in summer is varies. We extracted the SST time series for each pixel annually and smoothed with a 31-day moving average. Following the method illustrated in Figure 2 (where the maximum value in the time series is designated as Tmax, and its corresponding time is Tmax timing), we identified the Tmax and Tmax timing for each pixel each year. We examined the potential autocorrelation in Tmax and Tmax timing across different years and found no evidence of autocorrelation among a sample of pixels. This suggests that the Tmax and Tmax timing in any given year is independent of the Tmax and Tmax timing in preceding years. The decadal trends of Tmax and Tmax timing were estimated by fitting a linear regression relating Tmax and Tmax timing to year for each of the pixel’s yearly time series. The slopes of the fitted linear regressions provide an estimate of the rates of change for each pixel (units: °C decade-1 for Tmax, and days decade-1 for Tmax timing). To assess whether there were significant trends in the Tmax and Tmax timing time series, we calculated the Pearson correlation coefficient (r) between the original values and the values obtained from linear regression. A t-test coefficient p can be calculated to determine the significance level. A significant trend in the time series is considered to exist when p<0.05. We also utilized the r to measure the linear relationship between two continuous variables, which ranges from -1 to 1. A correlation coefficient of 1 indicates a perfect positive correlation, -1 indicates a perfect negative correlation, and 0 indicates no linear relationship. Similarly, significance levels are determined using a t-test, where p<0.05 indicates a significant correlation.
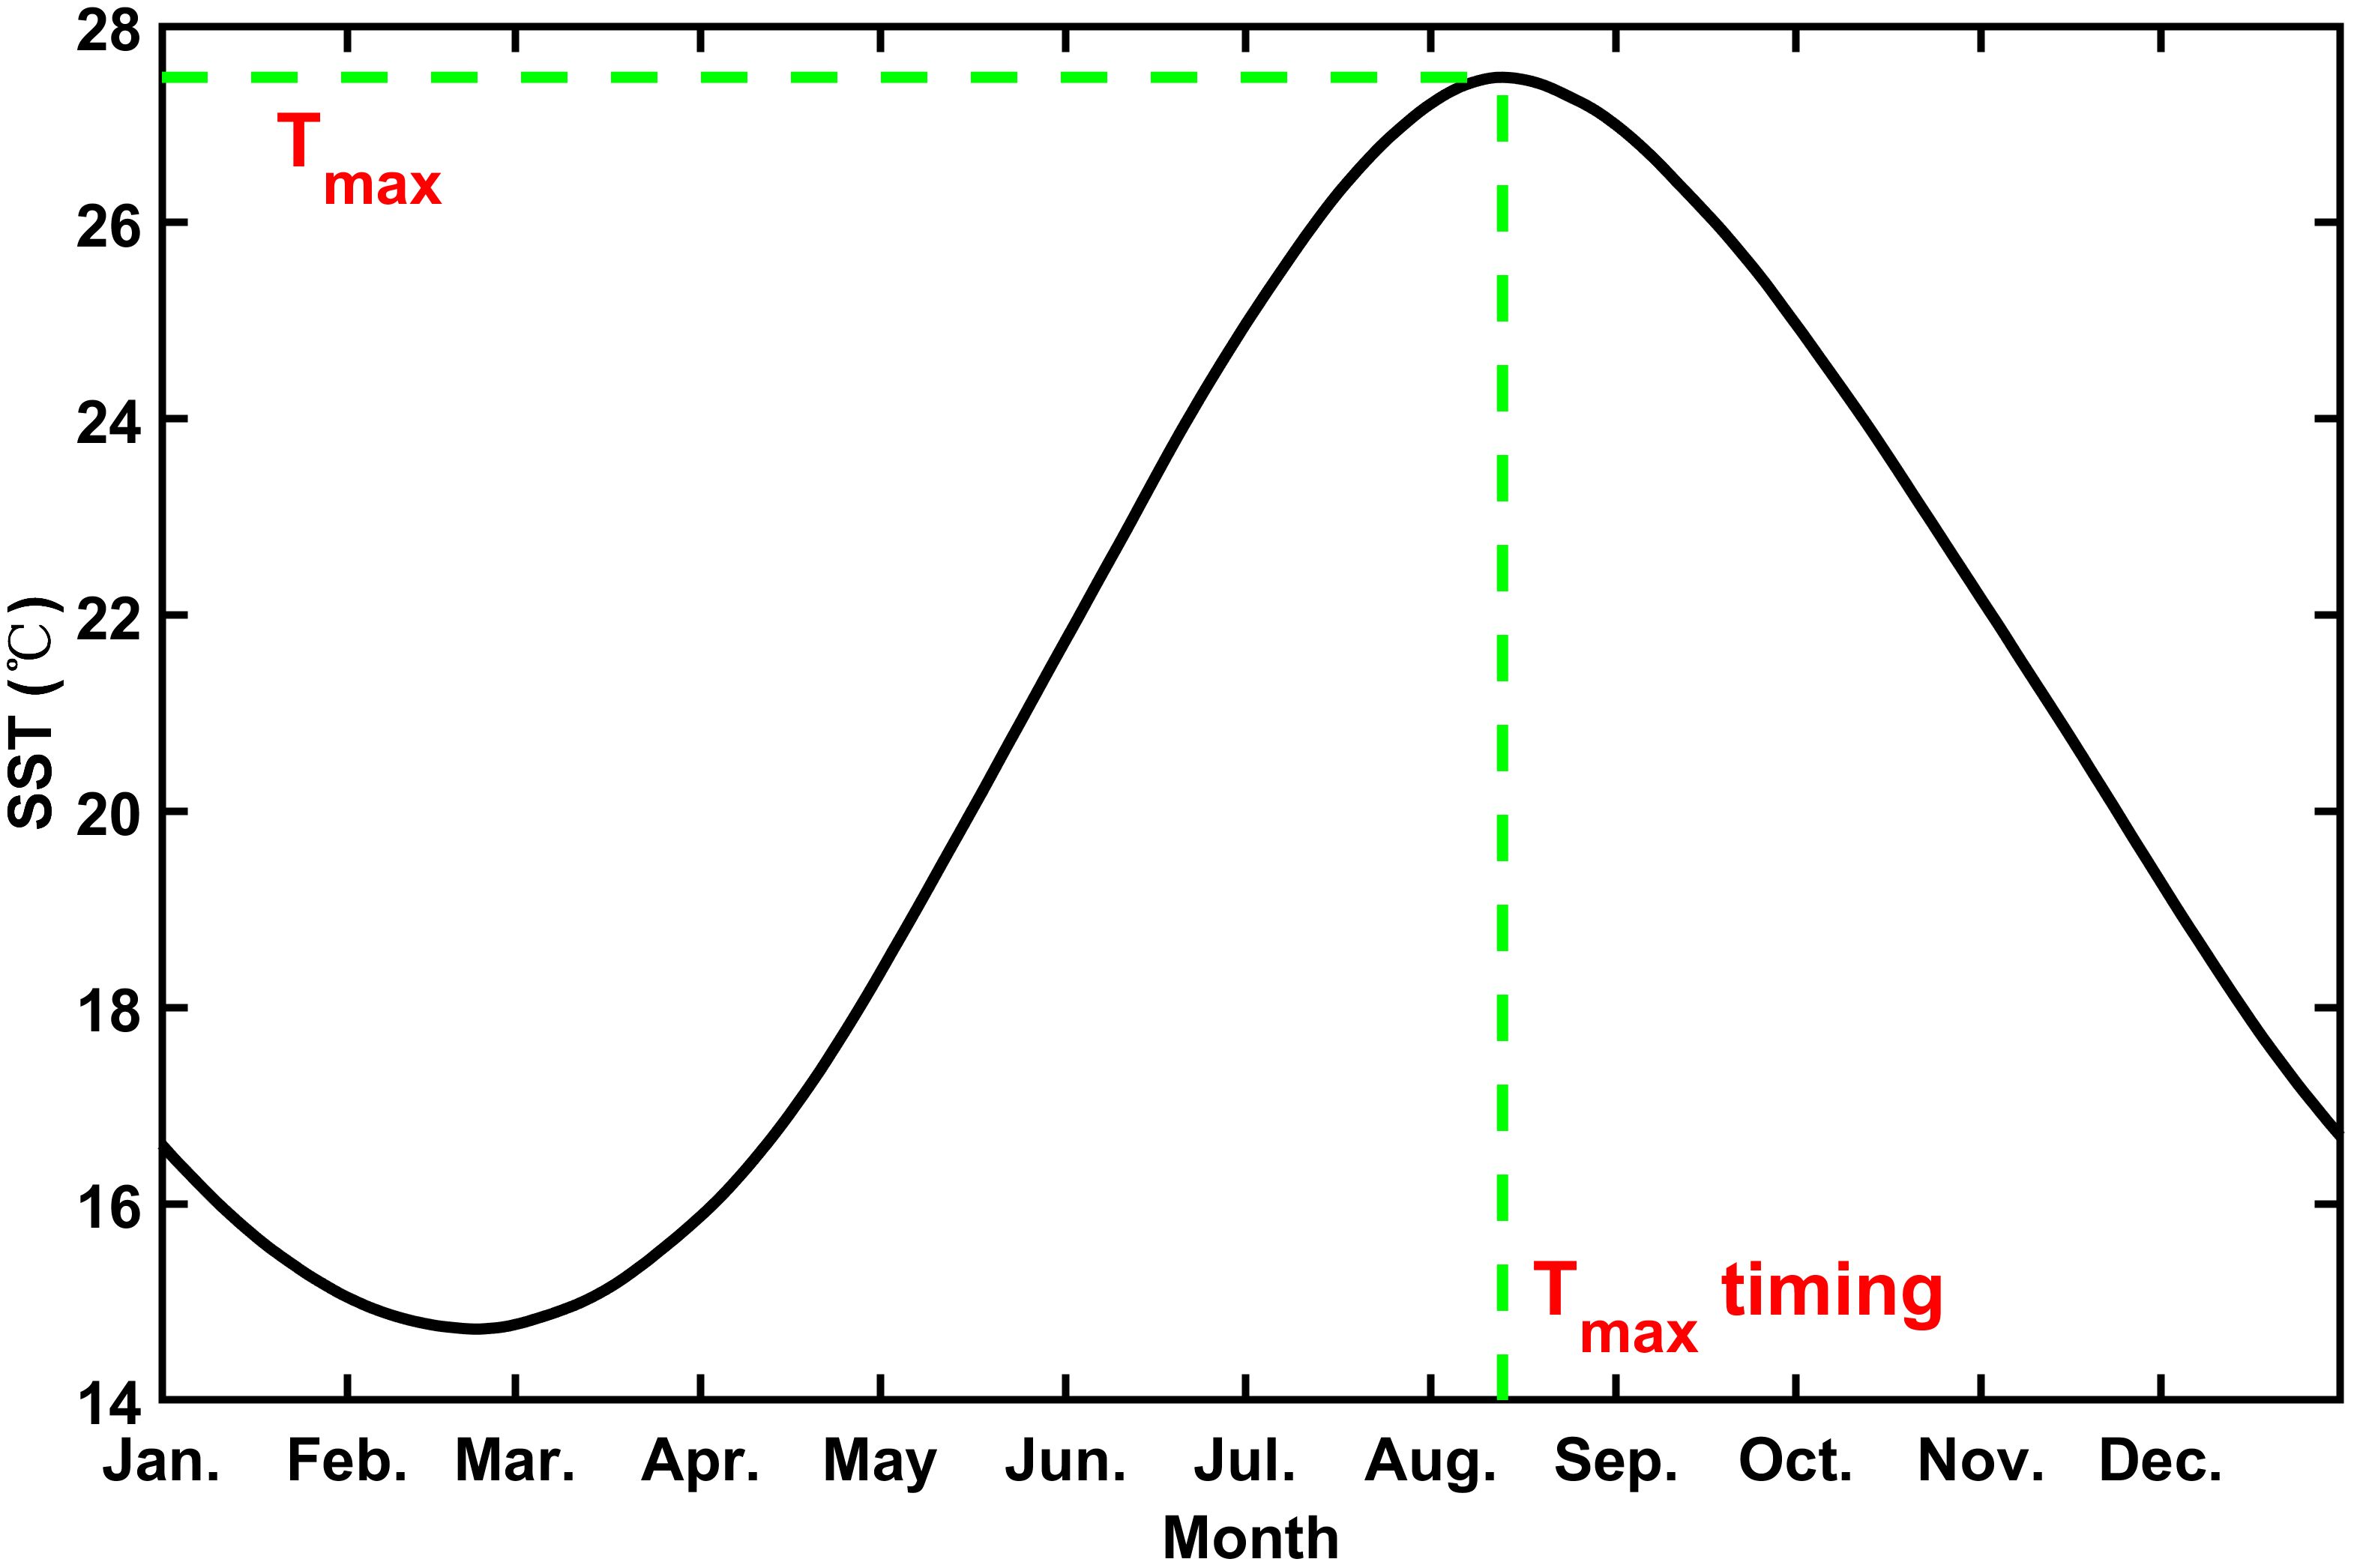
Figure 2. The schematic diagram of the annual maximum SST (Tmax) and the corresponding Tmax timing. The black solid line represents the SST time series for a pixel in a year.
Similar to SST, air temperature also peak during the summer. We employed the same method as for SST to obtain the maximum values and corresponding times for air temperature (AirTmax and AirTmax timing).
2.3 The calculation of marine heatwaves
This study follows the methodology described by Hobday et al. (2016) and Oliver et al. (2018). Marine heatwaves (MHWs) are identified at each pixel using daily OSTIA data. An MHW event is defined when the daily SST exceeds the 90th percentile threshold, calculated from a 38-year dataset of daily SSTs. To determine seasonally varying 90th percentile thresholds, daily SSTs are computed within an 11-day window centered on the corresponding date of each year from 1985 to 2022. Subsequently, a 31-day moving average is applied to smooth the 90th percentile thresholds. Any contiguous days with temperatures above the threshold for at least five consecutive days and a break of no more than three days is considered as a single event. Matlab codes we used in this study to calculate MHW characteristics are available at https://github.com/ZijieZhaoMMHW. The Proportion of MHWs at Tmax timing is defined as the number of pixels in the study area where MHWs occur at Tmax timing divided by the total number of pixels.
3 Results
We analyzed the spatial distribution of Tmax and Tmax timing between 1985 and 2022, covering 38 years. The Tmax distribution shows lower values in the north and higher values in the south, with areas below 24°C along the eastern coast of the Liaodong Peninsula, the western coast of the Korean Peninsula, and the northern part of the Japan Sea (Figure 3A). In the East China Sea, the Tmax isotherms trend southwest-northeast, with the highest Tmax in the southeast exceeding 29°C (Figure 3A). Tmax in the Eastern China seas mainly occurs in July and August, with the timing generally earlier in the south and west compared to the north and east (Figure 3B). In the southern part of the Yangtze River estuary along the coast of China Mainland, Tmax occurs later, and is relatively lower compared to the surrounding areas (Figures 3A, B).
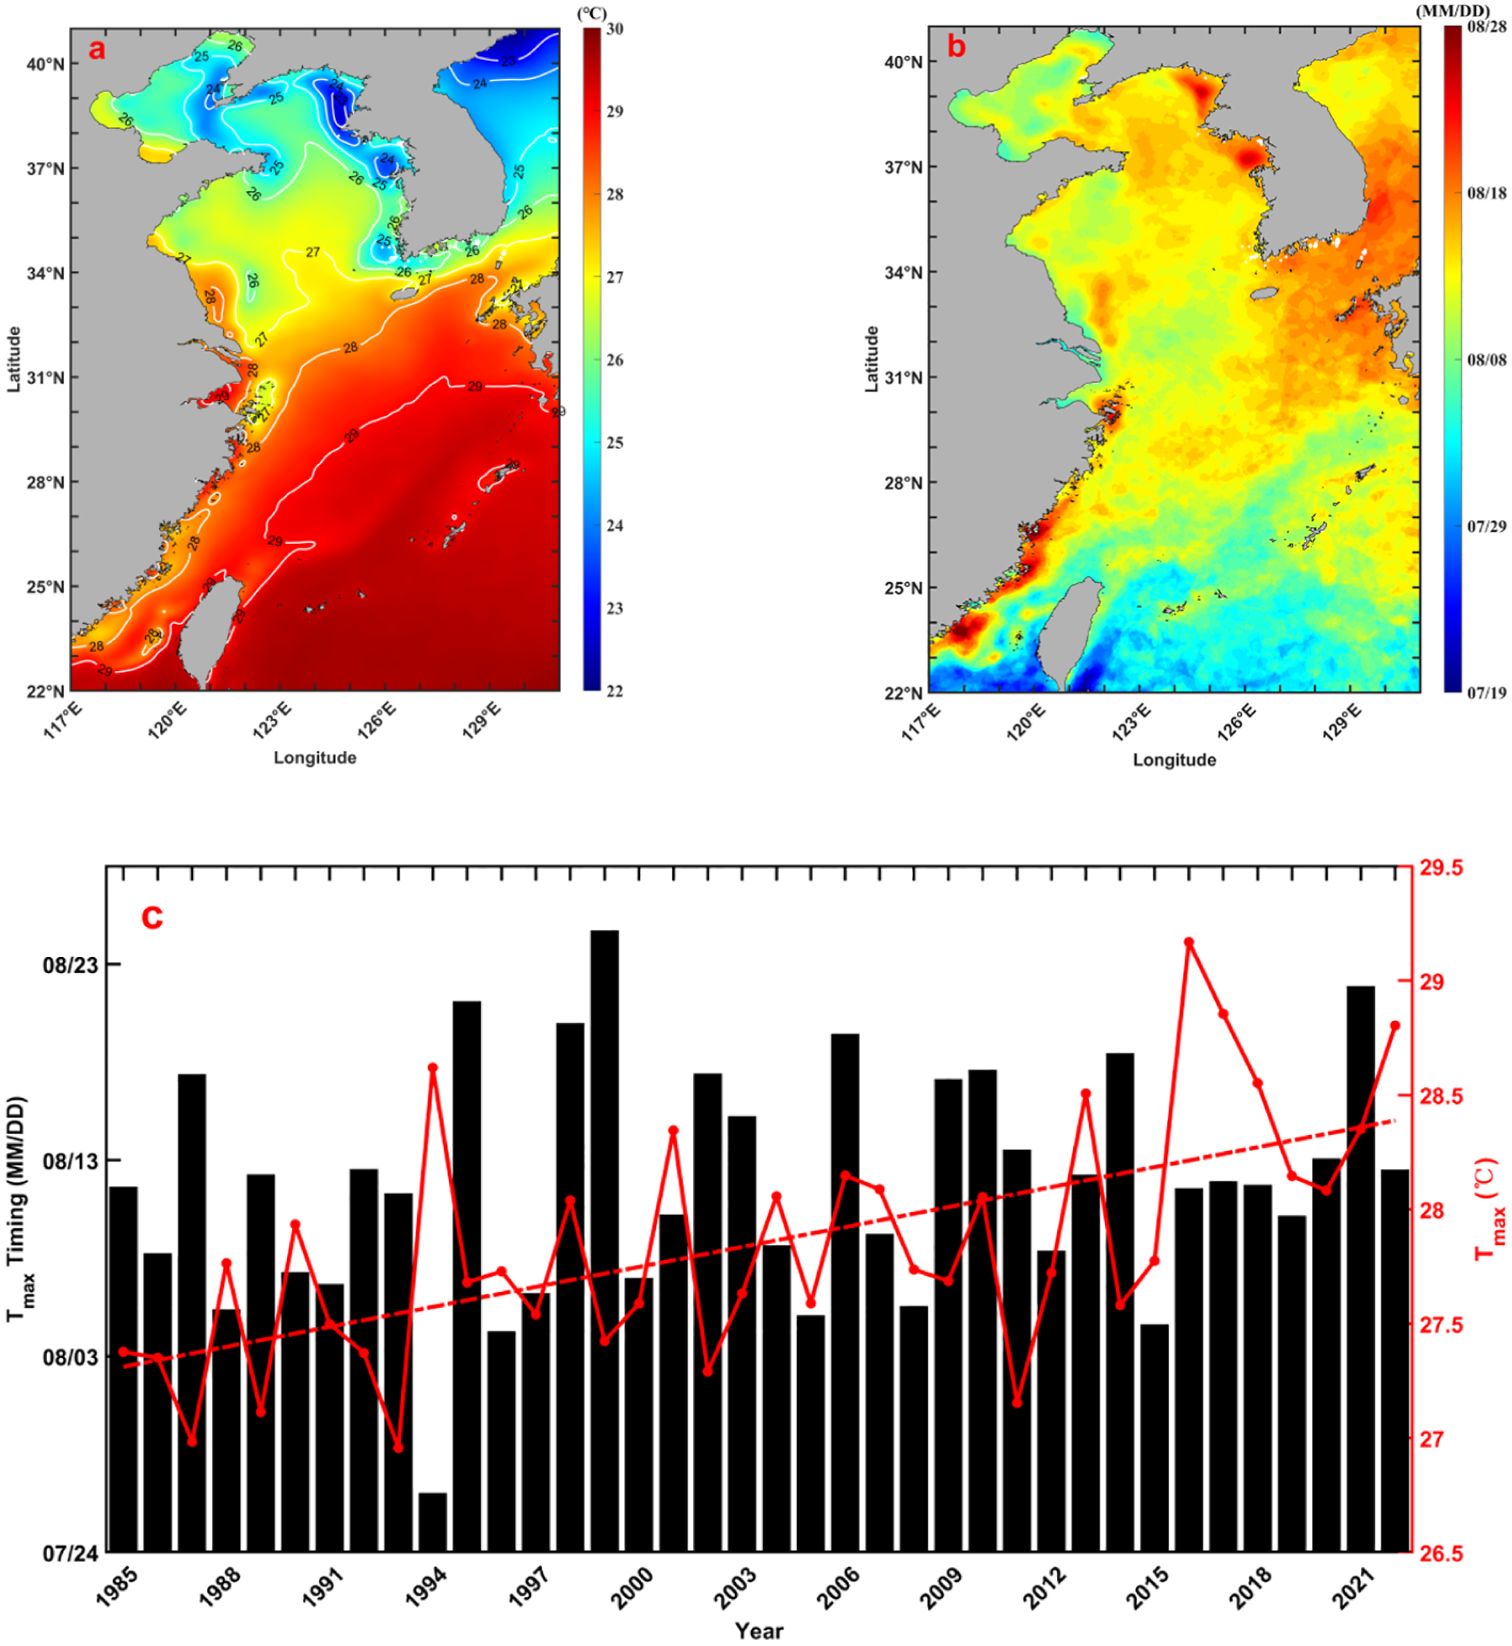
Figure 3. Distribution of mean (from 1985 to 2022) maximum annual SST [Tmax; (A)], Tmax timing (B) and Tmax area-averaged time series (C) across the Eastern China Seas.
Tmax shows a significant warming trend (p<0.01) at a rate of 0.3°C decade-1 (Figure 3C), which is 52% higher than the summer average. The year 2016 marked the highest Tmax in 38 years, reaching 29.2°C. The average Tmax timing in the study area shows no significant interannual variation. In 1994, Tmax occurred notably earlier compared to other years, with relatively higher Tmax. There is no apparent correlation between the average Tmax and Tmax timing across the entire study area.
In the southern part of the Eastern China Seas, Tmax is mostly positively correlated with Tmax timing, while in the northern part, Tmax is mostly negatively correlated with Tmax timing (Figure 4A). In most regions of the Bohai Sea, northern Yellow Sea, Japen Sea, and the Tsushima Strait, there is a significant negative correlation between Tmax and Tmax timing. In a few areas east of Taiwan Island, Tmax and Tmax timing exhibit a significant positive correlation.
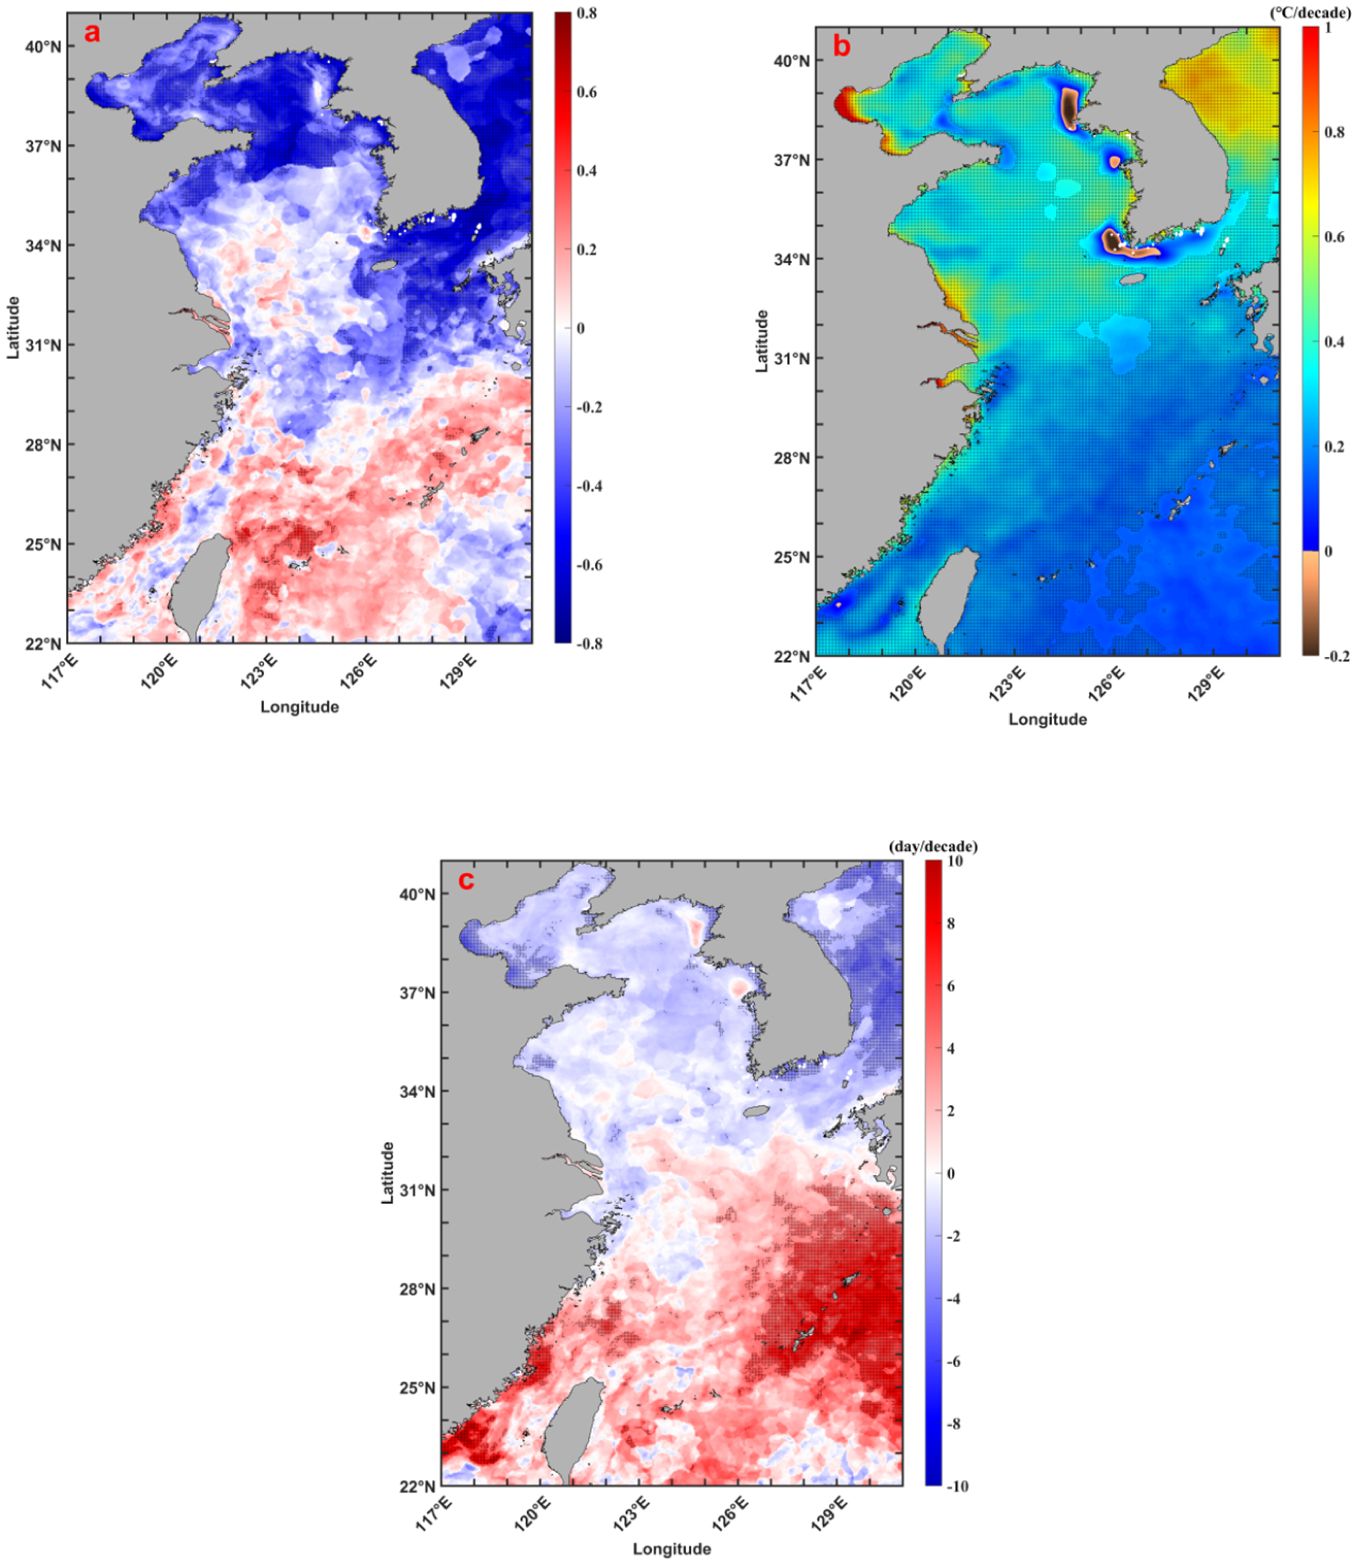
Figure 4. The correlation coefficient between Tmax and Tmax timing (A), decadal rates of Tmax warming [°C decade−1; (B)] and change in Tmax timing [days decade−1; (C)] across the Eastern China Seas. The black dots in (A) indicate significant correlation, while the black dots in (B) and (C) represent significant trends.
The areas of Tmax warming covered almost the entire Eastern China Seas, with only a few isolated areas in the western and southern parts of the Korean Peninsula experiencing Tmax cooling (Figure 4A). The rate of warming in the northern part was higher than in the south, with the highest rate of warming occurring in the western coastal waters of the Bohai Sea. The change in Tmax timing also showed contrasting trends between the northern and southern parts. In the northern parts, Tmax occurred earlier in most areas, with significant advancements observed in the western Bohai Sea and most areas of the Japan Sea. In the southern parts, Tmax was delayed in most areas, with significant delays observed in the eastern East China Sea and the western coast of the Taiwan Strait.
4 Discussion
4.1 The trend of Tmax
The increase in ocean temperature has gained significant interest due to its connection with global warming (Trenberth et al., 2007; Rhein et al., 2013). Numerous studies have reported a warming trend in summer SST in the Eastern China Seas, with a consensus that the rate of warming is significantly higher than the global average (Cai et al., 2017; Tang et al., 2020; Wang et al., 2023). Tmax, representing the annual summer extreme temperature in the study areas, has been warming at a rate of 0.3°C decade-1, which is 52% higher than the global average and 94% higher than the reported summer average warming rate in other studies (Cai et al., 2016, 2017; Wang et al., 2023). The notable increase in extreme temperatures poses a greater threat to the ecosystem, as organisms may already be operating at the upper limit of their thermal tolerance (Wernberg et al., 2013; Chaidez et al., 2017). Although the ability of organisms to adapt to warming through a poleward shift in their biogeographical range has been shown (Wernberg et al., 2016), the significant rise in Tmax may have major impacts on the migration of fishery resources in the Eastern China Seas.
It can be observed from Figure 4 that there are significant differences between the southern and northern parts of the Eastern China Seas in terms of the Tmax warming rate, change in Tmax timing, and the relationship between Tmax and Tmax timing. We divided the study area into southern and northern parts using 31.5°N as the boundary and analyzed the changes in Tmax and Tmax timing in both the southern and northern parts separately, as shown in Figure 5. In both the southern and northern parts, Tmax increased significantly (p<0.01), with a warming rate of 0.4°C decade-1 in the northern part, which is twice the rate of 0.2°C decade-1 in the southern part. In the northern part, Tmax timing significantly decreased over time (p=0.04), meaning the occurrence time of Tmax advanced significantly, with a change rate of 1.3 days decade-1, and Tmax and Tmax timing showed a significant negative correlation (r=-0.5, p<0.01). In the southern part, Tmax timing significantly increased over time (p=0.04), meaning the occurrence time of Tmax significantly delayed, with a change rate of 2.8 days decade-1. The Tmax in the northern region are lower than in the south (Figure 3A), and the faster increase in Tmax in the north may lead to a reduction in the Tmax difference between the north and south. Tmax occurs earlier in the south than in the north (Figure 3B), and the significant increase in Tmax timing in the south and the significant decrease in Tmax timing in the north may lead to a reduction in the difference in Tmax occurrence times between the north and south. Variance analysis shows that Tmax (r=-0.54, p<0.01) and Tmax timing (r=-0.36, p=0.03) in the study area are both significantly negatively correlated with Tmax (Figure not show). Thus, while Tmax is significantly warming, the difference in Tmax and Tmax timing between the southern and northern parts is diminishing.
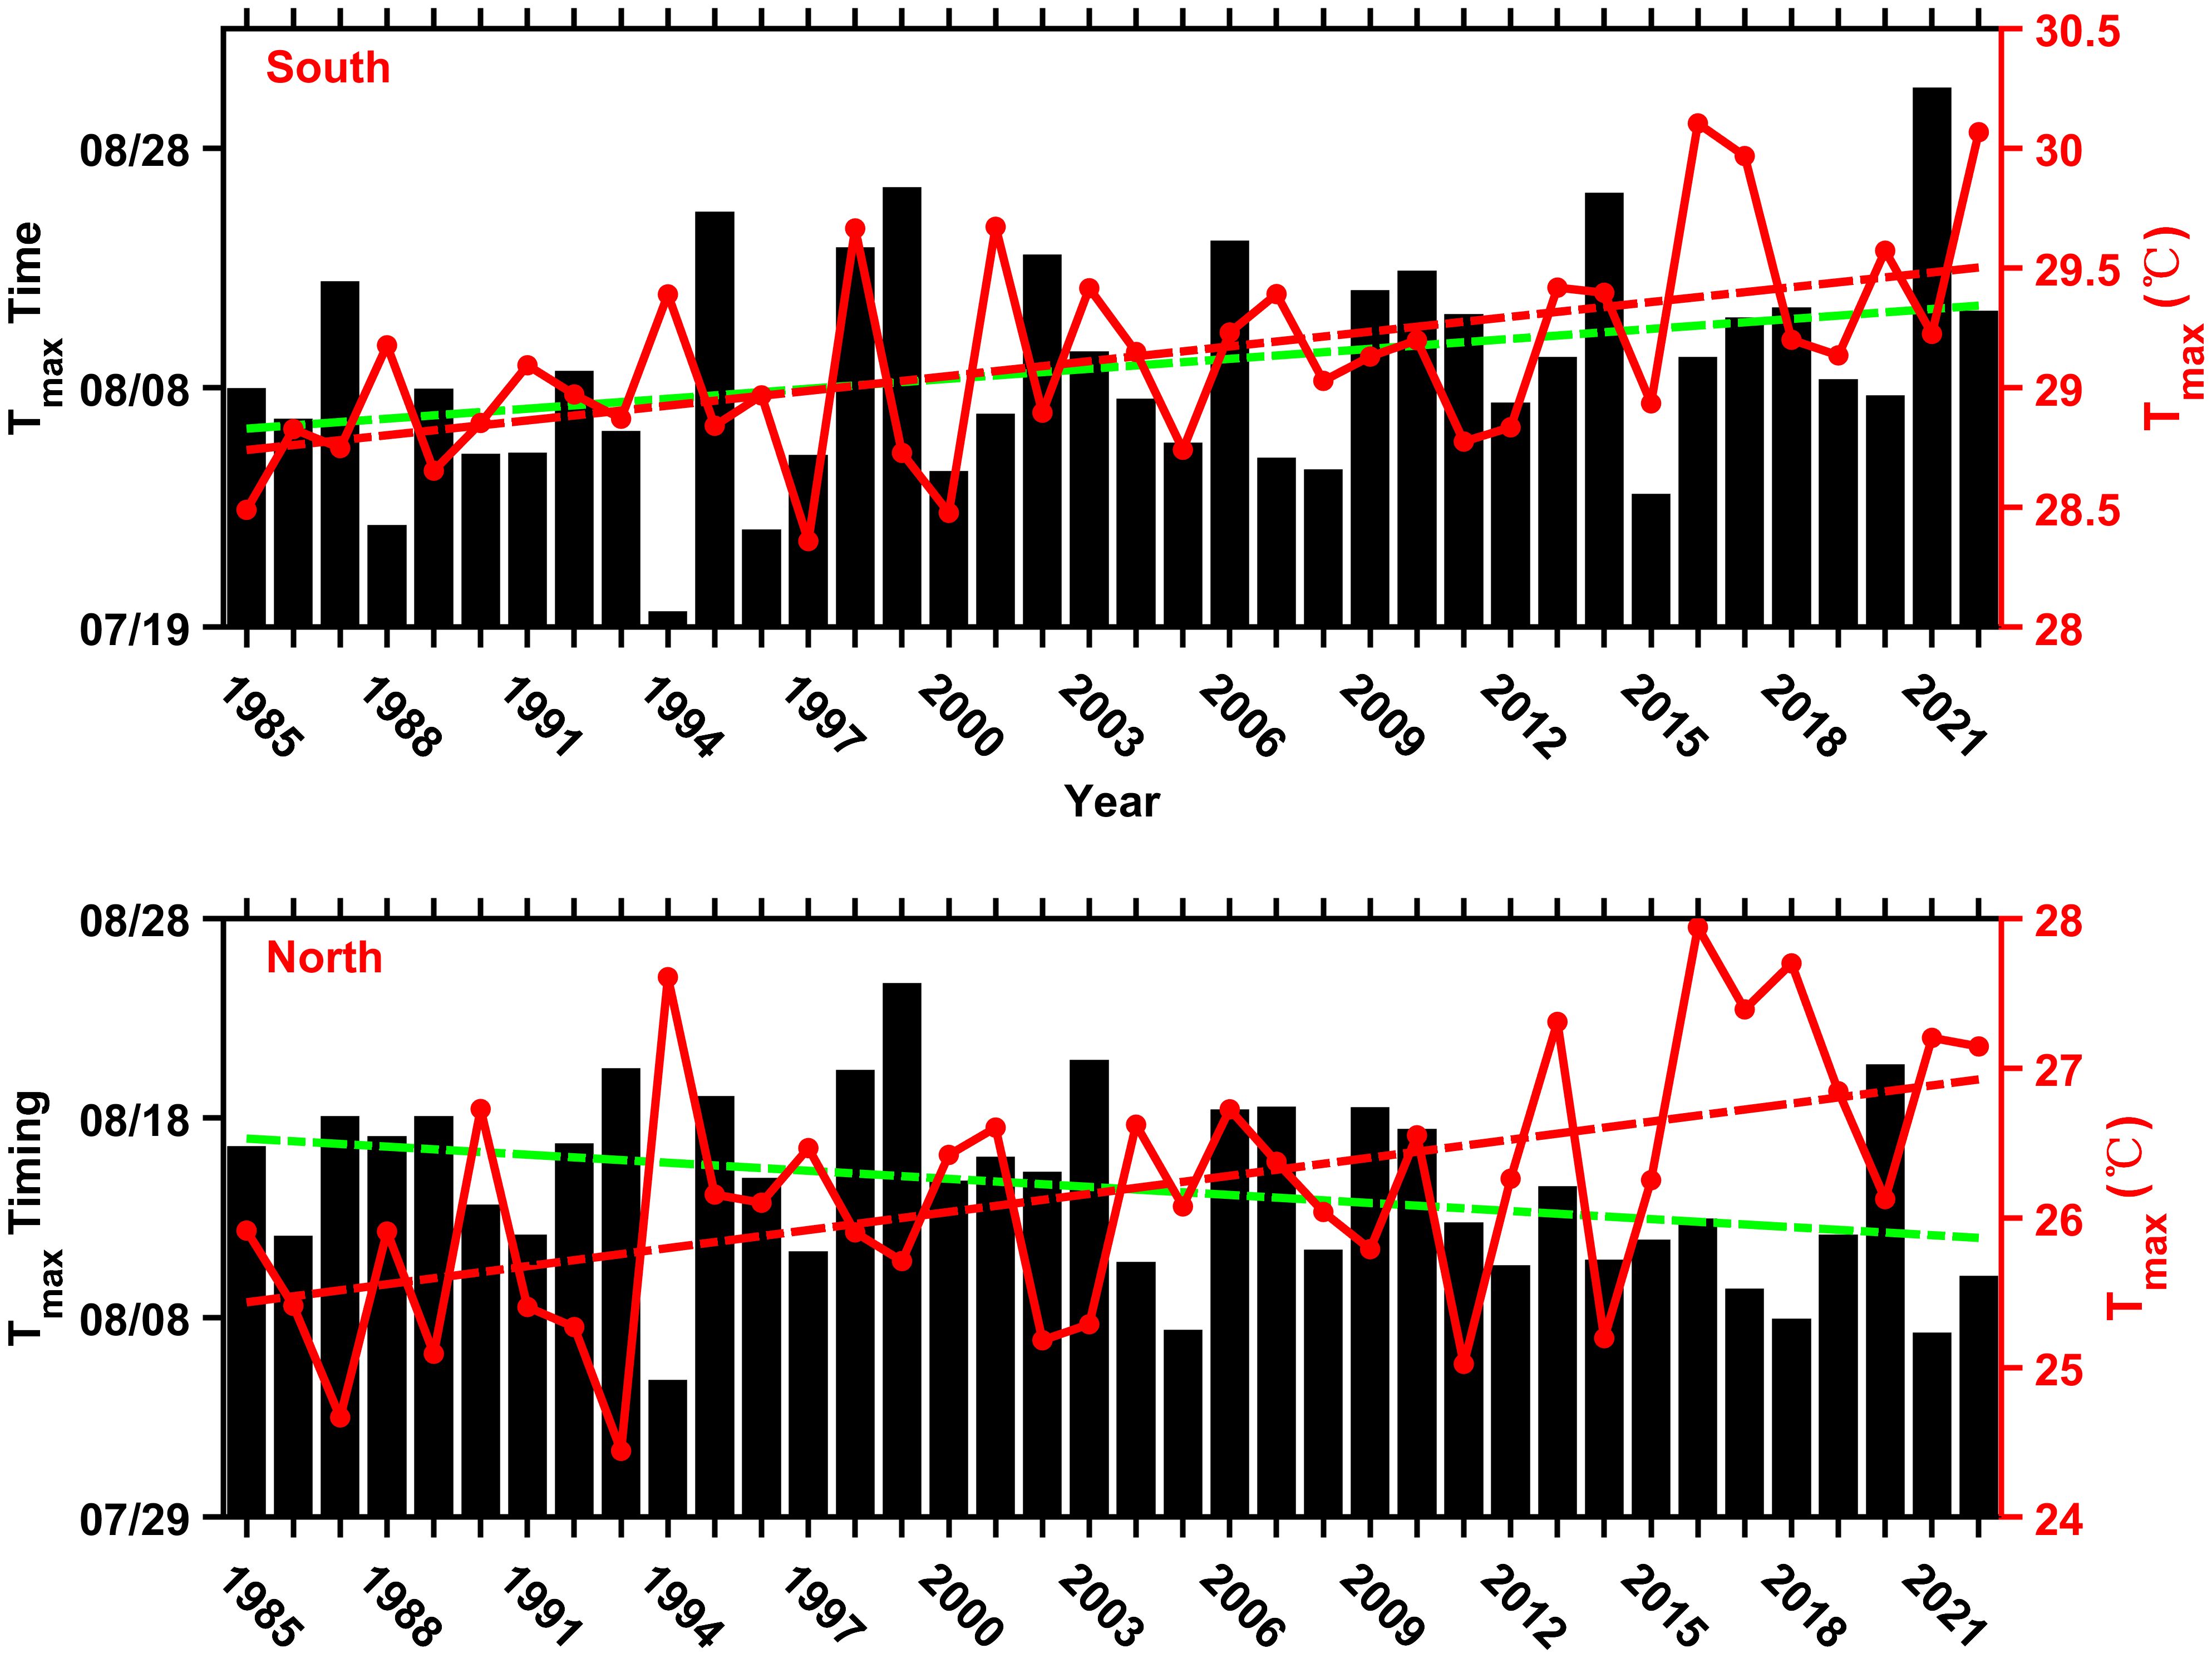
Figure 5. Annual time series plots of Tmax and Tmax timing in the southern and northern parts of the Eastern China Seas. The red dashed line represents the linearly fitted Tmax time series, and the green dashed line represents the linearly fitted Tmax timing time series.
4.2 Factors affecting Tmax
The relationship between air temperature and SST is complex and interconnected (Al-Shehhi, 2022; He et al., 2023). Changes in air temperature can influence SST through various mechanisms, resulting in a strong correlation between air temperature and SST (Feng et al., 2018). In the Eastern China Seas, air temperature reaches its peak during the summer, approximately 6.4 days earlier than the peak SST in the southern part and 9.5 days earlier in the northern part. There is a high correlation between AirTmax and Tmax, with the correlation coefficients of 0.93 in both the southern and northern parts, resulting in nearly identical trends for AirTmax and Tmax in both parts (Figure 6).
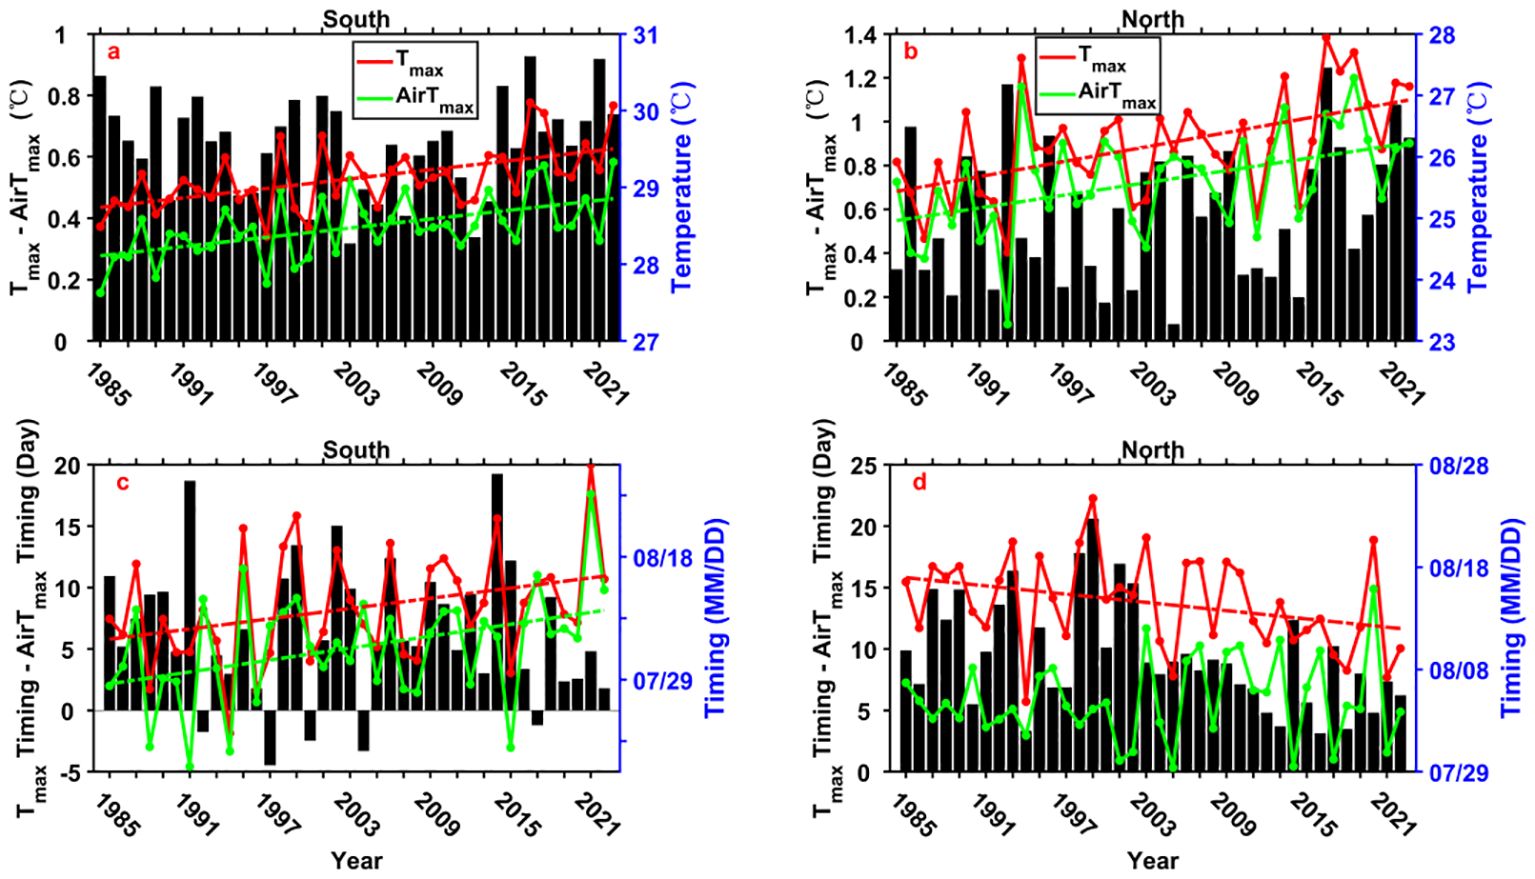
Figure 6. Annual time series plots of Tmax (red line), AirTmax (green line) and difference between Tmax and AirTmax (black bar) in the southern (A) and northern (B) parts of the Eastern China Seas. And, annual time series plots of Tmax timing (red line), AirTmax timing (green line) and difference between Tmax timing and AirTmax timing (black bar) in the southern (C) and northern (D) parts.
However, the correlation between AirTmax timing and Tmax timing differs between the south and the north. In the southern part, AirTmax timing shows a similar increasing trend to Tmax timing, whereas in the northern part, the difference between AirTmax timing and Tmax timing has significantly decreased (p<0.01) (Figure 6). This reduction in the time lag between Tmax and AirTmax, along with the lack of a clear trend in AirTmax timing, results in an advancing trend in Tmax timing in the northern part (Figure 6).
Higher SST often leads to increased QLH due to enhanced evaporation rates (Kumar et al., 2017; Mohan et al., 2023). In the northern part of the Eastern China Seas, there is a strong correlation between QLH and Tmax in August (Table 1). This increased QLH can influence SST by promoting heat transfer from the ocean surface to the atmosphere, potentially moderating further increases in SST (Sekizawa et al., 2018; Ganguly et al., 2024). In August, strong QLH suppresses the continuous increase in SST in the northern part, causing Tmax timing to advance. This may be an important reason for the significant negative correlation between QLH and Tmax timing (Table 1). In contrast, this relationship between QLH, Tmax and Tmax timing is much weaker in the southern part. In the southern part, approximately 39% of Tmax occurs in July, and 61% occurs in August. The QLH in both July and August shows a significant increase in the south (Figure 7). High QLH in July suppresses the increase in SST, delaying Tmax to August, which diminishes the effect of high QLH in August on advancing Tmax. In the northern part, 93% of Tmax occurs in August, and there is no significant increase in QLH in July. This makes the impact of the increased QLH in August on advancing Tmax particularly evident. Additionally, regional variations in QLH can significantly impact local SST trends, emphasizing the importance of understanding these dynamics for accurate climate modeling and forecasting in the Eastern China Seas.
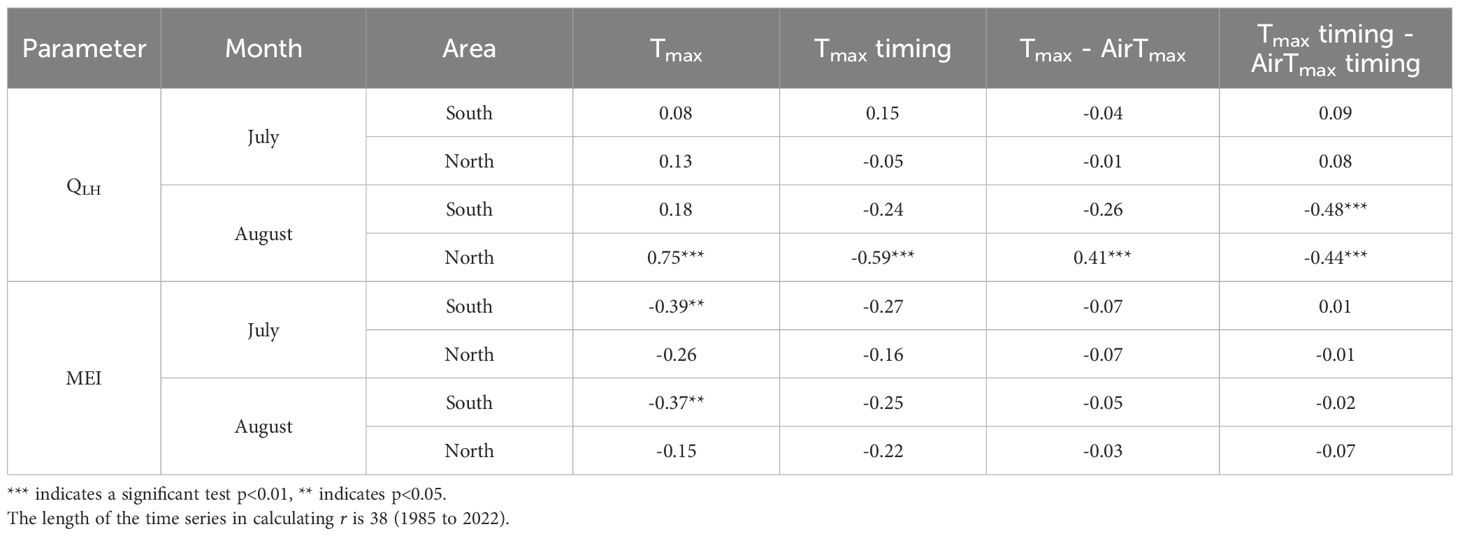
Table 1. The correlation coefficients (r) between Tmax and Tmax timing, with the monthly average of QLH and MEI, in July and August in the south and north of the Eastern China Seas.
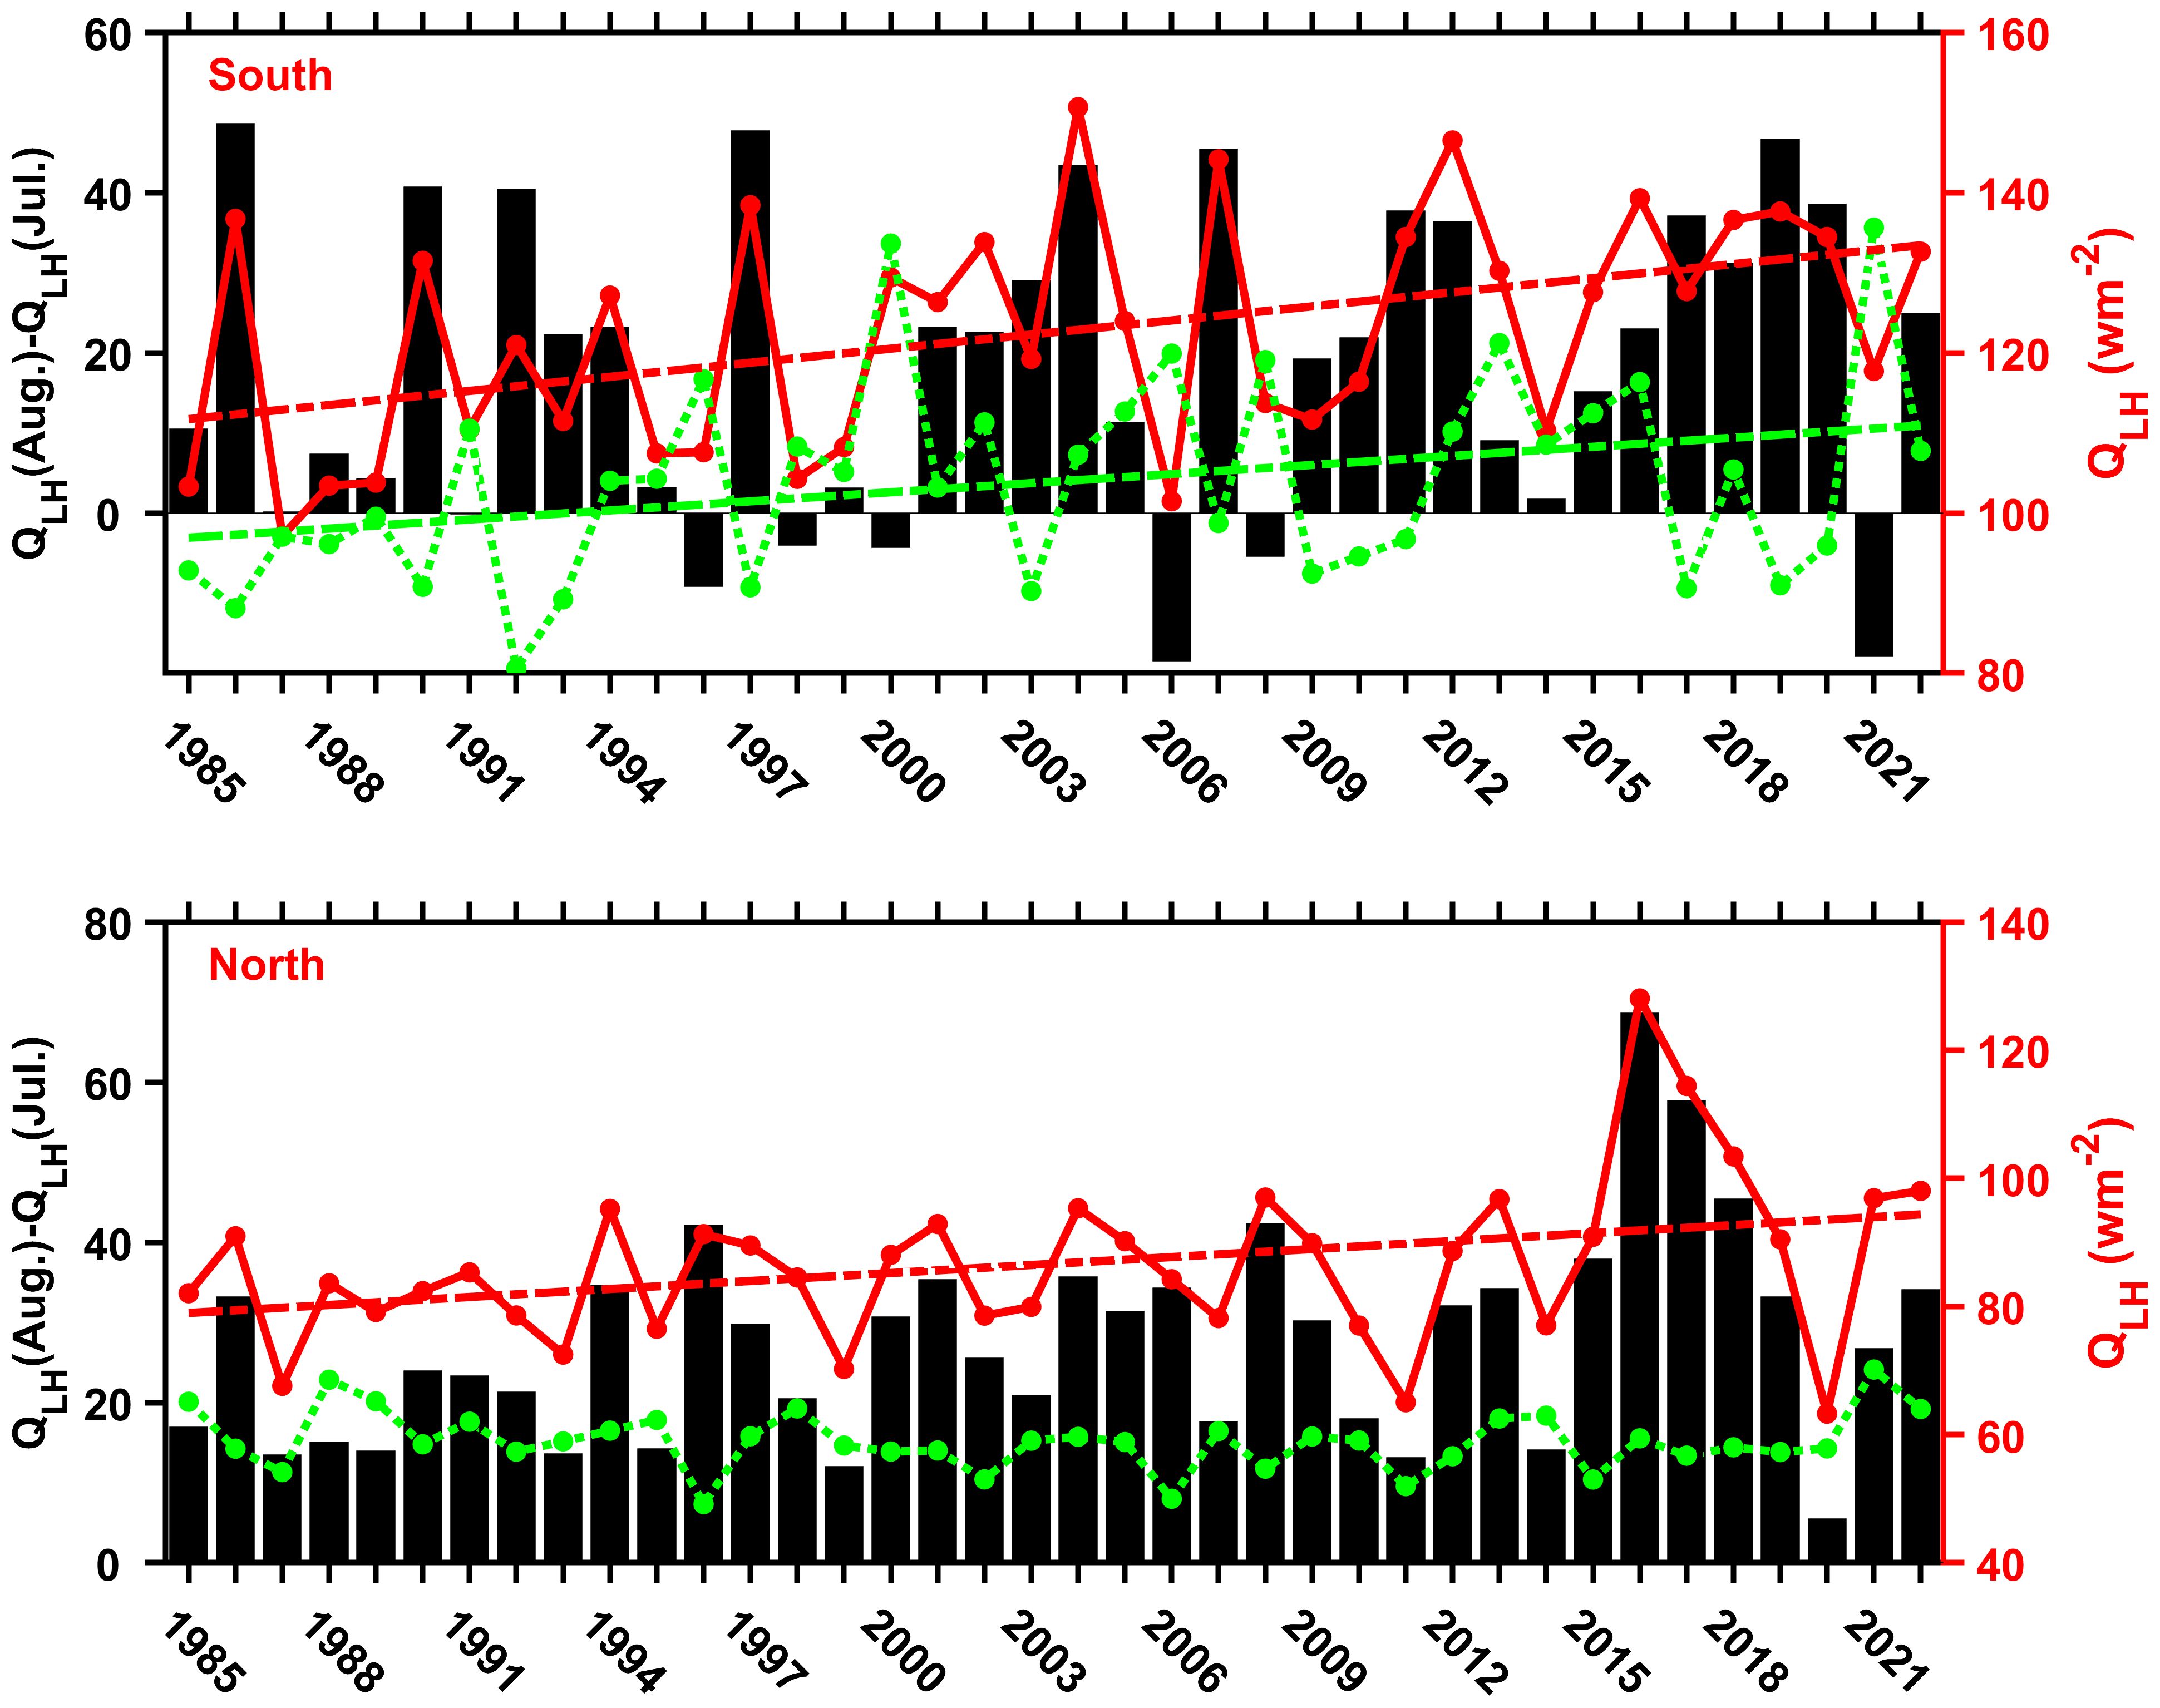
Figure 7. Annual time series plots of QLH in July (green line) and August (red line), and difference of QLH between July and August (black bar) in the southern and northern parts of the Eastern China Seas.
The MEI is an important indicator of ENSO variability, which has been shown to influence SST patterns globally (Yuan et al., 2018; Cai et al., 2019). In the Eastern China Seas, ENSO events can significantly impact summer SST dynamics (Sun et al., 2021; Liu et al., 2023). There is a significant negative correlation between MEI and Tmax during July and August in the southern part (Table 1), indicating that La Niña tends to favor higher Tmax values. During El Niño and La Niña events, there are notable shifts in both the position and intensity of the western Pacific subtropical high (WPSH) (Paek et al., 2019). During summer, the position of WPSH shifts eastward and weakens in intensity during El Niño events, whereas during La Niña events, the WPSH position shifts westward and its intensity strengthens (Liu et al., 2023). This phenomenon suggests that the air-sea interaction under the influence of the subtropical high may play a crucial role in SST rise (Zeng et al., 2010). Additionally, it may be a key factor contributing to higher SST during summers characterized by La Niña events compared to those with El Niño events (Timmermann et al., 2018). In the northern part, possibly due to significant disturbances from local factors (such as QLH), although MEI and Tmax exhibit a negative correlation, the correlation is not significant (Table 1).
Based on the interannual variation trend of SST, the causes of extreme high-temperature events in certain years need to be analyzed specifically (Gao et al., 2020; Yan et al., 2020; Tan et al., 2023). In both the southern and northern parts of the Eastern China Seas, Tmax in 2016 was the highest in 38 years (Figure 5). Several studies have reported extreme high-temperature events in the Eastern China Seas during the summer of 2016 (Tan and Cai, 2018; Moon et al., 2019; Yan et al., 2020). In August 2016, the region experienced an exceptional warming event with maximum anomalies exceeding 2°C (Tan and Cai, 2018), and the intense warming led to SST breaking historical records observed by satellites (Yan et al., 2020). The high SST in 2016 is attributed to various factors such as increased net heat flux and enhanced warm advection (Tan and Cai, 2018), increased Changjiang diluted water (Moon et al., 2019), and a high-pressure system over the Eastern China Seas splitting from the western Pacific subtropical high (Yan et al., 2020). Gao et al. (2020) attributed the high temperature events during the consecutive summers from 2016 to 2018 to shortwave radiation and ocean advection anomalies, as well as the reduction of surface wind speeds. The high-temperature event in 2022 was caused by a combination of anomalous atmospheric and oceanic conditions, including enhanced insolation, weakened surface wind speed, suppressed latent heat loss from the ocean, a shallower mixed layer, and an upper ocean current anomaly (Tan et al., 2023).
Understanding the predictability of Tmax is crucial for assessing the impacts of extreme heat events on marine ecosystems and coastal communities. In the southern part of the Eastern China Seas, Tmax is closely related to AirTmax and its timing, suggesting that AirTmax can serve as a reliable predictor for Tmax. This relationship is more complex in the northern part, where QLH significantly influences Tmax timing. High QLH during August tends to suppress further increases in SST, advancing Tmax timing. The negative correlation between QLH and Tmax timing (-0.56, p<0.01) indicates that QLH can be used to correct Tmax timing forecasts. Therefore, a hybrid approach integrating AirTmax and QLH can enhance the accuracy and timeliness of Tmax forecasts in the northern part. Furthermore, other parameters influencing SST, such as ocean currents, wind, solar radiation flux, MEI, and so on, can be integrated to further improve the predictive capability. Machine learning algorithms, can handle the non-linear relationships and interactions among multiple parameters (Dong et al., 2021; Manucharyan et al., 2021), thereby providing robust predictions of Tmax. The impacts of these trends on marine ecosystems and fisheries can be profound. For example, higher SSTs can lead to shifts in species distribution, affecting local fisheries (Hobday et al., 2016; Oliver et al., 2018). Specific case studies, such as the 2016 extreme high-temperature event, highlight the importance of understanding these dynamics (Tan and Cai, 2018; Moon et al., 2019; Yan et al., 2020). Integrating various parameters and employing machine learning techniques can further enhance the precision and lead time of Tmax forecasts, facilitating better preparedness for extreme heat events and their impacts on marine environments. This is a topic that is worth studying further.
While our study provides significant insights into the patterns and trends of Tmax in the Eastern China Seas, several limitations must be acknowledged to offer a balanced perspective on our findings. Our initial analysis indicates that the faster warming rate of Tmax in the northern region is largely due to the corresponding trends in AirTmax, which also exhibit a faster warming rate in the north. Additionally, the differing trends in Tmax timing between the northern and southern regions are closely linked to the distinct trends in QLH during July and August. However, the underlying mechanisms behind these trends remain complex and are not fully explored in this study. Future research should delve deeper into understanding the reasons behind the varying trends in AirTmax and QLH between the northern and southern regions. By addressing these complexities, future studies can build upon our findings to provide a more comprehensive understanding of the regional climate dynamics affecting Tmax. Moreover, while our study focused on the observed trends and initial causal factors, further investigation into the broader climatic phenomena and their interactions with local processes will be crucial in refining our understanding of Tmax variability in the Eastern China Seas.
4.3 Relationship between Tmax and MHWs
Our study reveals a significant positive correlation between Tmax and the probability of MHWs occurrence in the Eastern China Seas (Figure 8). The average probability of MHWs occurrence in the study area is approximately 6%. However, during Tmax, this probability surges to 16%, indicating a heightened risk of MHWs coinciding with Tmax. The year 2016 exemplifies this relationship, as it recorded the highest Tmax and the most frequent MHW occurrences (Figure 8). In 2016, MHWs affected 69% of the study area during Tmax, meaning that 69% of the region experienced MHWs when SST reached its annual maximum. This dramatic increase underscores the strong linkage between Tmax and MHWs.
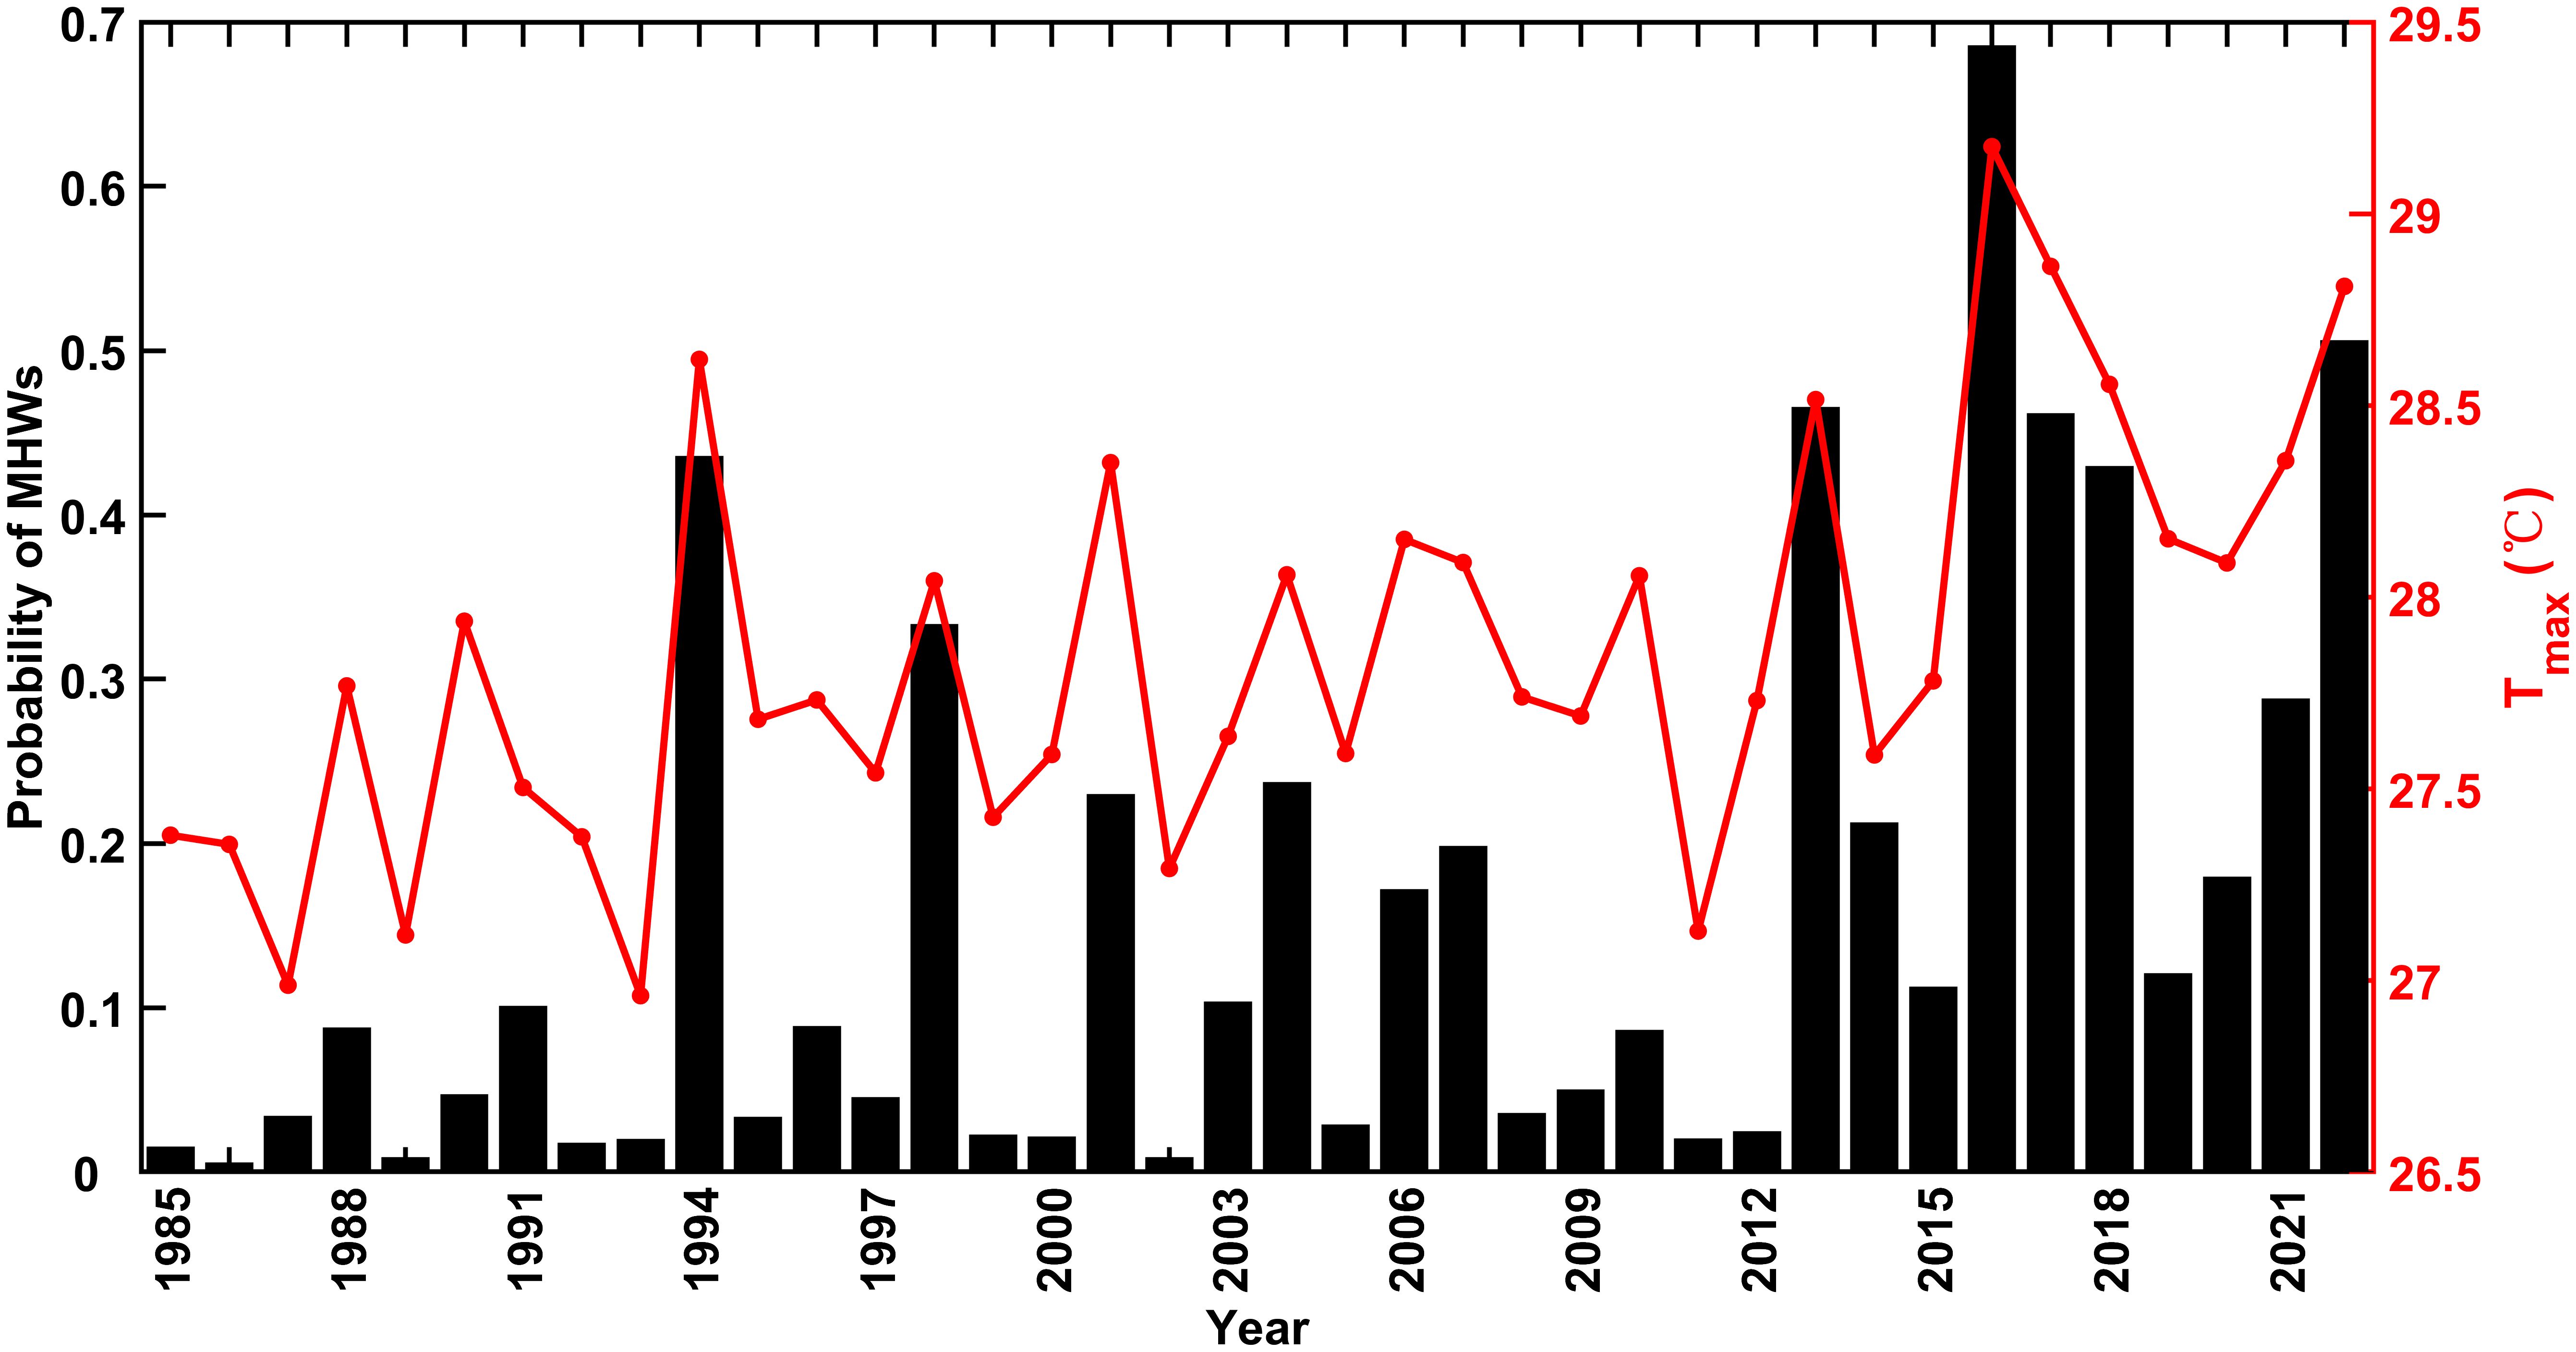
Figure 8. Time series of the probability of MHWs at Tmax timing.
The implications of this relationship between Tmax and MHWs are profound. MHWs are known to have devastating impacts on marine ecosystems, including widespread coral bleaching, altered species distributions, and disrupted marine food webs (Hobday et al., 2016; Oliver et al., 2018). The concurrent occurrence of Tmax and MHWs amplifies these adverse effects, posing severe threats to marine biodiversity and the health of coastal environments. Recognizing the critical role of Tmax in triggering MHWs, it is essential to monitor and predict Tmax events accurately. Enhanced forecasting of Tmax can provide early warnings for impending MHWs, enabling timely mitigation efforts to protect vulnerable marine habitats. Additionally, understanding the mechanisms linking Tmax with MHWs can inform strategies to enhance the resilience of marine ecosystems to extreme thermal events.
5 Conclusions
In this study, we comprehensively analyzed the patterns and trends of maximum annual sea surface temperature (Tmax) in the Eastern China Seas from 1985 to 2022. Our findings reveal a significant warming trend in Tmax, with a rate of 0.3°C decade-1, surpassing the average summer warming rate reported in other studies. The trends in Tmax and its timing differ between the northern and southern parts. In the northern part, Tmax exhibits a higher rate of warming, significant advancement in its timing, and a significant negative correlation between Tmax and its timing. In the southern part, the rate of Tmax warming is much lower than that in the northern part, and its timing significantly delayed. Tmax in both the northern and southern parts is highly correlated with the annual maximum air temperature (AirTmax). The Tmax timing in the southern part is closely related to the AirTmax timing, whereas in the northern part, the Tmax timing is significantly advanced due to the notable increase in QLH in August. These correlations provide significant feasibility for subsequent Tmax forecasting. Additionally, our research found that the higher the Tmax, the higher the probability of MHW occurrence, which greatly increases the demand for Tmax forecasting.
The findings offer critical insights that can significantly enhance regional climate models and inform local conservation strategies in the Eastern China Seas. The observed Tmax trends and their correlations with local and remote climatic factors can be incorporated into regional climate models to improve the accuracy of temperature projections and the prediction of extreme temperature events. Specifically, the high correlation between Tmax and AirTmax, as well as the influence of QLH, can be utilized to refine the parametrization of SST in climate models, leading to more reliable simulations of future climate scenarios. Furthermore, these findings have direct implications for the development of adaptive ecosystem management strategies. By identifying areas with higher Tmax and increased frequency of marine heatwaves, conservation efforts can be targeted towards the most vulnerable regions. This information is crucial for implementing timely interventions to mitigate the adverse impacts of extreme temperatures on marine biodiversity and fisheries. Overall, the integration of our study’s results into regional climate models and local conservation planning can provide a robust framework for enhancing resilience to climate change in the Eastern China Seas.
Data availability statement
Publicly available datasets were analyzed in this study. This data can be found here: http://marine.copernicus.eu, https://psl.noaa.gov, http://apdrc.soest.hawaii.edu.
Author contributions
WD: Conceptualization, Data curation, Formal analysis, Investigation, Methodology, Software, Validation, Visualization, Writing – original draft, Writing – review & editing. QW: Funding acquisition, Investigation, Project administration, Resources, Supervision, Writing – review & editing. YC: Validation, Visualization, Writing – review & editing.
Funding
The author(s) declare financial support was received for the research, authorship, and/or publication of this article. The research is supported by Key R&D projects in Zhejiang Province (No. 2023C03120), National Key Research and Development Program of China (No. 2023YFD2401904), and General scientific research projects in Zhejiang Province (No. Y202353957).
Conflict of interest
The authors declare that the research was conducted in the absence of any commercial or financial relationships that could be construed as a potential conflict of interest.
Publisher’s note
All claims expressed in this article are solely those of the authors and do not necessarily represent those of their affiliated organizations, or those of the publisher, the editors and the reviewers. Any product that may be evaluated in this article, or claim that may be made by its manufacturer, is not guaranteed or endorsed by the publisher.
References
Al-Shehhi M. R. (2022). Uncertainty in satellite sea surface temperature with respect to air temperature, dust level, wind speed and solar position. Regional Stud. Mar. Science 53, 102385. doi: 10.1016/j.rsma.2022.102385
Bao B., Ren G. Y. (2014). Climatological characteristics and long-term change of SST over the marginal seas of China. Cont. Shelf Res. 77, 96–106. doi: 10.1016/j.csr.2014.01.013
Bronselaer B., Zanna L. (2020). Heat and carbon coupling reveals ocean warming due to circulation changes. Nature 584, 227–22+. doi: 10.1038/s41586-020-2573-5
Cai R. S., Tan H. J., Kontoyiannis H. (2017). Robust surface warming in offshore China seas and its relationship to the East Asian monsoon wind field and ocean forcing on interdecadal time scales. J. Climate 30, 8987–9005. doi: 10.1175/JCLI-D-16-0016.1
Cai R. S., Tan H. J., Qi Q. H. (2016). Impacts of and adaptation to inter-decadal marine climate change in coastal China seas. Int. J. Climatol. 36, 3770–3780. doi: 10.1002/joc.4591
Cai W. J., Wang G. J., Dewitte B., Wu L. X., Santoso A., Takahashi K., et al. (2018). Increased variability of eastern Pacific El Nino under greenhouse warming. Nature 564, 201–20+. doi: 10.1038/s41586-018-0776-9
Cai W. J., Wu L. X., Lengaigne M., Li T., McGregor S., Kug J. S., et al. (2019). Pantropical climate interactions. Science 363 (6430), 944–+. doi: 10.1126/science.aav4236
Chaidez V., Dreano D., Agusti S., Duarte C. M., Hoteit I. (2017). Decadal trends in Red Sea maximum surface temperature. Sci. Rep. 7, 8144. doi: 10.1038/s41598-017-08146-z
Dong S., Wang P., Abbas K. (2021). A survey on deep learning and its applications. Comput. Sci. Rev. 40, 100379. doi: 10.1016/j.cosrev.2021.100379
Donlon C. J., Martin M., Stark J., Roberts-Jones J., Fiedler E., Wimmer W. (2012). The operational sea surface temperature and sea ice analysis (OSTIA) system. Remote Sens. Environ. 116, 140–158. doi: 10.1016/j.rse.2010.10.017
Feng X. B., Haines K., de Boisséson E. (2018). Coupling of surface air and sea surface temperatures in the CERA-20C reanalysis. Q. J. R. Meteorol. Soc. 144, 195–207. doi: 10.1002/qj.3194
Ganguly I., Gonzalez A. O., Karnauskas K. B. (2024). On the role of wind-evaporation-SST feedbacks in the subseasonal variability of the east pacific ITCZ. J. Climate 37, 129–143. doi: 10.1175/JCLI-D-22-0849.1
Gao G., Marin M., Feng M., Yin B. S., Yang D. Z., Feng X. R., et al. (2020). Drivers of marine heatwaves in the East China Sea and the south Yellow Sea in three consecutive summers during 2016-2018. J. Geophy. Res. Oceans 125, e2020JC016518. doi: 10.1029/2020JC016518
Guo J. T., Pan H. D., Cao R. C., Wang J. F., Lv X. Q. (2023). Multiple timescale variations in water transparency in the Eastern China Seas over the period 1997-2019. J. Geophysical Research-Oceans 128, e2022JC019170. doi: 10.1029/2022JC019170
Hayashida H., Matear R. J., Strutton P. G. (2020). Background nutrient concentration determines phytoplankton bloom response to marine heatwaves. Global Change Biol. 26, 4800–4811. doi: 10.1111/gcb.15255
He M., Qin J., Lu N., Yao L. (2023). Assessment of ERA5 near-surface air temperatures over global oceans by combining MODIS sea surface temperature products and in-situ observations. IEEE J. Selected Topics Appl. Earth Observations Remote Sensing 16, 8442–8455. doi: 10.1109/JSTARS.2023.3312810
He W. P., Zhao S. S. (2018). Assessment of the quality of NCEP-2 and CFSR reanalysis daily temperature in China based on long-range correlation. Clim. Dyn. 50, 493–505. doi: 10.1007/s00382-017-3622-0
Hobday A. J., Alexander L. V., Perkins S. E., Smale D. A., Straub S. C., Oliver E. C. J., et al. (2016). A hierarchical approach to defining marine heatwaves. Prog. Oceanogr. 141, 227–238. doi: 10.1016/j.pocean.2015.12.014
Holbrook N. J., Gupta A. S., Oliver E. C. J., Hobday A. J., Benthuysen J. A., Scannell H. A., et al. (2020). Keeping pace with marine heatwaves. Nat. Rev. Earth Environ. 1 (9), 482–493. doi: 10.1038/s43017-020-0068-4
Holbrook N. J., Scannell H. A., Sen Gupta A., Benthuysen J. A., Feng M., Oliver E. C. J., et al. (2019). A global assessment of marine heatwaves and their drivers. Nat. Commun. 10 (1), 2624. doi: 10.1038/s41467-019-10206-z
Hu J. Y., Wang X. H. (2016). Progress on upwelling studies in the China seas. Rev. Geophys. 54, 653–673. doi: 10.1002/2015RG000505
Kumar B. P., Cronin M. F., Joseph S., Ravichandran M., Sureshkumar N. (2017). Latent heat flux sensitivity to sea surface temperature: regional perspectives. J. Climate 30, 129–143. doi: 10.1175/JCLI-D-16-0285.1
Lee S., Park M. S., Kwon M., Park Y. G., Kim Y. H., Choi N. (2023). Rapidly changing East Asian marine heatwaves under a warming climate. J. Geophysical Res.: Oceans 128, e2023JC019761. doi: 10.1029/2023JC019761
Liu N., Wang H., Ling T. J., Feng L. C. (2013). The influence of ENSO on sea surface temperature variations in the China seas. Acta Oceanologica Sinica 32, 21–29. doi: 10.1007/s13131-013-0348-7
Liu X., Ding D., Li G. X., Zhang Y., Liu S. D., Wang N., et al. (2023). Responses of the sea surface temperature and suspended matter concentration to ENSO events in the Bohai Sea. J. Ocean Univ. China. 22 (3), 697–708. doi: 10.1007/s11802-023-5351-9
Liu Z. Q., Gan J. P., Hu J. Y., Wu H., Cai Z. Y., Deng Y. F. (2021). Progress on circulation dynamics in the East China Sea and southern Yellow Sea: Origination, pathways, and destinations of shelf currents. Prog. Oceanogr. 193, 102553. doi: 10.1016/j.pocean.2021.102553
Lyu K. W., Zhang X. B., Church J. A. (2021). Projected ocean warming constrained by the ocean observational record. Nat. Climate Change 11, 834–83+. doi: 10.1038/s41558-021-01151-1
Manucharyan G. E., Siegelman L., Klein P. (2021). A deep learning approach to spatiotemporal sea surface height interpolation and estimation of deep currents in geostrophic ocean turbulence. J. Adv. Modeling Earth Syst. 13, e2019MS001965. doi: 10.1029/2019MS001965
Mohan S., Ruchith R. D., Rahul S., Shanas P. R. (2023). Latent heat flux variability over the tropical Indian Ocean. Int. J. Climatol. 43, 6225–6242. doi: 10.1002/joc.8202
Moon J. H., Kim T., Son Y. B., Hong J. S., Lee J. H., Chang P. H., et al. (2019). Contribution of low-salinity water to sea surface warming of the East China Sea in the summer of 2016. Prog. Oceanogr. 175, 68–80. doi: 10.1016/j.pocean.2019.03.012
Oliver E. C. J., Benthuysen J. A., Darmaraki S., Donat M. G., Hobday A. J., Holbrook N. J., et al. (2021). Marine heatwaves. Ann. Rev. Mar. Sci. 13, 313–342. doi: 10.1146/annurev-marine-032720-095144
Oliver E. C. J., Donat M. G., Burrows M. T., Moore P. J., Smale D. A., Alexander L. V., et al. (2018). Longer and more frequent marine heatwaves over the past century. Nat. Commun. 9, 1324. doi: 10.1038/s41467-018-03732-9
Paek H., Yu J. Y., Zheng F., Lu M. M. (2019). Impacts of ENSO diversity on the western Pacific and North Pacific subtropical highs during boreal summer. Climate Dyn. 52, 7153–7172. doi: 10.1007/s00382-016-3288-z
Rhein M., et al. (2013). “Observations: ocean,” in Climate Change 2013: The Physical Science Basis. Ed. Stocker T. F., et al (Cambridge University Press), 255–315.
Sattari M. T., Rezazadeh-Joudi A., Kusiak A. (2017). Assessment of different methods for estimation of missing data in precipitation studies. Hydrol. Res. 48, 1032–1044. doi: 10.2166/nh.2016.364
Schlegel R. W., Oliver E. C., Wernberg T., Smit A. J. (2017). Nearshore and offshore co-occurrence of marine heatwaves and cold-spells. Prog. Oceanogr. 151, 189–205. doi: 10.1016/j.pocean.2017.01.004
Sekizawa S., Nakamura H., Kosaka Y. (2018). Interannual variability of the Australian summer monsoon system internally sustained through wind-evaporation feedback. Geophys. Res. Lett. 45, 7748–7755. doi: 10.1029/2018GL078536
Si D., Hu Z. Z., Kumar A., Jha B., Peng P. T., Wang W. Q., et al. (2016). Is the interdecadal variation of the summer rainfall over eastern China associated with SST? Climate Dyn. 46, 135–146. doi: 10.1007/s00382-015-2574-5
Sun L. Y., Yang X. Q., Tao L. F., Fang J. B., Sun X. G. (2021). Changing impact of ENSO events on the following summer rainfall in Eastern China since the 1950s. J. Climate 34, 8105–8123. doi: 10.1175/JCLI-D-21-0018.1
Sun X. R., Shen F., Brewin R. J. W., Liu D. Y., Tang R. G. (2019). Twenty-year variations in satellite-derived chlorophyll-a and phytoplankton size in the Bohai Sea and Yellow Sea. J. Geophysical Research-Oceans 124, 8887–8912. doi: 10.1029/2019JC015552
Tan H. J., Cai R. S. (2018). What caused the record-breaking warming in East China Seas during August 2016? Atmos. Sci. Lett. 19 (10), e853. doi: 10.1002/asl.853
Tan H. J., Cai R. S., Bai D. P., Hilmi K., Tonbol K. (2023). Causes of 2022 summer marine heatwave in the East China Seas. Adv. Climate Change Res. 14, 633–641. doi: 10.1016/j.accre.2023.08.010
Tang Y. L., Huangfu J. L., Huang R. H., Chen W. (2020). Surface warming reacceleration in offshore China and its interdecadal effects on the East Asia-Pacific climate. Sci. Rep. 10, 14811. doi: 10.1038/s41598-020-71862-6
Timmermann A., An S. I., Kug J. S., Jin F. F., Cai W. J., Capotondi A., et al. (2018). El Niño-southern oscillation complexity. Nature 559, 535–545. doi: 10.1038/s41586-018-0252-6
Trenberth K. E., et al. (2007). “Observations: Surface and atmospheric climate change,” in Climate Change 2007: The Physical Science Basis. Ed. Solomon S., et al (Cambridge University Press), 235–336.
Wang C. Q., Li X., Zhang Y. F., Zu Z. Q., Zhang R. Y. (2020a). A comparative study of three SST reanalysis products and buoys data over the China offshore area. Haiyang Xuebao 42, 118–128. doi: 10.3969/j.issn.0253-4193.2020.03.011
Wang F., Li X. G., Tang X. H., Sun X. X., Zhang J. L., Yang D. Z., et al. (2023). The seas around China in a warming climate. Nat. Rev. Earth Environ. 4, 535–551. doi: 10.1038/s43017-023-00453-6
Wang M., Guo J. R., Song J., Fu Y. Z., Sui W. Y., Li Y. Q., et al. (2020b). The correlation between ENSO events and sea surface temperature anomaly in the Bohai Sea and Yellow Sea. Regional Stud. Mar. Science 35, 101228. doi: 10.1016/j.rsma.2020.101228
Wernberg T., Bennett S., Babcock R. C., de Bettignies T., Cure K., Depczynski M., et al. (2016). Climate-driven regime shift of a temperate marine ecosystem. Science 353, 169–172. doi: 10.1126/science.aad8745
Wernberg T., Smale D. A., Tuya F., Thomsen M. S., Langlois T. J., de Bettignies T., et al. (2013). An extreme climatic event alters marine ecosystem structure in a global biodiversity hotspot. Nat. Climate Change 3, 78–82. doi: 10.1038/nclimate1627
Wolter K., Timlin M. S. (1998). Measuring the strength of ENSO events - how does 1997/98 rank? Weather 53, 315–324. doi: 10.1002/j.1477-8696.1998.tb06408.x
Wu L. X., Cai W. J., Zhang L. P., Nakamura H., Timmermann A., Joyce T., et al. (2012). Enhanced warming over the global subtropical western boundary currents. Nat. Climate Change 2, 161–166. doi: 10.1038/nclimate1353
Xiao F., Wang D., Leung M. Y. T. (2020). Early and extreme warming in the South China Sea during 2015/2016: role of an unusual Indian Ocean Dipole event. Geophys. Res. Lett. 47, e2020GL089936. doi: 10.1029/2020GL089936
Yan Y. W., Chai F., Xue H. J., Wang G. H. (2020). Record-breaking sea surface temperatures in the Yellow and East China Seas. J. Geophy. Res. Oceans 125(8), e2019JC015883. doi: 10.1029/2019JC015883
Yang W., Wei H., Zhao L. (2017). Observations of tidal straining within two different ocean environments in the East China Sea: stratification and near-bottom turbulence. J. Geophysical Research-Oceans 122, 8876–8893. doi: 10.1002/2017JC012924
Yin W. B., Ma Y. Z., Wang D., He S. Y., Huang D. J. (2022). Surface upwelling off the Zhoushan Islands, East China Sea, from himawari-8 AHI data. Remote Sensing 14, 3261. doi: 10.3390/rs14143261
Yuan X. J., Kaplan M. R., Cane M. A. (2018). The interconnected global climate system-A review of tropical-polar teleconnections. J. Climate 31, 5765–5792. doi: 10.1175/JCLI-D-16-0637.1
Zeng G., Sun Z. B., Lin Z. H., Ni D. H. (2010). Numerical simulation of impacts of sea surface temperature anomaly upon the interdecadal variation in the northwestern Pacific subtropical high. Atmospheric Sci. 34, 307–322.
Zhang Q. B., Liu B., Li S. L., Zhou T. J. (2023). Understanding models’ Global sea surface temperature bias in mean state: from CMIP5 to CMIP6. Geophys. Res. Lett. 50, e2022GL100888. doi: 10.1029/2022GL100888
Keywords: SST, extreme temperature, Eastern China seas, marine heatwaves, latent heat flux
Citation: Ding W, Wu Q and Chen Y (2024) Trends of maximum annual sea surface temperature in the Eastern China Seas. Front. Mar. Sci. 11:1452125. doi: 10.3389/fmars.2024.1452125
Received: 20 June 2024; Accepted: 29 July 2024;
Published: 14 August 2024.
Edited by:
Li Li, Zhejiang University, ChinaReviewed by:
Qicheng Meng, Ministry of Natural Resources, ChinaTianqi Xiong, Qingdao University, China
Copyright © 2024 Ding, Wu and Chen. This is an open-access article distributed under the terms of the Creative Commons Attribution License (CC BY). The use, distribution or reproduction in other forums is permitted, provided the original author(s) and the copyright owner(s) are credited and that the original publication in this journal is cited, in accordance with accepted academic practice. No use, distribution or reproduction is permitted which does not comply with these terms.
*Correspondence: Qiong Wu, cWlvbmd3dV9lZHVAeWVhaC5uZXQ=