- 1Institute for Marine and Antarctic Studies, University of Tasmania, Hobart, TAS, Australia
- 2Australian Antarctic Program Partnership, Hobart, TAS, Australia
- 3Australian Antarctic Division, Department of Climate Change, Energy, the Environment and Water, Kingston, TAS, Australia
In the Indian sector of the Southern Ocean, 80°E marks an important transition in ocean circulation between the greater Prydz Bay gyre to the west and the Australian Antarctic gyre to the east. Here, the submarine Kerguelen Plateau impedes the eastward flow of the Antarctic Circumpolar Current (ACC), topographically steering the flow. Enhanced biological productivity associated with the southern plateau supports an important marine ecosystem with many foraging marine predators. We collate ship-based hydrographic data on the vertical structure of the upper water column near 80°E from eight voyages spanning 1994 to 2021, from 58°S towards the Antarctic continent. The study aims to investigate the mixed layer oceanography, the implications for nutrient supply from deep to near-surface waters, and associated biological production. Our results show that the major oceanographic fronts are constrained within the narrow Princess Elizabeth Trough, between the southern Kerguelen Plateau and the Antarctic slope. Therefore, the Southern Boundary and the Southern ACC Front (SACCF) are often co-located, albeit with some interannual variability, with the location of the SACCF ranging from roughly 63°S to 65°S. The average depth of the seasonal mixed layer ranges from 34-49 m, typically deepening from south to north, in association with longer time since sea-ice melt. Below the mixed layer, Winter Water (WW) characteristics also vary across the observed latitudinal range; typically the temperature and thickness of the WW layer are inversely related, with warmer WW layers being thinner. Subsurface nitrate concentrations range from 20-40 µM, while silicate concentrations reach 100 µM. Nutrient drawdown is calculated based on mean concentrations in the mixed layer and WW layer, with drawdown values at individual stations reaching nearly 12 µM and 60 µM for nitrate and silicate, respectively, and a positive correlation between the two. Nutrient drawdown was higher in association with longer time since sea-ice melt and with thinner WW layers, while higher nitrate-based production was associated with deeper mixed layers. Observed relationships between upper water column characteristics and biological processes are discussed in terms of likely nutrient supply mechanisms and seasonal patterns of utilization.
1 Introduction
The Southern Ocean plays a central role in supporting the global climate, providing a direct link to global biogeochemical cycles through redistributing nutrients, carbon, and oxygen between the major ocean basins, and between the deep ocean, surface ocean, and atmosphere (Henley et al., 2020). It connects the Indian, Pacific, and Atlantic Oceans through the influence of the Antarctic Circumpolar Current (ACC) (Orsi et al., 1995). The eastward-flowing ACC is deflected by topography in different regions of the Southern Ocean (Lu et al., 2020; Talley, 2011; Williams et al., 2010); when passing through constrictive bathymetric troughs or around major submarine plateaus, the flow intensifies, and meridional meandering may occur downstream, facilitating enhanced mesoscale eddy activity associated with cross frontal exchange and upwelling (Foppert et al., 2017; Tamsitt et al., 2017; Rintoul, 2018). In the south Indian sector, the major obstacle is the submarine Kerguelen Plateau, which significantly influences the path of the ACC (Sparrow et al, 1996; Heywood et al., 1999; Vivier et al., 2015; Bestley et al., 2020). As the ACC approaches the southern Kerguelen Plateau (SKP), the Southern Boundary (SB) and Southern ACC Front (SACCF) are diverted to the south through the Princess Elizabeth Trough (PET). Further east, their flow is then deflected northward along the eastern flank of the SKP.
The Southern Ocean overall is known to be a high nutrient low chlorophyll (HNLC) region, due to low concentrations of iron that limit phytoplankton production despite the availability of macronutrients (Boyd et al., 2012; Henley et al., 2020). Iron is supplied through various mechanisms including dust deposition, sea-ice melt, redistribution of suspended sediments from shallow shelf areas, and glacial meltwater from ice shelves and icebergs (Gao et al., 2020; Laufkötter et al., 2018; Rintoul, 2018; Schallenberg et al., 2018). The sustained phytoplankton blooms observed in the SKP region are thought to result from a higher subsurface iron supply here than other regions (Schallenberg et al., 2018). This increased primary production may positively influence Antarctic krill (Nicol et al., 2000b; Nicol and Raymond, 2012; Bestley et al., 2018) and their dependent higher-order predators (Raymond et al., 2015; Patterson et al., 2016) including migratory species such as humpback whales (Bestley et al., 2019).
Physical features affecting the upper ocean structure can have a large influence on primary production given the reliance of phytoplankton cells on light and nutrients for growth (Pinkerton et al., 2021). Phytoplankton growth is constrained to within the euphotic zone (where incoming light is sufficient for photosynthesis). If the mixed layer is deeper than this, and cells are mixed below the euphotic zone, then growth may be sub-optimal due to periods of darkness. Mixed layer dynamics are therefore important for phytoplankton, as light limitation may reduce phytoplankton growth and overall primary productivity (Nelson and Smith, 1991; Westwood et al., 2010). The structure of the water column also influences macro- and micro-nutrient supply, including upwelling of nutrients into surface waters (Williams et al., 2010).
There are also significant seasonal influences on the control of phytoplankton growth (Arrigo et al., 2008). The high latitude of the Southern Ocean means that light availability shows a strong oscillation between limited daylight in winter and extended daylight hours in summer. The seasonal advance and retreat of sea ice also exerts an important control on upper ocean dynamics, influencing both light and nutrient availability. When sea ice melts, the release of low-salinity water stratifies the water column, and iron is also released (Person et al., 2021). This creates favorable conditions for phytoplankton growth and ice-edge blooms are often observed (Westwood et al., 2010; Williams et al., 2010). Seasonal summer warming serves to stratify the upper water column and stabilizes the mixed layer while in winter, the mixed layer again deepens (Sallée et al., 2010). In ice-free regions, decreasing temperatures and enhanced winds convect the water column and deepen the mixed layer; in the seasonal ice zone, brine rejection enhances convection and deepens the mixed layer (Williams et al., 2010). A clear signature in polar waters is the remnant winter mixed layer, or Winter Water, evident as a cold temperature minimum layer beneath the summer mixed layer above (e.g. van Wijk et al., 2010).
To understand how physical conditions may control biological dynamics, there have been several multi-disciplinary survey efforts to observe the structure and function of marine ecosystem components in the SKP region. Namely, the voyages are BROKE in 1996 (e.g. Nicol et al., 2000a; Wright and van den Enden, 2000); BROKE-West in 2006 (e.g. Williams et al., 2010; Meijers et al., 2010); KAXIS in 2016 (e.g. Schallenberg et al., 2018; Bestley et al., 2020); and TEMPO in 2021 (e.g. Cox et al., 2022; Heidemann et al., 2024). The SKP region is also sampled by international GO-SHIP efforts along repeat hydrography section I08S (https://www.go-ship.org/). This study collates data from eight occupations near or along 80°E – through the TEMPO, BROKE, BROKE-West, and GO-SHIP efforts – spanning from 1994 to 2021 to allow for a more comprehensive study of upper ocean dynamics and physical-biological linkages in this significant region. Newly recorded TEMPO data, from the 2021 survey, are placed into broader temporal context to investigate patterns within and between years. The main aims of the study are to 1) examine the upper water column structure across the eight voyages; 2) describe the variability of upper-ocean properties over time; and 3) examine relationships between key physical properties and their influence on nutrient availability and production.
2 Data
2.1 Oceanographic data
The project focuses on the area around 80°E, between 58°S and 68°S (Figure 1; Table 1). The study area includes the southern part of the Kerguelen plateau, the Princess Elizabeth Trough (PET), and south to the East Antarctic shelf break. The oceanographic data presented here were collected across eight different voyages, from as early as 1994 to the most recent TEMPO data in 2021. All data prior to 2021 can be obtained from CCHDO (https://cchdo.ucsd.edu/); TEMPO data is available through the MNF portal (https://www.marine.csiro.au/data/trawler/survey_details.cfm?survey=IN2021_V01). We use a total of 121 CTD profiles across the eight surveys in this study.
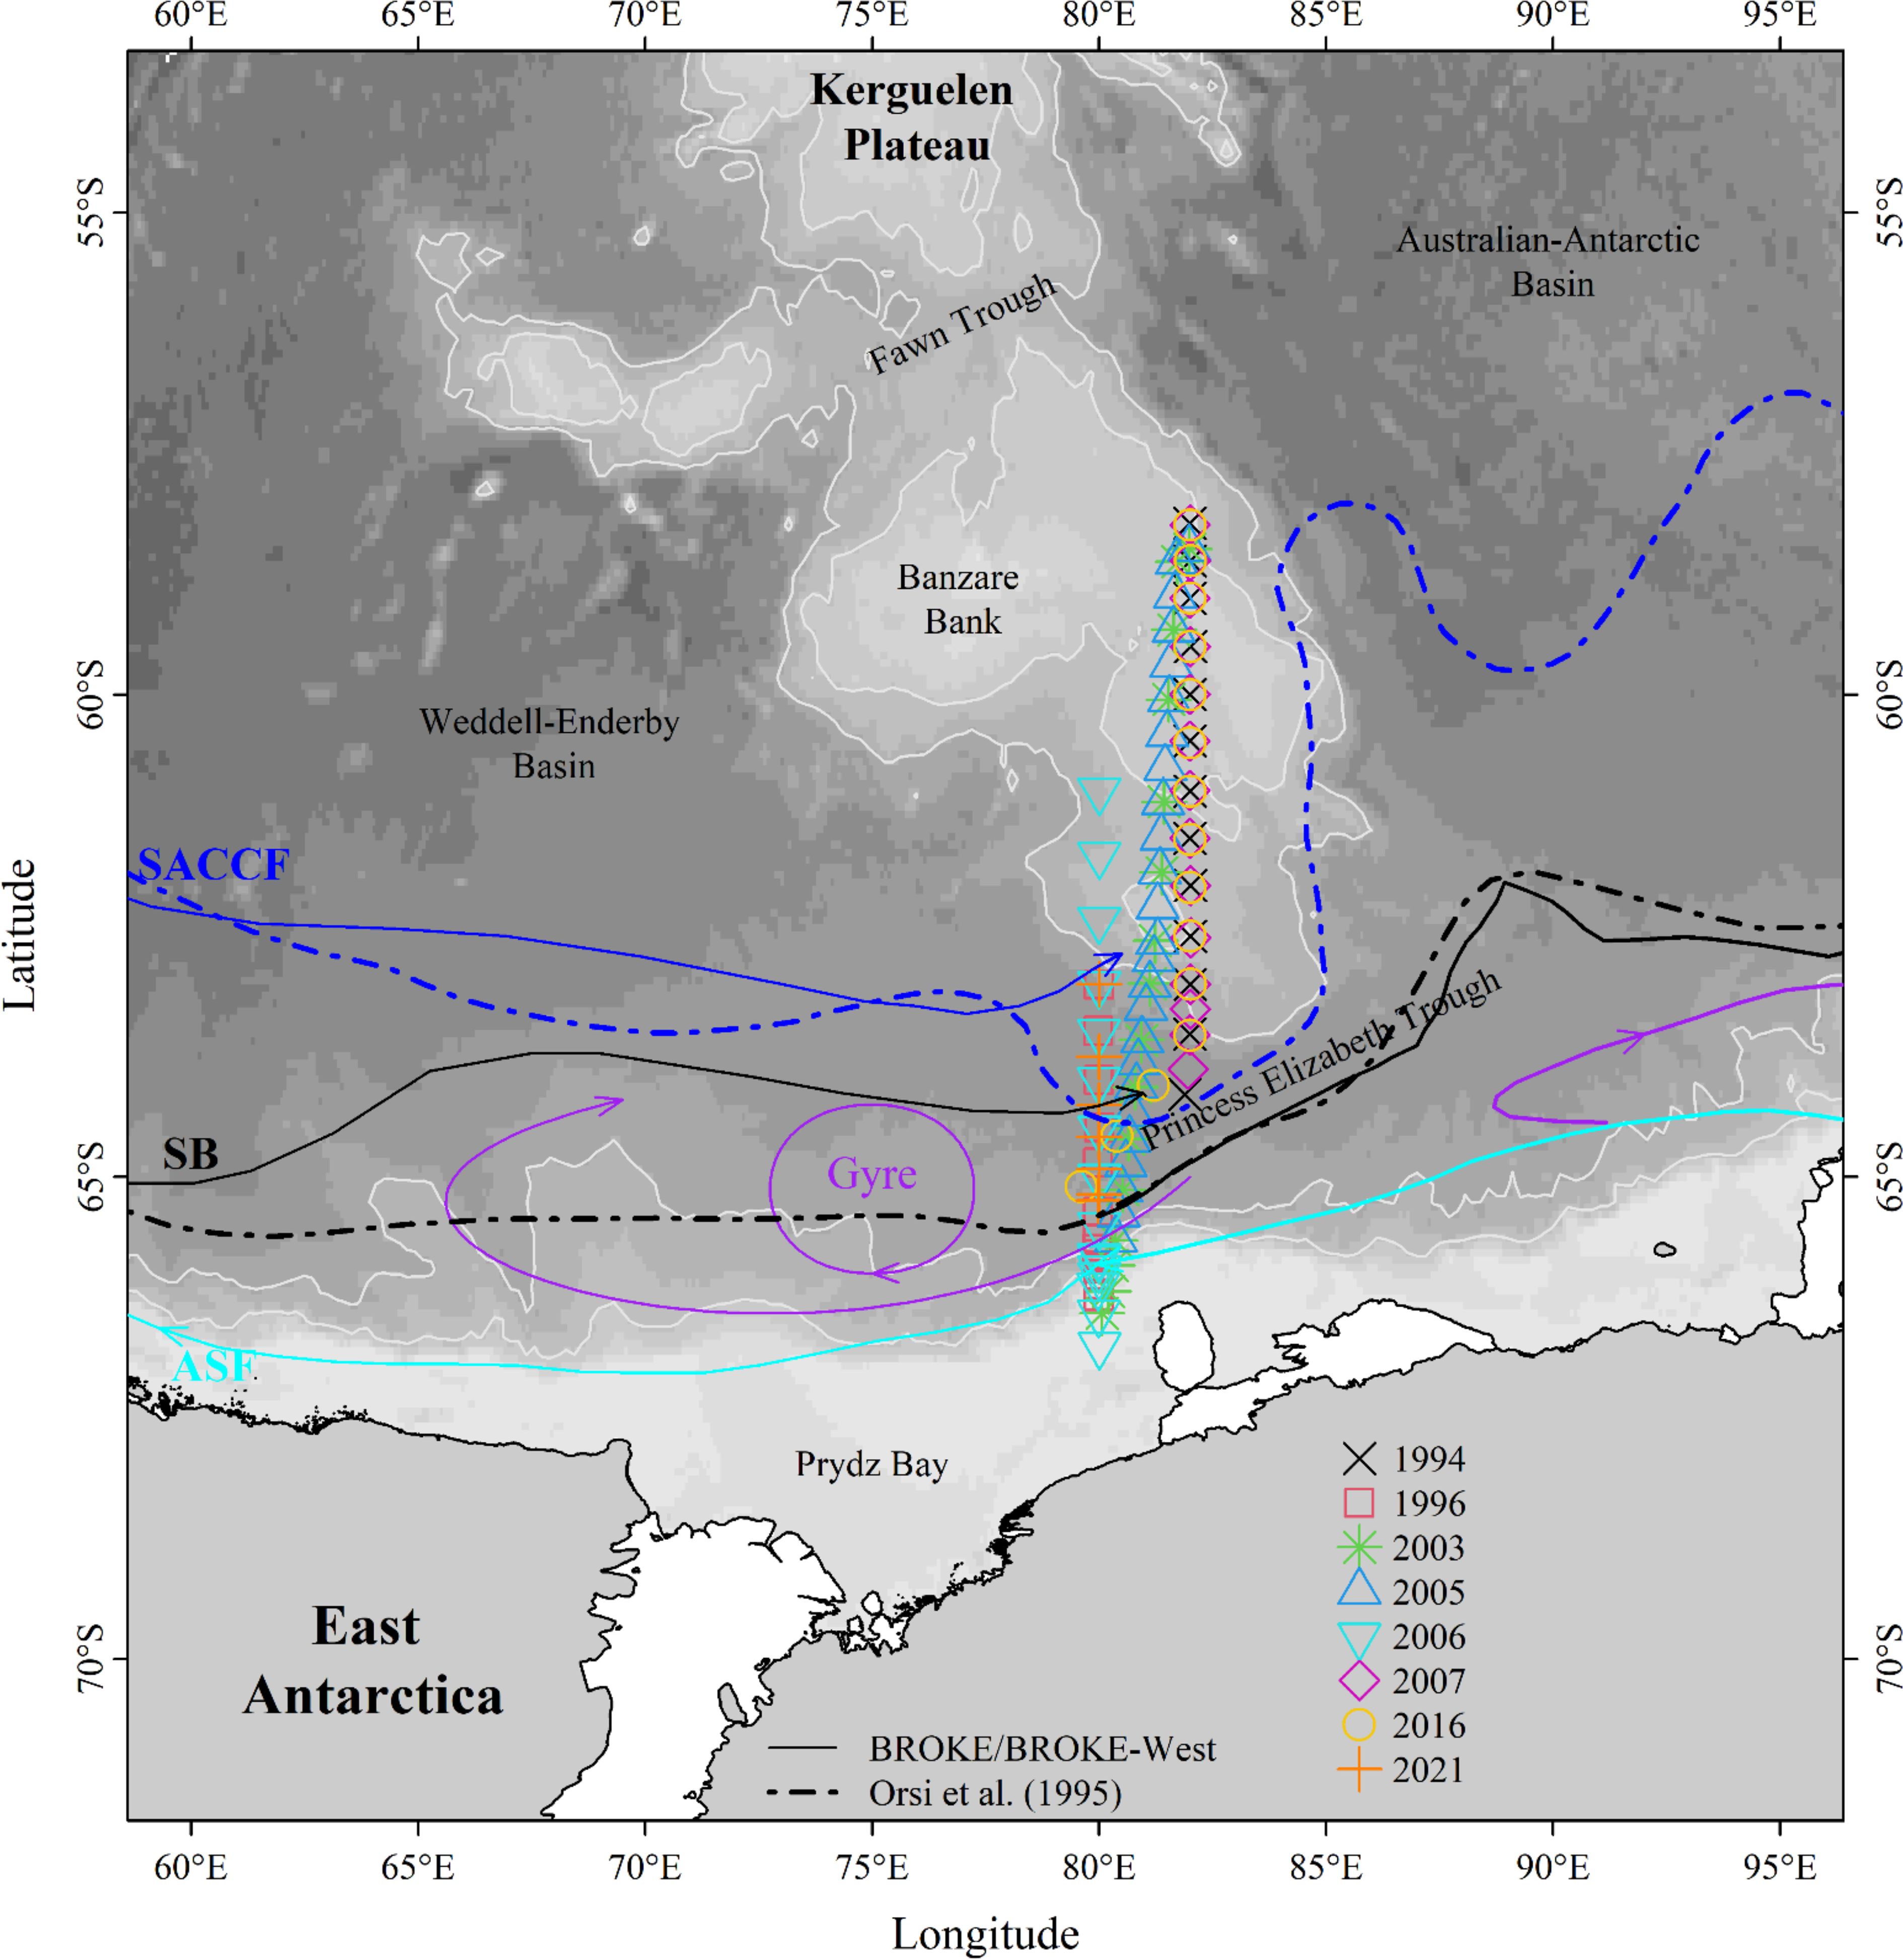
Figure 1. Map of study area. The eight oceanographic voyages are shown with different colored/shaped symbols (see legend). The major fronts in the study region include: the Southern Antarctic Circumpolar Current Front (SACCF), the Southern Boundary (SB), and the Antarctic Slope Front (ASF). All fronts are shown by lines [solid line – BROKE (Bindoff et al., 2000) and BROKE-West (Meijers et al., 2010; Williams et al., 2010); dash line – Orsi et al. (1995)]. The background shows bathymetry from GEBCO.
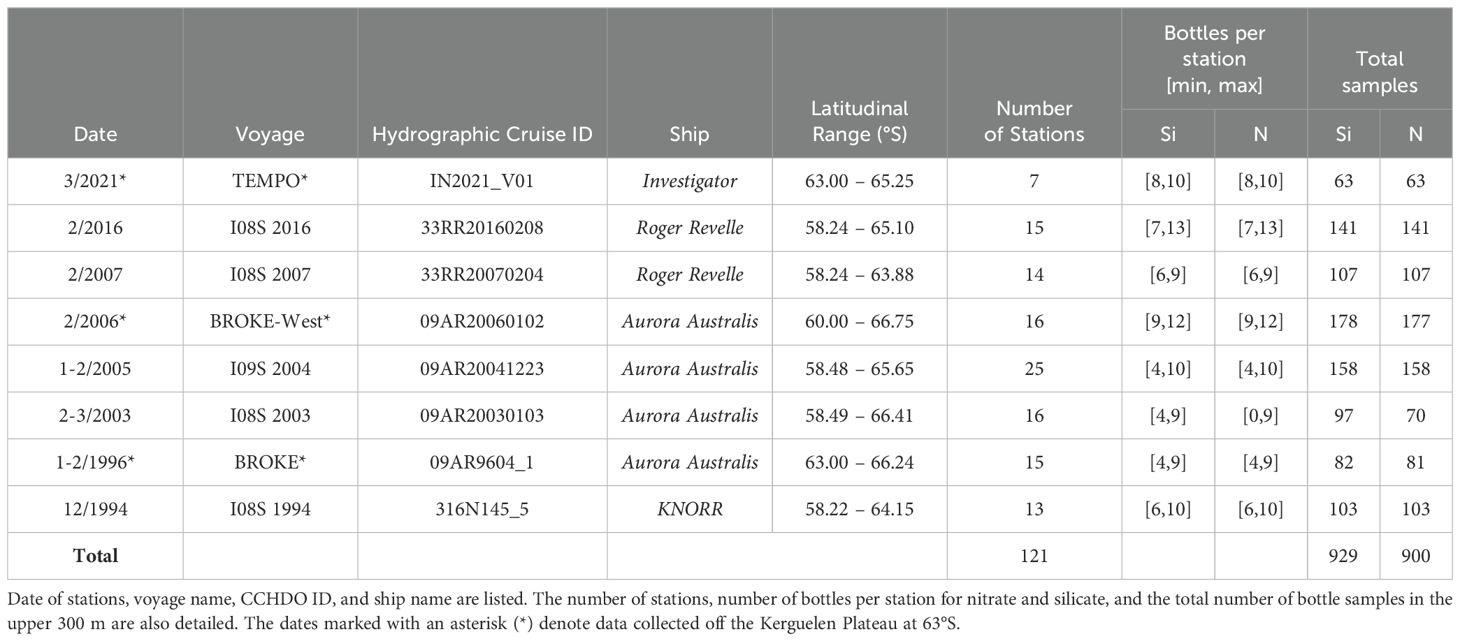
Table 1. Voyage summary information for each oceanographic cruise and stations/samples included in this study.
In the northern part of the study region, north of about 64°S, repeat oceanographic transects along I08S are at 82°E (1994, 2003, 2005, 2007, 2016) and these transects traverse the submarine SKP before dog-legging west to 80°E (Figure 1). Other multidisciplinary marine surveys along 80°E include BROKE (1996), BROKE-West (2006) and TEMPO (2021). The southern extent of each occupation is generally determined by sea-ice extent or by the continental shelf break. Hence, the 1994 and 2007 cruises provided data mainly over the SKP to the north of around 64°S, while the surveys extended much further south in other years (to nearly 67°S; Figure 1).
All hydrographic data are from the austral summer, i.e. December to March. By coincidence, the year that each voyage was conducted roughly corresponds to the time throughout the summer season that the sampling occurred. That is, the 1994 voyage was conducted in early December, the 1996 voyage in January, the 2003-2016 voyages in February, and the 2021 voyage in March. The one exception is 2005, conducted at the end of January to early February (Table 1).
Ship-based CTD data provide temperature (°C), salinity (PSS-78), concentration of dissolved oxygen (DO; µmol kg-1), and pressure (dbar) throughout the water column. Fluorescence measurements were not taken on every voyage and have therefore been excluded from this study. The data were examined over the upper 1000 m. Using the Gibbs Seawater toolbox (McDougall and Barker, 2011), we calculate the conservative temperature (CT, °C), absolute salinity (SA, g kg-1), neutral density (γn, kg m-3), potential density referenced to the surface (σ0, kg m-3), and the buoyancy frequency (N2, s-2). Potential density and buoyancy frequency are both used to calculate the mixed layer depth (as described in Section 3.2).
Each of the 121 CTD profiles had corresponding macronutrient data from discrete bottle samples. Within the upper 300 m these comprise a total of 900 nitrate and 929 silicate measurements (µM; Table 1), respectively. These data were combined with the CTD sensor data to estimate nutrient drawdown (µM) and primary production (mg Carbon m-2 d-1; as described in Section 3.3).
2.2 Ancillary environmental information
The National Snow and Ice Data Centre SMMR-SSM/I polar product, which is available for the Southern Hemisphere gridded at 25 km resolution, provided the daily passive microwave estimates of percentage of sea-ice concentration (Cavalieri et al., 1996; Maslanik and Stroeve, 1999). These data were used to calculate the ice-free days, defined as the time since the concentration of ice fell below 15%. Bathymetry data comes from the General Bathymetric Chart of the Oceans GEBCO_2014 Grid, version 20150318 (Weatherall et al., 2015; https://www.gebco.net/).
3 Methods
3.1 Definitions for water masses and major fronts
In this paper, we follow Bestley et al. (2020) (their Tables 1 and 2, and references therein) for the definitions of water masses and major fronts. The surface layer of the upper ocean is Antarctic Surface Water (AASW), defined where the neutral density is less than 28 kg m-3 and the temperature below 2°C. Within this water mass, Winter Water (WW) is the remnant deep winter mixed layer, defined subsurface where the temperature is less than 0.5°C beneath the overlying seasonal mixed layer (ML); the ML is determined according to the density method outlined in section 3.2.
Below AASW lies the warmer and more saline Circumpolar Deep Water (CDW). In this region, the area of lowest oxygen (e.g. DO< 200 µmol kg-1) identifies Upper Circumpolar Deep Water (UCDW), and the signature of maximum salinity (e.g. SA > 34.7 g kg-1) identifies Lower Circumpolar Current Deep Water (LCDW). As UCDW rises southwards and its properties are modified through mixing, the cooled and freshened form is called Modified Circumpolar Deep Water (mCDW).
Following Orsi et al. (1995), in this region we use the subsurface 1.5°C and 1.8°C isotherms to define the locations of the Southern Boundary (SB) and the Southern ACC Front (SACCF), respectively. The SB marks the location where CDW has cooled enough to be recognized as mCDW, i.e. south of SB the subsurface maximum temperature is less than 1.5°C.
Along the Antarctic shelf break, there is a strong sub-surface horizontal density gradient associated with the Antarctic Slope Front (ASF), which is often coincident with the vertical plunge of the 0°C isotherm (Ainley and Jacobs, 1981). Here, we define the ASF to be the location where the 0.5°C isotherm at the bottom of the temperature minimum layer reaches 200 m depth. This is similar to the northern extent of the ASF in the greater Prdyz Bay region used by Foppert et al. (2024).
3.2 Mixed layer depth calculation
To investigate the vertical structure of the upper ocean two methods were used to calculate mixed layer depth. The first defines it to be the depth at which the potential density difference (Δσ0) is 0.03 kg m-3 from the near-surface (10 dbar), following the global approach of de Boyer Montégut et al. (2004). The second method defines the ‘ecologically relevant’ mixed layer depth using the maximum buoyancy frequency (N2) following Carvalho et al. (2017). Figure 2 shows an example of the results based on both methods.
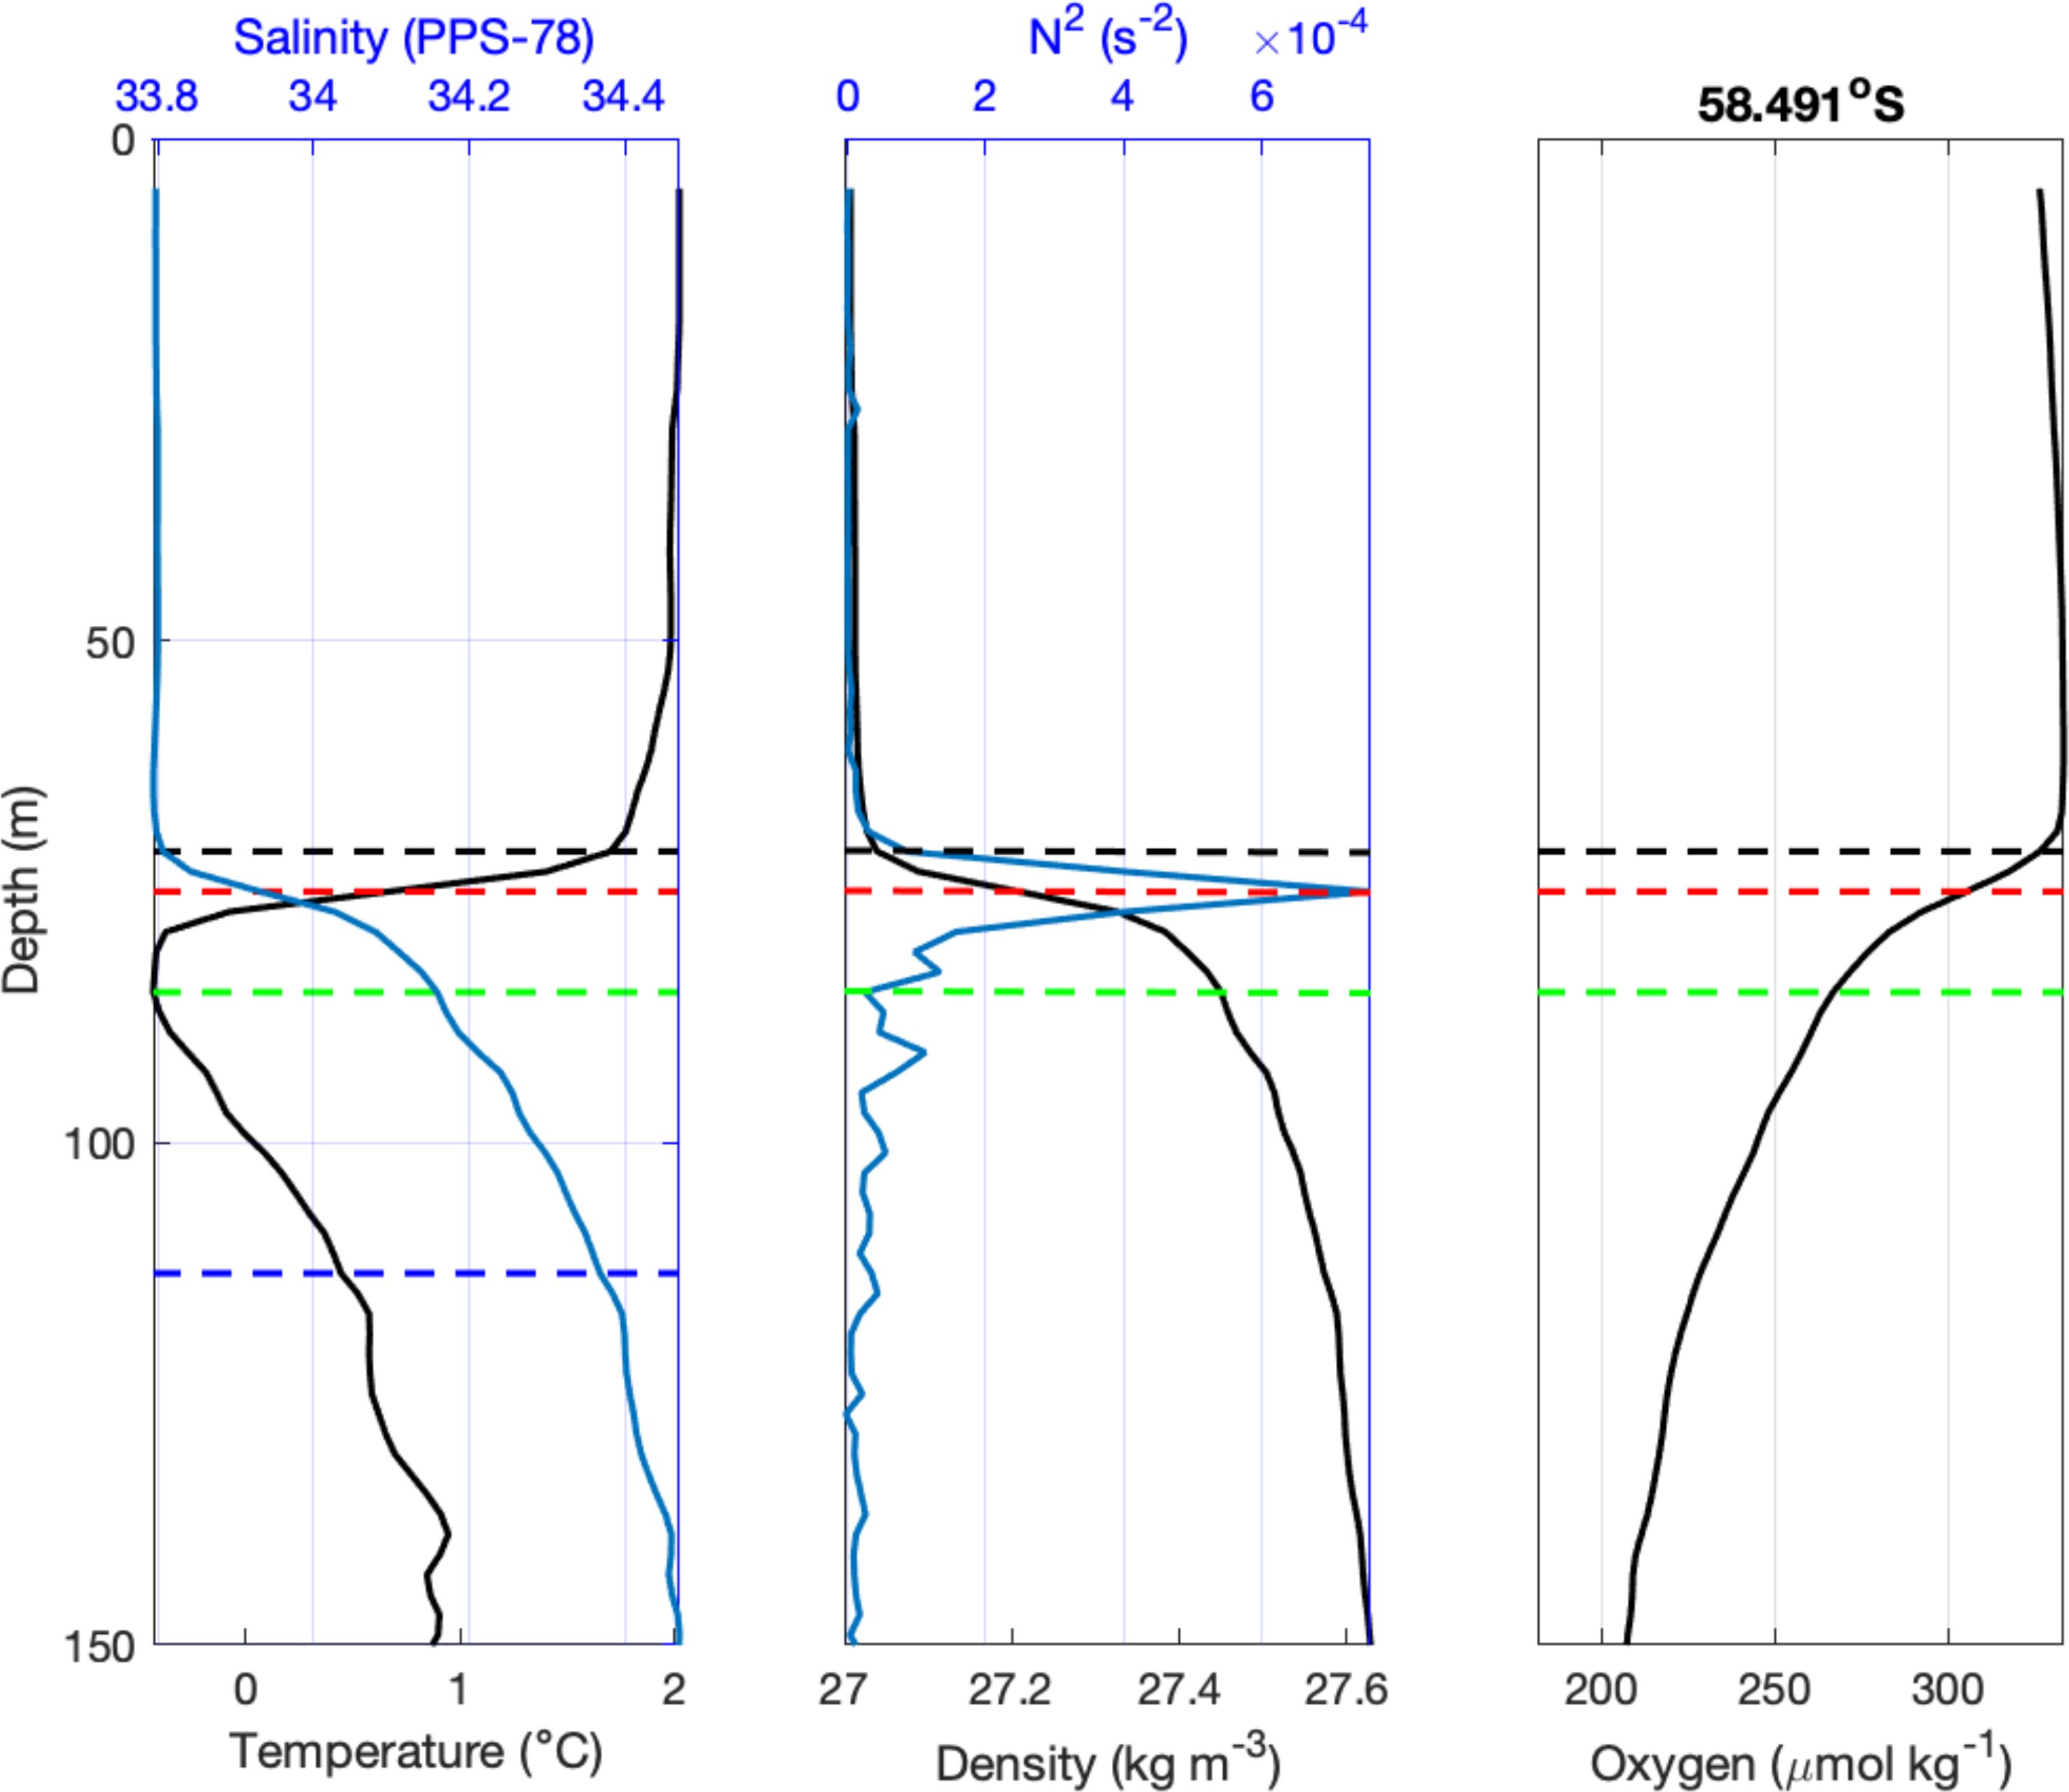
Figure 2. Example profiles of upper-ocean structure. Left: Temperature and salinity; Middle: potential density and buoyancy frequency (N2); Right: dissolved oxygen. The dashed lines indicate mixed layer depth as determined by the density-based criterion (black) and the N2 maximum (red). Below, the depth of temperature minimum (green) and the base of the Winter Water layer (blue; left panel) are shown.
3.3 Nutrient drawdown and seasonal production
To understand the connection between physical properties and biological production, the drawdown of nitrate and silicate in the upper ocean was calculated from the bottle data, and the seasonal production associated with them were quantified following Westwood et al. (2010). For drawdown, we first calculated the average concentration of nitrate and silicate within the (density-based) mixed layer and then subtracted this from the average concentration in the WW below (i.e. [N]WW – [N]ML is the nitrate drawdown in units of µM). This represents the amount of nutrients that the phytoplankton had used since the previous winter. For this calculation we included only stations north of the Antarctic Slope Front, where WW is clearly observed, and those that have high quality nutrient data in both the mixed layer and WW. As outlined above, WW averages included all bottles located beneath the density-based mixed layer, where the CTD trace indicated temperature was ≤ 0.5°C, i.e., bottles above the base of the temperature-minimum (or WW) layer. This difference between the 0.5°C isotherm depth (WW base) and the mixed layer depth is considered the thickness of the WW layer.
Nutrient drawdown was converted to carbon drawdown using the ratios of Redfield (1958) and Copin-Montegut and Copin-Montegut (1978). That is, C:N = 6.6. and C:Si = 2.5, respectively. Seasonal production rates (mg C m-2 d-1) were calculated by determining the number of growth days for phytoplankton over the season. Growth days were estimated through deriving the time since sea-ice melt from satellite data, at the time and location that stations were sampled (Westwood et al., 2010). Thus, seasonal production of carbon by nitrate, for example, is given by:
where Tgrowth is the number of days since sea ice melt, 6.6 is the Redfield ratio, and 12.01 g mol-1 is the molecular weight of carbon. Recall [N]WW – [N]ML is the nitrate drawdown in µM (or mmol m-3) and MLD is the mixed layer depth based on the density criterion.
3.4 Relationships between physical and biological parameters
To explore relationships between upper water column structure, physical drivers, and biological processes we fitted a series of linear regression models using the freely available R statistical software version 4.3.2 (R Core Team, 2023). We fitted separate models to investigate each of the following response variables: a) winter water thickness, b) winter water nitrate, c) mixed-layer nitrate, d) nitrate-based drawdown and e) nitrate-based production. We firstly inspected the correlation between predictor variables and used variance inflation factors (VIFs) as a guide for selecting candidate variable combinations for any given model, aiming for VIFs of approximately 3 or below (Zuur et al., 2010). Candidate predictor variables considered are summarized in Electronic Supplementary Material Table S1. To identify the best set of predictor variables we used automatic model selection methods (Burnham and Anderson, 2002) ranking models based on AICc, as implemented via the dredge() function in the library(MuMIn) (Barton, 2023). The results shown are the predictor terms retained in the highest-ranked models based on AICc; in the case where the ΔAICc was< 2 the simplest (most parsimonious) model was selected. This aspect of the data analysis again excluded observations south of the ASF (n=29), as well as those stations immediately north of the ASF/south of the SB where the ‘WW’ was anomalously thick (≥130m) due to the ASF influence (n=6). Data from two cold core eddies, located at 63.6°S in 2005 and 64°S in 2006, were similarly excluded.
4 Results
The ocean characteristics and water column structure observed over the eight voyages, 1994-2021, are shown in Figures 3 and 4, with the latter focusing on the upper 1000 m. Occupying the deepest of these layers, LCDW is evident as a high salinity (SA > 34.7 g/kg) tongue underlying UCDW above. The core of the UCDW is characterized by high temperature (CT > 1.8°C) and low oxygen (< 180 µmol/kg) signatures, typically below 150 m and above 500 m in this region. The near surface is occupied by AASW, which during these summertime voyages is characterized by a warmed seasonal mixed layer overlying a cold WW layer (temperature minimum layer with CT< 0.5°C) that is a remnant of the deep winter mixed layer.
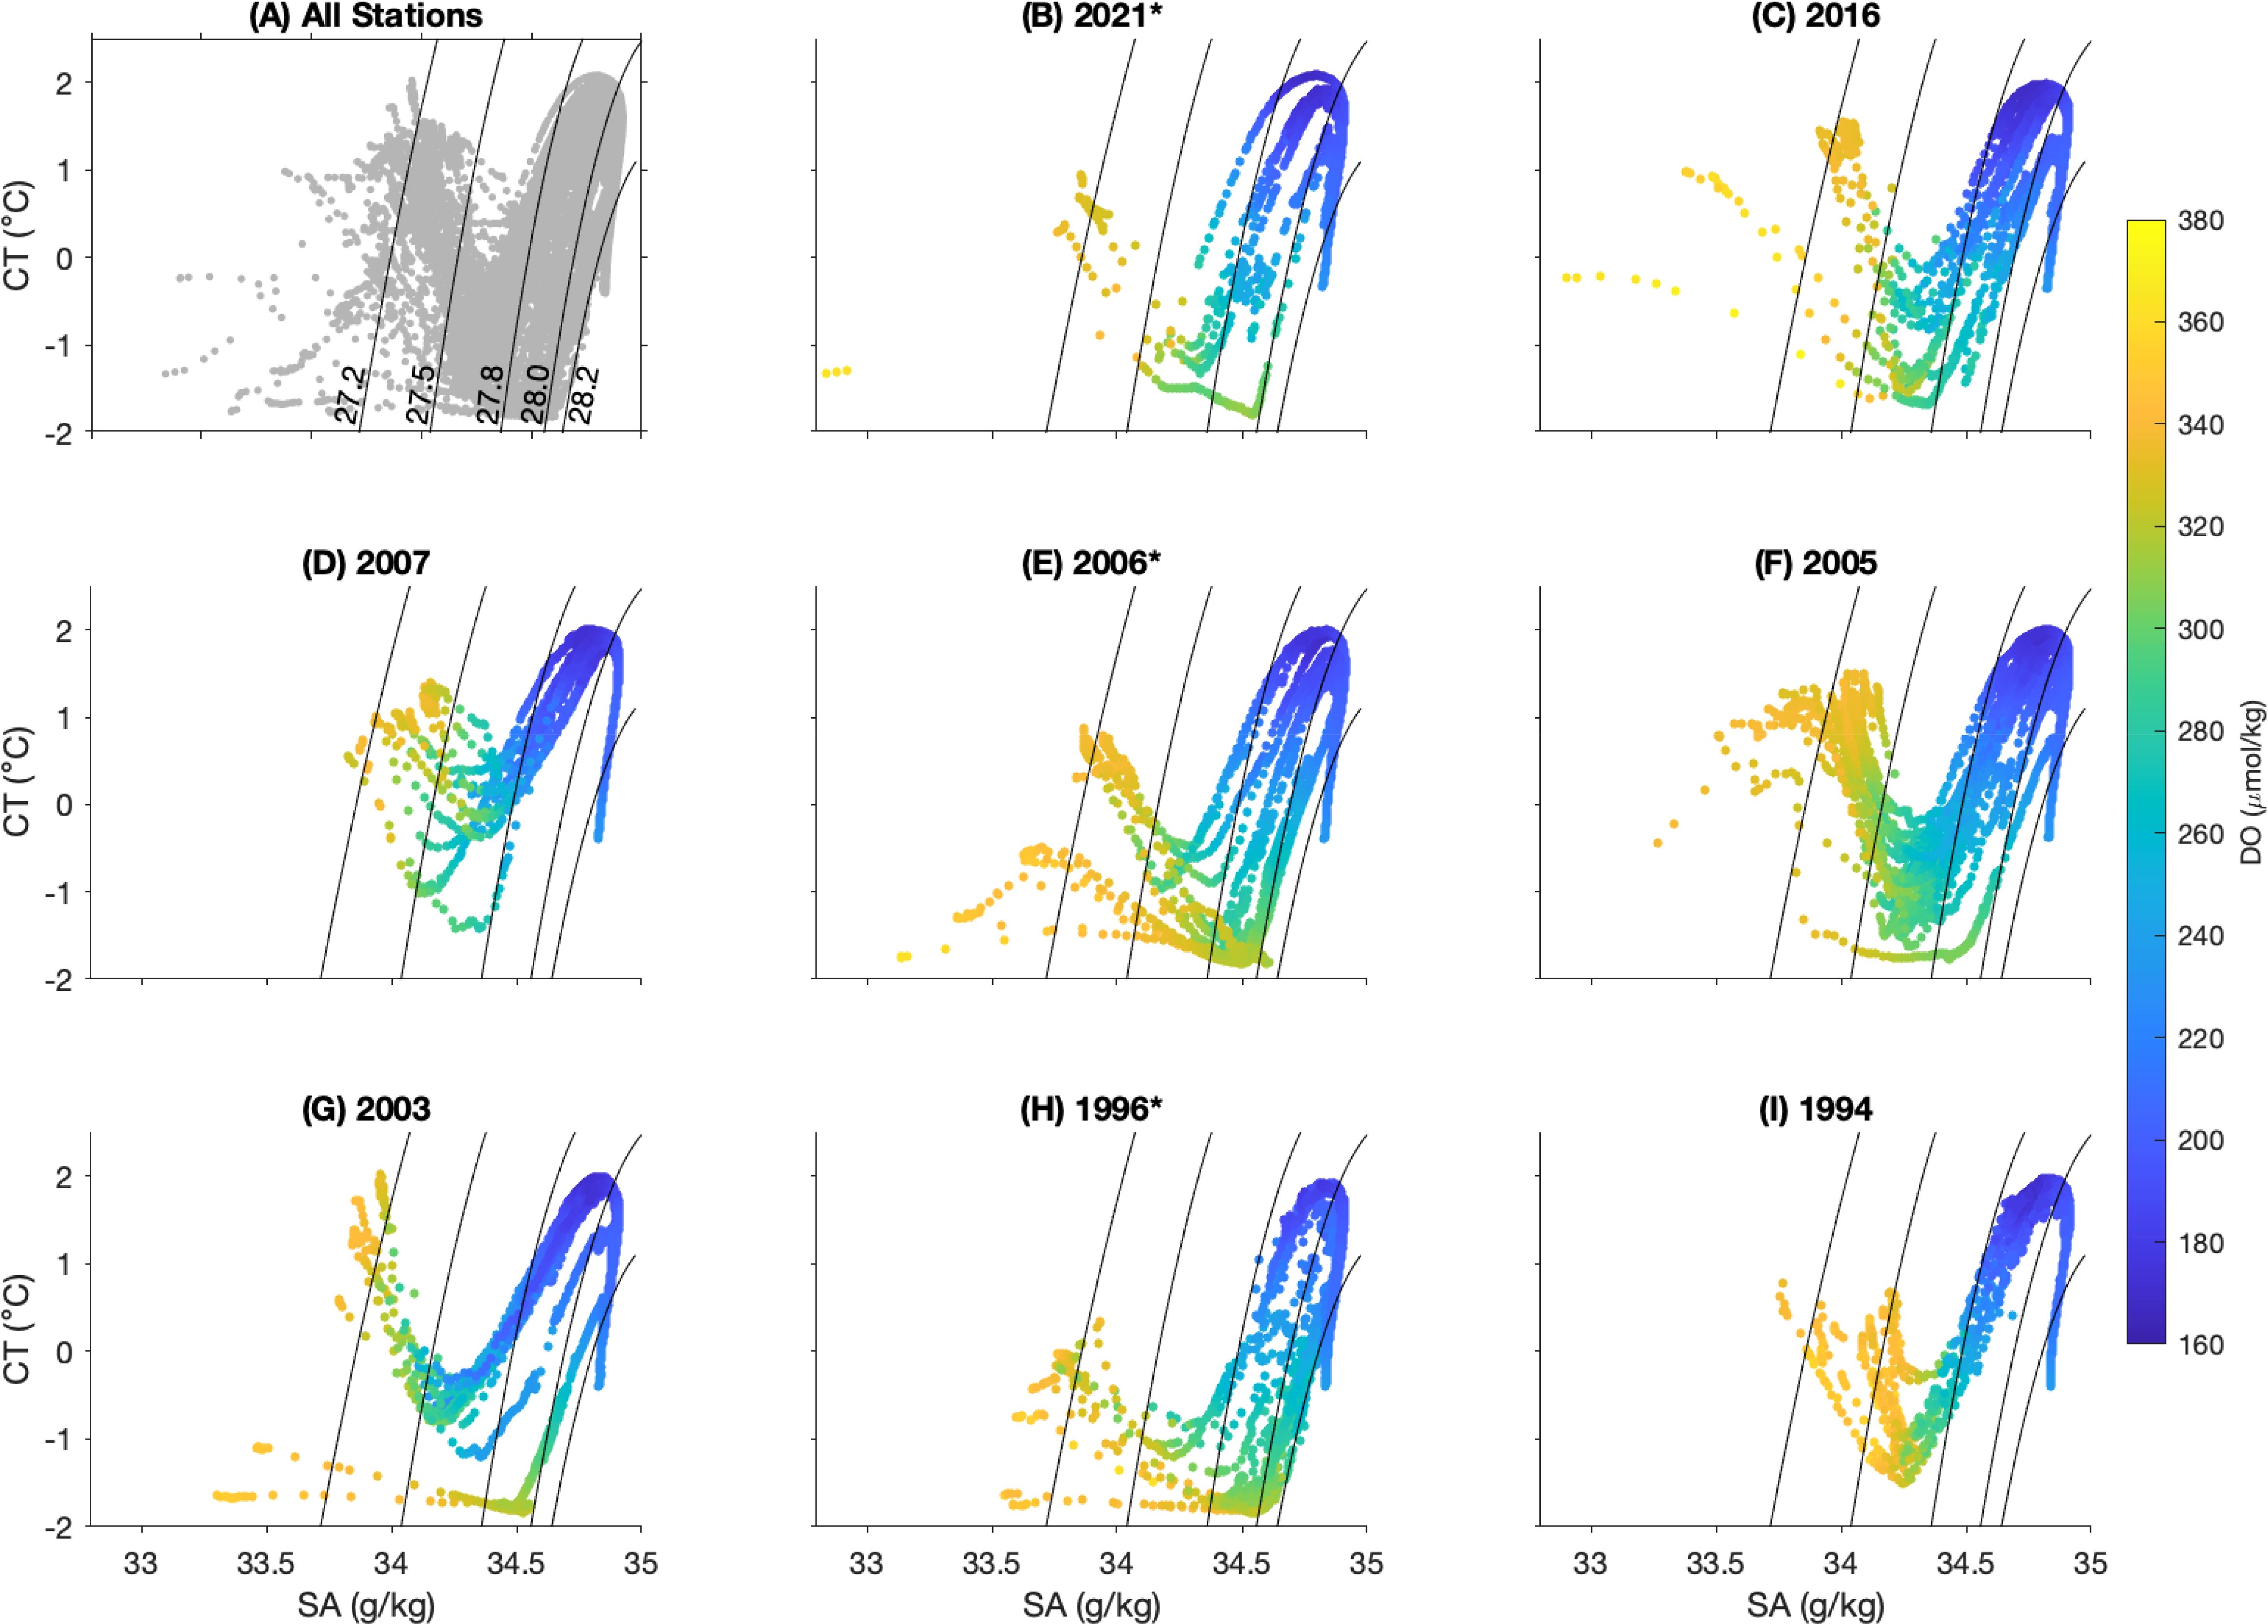
Figure 3. Conservative temperature and absolute salinity diagram. (A) T-S diagrams from all casts from the eight occupations. (B–I) T-S diagrams from the individual occupation, with year of occupation in the title.Colours represent the concentration of dissolved oxygen (DO, µmol kg-1). Solid lines are neutral density contours with values of gn = 27.2, 27.5, 27.8, 28.0, and 28.2 kg m-3, as labelled in (A). The voyages marked with an asterisk (*) are those where data was collected off the Kerguelen Plateau at 63°S.
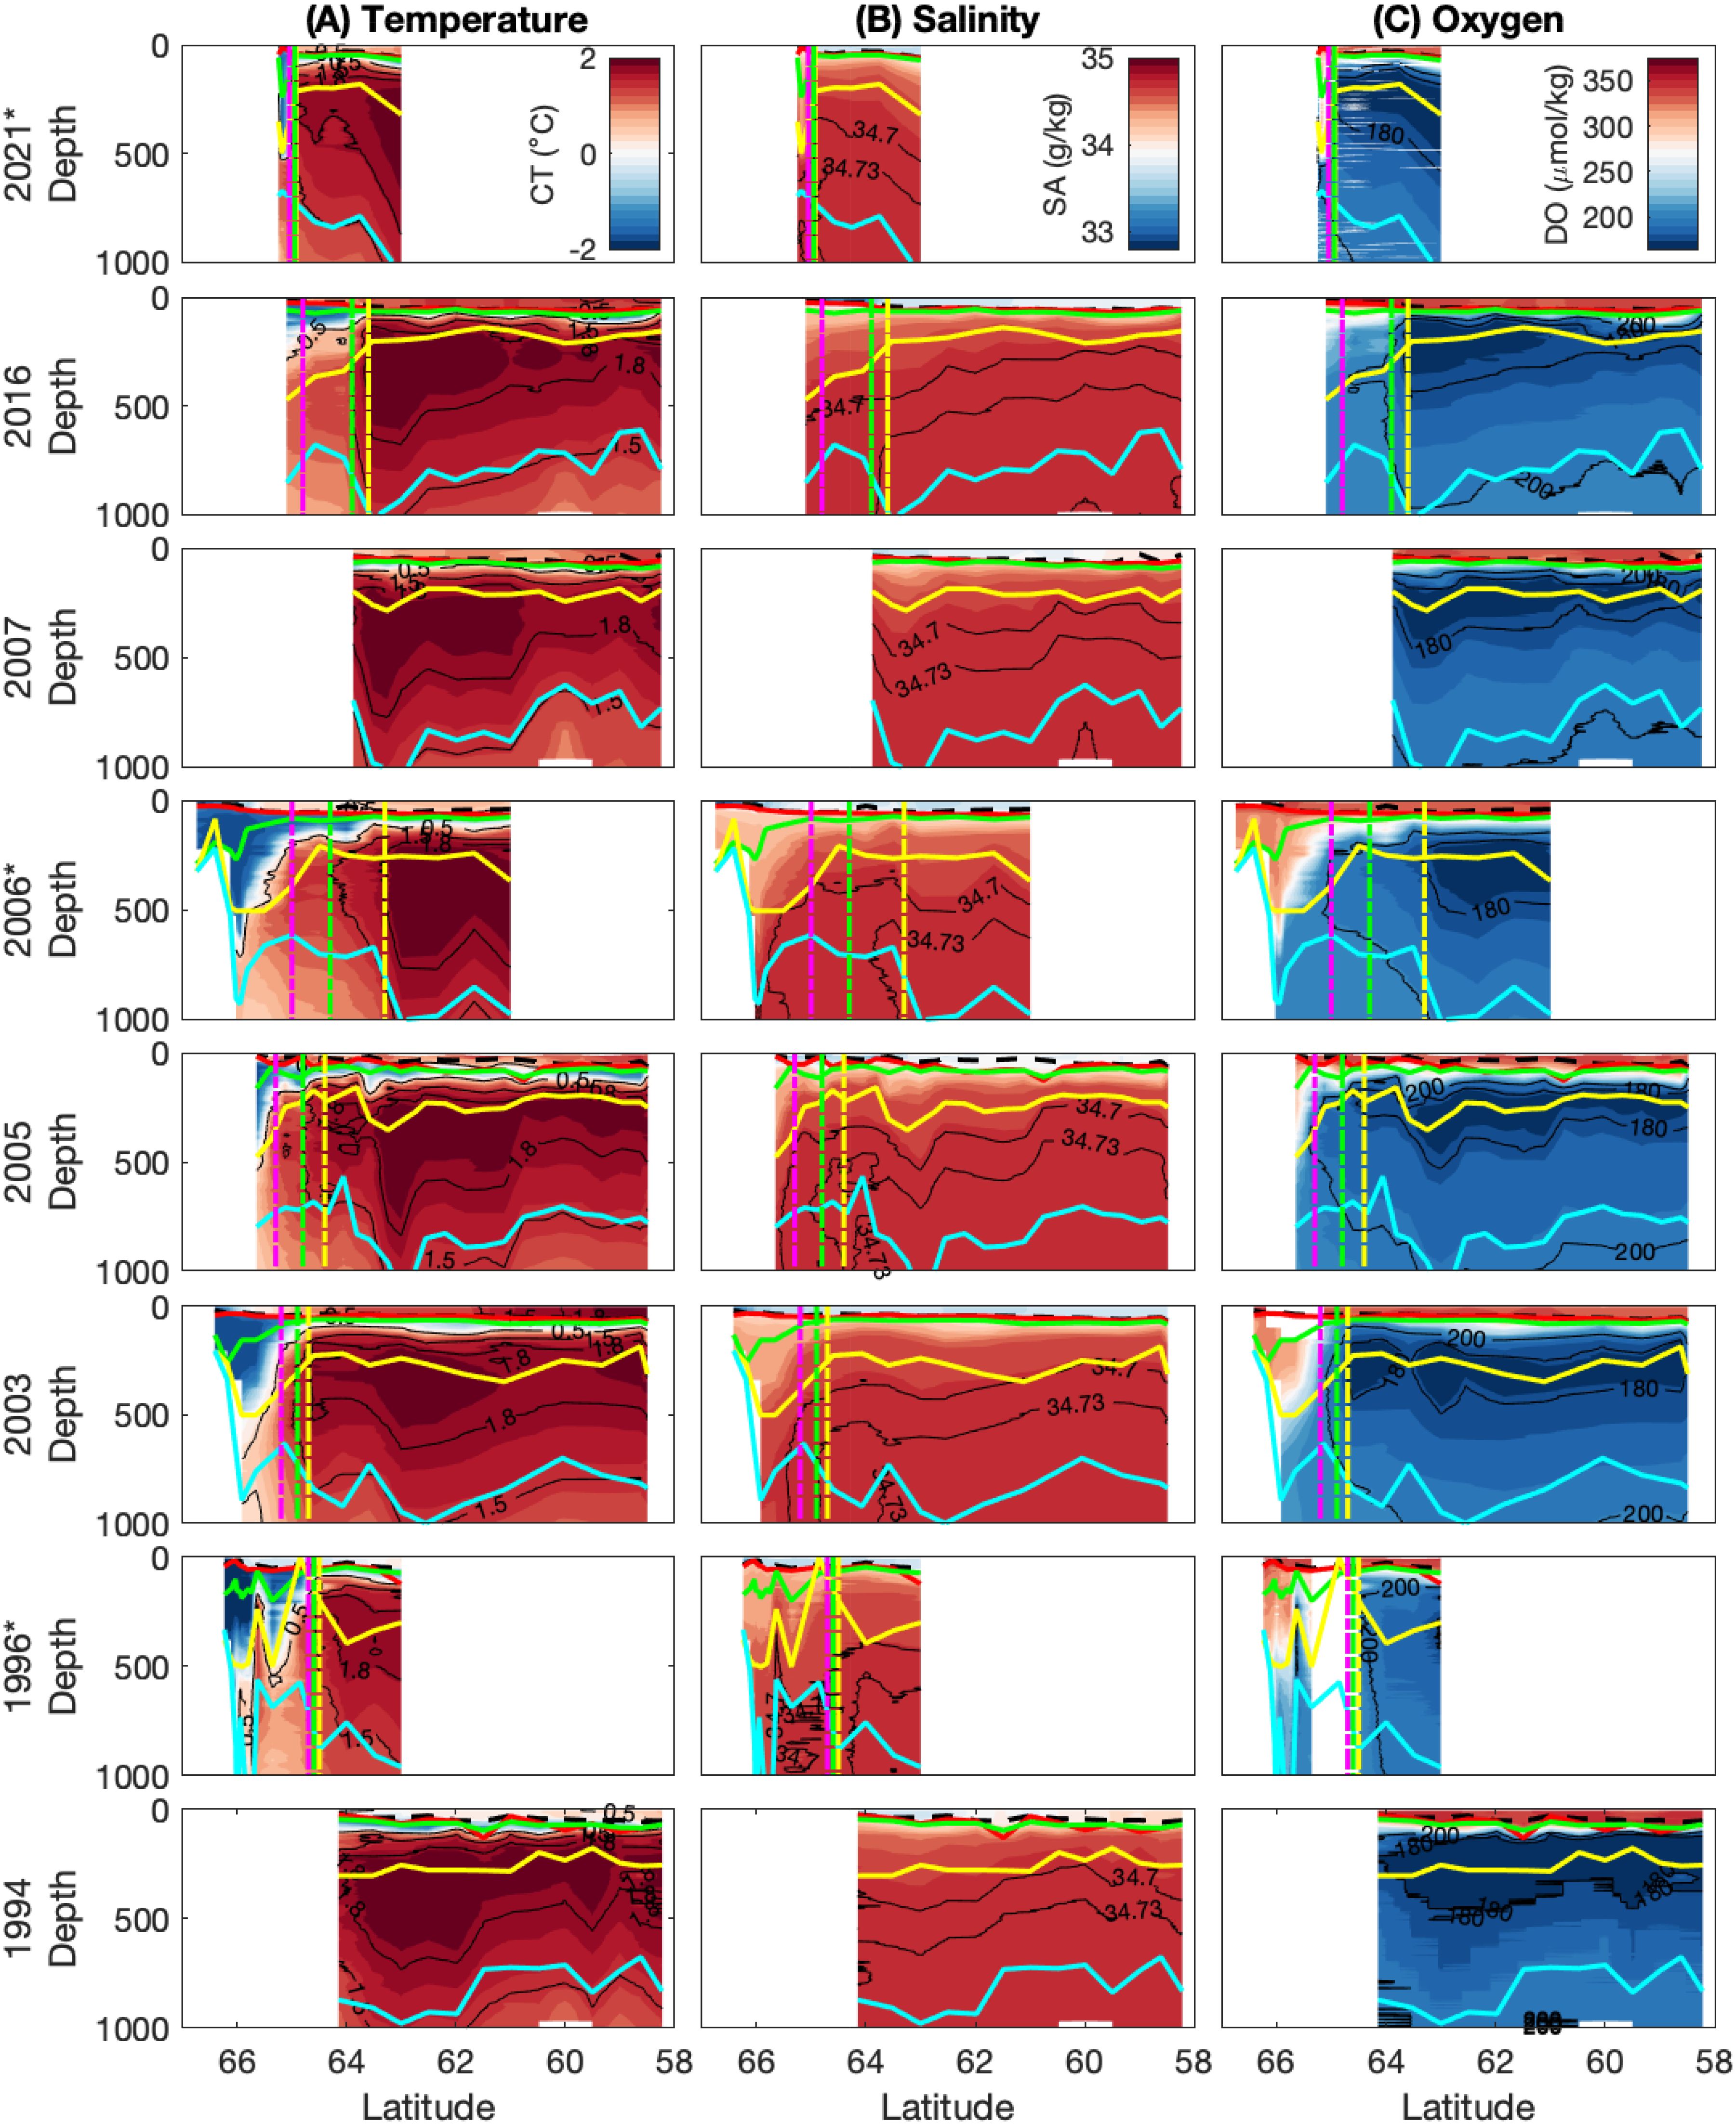
Figure 4. Transects of (A) temperature, (B) salinity and (C) oxygen in the upper 1000 m across eight voyages 1994 – 2021. Coloured lines represent the density-based MLD (black), the depth of maximum buoyancy frequency (N2, red), temperature minimum (green), oxygen maximum (yellow), and salinity maximum (blue). Dashed vertical lines represent the fronts from south to north: ASF (magneta) SB (green) and SACCF (yellow). The voyages marked with an asterisk (*) are those where data was collected off the Kerguelen Plateau at 63°S.
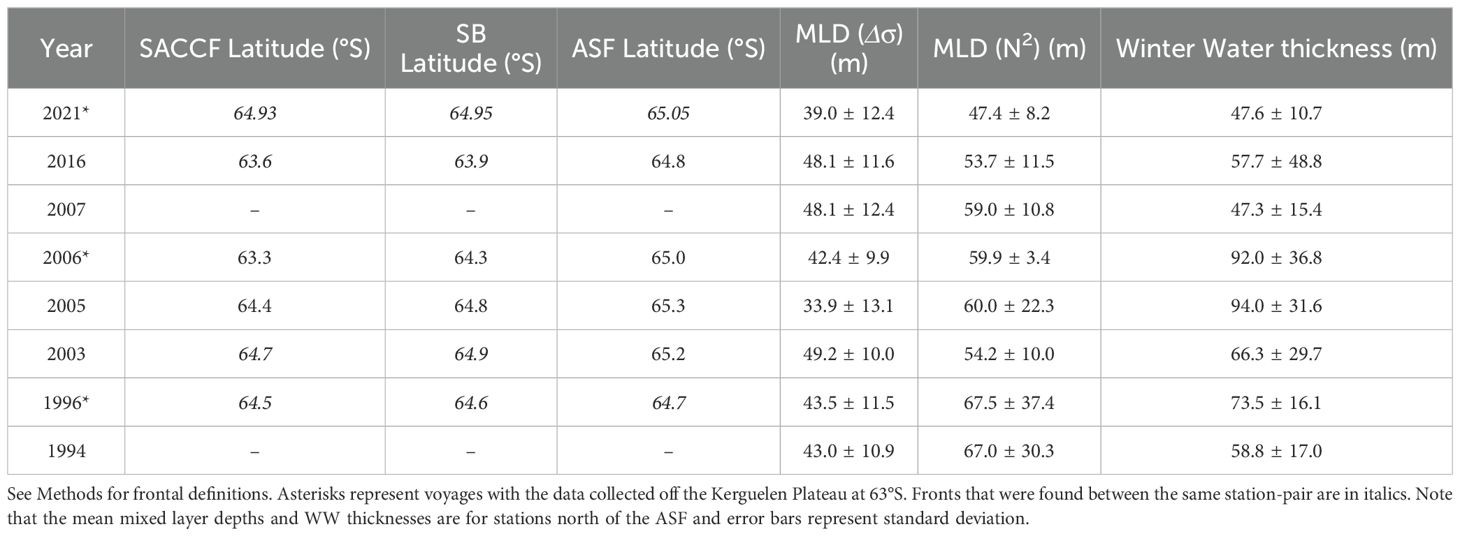
As the UCDW rises southward its properties are cooled and freshened. In this region, the southernmost extent of subsurface temperature maxima of 1.8°C and 1.5°C are used to demarcate the location of the SACCF and the Southern Boundary, respectively (yellow and green vertical lines, respectively, in Figures 4 and 5). Over the period that voyages were conducted, the SACCF was observed at latitudes from 63.3°S-64.93°S and the SB ranged between 63.9°S-64.95°S (Table 2). The SACCF and SB were identified between the same station pair in four of the six voyages that sampled the fronts (Table 2, italicized values), but were found more than 100 km apart in 2006. Thus, the SB and the SACCF were generally co-located in most years, with the exception of 2005 and 2006.
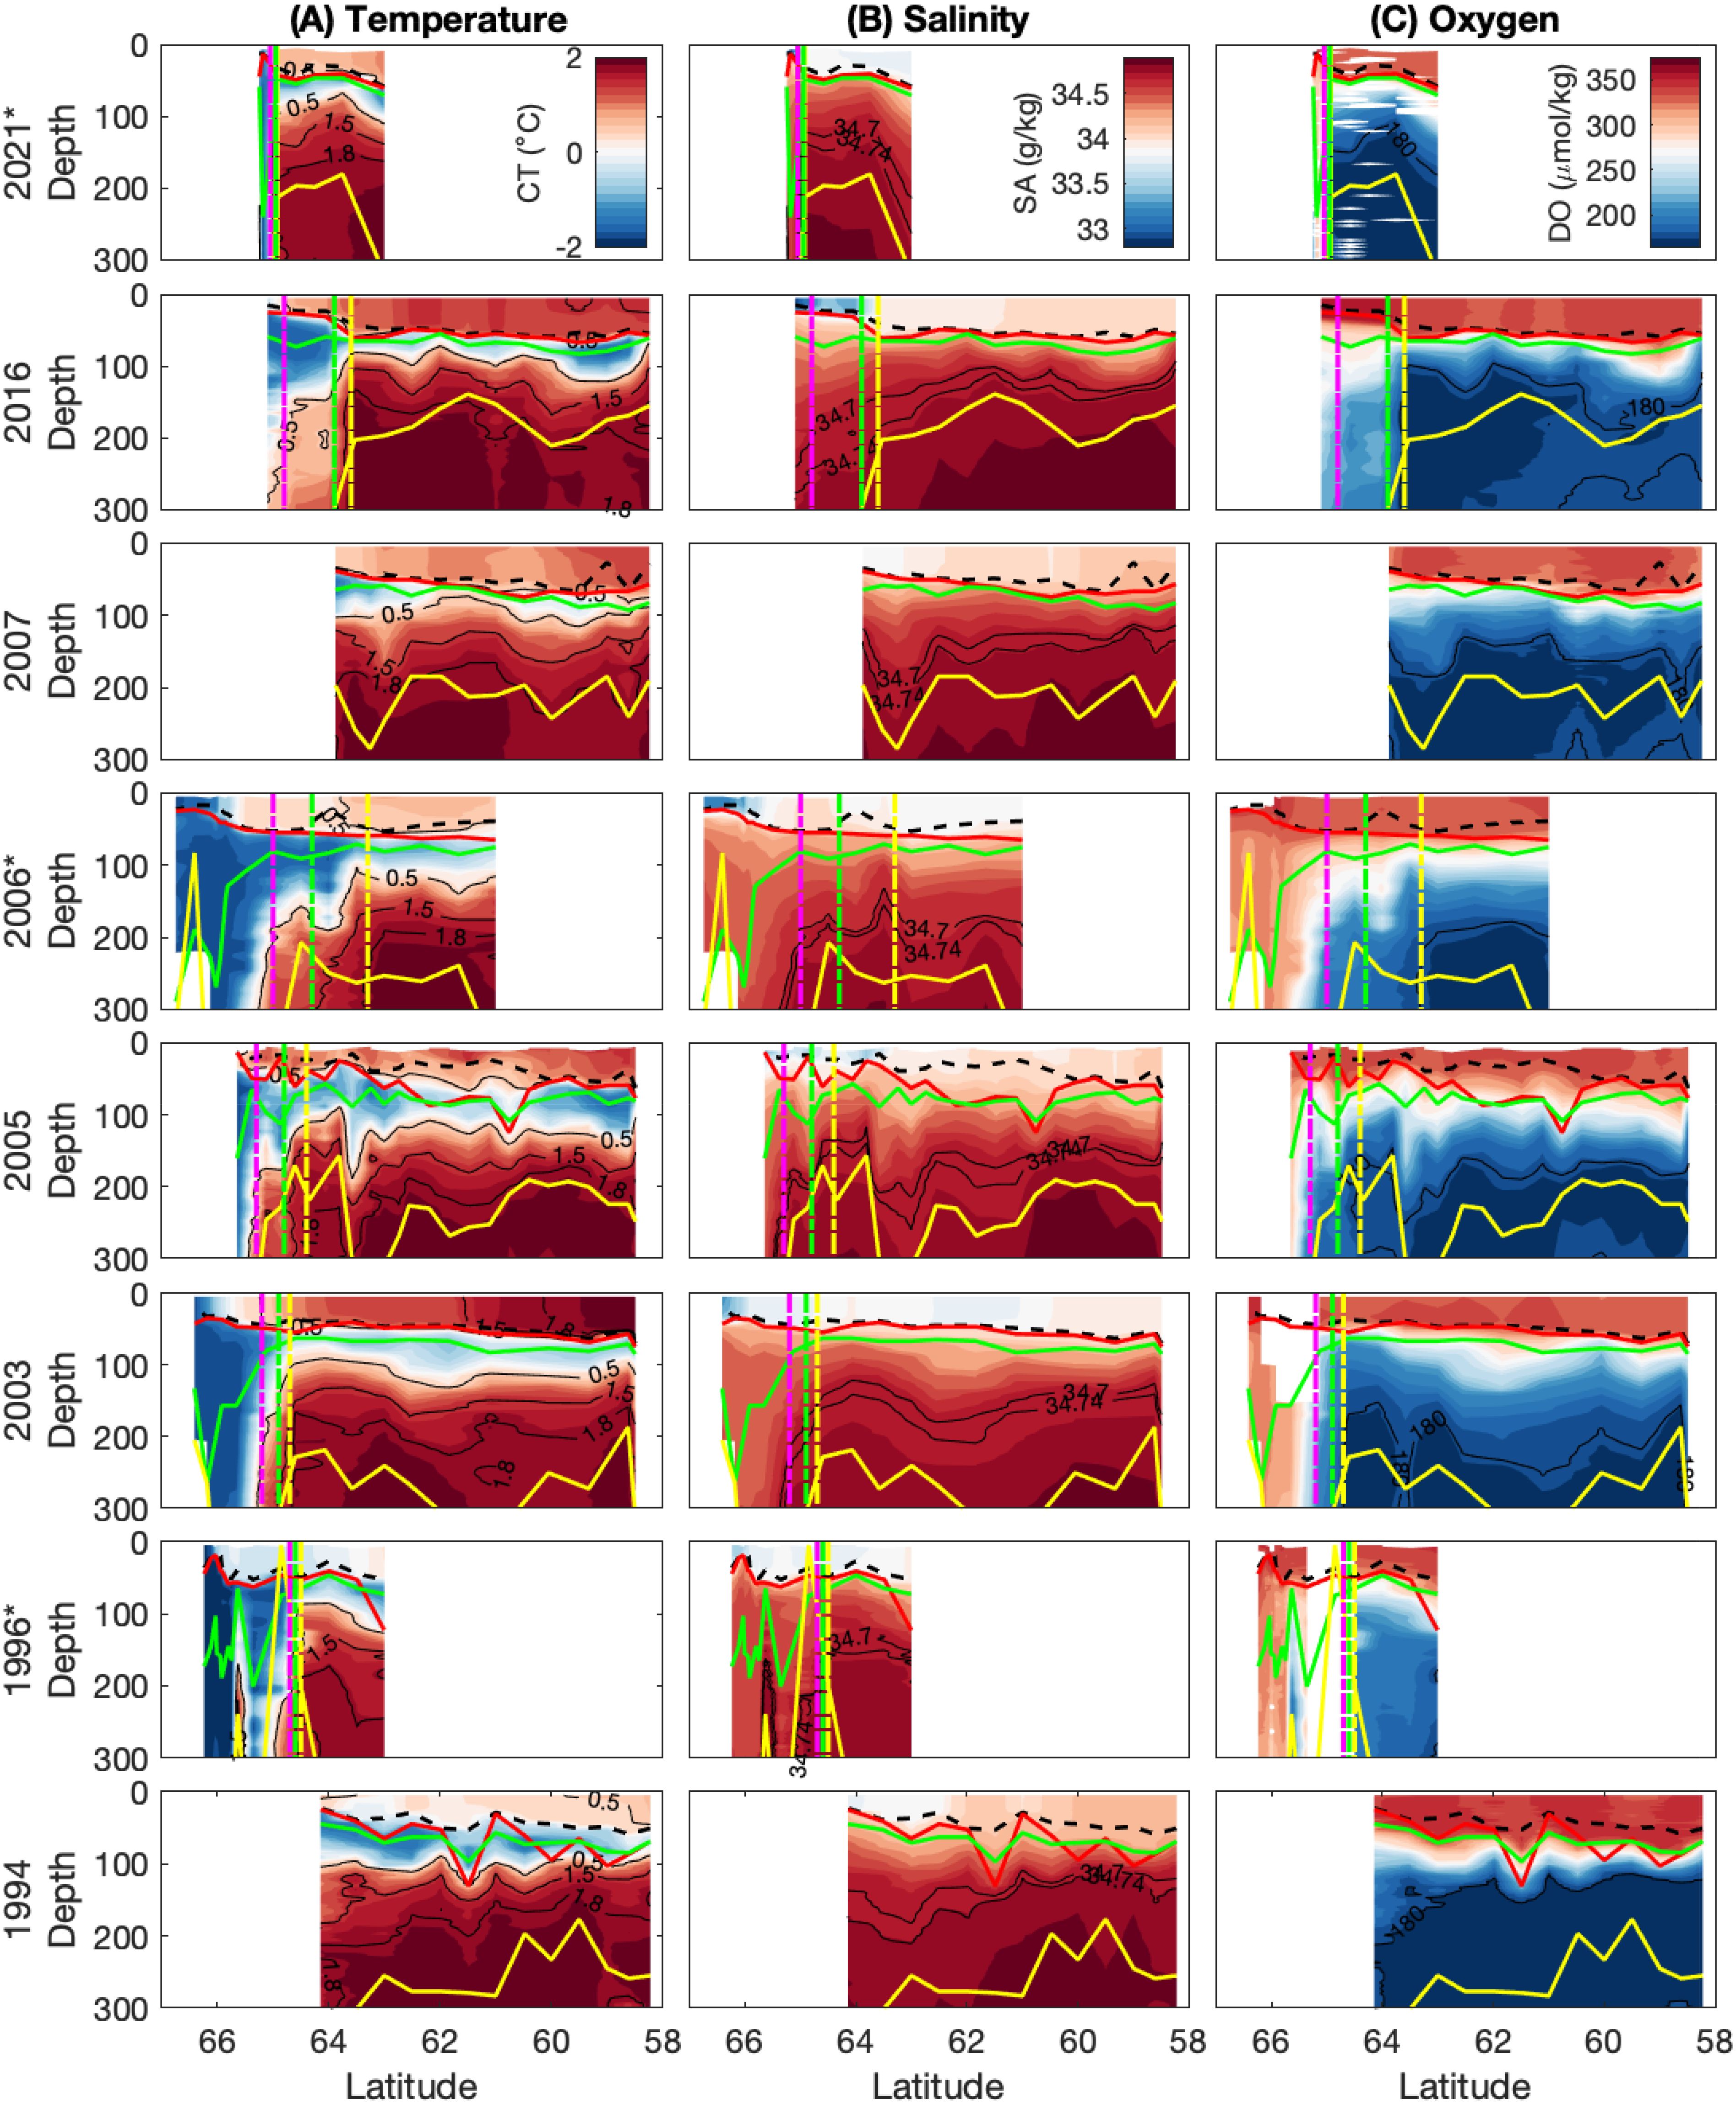
Figure 5. Transects of (A) temperature, (B) salinity and (C) oxygen in the upper 300 m across eight voyages, 1994 – 2021. Representation as for Figure 4.
The ASF is evident as a strong meridional temperature gradient towards the southern end of some transects, characterized by the 0.5°C isotherm at 200 m. It was unable to be identified in all years, as voyages over the SKP (in 2007 and 1994) either terminated or turned eastward north of this feature. For voyages where the ASF was sampled it was located near 65°S, with a range of 64.7-65.3°S.
Figure 5 shows transects of temperature, salinity, and oxygen in the upper 300 m, allowing visibility of changes in the mixed layer and Winter Water layer. For stations north of the ASF, the average mixed layer depth based on density ranges from 33.9-49.2 m, while the average mixed layer depth based on maximum buoyancy frequency (N2) is generally deeper, ranging from 47.4-67.5 m (Table 2). When including stations south of the ASF, the mean mixed layers are consistently shallower by up to 10 and 20 m for the density-based and N2 maximum-based MLD definitions, respectively (not shown). Below the mixed layer, the WW layer (temperature below 0.5°C) ranges from 47.3-94.0 m in thickness at stations north of the ASF. Note that we present information in Table 2 for stations north of the ASF only, because those are the relevant stations for nutrient drawdown and seasonal production calculations.
At individual stations, the density-based MLDs vary between roughly 10 m and 70 m, while those calculated from buoyancy frequency vary between 10 m and 130 m (Figure 6). The latter are typically deeper by 10-20 m (Table 2), but can be up to almost 100 m deeper. There is a broad pattern of MLD deepening from the south to the north. In all years, there is considerable station-to-station variability using both methods. Time within season has no clear influence on MLD and there is no clear difference between years (Figures 6B, E). However, there is a relationship between MLD and the amount of ice-free time (i.e. number of days since sea-ice melt; Figures 6C, F). Mixed layers are generally deeper in regions where the ocean has been ice-free longer and, thus, exposed to local wind-driven mixing for longer. Overall, the variability appears dominated by latitude and time since sea-ice melt, which are largely correlated, as sea ice tends to melt from north to south.
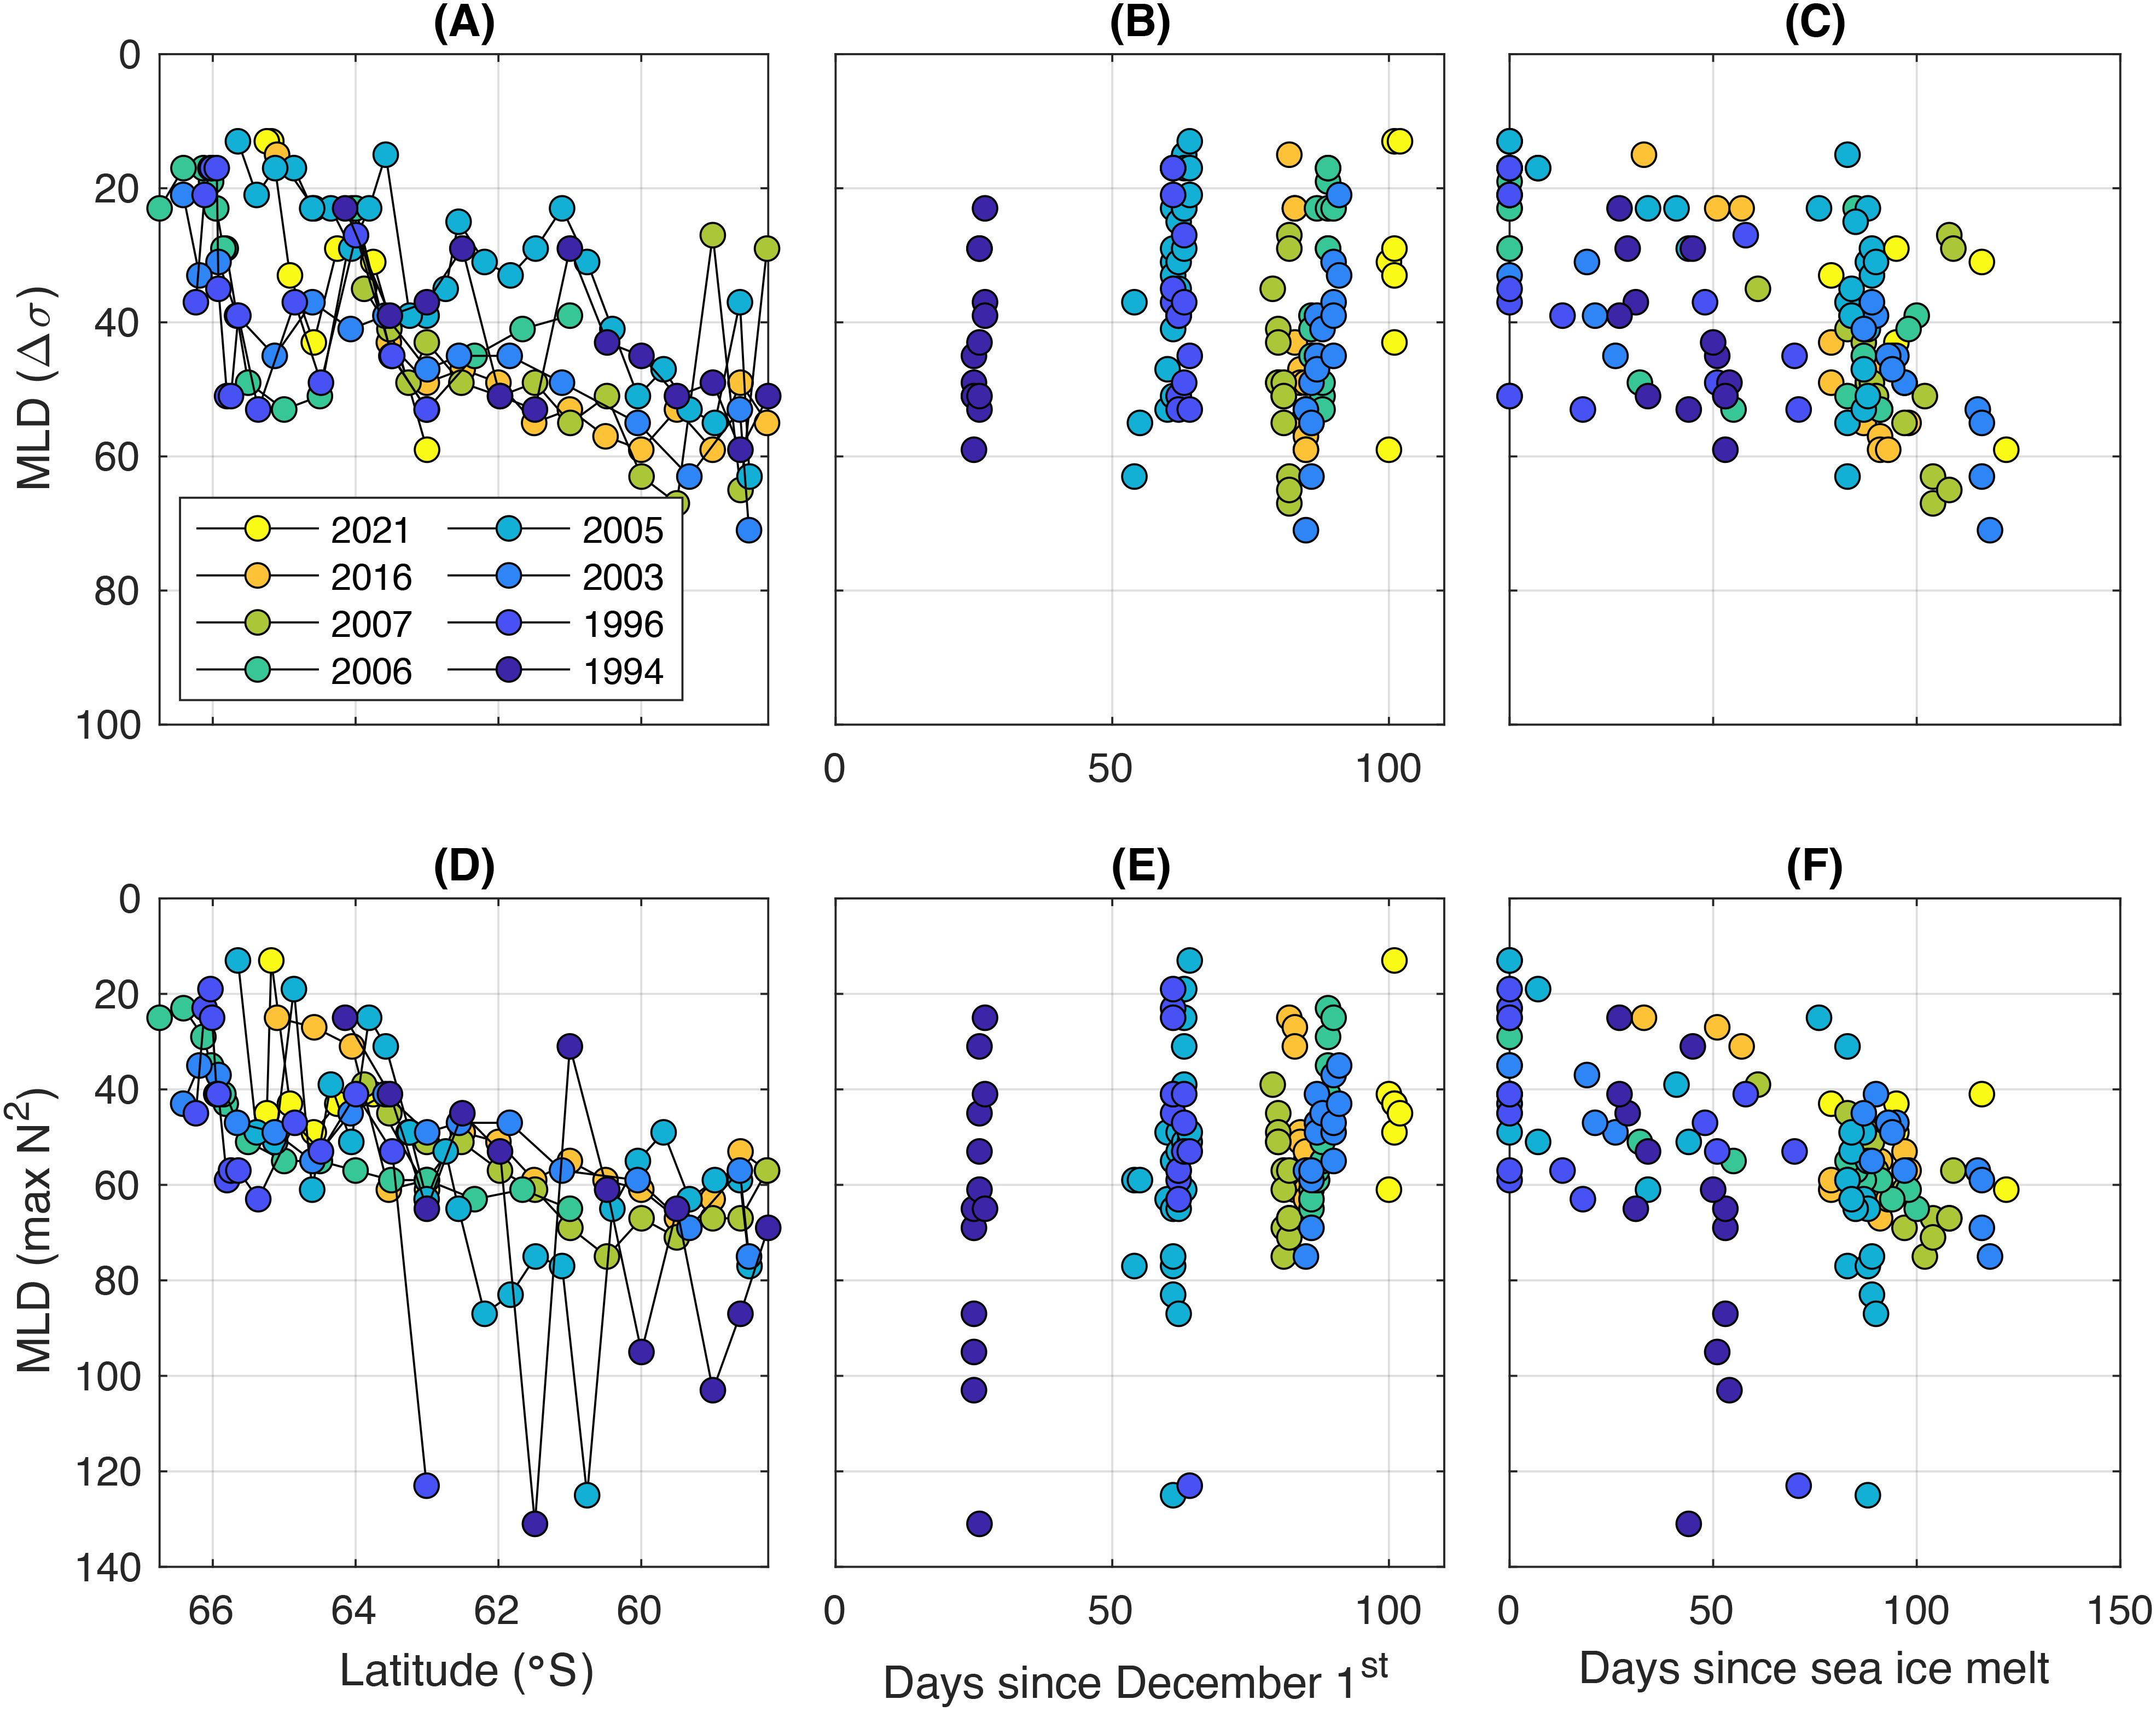
Figure 6. Mixed layer depth variation in space and time. The top row (panels A–C) shows density-based MLD variability as a function of (left) latitude, (middle) time within season, and (right) days since sea ice melt. The bottom row (panels D–F) shows the same for MLD defined as the N2 maximum. Colour indicates voyage year.
Due to differences in cruise tracks (Figure 1), oceanographic observations are available across all voyages only at 63°S and 64°S. Figure 7 co-plots the major diagnostic features of the upper ocean structure at these two latitudes. Figure 7A shows that the mixed layer appears to be warming at 63°S, however this is likely due to the timing of the sampling in each year rather than a long-term trend. Recall, in 1994 the sampling occurred in December while in 2021 the sampling occurred in March (Table 1). This apparent warming pattern is not seen at 64°S (Figure 7A). There is no clear pattern in the depth of the mixed layer between years at either location (Figure 7B). In the WW, cooler temperature minima are generally found deeper in the water column (Figures 7C, D). Figures 7E, F shows that when the oxygen minimum layer lies deeper, oxygen concentrations are generally higher. Figure 7E shows that the oxygen minimum values at 63°S are very stable but slightly higher at stations off the plateau (1996, 2006 and 2021). Here, the oxygen minimum is also deeper (Figure 7F). In general, deep-water properties (O2min and Smax) are much more stable at 63°S than 64°S.
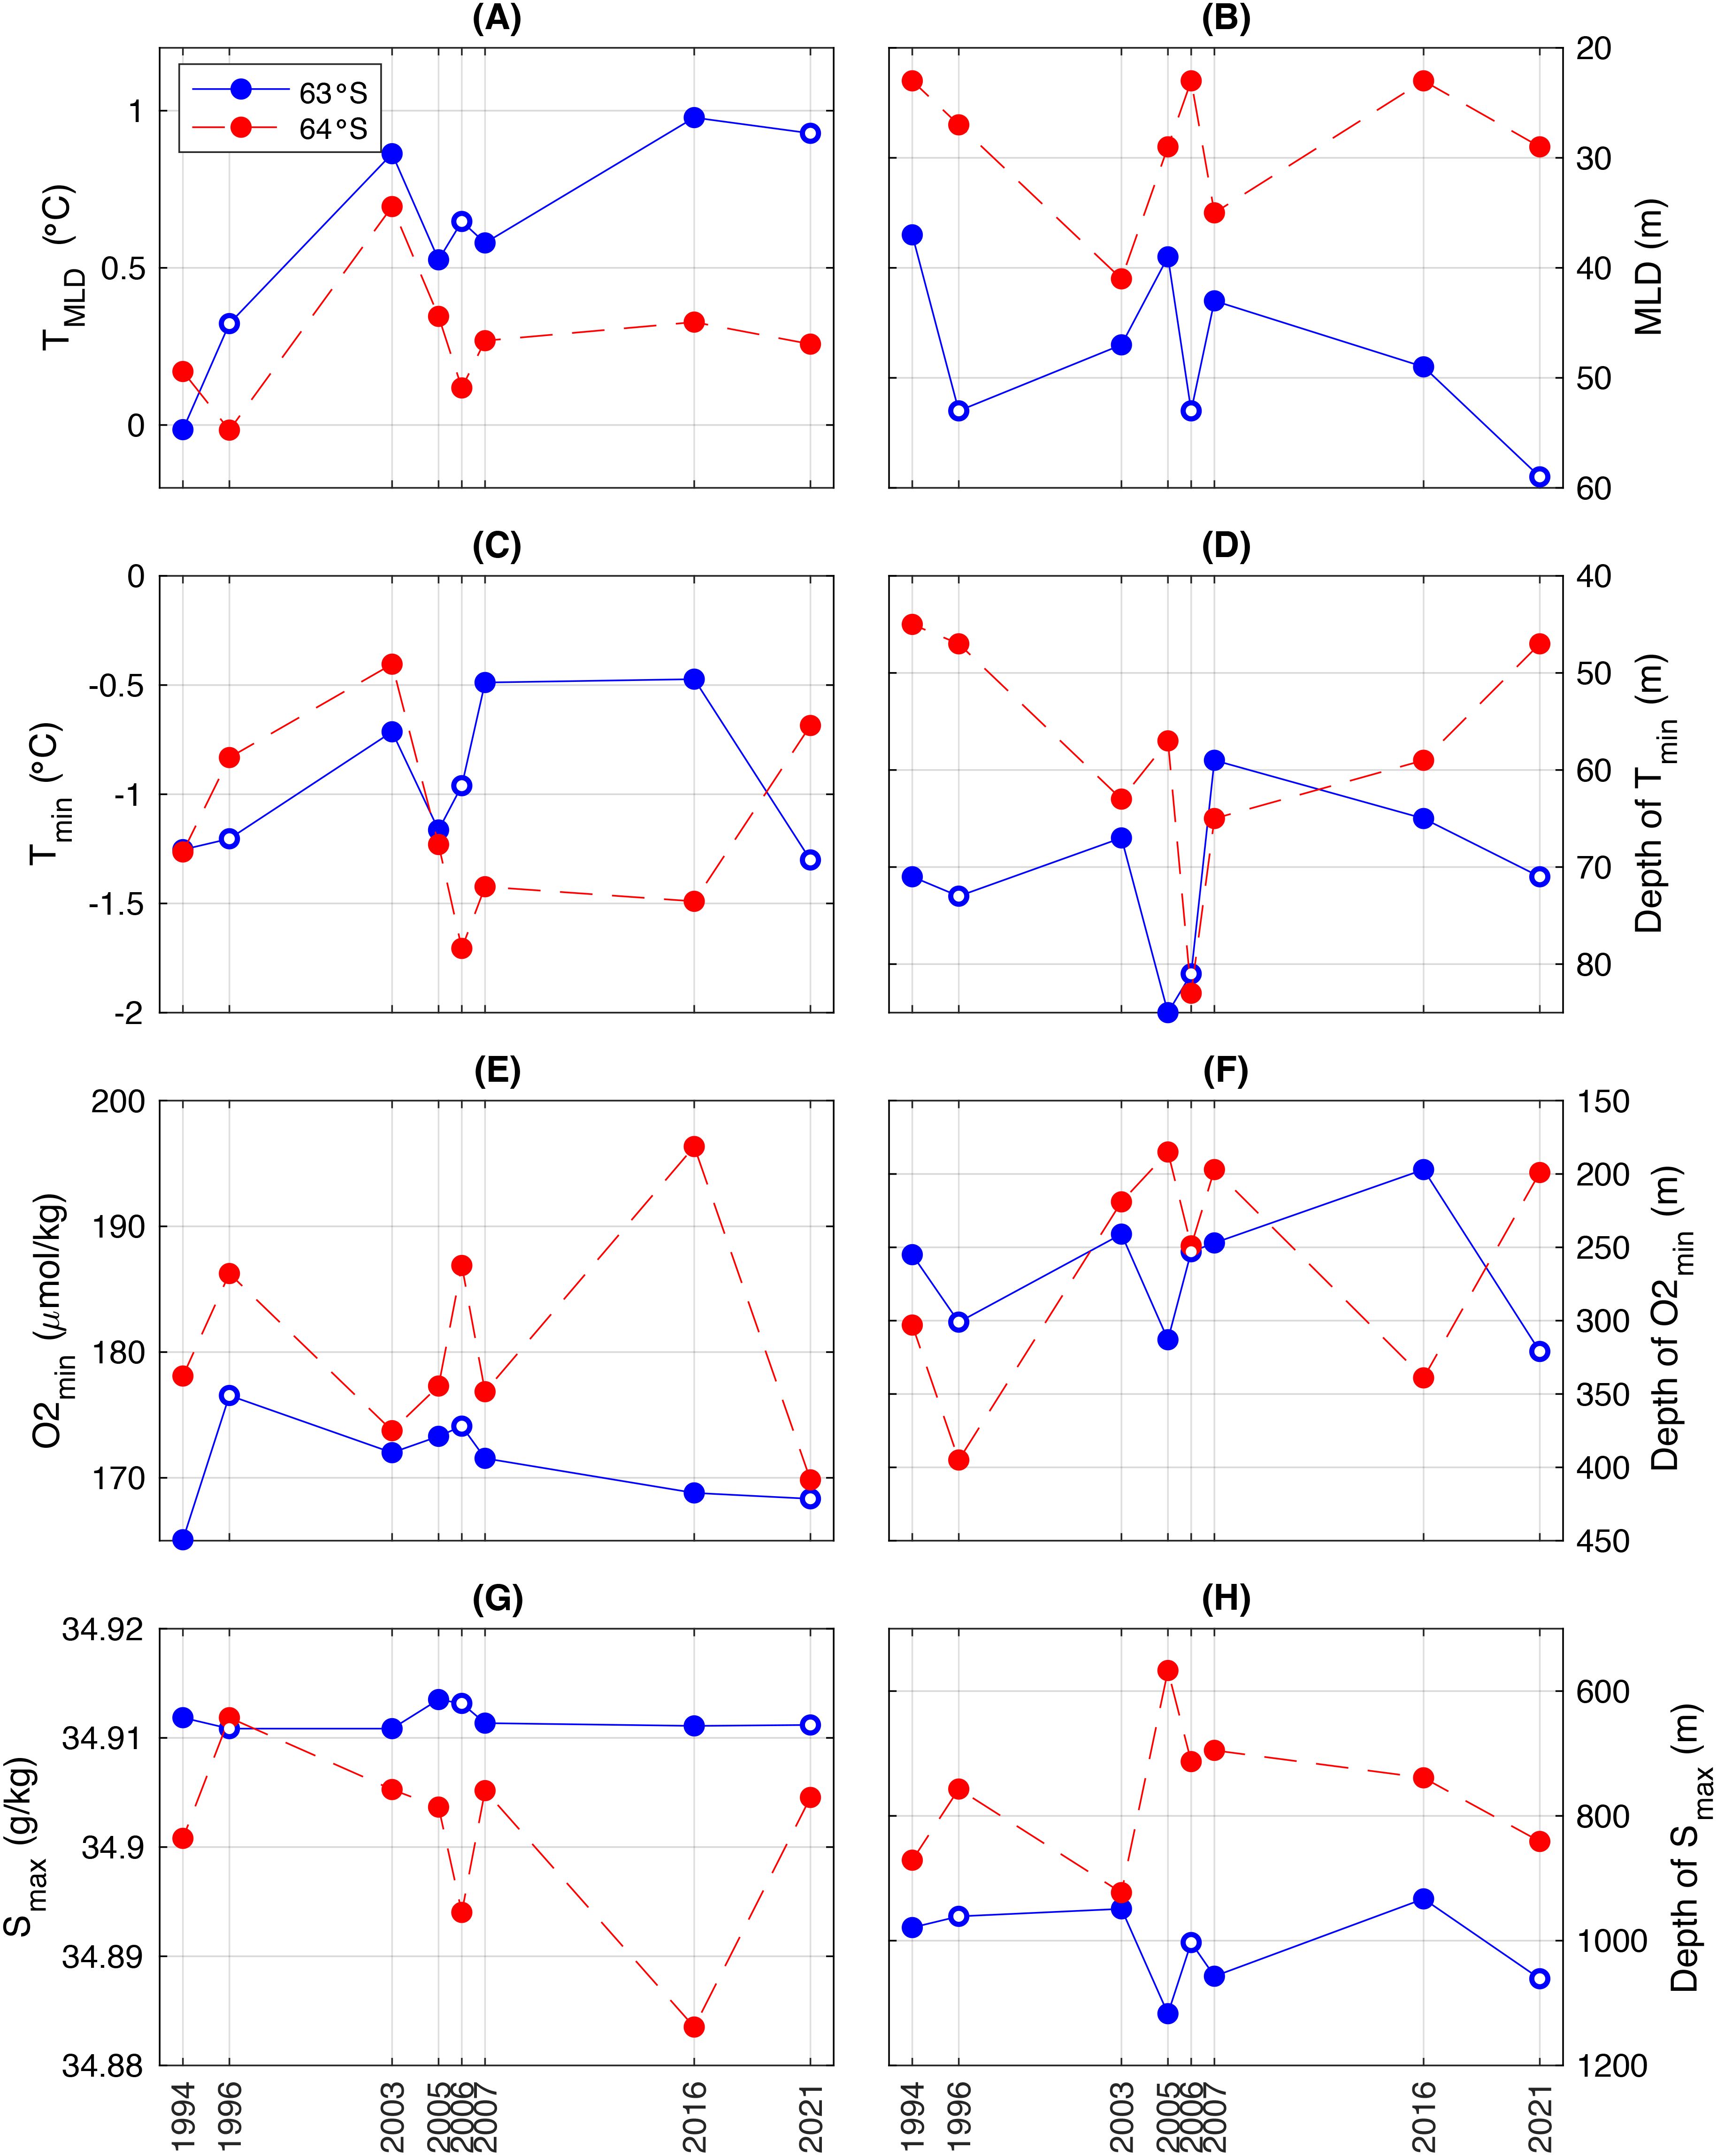
Figure 7. Upper-ocean water-mass characteristics at 63°S (blue) and 64°S (red) across eight voyages 1994 – 2021. (A) Mean MLD temperature; (B) MLD, calculated using the density-based criterion; (C) Minimum temperature; (D) Depth of temperature minimum; (E) Minimum oxygen concentration; (F) Depth of oxygen minimum; (G) Maximum salinity; (H) Depth of salinity maximum. Open circles in the blue line indicate the voyages that sampled west of the Southern Kerguelen Plateau (i.e. off-plateau) at 63°S. Note that the y-axes in the right column are inverse, such that depth is increasing downwards.
Nitrate concentrations in the upper 300 m range from about 20-40 µM, and silicate concentrations reach values near 100 µM (Figure 8). Concentrations of both nutrients generally increase with depth and are distinctly lower in the mixed layer compared to the WW below. Stations south of ~65°S, i.e. south of the ASF, have lower concentrations of nutrients at depth compared to stations on the northern side of the ASF.
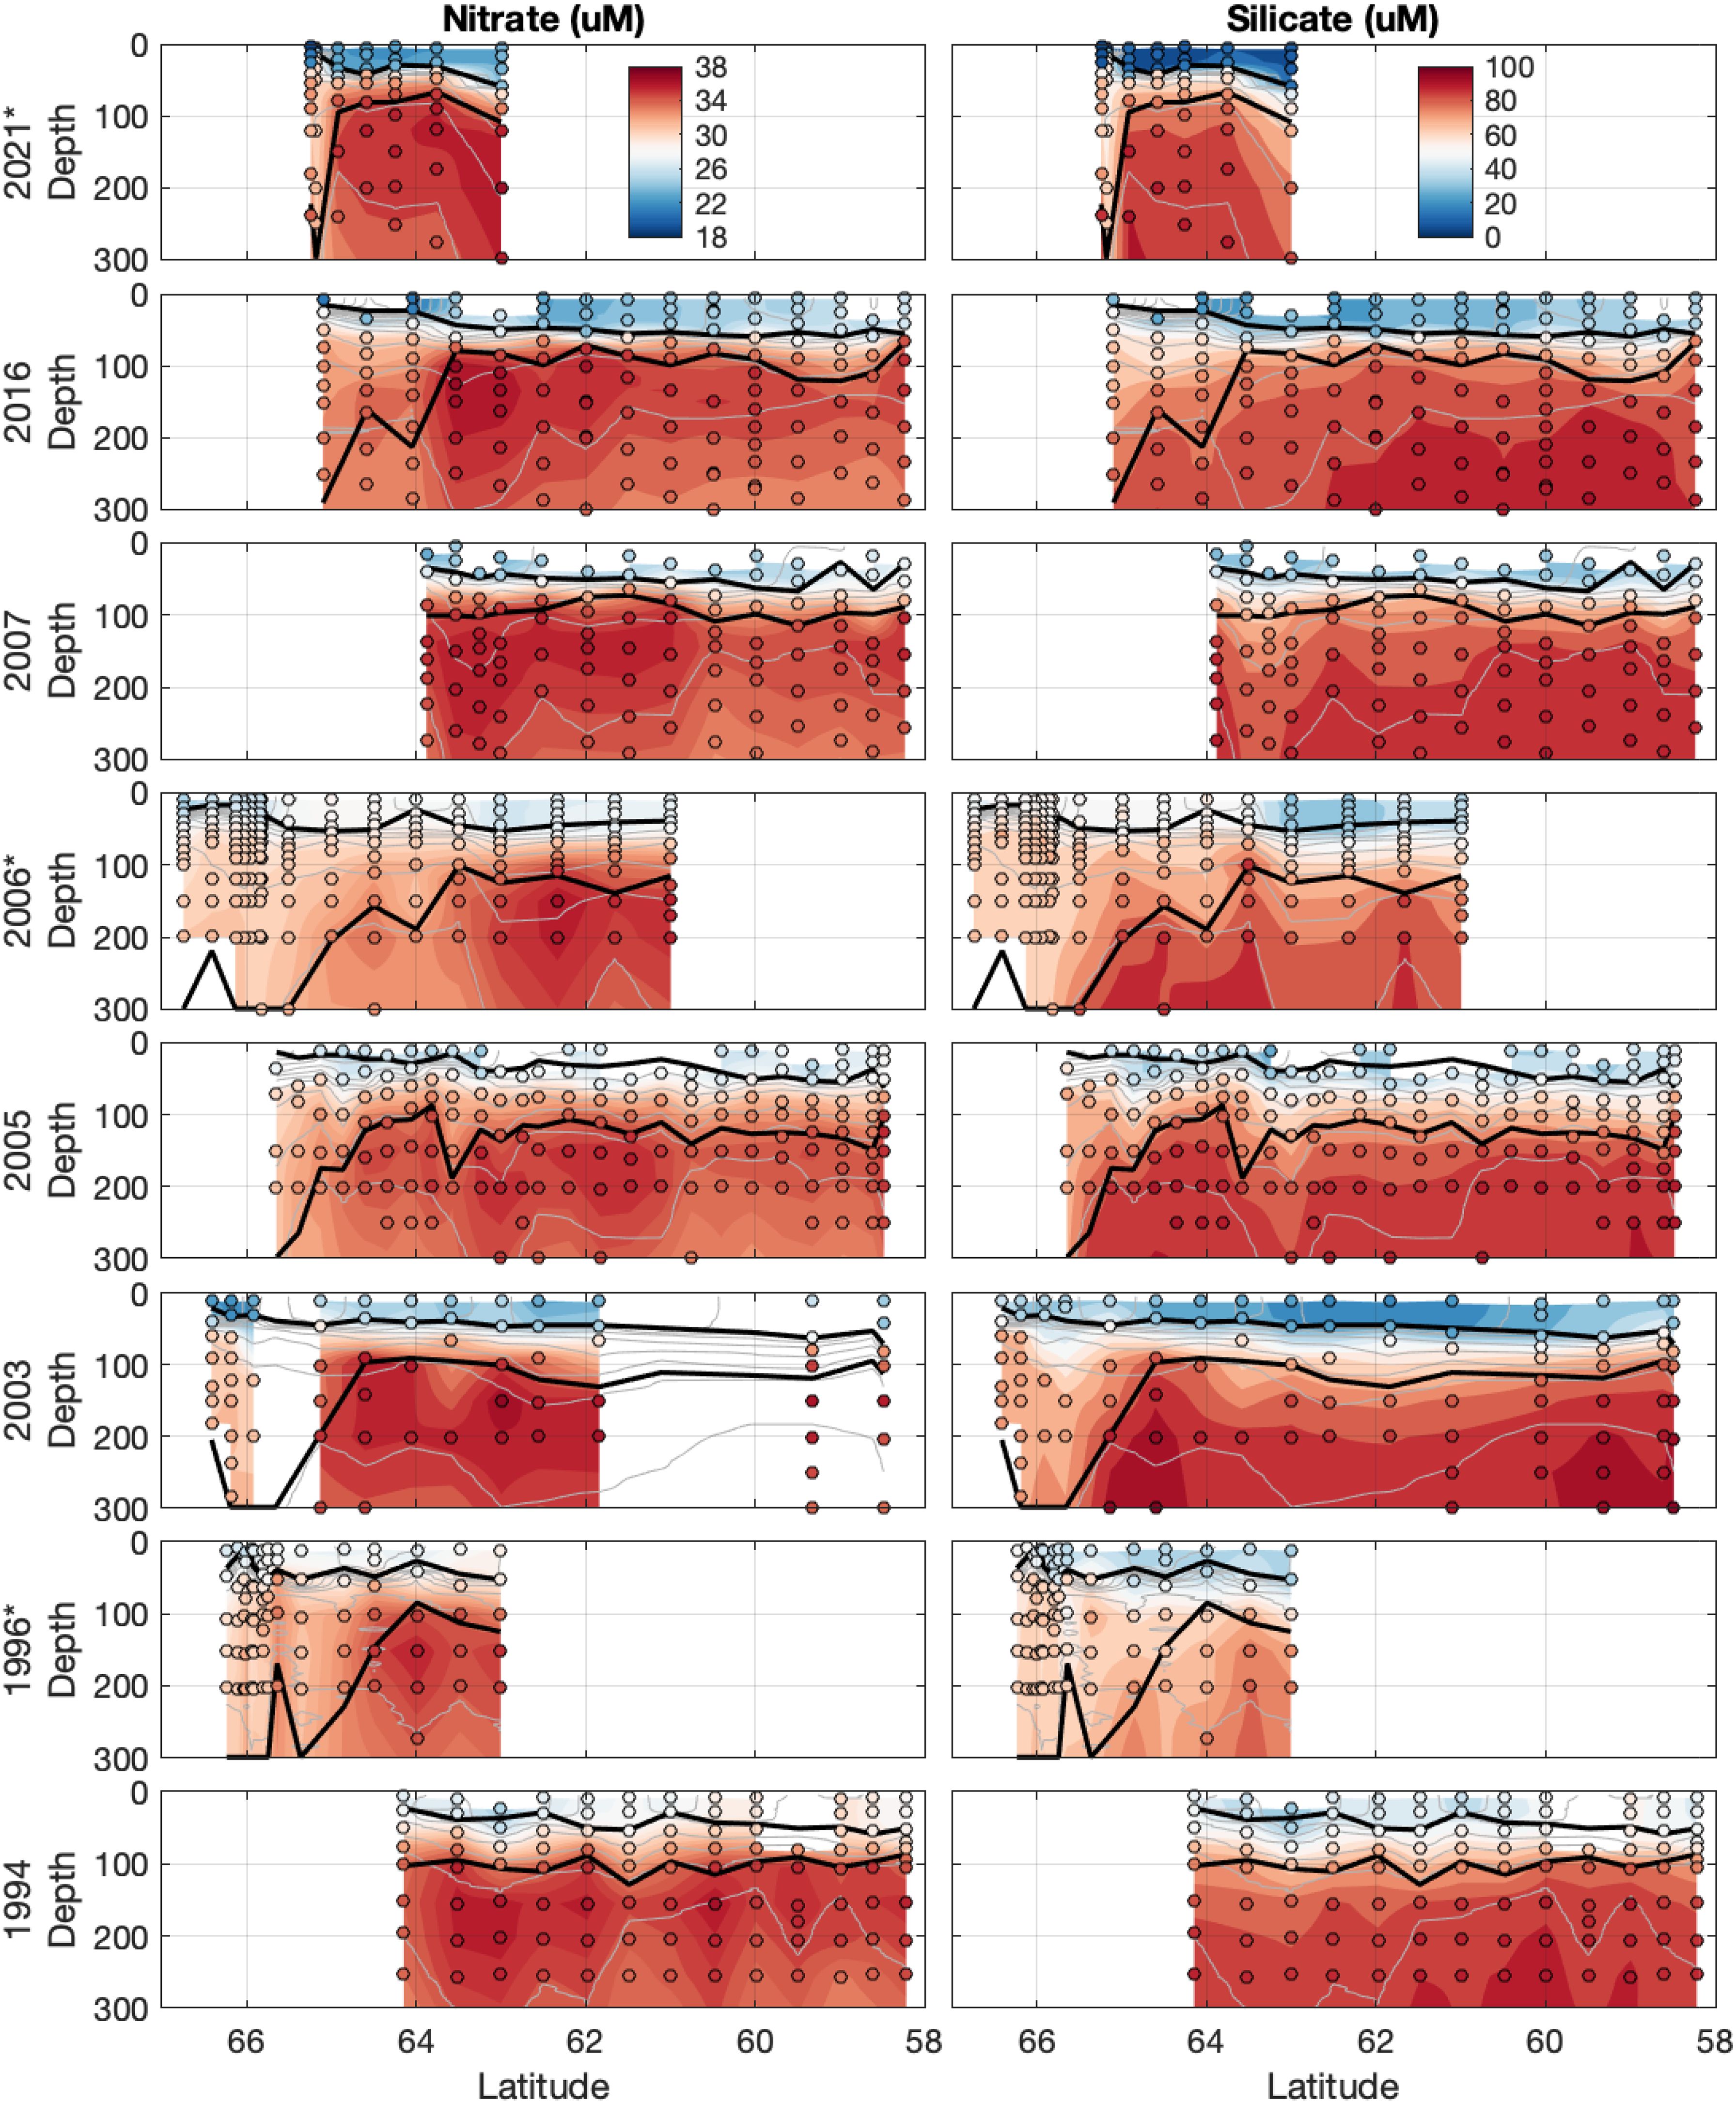
Figure 8. Transects of nutrients in the upper 300 m: nitrate (left) and silicate (right). Colored dots indicate nutrient concentrations from bottle samples. Background shading shows the nutrient data linearly interpolated onto an even pressure grid. Solid black lines, from shallower to deeper, represent the MLD and the bottom of the WW layer. The thin grey lines represent potential density contours at 0.1 kg m-3 intervals.
Nutrient drawdown values reach nearly 12 µM for nitrate and 60 µM for silicate at individual stations (Figure 9; Table 3). There is a seasonal influence on drawdown for both nutrients (Figures 9B, E), with more ice-free days associated with higher nutrient drawdown. Voyage average production estimates range from 123.4-375.2 mg C m-2 d-1 for nitrate and 240.0-560.5 mg C m-2 d-1 for silicate (Table 3). Daily production values are normalized by days since sea ice melt and are therefore similar across the growing season (Figures 9H, K) and latitudes (Figure 9G, J). There is an indication that mixed layer depth may positively influence production (Figures 9I, L).
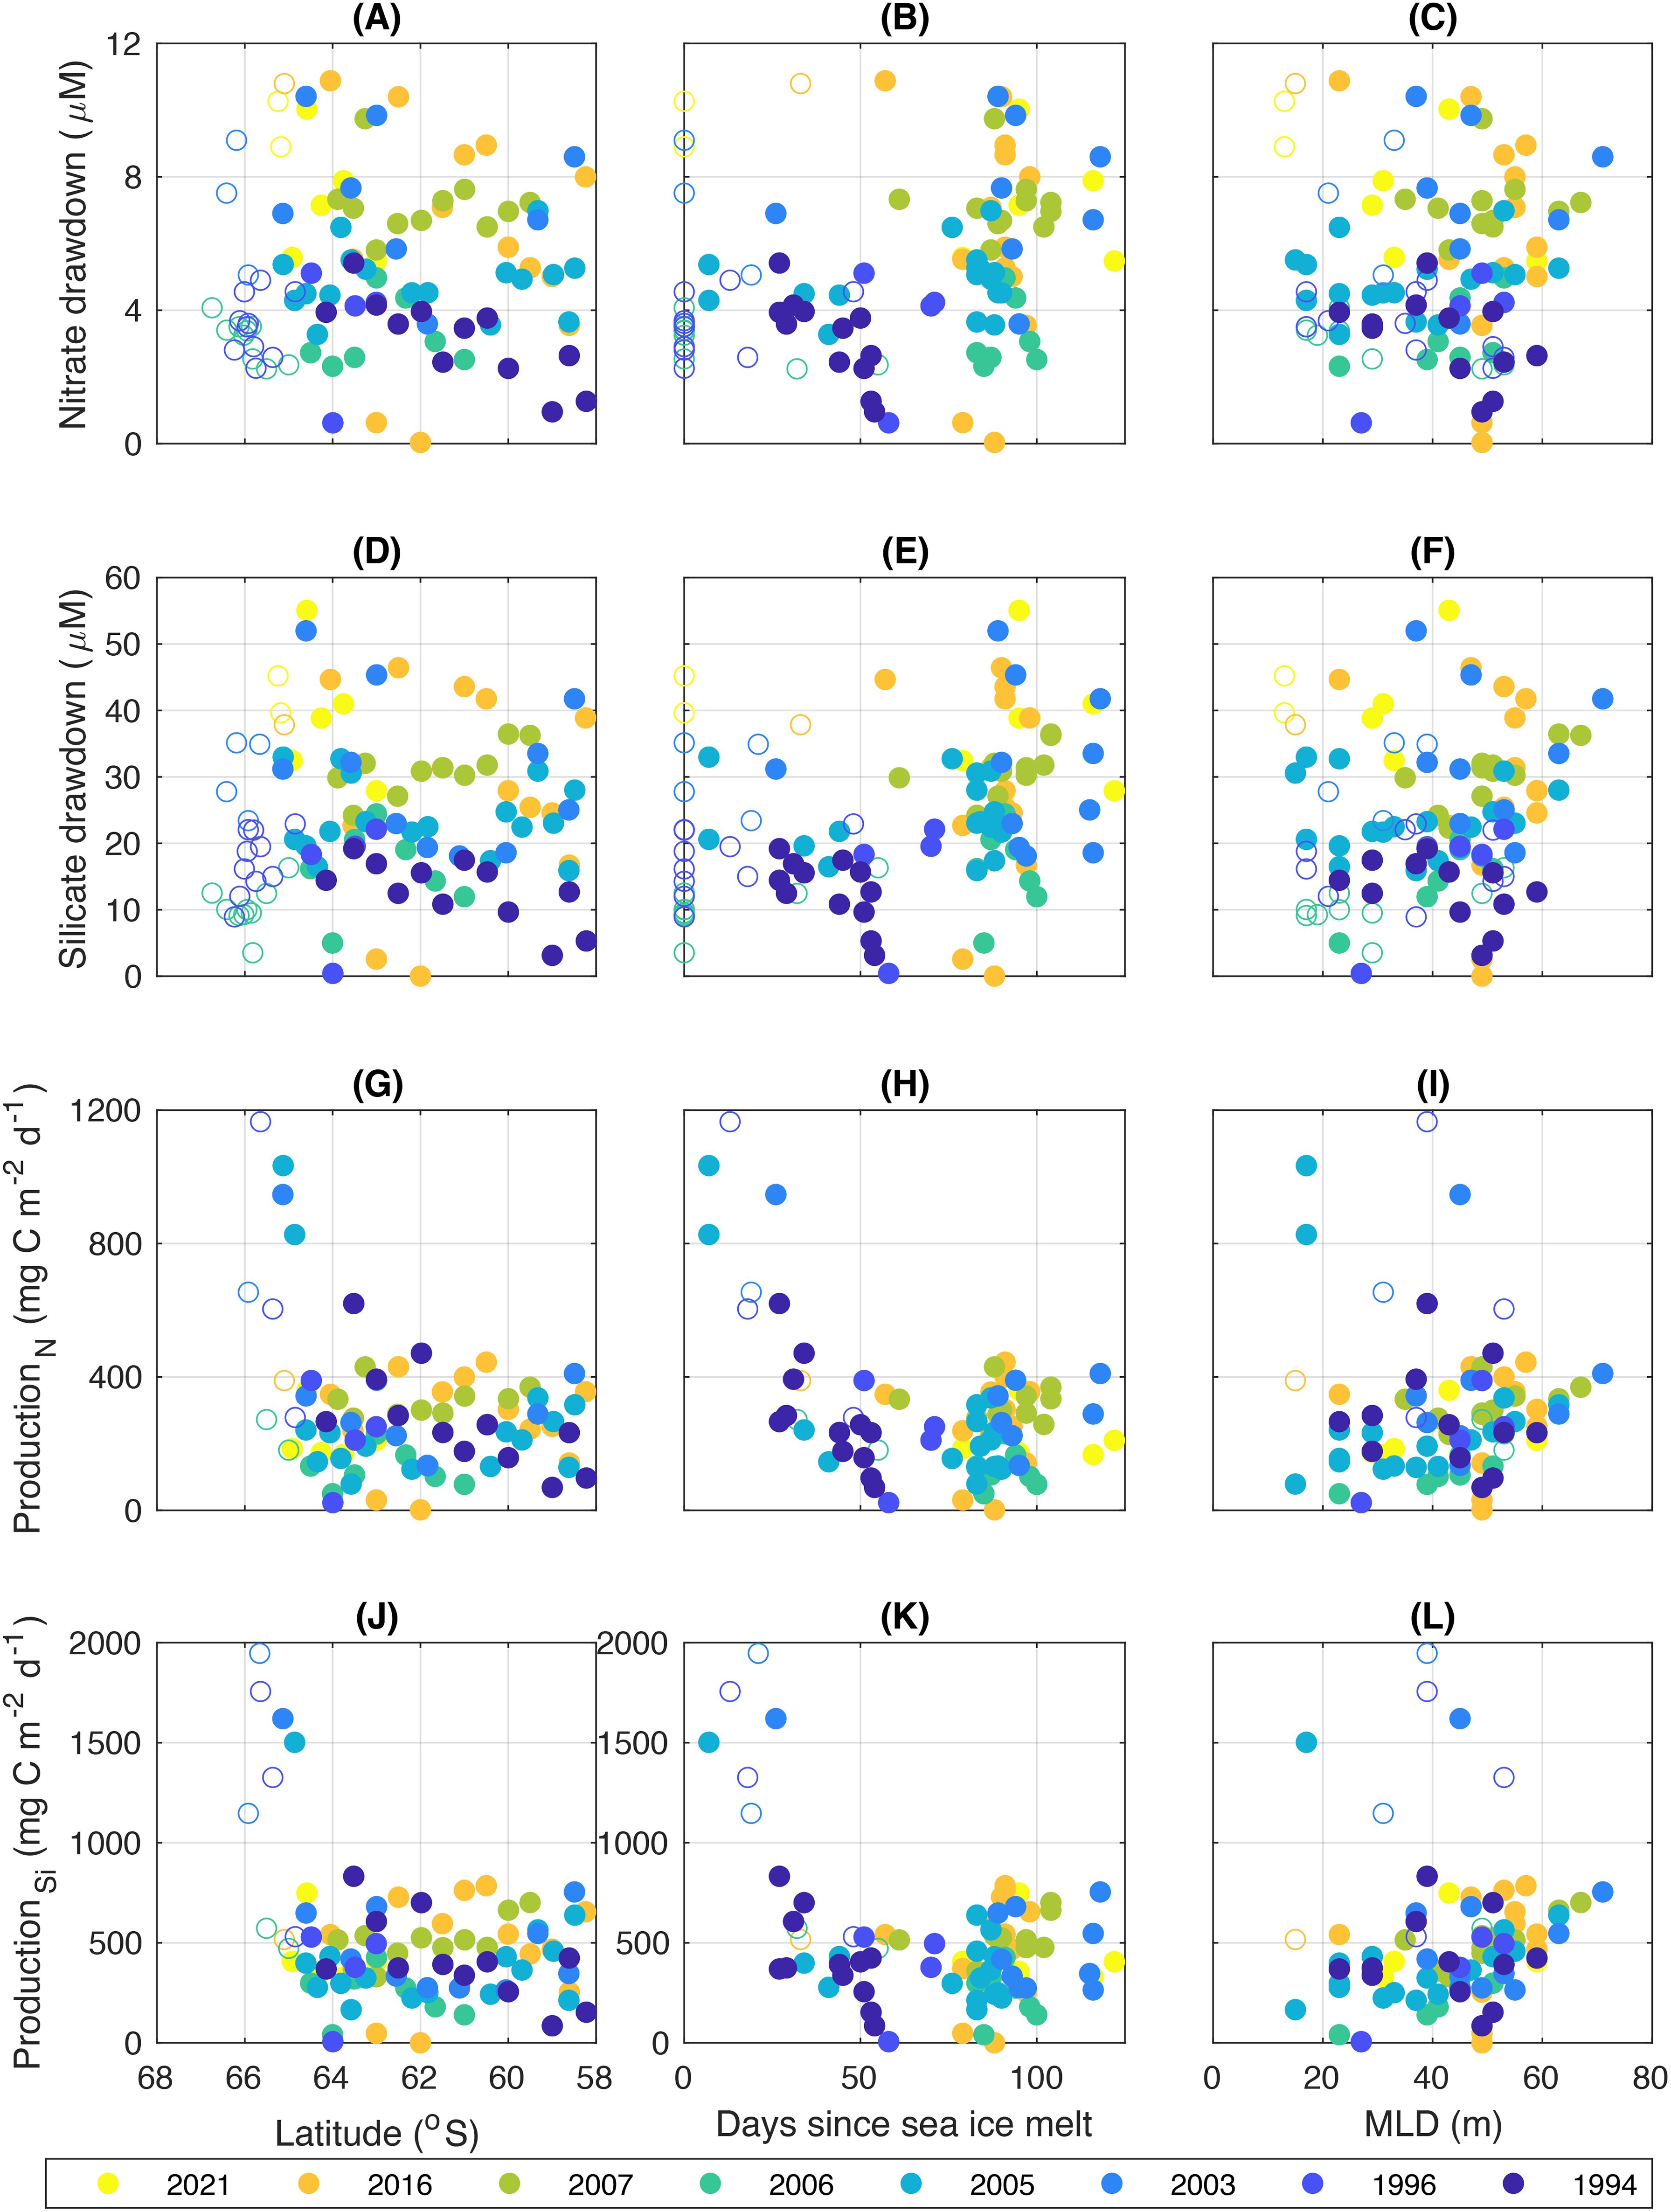
Figure 9. Nutrient drawdown and production. From top to bottom, the drawdown of nitrate (panels A–C) and silicate (panels D–F), and the corresponding production estimates based on nitrate and silicate drawdown (panels G–I and panels J–L, respectively). The drawdown and production values are shown as a function of (left) latitude, (middle) days since sea-ice melt, and (right) density-based MLD. Open symbols represent the stations located south of ASF.
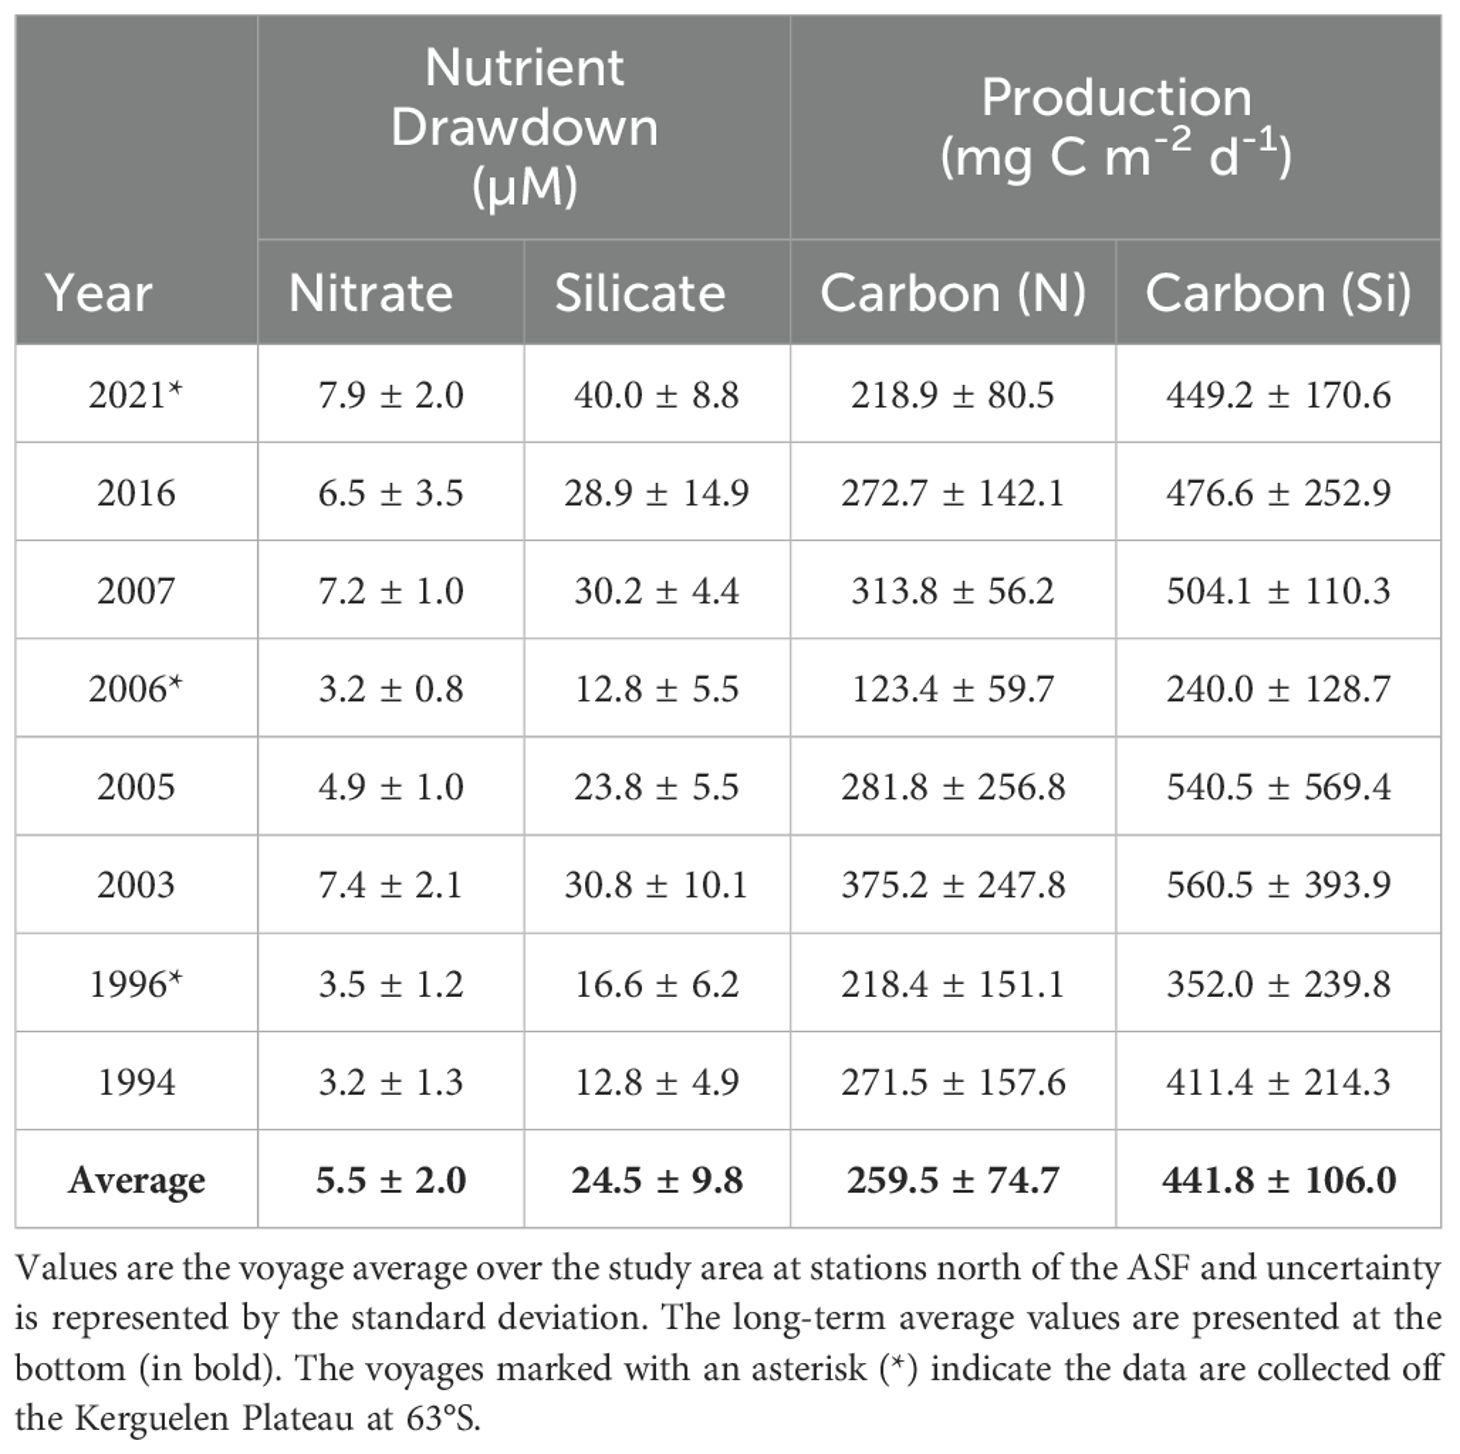
Table 3. Nutrient drawdown and primary production estimates based on silicate and nitrate bottle data collected across eight voyages, 1994 – 2021.
There is a clear linear relationship between silicate drawdown and nitrate drawdown, with silicate drawdown 4.6 times higher than that of nitrate (Figures 10A; Table 3). Seasonal production is also linearly related, with production calculated from silicate almost twice as high than that of nitrate-based production (Figure 10B).
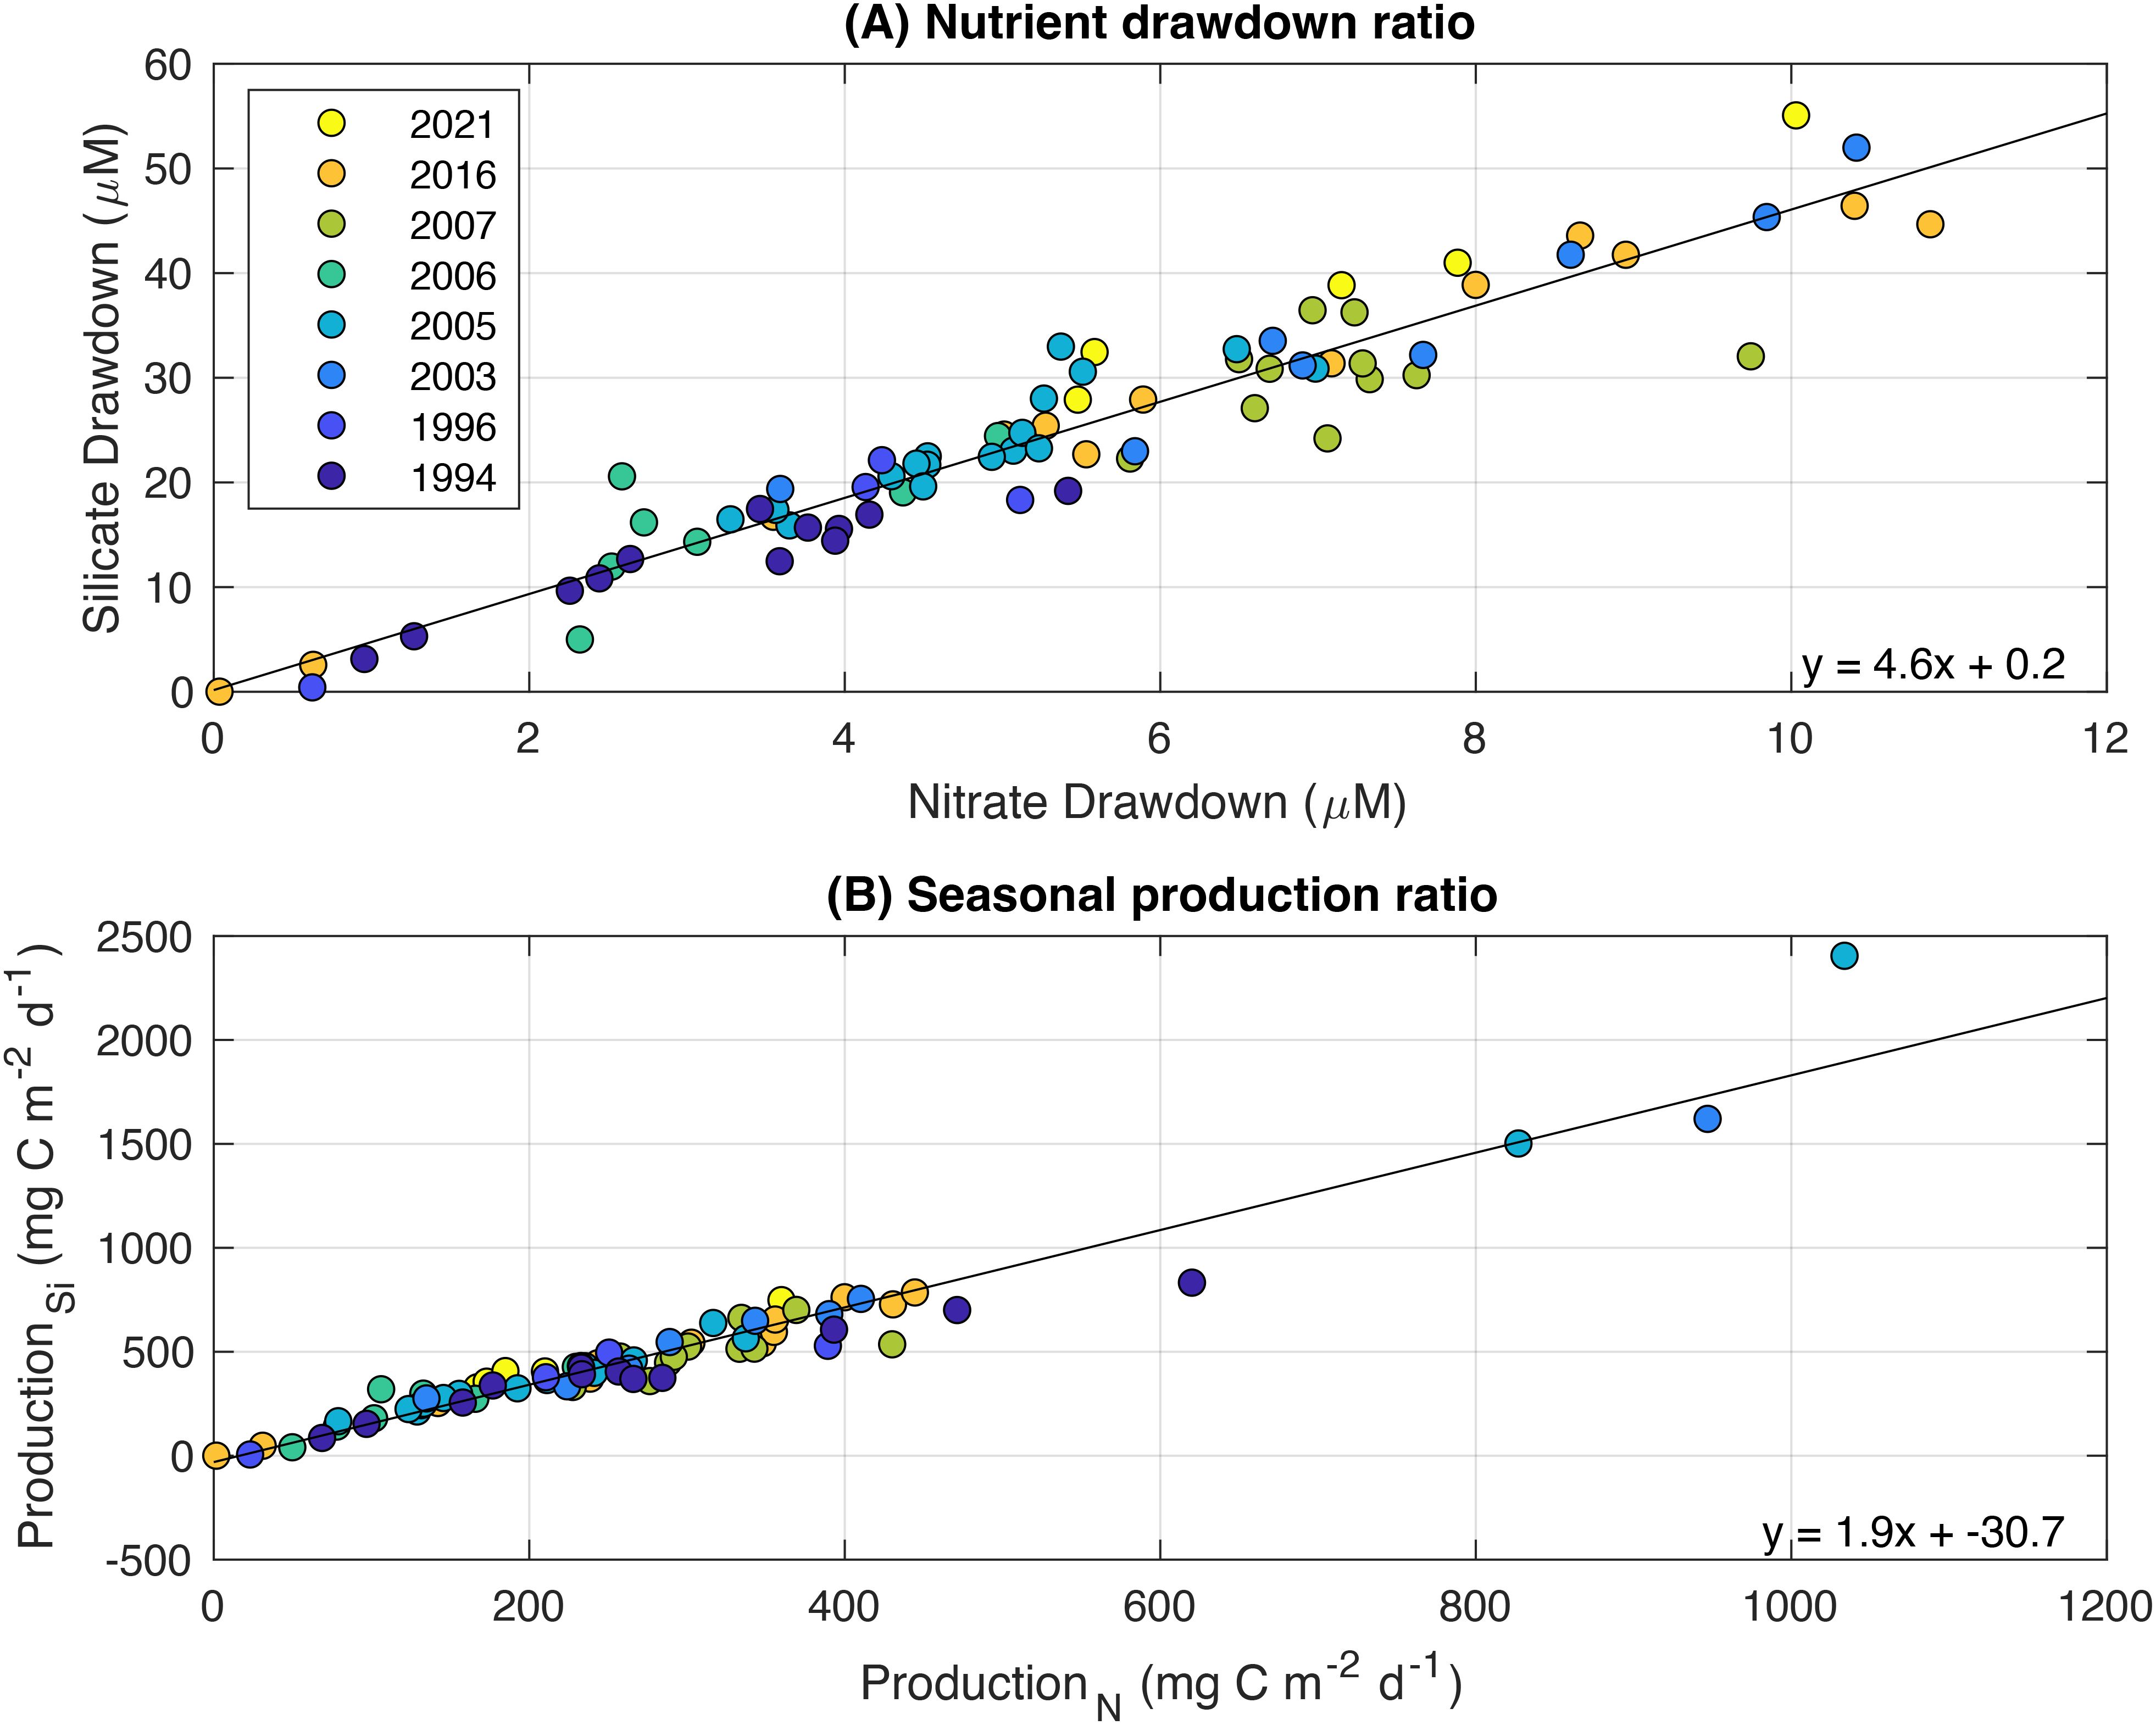
Figure 10. The relationship between nitrate and silicate (A) drawdown and (B) seasonal production from observations across eight voyages, 1994 – 2021. Note that only data from stations north of the ASF are shown. The solid lines represent linear regression, with equations shown in the lower right-hand corner of each panel.
The results from the fitted regression models reveal relationships between upper water column structure, physical drivers, and biological processes (Figure 11). Thicker Winter water layers (Figure 11A) are associated with shallower mixed layers (coef. est = -0.90 ± 0.16, t-value=-5.715, p-value<0.001) and colder Tmin values (coef. est = -14.14 ± 3.88, t-value=-3.643, p-value<0.001), while WW layers are thinner where UCDW (diagnostic signature is O2 minima) is shallower (coef. est = 0.08 ± 0.03, t-value=2.226, p-value=0.029). WW nitrate concentration is higher where the WW layer is thinner (coef. est = -0.03 ± 0.01, t-value=-2.96, p-value=0.004; Figure 11B), while mixed layer nitrate concentrations are higher within colder mixed layers (coef. est = -1.81 ± 0.41, t-value=-4.383, p-value<0.001) and where the WW core (i.e. the depth of the temperature minimum) is deeper (coef. est = 0.09 ± 0.02, t-value=5.461, p-value<0.001; Figure 11C). Nitrate drawdown is higher in association with longer time since sea-ice melt (coef. est = 0.04 ± 0.01, t-value=3.855, p-value<0.001) and shows a positive association with thinner WW layers (coef. est = -0.03 ± 0.01, t-value=-2.28, p-value=0.026; Figure 11D). Finally, higher nitrate-based production is associated with deeper mixed layers (coef. est = 3.68 ± 1.15, t-value=3.196, p-value=0.002; Figure 11E).
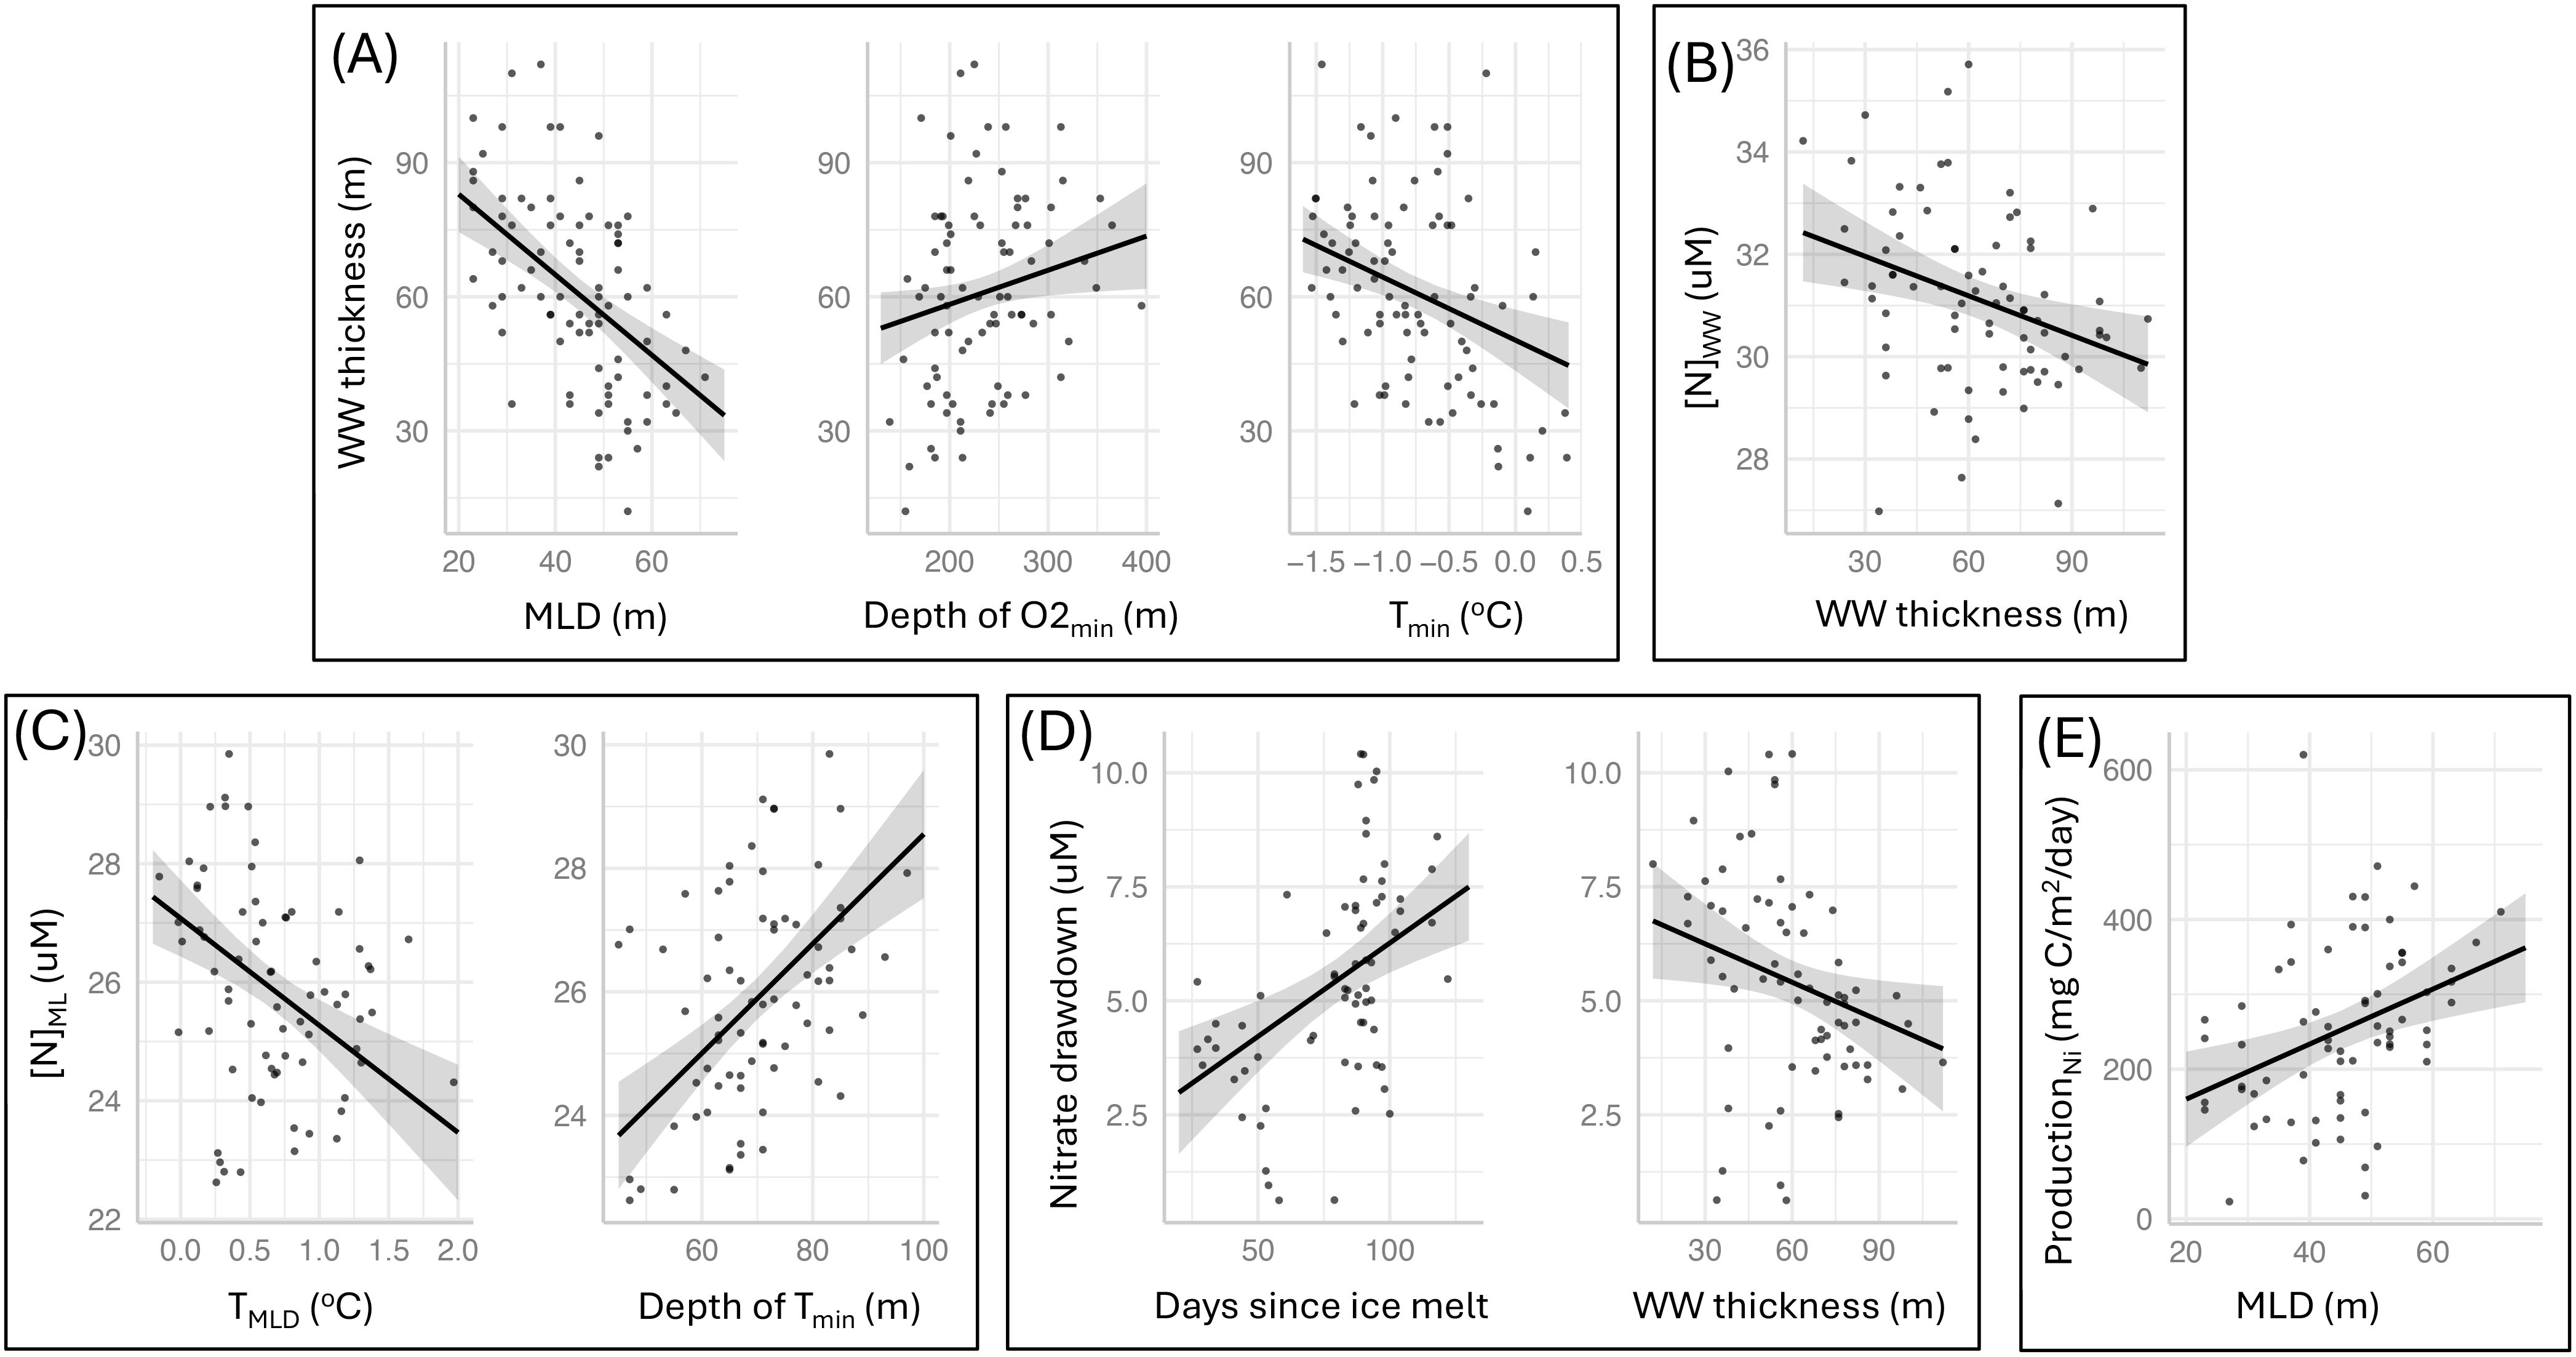
Figure 11. Results from fitted linear models exploring relationships between upper water column structure, physical drivers, and biological processes. Shown are the predictor terms retained in the highest ranked models for (A) Winter water thickness (m) (), (B) winter water nitrate concentrations (µM) (), (C) mixed layer nitrate concentrations (µM) (), (D) the drawdown of nitrate (), and (E) the production estimate based on nitrate drawdown (mg C m-2 d-1) (). All retained terms are considered significant (p-value< 0.05); model coefficient estimates are reported in Results text.
5 Discussion
The study investigated available hydrographic data (temperature, salinity, and oxygen concentration) in conjunction with spatiotemporal patterns in nutrient availability, drawdown and primary production, to examine the relationship between upper ocean vertical structure and ecosystem productivity in the region near 80°E. The upper ocean properties were largely consistent across the eight voyages 1994 – 2021, facilitating our ability to define water masses and fronts and compare them across years using uniform criteria. The spatial and temporal patterns in the biophysical properties enabled us to explore the physical processes that set the structure and nutrient supply within the seasonal mixed layer and the winter water below, and how these are utilized by phytoplankton throughout the season, thereby improving our understanding of the ecosystem function within the important southern Kerguelen plateau region.
In this region, the eastward flow of the ACC is constrained by the narrow PET, with the KP to the north and the Antarctic continental slope to the south. Hence, the two southernmost fronts of the ACC (Southern Boundary and SACCF) are often co-located in space, when defined by classical subsurface criteria (Table 2). However, the two fronts can be separated by up to a degree of latitude (~100 km) as observed in 2006. Across the different voyages, the frontal locations vary north-south across about 1-1.5 degrees of latitude, consistent with previous observations of meandering ACC fronts, which could be due to the recirculation of the Prydz Bay gyre and the increase in mesoscale eddy dynamics on approaching the PET (Bestley et al., 2020; Heywood et al., 1999).
Over the observation period 1994 to 2021, mixed layer depths calculated from either density or maximum buoyancy frequency, shallowed from north to south. This is likely a seasonal effect, being due to the earlier ice-free state in the northern part of the study domain, where seawater is exposed to wind mixing for a longer time. Stations at the northern end of the study region generally experienced about 100 days since sea ice melt while those on the southern end were only ice-free for about 30 days before sampling. As the mixed layer reflects the interaction between the ocean and the atmosphere, its depth is influenced by the wind in the atmosphere, with increased wind stress causing it to deepen (Carranza and Gille, 2015; Sallée et al., 2010). Williams et al. (2010) showed that there was a strong positive linear correlation between the mixed layer depth and ice-free days and wind stress in this area. The repeat observations at 63°S in our study showed that the mixed layer gradually increased in average temperature from early to late summer, accompanied by a general deepening overall (Figures 7A, B). The exceptions were in 1994 and 2007, with anomalous values likely due to local storms or mesoscale dynamics.
The mixed layer became much shallower south of 65°S in the vicinity of the ASF (the cold, V-shaped feature evident in Figure 5). South of the ASF the near surface often remains under the influence of sea ice, particularly associated with the West Ice shelf nearby. Westwood et al. (2010) noted that the mixed layer depth in the sea-ice region is shallower than in the open sea, which is consistent with our results near 80°E. Additionally, both the density-based and buoyancy-based mixed layer depths fluctuated greatly during 1994, possibly because these voyage data were mainly collected in early summer (December) before the seasonal mixed layer had a chance to form (Figure 1; Table 1).
The oceanographic data showed relatively consistent spatial patterns in nutrient concentrations within the region (Figure 8). Nutrient concentrations are clearly lower in the surface layer relative to the deep. This is because the main source of macronutrients in the Southern Ocean is circumpolar deep water, which replenishes nutrients from below (Callahan, 1972). Also, nutrient drawdown by phytoplankton mainly occurs within the mixed layer where light availability for photosynthesis is high. As depth increases, the amount of light obtained by phytoplankton decreases, leading to less productivity and drawdown (Westwood et al., 2010).
Nutrient drawdown of both nitrate and silicate was generally related to time since sea-ice melt across the voyages (Figures 9B, E), with values increasing with time. This is because the total amount of nutrients used by phytoplankton accumulates gradually over the season. Stations sampled later in the season therefore had more time for nutrient uptake, and vice versa. Nitrate concentrations are lower with warmer temperatures in the mixed layer (Figure 11C) and drawdown of nitrate is higher with more days since sea ice melt (Figure 11D), further supporting a seasonal effect with the mixed layer warming throughout the season. The exception to the general seasonal pattern was in 2016 when drawdown was higher than expected early in the season (~50 days since melt, Figure 9B). This may have been related to replenishment of nutrients, e.g. from upwelling of CDW or lateral advection (Westwood et al., 2010). The similar pattern of nitrate and silicate drawdown across voyages suggests that diatoms were the main phytoplankton group contributing to production – given that other taxa do not require silicate. The dominance of diatoms in Southern Ocean waters has been clearly shown in other studies from East Antarctica (e.g. Wright et al., 2010, average of 61% of total chlorophyll a in a primary bloom, 43% in a secondary bloom, 38.7% south of the SB outside bloom regions, 49% between the SB and sACCF, 60.6% north of the sACCF; Takao et al., 2014, 55-87% of total chlorophyll south of 55°S; Heidemann et al., 2024, 56% of total chlorophyll a south of 62°S).
Production was also related to days since melt but had the opposite pattern to drawdown, with highest values (up to 2000 mg C m-2 d-1) occurring earliest in the season, within the first 40 days of melt (Figures 9H, K). Most high values are for stations south of the ASF, with latitude therefore also affecting production (Figures 9G, J). These stations south of the ASF, and with short days since melt, are likely reflective of the spring bloom that can occur at the retreating ice edge. This is associated with high iron input from ice melt (Lannuzel et al., 2016), combined with shallow mixed layer depths within the fresh meltwater lens creating a stable, high light environment. It should be noted that drawdown and production values are partly questionable south of the ASF in that there is no true Tmin to gain accurate WW nutrient concentrations. However, our data agrees with previous studies that clearly show highest production close to the Antarctic coast compared to offshore waters, thought to be due to increased iron supply (Westwood et al., 2010; Wright et al., 2010).
North of the ASF production does not obviously vary with ice-free days. It may have been expected that production rates would decrease by late summer because phytoplankton cells may have been becoming senescent with time. However, this was not observed. Rather, production north of the ASF was positively influenced by increased mixed layer depth (Figure 11E). Accordingly, there was less nitrate in the mixed layer when the mixed layers were warmer (Figure 11C), both consistent with increased drawdown occurring in waters that experienced a longer time since sea-ice melt (Figure 11D). The positive influence of mixed layer depth on production may be unexpected given that increased mixed layer depths potentially mean less light availability for phytoplankton growth. However, in this area mixed layers typically ranged from 10-60 m across voyages and under low biomass euphotic depths can be as deep as 80-100 m, as demonstrated by Westwood et al. (2010) and Heidemann et al. (2024). This suggests that even within the deepest mixed layer depths observed there was still sufficient light for phytoplankton growth.
The positive influence of deeper mixed layers on production was likely associated with increased nutrient availability, allowing sustained phytoplankton growth throughout the season. Evidence to support increased nutrient availability comes from consideration of additional physical processes within the water column. Firstly, it was found that the availability of nitrate in WW was related to the thickness of this layer: decreased WW thickness means increased nitrate. Therefore, we consider any physical processes that enhance a decrease in WW thickness allows the potential for increased nutrient supply to surface waters. Shallower depths of UCDW (as indicated by the oxygen minimum) were related to decreased WW thickness. Therefore, it is likely that nitrate was increased due to upwelling from nutrient rich CDW. A thinner (and warmer) WW layer is caused not only by shallower CDW below but is also associated with deeper mixed layers overlying (Figure 11A, see also Figure 8). With a thinner WW layer, the mixed layer is therefore in closer proximity to CDW, as well as to increased nutrient availability within the WW layer. This may enable a reliable and sustained source of additional nutrients. For phytoplankton populations offshore there is high reliance on upwelled nutrient sources to replenish surface waters given a lack of input from continental sources.
The production values obtained in our study were within a similar range to other regions in East Antarctica. North of the ASF, voyage averages for nitrate-based production ranged from 127-309 mg C m-2 d-1 and silicate-based production from 243-533 mg C m-2 d-1 (Table 3). The average across all voyages and locations was 260 ± 75 and 442 ± 106 mg C m-2 d-1 for nitrate- and silicate-based production, respectively. In comparison, the BROKE-West region nitrate-based production averaged 410.3 ± 323.7 mg C m-2 d-1 and silicate-based production 302.5 ± 273.7 mg C m-2 d-1 (Westwood et al., 2010). For the BROKE region nitrate-based production was 50-750 mg C m-2 d-1 (Nicol et al., 2000a; Strutton et al., 2000). Our study also had similar production rates to the Weddell Sea (128 - 977 mg C m-2 d-1), Ross Sea (124 - 638 mg C m-2 d-1), and the Scotia Sea (30 - 250 mg C m-2 d-1) in the open ocean (El-Sayed and Weber, 1982; Park et al., 1999; Saggiomo et al., 2002).
The ratio of silicate drawdown to nitrate drawdown was 4.6, and the ratio of silicate-based production to nitrate-based production was 1.9, with the carbon production based on silicate consumption being significantly higher than that based on nitrate. According to Richards (1958), we would expect phytoplankton to uptake silicate at about the same amount as nitrogen (ratio 1:1). The difference in our study could be due to recycling of nitrogen by bacteria in surface waters (Brzezinski et al., 2003; Mosseri et al., 2008). This forms ammonia and regenerated production may have occurred, whereby the diatoms use ammonia as a source of nitrogen rather than nitrate. As the diatoms are consuming silicate whilst using either nitrate or ammonia as a nitrogen source, this results in a silicate:nitrate uptake greater than 1. A second reason could be iron limitation. Under the condition of iron deficiency, the uptake of silicate has been shown to be greater than that of nitrate (Hutchins and Bruland, 1998; Takeda, 1998). Westwood et al. (2010) showed higher Si:N ratios offshore compared to coastal Antarctic waters where iron supply was likely greater.
A sustained seasonal phytoplankton bloom over and east of the SKP has been linked to subsurface iron supply, likely advected northwards offshore from the Antarctic shelf (Schallenberg et al., 2018). This regional productivity supports foraging grounds for higher order predators, including those migrating from Kerguelen Island (Patterson et al., 2016; Bestley et al., 2016) and farther north. For example, tracking data for migratory Western Australian humpback whales (Bestley et al., 2019) showed occupancy of the dynamic western boundary current (~59°S, 83°E) earlier in the season (Nov-Dec) and southward movement thereafter including into this area near 80° E. Two recent voyages, in 2016 (KAXIS) and 2021 (TEMPO), directly observed large numbers of whales aggregating and feeding on krill at this “biological hotspot” near 63°S, 80° E; i.e. within the deep waters immediately west of the SKP. Todd and Williamson (2022) found that cetaceans sighted near the northern Kerguelen Plateau tended to occur in pelagic (depths > 600 m) rather than plateau waters. Thiele et al. (2000) proposed that cetacean distributions might be linked to areas where physical processes support extended surface water residence conditions for primary producers. Comparing repeat ocean observations available at 63°S and 64°S, we found the greatest differences to be evident in the deep-water properties (Figures 7G, H), these properties generally being more stable at 63°S. Because the major fronts (sACCf and SB) are farther to the south, the properties at 63°S are less influenced by the dynamic frontal meandering and exchange. It is possible that this quiescent area, nearby the dynamic fronts but with relatively weak geostrophic currents, may provide favorable conditions for retaining phytoplankton blooms (Park et al., 2008a, Park et al., 2008b) and krill swarms (Bestley et al., 2018). Todd and Williamson (2022) also found whales sightings to be associated with higher phytoplankton concentrations and higher dissolved oxygen. Whales are particularly dependent on predictable, productive conditions for their seasonal feeding in polar regions (Smetacek and Nicol, 2005; Tulloch et al., 2019).
This study used all available cruise data, which is of a certified standard quality but was intermittent over the 20-year period, providing an incomplete time series of the physical environment and biological exchange in the region. In the future, oceanographic data from animal tracking (https://imos.org.au/facility/animal-tracking) could be included in a more comprehensive analysis of the changes in seawater properties and associated biological activity in the region (e.g. Roquet et al., 2009). Increasing data streams from BGC-Argo floats (https://argo.ucsd.edu/expansion/biogeochemical-argo-mission/) can further document spatial and seasonal variations in physical-biogeochemical properties (fluorescence, backscatter, PAR) with high temporal and spatial resolution (Rembauville et al., 2017). Future work incorporating these new data sources could further examine the drivers of specific changes, for example, the interlinked roles of sea ice and the wind field to determine the importance of local and regional effects on mixed layer depth prior to sampling.
6 Conclusion
We provide a comprehensive study on the vertical structure of the upper ocean and associated primary production in the vicinity of 80°E East Antarctica, from a compilation of historical cruise data. The mixed layer depth varied with latitude, being deeper in the northern part of the study region where sea ice melt occurs earlier. Nutrient drawdown increased throughout the season, with more drawdown later in the summer. Silicate-based production was higher than nitrate-based production in this region, possibly due to efficient nitrate recycling and/or iron limitation. Deeper mixed layer depths had a positive influence on production north of the ASF, likely associated with the supply of nutrients from UCDW. Highest production was south of the ASF where nutrient availability is increased due to continental and ice inputs.
Data availability statement
All data are publicly available. Data prior to 2021 can be found on CCHDO (https://cchdo.ucsd.edu/), and the TEMPO data is available from the CSIRO's Marine National Facility data portal (https://www.marine.csiro.au/data/trawler/survey_details.cfm?survey=IN2021_V01).
Author contributions
ML: Formal analysis, Investigation, Visualization, Writing – original draft. AF: Conceptualization, Data curation, Formal analysis, Investigation, Methodology, Project administration, Supervision, Visualization, Writing – review & editing. KW: Conceptualization, Formal analysis, Investigation, Methodology, Project administration, Supervision, Writing – review & editing. SB: Conceptualization, Data curation, Formal analysis, Investigation, Methodology, Project administration, Supervision, Visualization, Writing – review & editing.
Funding
The author(s) declare financial support was received for the research, authorship, and/or publication of this article. This project was supported and funded by Australian Antarctic Science Project 4512 and 4636, and received grant funding from the Australian Government as part of the Antarctic Science Collaboration Initiative program. This project also received financial support from Pew Charitable Trust and Antarctic Science Foundation.
Acknowledgments
We acknowledge the use of the CSIRO Marine National Facility (https://ror.org/01mae9353) and grant of sea time on RV Investigator in undertaking part of this research. We thank the captains and crews for their efforts and support in the collection of these data. We also thank Michael Sumner and Ben Raymond from the Australian Antarctic Division for their assistance in providing estimates of days since sea ice melt for all stations.
Conflict of interest
The authors declare that the research was conducted in the absence of any commercial or financial relationships that could be construed as a potential conflict of interest.
Publisher’s note
All claims expressed in this article are solely those of the authors and do not necessarily represent those of their affiliated organizations, or those of the publisher, the editors and the reviewers. Any product that may be evaluated in this article, or claim that may be made by its manufacturer, is not guaranteed or endorsed by the publisher.
Supplementary material
The Supplementary Material for this article can be found online at: https://www.frontiersin.org/articles/10.3389/fmars.2024.1451997/full#supplementary-material
References
Ainley D. G., Jacobs S. S. (1981). Sea-bird affinities for ocean and ice boundaries in the Antarctic. Deep Sea Res. Part A. Oceanographic Res. Papers 28, 1173–1185. doi: 10.1016/0198-0149(81)90054-6
Arrigo K. R., van Dijken G. L., Bushinsky S. (2008). Primary production in the Southern Ocean 1997–2006. J. Geophysical Research: Oceans 113, C08004. doi: 10.1029/2007JC004551
Barton K. (2023). “MuMIn: Multi-Model Inference,” in R package version 1.47.5. Available at: https://CRAN.R-project.org/package=MuMIn.
Bestley S., Andrews-Goff V., van Wijk E., Rintoul S. R., Double M. C., How J. (2019). New insights into prime Southern Ocean forage grounds for thriving Western Australian humpback whales. Sci. Rep. 9, 1–12. doi: 10.1038/s41598-019-50497-2
Bestley S., Jonsen I. D., Harcourt R. G., Hindell M. A., Gales N. J. (2016). Putting the behaviour into animal movement modelling: improved activity budgets from use of ancillary tag information. Ecol. Evol. 6, 8243–8255. doi: 10.1002/ece3.2016.6.issue-22
Bestley S., Raymond B., Gales N., Harcourt R., Hindell M. A., Jonsen I., et al. (2018). Predicting krill swarm characteristics important for marine predators foraging off East Antarctica. Ecography 41, 996–1012. doi: 10.1111/ecog.2018.v41.i6
Bestley S., van Wijk E., Rosenberg M., Eriksen R., Corney S., Tattersall K., et al. (2020). Ocean circulation and frontal structure near the southern Kerguelen Plateau: The physical context for the Kerguelen Axis ecosystem study. Deep Sea Res. Part II: Topical Stud. Oceanography 174. doi: 10.1016/j.dsr2.2018.07.013
Bindoff N. L., Rosenberg M. A., Warner M. J. (2000). On the circulation and water masses over the Antarctic continental slope and rise between 80 and 150 E. Deep Sea Res. Part II: Topical Stud. Oceanography 4, 2299–2326. doi: 10.1016/S0967-0645(00)00038-2
Boyd P. W., Arrigo K. R., Strzepek R., vanDijken G. L. (2012). Mapping phytoplankton iron utilization: Insights into Southern Ocean supply mechanisms. J. Geophysical Research: Oceans 117, C06009. doi: 10.1029/2011JC007726
Brzezinski M. A., Dickson M.-L., Nelson D. M., Sambrotto R. (2003). Ratios of Si, C and N uptake by microplankton in the Southern Ocean. Deep Sea Res. Part II: Topical Stud. Oceanography 50, 619–633. doi: 10.1016/S0967-0645(02)00587-8
Burnham K. P., Anderson D. R. (2002). Model selection and multimodel inference: a practical information-theoretic approach. 2nd ed (New York: Springer-Verlag).
Callahan J. E. (1972). “The structure and circulation of deep water in the Antarctic,” in Deep sea research and oceanographic abstracts, 19, 563–575. doi: 10.1016/0011-7471(72)90040-X
Carranza M. M., Gille S. T. (2015). Southern Ocean wind-driven entrainment enhances satellite chlorophyll-a through the summer. J. Geophysical Research: Oceans 120, 304–323. doi: 10.1002/2014JC010203
Carvalho F., Kohut J., Oliver M. J., Schofield O. (2017). Defining the ecologically relevant mixedlayer depth for Antarctica’s coastal seas. Geophysical Res. Lett. 44, 338–345. doi: 10.1002/2016GL071205
Cavalieri D., Parkinson C., Gloersen P., Zwally H. (1996). Sea Ice Concentrations From Nimbus-7 SMMR and DMSP SSM/ISSMI Passive Microwave Data, January 1979 to August 2011. Natl. Snow Ice Data Cent. Boulder Colo.,[Updated daily]. doi: 10.5067/8GQ8LZQVL0VL
Copin-Montegut C., Copin-Montegut G. (1978). The chemistry of particulate matter from the south Indian and Antarctic oceans. Deep Sea Res. 25, 911–931. doi: 10.1016/0146-6291(78)90633-1
Cox M. J., Macaulay G., Brasier M. J., Burns A., Johnson O. J., King R., et al. (2022). Two scales of distribution and biomass of Antarctic krill (Euphausia superba) in the eastern sector of the CCAMLR Division 58.4. 2 (55° E to 80° E). PloS One 17, e0271078. doi: 10.1371/journal.pone.0271078
de Boyer Montégut C., Madec G., Fischer A. S., Lazar A., Iudicone D. (2004). Mixed layer depth over the global ocean: An examination of profile data and a profile-based climatology. J. Geophysical Research: Oceans 109, C12. doi: 10.1029/2004JC002378
El-Sayed S., Weber L. (1982). Spatial and temporal variations in phytoplankton biomass and primary productivity in the Southwest Atlantic and the Scotia Sea. Polar Biol. 1, 83–90. doi: 10.1007/BF00263804
Foppert A., Bestley S., Shadwick E. H., Klocker A., Vives C. R., Liniger G., et al. (2024). Observed water-mass characteristics and circulation off Prydz Bay, East Antarctica. Front. Mar. Sci. doi: 10.3389/fmars.2024.1456207
Foppert A., Donohue K. A., Watts D. R., Tracey K. L. (2017). Eddy heat flux across the Antarctic Circumpolar Current estimated from sea surface height standard deviation. J. Geophysical Research: Oceans 122, 6947–6964. doi: 10.1002/2017JC012837
Gao Y., Yu S., Sherrell R. M., Fan S., Bu K., Anderson J. R. (2020). Particle-size distributions and solubility of aerosol iron over the Antarctic peninsula during austral summer. J. Geophysical Research: Atmospheres 125, e2019JD032082. doi: 10.1029/2019JD032082
Heidemann A., Westwood K. J., Foppert A., Klocker A., Vives C. R., Wotherspoon S., et al. (2024). Drivers of phytoplankton distribution, abundance and community composition off East Antarctica, from 55-80°E (CCAMLR Division 58.4.2 East). Front. Mar. Sci. doi: 10.3389/fmars.2024.1454421
Henley S. F., Cavan E. L., Fawcett S. E., Kerr R., Monteiro T., Sherrell R. M., et al. (2020). Changing biogeochemistry of the Southern Ocean and its ecosystem implications. Front. Mar. Sci., 581. doi: 10.3389/fmars.2020.00581
Heywood K. J., Sparrow M. D., Brown J., Dickson R. R. (1999). Frontal structure and Antarctic bottom water flow through the Princess Elizabeth Trough, Antarctica. Deep Sea Res. Part I: Oceanographic Res. Papers 46, 1181–1200. doi: 10.1016/S0967-0637(98)00108-3
Hutchins D. A., Bruland K. W. (1998). Iron-limited diatom growth and Si: N uptake ratios in a coastal upwelling regime. Nature 393, 561–564. doi: 10.1038/31203
Lannuzel D., Vancoppenolle M., van den Merwe P., de Jong J., Meiners K. M., Grotti M., et al. (2016). Iron and sea ice: Review and new insights. Elementa 4. doi: 10.12952/journal.elementa.000130
Laufkötter C., Stern A. A., John J. G., Stock C. A., Dunne J. P. (2018). Glacial iron sources stimulate the southern ocean carbon cycle. Geophysical Res. Lett. 45, 377–313,385. doi: 10.1029/2018GL079797
Lu Z., Liu D., Liao J., Wang J., Li H., Zhang J. (2020). Characterizing spatial distribution of chlorophyll a in the Southern Ocean on a circumpolar cruise in summer. Sci. Total Environ. 708, 134833. doi: 10.1016/j.scitotenv.2019.134833
Maslanik J., Stroeve J. (1999). “Near-real-time DMSP SSMIS daily polar gridded sea ice concentrations, version 1,” in NASA national snow and ice data center distributed active archive center.
McDougall T. J., Barker P. M. (2011). Getting started with TEOS-10 and the Gibbs Seawater (GSW) Oceanographic Toolbox. Scor/Iapso WG. SCOR/IAPSO WG127, 28pp.
Meijers A., Klocker A., Bindoff N., Williams G., Marsland S. (2010). The circulation and water masses of the Antarctic shelf and continental slope between 30 and 80E. Deep Sea Res. Part II: Topical Stud. Oceanography, 723–737. doi: 10.1016/j.dsr2.2009.04.019
Mosseri J., Queguiner B., Armand L., Cornet-Barthaux V. (2008). Impact of iron on silicon utilization by diatoms in the Southern Ocean: A case study of Si/N cycle decoupling in a naturally iron-enriched area. Deep Sea Res. Part II: Topical Stud. Oceanography 55, 801–819. doi: 10.1016/j.dsr2.2007.12.003
Nelson D. M., Smith W. Jr. (1991). Sverdrup revisited: Critical depths, maximum chlorophyll levels, and the control of Southern Ocean productivity by the irradiance-mixing regime. Limnology Oceanography 36, 1650–1661. doi: 10.4319/lo.1991.36.8.1650
Nicol S., Pauly T., Bindoff N., Strutton P. (2000a). BROKE” a biological/oceanographic survey off the coast of East Antarctica (80–150° E) carried out in January–March 1996. Deep Sea Res. Part II: Topical Stud. Oceanography 12-13, 09670645. doi: 10.1016/S0967-0645(00)00026-6
Nicol S., Pauly T., Bindoff N. L., Wright S., Thiele D., Hosie G. W., et al. (2000b). Ocean circulation off east Antarctica affects ecosystem structure and sea-ice extent. Nature 406, 504–507. doi: 10.1038/35020053
Nicol S., Raymond B. (2012). Pelagic ecosystems in the waters off East Antarctica (30°E−150°E). Antarctic ecosystems: an extreme environment in a changing world. Rogers A. D., Johnston N. M., Murphy E. J., Clarke A. Eds. Ch. 8 (Blackwell Publishing Ltd.), 243–254. doi: 10.1002/9781444347241.ch8
Orsi A. H., Whitworth T. III, Nowlin W. D. Jr. (1995). On the meridional extent and fronts of the Antarctic Circumpolar Current. Deep Sea Res. Part I: Oceanographic Res. Papers 42, 641–673. doi: 10.1016/0967-0637(95)00021-W
Park Y.-H., Fuda J.-L., Durand I., Naveira Garabato A. C. (2008a). Internal tides and vertical mixing over the Kerguelen Plateau. Deep Sea Res. Part II: Topical Stud. Oceanography 55, 582–593. doi: 10.1016/j.dsr2.2007.12.027
Park Y.-H., Roquet F., Durand I., Fuda J.-L. (2008b). Large-scale circulation over and around the Northern Kerguelen Plateau. Deep Sea Res. Part II: Topical Stud. Oceanography 55, 566–581. doi: 10.1016/j.dsr2.2007.12.030
Park M. G., Yang S. R., Kang S.-H., Chung K. H., Shim J. H. (1999). Phytoplankton biomass and primary production in the marginal ice zone of the northwestern Weddell Sea during austral summer. Polar Biol. 1, 251–261. doi: 10.1007/s003000050360
Patterson T. A., Sharples R. J., Raymond B., Welsford D. C., Andrews-Goff V., Lea M.-A., et al. (2016). Foraging distribution overlap and marine reserve usage amongst sub-Antarctic predators inferred from a multi-species satellite tagging experiment. Ecol. Indicators vol. 70 pp, 531–544. doi: 10.1016/j.ecolind.2016.05.049
Person R., Vancoppenolle M., Aumont O., Malsang M. (2021). Continental and sea ice iron sources fertilize the Southern Ocean in synergy. Geophysical Res. Lett. 48, e2021GL094761. doi: 10.1029/2021GL094761
Pinkerton M. H., Boyd P. W., Deppeler S., Hayward A., Höfer J., Moreau S. (2021). Evidence for the impact of climate change on primary producers in the southern ocean. Front. Ecol. Evol. 9. doi: 10.3389/fevo.2021.592027
R Core Team (2023). “R: A Language and Environment for Statistical Computing,” in R Foundation for Statistical Computing(Vienna, Austria). Available at: https://www.R-project.org/.
Raymond B., Lea M.-A., Patterson T., Andrews-Goff V., Sharples R., Charrassin J.-B., et al. (2015). Important marine habitat off east Antarctica revealed by two decades of multi-species predator tracking. Ecography 38, 121–129. doi: 10.1111/ecog.01021
Redfield A. C. (1958). The biological control of chemical factors in the environment. Am. scientist 46, 230A–2221.
Rembauville M., Briggs N., Ardyna M., Uitz J., Catala P., Penkerc’h C., et al. (2017). Plankton assemblage estimated with BGC-Argo floats in the Southern Ocean: Implications for seasonal successions and particle export. J. Geophysical Research: Oceans 122, 8278–8292. doi: 10.1002/2017JC013067
Richards F. (1958). “Dissolved silicate and related properties of some western north-Atlantic and Caribbean waters.” J. Mar. Res. 17(1).
Rintoul S. R. (2018). The global influence of localized dynamics in the Southern Ocean. Nature 558, 209–218. doi: 10.1038/s41586-018-0182-3
Roquet F., Park Y. H., Guinet C., Bailleul F., Charrassin J. B. (2009). Observations of the Fawn Trough Current over the Kerguelen Plateau from instrumented elephant seals. J. Mar. Syst. 78, 377–393. doi: 10.1016/j.jmarsys.2008.11.017
Saggiomo V., Catalano G., Mangoni O., Budillon G., Carrada G. C. (2002). Primary production processes in ice-free waters of the Ross Sea (Antarctica) during the austral summer 1996. Deep Sea Res. Part II: Topical Stud. Oceanography 49, 1787–1801. doi: 10.1016/S0967-0645(02)00012-7
Sallée J.-B., Speer K., Rintoul S. (2010). Zonally asymmetric response of the Southern Ocean mixed layer depth to the Southern Annular Mode. Nat. Geosci. 3, 273–279. doi: 10.1038/ngeo812
Schallenberg C., Bestley S., Klocker A., Trull T. W., Davies D. M., Gault-Ringold M., et al. (2018). Sustained upwelling of subsurface iron supplies seasonally persistent phytoplankton blooms around the southern Kerguelen plateau, Southern Ocean. J. Geophysical Research: Oceans 123, 5986–6003. doi: 10.1029/2018JC013932
Smetacek V., Nicol S. (2005). Polar ocean ecosystems in a changing world. Nature 437, 362–368. doi: 10.1038/nature04161
Sparrow M. D., Heywood K. J., Brown J. (1996). Current structure of the south Indian Ocean. J. Geophysical Research: Oceans 101, 6377–6391. doi: 10.1029/95JC03750
Strutton P. G., Griffiths F. B., Waters R. L., Wright S. W., Bindoff N. L. (2000). Primary productivity off the coast of East Antarctica (80-150°E): January to March 1996. Deep-Sea Res. II 47, 2327–2362. doi: 10.1016/S0967-0645(00)00028-X
Takao S., Hirawake T., Hashida G., Sasaki H., Hattori H., Suzuki K. (2014). Phytoplankton community composition and photosynthetic physiology in the Australian sector of the Southern Ocean during the austral summer of 2010/2011. Polar Biol. 37, 1563–1578. doi: 10.1007/s00300-014-1542-6
Takeda S. (1998). Influence of iron availability on nutrient consumption ratio of diatoms in oceanic waters. Nature 393, 774–777. doi: 10.1038/31674
Tamsitt V., Drake H. F., Morrison A. K., Talley L. D., Dufour C. O., Gray A. R., et al. (2017). Spiraling pathways of global deep waters to the surface of the Southern Ocean. Nat. Commun. 8, 172. doi: 10.1038/s41467-017-00197-0
Thiele D., Chester E. T., Gill P. C. (2000). Cetacean distribution off Eastern Antarctica (80–150 E) during the Austral summer of 1995/1996. Deep Sea Res. Part II: Topical Stud. Oceanography 47, 2543–2572. doi: 10.1016/S0967-0645(00)00035-7
Todd V. L., Williamson L. D. (2022). Cetacean distribution in relation to oceanographic features at the Kerguelen Plateau. Polar Biol. 5, 113–126. doi: 10.1007/s00300-021-02977-3
Tulloch V. J., Plagányi ÉE., Brown C., Richardson A. J., Matear R. (2019). Future recovery of baleen whales is imperiled by climate change. Global Change Biol. 25, 1263–1281. doi: 10.1111/gcb.2019.25.issue-4
van Wijk E. M., Rintoul S. R., Ronai B. M., Williams G. D. (2010). Regional circulation around Heard and McDonald Islands and through the fawn trough, central Kerguelen Plateau. Deep Sea Res. Part I: Oceanographic Res. Papers 57, 653–669. doi: 10.1016/j.dsr.2010.03.001
Vivier F., Park Y.-H., Sekma H., Le Sommer J. (2015). Variability of the Antarctic Circumpolar Current transport through the Fawn trough, Kerguelen Plateau. Deep-Sea Researt Part II: Topical Stud. Oceanography 114, 12–26. doi: 10.1016/j.dsr2.2014.01.017
Weatherall P., Marks K. M., Jakobsson M., Schmitt T., Tani S., Arndt J. E., et al. (2015). A new digital bathymetric model of the world’s oceans. Earth Space Sci. 2, 331–345. doi: 10.1002/2015EA000107
Westwood K. J., Griffiths F. B., Meiners K. M., Williams G. D. (2010). Primary productivity off the Antarctic coast from 30° to 80° E; BROKE-West survey. Deep-Sea Research II 57, 794–814. doi: 10.1016/j.dsr2.2008.08.020
Williams G. D., Nicol S., Aoki S., Meijers A. J., Bindoff N. L., Iijima Y., et al. (2010). Surface oceanography of BROKE-West, along the Antarctic margin of the south-west Indian Ocean (30–80E). Deep Sea Res. Part II: Topical Stud. Oceanography 57, 738–757. doi: 10.1016/j.dsr2.2009.04.020
Wright S. W., van den Enden R. L. (2000). Phytoplankton community structure and stocks in the East Antarctic marginal ice zone (BROKE survey, January-March 1996) determined by CHEMTAX analysis of HPLC pigment signatures. Deep Sea Res. Part II: Topical Stud. Oceanography 47, 2363–2400. doi: 10.1016/S0967-0645(00)00029-1
Wright S. W., van den Enden R. L., Pearce I., Davidson A. T., Scott F. J., Westwood K. J. (2010). Phytoplankton community structure and stocks in the Southern Ocean (30-80°E) determined by CHEMTAX analysis of HPLC pigment signatures. Deep Sea Res. Part II: Topical Stud. Oceanography 57, 758–778. doi: 10.1016/j.dsr2.2009.06.015
Keywords: Antarctic Circumpolar Current (ACC) fronts, summer stratification, seasonal mixed layer, nutrient availability, drawdown, biological productivity
Citation: Liang M, Foppert A, Westwood KJ and Bestley S (2025) Observed upper-ocean structure and seasonal production in the southern Kerguelen Plateau region, 1994-2021. Front. Mar. Sci. 11:1451997. doi: 10.3389/fmars.2024.1451997
Received: 20 June 2024; Accepted: 19 December 2024;
Published: 22 January 2025.
Edited by:
Toru Hirawake, National Institute of Polar Research, JapanReviewed by:
Keishi Shimada, National Institute of Polar Research, JapanRachel Thomas, Florida Department of Environmental Protection, United States
Copyright © 2025 Liang, Foppert, Westwood and Bestley. This is an open-access article distributed under the terms of the Creative Commons Attribution License (CC BY). The use, distribution or reproduction in other forums is permitted, provided the original author(s) and the copyright owner(s) are credited and that the original publication in this journal is cited, in accordance with accepted academic practice. No use, distribution or reproduction is permitted which does not comply with these terms.
*Correspondence: Annie Foppert, YW5uaWUuZm9wcGVydEB1dGFzLmVkdS5hdQ==
 Man Liang
 Annie Foppert
 Karen J. Westwood
 Sophie Bestley