 Weiwei Zhou1
 Qingxi Han
- 1Ningbo University, School of Marine Sciences, Ningbo, China
- 2Marine Environmental Monitoring Center of Ningbo, Ministry of Natural Resources, Ningbo, China
- 3Yuzhi Environmental Technology (Zhejiang) Co., Ltd., Ningbo, China
The ecological effects of eutrophication on estuaries and coastal ecosystems are significant worldwide. Based on data collected in 2019 from Hangzhou Bay and adjacent waters, this study employed biological traits analysis and RLQ/fourth-corner analysis methods to investigate the distribution patterns of macrobenthic assemblages along a eutrophication gradient and reveal the response patterns of their biological traits to eutrophication stress. The results showed that eutrophication had a significant structuring effect on the spatial distribution of macrobenthic community structure. As the level of eutrophication increased, the community abundance and number of macrobenthic biological traits decreased. The composition of macrobenthic community biological traits changed in response to eutrophication. In areas with high levels of eutrophication, larger body sizes became more dominant, reflecting a shift in dominant traits similar to the eutrophication gradient. Furthermore, the predominant species in this region were burrowers and tube dwellers, which preferred muddy sand and sandy mud substrates. The AMBI ecological group accurately reflects the degree of eutrophication disturbance, with tolerant species and second-order opportunistic species being common in eutrophic areas.
1 Introduction
Eutrophication is a water pollution phenomenon caused by excessive levels of nutrients such as nitrogen and phosphorus in the water (Akinnawo, 2023; Kratzer et al., 2019). The causes of eutrophication are imbalances in the functioning of aquatic ecosystems, triggered by changes in the quantity, relative proportion, or chemical forms of nitrogen and phosphorus entering these ecosystems. The nature and intensity of the response are influenced by the rate of water flow, temperature, and the intensity of light (Le Moal et al., 2019). There are two types of eutrophication in water bodies: one is natural eutrophication formed through long-term accumulation, and the other is cultural eutrophication, which forms rapidly in a short period of time (Akinnawo, 2023). The extent of natural eutrophication is determined by soil movement in the surrounding watershed and the speed of surface and groundwater flow. Along the land–sea continuum, phosphorus is primarily retained in the soil, and when soil is eroded and transported by water flow, phosphorus can enter the ocean in solid or liquid form (Jarvie et al., 2013). Nitrogen mainly dissolves into surface water and groundwater in the form of nitrates and is then carried back into the ocean through river runoffs (Kolbe et al., 2016). In comparison, the sources of anthropogenic eutrophication are wider and more rapid, mainly due to frequent human activities such as the direct discharge of untreated domestic sewage, mining of phosphorus, and chemical manufacture of mineral nitrogen, which overload nitrogen and phosphorus concentrations on land and ultimately leads to severe eutrophication of the oceans (Asmal et al., 2022; Smith and Schindler, 2009).
Coastal eutrophication has become a pressing global issue, severely damaging the health of coastal ecosystems (Liu et al., 2021). Although the natural conditions of different sea areas vary, their responses to eutrophication still follow general patterns. In the early stages of eutrophication, there is a substantial increase in algal primary productivity (Ding et al., 2023). As a result, macrobenthic amphipods, shrimp, filter-feeding bivalves, and phytophagous fishes show increased abundance, growth rate, and fecundity (Erdoğan et al., 2021; Martinetto et al., 2010). However, when nutrient inputs exceed the marine ecosystem's capacity to absorb them, increasing the abundance and biomass of phytoplankton and algae, various negative impacts will occur. Increased algae productivity may exceed the tolerance capacity of herbivores, resulting in incomplete utilization by herbivores at higher trophic levels and leading to an increase in the sedimentation of organic matter on the seabed (Rabalais et al., 2009). Decomposition of organic matter will consume a large amount of oxygen. When oxygen levels reach a critical state, mobile species escape to seek new habitats, whereas sessile species perish as oxygen is depleted (Glibert et al., 2005; Malone and Newton, 2020). This scenario can lead to severe degradation of macrobenthic communities. Furthermore, turbid water reduces light penetration, preventing submerged plants from performing normal photosynthesis, which ultimately results in their death, thereby decreasing species diversity (Paerl, 2018; Savchuk, 2018).
Using the classic organic enrichment hypothesis (Pearson and Rosenberg, 1978) and the diversity–disturbance hypothesis (Huston, 1979), the impacts of eutrophication on the species composition and community structure of macrobenthos can be thoroughly understood. Eutrophication is a process where the input rate of organic matter increases: on one hand, anthropogenic discharges of wastewater carry significant amounts of organic substances; on the other hand, continuous nitrogen and phosphorus discharges promote algal proliferation. Upon algal death, a substantial release of organic matter further increases the organic load of water bodies (Nixon, 1995)—for example, influenced by eutrophication, large accumulations of macroalgae in Laholm Bay and the Baltic Sea have reduced the water transparency and oxygen levels, leading to significant fish and bivalve mortality (Rosenberg, 1985; Rosenberg et al., 1990). In the North Adriatic Sea, abnormal deaths of macrobenthos are attributed to excessive phosphorus inputs triggering algal blooms, followed by extensive algal decay causing bottom-layer hypoxia (Chiaudani et al., 1980). Similarly, in the United States' Chesapeake bay, eutrophication has led to increased phytoplankton, decreased water transparency, and deep-water hypoxia, ultimately resulting in reduced populations of macrobenthos (Kemp et al., 2005). China is also affected, with the East China Sea experiencing frequent hypoxia and harmful algal blooms due to excessive nutrient inputs from the Yangtze and Qiantang rivers, which have harmed fish populations (Tang et al., 2006; Zhou et al., 2022).
However, there is a lack of research on how the biological traits of macrobenthos respond to eutrophication disturbances. Biological traits offer insights into species distribution and the underlying mechanisms. Biological traits, characteristics of a species' morphology, and life history represent the connections between life history and habitat (Beauchard et al., 2017). Biological trait analysis (BTA) is a straightforward and widely used method that reflects the environmental impact on species and illustrates how species regulate and maintain ecosystems—for instance, body size is a crucial trait for adapting to different sediments, while habitat preferences can influence sediment porosity and oxygen levels (Bremner et al., 2006; Soetaert et al., 2002). When employing biological trait analysis, RLQ and fourth-corner analysis methods are necessary to determine whether a specific trait is significantly correlated with environmental gradients. Although these methods differ, their combined use is the most effective way to assess the correlation between traits and the environment (Kleyer et al., 2012). RLQ primarily uses species abundance as a mediator to assess the relationship between environmental gradients and traits, representing the overall relationship between species traits and environmental variables. The fourth-corner analysis method examines the correlation between a single trait and a single environmental factor at a time, with the final results displaying only significantly correlated traits and environmental variables (Dray et al., 2014).
This study employed BTA, RLQ analysis, and fourth-corner analysis methods to examine the response of biological traits of benthic macrofauna in Hangzhou Bay and adjacent waters to varying levels of eutrophication. The study aims to investigate how the species abundance and biological traits of macrobenthic fauna respond to the eutrophication gradient and to assess their correlations with eutrophication-related factors. This integrated approach seeks to deepen our understanding of ecological responses to environmental changes and their implications for ecosystem health.
2 Materials and methods
2.1 Study area and sampling design
The East China Sea is one of largest marginal seas in the Pacific Ocean, featuring an approximately 600-km continental shelf (Qian et al., 2017). The research area spans the provinces of Zhejiang and Shanghai and is situated in the coastal region of the northern East China Sea, the Hangzhou Bay, and adjacent waters. It is a trumpet-shaped estuary that faces east and west. Its length is 90 km, its width at the bay mouth is 100 km, and it covers an area of approximately 5,000 km². The typical water depth is 8–10 m, and the mudflat area is approximately 550 km2. With a coastline of 258.49 km and an estuary shoreline of 22.08 km, Hangzhou Bay is primarily a flat, silty coast. It mainly receives freshwater and sediment from rivers such as the Qiantang, Cao'e, and Yong River (Yang et al., 2012). Among these rivers, the Qiantang River, which has a water inflow of 373 × 108 m3 and a sand inflow of 658.7 × 10⁴ t, is a well-known surge location that runs through Zhejiang Province with high runoff (Zhang et al., 2016). The Yongjiang and Cao'e Rivers empty straight into Hangzhou Bay, bringing in 823.3 × 10⁴ t of sand annually along with an annual inflow of 444.4 × 10⁸ m3 of water. The salinity of the seawater at the study area is relatively low (Matsuzaki et al., 2016), and the average water temperature is high (Choi et al., 2021), influenced by the Yangtze River diluting water and Kuroshio warm saline water. The study area is located in Hangzhou Bay, where the long-term input of nutrients and suspended organic matter from the Yangtze River have caused eutrophication (Chen et al., 2020). Accordingly, the study conducted sampling at 17 stations in Hangzhou Bay during the summer of 2019 (July–August) (Figure 1). The primary cause of eutrophication is the imbalance between the input and output of nitrogen and phosphorus nutrients and phosphorus nutrients in the water. Therefore, the degree of eutrophication in this region was represented by calculating the eutrophication index (EI). Eutrophication levels were calculated using the eutrophication index method (Yao and Shen, 2005):
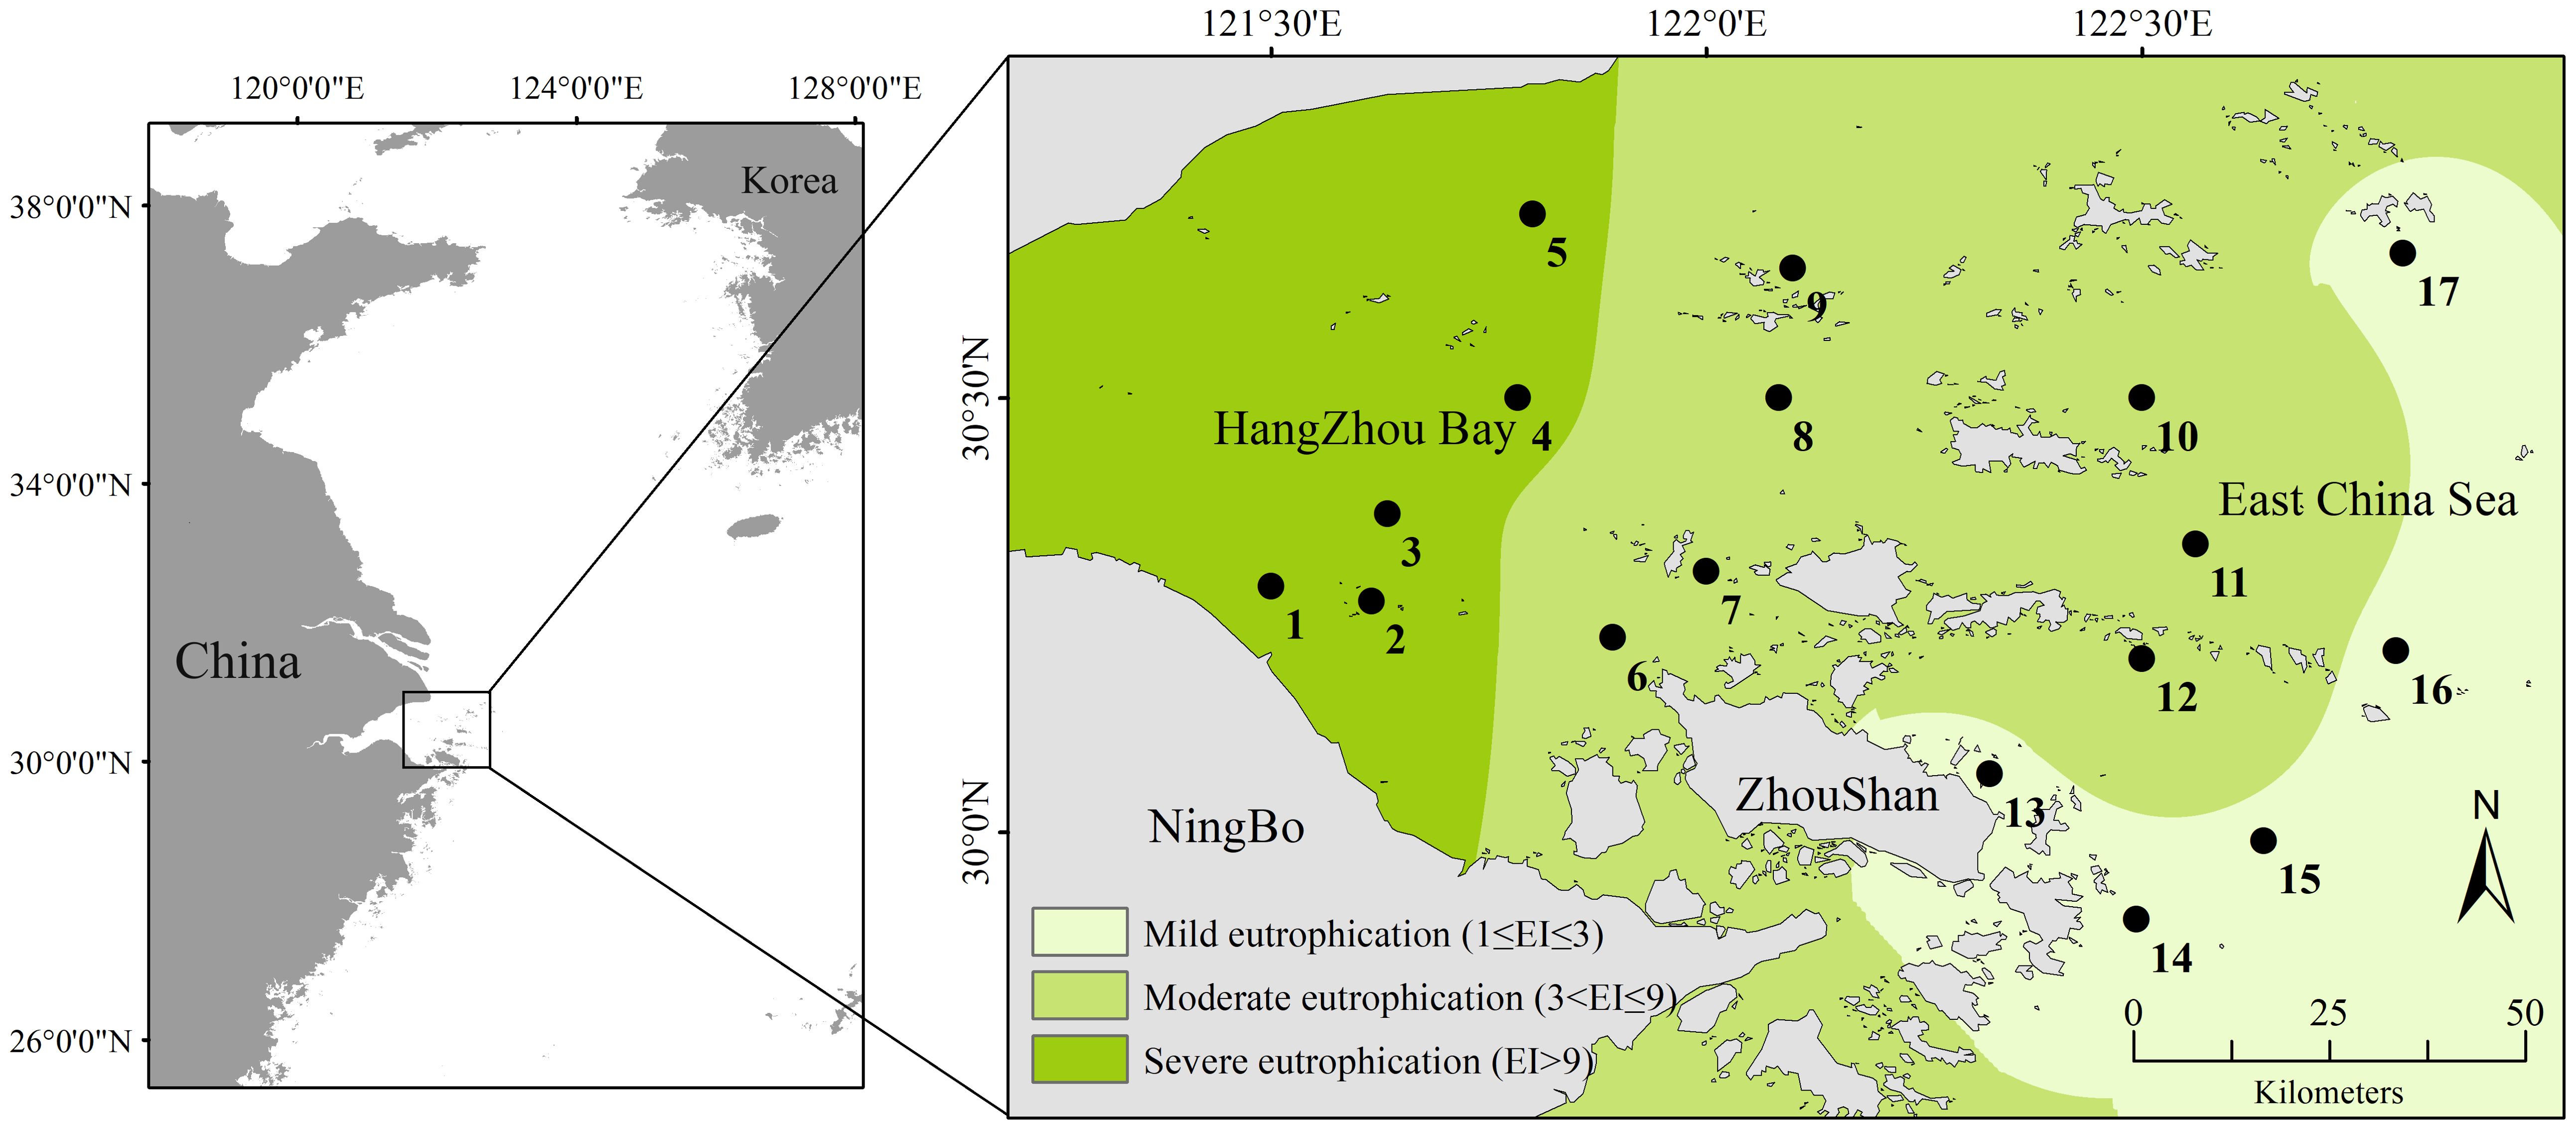
Figure 1. Sampling sites in the coastal area of Hangzhou Bay in 2019. The degree of eutrophication in three regions is calculated based on the eutrophication index and classified according to corresponding standards with the data collected in this study.
In the formula, COD (mg/L) represents chemical oxygen demand; DIN (mg/L) denotes the mass concentration of inorganic nitrogen, including nitrite nitrogen, nitrate nitrogen, and ammonium nitrogen; and DIP (mg/L) indicates the mass concentration of dissolved inorganic phosphorus. The product of the individual eutrophication thresholds for COD, DIN, and DIP in this marine area is 4,500, in which 1 ≤ EI ≤ 3, 3< EI ≤ 9, and EI > 9 representing mild eutrophication, moderate eutrophication, and severe eutrophication, respectively.
2.2 Environmental variables
Samples were collected using a 0.1-m2 box corer, with four replicates. Two replicate samples were rinsed with seawater and sieved through 0.5-mm mesh sieves to collect macrobenthos, while the third and fourth replicate samples were used for sediment factor analysis. In the laboratory, the remaining sediment samples were poured into porcelain dishes and meticulously inspected until no macrobenthic organisms remained. The identified macrobenthos were taxonomically classified to the lowest possible level using a stereoscopic dissecting microscope (Olympus SZX16) with reference to professional books and atlases (e.g., Editorial committee of Fauna of Zhejiang, 1991; Sun and Yang, 1988). Individual species were then counted and weighed using an electronic balance to determine their abundance.
During field sampling, water depth, bottom water temperature, salinity, and dissolved oxygen (DO) were measured at each station using a Yellow Springs Instruments water quality meter (YSI, OH, USA). Additionally, at each station, four replicate samples of bottom water were collected, with each sample consisting of 500 mL of water stored in plastic containers. These samples were then brought back to the laboratory for the measurement of chlorophyll a, dissolved silicate, chemical oxygen demand, suspended solids, dissolved inorganic phosphorus, nitrite nitrogen, nitrate nitrogen, and ammonia nitrogen. The third and fourth sediment samples were frozen for subsequent analyses of total organic carbon, sulfide, and water content. The measuring methods corresponding to each environmental factor include chlorophyll a (Chla) measured using fluorescence spectrophotometry, dissolved silicate (DSi) determined using silicon molybdenum yellow spectrophotometry, chemical oxygen demand (COD) measured using titration via the acid potassium permanganate method, suspended solids (SS) determined using the gravimetric method, dissolved inorganic phosphorus (DIP) determined using the molybdate blue spectrophotometric method, nitrite nitrogen (NO₂) determined using the diazotization method, nitrate nitrogen (NO₃) determined using the zinc–cadmium reduction method, ammonia nitrogen (NH₄) determined using the hypobromite oxidation method, total organic carbon (TOC) determined using a Vario MICRO cube analyzer (Elementar, Germany), sulfide determined using the methylene blue spectrophotometric method, and water content (WC) determined using the drying method (State Bureau of Quality and Technical Supervision of China, 2007a, 2007b).
2.3 Biological trait analysis
Macrobenthic biological traits were selected for this research based on species' morphology, life history, mobility, and ecology, which have been demonstrated as reliable by the majority of studies (Calapez et al., 2018). The 26 trait modalities of six biological traits (adult body length, food source, dwelling habit, feeding mode, substratum preference, and AMBI ecological group) were selected for macrobenthos in Hangzhou Bay and adjacent waters. The AMBI ecological group of the species was determined using the software available on the AZTI website (http://ambi.azti.es). Information on the biological traits of each species was gathered from the literature (Macdonald et al., 2010) and the online databases BIOTIC (http://www.marlin.ac.uk/biotic/), Marine Species Traits (http://www.marinespecies.org/traits/index.php), the Arctic Traits Database (https://www.univie.ac.at/arctictraits/), and Polytraits (http://polytraits.lifewatchgreece.eu/polytraits). If information on the biological traits of certain species could not be obtained via these routes, the most taxonomically similar biological traits were chosen instead. Fuzzy codes were used to assign values to the biological trait patterns of species, as trait modalities were not absolute (Chevene et al., 1994). The association between a species and a trait modality was measured on a scale of 0 to 3, where “0” denoted no association, “1” low association, “2” moderate association, and “3” high association—for example, the adult body length of Loimia medusa generally varies from 3 to 10 cm, although a few can reach lengths of 10 cm or more; hence, “medium” body lengths are assigned a value of 3, “large” body lengths are assigned a value of 1, and others receive a value of 0. As an absolute omnivore, Sternaspis chinensis received a value of 3 for feeding mode, whereas other modalities of feeding mode trait were given a value of 0. The fuzzy code values for biological traits of the macrobenthos are shown in Appendix 2.
2.4 Data analysis
The correlation between eutrophication index and macrobenthic abundance was assessed using the “vegan” package with the Mantel test and Spearman correlation analysis (9,999 permutations) because the data on abundance and eutrophication index were non-normally distributed and monotonically related. Finally, correlation scatterplots were generated using the “ggplot2” package. The r-values range between -1 and 1, with an r of 1 representing a perfect positive correlation between two variables and a value of -1 indicating a perfect negative correlation. All the above-mentioned analyses were performed in R4.4.2 software.
In SPSS 26.0 software, the Kolmogorov–Smirnov test was used to assess the normality of environmental data. The data on species abundance were examined using nonmetric multidimensional scaling ordination (nMDS) and cluster analysis (CLUSTER) in PRIMER 6.0 software. The Bray−Curtis similarity matrix was computed after the species abundance data were square-root transformed. CLUSTER was performed with the average linkage method. The results of nMDS are reliable when the stress coefficient is less than 0.01. Using the package “ade4” in R4.4.2, data on abundance, biological traits, and environmental variables were evaluated for RLQ and fourth-corner analysis. Species abundance data were processed using correspondence analysis (CA), species biological trait data using principal component analysis (PCA), and environmental variables using Hill–Smith analysis. Additionally, the overall significance of the randomized permutations of models 2 and 4 was tested using the Monte Carlo test. Because RLQ cannot be used to determine which environmental variables affect which biological traits significantly, it is thus combined with the complementary fourth-corner analysis to obtain the final result (Dray et al., 2014). To differentiate between the distinct impacts of eutrophication and other environmental conditions on the macrobenthic community, variance partitioning analysis (VPA) was conducted on community abundance and environmental data using the “vegan” package in R4.4.2.
3 Results
3.1 Environmental variables
The Kolmogorov–Smirnov test was performed for all environmental variables, and the results showed that none of the data conformed to a normal distribution, so the median (first quartile–third quartile) was used for statistical description, as shown in Table 1. In terms of environmental variables related to the eutrophication index, the concentration of NO2 was the lowest, while the concentration of COD and NO3 were the highest at 1.92 and 1.43 mg/L, respectively. Meanwhile, the eutrophication index ranged from a minimum of 3.11 to a maximum of 34.81.
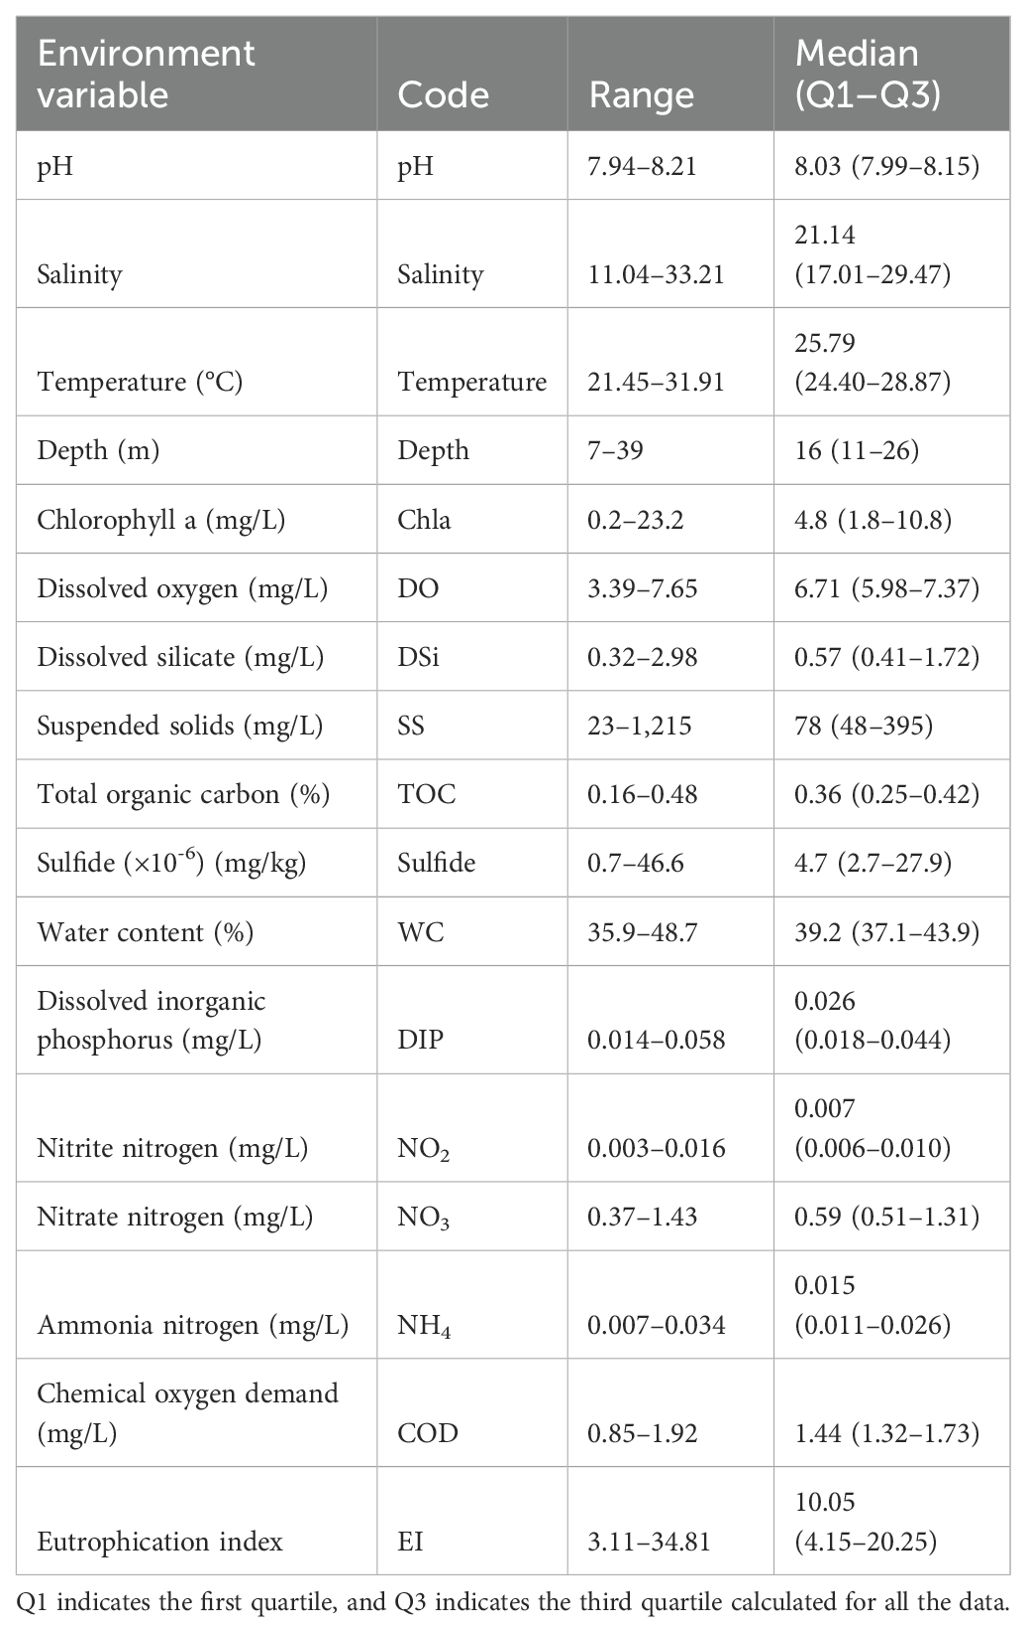
Table 1. Environmental variables in the coastal area of Hangzhou Bay and adjacent waters in 2019.
3.2 Macrobenthic community
Along the northern coast of the East China Sea, 381 individuals of macrobenthos from 21 species and five phyla were collected. The community composition of macrobenthos was dominated by Polychaetes, with 16 species (76%), followed by Echinodermata, with two species, and Cnidaria, Mollusca, and Nemertea with one species each, as detailed in Appendix 1. The results of the correlation analysis revealed a significant negative correlation between species abundance and the eutrophication index, as shown by the scatterplot in Figure 2. Cluster analysis (Figure 3) was performed based on the abundance of each species in the macrobenthic community, and three groups were identified. Group 1 consisted of sites with an abundance of 15 or less individuals/m2 (sites 1, 2, 3, 4, 5), group 2 included sites with an abundance between 16 and 30 individuals/m2 (sites 13, 14, 15, 16, 17), and group 3 included sites with an abundance of 31 or more individuals/m2 (sites 6, 7, 8, 9, 10, 11, and 12). The results of nMDS (2D stress = 0.01) (Figure 4A) was consistent with that of the cluster analysis, and three groups were uniformly distributed along the eutrophication gradient (Figure 4B).
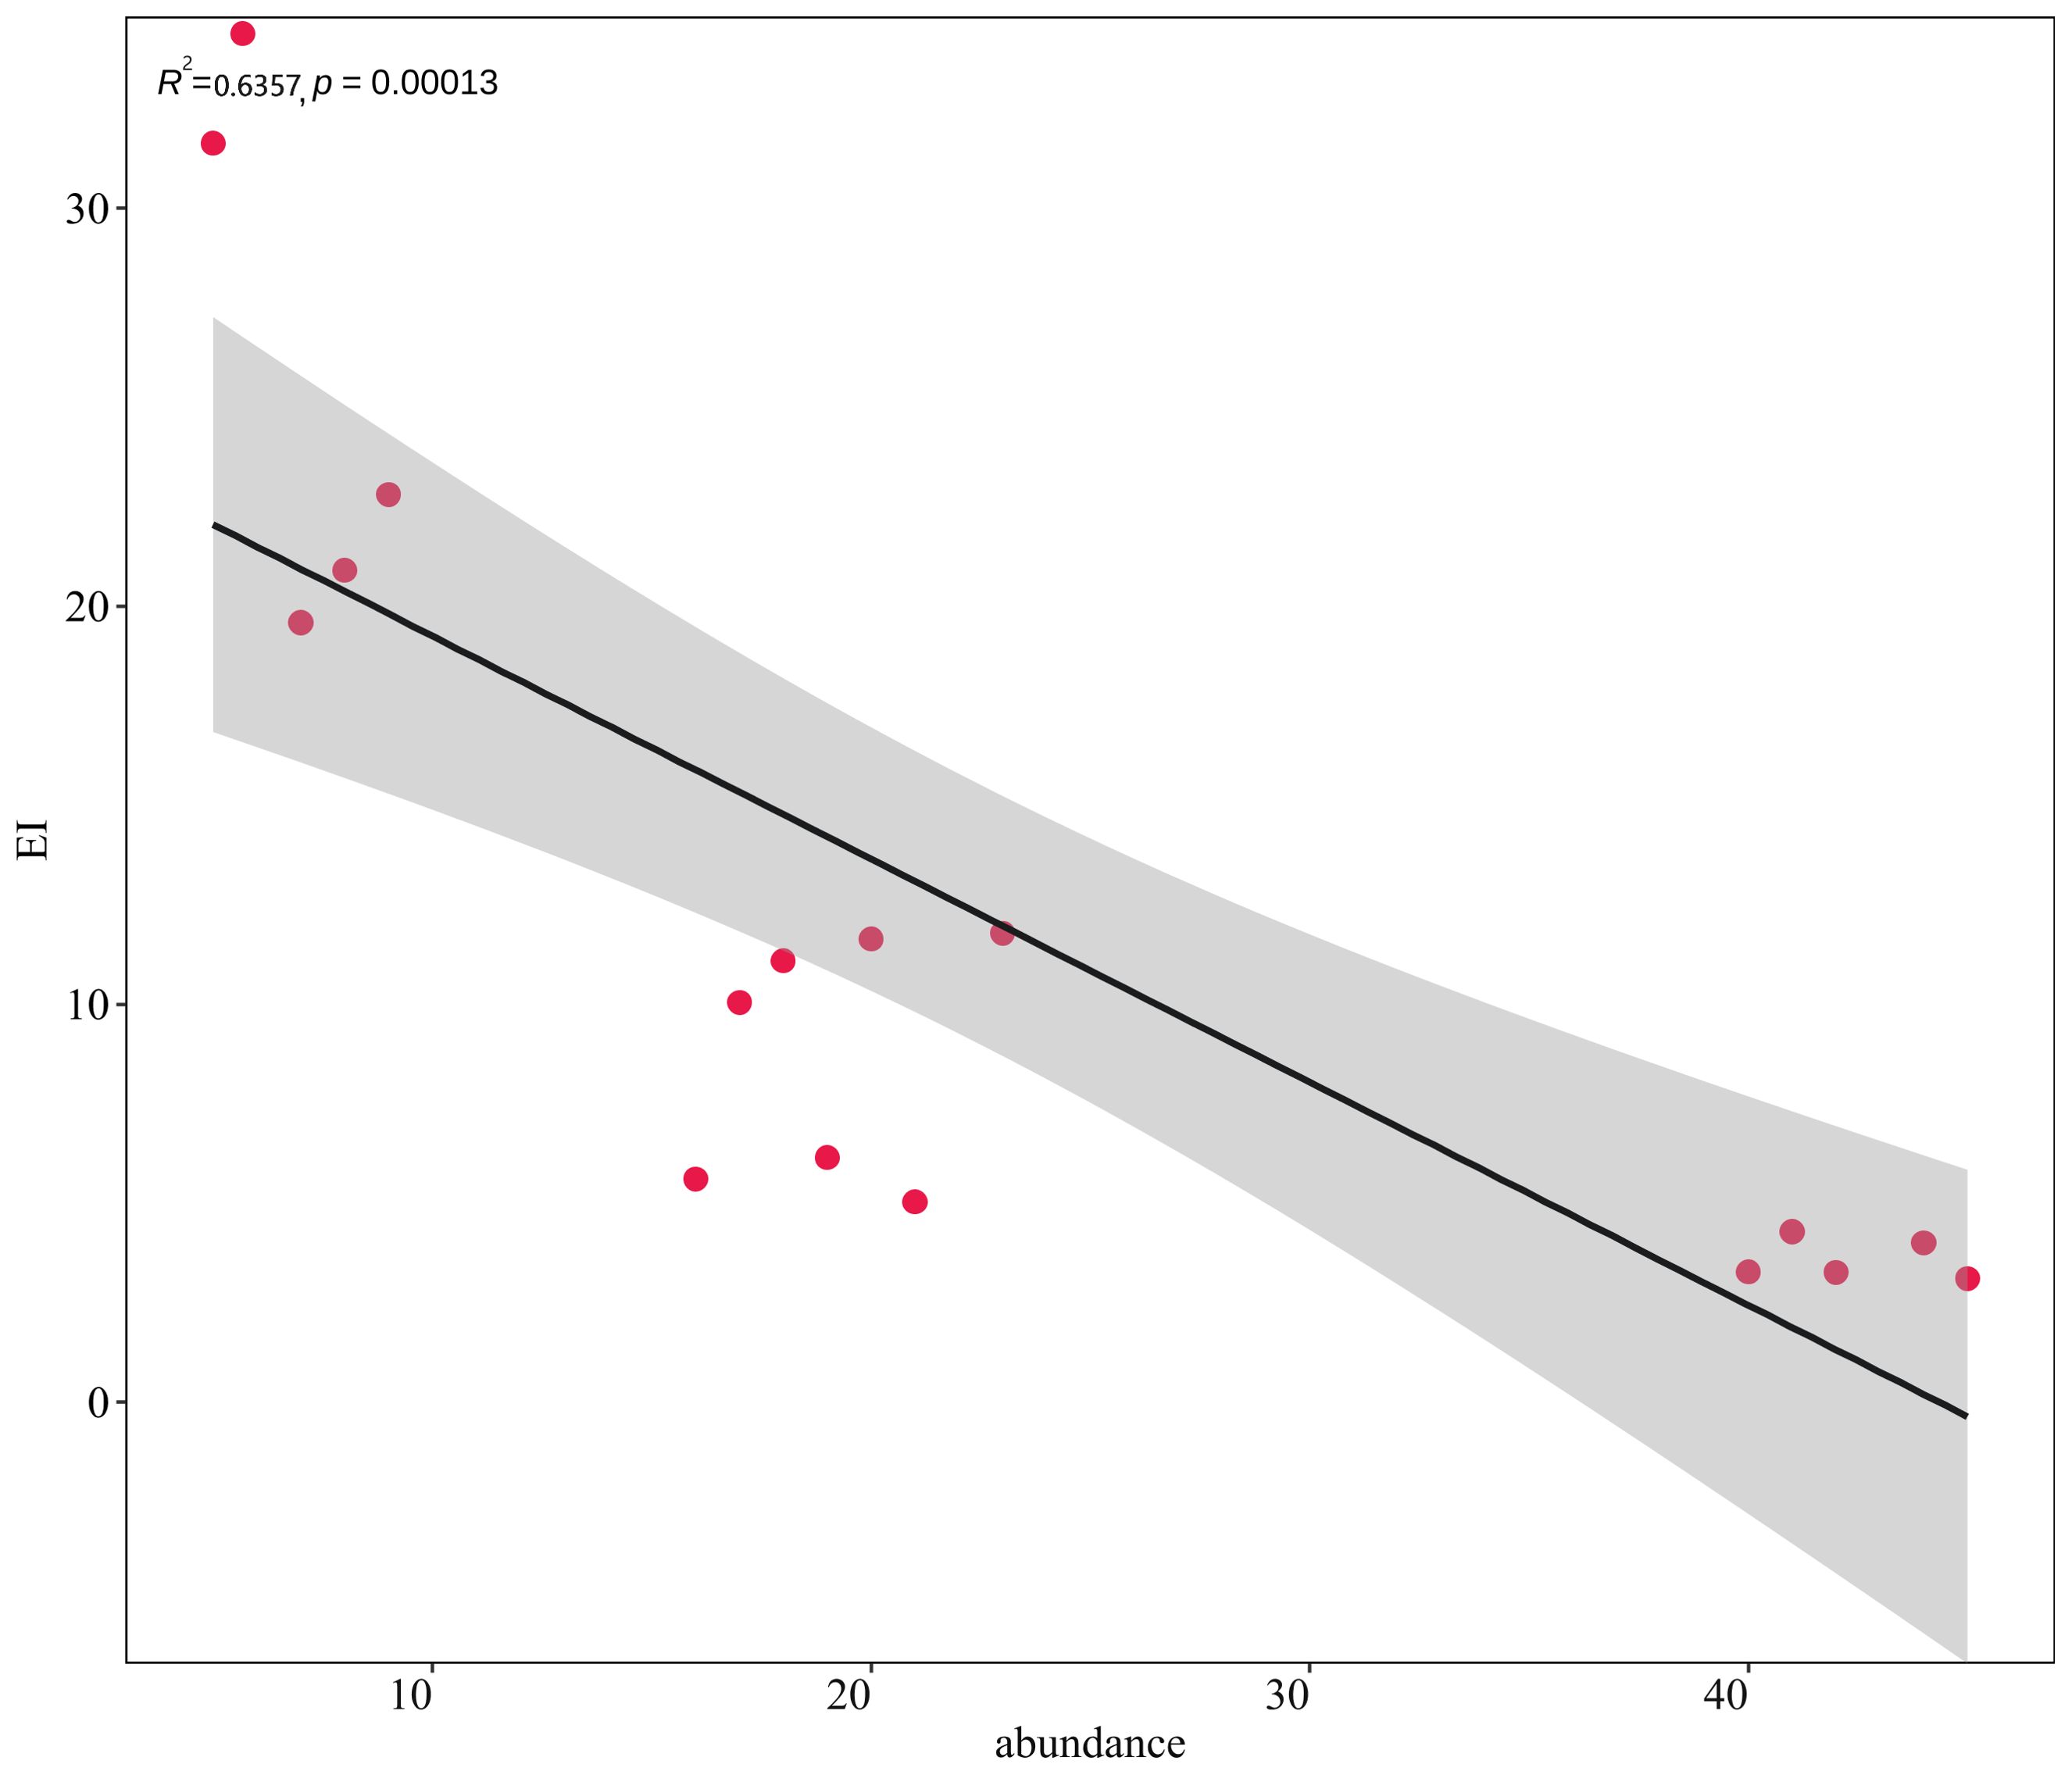
Figure 2. Scatterplot of the correlation between species abundance and the eutrophication index.

Figure 3. Cluster analysis of the abundance data.
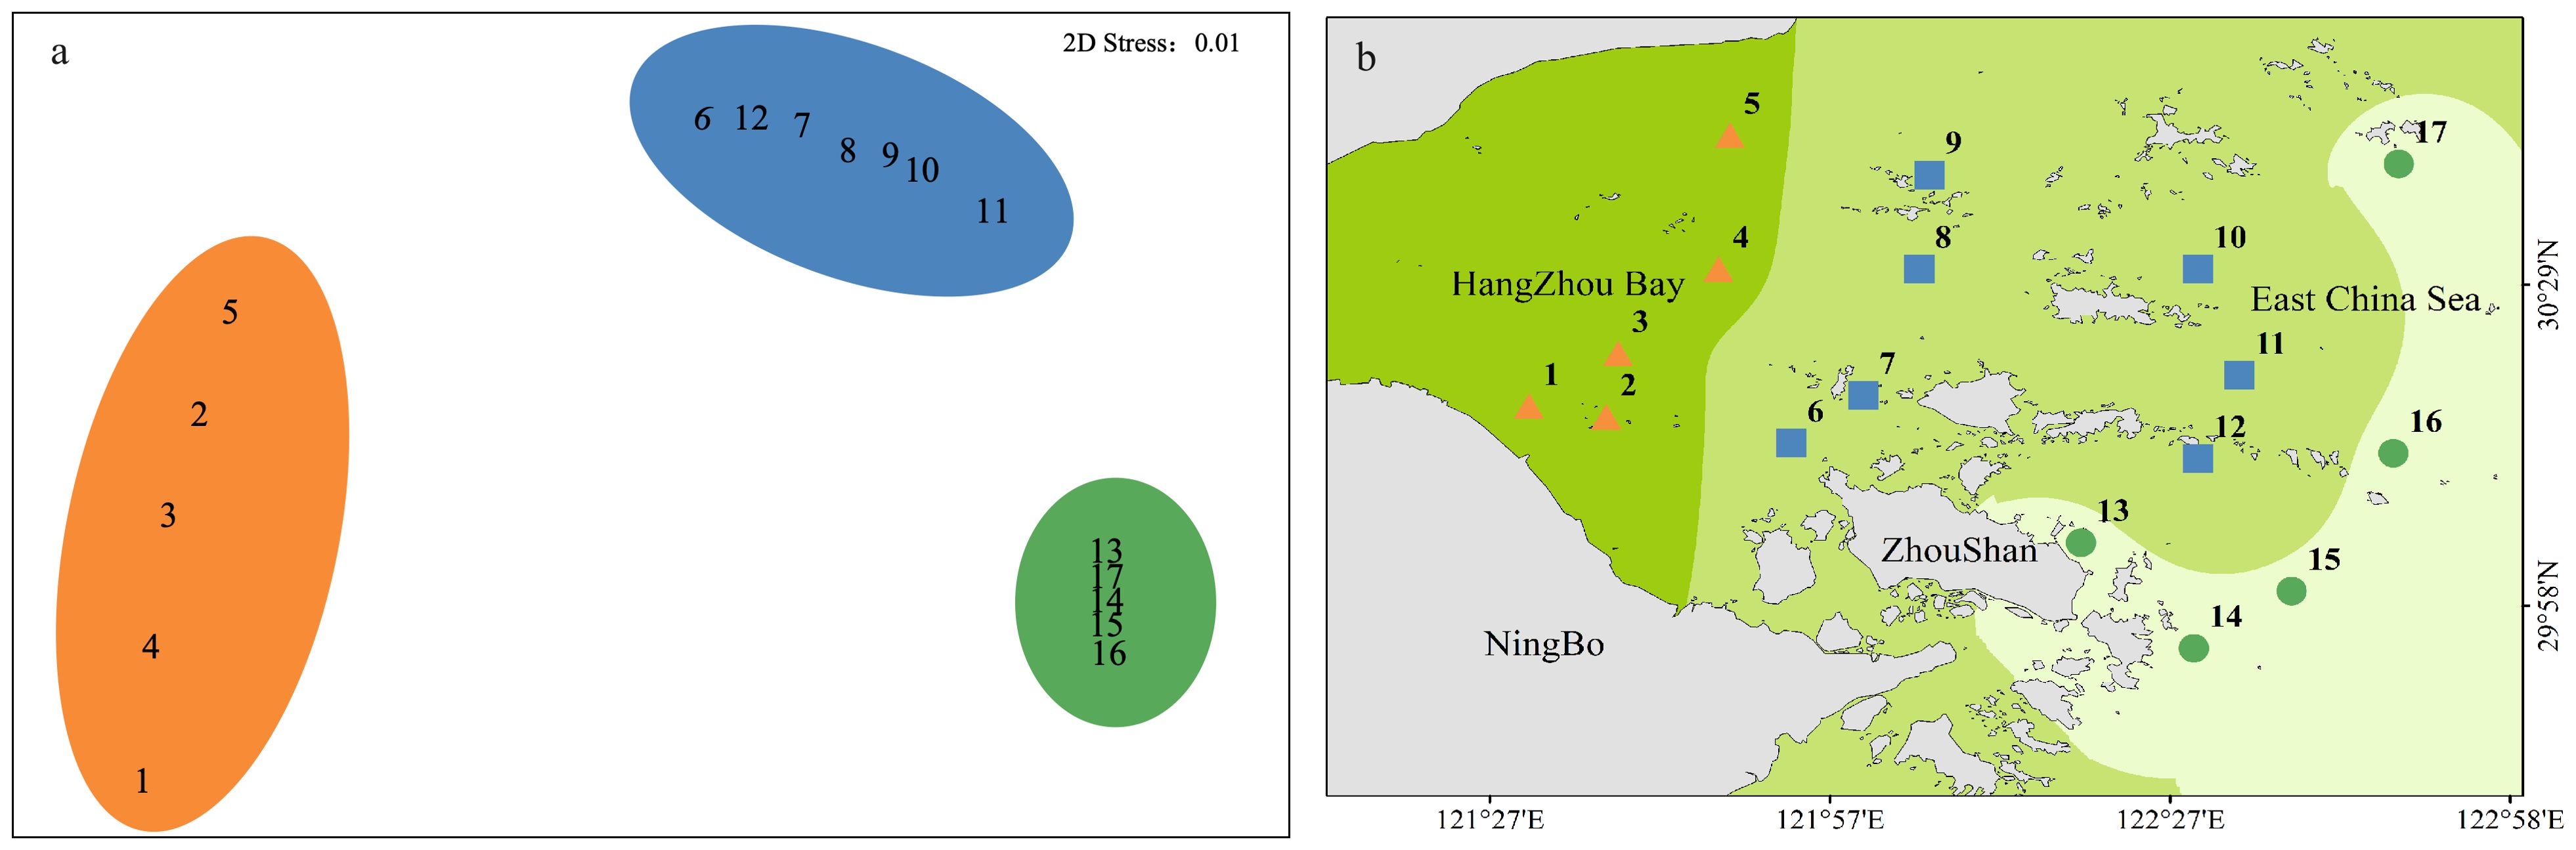
Figure 4. nMDS analysis (A) and distribution (B) of abundance data.
3.3 Biological trait analysis
A total of six biological traits and 26 trait modalities are listed in Table 2. Only the very short (<1 cm) body length, deposit-feeder, and filter-feeder modalities were not found. The proportions of macrobenthic biological traits in the three subareas with different eutrophication levels are shown in Figure 5. The majority of biological traits exhibited more uniform patterns in the severe eutrophication area than in the mild or moderate eutrophication areas—for instance, only two trait modalities of food source, P2 and P3, were detected in the severe eutrophication sites, but three trait modalities, P1, P2, and P3, were detected in the mild and moderate eutrophication sites.

Table 2. Biological traits and trait modalities of macrobenthos and corresponding abbreviations.
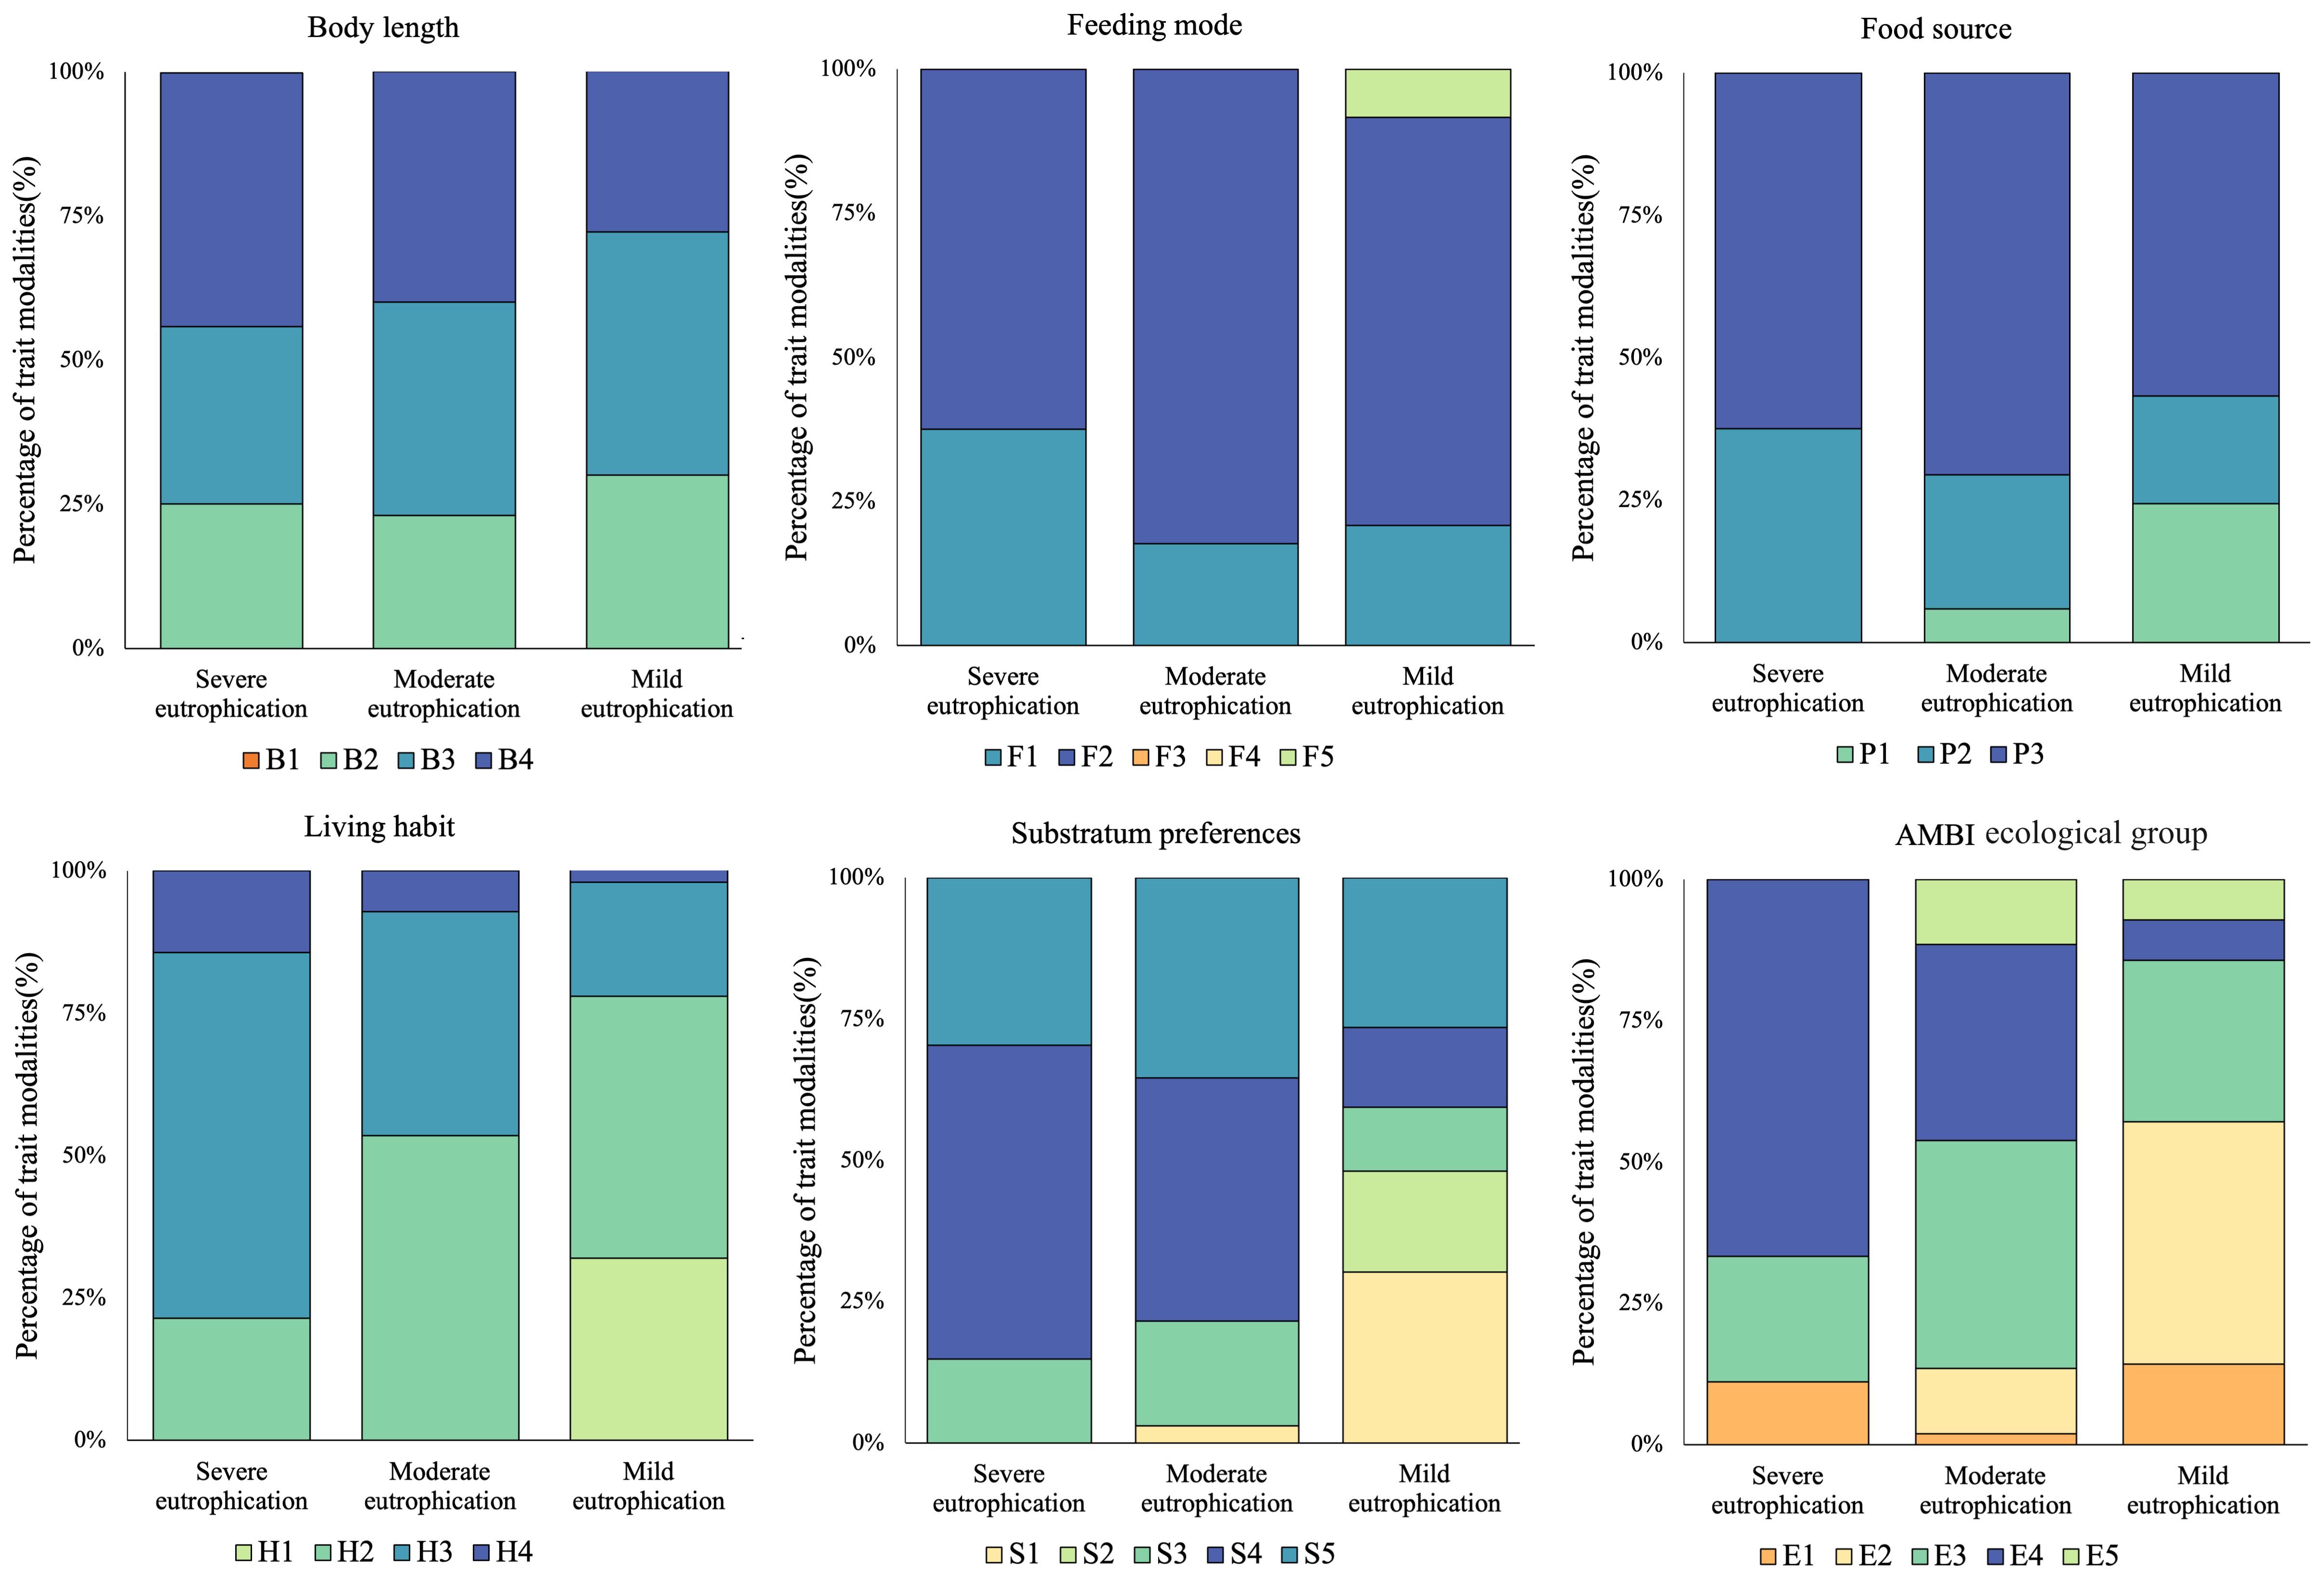
Figure 5. Composition of modalities of macrobenthic biological traits in Hangzhou Bay and adjacent waters. Trait modality codes are shown in Table 2.
At different levels of eutrophication, each biological trait exhibited different dominant biological patterns. In terms of body length, large body lengths (B4) demonstrated a growth advantage under severe eutrophication. For feeding mode, omnivores (F2) were the dominant biological pattern across three eutrophication gradients. Regarding food source, subsurface (P3) represented the dominant biological pattern across three eutrophication gradients. In terms of living habit, burrowers (H3) exhibited a growth advantage under severe eutrophication. With regards to substratum preference, muddy sand (S4) demonstrated a growth advantage under severe eutrophication. Finally, within the AMBI ecological group, second-order opportunistic species (E4) indicated a growth prevalence due to severe eutrophication.
3.4 RLQ/fourth-corner analysis
The results of the RLQ analysis are displayed in Table 3. The biological traits of macrobenthos and the environmental variables exhibited significant associations, as indicated by the test findings of Models 2 and 4 (P<0.05). Furthermore, 74.80% and 11.02% of the total variation could be explained by the first two RLQ axes, respectively. The R and Q axes were more strongly correlated with the RLQ axis, as shown in Figures 6E, F, and the first two axes carried the greatest majority of the eigenvalues. The outcomes of the RLQ analysis were consistent with those of the fourth-corner analysis (Figure 7) after correction for the p-value. The VPA results revealed that other environmental variables explained 44% of the variance, and while both variable classes attained significance, the eutrophication variables explained 73% of the variance (Figure 8).

Table 3. Summary of the RLQ analysis.
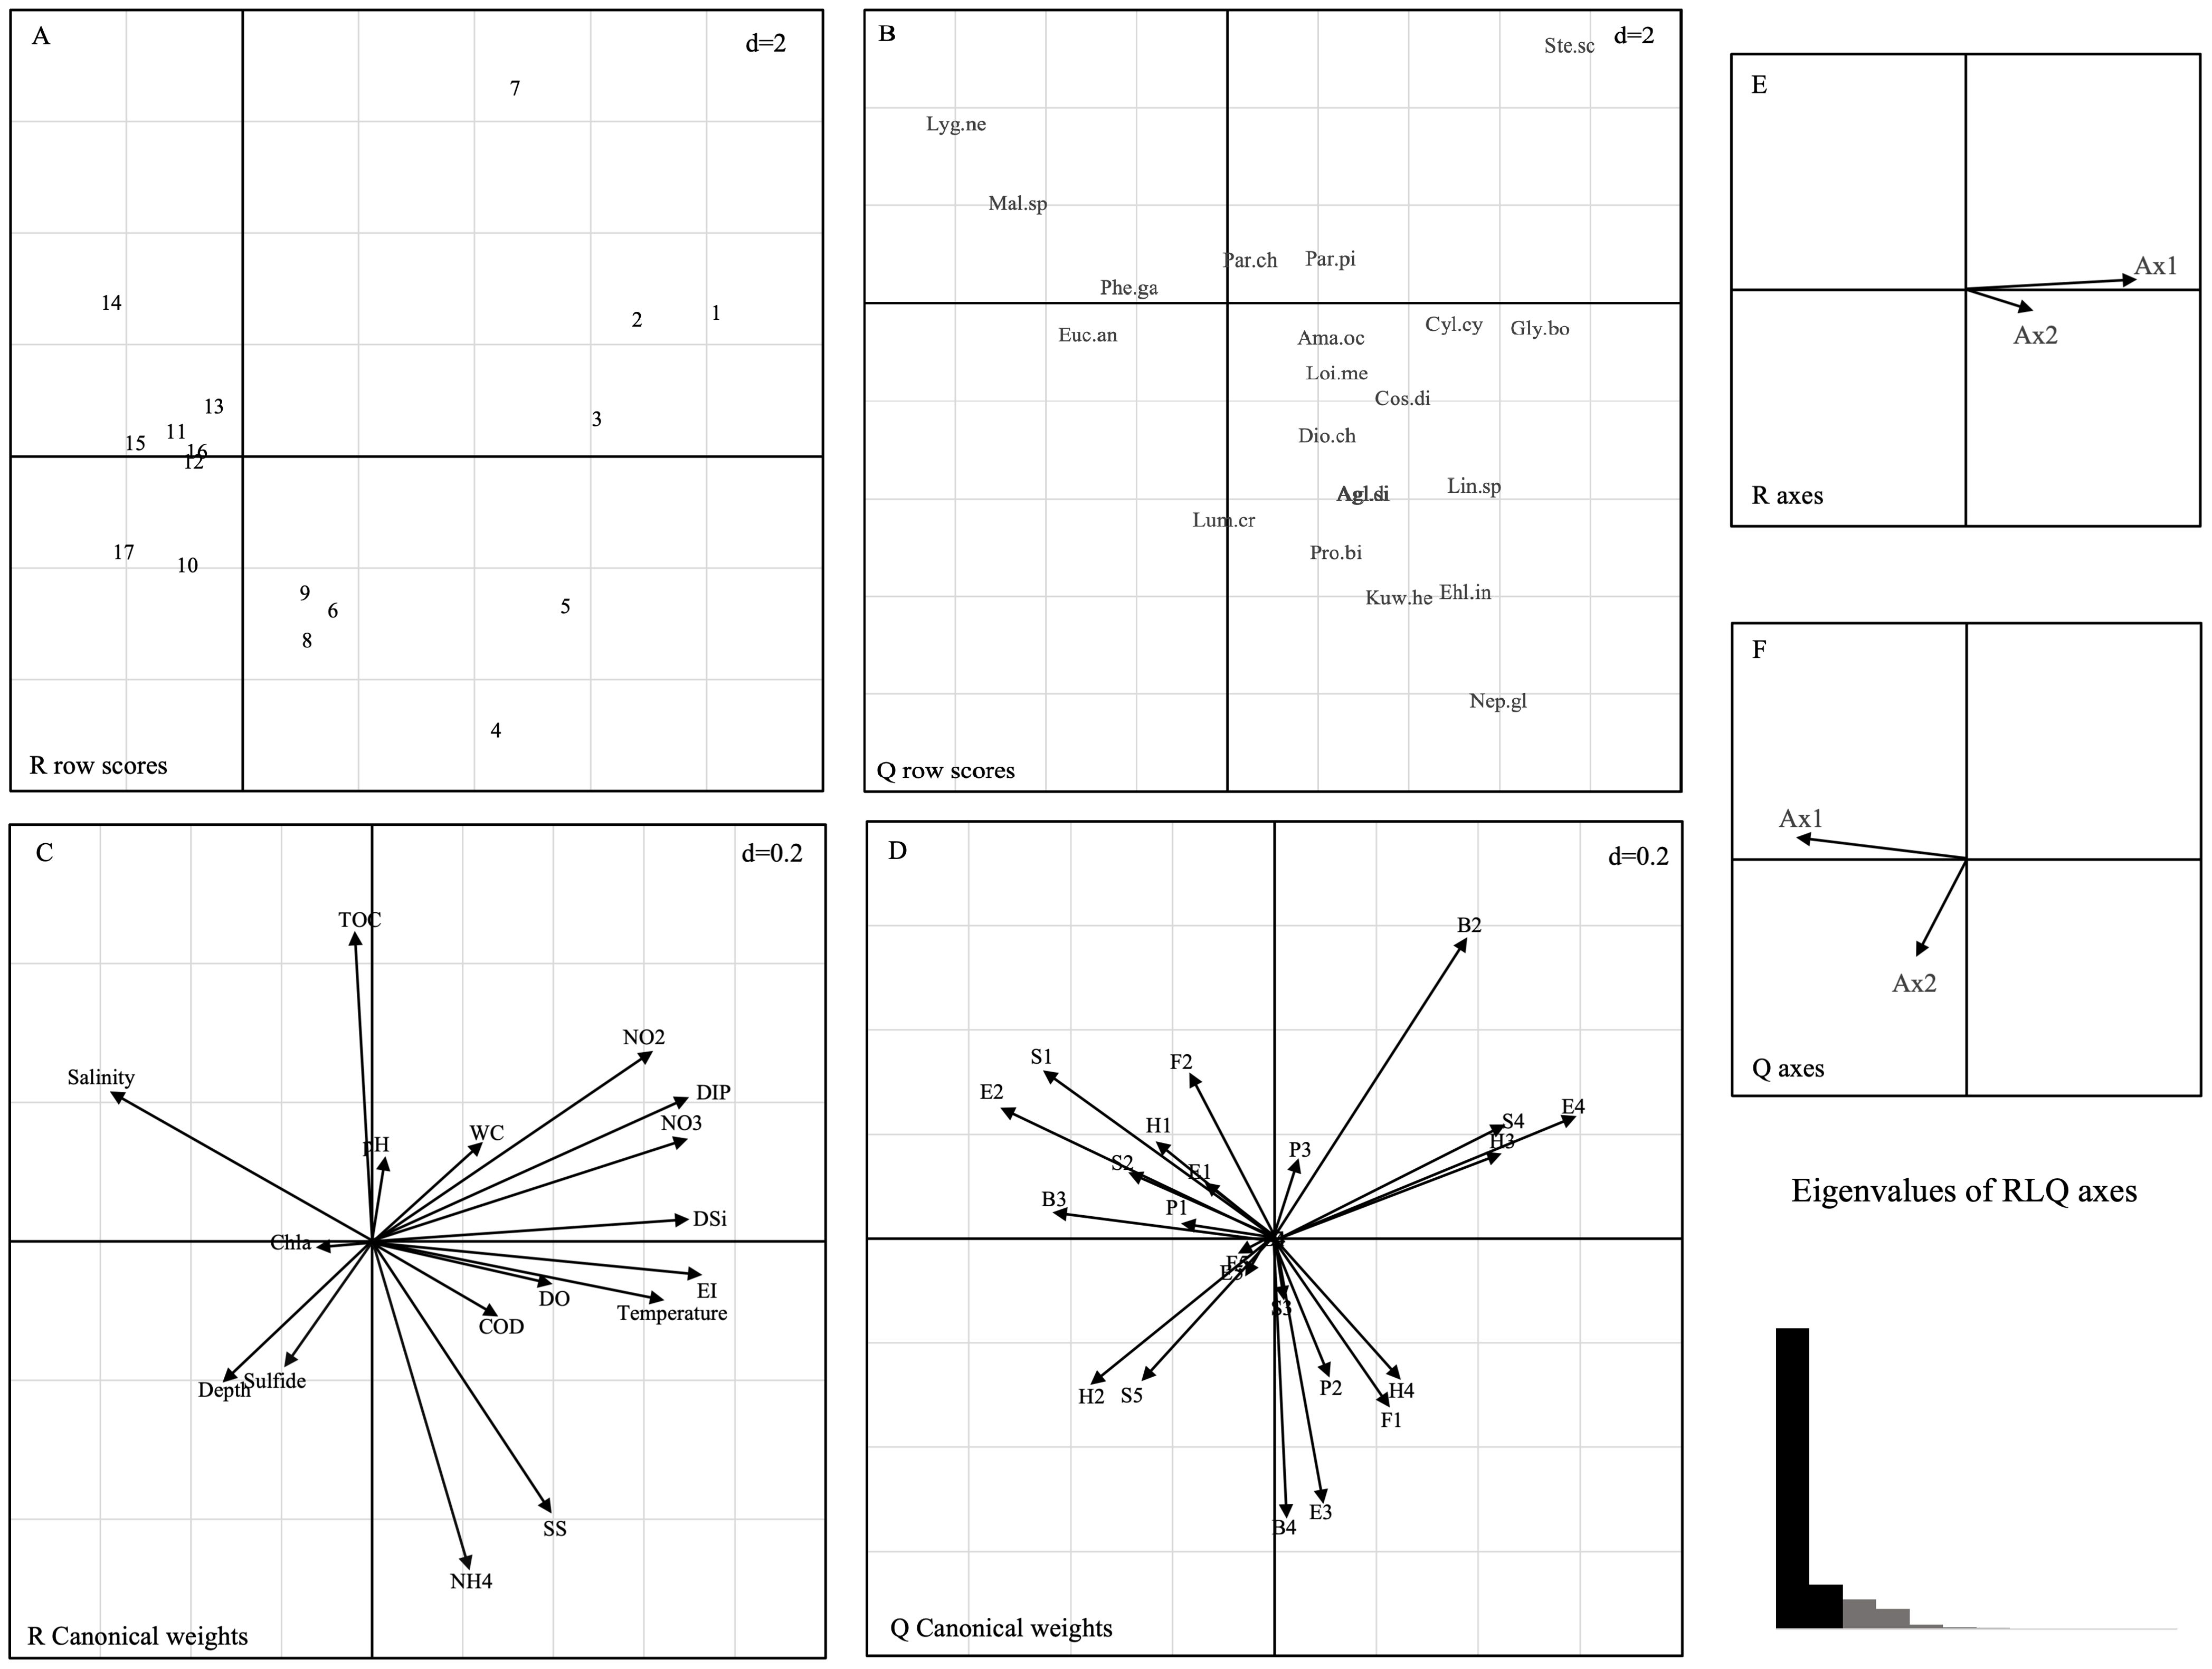
Figure 6. Results of the RLQ analysis represented by first and second axes: (A) sampling sites, (B) score of species, (C) coefficients of environmental variables, (D) score of biological traits, (E) correlations between R axes and RLQ axes, and (F) correlations between Q axes and RLQ axes and eigenvalues of RLQ axes. The d value indicates the grid size of the graph. The codes for species are shown in Appendix 1, and environmental variable abbreviations are available in Table 1. B1, very short; B2, short; B3, medium; B4, large; P1, epibenthic; P2, surface; P3, subsurface; H1, sessile; H2, tube dweller; H3, burrower; H4, surface crawler; F1, carnivore; F2, omnivore; F3, deposit-feeder; F4, filter-feeder; F5, herbivore; S1, coarse sand; S2, fine sand; S3, mud; S4, muddy sand; S5, sandy mud; E1, sensitive species; E2, indifferent species; E3, tolerant species; E4, second-order opportunistic species; E5, first-order opportunistic species.
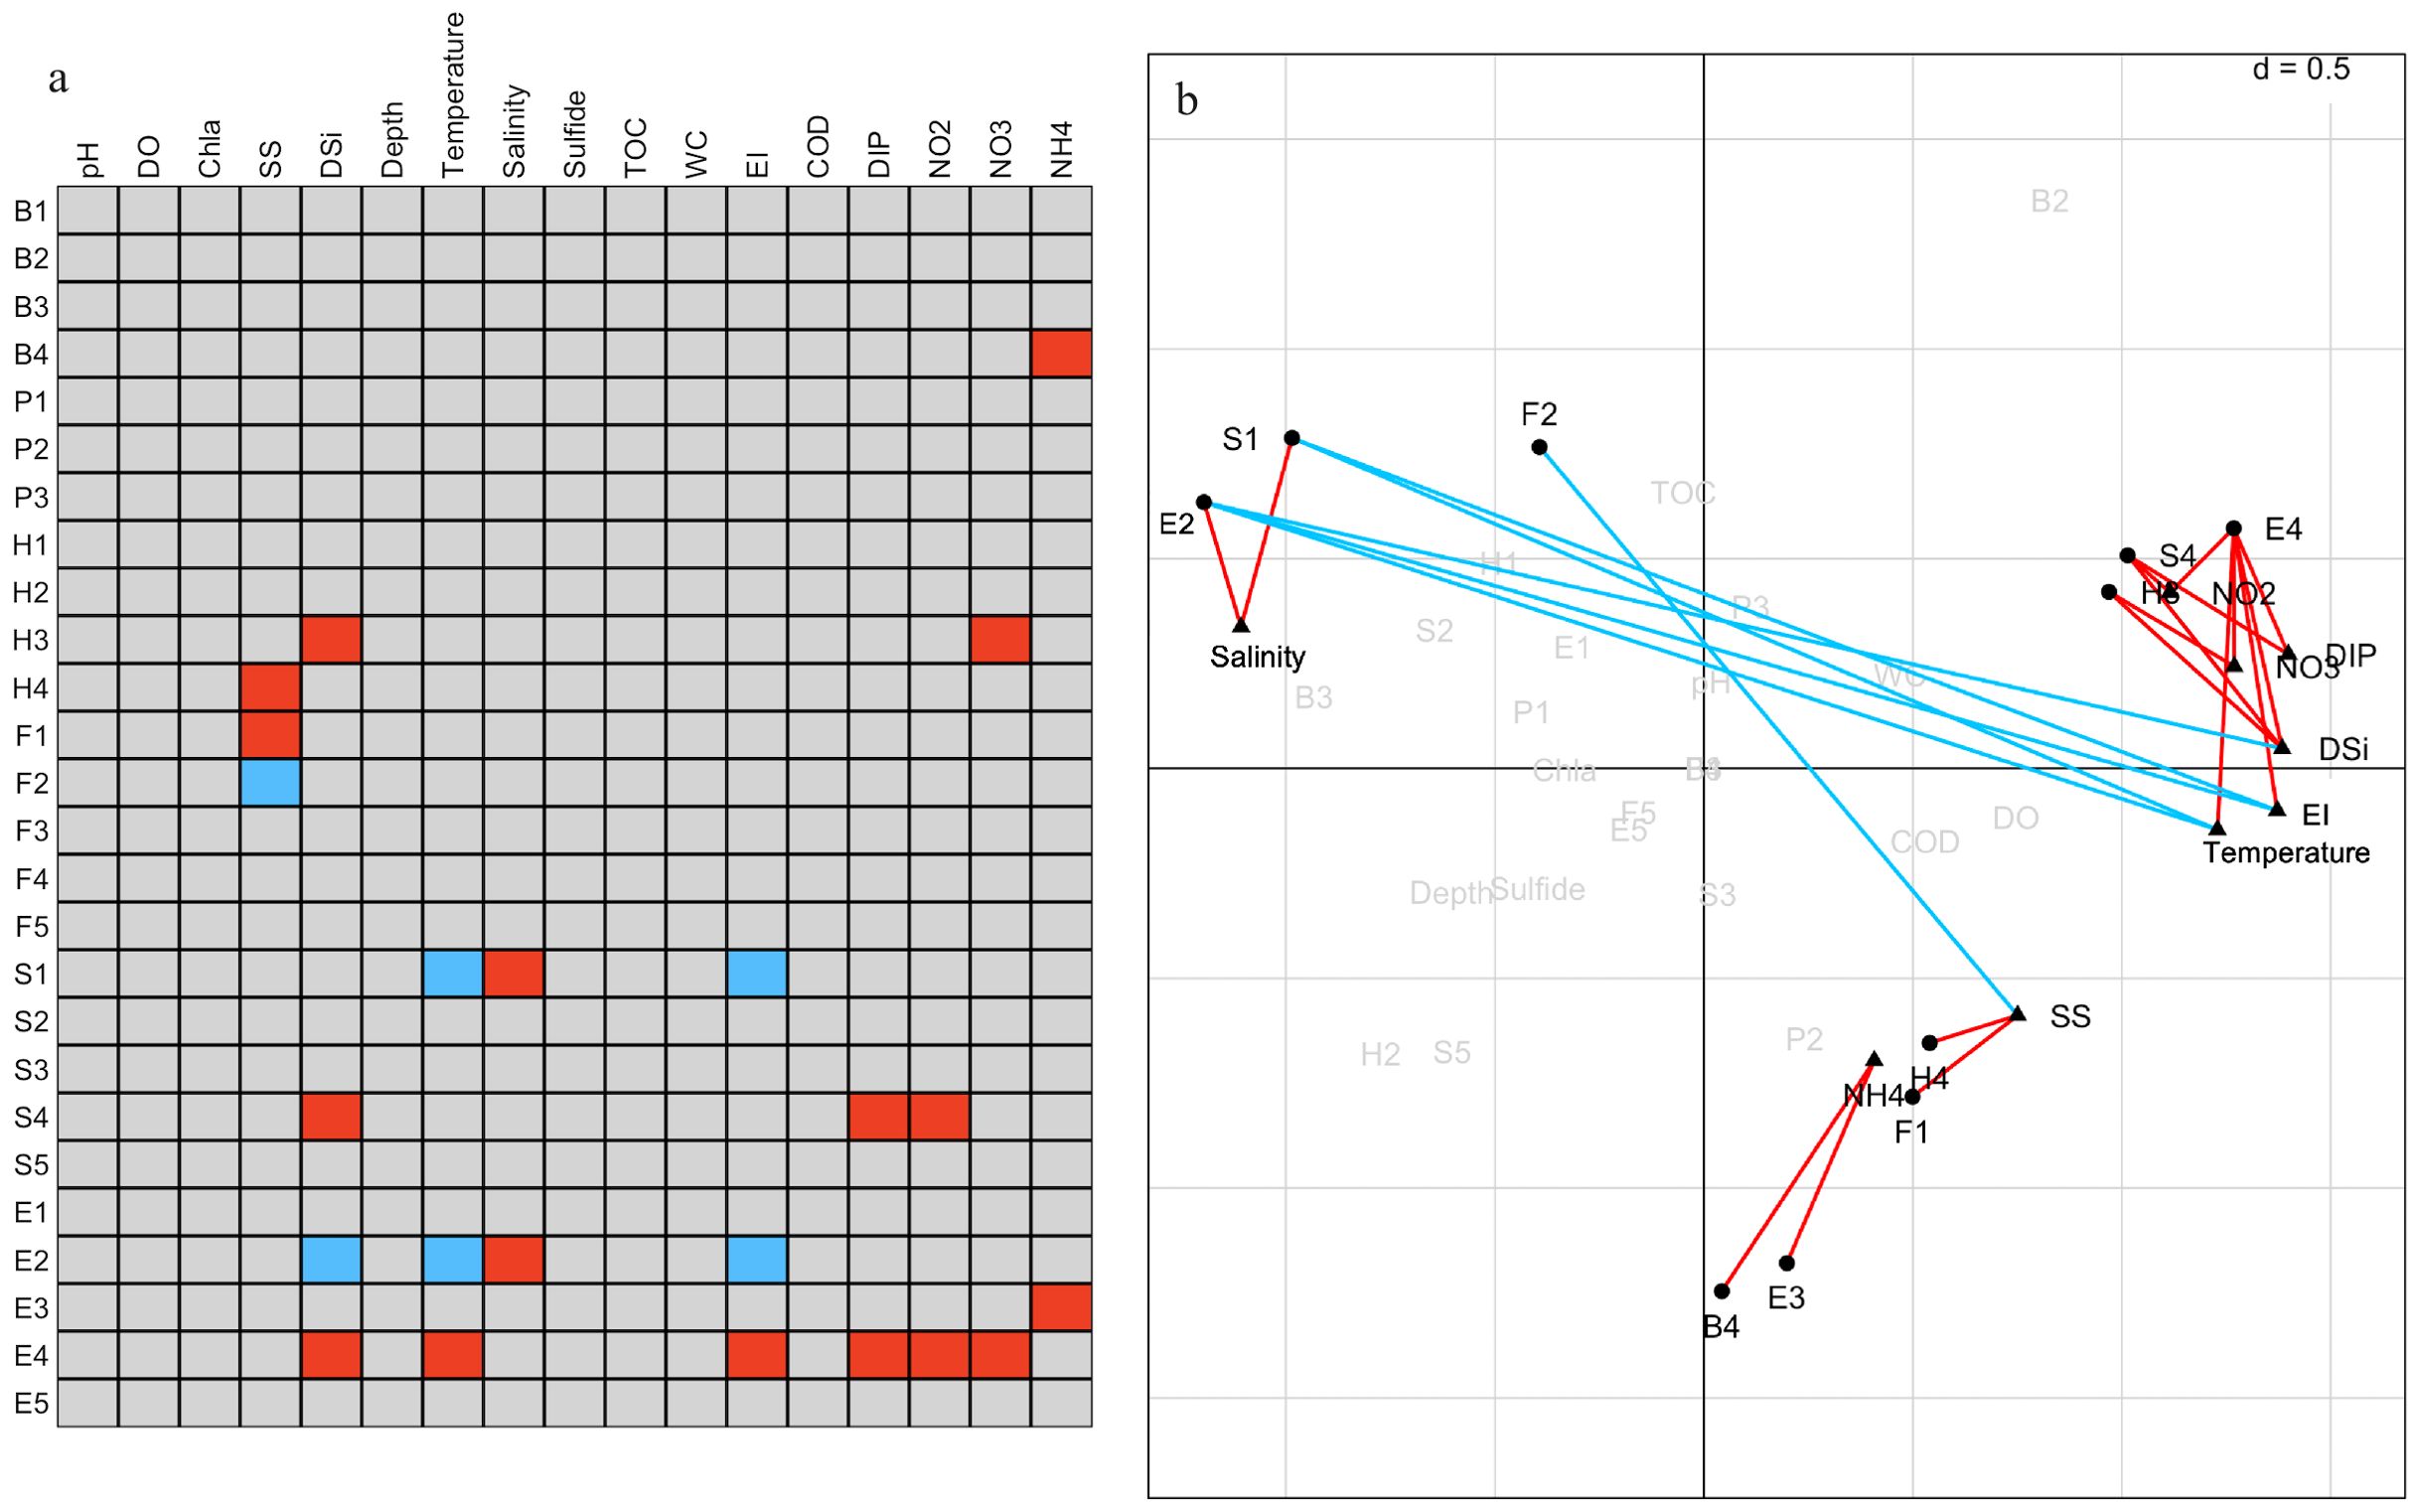
Figure 7. Combined results of fourth-corner analysis and RLQ analysis. (A) Results of fourth-corner tests for multiple validation of p-values using the false discovery rate (FDR). (B) Plots of biological traits and environmental variables obtained from RLQ analysis. Significant (P < 0.05) positive correlations are indicated by red, and significant negative correlations are indicated by blue. Biological traits codes are shown in Table 2, and environmental variable abbreviations are shown in Table 1.
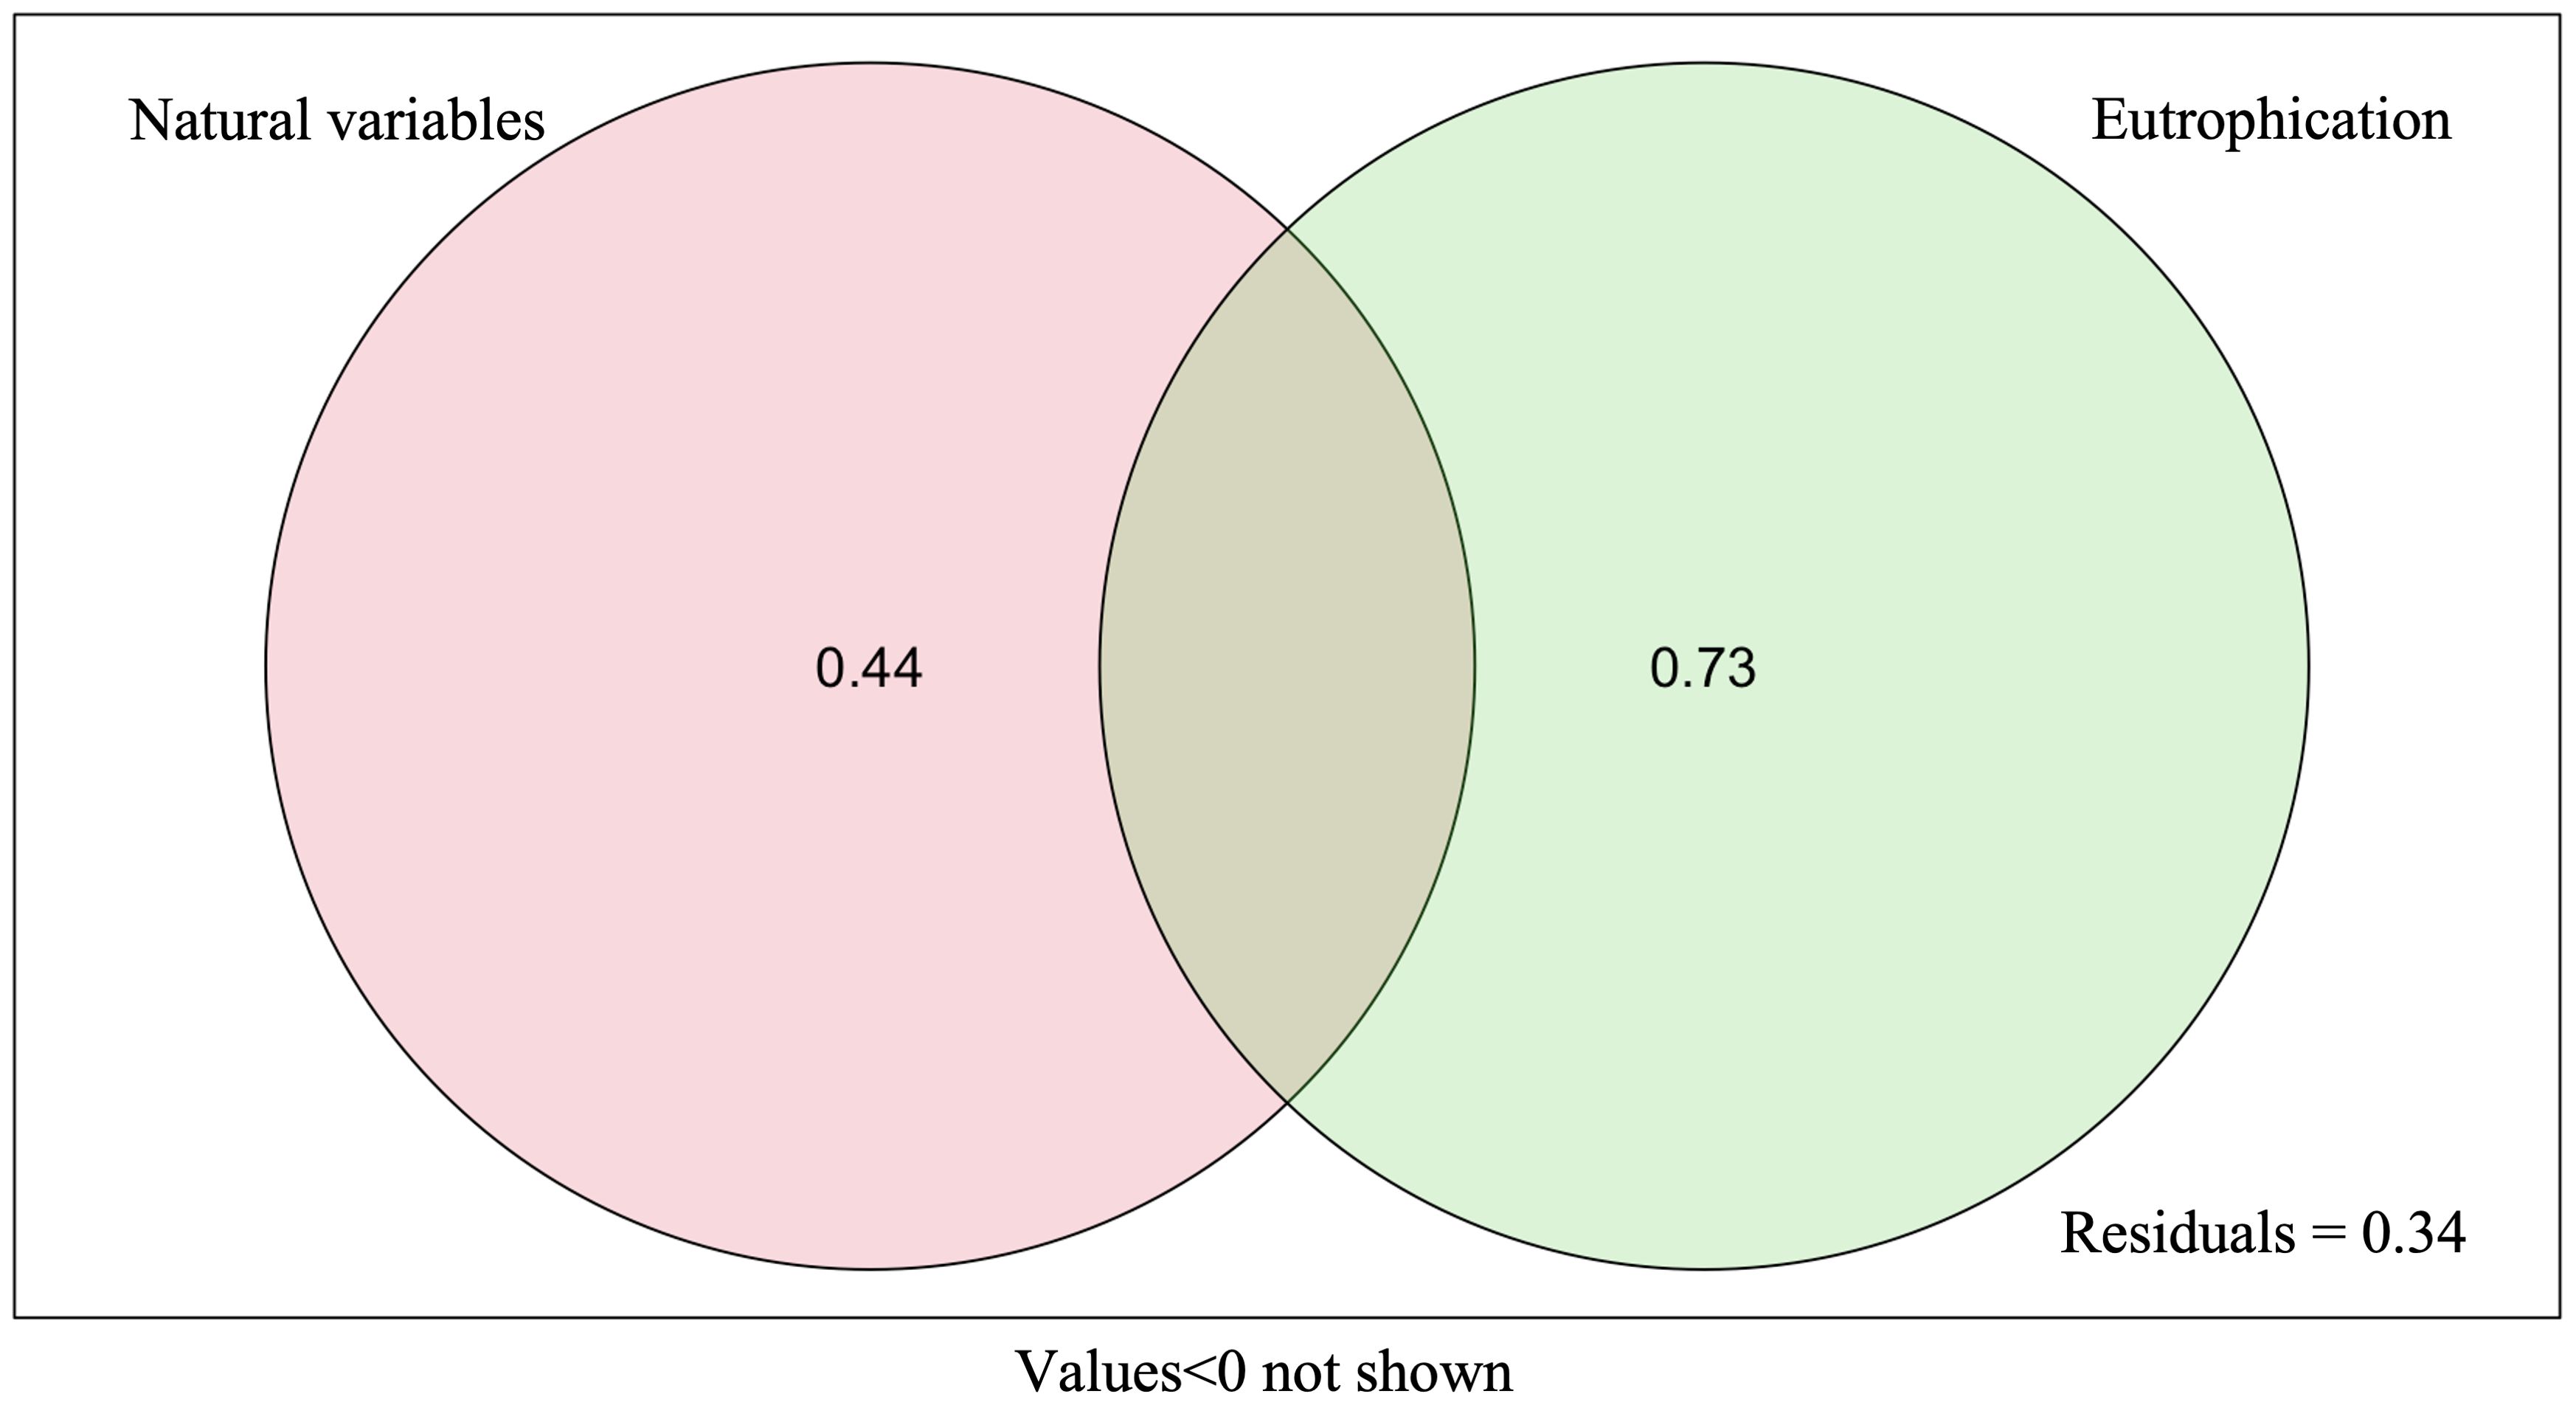
Figure 8. Variance partitioning analysis (VPA) for eutrophication and natural variables explaining biological diversity. 0.44, contribution of other environmental variables to community changes individually; 0.73, contribution of factors related to eutrophication index to community changes individually; residuals, unexplained portion by all environmental variables.
The left side of the RLQ axis shows that the majority of the species (e.g., Lygdamis nesiotes, Figure 6B) in this area were indifferent species (E2) that preferred to live on coarse sand (S1) substrates (Figure 6D) and an environment with high salinity (Figure 6C). The rightmost side of the RLQ axis shows that eutrophic disturbance (Figure 6C) caused by large nutrient inputs (NO2, NO3, DIP, etc.) corresponded to certain burrowers (H3) that preferred muddy sand (S4), such as Paracaudina chilensis (Figure 6B), as well as some second-order opportunistic species (E4) (Figure 6D) that prefer borrow dwelling (H3), such as Sternaspis chinensis. Large (B4) tolerant species (E3) (Figure 6D) showed a positive correlation between body length and NH4 (Figure 5C) at the bottom right of the RLQ axis. Examples of these species were Protankyra bidentata, Aglaophamus sinensis, Nephtys glabra, Aglaophamus dibranchis, Diopatra chiliensis, Kuwaita heteropoda, and Lumbrineris cruzensis (Figure 6B). Through RLQ analysis, the degree of eutrophication was further validated, showing a gradual increase from east to west with the sampling location on the map (Figure 6A). The results of the variation partitioning analysis (Figure 8) indicated that the unique explanatory power of environmental factors related to the eutrophication index was much greater than that of other environmental factors.
4 Discussion
The results of this study indicated that macrobenthic communities had forfeited their growth advantage due to eutrophic stress, with macrobenthic species abundance showing a declining trend as eutrophication escalates. This decline primarily stems from diminished oxygen levels at the sediment interface, a consequence of heightened nutrient loading in the region and an excess of organic matter within the sediment (Como et al., 2007). Additionally, the accumulation of hazardous byproducts like ammonia and sulfide (Signa et al., 2015) has further constrained the abundance and biomass of macrobenthos (Dong et al., 2021; Gusmao et al., 2016; Llanos et al., 2020). Seawater hypoxia and harmful algal blooms are the two main negative effects of coastal eutrophication. Eutrophication is one of the primary causes of dangerous algal blooms among them. According to surveys, there has been a recent trend in harmfulness and diversification among the disease-causing algal bloom species in Chinese coastal waters (Wang et al., 2018). When there is little hydrodynamic pressure, toxins from harmful algal blooms can stay stagnant in the substrate for extended periods of time, causing harm to macrobenthos (Wear and Gardner, 2001). Hypoxia is a consequence of long-term development. In spring, the abundant nutrients promoted algal growth and blooms under eutrophic conditions, and the combined effects of wind and currents spread the algal range, increase the dissolved oxygen concentration in the water column as well as primary productivity, and provide a suitable environment for macrobenthos. During this time, the growth and reproduction of algae reached their peak. During the summer, the algae begin to decompose and consume large amounts of oxygen, resulting in a prolonged period of low-oxygen conditions in the sea. Studies have shown that, in this state, the dissolved oxygen in the sea is very close to zero. When photosynthesis is not able to replenish the oxygen needed for respiration in time and oxygenated seawater is not available during low tide, the sea will be in a state of hypoxia, causing physical damage to macrobenthos (i.e., asphyxiation) (Tagliapietra et al., 1998). Human discharges of wastewater and sewage not only contain N and P nutrients but also carry large amounts of metals and organic pollutants that can also harm macrobenthos. A large number of toxic compounds in sediments have toxic effects and can cause the mortality of fish and mollusks and ultimately reduce the abundance of macrobenthos (Bao et al., 2021).
A popular analytical technique for connecting the biological traits of macrobenthos to stresses or disturbances in the marine environment is biological trait analysis (BTA), also known as RLQ/fourth-corner analysis (Tsikopoulou et al., 2022). This technique can also be used to analyze the relationships between environmental variables and species biological traits (Brown et al., 2014). These two tools allow us to study changes in macrobenthic biological traits when organisms are exposed to the stress of marine ecological pollution (Hooper et al., 2005; Törnroos and Bonsdorff, 2012). Additionally, particular pollution perturbations (e.g., eutrophication pollution and heavy metal pollution) can be differentiated from other environmental variables (Panassiti et al., 2023) as well as from the weights of other disruptions to the environment (Menezes et al., 2010). Severe eutrophication disruption significantly reduces the trait modalities of macrobenthos, similar to heavy metal disruption (Dong et al., 2021). The present study observed only two food source trait modalities (surface-P2 and subsurface-P3) in the severe eutrophication area, though three trait modalities were found at other sites. Only three substratum preference trait modalities were found in the severe eutrophication area—mud (S3), muddy sand (S4), and sandy mud (S5)—but five were found in the mild eutrophication area. These findings suggest that environmental disturbances could suppress the development of biological trait modalities in macrobenthos (Edegbene et al., 2022; Wang et al., 2022) and change the composition of dominant biological trait modalities in macrobenthic communities (Boersma et al., 2016; Kenny et al., 2018).
By using VPA, it was found that the explanatory rate of eutrophication variables (73%) was greater than that of other environmental variables (44%). This study found that environmental factors related to eutrophication indices (e.g., NH4, NO3, NO2, DIP, etc.) were more explanatory of the characteristics of biological trait composition of macrobenthos in Hangzhou Bay—for example, biological trait modalities showed a decreasing trend with increasing eutrophication levels. For instance, under more severe eutrophication stress, the trait modalities of body length, living habit, substratum preference, and AMBI ecological group of macrobenthos could be characterized by long body length, preference for a muddy sand, burrowing, and tolerant and second-order opportunistic species, respectively.
Body length affects all levels of organization, from cell to community (Donadi et al., 2015). The most effective (Buchwalter et al., 2002; Ristau et al., 2015) and intuitive instrument (Odume, 2020) for assessing ecological responses to environmental disturbances is thought to be a change in body length (Eriksson et al., 2010). This study found that appropriate nutrient enrichment can increase organic matter content in sediments by enhancing primary production, thereby increasing food availability and promoting species growth (Atkinson et al., 2011; Collie et al., 2000), giving them a competitive advantage (Macdonald et al., 2012). However, as the degree of eutrophication continuously increases, larger-bodied species become more advantageous in terms of growth. The main reason is that severe eutrophication can lead to prolonged hypoxia, forming dead zones. The reduction in abundance alters the food web (Diaz and Rosenberg, 2008). Species of large body size can accumulate significant energy reserves when food was abundant, allowing them to survive for a longer period even when food supply decreases.
Macrobenthos played a regular role in the mixing of pollutants with sediments through burrow construction and maintenance, feeding, feces, and respiration (Lam-Gordillo et al., 2022). They also serve as pathways and mediators for a variety of biochemical processes (Queirós et al., 2013). This study found that burrowers and tube dwellers were the primary eutrophic-associated trait modalities, mostly due to their increased tolerance to direct contact with different types of contaminants while participating in the mixing of pollutants (Kuzmanovic et al., 2017; Llanos et al., 2020). Additionally, the results indicated that, in areas of higher eutrophication, the dominant biological modes were muddy sand and sandy mud, with species such as Cossura dimorpha, Nephtys glabra, Diopatra chiliensis, and Paracaudina chilensis highly distributed in this region. This concentration was mainly attributed to these species being burrowers, spending most of their time in their tunnels. Muddy sand and sandy mud substrates with some sand were more suitable for burrowers (Murphy et al., 2017), especially in hypoxic environments with higher eutrophication levels.
The spatial distribution of dominant taxa is asymmetrical, which is known from the AMBI ecological groups of the species. The macrobenthos were classified into five AMBI ecological groups, namely, sensitive, indifferent, tolerant, second-order opportunistic, and first-order opportunistic species, based on their sensitivity to different gradients of environmental disturbance (Borja et al., 2000). The different ecological group categories represented the sensitivity of macrobenthos to disturbance. Second-order opportunistic species are positively correlated with eutrophication indices, while indifferent species show a negative correlation with them. Therefore, second-order opportunistic species predominated in areas with severe eutrophication, whereas indifferent species occurred in areas with mild eutrophication. The same phenomenon has been observed in the Bohai Sea (Wang et al., 2022), Daya Bay (Rao et al., 2021), Prydz Bay (Baishnab et al., 2023), and the southeastern coast of India (Pandey et al., 2022). Partial opportunistic species (such as Sternaspis chinensis) are considered as bio-spreaders and pollution-tolerant benthic deposit feeders, often exhibiting a growth advantage in low-quality marine environments rich in high levels of nutrients and heavy metals. This also indicates that the assessment of ecological quality revealed that the AMBI ecological group had a greater indicative value.
Despite their widespread use in marine ecological studies, BTA and RLQ/fourth-corner analysis still have certain drawbacks (Munari, 2013)—for instance, there are currently gaps in the knowledge on the biological traits of macrobenthos and no accepted criteria to classify biological traits (Beauchard et al., 2017; Berger et al., 2018). Furthermore, it might be challenging to fully rule out the effects of natural variables in a study and to quantify a particular type of anthropogenic perturbation alone in complex marine ecosystems (Beauchard et al., 2017; Berger et al., 2018; Edegbene et al., 2020). Other environmental variables, including those that had been chosen and other unmeasured environmental variables, also had an impact on macrobenthos in addition to eutrophication perturbations, as demonstrated by the 44% explanatory rate found for these variables via VPA. Surface crawlers and suspended matter exhibited substantial positive correlations among the selected environmental factors. This correlation may be attributed to the fact that the majority of surface crawlers feed on suspended organic particles in the water. A higher concentration of suspended matter also meant a greater concentration of organic particles, which was more favorable for the survival of surface crawlers.
5 Conclusions
The study revealed the relationship between macrobenthos and eutrophication gradient. The biological characteristics and community structure of macrobenthos along the Hangzhou Bay and adjacent waters were influenced by the eutrophication gradient, and the method of biological traits was able to provide some insights into the spatial distributional changes of macrobenthos. Eutrophication was significantly correlated with the biological traits such as body length, living habit, substratum preference, and AMBI ecological group. Large body length, burrowers and tube dwellers as living habits, and a preference for a sandy and muddy substrata were the primary biological traits of macrobenthos in areas with increased NH4, NO3, NO2, and DIP concentrations. Furthermore, the severe eutrophication area was dominated by second-order opportunistic and tolerant species, such as Sternaspis chinensis and Protankyra bidentata. The eutrophication disturbance severity was also precisely described by the AMBI ecological group. Variation partitioning analysis further confirmed the significant impact of eutrophication on the community and biological traits composition of macrobenthos.
Data availability statement
The original contributions presented in the study are included in the article/supplementary material. Further inquiries can be directed to the corresponding author.
Ethics statement
The manuscript presents research on animals that do not require ethical approval for their study.
Author contributions
WZ: Data curation, Methodology, Software, Validation, Visualization, Writing – original draft. XW: Data curation, Investigation, Resources, Writing – original draft. QH: Conceptualization, Funding acquisition, Methodology, Project administration, Supervision, Validation, Writing – review & editing.
Funding
The author(s) declare financial support was received for the research, authorship, and/or publication of this article. This study was financially supported by the National Natural Science Foundation of China (NSFC) (No. 42076156) and was also sponsored by the K.C. Wong Magna Fund in Ningbo University.
Conflict of interest
Author XW was employed by Yuzhi Environmental Technology Zhejiang Co., Ltd.
The remaining authors declare that the research was conducted in the absence of any commercial or financial relationships that could be construed as a potential conflict of interest.
Publisher’s note
All claims expressed in this article are solely those of the authors and do not necessarily represent those of their affiliated organizations, or those of the publisher, the editors and the reviewers. Any product that may be evaluated in this article, or claim that may be made by its manufacturer, is not guaranteed or endorsed by the publisher.
References
Akinnawo S. O. (2023). Eutrophication: Causes, consequences, physical, chemical and biological techniques for mitigation strategies. Environ. Challenges 12, 100733. doi: 10.1016/j.envc.2023.100733
Asmal I., Syarif E., Amin S., Walenna M. A. (2022). The impact of the environment and people’s attitudes on greywater management in slum coastal settlements. Civil Eng. J. 8, 2734–2748. doi: 10.28991/CEJ-2022-08-12-05
Atkinson L., Field J., Hutchings L. (2011). Effects of demersal trawling along the west coast of southern Africa: multivariate analysis of benthic assemblages. Mar. Ecol. Prog. Ser. 430, 241–255. doi: 10.3354/meps08956
Baishnab S. S., Shahir A., Mandal S., Tripathy S. C. (2023). Unveiling the meiobenthic community structure of Prydz Bay, Antarctica during austral summer. Deep Sea Res. Part I: Oceanographic Res. Papers 199, 104109. doi: 10.1016/j.dsr.2023.104109
Bao C., Huang B., Shao J., Cai Q., Mu Q., Murk A. J. (2021). Spatial and temporal distribution of toxic compounds in sediments and potential ecological effects on macrobenthic faunal species in Hangzhou Bay from 2003 to 2015. Mar. pollut. Bull. 172, 112816. doi: 10.1016/j.marpolbul.2021.112816
Beauchard O., Veríssimo H., Queirós A. M., Herman P. M. J. (2017). The use of multiple biological traits in marine community ecology and its potential in ecological indicator development. Ecol. Indic. 76, 81–96. doi: 10.1016/j.ecolind.2017.01.011
Berger E., Haase P., Schäfer R. B., Sundermann A. (2018). Towards stressor-specific macroinvertebrate indices: Which traits and taxonomic groups are associated with vulnerable and tolerant taxa? Sci. Total Environ. 619–620, 144–154. doi: 10.1016/j.scitotenv.2017.11.022
Boersma K. S., Dee L. E., Miller S. J., Bogan M. T., Lytle D. A., Gitelman A. I. (2016). Linking multidimensional functional diversity to quantitative methods: a graphical hypothesis-evaluation framework. Ecology 97, 583–593. doi: 10.1890/15-0688
Borja A., Franco J., Pérez V. (2000). A marine biotic index to establish the ecological quality of soft-bottom benthos within european estuarine and coastal environments. Mar. pollut. Bull. 40, 1100–1114. doi: 10.1016/S0025-326X(00)00061-8
Bremner J., Rogers S., Frid C. (2006). Methods for describing ecological functioning of marine benthic assemblages using biological traits analysis (BTA). Ecol. Indic. 6, 609–622. doi: 10.1016/j.ecolind.2005.08.026
Brown A. M., Warton D. I., Andrew N. R., Binns M., Cassis G., Gibb H. (2014). The fourth-corner solution – using predictive models to understand how species traits interact with the environment. Methods Ecol. Evol. 5, 344–352. doi: 10.1111/2041-210X.12163
Buchwalter D. B., Jenkins J. J., Curtis L. R. (2002). Respiratory strategy is a major determinant of [3H]water and [14C]chlorpyrifos uptake in aquatic insects. Can. J. Fisheries Aquat. Sci. 59, 1315–1322. doi: 10.1139/f02-107
Calapez A. R., Serra S. R. Q., Santos J. M., Branco P., Ferreira T., Hein T., et al. (2018). The effect of hypoxia and flow decrease in macroinvertebrate functional responses: A trait-based approach to multiple-stressors in mesocosms. Sci. Total Environ. 637–638, 647–656. doi: 10.1016/j.scitotenv.2018.05.071
Chen J., Li D., Jin H., Jiang Z., Wang B., Wu B., et al. (2020). “Changing nutrients, oxygen and phytoplankton in the east China Sea,” in Changing Asia-Pacific Marginal Seas, Atmosphere, Earth, Ocean & Space. Eds. Chen C.-T. A., Guo X. (Springer Singapore, Singapore), 155–178. doi: 10.1007/978-981-15-4886-4_10
Chevene F., Doléadec S., Chessel D. (1994). A fuzzy coding approach for the analysis of long-term ecological data. Freshw. Biol. 31, 295–309. doi: 10.1111/j.1365-2427.1994.tb01742.x
Chiaudani G., Marchetti R., Vighi M. (1980). “Eutrophication in emilia-romagna coastal waters (North Adriatic Sea, Italy): a case history,” in Mediterranean Coastal Pollution (Netherlands: Elsevier), 185–192. doi: 10.1016/B978-0-08-026058-7.50019-4
Choi Y., Kim D., Noh J. H., Kang D.-J. (2021). Contribution of Changjiang River discharge to CO2 uptake capacity of the northern East China Sea in August 2016. Continental Shelf Res. 215, 104336. doi: 10.1016/j.csr.2020.104336
Collie J., Hall S., Kaiser M., Poiner I. (2000). A quantitative analysis of fishing impacts shelf-sea benthos. J. Anim. Ecol. 69, 785–798. doi: 10.1046/j.1365-2656.2000.00434.x
Como S., Magni P., Casu D., Floris A., Giordani G., Natale S., et al. (2007). Sediment characteristics and macrofauna distribution along a human-modified inlet in the Gulf of Oristano (Sardinia, Italy). Mar. pollut. Bull. 54, 733–744. doi: 10.1016/j.marpolbul.2007.01.007
Diaz R. J., Rosenberg R. (2008). Spreading dead zones and consequences for marine ecosystems (American Association for the Advancement of Science (American)). doi: 10.1126/SCIENCE.1156401
Ding X., Shi J., Guo X., Gao H., Liu S., Guo W. (2023). Interannual variations in the nutrient cycle in the central Bohai Sea in response to anthropogenic inputs. Chemosphere 313, 137620. doi: 10.1016/j.chemosphere.2022.137620
Donadi S., Eriksson B. K., Lettmann K. A., Hodapp D., Wolff J.-O., Hillebrand H. (2015). The body-size structure of macrobenthos changes predictably along gradients of hydrodynamic stress and organic enrichment. Mar. Biol. 162, 675–685. doi: 10.1007/s00227-015-2614-z
Dong J., Zhao L., Sun X., Hu C., Wang Y., Li W., et al. (2021). Response of macrobenthic communities to heavy metal pollution in Laoshan Bay, China: A trait-based method. Mar. pollut. Bull. 167, 112292. doi: 10.1016/j.marpolbul.2021.112292
Dray S., Choler P., Dolédec S., Peres-Neto P. R., Thuiller W., Pavoine S., et al. (2014). Combining the fourth-corner and the RLQ methods for assessing trait responses to environmental variation. Ecology 95, 14–21. doi: 10.1890/13-0196.1
Edegbene A. O., Akamagwuna F. C., Arimoro F. O., Akumabor E. C., Kaine E. A. (2022). Effects of urban-agricultural land-use on Afrotropical macroinvertebrate functional feeding groups in selected rivers in the Niger Delta Region, Nigeria. Hydrobiologia 849, 4857–4869. doi: 10.1007/s10750-022-05034-0
Edegbene A. O., Arimoro F. O., Odume O. N. (2020). Exploring the distribution patterns of macroinvertebrate signature traits and ecological preferences and their responses to urban and agricultural pollution in selected rivers in the Niger Delta ecoregion, Nigeria. Aquat Ecol. 54, 553–573. doi: 10.1007/s10452-020-09759-9
Editorial Committee of Fauna of Zhejiang. (1991). Fauna of zhejiang mollusks (Zhejiang Science and Technology Press).
Erdoğan Ş., Beklİoğlu M., Litchman E., Miller E. T., Levі E. E., Bucak T., et al. (2021). Determinants of phytoplankton size structure in warm, shallow lakes. J. Plankton Res. 43, 353–366. doi: 10.1093/plankt/fbab035
Eriksson B. K., van der Heide T., van de Koppel J., Piersma T., van der Veer H. W., Olff H. (2010). Major changes in the ecology of the wadden sea: human impacts, ecosystem engineering and sediment dynamics. Ecosystems 13, 752–764. doi: 10.1007/s10021-010-9352-3
Glibert P., Seitzinger S., Heil C., Burkholder J., Parrow M., Codispoti L., et al. (2005). The role of eutrophication in the global proliferation of harmful algal blooms. Oceanog 18, 198–209. doi: 10.5670/oceanog.2005.54
Gusmao J. B., Brauko K. M., Eriksson B. K., Lana P. C. (2016). Functional diversity of macrobenthic assemblages decreases in response to sewage discharges. Ecol. Indic. 66, 65–75. doi: 10.1016/j.ecolind.2016.01.003
Hooper D. U., Chapin F. S., Ewel J. J., Hector A., Inchausti P., Lavorel S., et al. (2005). Effects of biodiversity on ecosystem functioning: a consensus of current knowledge. Ecol. Monogr. 75, 3–35. doi: 10.1890/04-0922
Jarvie H. P., Sharpley A. N., Spears B., Buda A. R., May L., Kleinman P. J. A. (2013). Water quality remediation faces unprecedented challenges from “legacy phosphorus. Environ. Sci. Technol. 47, 8997–8998. doi: 10.1021/es403160a
Kemp W. M., Boynton W. R., Adolf J. E., Boesch D. F., Boicourt W. C., Brush G., et al. (2005). Eutrophication of Chesapeake Bay: historical trends and ecological interactions. Mar. Ecol. Prog. Ser. 303, 1–29. doi: 10.3354/meps303001
Kenny A. J., Jenkins C., Wood D., Bolam S. G., Mitchell P., Scougal C., et al. (2018). Assessing cumulative human activities, pressures, and impacts on North Sea benthic habitats using a biological traits approach. ICES J. Mar. Sci. 75, 1080–1092. doi: 10.1093/icesjms/fsx205
Kleyer M., Dray S., Bello F., Lepš J., Pakeman R. J., Strauss B., et al. (2012). Assessing species and community functional responses to environmental gradients: which multivariate methods? J. Vegetation Sci. 23, 805–821. doi: 10.1111/j.1654-1103.2012.01402.x
Kolbe T., Marçais J., Thomas Z., Abbott B. W., de Dreuzy J.-R., Rousseau-Gueutin P., et al. (2016). Coupling 3D groundwater modeling with CFC-based age dating to classify local groundwater circulation in an unconfined crystalline aquifer. J. Hydrology RESIDENCE TIMES IN SUBSURFACE HYDROLOGICAL SYSTEMS: Signature hydrological processes impact Environ. Appl. 543, 31–46. doi: 10.1016/j.jhydrol.2016.05.020
Kratzer S., Kyryliuk D., Edman M., Philipson P., Lyon S. W. (2019). Synergy of satellite, in situ and modelled data for addressing the scarcity of water quality information for eutrophication assessment and monitoring of swedish coastal waters. Remote Sens. 11, 2051. doi: 10.3390/rs11172051
Kuzmanovic M., Dolédec S., De Castro-Catala N., Ginebreda A., Sabater S., Muñoz I., et al. (2017). Environmental stressors as a driver of the trait composition of benthic macroinvertebrate assemblages in polluted Iberian rivers. Environ. Res. 156, 485–493. doi: 10.1016/j.envres.2017.03.054
Lam-Gordillo O., Huang J., Barceló A., Kent J., Mosley L. M., Welsh D. T., et al. (2022). Restoration of benthic macrofauna promotes biogeochemical remediation of hostile sediments; An in situ transplantation experiment in a eutrophic estuarine-hypersaline lagoon system. Sci. Total Environ. 833, 155201. doi: 10.1016/j.scitotenv.2022.155201
Le Moal M., Gascuel-Odoux C., Ménesguen A., Souchon Y., Étrillard C., Levain A., et al. (2019). Eutrophication: A new wine in an old bottle? Sci. Total Environ. 651, 1–11. doi: 10.1016/j.scitotenv.2018.09.139
Liu X., Stock C. A., Dunne J. P., Lee M., Shevliakova E., Malyshev S., et al. (2021). Simulated global coastal ecosystem responses to a half-century increase in river nitrogen loads. Geophysical Res. Lett. 48, e2021GL094367. doi: 10.1029/2021GL094367
Llanos E. N., Saracho Bottero M. A., Jaubet M. L., Elías R., Garaffo G. V. (2020). Functional diversity in the intertidal macrobenthic community at sewage-affected shores from Southwestern Atlantic. Mar. pollut. Bull. 157, 111365. doi: 10.1016/j.marpolbul.2020.111365
Macdonald D., Smith H. A., Vannijnatten D. L., Vannijnatten D. L. (2010). La politique canadienne en matiere de changements climatiques et l’influence nord-americaine. Gouvernance 7, 1. doi: 10.7202/1039137ar
Macdonald T. A., Burd B. J., van Roodselaar A. (2012). Size structure of marine soft-bottom macrobenthic communities across natural habitat gradients: implications for productivity and ecosystem function. PloS One 7, e40071. doi: 10.1371/journal.pone.0040071
Malone T. C., Newton A. (2020). The globalization of cultural eutrophication in the coastal ocean: causes and consequences. Front. Mar. Sci. 7. doi: 10.3389/fmars.2020.00670
Martinetto P., Daleo P., Escapa M., Alberti J., Isacch J. P., Fanjul E., et al. (2010). High abundance and diversity of consumers associated with eutrophic areas in a semi-desert macrotidal coastal ecosystem in Patagonia, Argentina. Estuarine Coast. Shelf Sci. 88, 357–364. doi: 10.1016/j.ecss.2010.04.012
Matsuzaki K. M., Itaki T., Kimoto K. (2016). Vertical distribution of polycystine radiolarians in the northern East China Sea. Mar. Micropaleontology 125, 66–84. doi: 10.1016/j.marmicro.2016.03.004
Menezes S., Baird D. J., Soares A. M. V. M. (2010). Beyond taxonomy: a review of macroinvertebrate trait-based community descriptors as tools for freshwater biomonitoring: Trait-based community descriptors. J. Appl. Ecol. 47, 711–719. doi: 10.1111/j.1365-2664.2010.01819.x
Munari C. (2013). Benthic community and biological trait composition in respect to artificial coastal defence structures: A study case in the northern Adriatic Sea. Mar. Environ. Res. 90, 47–54. doi: 10.1016/j.marenvres.2013.05.011
Murphy J. F., Jones J. I., Arnold A., Duerdoth C. P., Pretty J. L., Naden P. S., et al. (2017). Can macroinvertebrate biological traits indicate fine-grained sediment conditions in streams? River Res. Apps 33, 1606–1617. doi: 10.1002/rra.3194
Nixon S. W. (1995). Coastal marine eutrophication: A definition, social causes, and future concerns. Ophelia 41, 199–219. doi: 10.1080/00785236.1995.10422044
Odume O. N. (2020). Searching for urban pollution signature and sensitive macroinvertebrate traits and ecological preferences in a river in the Eastern Cape of South Africa. Ecol. Indic. 108, 105759. doi: 10.1016/j.ecolind.2019.105759
Paerl H. (2018). Mitigating toxic planktonic cyanobacterial blooms in aquatic ecosystems facing increasing anthropogenic and climatic pressures. Toxins 10, 76. doi: 10.3390/toxins10020076
Panassiti B., Trivellone V., Armella L. H., Renison D., Carranza A. V. (2023). Oil exploitation drives environmentally- and trait-mediated diversity of non-native plants in the Yungas forest in Argentina. Flora 305, 152344. doi: 10.1016/j.flora.2023.152344
Pandey V., Jha D. K., Kumar P. S., Santhanakumar J., Venkatnarayanan S., Prince Prakash Jebakumar J., et al. (2022). Effect of multiple stressors on the functional traits of sub-tidal macrobenthic fauna: A case study of the southeast coast of India. Mar. pollut. Bull. 175, 113355. doi: 10.1016/j.marpolbul.2022.113355
Pearson T., Rosenberg R. (1978). Macrobenthic succession in relation to organic enrichment and pollution of the marine environment. Oceanographic Mar. Biol. Annu. Rev. 16, 229–311.
Qian W., Dai M., Xu M., Kao S., Du C., Liu J., et al. (2017). Non-local drivers of the summer hypoxia in the East China Sea off the Changjiang Estuary. Estuarine Coast. Shelf Sci. 198, 393–399. doi: 10.1016/j.ecss.2016.08.032
Queirós A. M., Birchenough S. N. R., Bremner J., Godbold J. A., Parker R. E., Romero-Ramirez A., et al. (2013). A bioturbation classification of European marine infaunal invertebrates. Ecol. Evol. 3, 3958–3985. doi: 10.1002/ece3.769
Rabalais N. N., Turner R. E., Díaz R. J., Justić D. (2009). Global change and eutrophication of coastal waters. ICES J. Mar. Sci. 66, 1528–1537. doi: 10.1093/icesjms/fsp047
Rao Y., Cai L., Chen X., Zhou X., Fu S., Huang H. (2021). Responses of functional traits of macrobenthic communities to human activities in daya bay (a subtropical semi-enclosed bay), China. Front. Environ. Sci. 9. doi: 10.3389/fenvs.2021.766580
Ristau K., Spann N., Traunspurger W. (2015). Species and trait compositions of freshwater nematodes as indicative descriptors of lake eutrophication. Ecol. Indic. 53, 196–205. doi: 10.1016/j.ecolind.2015.01.010
Rosenberg R. (1985). Eutrophication—The future marine coastal nuisance? Mar. pollut. Bull. 16, 227–231. doi: 10.1016/0025-326X(85)90505-3
Rosenberg R., Elmgren R., Fleischer S., Jonsson P., Dahlin H. (1990). Marine eutrophic case studies in Sweden. AMBIO A J. Hum. Environ. 19, 102-108.
Savchuk O. P. (2018). Large-scale nutrient dynamics in the Baltic Sea 1970–2016. Front. Mar. Sci. 5. doi: 10.3389/fmars.2018.00095
Signa G., Mazzola A., Costa V., Vizzini S. (2015). Bottom-up control of macrobenthic communities in a guanotrophic coastal system. PloS One 10, e0117544. doi: 10.1371/journal.pone.0117544
Smith V. H., Schindler D. W. (2009). Eutrophication science: where do we go from here? Trends Ecol. Evol. 24, 201–207. doi: 10.1016/j.tree.2008.11.009
Soetaert K., Muthumbi A., Heip C. (2002). Size and shape of ocean margin nematodes: morphological diversity and depth-related patterns. Mar. Ecol. Prog. Ser. 242, 179–193. doi: 10.3354/meps242179
State Bureau of Quality and Technical Supervision of China. (2007a). Part 5: Sediment Analysis (The Standards Press of China (China): National Standard of China for the Specification for Marine Monitoring). (GB 17378.5–2007).
State Bureau of Quality and Technical Supervision of China (2007b). Part 4: Survey of Chemical Parameters in Sea Water (The Standards Press of China (China): National Standard of China for the Specification for Marine Monitoring). (GB/T 12763.4-2007).
Sun R., Yang D. (1988). Chinese Offshore Polychaetes. (Marine Science (China): China Agriculture Press).
Tagliapietra D., Pavan M., Wagner C. (1998). Macrobenthic community changes related to eutrophication inpalude della rosa(venetian lagoon, Italy). Estuarine Coast. Shelf Sci. 47, 217–226. doi: 10.1006/ecss.1998.0340
Tang D., Di B., Wei G., Ni I.-H., Oh I. S., Wang S. (2006). Spatial, seasonal and species variations of harmful algal blooms in the South Yellow Sea and East China Sea. Hydrobiologia 568, 245–253. doi: 10.1007/s10750-006-0108-1
Törnroos A., Bonsdorff E. (2012). Developing the multitrait concept for functional diversity: lessons from a system rich in functions but poor in species. Ecol. Appl. 22, 2221–2236. doi: 10.1890/11-2042.1
Tsikopoulou I., Smith C. J., Papadopoulou K. N., Austen M. C. (2022). Linking species functional traits to specific biogeochemical processes under trawling pressure. Biology 11, 1378. doi: 10.3390/biology11101378
Wang Q., Shi S., Liu X. (2022). Functional diversity of macrofaunal assemblages as indicators to assess heavy metal pollution in the Bohai Sea, China. Mar. pollut. Bull. 185, 114265. doi: 10.1016/j.marpolbul.2022.114265
Wang B., Xin M., Wei Q., Xie L. (2018). A historical overview of coastal eutrophication in the China Seas. Mar. pollut. Bull. 136, 394–400. doi: 10.1016/j.marpolbul.2018.09.044
Wear R., Gardner J. (2001). Biological effects of the toxic algal bloom of February and March 1998 on the benthos of Wellington Harbour, New Zealand. Mar. Ecol. Prog. Ser. 218, 63–76. doi: 10.3354/meps218063
Yang H., Zhuo S., Xue B., Zhang C., Liu W. (2012). Distribution, historical trends and inventories of polychlorinated biphenyls in sediments from Yangtze River Estuary and adjacent East China Sea. Environ. pollut. 169, 20–26. doi: 10.1016/j.envpol.2012.05.003
Yao Y., Shen Z. (2005). A review on eutrophication research of coastal waters. MarineScience 29, 53–57.
Zhang D., Xu Z., Gao Q., Chen J. (2016). Effects of tide and water masses on the distribution of zooplankton in different parts of Hangzhou Bay. Acta Ecologica Sin. 36, 133–140. doi: 10.1016/j.chnaes.2015.12.007
Zhou Z., Yu R. C., Zhou M. (2022). Evolution of harmful algal blooms in the East China Sea under eutrophication and warming scenarios. Water Res. 221, 118807. doi: 10.1016/j.watres.2022.118807
Appendix 1
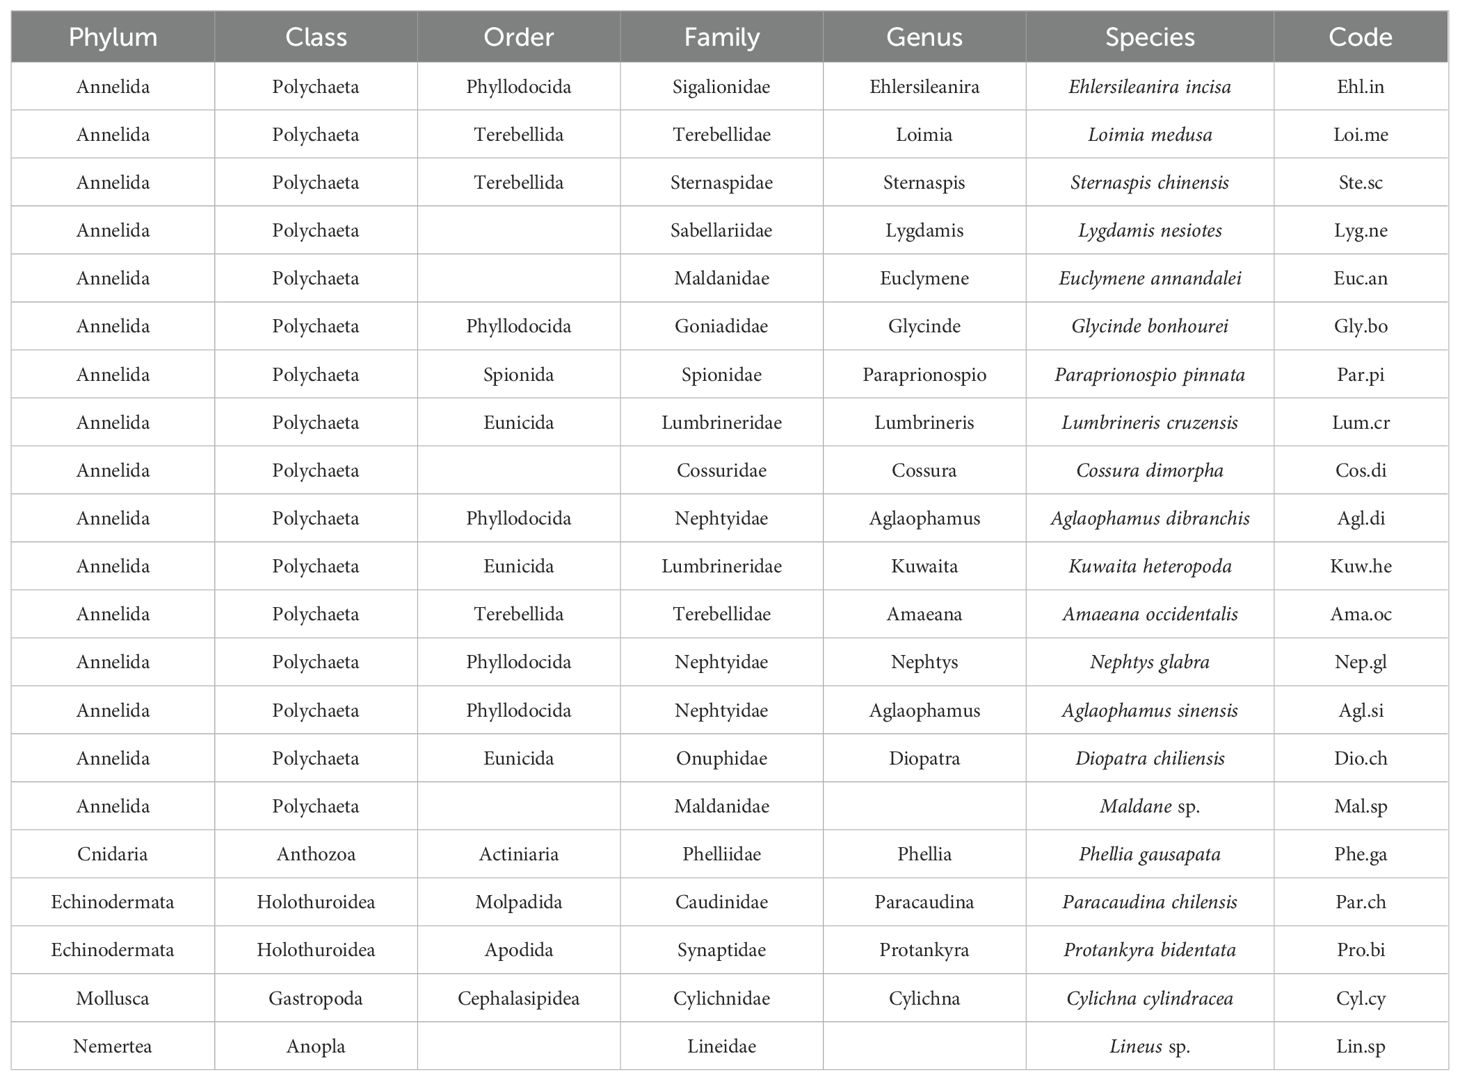
. List of macrobenthic species in Hangzhou Bay and adjacent waters and corresponding codes.
Appendix 2
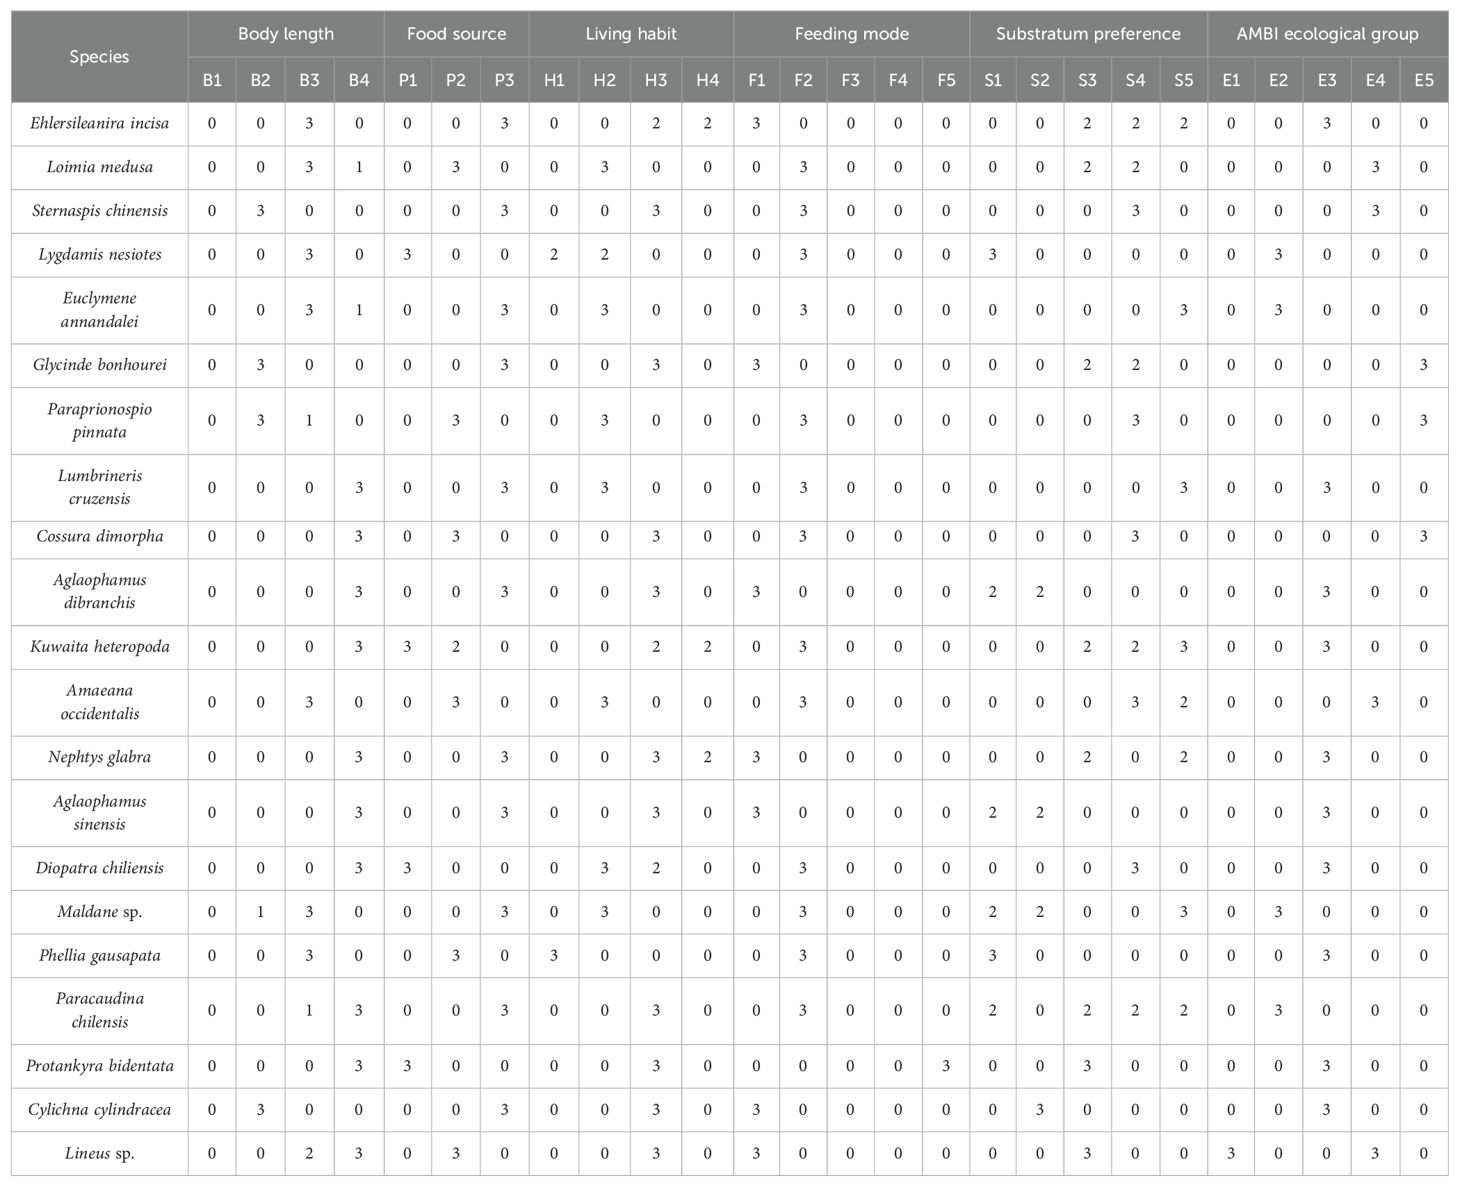
. Fuzzy code values for the functional traits of 21 macrobenthic species in Hangzhou Bay and adjacent waters.
Keywords: biological traits analysis, macrobenthic community, Hangzhou Bay, variance partitioning analysis, eutrophication
Citation: Zhou W, Wang X and Han Q (2024) Unveiling the structuring effects of eutrophication on macrobenthic biological traits in Hangzhou Bay and adjacent waters. Front. Mar. Sci. 11:1451886. doi: 10.3389/fmars.2024.1451886
Received: 20 June 2024; Accepted: 09 August 2024;
Published: 30 August 2024.
Edited by:
Jose Luis Iriarte, Austral University of Chile, ChileReviewed by:
Sandra L. Marin, Austral University of Chile, ChileAmerico Montiel, Universidad de Magallanes, Chile
Copyright © 2024 Zhou, Wang and Han. This is an open-access article distributed under the terms of the Creative Commons Attribution License (CC BY). The use, distribution or reproduction in other forums is permitted, provided the original author(s) and the copyright owner(s) are credited and that the original publication in this journal is cited, in accordance with accepted academic practice. No use, distribution or reproduction is permitted which does not comply with these terms.
*Correspondence: Qingxi Han, aGFucWluZ3hpQG5idS5lZHUuY24=