- 1Institute of Carbon Cycles, Helmholtz-Zentrum Hereon, Geesthacht, Germany
- 2Research and Technology Centre Westcoast (FTZ), University of Kiel, Büsum, Germany
- 3Research Centre for Oceanography of National Research and Innovation Agency, Jakarta, Indonesia
Stationary in situ measurements conducted in close proximity to the shoreline present unique challenges. The shallow depth, automated profiling and accessibility for maintenance, particularly in the context of biofouling, are key considerations. The WInch for Long-term MOnitoring (WILMO), a solution designed to meet these requirements, is therefore presented. The fully automated system keeps the sensitive devices outside of the water until a profiling cycle is initiated, reducing the available settling time for species on the surface of the sensors. The design leverages common hardware and is structured in distinct units. This feature facilitates the interchangeability of individual hardware components and the implementation of a unifying software system capable of simultaneously managing all elements of WILMO. Using wireless broadband communications, WILMO can be fully controlled remotely, allowing for adjustments to the setup and monitoring of system functionality through a special web interface. The data are transmitted to a server with adjustable frequency and a post processing tool prepares them for analysis. The system underwent rigorous testing and demonstrated effective performance in northern Bali, Indonesia, between March and December 2022, gathering physical and biogeochemical time series data. The consistency of the data is validated through comparison with other instruments to ensure data quality. The results obtained are employed to ascertain the suitability of the special flow velocity sensor in this context. WILMO is a demonstrably reliable device, easily manageable and perfectly suited for long-term coastal monitoring.
1 Introduction
Coastal areas cover only about 8 % of the total ocean surface but account for 30 % of the total global ocean productivity (Schofield et al., 2002). Climate change impact coastal areas, shelf seas, and the open ocean and hence increases the pressure on marine ecosystems. Marine heatwaves, for instance, can result in shifts of nutrient fluxes, biogeography, phenology and community composition of different species, which in turn can impact the blue economy as well as communities living in proximity to the coast (Cooley et al., 2022; Kaiser et al., 2023).
In line with this more anthropocentric view, the number of offshore aquafarms (mariculture) is increasing at a steady rate. The output of fish from aquaculture has surpassed that of offshore fishing, with mariculture representing a substantial contributor (FAO, 2022). Ocean acidification is associated with the uptake of CO2 by the ocean and has an impact on mariculture. For example, calcifying species and finfish may be affected (Clements and Chopin, 2017; Wallace et al., 2014; Feely et al., 2010). It is therefore essential to implement high-resolution monitoring systems to track coastal conditions and the impact of both the effect of a changing ocean on aquafarms and the ecological and economic growth of sustainable mariculture. Indonesia, for instance, is one of the major global fish producers (FAO, 2022) and thus represents an ideal location for such measurements and to study the aforementioned interrelations.
Moreover, marine ecosystems, and particularly coastal regions are invaluable for reducing atmospheric CO2 (Bauer et al., 2013; Mathis et al., 2024), and high resolution observations are essential for estimating drivers of coastal carbon fluxes (Kitidis et al., 2019). Macovei et al. (2022) demonstrates the significance of high resolution observations like FerryBox measurements (Petersen, 2014; Petersen et al., 2018) for reducing the uncertainty of estimating the carbon sink capacity in coastal shelf seas. Both, mesoscale advection processes and biologically driven processes can alter the average trend in CO2 air-sea flux, with implications for numerical modeling and forecasting. As another example, in coastal systems driven by tidal dynamics, continuous high-resolution automated observations can help quantify the drivers of primary production and ecosystem metabolism, and identify the ecosystem mechanism that forms a tidally-driven biogeochemical reactor (Voynova et al., 2015).
Accurate observations of coastal regions are of major importance regarding physical and biogeochemical dynamics as well as climate change and/or sustainable exploitation. However, this demands a high spatial and temporal resolution and hence a large amount of flexible and cost-efficient in situ sensors and devices (Wang et al., 2019).
1.1 State of the art
Melet et al. (2020) points out, that earth observations and in particular coastal observations should be performed with both, in situ- and remote sensing methods. In situ methods are stationary or underway observations along a fixed or moving transect and only a large number of measurement platforms yields the required spatial resolution. Remote sensing methods easily cover wide ranges but with a lower temporal resolution1 and ocean state parameters are not directly measurable.
A detailed summary of various existing types of instruments is given in Carlson et al. (2013). Alongside fixed-depth instruments like ADCPs, moored automatic mobile profilers (MAMPs) are types of profilers intended to measure vertical time series data of biotic and abiotic processes. They are used for oceanographic measurements up to 1000 m depth and they resolve dynamic processes including vertical (turbulent) mixing or horizontal advection and diffusion. Also, chemical reactions as well as for example the phytoplankton production are of interest. MAMPs include four different types: (i) buoy profilers are floating devices raising and lowering oceanographic instruments mainly used for shallow coastal waters up to 100 m. To reduce biofouling, it is advised to park the probe below the euphotic zone during standby. (ii) bottom-mounted profilers (e.g. Zang et al., 2021) are moored on the sea floor but rarely include winch-driven instruments. The measurements include the sea bed and sea surface interfaces and exclude floating distortions but with the cost of expensive and complicated mooring systems. They are suitable for depths of ∼ 300 m. (iii) winch-type profilers consist of a single frame including the instruments as well as the winch itself with cable-length of up to 100 m. The profiler is attached to an anchor and the winch works against buoyancy when lowering the device to the ground. The advantages are its simple deployment and size but it is restricted for regions with low flow velocity and the high energy consumption increases maintenance intervals. (iv) wire following profilers autonomously follow the mooring line either driven by a motor or by variable buoyancy (e.g. Send et al., 2013). The wire profiler is used for depths up to 800 m but needs additional communication to a local modem before the data can be transferred. The probe on the buoy profilers (i) can be fully or partially submerged during the standby mode and biofouling can hardly be suppressed. The instruments (ii - iv) are always submerged and biofouling can only be suppressed for depths greater than 80 to 100 m, the region below the euphotic zone. However, preventing biofouling via submerging the instrument deeper than the euphotic zone is not possible in coastal waters shallower than 80 m. Venkatesan et al. (2017) presents cases of sensor drift for CT-sensors as an effect of biofouling predominantly for the upper 50 m. Delauney et al. (2010) reports biofouling effects on the measurement data in less than a week drastically reducing the reliability of measurements. Furthermore, the communication and controls to the devices may sometimes be tricky and in some cases, the data are just available after the campaign or during maintenance.
Jin et al. (2021) developed a buoy system (buoy profiler, i) to be deployed in the Yellow Sea which is characterized by a wide tidal range (∼ 10 m), strong tidal currents and an average depth of 44 m. Moored devices (ii – iv) do not work for large tidal ranges because only the distance of the available water column at low tide is accessible over long periods. Their proposed buoy system employed a winch and sampled time series data for the entire water column over a long campaign period. As any MAMP, the instrument is submerged and parked permanently well above the euphotic zone. Hence, the system and the sensors are persistently affected by biofouling and frequent maintenance is necessary. The profiling system introduced by Barnard et al. (2010) is a member of an extensive family of interconnected instruments that measure the full water column, including boundary layers and additional devices designed to suppress biofouling.
Other types of instruments are autonomous floating devices, e.g. the ARGO floats (TheArgoScienceTeam, 1999). Argo floats are deployed in the open ocean and build a net of instruments for monitoring. The devices are designed to send collected data via satellite as they surface after they sink to a specified depth, and take profiles as they ascend. Numerous devices provide a relatively high spatial resolution and a reasonable temporal resolution depending on depth. Importantly, the devices perform depth profiles up to 2000 m, do not cover coastal regions2 and depend on the track of the drift. As the sensors on the Argo floats are submerged throughout their use, they are affected by biofouling and a long-term conductivity sensor drift may arise (Oka, 2005).
For monitoring coastal regions rather small depths have to be measured. Autonomous floating devices depend on the drifting path making it hard to keep them in the narrow coastal region. MAMP systems can be complex and expensive, requiring regular maintenance that can only be performed on the instrument taken out of the water. Biofouling can be suppressed below the euphotic zone, deeper than the intended coastal region. In general, remote sensing methods are highly useful tools, but it is evident that they are unable to monitor the water column in situ.
In this paper, the flexible instrument design WInch for Long-term MOnitoring (WILMO) will be introduced addressing the limitations outlined above. WILMO is developed as a combination of a buoy profiler (i) and a stationary (fixed location) in situ profiling system shown in Figures 1 and Figure A1. It measures the physical and biological parameters of the water column in shallow coastal waters (≲120 m depths) with an adjustable frequency. Unlike buoy profilers (e.g. Lochthofen et al., 2021), WILMO relies on a mounting platform, a quai wall or any other suitable structure making it easy to protect the system from environmental impacts and to easily access the device for maintenance. WILMOs sensitive instruments are submerged only during the measurement and kept well above the water surface in standby mode, which is a very simple but effective method of suppressing biofouling. For communication, the proximity to the coast allows for a simple LTE modem which grants access to WILMO and enables both, the full controls and the data transfer either by pushing or pulling the data.
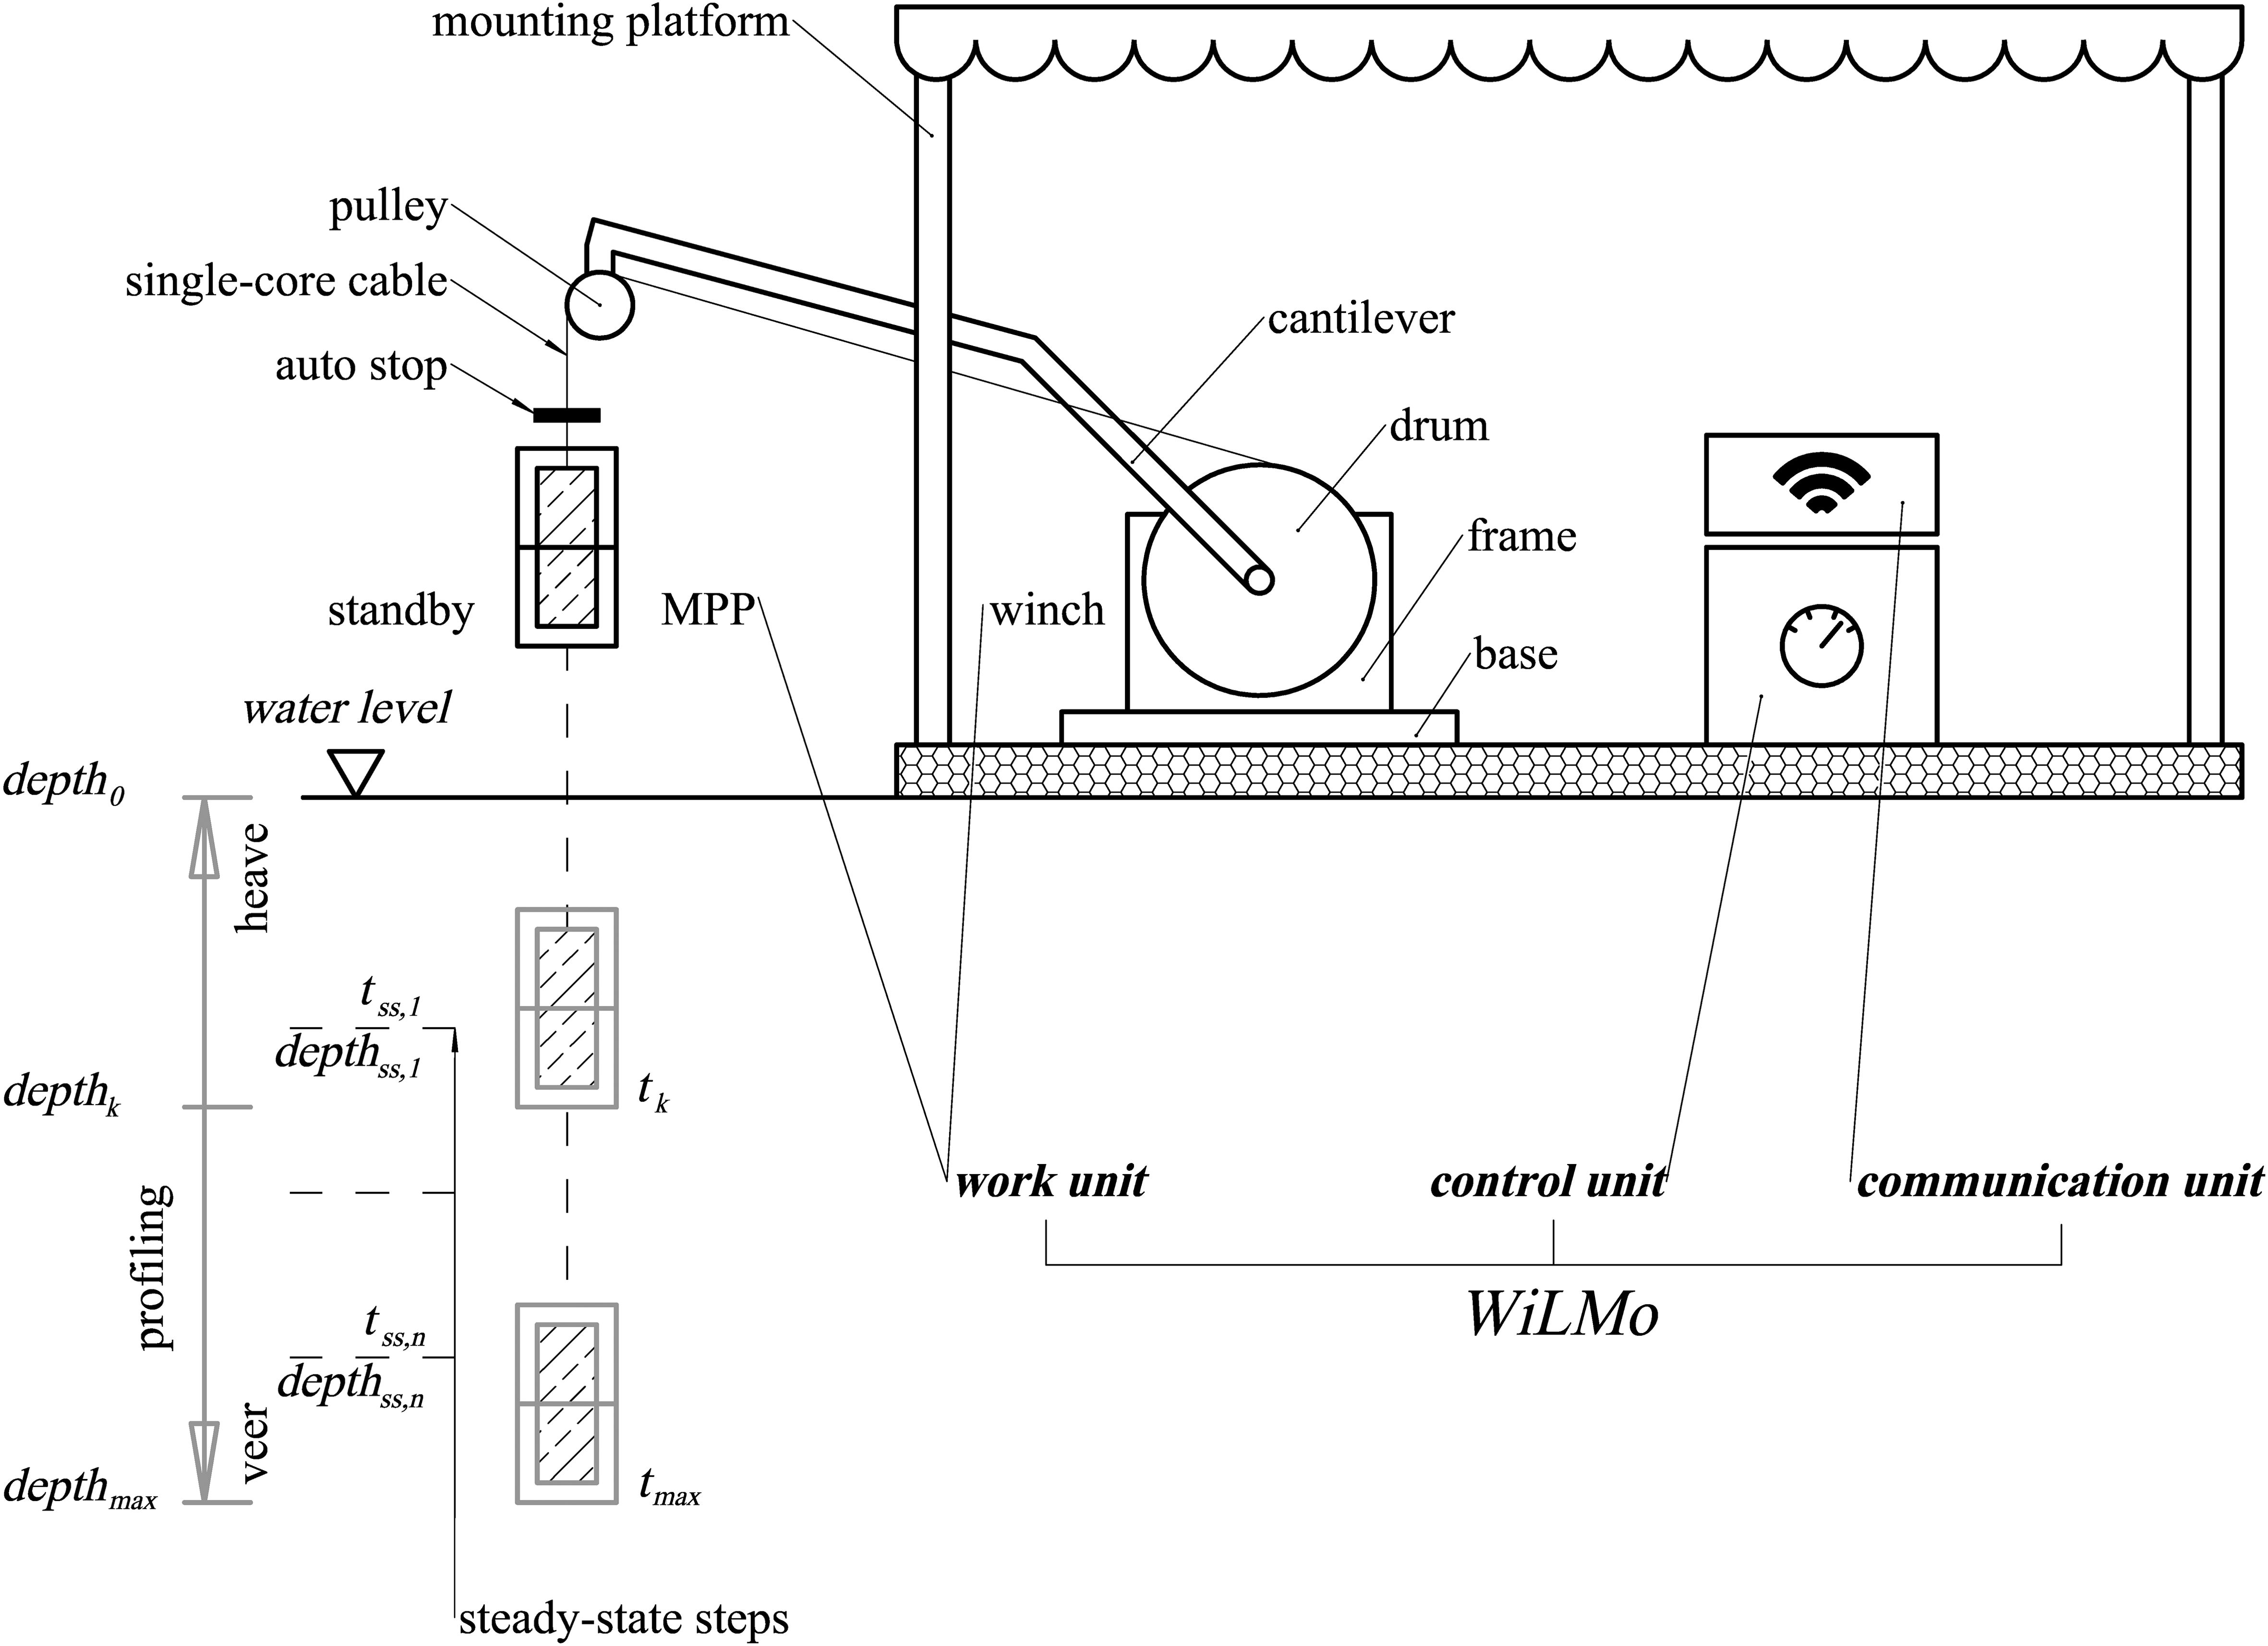
Figure 1. WILMO consists of three basic components. The winch and the multi parameter probe (MPP) (work unit) is securely mounted on a sturdy platform, together with two additional boxes housing the control- and communication units. The MPP is lowered into the water column (veering) periodically with the option to stop at n predefined depths for n predefined times . The MPP is continuously lifted back (heaved) to its initial position after reaching its maximum depth .
In cooperation with the Research Institute for Mariculture (RIM Gondol) and the Indonesian Ministry of Marine Affairs and Fisheries (KKP), WILMO has been deployed on a pontoon ∼ 600 m off the coast of Patas (northern Bali, Indonesia) during a two week campaign in March 2022. The deployment location was chosen for closely monitoring the conditions at adjacent fish farms by sampling several key parameters for sustainable mariculture. In Figure 2 the locations of WILMO (dot), a temperature- and depth diver gauge (Diver04, diamond), two Spotter buoys (WS01, WS02, triangle) and two Sentinel V ADCPs (ADCP01, ADCP02, stars) together with the fish cages (small dots) are shown. More information on all devices are summarized in Table 1 and WILMO is shown in Figure A1. WILMO successfully operated from March 2022 until the end of the campaign in December 2022 and provided time series data of several biogeochemical and physical parameters.
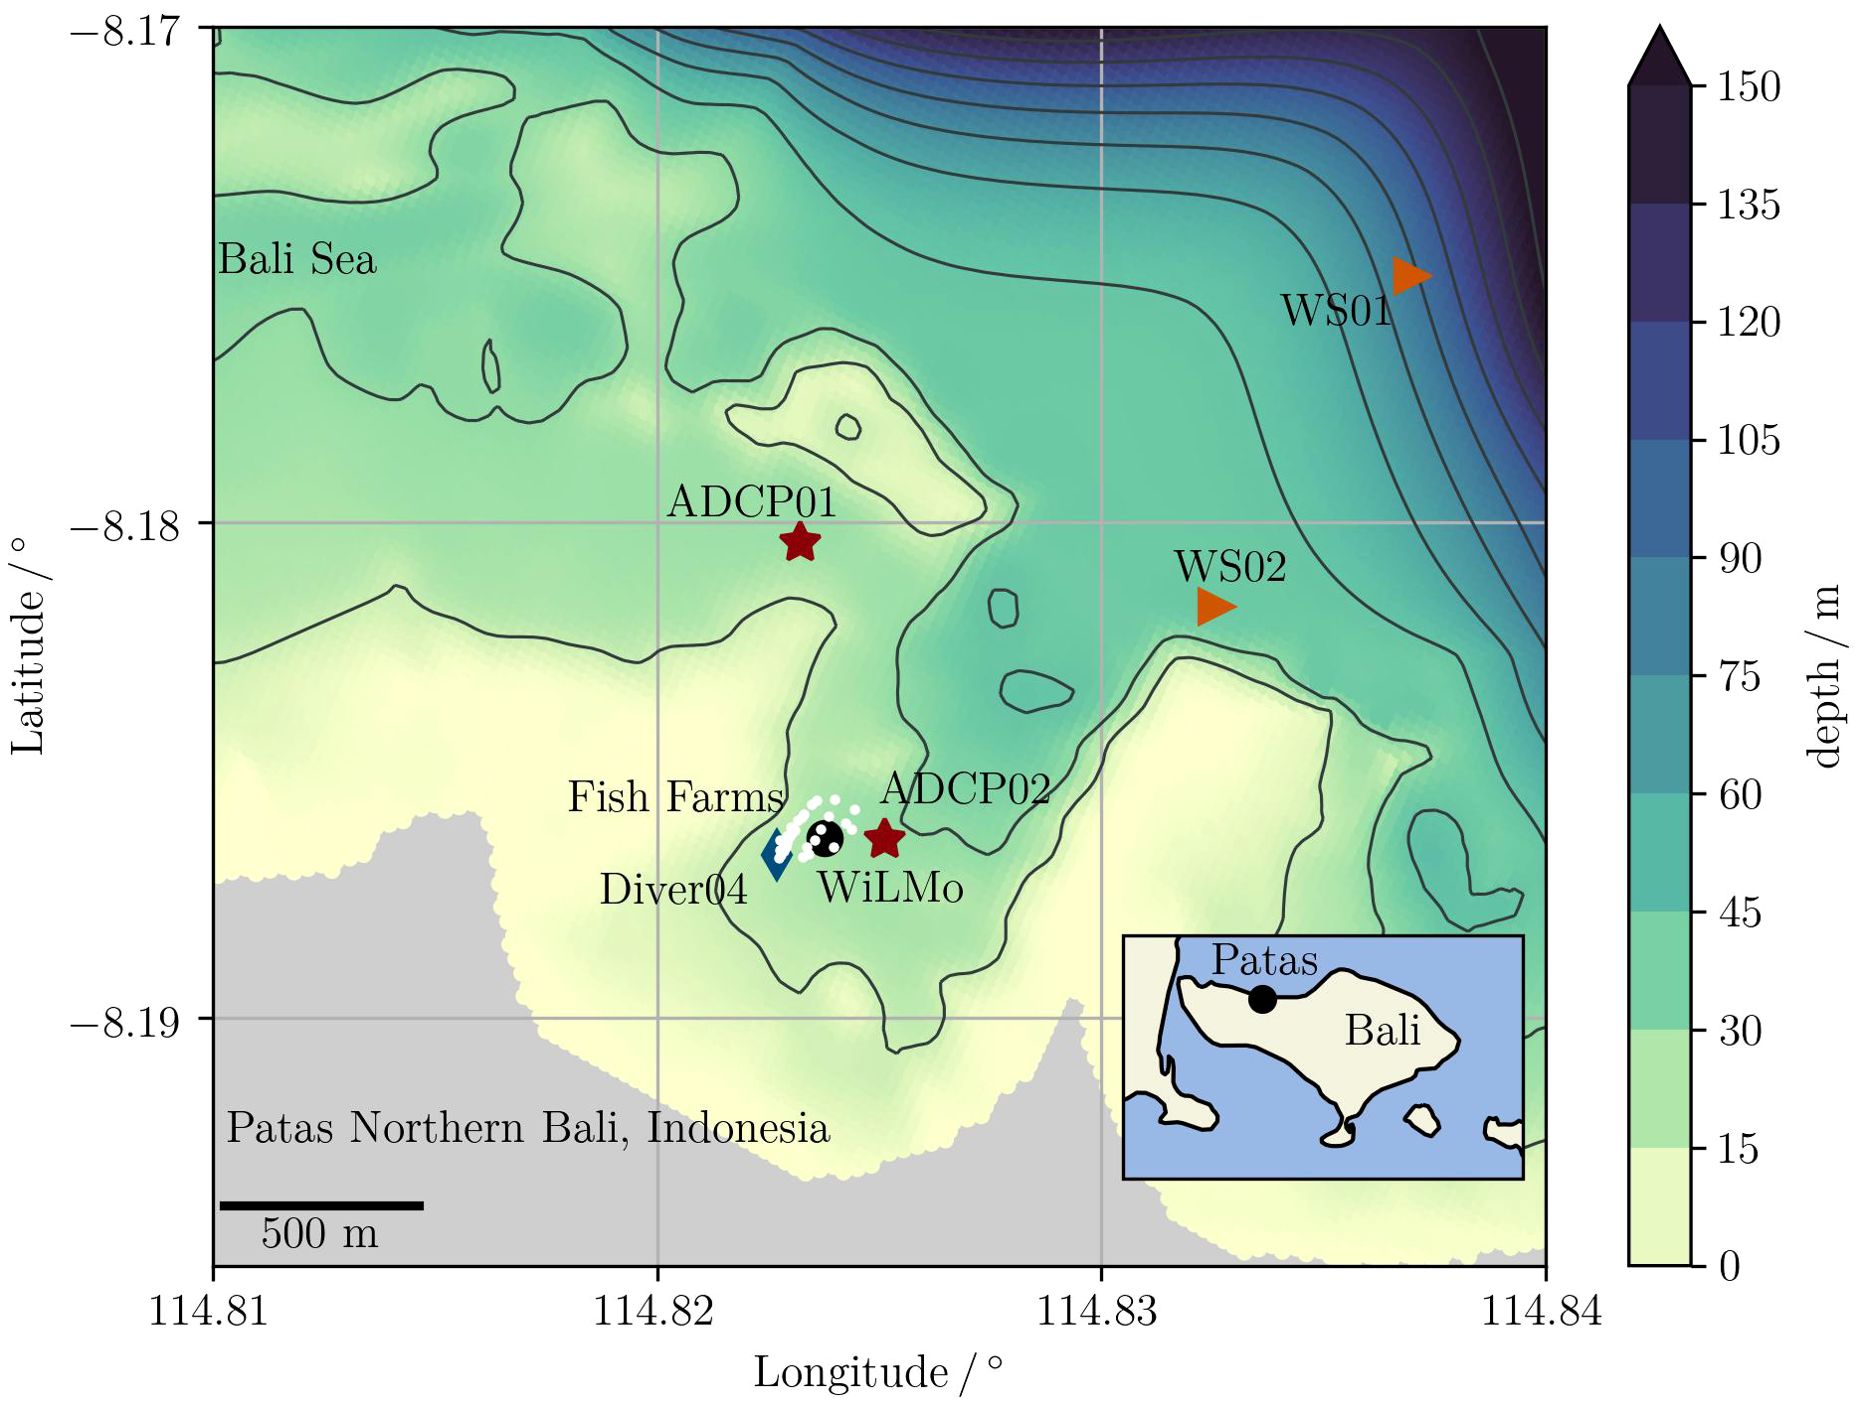
Figure 2. Bathymetric map of the coast of Patas including the locations of WILMO (dot) and other equipment listed in Table 1. The small, white dots are mariculture cages. WILMO is located approximately 500 to 600 m offshore and is mounted on the edge of a trench to profile the approximately 25 m deep water column. The floating platform is typically used as a working platform for the mariculture company’s staff.
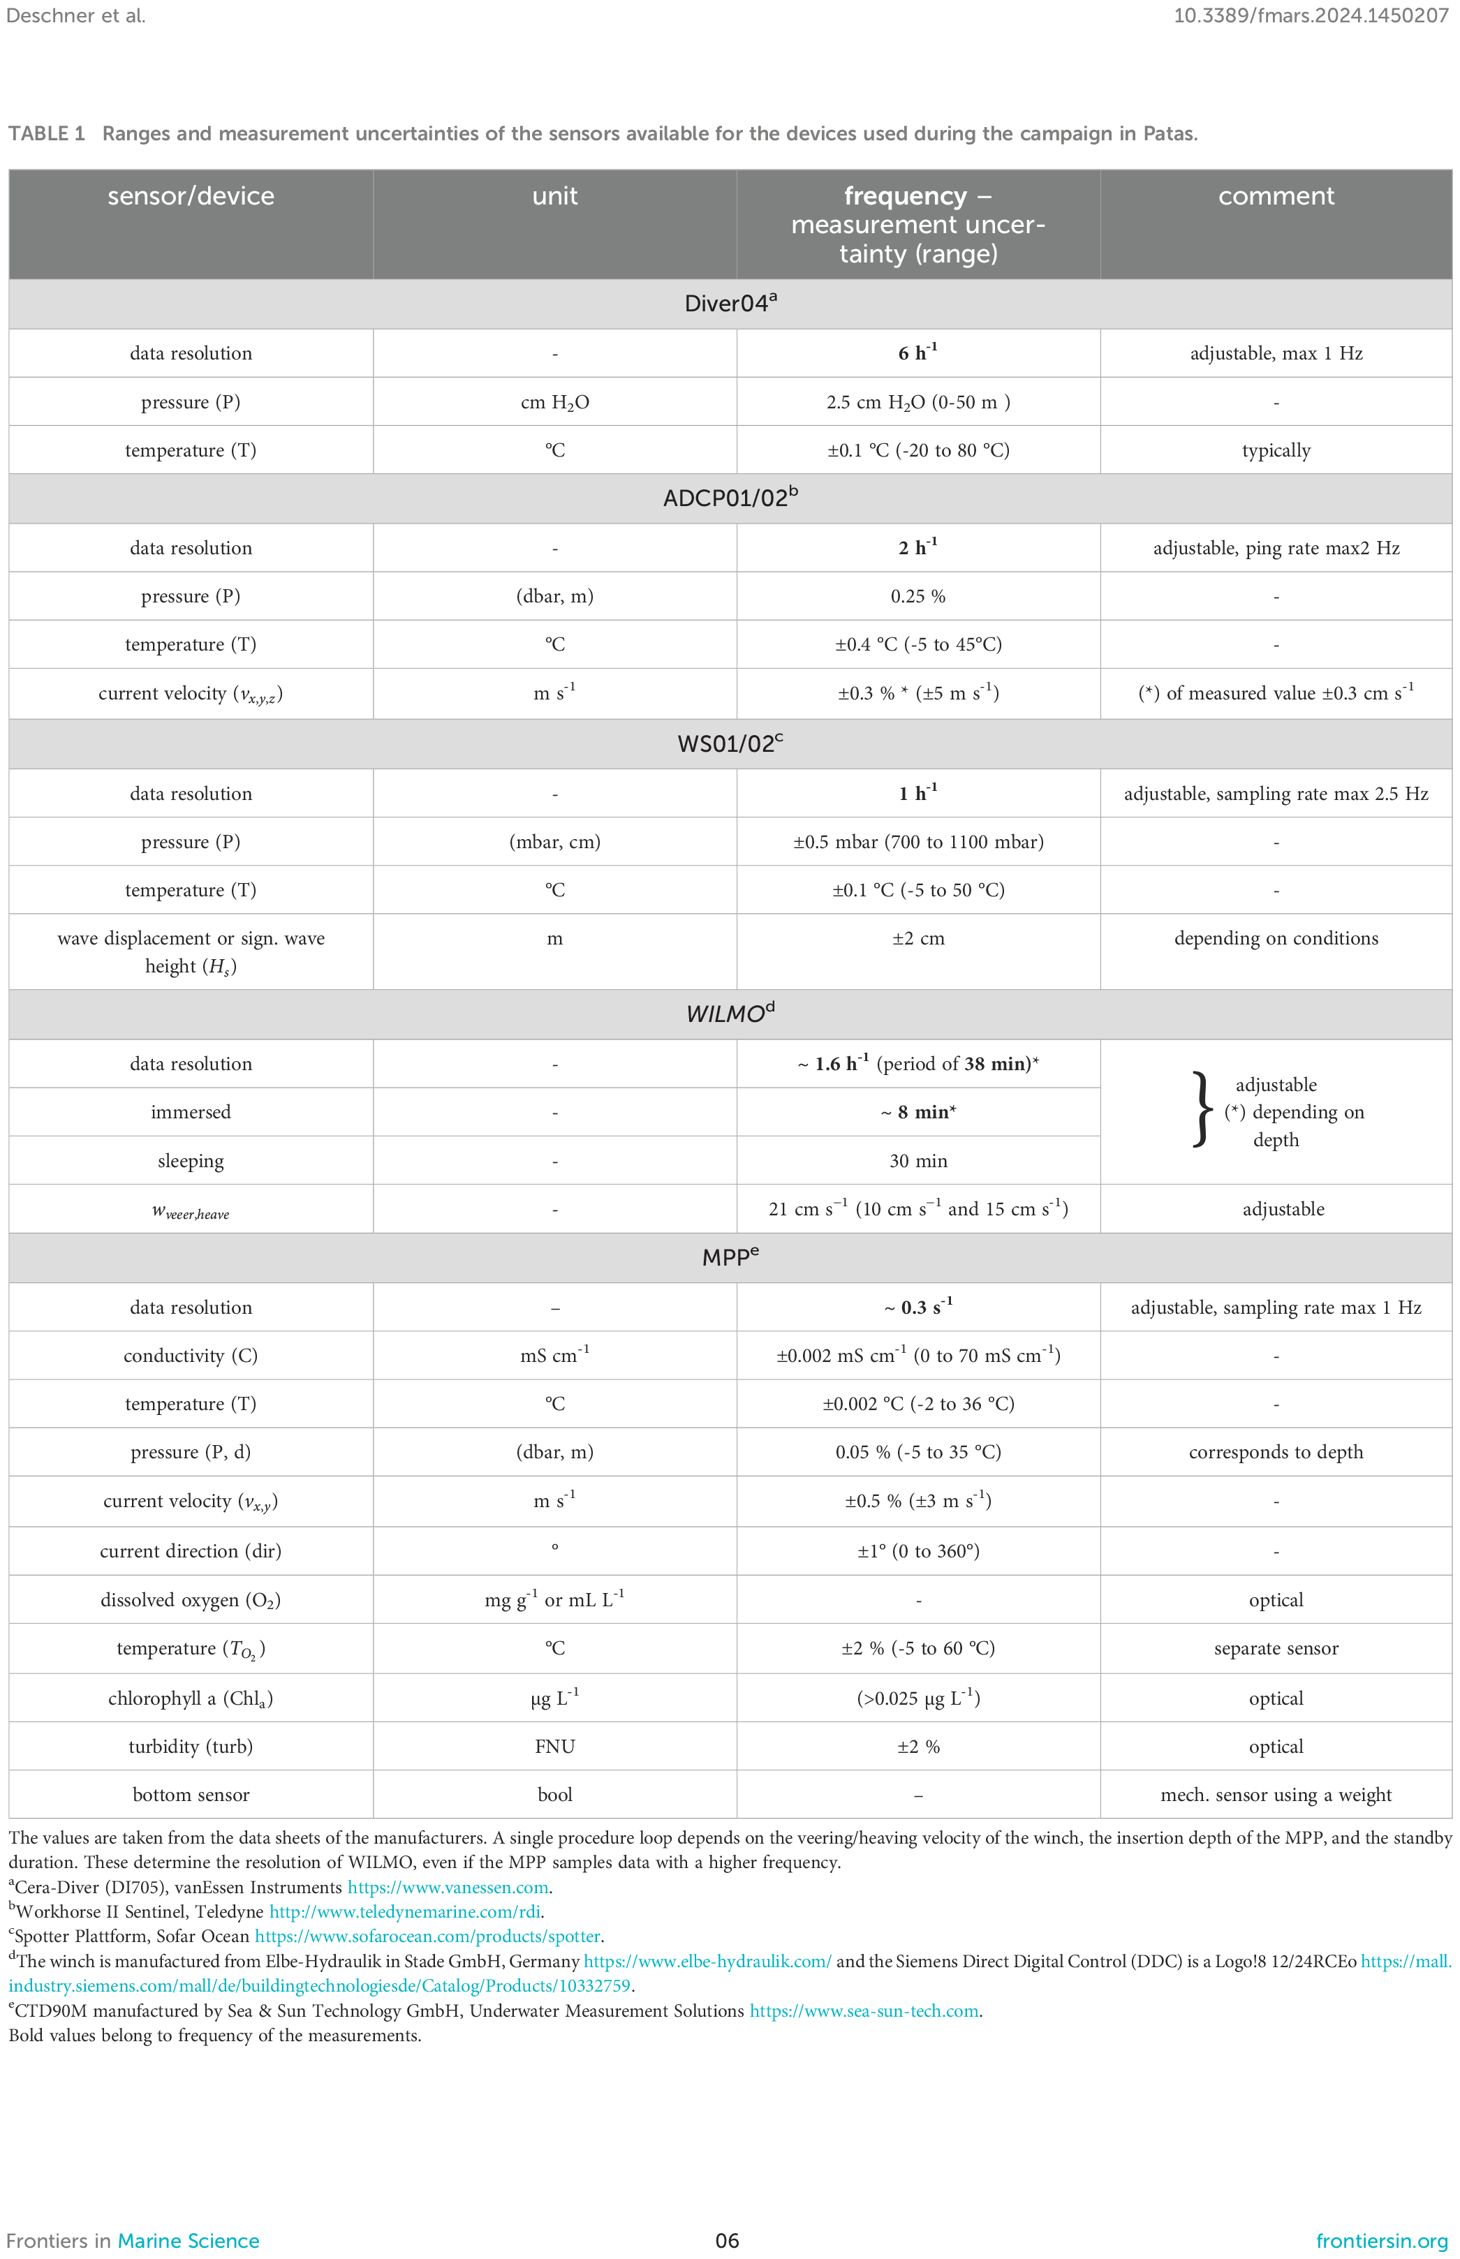
Table 1. Ranges and measurement uncertainties of the sensors available for the devices used during the campaign in Patas.
The campaign data are post-processed with a custom tool intended for filtering, splitting and clustering the campaign data to produce spatio-temporal heatmaps. In addition to technical reliability, the proper functionality of WILMO requires a classification of the measured data. Hence, the plausibility and consistency of particular post processed campaign data are checked. The focus here is on biofouling, temperature, current velocity and conductivity, which are compared to the measurements available from additional instruments used during the campaign.
In the following, the technical specifics of WILMO and its units are described (section 2). Thereafter, the consistency of the post-processed campaign data are checked (section 3). The results will be summarized and discussed in section (4).
2 The novel monitoring system WILMO
Commonly, multi parameter probe (MPP) measurements are performed by hand. Stationary measurements are prone to biofouling (Jin et al., 2021; Park et al., 2021) and the recorded data may begin to drift quickly (Delauney et al., 2010; Venkatesan et al., 2017). The novel system WILMO is designed for both, automated profiling and reduced biofouling. Figure 1 shows a sketch of WILMO and its three functional units: the work unit consists of the winch that raises and lowers the MPP at specific times to measure the water column (section 2.1), the control unit summarizes the electrical hardware components necessary to run all constituents (section 2.2) and the communication unit handles the orchestration of the measuring process and additional devices with a common software framework as well as the data transfer (section 2.3). The MPP sensors are not submerged in standby mode, which drastically reduces the time available for organisms to colonize and thus prevents biofouling from occurring. It requires a mounting platform that protects the system from severe weather but also grants easy access to WILMO. Voluntary local staff take advantage of this to clean the MPP every four weeks (maintenance interval) using a solution of citric acid and distilled water to remove salt crusts. Among other settings, which will be described in more detail later, both the measurement intervals and depth levels are adjustable (see Figure 1). At these levels, the MPP performs steady-state measurements over a specified time. WILMO combines common, reliable and well-known hardware components allowing each constituent to be simply exchanged in case of damage. The manufactures of the current setup are given in Table 1.
2.1 The work unit
The winch is the first part of the work unit with a total weight of ∼ 87 kg and maximum dimensions of 1.8 × 0.7 × 1.8 m. The winch consists of the base and a frame, the cantilever and the pulley and the drum with a single-core cable for load support and data transmission from the MPP. The length of the single-core cable is currently ∼ 150 m which determines the insertion depth . A frequency-controlled geared servomotor operates the winch which is built of stainless steel to sustain rough marine environments. It is large enough to withstand any mechanical exposures but still is manageable by two persons without further technical equipment. Several safety systems are installed for the autonomous operation of WILMO. The final position of the MPP is recognized mechanically in addition to an estimate of the cable position based on the number of rotations of the pulley. Easily accessible emergency stop buttons are attached to the frame and the control box and immediately interrupt the instrument when pressed (see Figure A1). In case of damage or malfunction the magnetic brake of the servo motor can be released manually and the MPP can be heaved with a crank handle.
The second part of the work unit, the MPP (see Table 1) is built of titanium and carries the sensors inside a protection frame (Figure A1). The sensors of the MPP measure conductivity (C), temperature (T) and pressure (P). Additionally, optical sensors measure dissolved oxygen (O2), turbidity (Turb) and chlorophyll a fluorescence . The local flow velocity and its direction (dir) are measured in the horizontal plane. The MPP is equipped with a ground detector that, when triggered, interrupts the measurement and WILMO returns to standby mode i.e. the MPP is heaved to the final position and waits until the next procedure loop starts. If the MPP tears off accidentally, the heaving procedure is performed to protect WILMO from further damage. The red fin (Figure A1) lowers the torsion of the MPP during the measurement. The specifications of the sensors are summarized in Table 1. The sampling rate of the MPP is set to ∼ 0.3 s−1 where a maximum of ∼ 1 s−1 is possible. The temporal resolution is thus very high per procedure loop. However, the duration of a single procedure loop depends on the insertion depth and on the adjustable sleeping- or standby time. Both define the instrument resolution for long-term monitoring.
Each component of the work unit is exchangeable with similar and possibly cheaper devices. This flexibility allows simple replacement when a part is damaged or may reduce the costs for rebuilding WILMO if smaller and/or lighter winches are of interest. This can also be done with the hardware components used for the control- and the communication unit.
2.2 The control unit
WILMO is an integrated system in which all the various and necessary devices (servo drive, camera, LTE router, etc.) must be merged into a common framework. The control unit is the second functional unit which mainly combines these hardware components and grants access to them.
The servo motor together with the servo controller form the servo drive ensuring the independence of the winch speed from the mechanical load. In addition, the servo controller controls the electromechanical motor brake. A Siemens Direct Digital Control (DDC) specifies the speed and direction of rotation of the servo drive. It receives and sends binary signals via its I/O ports as well as strings or floating point numbers via the Modbus protocol. The DDC involves a custom programming interface used for the basic controls of the winch, e.g. the auto stop mechanism where the heaving speed is reduced shortly before the mechanical limit switch is triggered and the MPP returns to its standby position. It is possible to operate WILMO manually with a hardware terminal at the control unit, but also with a built in web interface (Appendix B) or the unifying software (section 2.3). All hardware components are interconnected into a local area network (LAN) and are therefore accessible from any browser. Two LAN cameras (a security cam and a under water camera, see Appendix A) are installed: one to inspect WILMO and mounted underneath the roof of the platform and another one mounted on a pile ∼ 3 m below the water surface to check the MPP and to track the local water conditions visually. All devices intended for sampling data (motor current, pictures and videos, the MPP-data, etc.) are controlled with the unifying software. The required hardware is a Raspberry Pi Model 3+ (RPI) providing sufficient computational power, storage capacity, reliability and ease of use. The connectivity to any of the devices is granted through an LTE modem equipped with a public IP address. The consideration of standard hardware components ensures quick identification and replacement in case of damage, as they are highly available from a wide range of vendors.
2.3 The communication unit
The proximity to the shoreline allows the use of a LTE network and ensures global access to WILMO and its controls. As long as the router is accessible, any LAN device of the control unit can be accessed, configured and rebooted. Hence, together with the unifying software, WILMO solely relies on a stable power source (220V Schuko, CEE 1/4), and for that reason, it is a semi-autonomous device3. The communication unit is the third functional unit of WILMO.
The architecture of the unifying software enables any new module to be run in a separate thread. Therefore, a single main file including the main loop that handles the basic properties of the measurement process is sufficient. The concept is shown in Figure 3, where the light blue boxes denote threaded processes running in parallel as a background job. New modules for additional devices, routines/algorithms or functionalities can easily be added to the system without changing the basic setup. In addition to the pure functionality, threading helps to distribute the CPU load. After the main code is executed, the first step is to read the configuration database. This is important because some threads use it to share information. For example, if the mechanical ground sensor (see the description of the MPP) is triggered, the signal is written into the configuration database without terminating its own thread. The configuration database is easily accessible from another thread intended to interpret the signal and to reset it to its default value. This process is described with interrupt veering/start heaving in Figure 3 and is also valid for the modules running interrupt: sleeping time weather check and winch error?, respectively. To save energy and to save finite LED hours regarding the optical sensors, the MPP gets powered just before a process loop starts. Moreover, to reduce trash data for measurements in air, we start storing the data as soon as the MPP is immersed (start sampling data MPP) and until it emerges again by checking the measured conductivity. If the conductivity value rises to a significantly higher number the data are written until it drops again. From the raw data, the unifying software computes the physical data using instrument-specific calibration constants and both values are stored in a local database. The run steady-state background process verifies the converted pressure value in dbar for in meter and temporarily halts veering for seconds without disrupting any other processes. This allows steady-state measurements with the same sampling rate as during the normal process (see Table 1). The data can be averaged during post-processing as will be described in section 2.4 The values and can be set for any depth, duration and number of steps. Throughout operation, data are written to a web socket and displayed on the web interface designed for setup and inspection (Figure A2). Figure 3 includes the process starting camera controlling the underwater camera. It periodically takes pictures or records a video of the MPP and water conditions after the main loop is executed. As mentioned earlier, the algorithm does not have to wait for this module to finish, which allows for capturing images at predefined times throughout the measurement. The module running interrupting sleeping time weather check checks a predefined value of the institute’s custom monitoring database4. It interprets weather data or data from other instruments and increases or decreases the frequency of measurements by interrupting the standby mode. This allows for increased data availability during severe weather or decreased measuring frequency for safety.
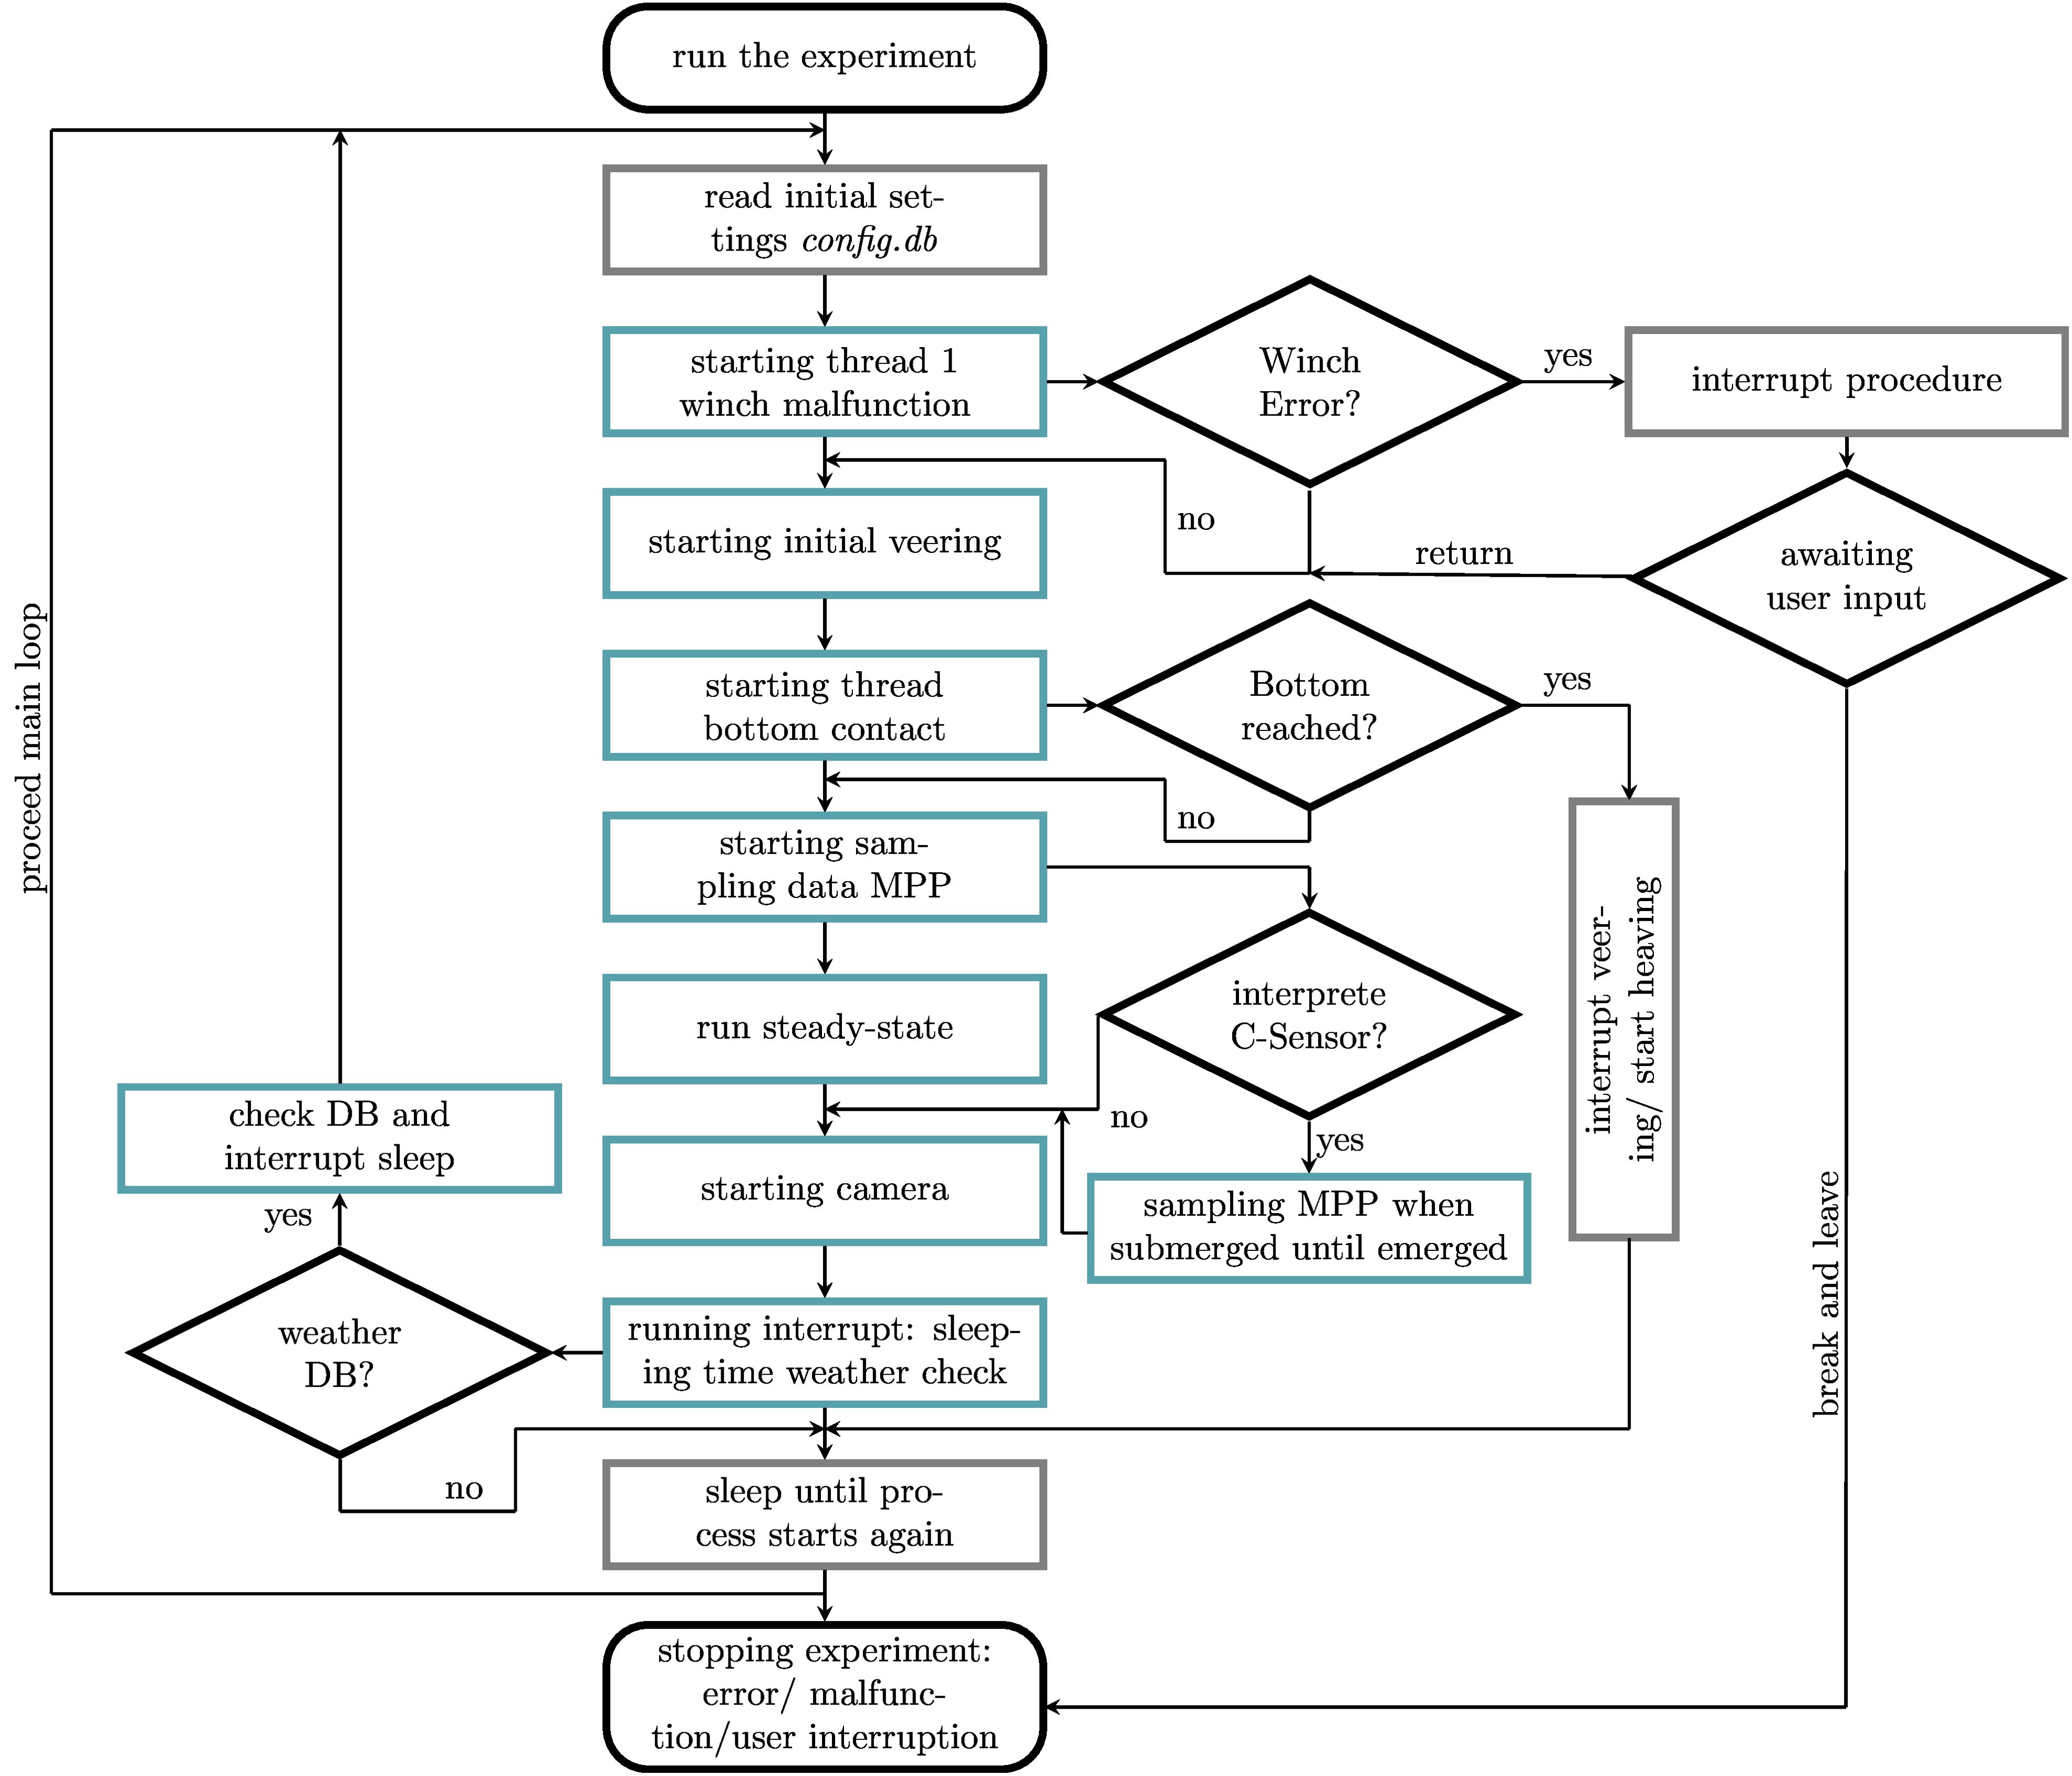
Figure 3. Flowchart displaying the operational processes of WILMO. Light-blue colored boxes mark threaded modules, gray boxes mark single processes and the diamonds a decision instance. New threaded modules can easily be added if one follows the developed framework. Necessary variables can be adjusted in a web interface and stored in a configuration database.
WILMO can easily be set up using a web interface by adjusting all relevant values (Appendix B and Figure A2). A web server is running on the RPI and accessible over LTE. For security reasons, especially when the instrument is operated remotely, performing the setup is only allowed when WILMO is not operating. The web interface allows to start, stop or to reset the measurement. It allows controlling e.g. the LAN cameras (Appendix A) or additional lights, it enables the user to download or to delete the database/the log files and to reboot the RPI. If one of the controls is active, a marker changes its color for clarity. The log file is streamed to the web interface in a different tab. A graph shows the current depth of the MPP, the length of the cable and the motor current5. If strong motor currents are present, the length of the cable is different from the current depth of the MPP because the MPP is deflected. In such cases, we have to be careful when interpreting the data, especially the flow meter. The power consumption of the motor may give rise to malfunctions if something blocks the operation.
The sampled data is requested from a server for adjustable periods and the data transfer is minimized by pulling only the differences between the latest and the current state of the database.
Altogether, the web interface gives the user full control of the device. The LTE modem grants access to WILMO from everywhere, and together with the camera, one can inspect the system in almost real-time. If further adjustments or updates are necessary, the user can access the RPI via a secure shell (ssh) connection.
2.4 Post-processing
Figure 4 shows a typical profile of a measurement cycle performed by WILMO. When the procedure loop starts (triangle), the MPP is veered discontinuously until a predefined maximum depth (diamond). After the maximum depth is reached, the MPP is heaved continuously until the starting position (square). The process starts again when the sleeping time is over or when it is triggered externally (see running interrupt: sleeping time weather check, Figure 3). The interrupting steps in the profile during veering are switchable and adjustable in depth and duration to perform steady-state measurements. This may be of importance regarding the flow meter measuring the velocities strictly in the horizontal plane. If WILMO veers or heaves, the velocities are superposed due to the vertical motion of the MPP. The sampling rate of WILMO (0.3 s−1 (≡ 20 min−1), see Table 1) is the same throughout the measurement cycle. In post processing, the user can decide to return all the data per step or to compute and return their mean value together with its standard deviation. The current setup in Bali (Figure 4) takes about 8 min for a single procedure loop, restarting every 30 min and therefore, a new dataset is sampled every 38 min. The latter number is the resolution limit for the current setup of WILMO, meaning processes faster than 38 min cannot be resolved6. However, this is adjustable and depends on the insertion depth of the MPP.
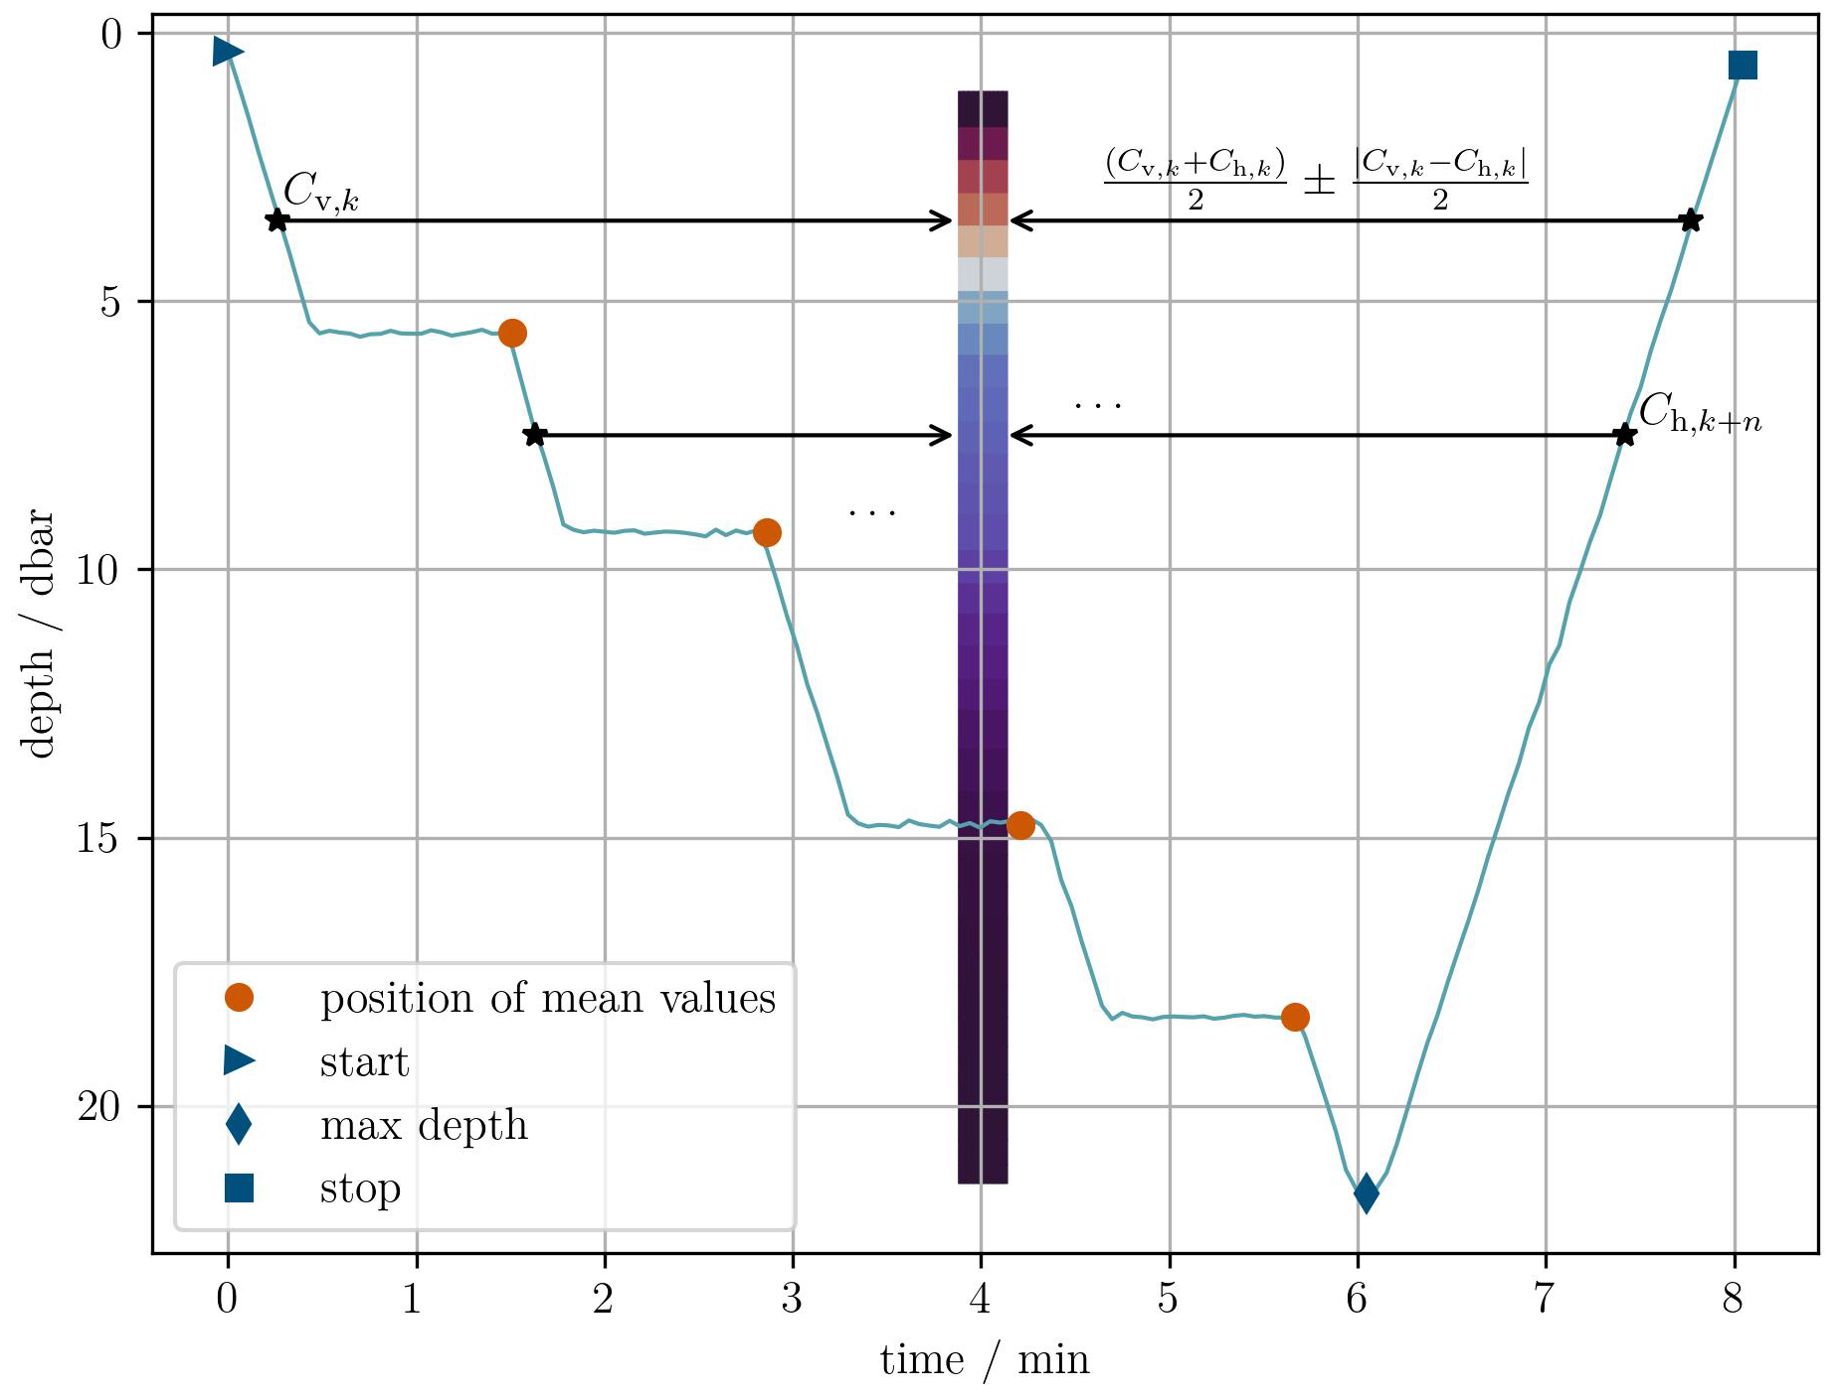
Figure 4. A typical profile measured from WILMO. The blue triangle, diamond and square mark the start, maximum depth and stop of a single measurement cycle. The dots mark 5 steady-state measurements, where the depths and durations for an arbitrary number of stages are separately adjustable. These stages are important for more accurate flow velocity measurements. The asterisks mark a single value for the same depth each token during veering and heaving (see post processing steps I to VII).
The following steps are performed for post-processing:
I. Identify every procedure start, stop, the maximum depth and the time of each of the starts and stops of the steady-state measurements.
II. Identify outliers (unfortunately, the conductivity data contain sporadical and unphysical jumps).
III. Compute the mean values and the standard deviation for each of the steady-state steps.
IV. Optional: compute the mean values and the standard deviation of the veering and heaving datasets, e.g. for reconstruction of missing data (select whether to compute the mean values or just use the values for veering).
V. Compute additional data, e.g. the kinematic viscosity, absolute salinity etc. by taking advantage of the TEOS-10 standard library (McDougall and Barker, 2011; Feistel et al., 2010; Roquet et al., 2015; Fofonoff and Millard, 1983).
VI. Save the prepared data in a new table in the database.
VII. Exclude steady-state data points from the dataset and reorganize the data for spatiotemporal (depth & time) heatmaps for selectable measured parameters. The steady-state data are provided as 1D time dependent lines.
The post-processing tool also allows to recompute the raw data to achieve the physical data. It is crucial to validate step (IV) for each parameter individually (see Figure 4). In section (3.2.3) we use step (IV) after removing artificial jumps in the conductivity data to increase the number of available data points and demonstrate that the occurring error is within the sensor accuracy.
3 Quality assurance
Figure 5 displays the recording intervals from the measurement campaign in Patas, which will be used in the following. Each of the devices together with the periods chosen to validate the performance of WILMO through comparison (gray boxes) are given. The campaign data from WILMO are interrupted and indicate missing data due to maintenance and malfunctions. The malfunctions were predominantly due to power outages, which will be discussed in section (4.1).
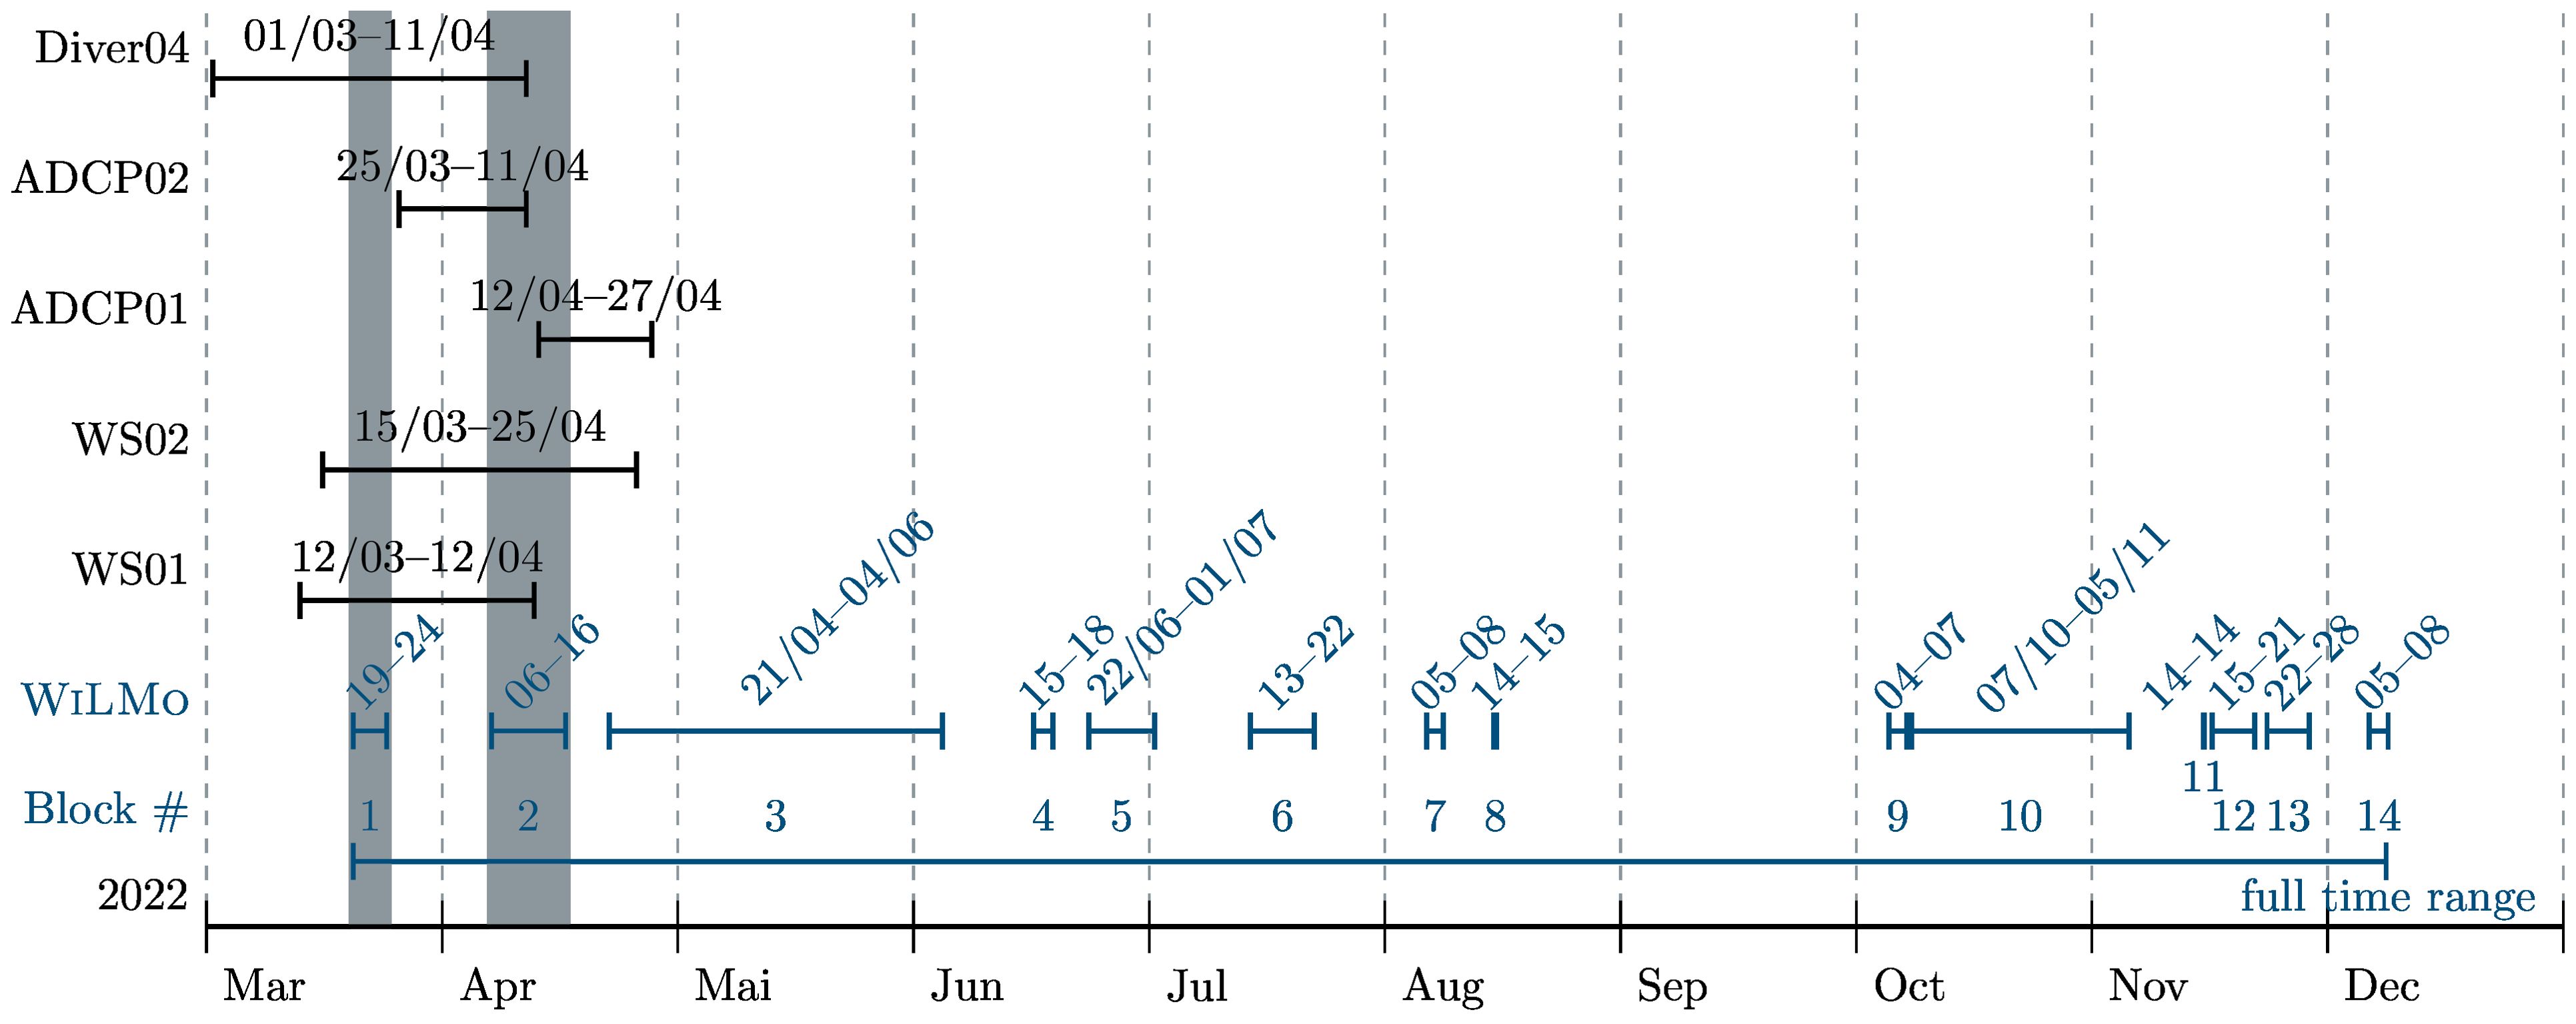
Figure 5. The instruments used during the measuring campaign in Patas in 2022, along with their corresponding sampling durations. Gray blocks indicate overlapping periods for instrument comparisons. Data gaps occurred primarily due to power outages and hardware failures (see also section 4.1).
This section begins with a visual inspection that demonstrates the effective reduction of biofouling after several weeks of measuring. Indeed, no sensor drift or deviations of the data were found during the entire measuring campaign.
A consistency check is performed by comparing the data from various devices. Despite the instruments measuring at slightly different locations, at slightly different depths, and with varying precision, the data is still comparable. It is important to note that this test is not an intercalibration, and differences in the data are expected. However, the data should still exhibit a similar trend. This investigation will confirm the performance and reliability of WILMO, especially as the MPP is a highly precise instrument (Table 1). It is calibrated under laboratory conditions and profiling is a very common method for CTD measurements. With this in mind, the temperature-, velocity- and conductivity sensor data are investigated.
3.1 Validation of reduced biofouling
The collected dataset shows no obvious drift of any of the sensors. A quantitative comparison between different devices is hard to do, because comparative values are only available for relatively short periods (5 days each in April and Mai, Figure 5) and for different locations. Nevertheless, a clear statement can be made by visual assessment of WILMOs sensors in comparison with a diver gauge (Diver04, see Figure 2) during corresponding periods. Figures 6A, B show WILMO after one and after 4 weeks of operation. There is little change to the MPPs surface except for a thin crust of salt. The seawater that moistens the MPP evaporates in the sun, leaving behind a thin layer of salt. Minor biofouling attachments appear in the shape of small patches that can be easily removed. In contrast, the Diver04 (Figure 6C, attached to a pipe and installed on the seafloor in ∼ 26 m depth) is shown after an observation period of 6 weeks. About 3 mm of slimy organic coats of fouling assemblages cover the device. Some organisms are firmly attached and could hardly be removed as shown in the more detailed Figure 6D. However, the temperature and depth data records are not affected. The observation confirms that the intensity of growth of marine fouling is closely related to the exposure period and type of surface material (e.g. Muthukumar et al., 2011). In the case of optical sensors, Figure 6E compares the two longest coherent periods for dissolved oxygen, chlorophyll a fluorescence, and turbidity. Over the course of the 6 (4) weeks observation period the daily variation is clearly apparent; however, a temporal drift of dissolved oxygen is not discernible. The concentration of dissolved oxygen is slightly higher during the dry season. The chlorophyll a fluorescence increases strongly after ∼ 3 to 4 weeks manifesting in both seasons. This phenomenon is linked to biofouling and can also be observed in turbidity during May, but not during October. However, in the case of turbidity an erroneous measuring range might be set7 because values below ∼ 0.2 FNU appear to be exceedingly small and necessitates more effort to achieve a meaningful correlation. Nevertheless, the cleaning period of ∼ 4 weeks seems reasonable for WILMO.
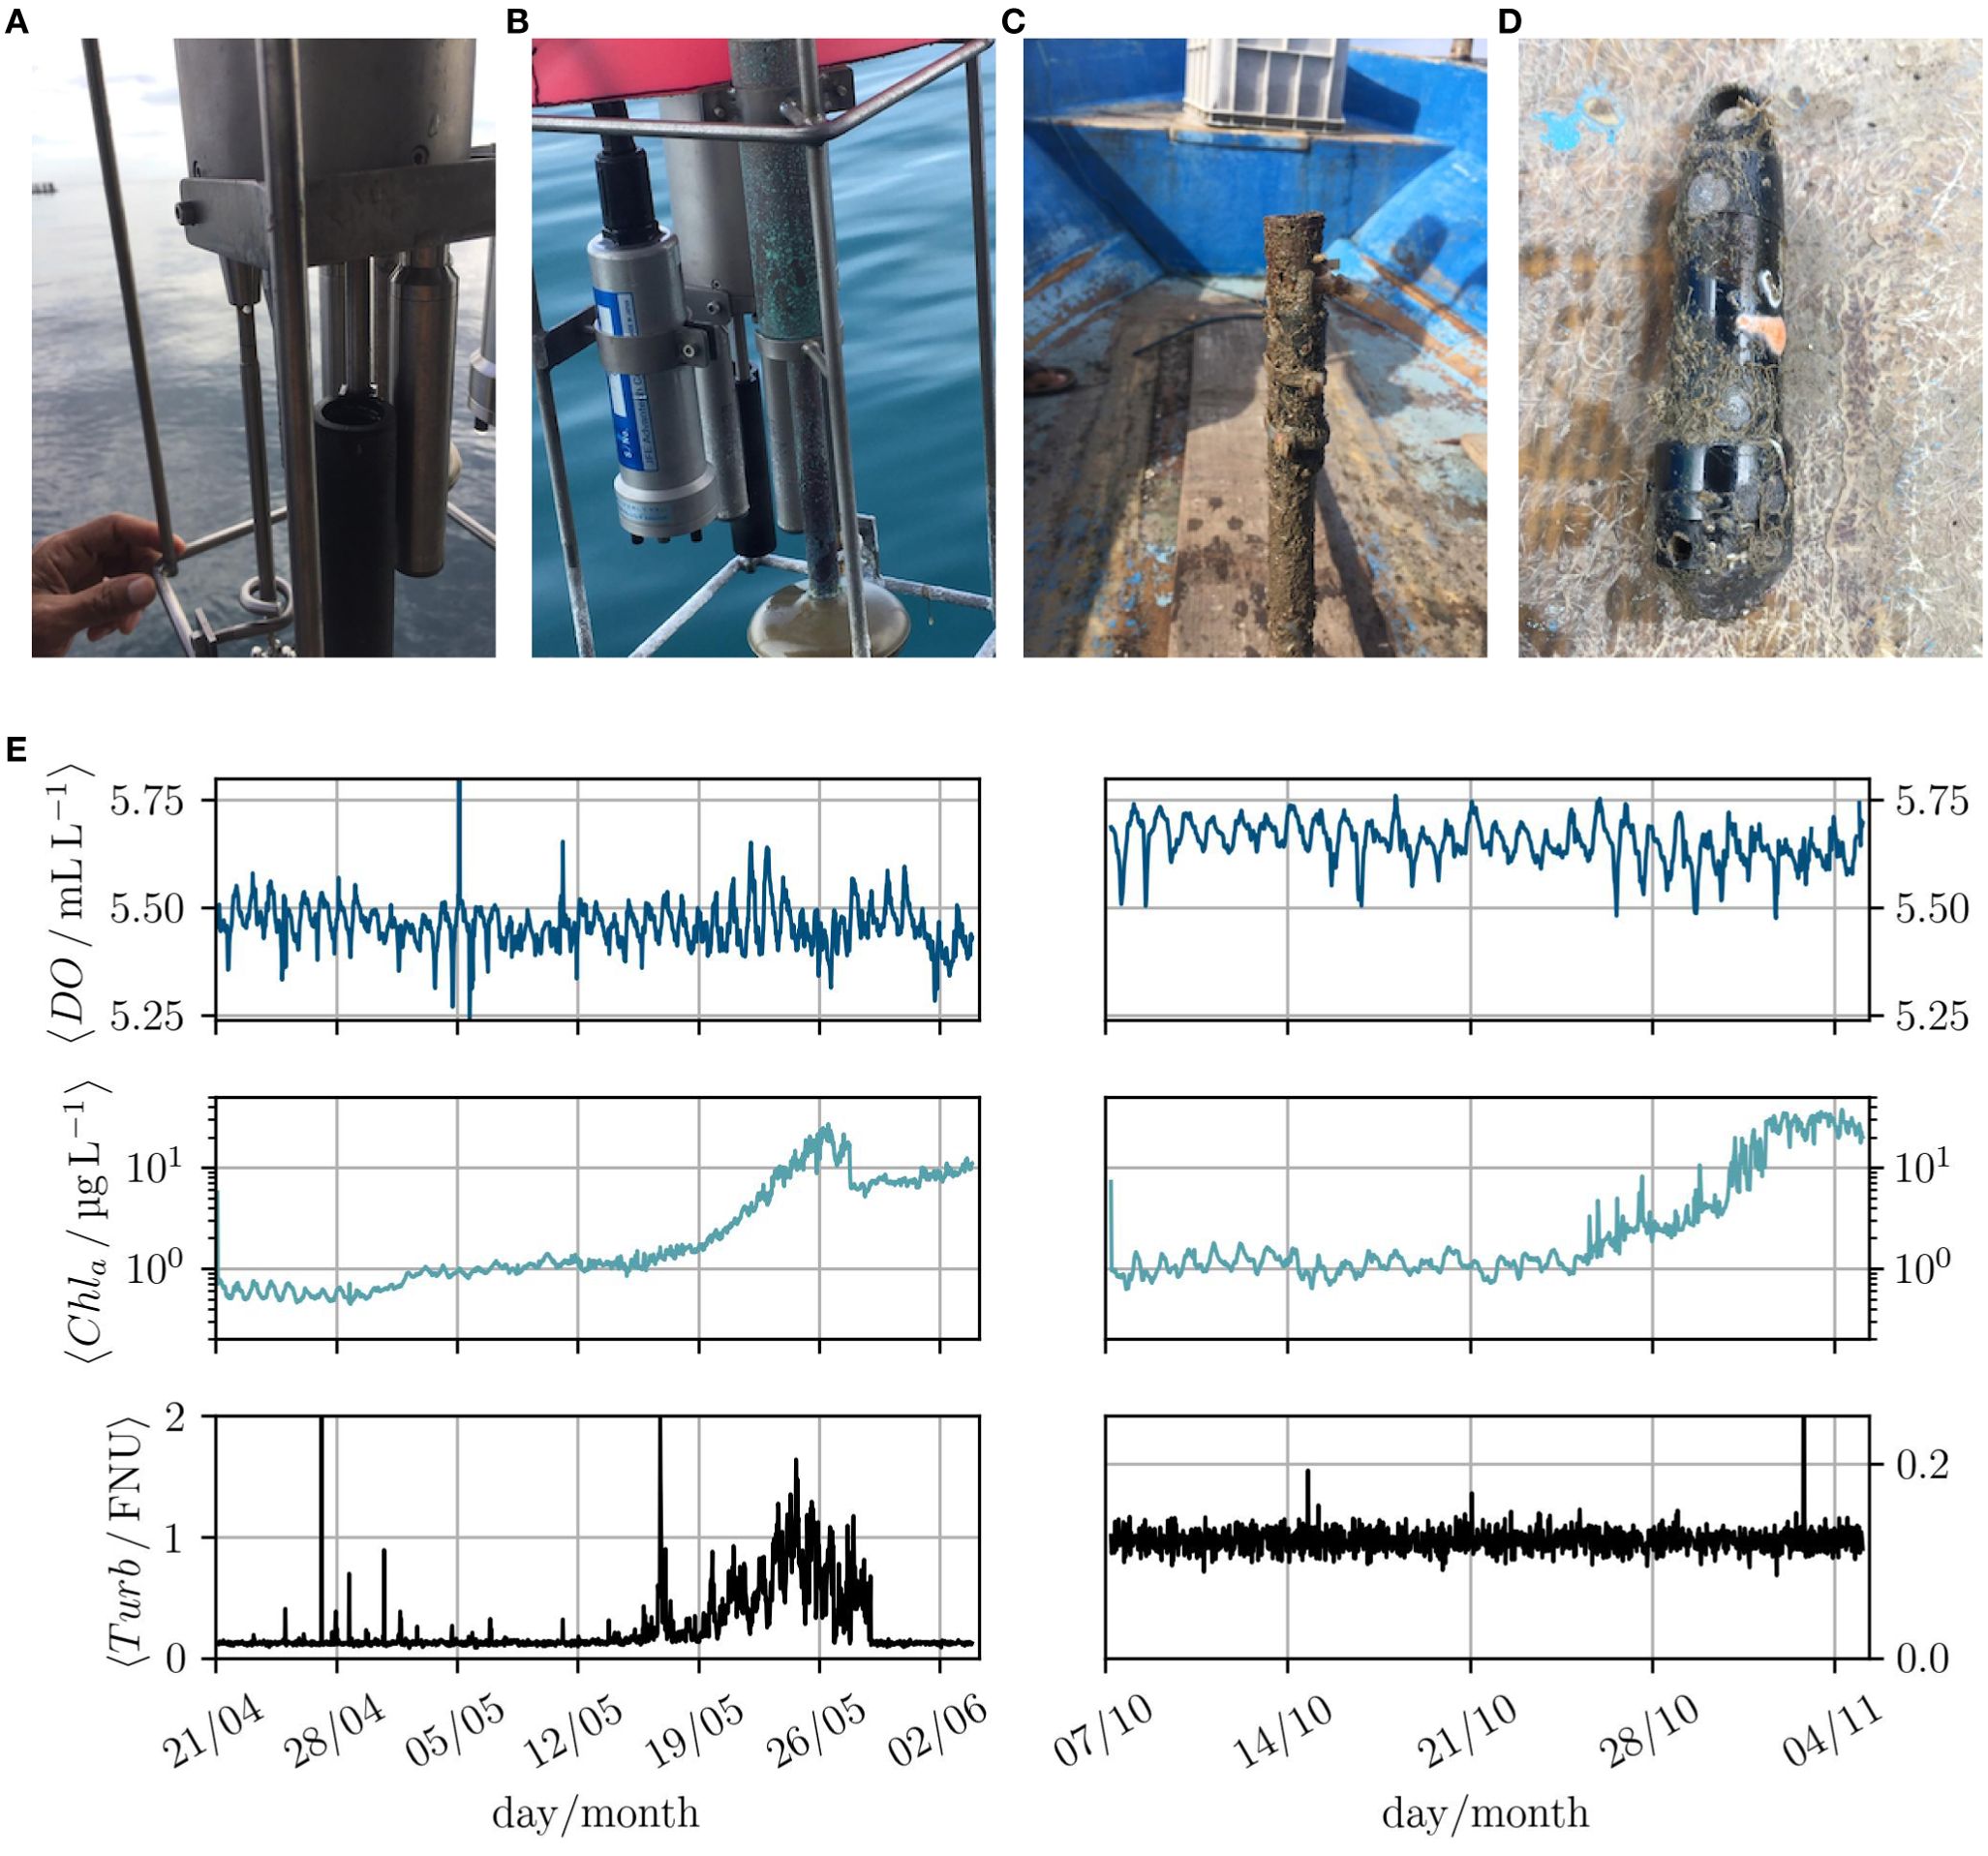
Figure 6. A comparison between the MPP and Diver04 regarding the influence of biofouling. After one week (A) and after four weeks (B), the MPP merely shows any fouling on its surfaces. The Diver04 was anchored on a pile (C) in the seabed at a depth of approximately 26m. After six weeks of operation, the Diver04 clearly exhibits fouling on its surface (D).Depth averaged values for dissolved oxygen, chlorophyll a fluorescence, and turbidity for block 3 & 10 (Figure 5) during the wet- and the dry season are given in (E).
Essentially, the effectiveness of WILMO in suppressing biofouling may be deduced to three main reasons: (i) the short residence time in the seawater (8 min) makes it difficult for the fouling organism to attach to the sensors, (ii) the relatively long exposure to solar UV radiation (30 min) of the MPP destroy any marine organisms settling on the sensors (iii) the quick evaporation of seawater and the salt coats destroy any organisms that might attach to the sensors. The argument (ii) is based on the findings of Coohill and Sagripanti (2009), who demonstrate the effectiveness of inactivating bacteria using UVA and UVB radiation, which is naturally present in solar light at the Earth’s surface. Similarly, this is reviewed and demonstrated for natural organic matter in water by Nelson et al. (2018). The primary method of technical prevention of biofouling is the use of UVC radiation (Ryan et al., 2020). Therefore, WILMO effectively suppresses biofouling and reduces the need for the use of chemicals or elaborate mechanics.
3.2 Data plausibility and consistency
The plausibility of WILMOs data are checked against different other devices deployed nearby and during the same period. It is not possible to compare the results exactly, because of the different locations, if relevant, their different depth and the different measuring frequencies of the devices. However, the data must be consistent in the sense of being related in the same way, where offsets in magnitude and minor temporal shifts are expectable.
3.2.1 Temperature measurements
The wave buoy (WS02, Figure 2) floats on the water surface and the diver gauge (Diver04) is mounted on the seafloor and both devices measure the temperature (Table 1). Hence, WILMOs data are filtered for the temperatures close to the surface at 1 m depth and 22 m closest possible depth to the ground. The grey-colored boxes shown in Figure 5 mark time intervals for simultaneous measurements, where we first focus on the temperatures measured from March 19 to 24 (Figure 7A) and from April 6 to 11 (Figure 7B). Overall, the surface- and ground temperatures are well aligned with each other. During March, the temperatures at the ground show a constant offset to the Diver04 data of ∼ 0.3 to 0.5 °C. Statistical data for the temporally averaged temperatures ) are summarized in Table 2, where the mean squared error (RMS) describes the variability of the temperatures from different devices. Pearson’s correlation coefficient (ρ) is a measure of linear correlation between the data of different devices. For the reasons given above, we expect a higher RMS and if the data are consistent ρ close to unity.
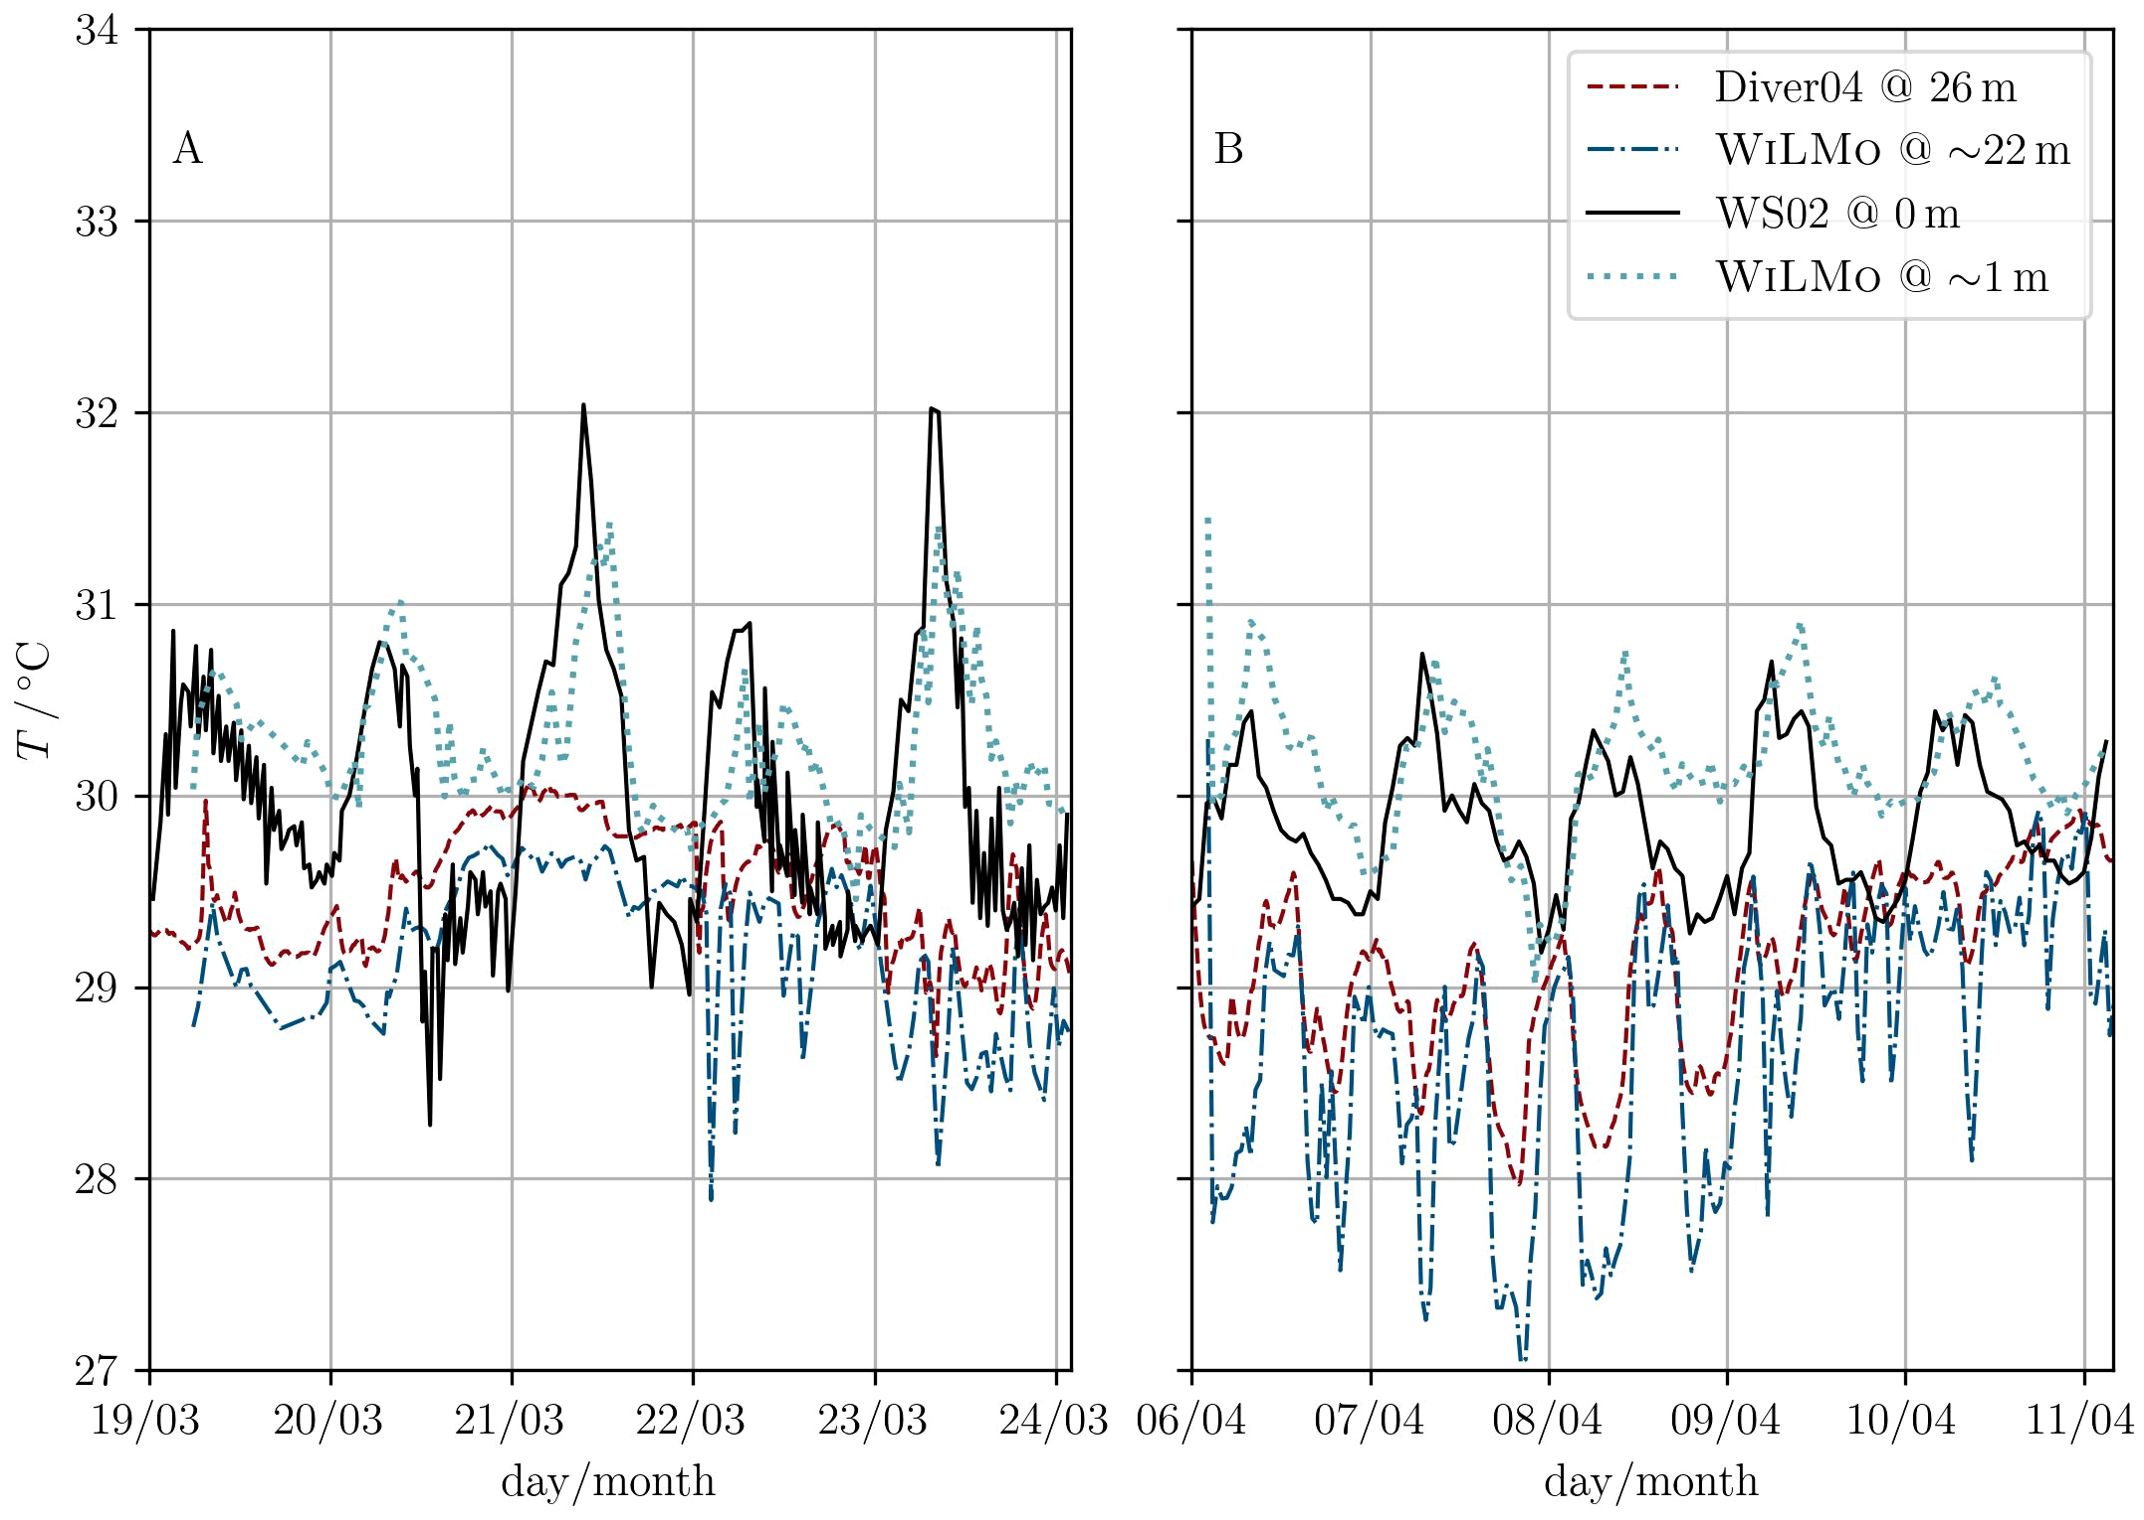
Figure 7. Temperature measurements in comparison between WS02, Diver04 and WILMO at ∼ 1 m and ∼ 25 m depth for two different periods. The duration of each period spans 5 days, during the months March (A) and April (B). The deviations are of order ∼ 0.1 °C and show the same temperature variations. The deviations are predictable because of slightly different locations, depths and instrument specifics.
The RMS ∼ 0.4 is relatively small compared to the mean temperature and Pearsons’ correlation coefficient ρ ∼ 0.8 states good correlation of the data. At the surface and in comparison to WS02, the error increases RMS ∼ 0.6 and the correlation coefficient drops to ρ ∼ 0.55 which is related to a higher variance in the WS02 data. Referring to Figure 2, WS02 is deployed more than 600 m away from WILMO. The computed numbers expectably differ, but show very similar behavior and hence are considered as consistent. During April (Figure 7B) the results are comparable to those of March: RMS ∼ 0.6, high correlation ρ ∼ 0.8 and higher variance for WILMOs data in case of the ground temperatures and a RMS ∼ 0.5 with lesser correlation ρ ∼ 0.5 at the surface. The higher RMS may be explained by steeper temperature drops measured by WILMO in comparison to the Diver04, however, the data are again well aligned. Moreover, as the RMS depends on the scale of the magnitude, all of the data are well aligned. Due to the different sampling rates of ∼ 0.1 min−1, ∼ 0.01667 min−1 and ∼ 20 min−1 for the Diver04, WS02 and WILMO, respectively, the amount of data must be reduced to calculate the RMS and Pearsons’ correlation coefficient. The maximum reduction factors are ∼ 5.3 (∼ 1.9) for final datasets of 138 (389) datapoints at the ground and ∼ 1.4 (∼ 0.3) for final datasets of 398 (124) data points at the surface regarding March (April). This leads to poorer statistics and weaker correlations for a qualitative comparison, but quantitatively the data are consistent.
3.2.2 Flow velocity measurements
A similar investigation for the more complex current meter is performed, especially since this sensor is restricted to only two velocity components () in the horizontal plane. However, WILMO adds a vertical velocity component in the z-direction through veering and heaving ( = 21 cm s−1, Table 1) and there is the vertical velocity component of the flow itself . Both effects distort the measured signal, where the first effect adds additional ram pressure when veering and turbulent boundary effects when heaving the MPP8. The second effect causes a similar deflection but with a different magnitude since in general . Both effects lead to a stronger deflection of the electrical field between the sensitive electrodes of the device and hence to over- or underestimated data. Unfortunately, the magnitude of this bias is presumably different in both directions and completely unknown. The quality of the measured data must be examined, because the order of magnitude of the veering/heaving velocity ∼ −1) is the same or even higher than that of the velocity field of the water body itself ∼ −2 to −1).
The data from WILMO compared to those from the ADCP02 at a distance of ∼ 150 m (Figure 2) are used to assess the quality of the local flow velocity. The maximum values of v with the steady-state data points removed in the case of WILMOs data are qualitatively comparable (2 to 3 dm s−1) to those measured by the ADCP02 (Figures 8A, B). WILMOs minimum flow velocities are higher throughout the given time range and the contrast between maximum and minimum velocities is much smaller. However, high flow velocity patterns with corresponding durations (Figures 8A, B) as well as similar patterns for low flow velocities can be observed. Figure 8C9 shows the residual and confirms that (reddish patterns). White patterns are aligned with the small flow velocities present in the ADCP data, and bluish patterns mean . The magnitude of the residual is of the order of the flow velocity itself, hinting at little comparability of the data. Nevertheless, not the velocity magnitude, but the visible patterns are comparable and the two instruments measure the same features. It is not possible to decide whether this is caused by the bias on the current meter or by the different locations of the devices.
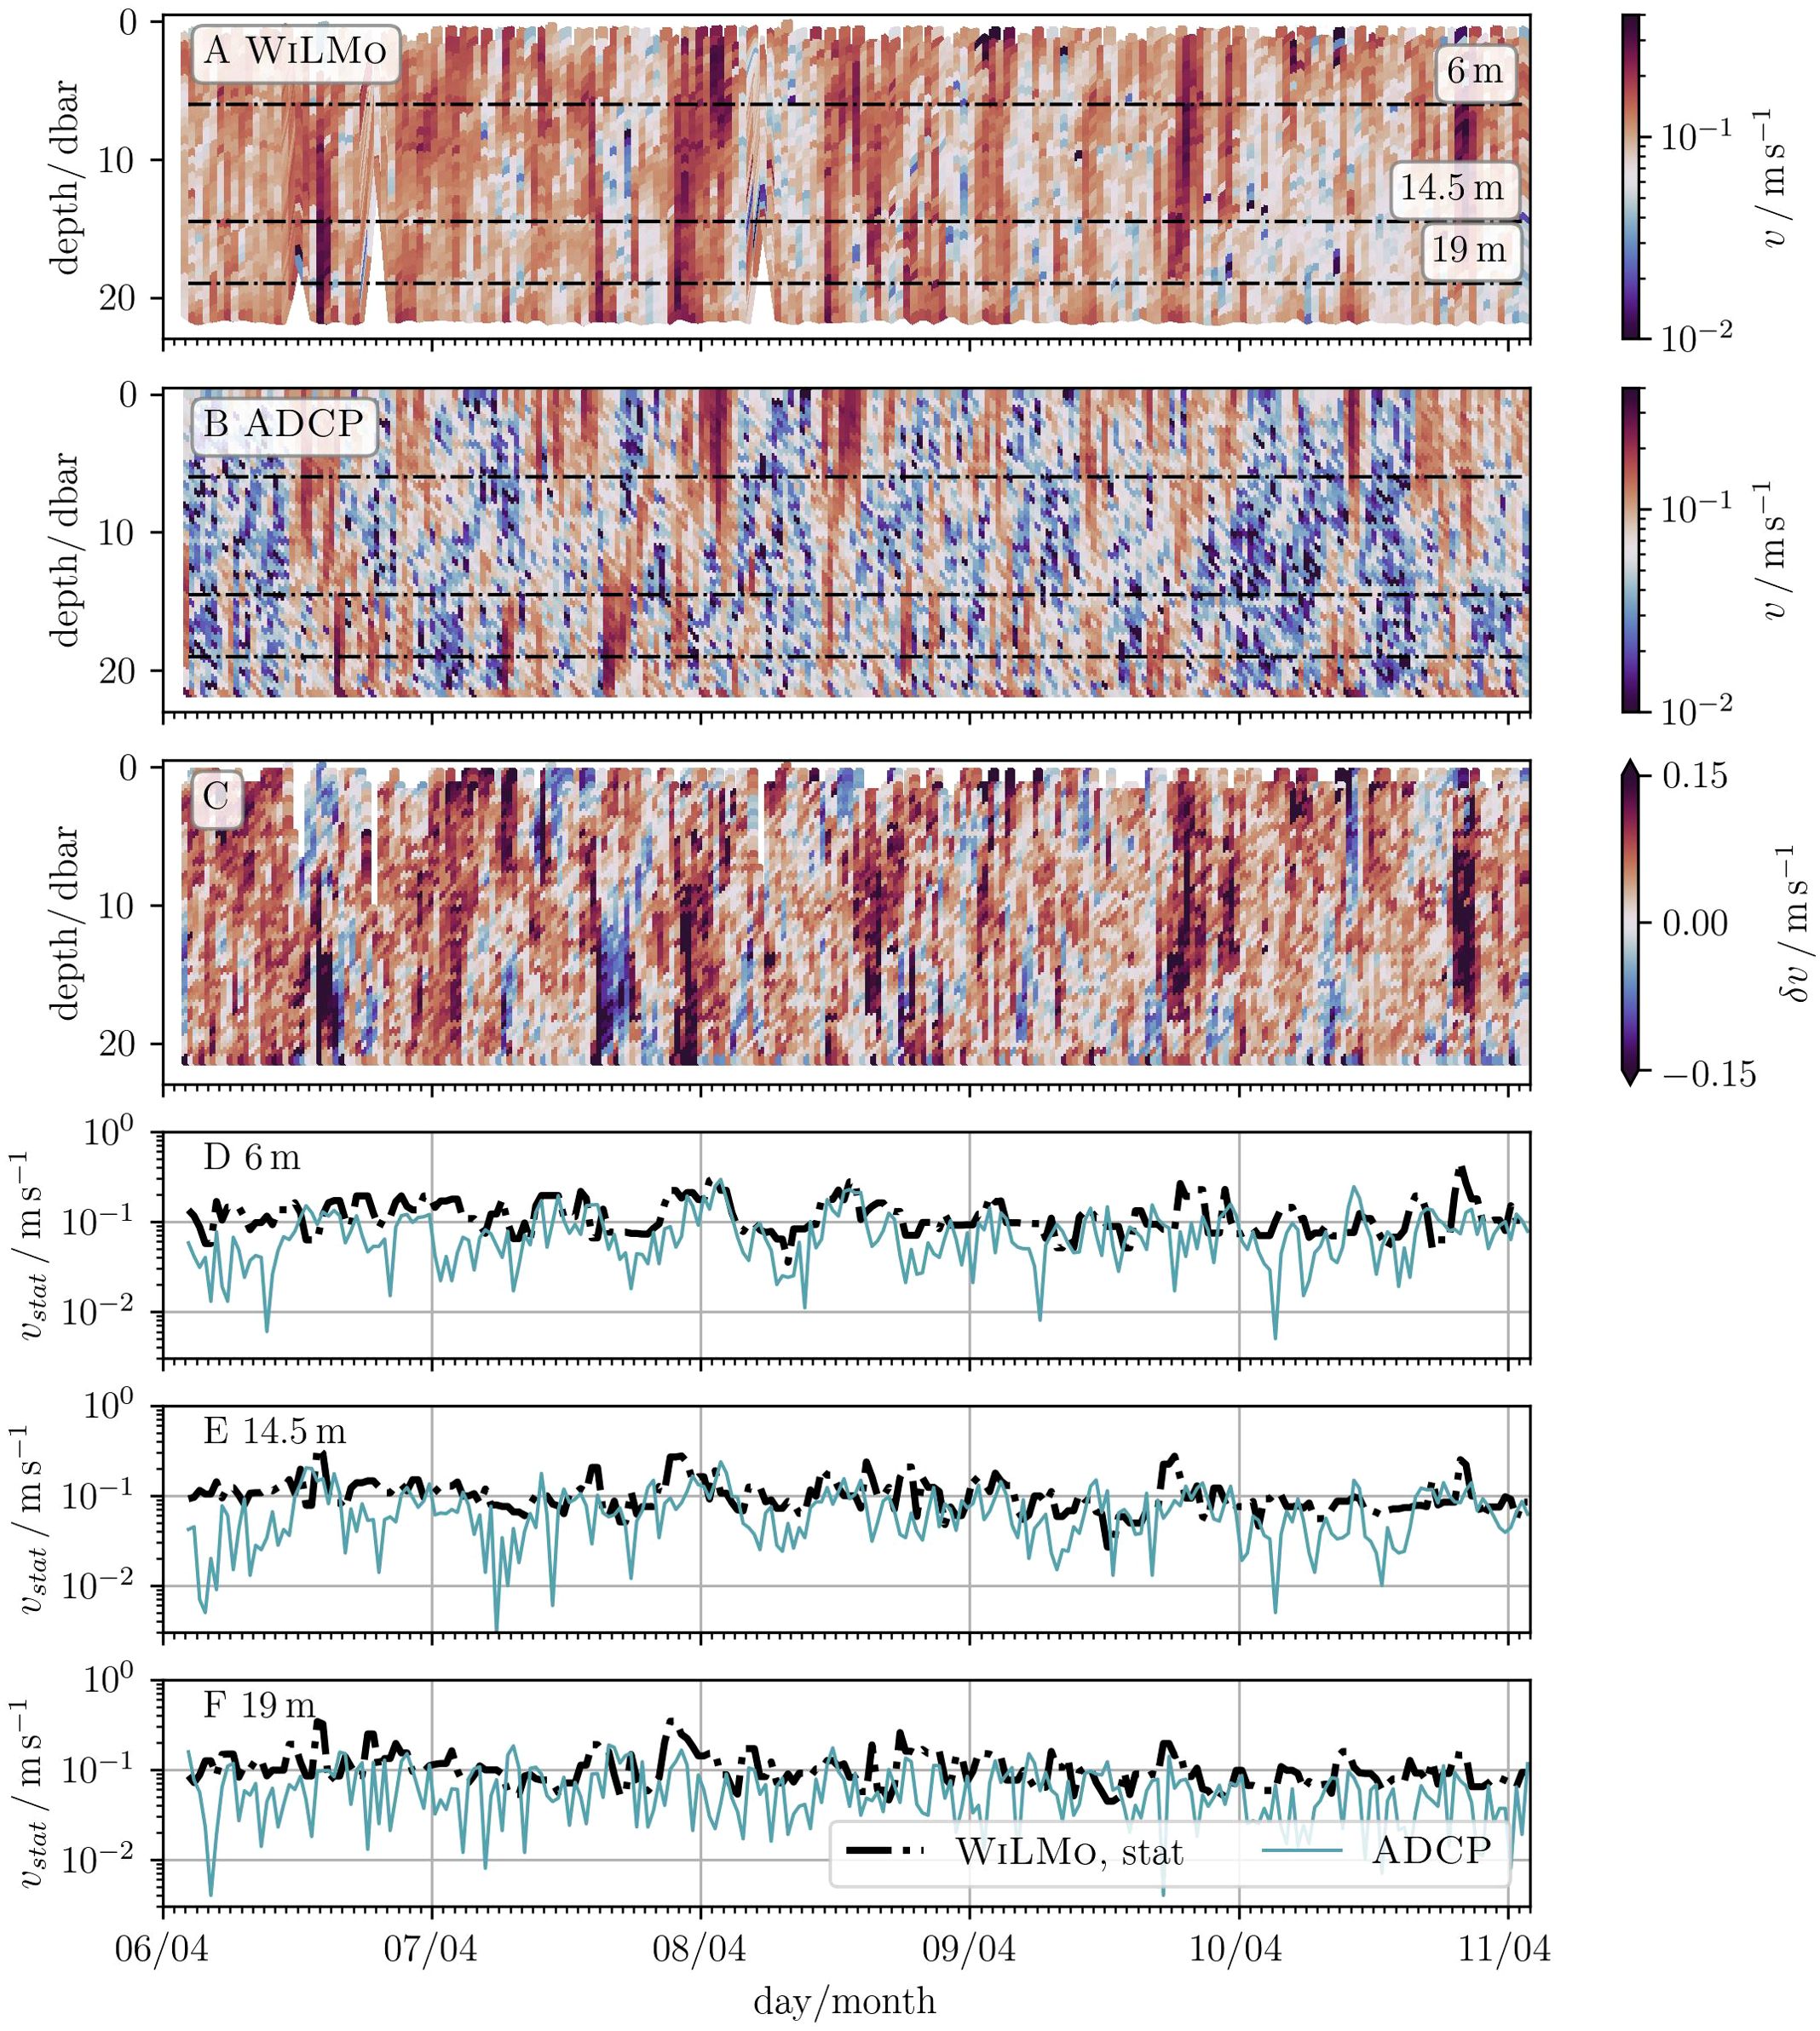
Figure 8. WILMO and ADCP flow velocities v (A, B), their residual (C) and the average of the stationary velocity measurements at three different depths (D–F). As indicated in the text, the measured flow velocities using WILMO are found to be greater than those measured with the ADCP02. However, WILMOs stationary data differ only slightly from the non-stationary (see also Table 3). Deviations may be due to the bias induced by veering (heaving), the vertical flow velocity component and the different locations and depths in the comparison.
Figures 8D–F investigate the steady-state flow velocities (, average for the 1 min duration per step, see orange dots in Figure 4 and section (2.4), step III) for three different depths at 6 m, 14.5 m and 19 m. In comparison with ADCP data for the same depths, basically, the same trend but less variance for WILMOs data is found. Especially in the case of 6 m depth and for April 7 around midnight and April 8 around noon longer periods of higher velocities are detected with both devices. Short-term changes for small flow velocities as measured by the ADCP02 are merely visible in WILMOs data and must be related to the unknown biases acting on the device. The magnitude of the velocities during the whole period is similar (several dm s−1) and for the samples under consideration is valid, meaning that WILMOs flow velocity data may be seen as an upper limit measurement. For 14.5 m and 19 m depth, the alignment of the comparison decreases. These findings are summarized in Table 3 where the temporally averaged flow velocities (labeled as ), the corresponding standard deviation as well as the RMS and Pearsson’s correlation coefficient is computed. WILMOs steady-state data overestimate the ADCP velocities where the error ranges intersect. The RMS is similar for all different depths and Pearsson’s correlation coefficient is rather small . If the steady-state data are higher than the ADCP data, then, presumably, the different locations of the devices are the major influence and not the described biases. The precision of both instruments (see Table 1) is much smaller than the described deviations and can therefore be neglected here.

Table 3. The temporally averaged flow velocities and their standard deviations show that as well as are of similar magnitude as .
As long as both, the steady-state and the non-steady flow velocities are comparable and roughly aligned with the ADCP data, the flow velocities measured with WILMO can help to estimate the local conditions. The impact of neighboring devices or the frame of the MPP on the compass used within the flow meter can be ignored due to the utilization of titanium. Similarly, the potential misalignment between the ADCP and true north (Le Menn et al., 2023) is not addressed in this analysis. Hence, to obtain a reliable measurement, much more effort must be put into examining the flow meter currently used.
3.2.3 Conductivity measurements
The conductivity sensor shows artificial jumps in the dataset. Given that the jumps are only visible in the conductivity data and neither in the temperature nor in any other independently measured values, it can be concluded that these jumps are in fact artificial. As the sensor was exchanged and the data transfer to the communication unit works as expected, this is most probably related to sensor damage during transportation (e.g. cold joints). Figures 9A, B show the original values exemplary for two different times (block 2 and 6, see Figure 5) together with the number of available data points. In order to minimize the error margin the measured data are not interpolated, but outliers are removed from the dataset (step II). A custom filter computes the time derivative of the conductivity and drops all values outside the predefined range . In other words, all values are dropped if neighboring values change ‘discontinuously’ stronger than the given value. This leads to a reduction of the number of data points, however, as can be seen in the Figures 9C, D, most of the outliers are removed and the measured data are conserved.
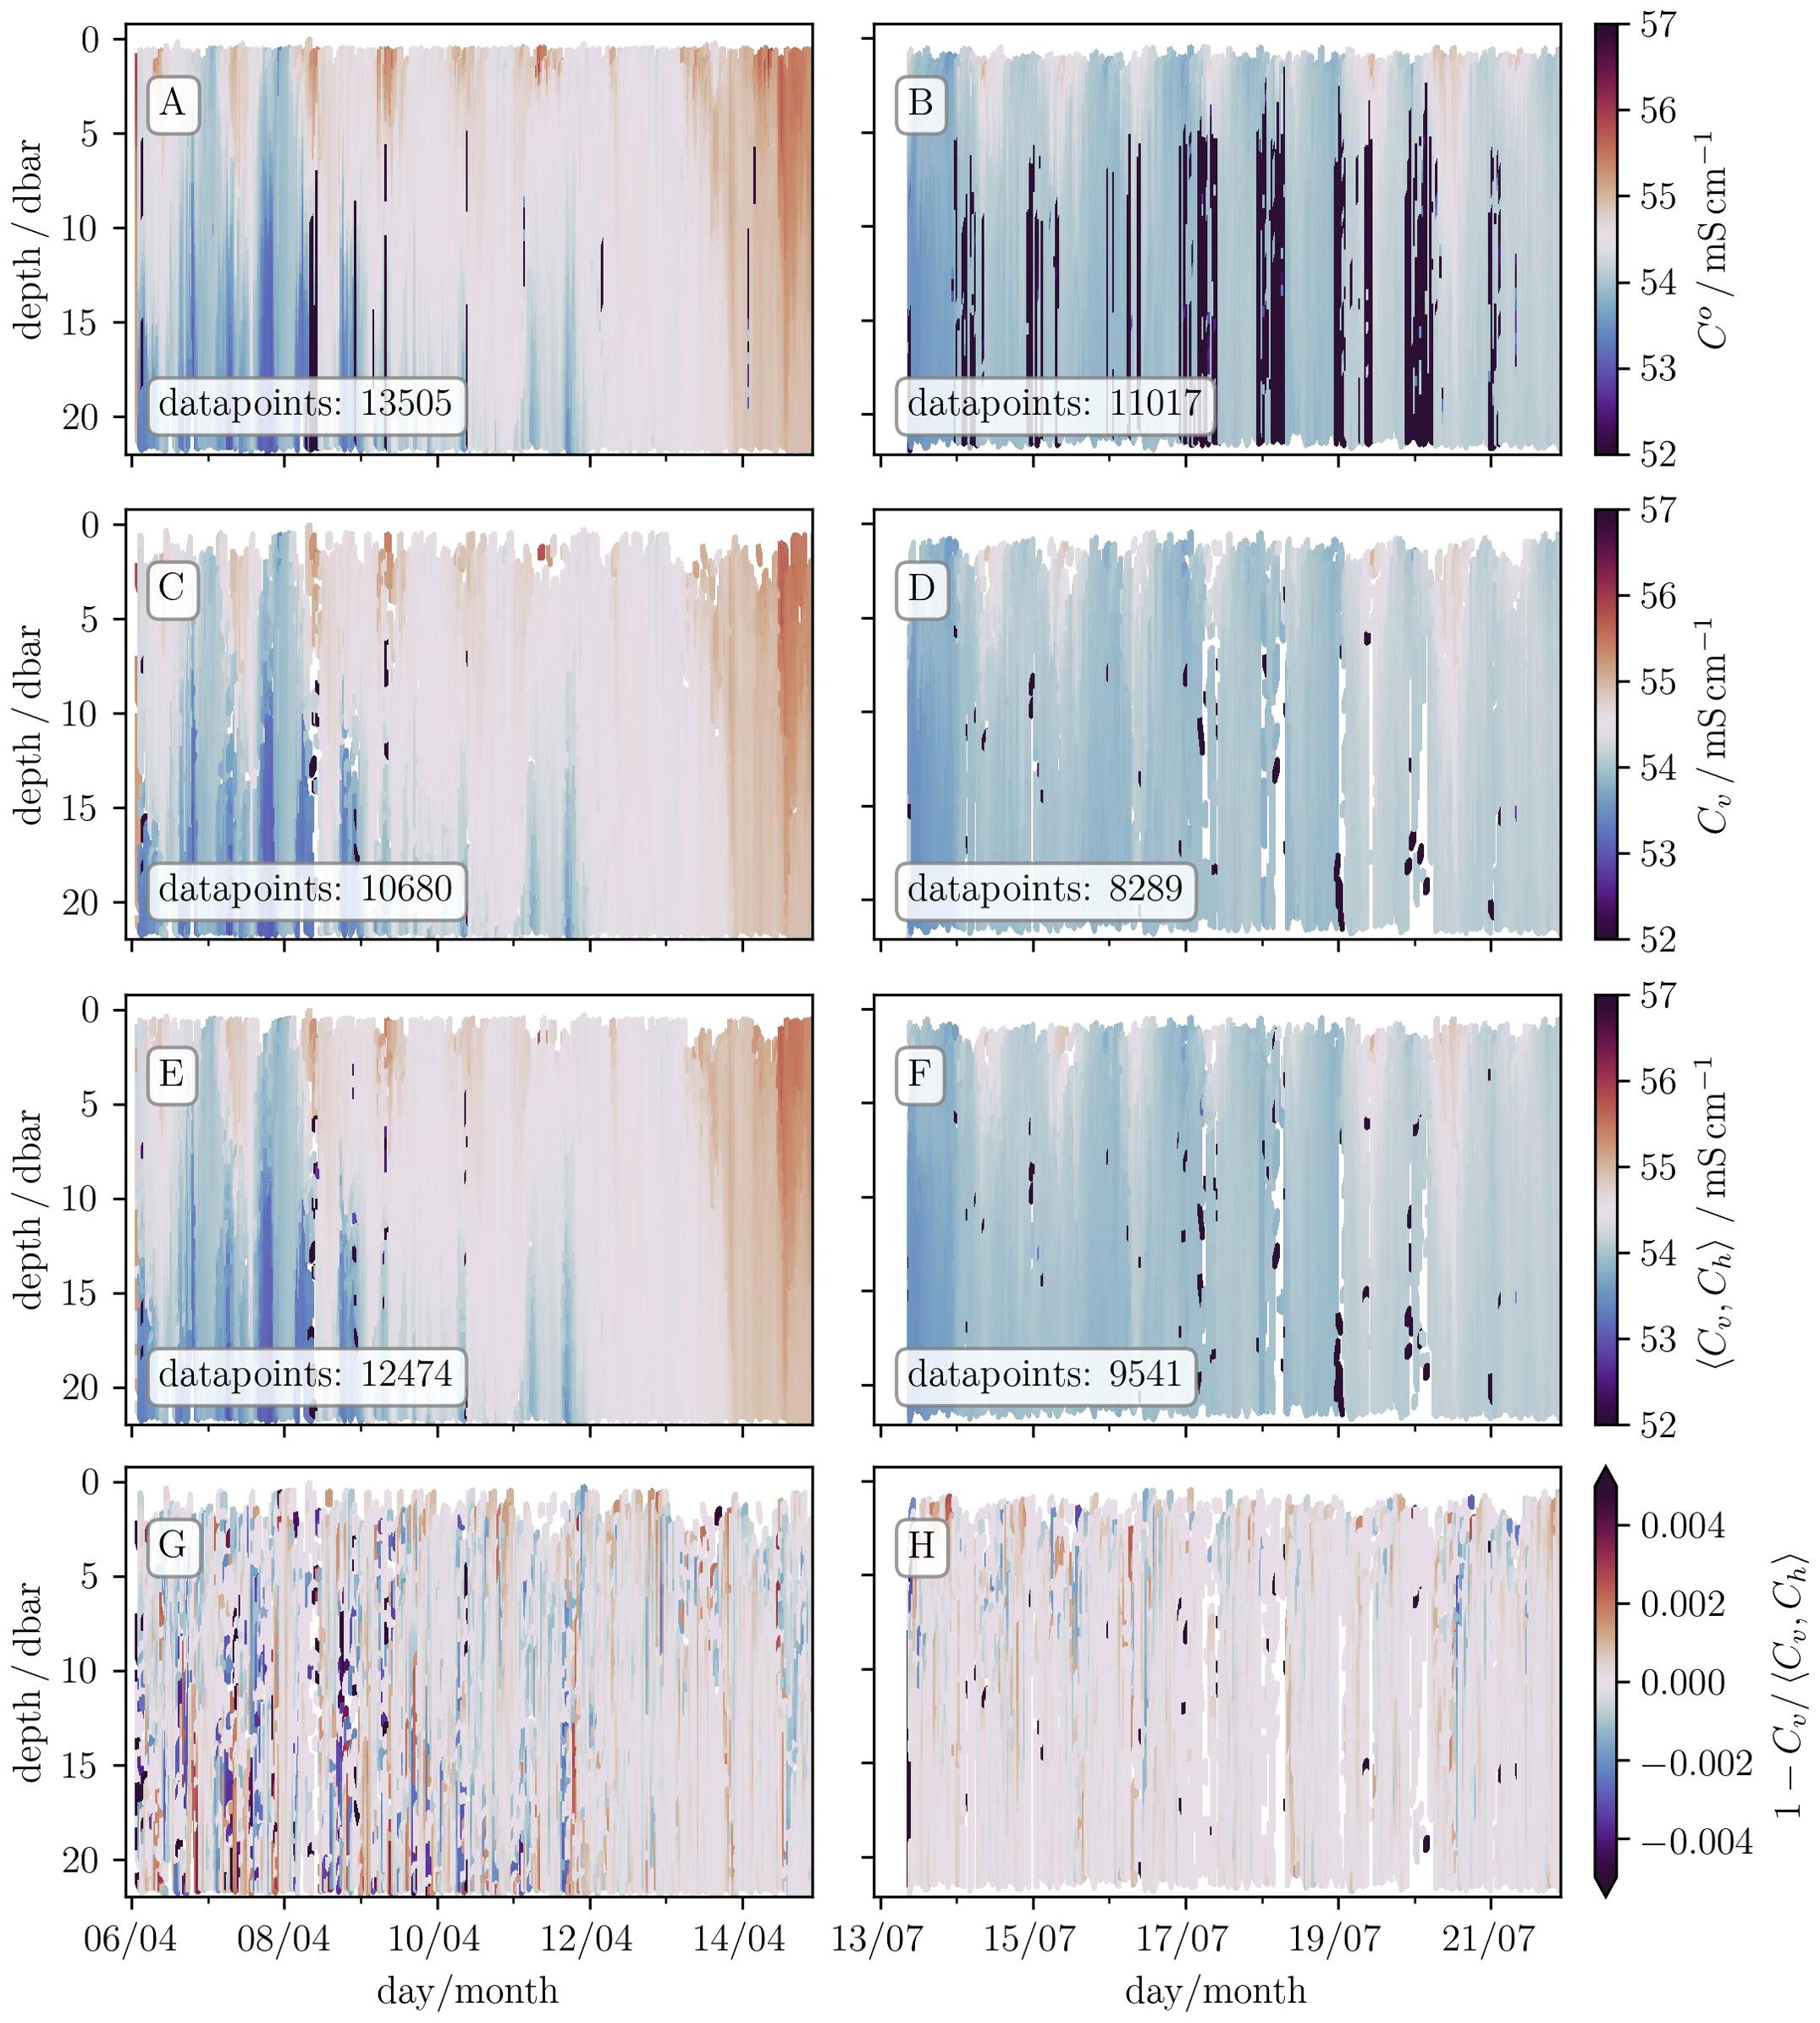
Figure 9. Investigation of the averaging process (IV) used for conductivity during differently varying periods. Panels (A, B) show the original conductivity data, including the sporadic and artificial jumps. Panels (C, D) show the filtered data without the outliers and during the veering process. Panels (E, F) show the results after the averaging process (IV) and panels (G, H) its relative error. The relative error of the procedure is of the order of the sensor accuracy validating the proposed procedure. Values means the averaging process over estimates, equals or underestimates the reconstructed values.
Proposition: WILMO provides two data points each at a specific depth, one during veering and one during heaving (see asterisks in Figure 4). If the variations in the water body are slower than during a single procedure loop (8 min), then the mean value of both data points increases the reliability of the measurements10 and increases the number of valid data points (post-processing step IV).
A general verification of above proposition is not possible because it depends on several important adjustments e.g. the cable length and hence on the duration of a single procedure loop. Nevertheless, the occurring error implied by this method is investigated in `s 9C–H showing plausible results with just minor deviation. As demonstrated by Mensah et al. (2009), the instrumental configuration gives better results during downcast because the signal is not disturbed by the water mixing caused by the cage or the instrument itself. Figures 9C, D show the data only during veering, (Figures 9E, F) the mean values corresponding to post-processing step (IV) and (Figures 9G, H) the relative error. The relative error is a measure of the applicability of the proposed method and thus indicates the possibility of reconstructing data. Numbers greater than zero overestimate the reconstructed values, numbers equal to zero indicate no difference between the measured and reconstructed values and numbers less than zero underestimate the measured values. There is more variation during April than during July, but the relative error is less than ± 0.005 mS cm−1 (besides the still available outliers) during both periods. This is well comparable to the given accuracy of the sensor in use (see Table 1) and hence the method is applicable. The available data points are increased by ∼ 13 % for April and ∼ 14 % for July, respectively. Errors exceeding the given range are still due to outliers, which survived the filtering and hence do not affect this analysis.
The method does not apply to all measured values and depends on the magnitude of the data. Especially the variance in case of the flow velocity is of the same order as the measured value itself. Therefore, solely the conductivity is computed with the proposed post-processing method (step IV). Nevertheless, for different setups, the post-processing step (IV) may be applicable to further sensors. Hence, the postprocessing tool includes a switch for selecting the values measured during the downcast or to compute the mean values.
4 Summary and discussion
WILMO is a novel and fully automated profiling system designed as a mixture of a buoy profiler and a stationary profiling system for coastal long-term monitoring. It is mounted on a platform and measures the whole water column in adjustable intervals and depth. Its proximity to the shore allows a simple wireless broadband communication (LTE) and thus easy data exchange and grants access to the mounting platform for maintenance. WILMO requires a power supply, but sufficient photovoltaic power and battery storage are now available to make the instrument completely autonomous. Since the sensitive MPP is only submerged during the procedure loop, biofouling is effectively suppressed. WILMOs design is flexible and promising in terms of hardware availability and interchangeability. The costs for building it can easily be reduced when the proposed components are replaced by smaller, lighter and cheaper ones. This can be done with all hardware components in use, as long as the working principle is the same, e.g. only winches with a servo drive can be used.
The technical specifics of WILMO are given in section (2) where three functional units are kept distinct: the work-, the control- and the communication unit. The work unit consists of the winch and the MPP (see Figure 1) and summarizes the mechanical hardware parts. The winch is robust and has its own safety- and control mechanisms. It exchanges specific information with the MPP, e.g. triggering an immediate stop and heave if ground contact is detected (see Figure 3). The control unit summarizes all electrical hardware components, e.g. the winchs’ electro-mechanical drive, the RPI (runs the unifying software and a web server for all instrument specific settings, etc.) and additional devices like cameras or the LTE modem. The communication unit includes the unifying software, handles the access to WILMO, is used for the setup, data transfer and internal communication between different hardware devices. Its proposed software architecture allows easy integration of new modules for additional cameras or sensors. It contains a module to increase or decrease the frequency of the procedure loop if information of local weather conditions are exchanged and interpreted (section 2.3). A comprehensive post-processing tool and a method for dealing with outliers and artificial sensor behavior is proposed. The tool uses the data for veering, extracts or excludes steady-state measurements and reorganizes the results to generate spatio-temporal heatmaps and thus enables easy data analysis. This allows WILMOs data to be easily compared with other instruments. In section (3) the quality of the measurements is investigated. All results and conclusions are based on the data sampled during a campaign in northern Bali in 2022. It is concluded, that the short immersion time, UV sunlight during standby and rapid evaporation of saltwater are the responsible factors for effectively suppressing biofouling on the sensors (i)-(iii). This is shown qualitatively by a visual inspection of WILMOs sensors compared with other devices over several weeks. Consistency and plausibility of temperature, flow velocity and conductivity data is shown with a comparison of datasets from different devices during the same period. Minor differences between the measurements are expected with regard to the different locations of the devices. Nevertheless, the data are well comparable and monitor the local conditions with high accuracy and reliability. It is shown, how a malfunction of the important conductivity sensor can be handled by data filtering. Further, the amount of data points can be increased by combining data from veering and heaving, where the error of this proposed method is of the order of the sensor accuracy.
It should be emphasized that despite some data gaps, WILMO was operated remotely from Germany for 9 months during the entire campaign without major technical problems.
4.1 Validations
WILMO was extensively tested for several weeks during April 2021 on a pier in the Kieler Förde and on a pontoon at Büsum harbor. These tests focused on durability, stability, software bugs, communication, and the effects of biofouling in various environments. The drift of the MPP in waters with high flow velocities was tested onboard Egidora11 during a cruise to Helgoland in September 2022. The difference between the depth of the MPP and cable length is important in both, the mechanics and transverse forces acting on the cantilever and the measurement procedure itself regarding the steady-state depth steps. For high flow velocities (≳1 m s−1 as a very conservative estimate) predefined depths may never be reached due to deflection of the MPP. This is of crucial importance regarding the proper functionality of WILMO. However, additional weights on the MPP could counteract this effect.
WILMO successfully operated with great reliability from March to December 2022 in Patas (see Figure 2) intended to monitor the water conditions concerning mariculture. Nevertheless, several problems occurred which could be resolved with the help of local support. The main problems were: (A) the underwater camera was destroyed by leakage and electrolysis two months after the deployment. Thereby, the network switch (providing power over ethernet) got corrupted and hence the security camera also ran into malfunction. (B) although we benefited from a generally stable power source, there were power outages leading to data gaps. (C) the conductivity sensor occasionally shows sporadic and physically meaningless jumps in the data.
The network switch was replaced easily but the IP camera must be sent to the manufacturer and was reinstalled after repair (A). This malfunction did not interfere the actual measuring procedure. In case of interruption12 (B), WILMO was not able to communicate this to the staff. A watchdog restarts the software if it finds itself not running. However, for security, the DDC is not allowed to switch back into automatic mode and, if the watchdog restarts the device, the software writes the log file but the winch does not start veering until it is switched back manually either with a hardware button or the web interface. For instance, if a remote user activates WILMO without first verifying that a local worker is currently cleaning the device, there is a significant risk of severe injury. This feature is responsible for most of the data gaps present in Figure 5. The second version of WILMO is able to communicate with the DDC and will send an email to the remote user in case of malfunction parallel to the information recorded in the log file. This will ensure a faster response to faults because a manual inspection of the log file is no longer necessary, ultimately reducing data gaps. Further, a signal light blinks when WILMO starts veering and the remote user should inspect the security camera before switching WILMO back to automatic mode. Sporadic jumps in the conductivity data (C) cannot be attributed to biofouling or any other physical phenomena. This can be demonstrated by examining conductivity-temperature plots where the correlation of the two quantities is violated by the sporadic jumps. It is more likely that the cause is a hardware failure that occurred during transport and the sensor must be replaced in future campaigns.
Besides photovoltaics and batteries, some additional hardware improvements must and have been performed. In a second version of WILMO the hardware is combined into one box and attached to the winch itself making the whole device very compact. However, the total weight13 increases making it hard to deploy the device without additional transportation tools. An updated software version now sets markers into the database for each of the starts, stops and steady-state starts and stops which reduces the complexity of the post-processing tool.
The diurnal exposure of the MPP in the sun results in temperature changes, which can lead to over- or underestimates in the measured data just after submergence. If this effect occurs, it is possible to either discard the first data points, or to halt the MPP for several seconds just after submergence. After letting the sensors adapt to the actual conditions, veering proceeds. However, the sensors respond very quickly to changes in the water and this effect may only become a factor when WILMO is employed for precise measurements of surface water, where the veering/heaving velocity must also be decreased, additionally.
The MPP data during veering are favorable over the data during heaving fitting the case described in Mensah et al. (2009). Consequently, the steady-state measurements are now performed during heaving for a continuous veering profile. Thus, the steady-state measurements must not be removed from the dataset anymore (step VII).
4.2 Outlook
This paper introduces the instrument design, technical specifics and flexibility of WILMO, along with an investigation of the quality of the measured data. Future deployments can consider the following additional operational purposes: 1. Measurements close to the sea floor or close below the sea surface. Surface waves do not interfere with the measurements close to the sea floor, as the bottom sensor will heave the MPP as soon as it touches the ground. If the data is interpreted fast enough, one can also consider a control module that compares the current pressure signal with a predefined value for a specific depth. The regulation of maintaining a stationary depth can then be achieved by conditionally stopping and quickly veering or heaving the MPP (analogous to, or by using directly the method for the stationary depth measurements, as outlined in section 2.3 and Figure 3). 2. Changing or adding sensors mounted on the MPP for specific parameters of interest. This enables highly precise measurements under reduced biofouling. 3. If the winch is capable to veer an instrument close to terminal velocity, fully automated microstructure measurements (Baumert et al., 2005, Part II Chapter 12) should be possible as well. 4. An investigation of a potential salinity drift caused by salt deposits on the conductivity sensor during long-term observations will help to substantiate WILMOs performance and may increase the maintenance intervals.
Data availability statement
The raw data supporting the conclusions of this article will be made available by the authors, without undue reservation.
Author contributions
SD: Conceptualization, Formal analysis, Methodology, Project administration, Software, Validation, Visualization, Writing – original draft. GB: Conceptualization, Methodology, Software, Writing – review & editing. KO: Investigation, Project administration, Resources, Visualization, Writing – review & editing. AN: Investigation, Resources, Visualization, Writing – review & editing. WV: Conceptualization, Methodology, Writing – review & editing.
Funding
The author(s) declare financial support was received for the research, authorship, and/or publication of this article. This work is partly funded by the Helmholtz Innovation Platform Shaping an Ocean Of Possibilities for science-industry collaboration (SOOP). Open access publication fees are funded by Helmholtz-Zentrum Hereon.
Acknowledgments
We are grateful to Yoana Voynova for very fruitful discussions and advice. The authors would like to thank Reagan Septory, Karl-Heinz Runte, Jose Manuel Fernandez-Jaramillo and Roberto Mayerle for their collaboration and helpful discussions. We would also like to thank the Research Institute for Mariculture (RIM Gondol) and the Indonesian Ministry of Marine Affairs and Fisheries (KKP) for their extensive support and assistance.
Conflict of interest
The authors declare that the research was conducted in the absence of any commercial or financial relationships that could be construed as a potential conflict of interest.
Publisher’s note
All claims expressed in this article are solely those of the authors and do not necessarily represent those of their affiliated organizations, or those of the publisher, the editors and the reviewers. Any product that may be evaluated in this article, or claim that may be made by its manufacturer, is not guaranteed or endorsed by the publisher.
Footnotes
- ^ As the earth rotates underneath a single satellite, the same position can only be measured after a specified time, the revisit time, of the order of several days.
- ^ ARGO floats could be programmed to drift in coastal regions with the risk of frequent groundings and there might also be possibilities to prevent biofouling. The deep-floats reach depths up to 6000 m.
- ^ Solar panels and a battery-pack providing sufficient power for WILMO are also available in the meantime. This additional hardware makes WILMO fully autonomous.
- ^ This database is maintained from the FTZ and part of previous projects. It summarizes real-time data for different instruments but also from different official sources for monitoring and modeling purposes.
- ^ The data stream also contains information on solar panels and the battery status if both are available.
- ^ The resolution of a single profile is much higher, about 0.3 s-1 (see Table 1).
- ^ The water was notably clear, and the MPP still visible after reaching ∼ 5 to 10 m depth.
- ^ The sensor is shown in Figure 6B, where the electrodes are located on the bottom of the ellipsoid.
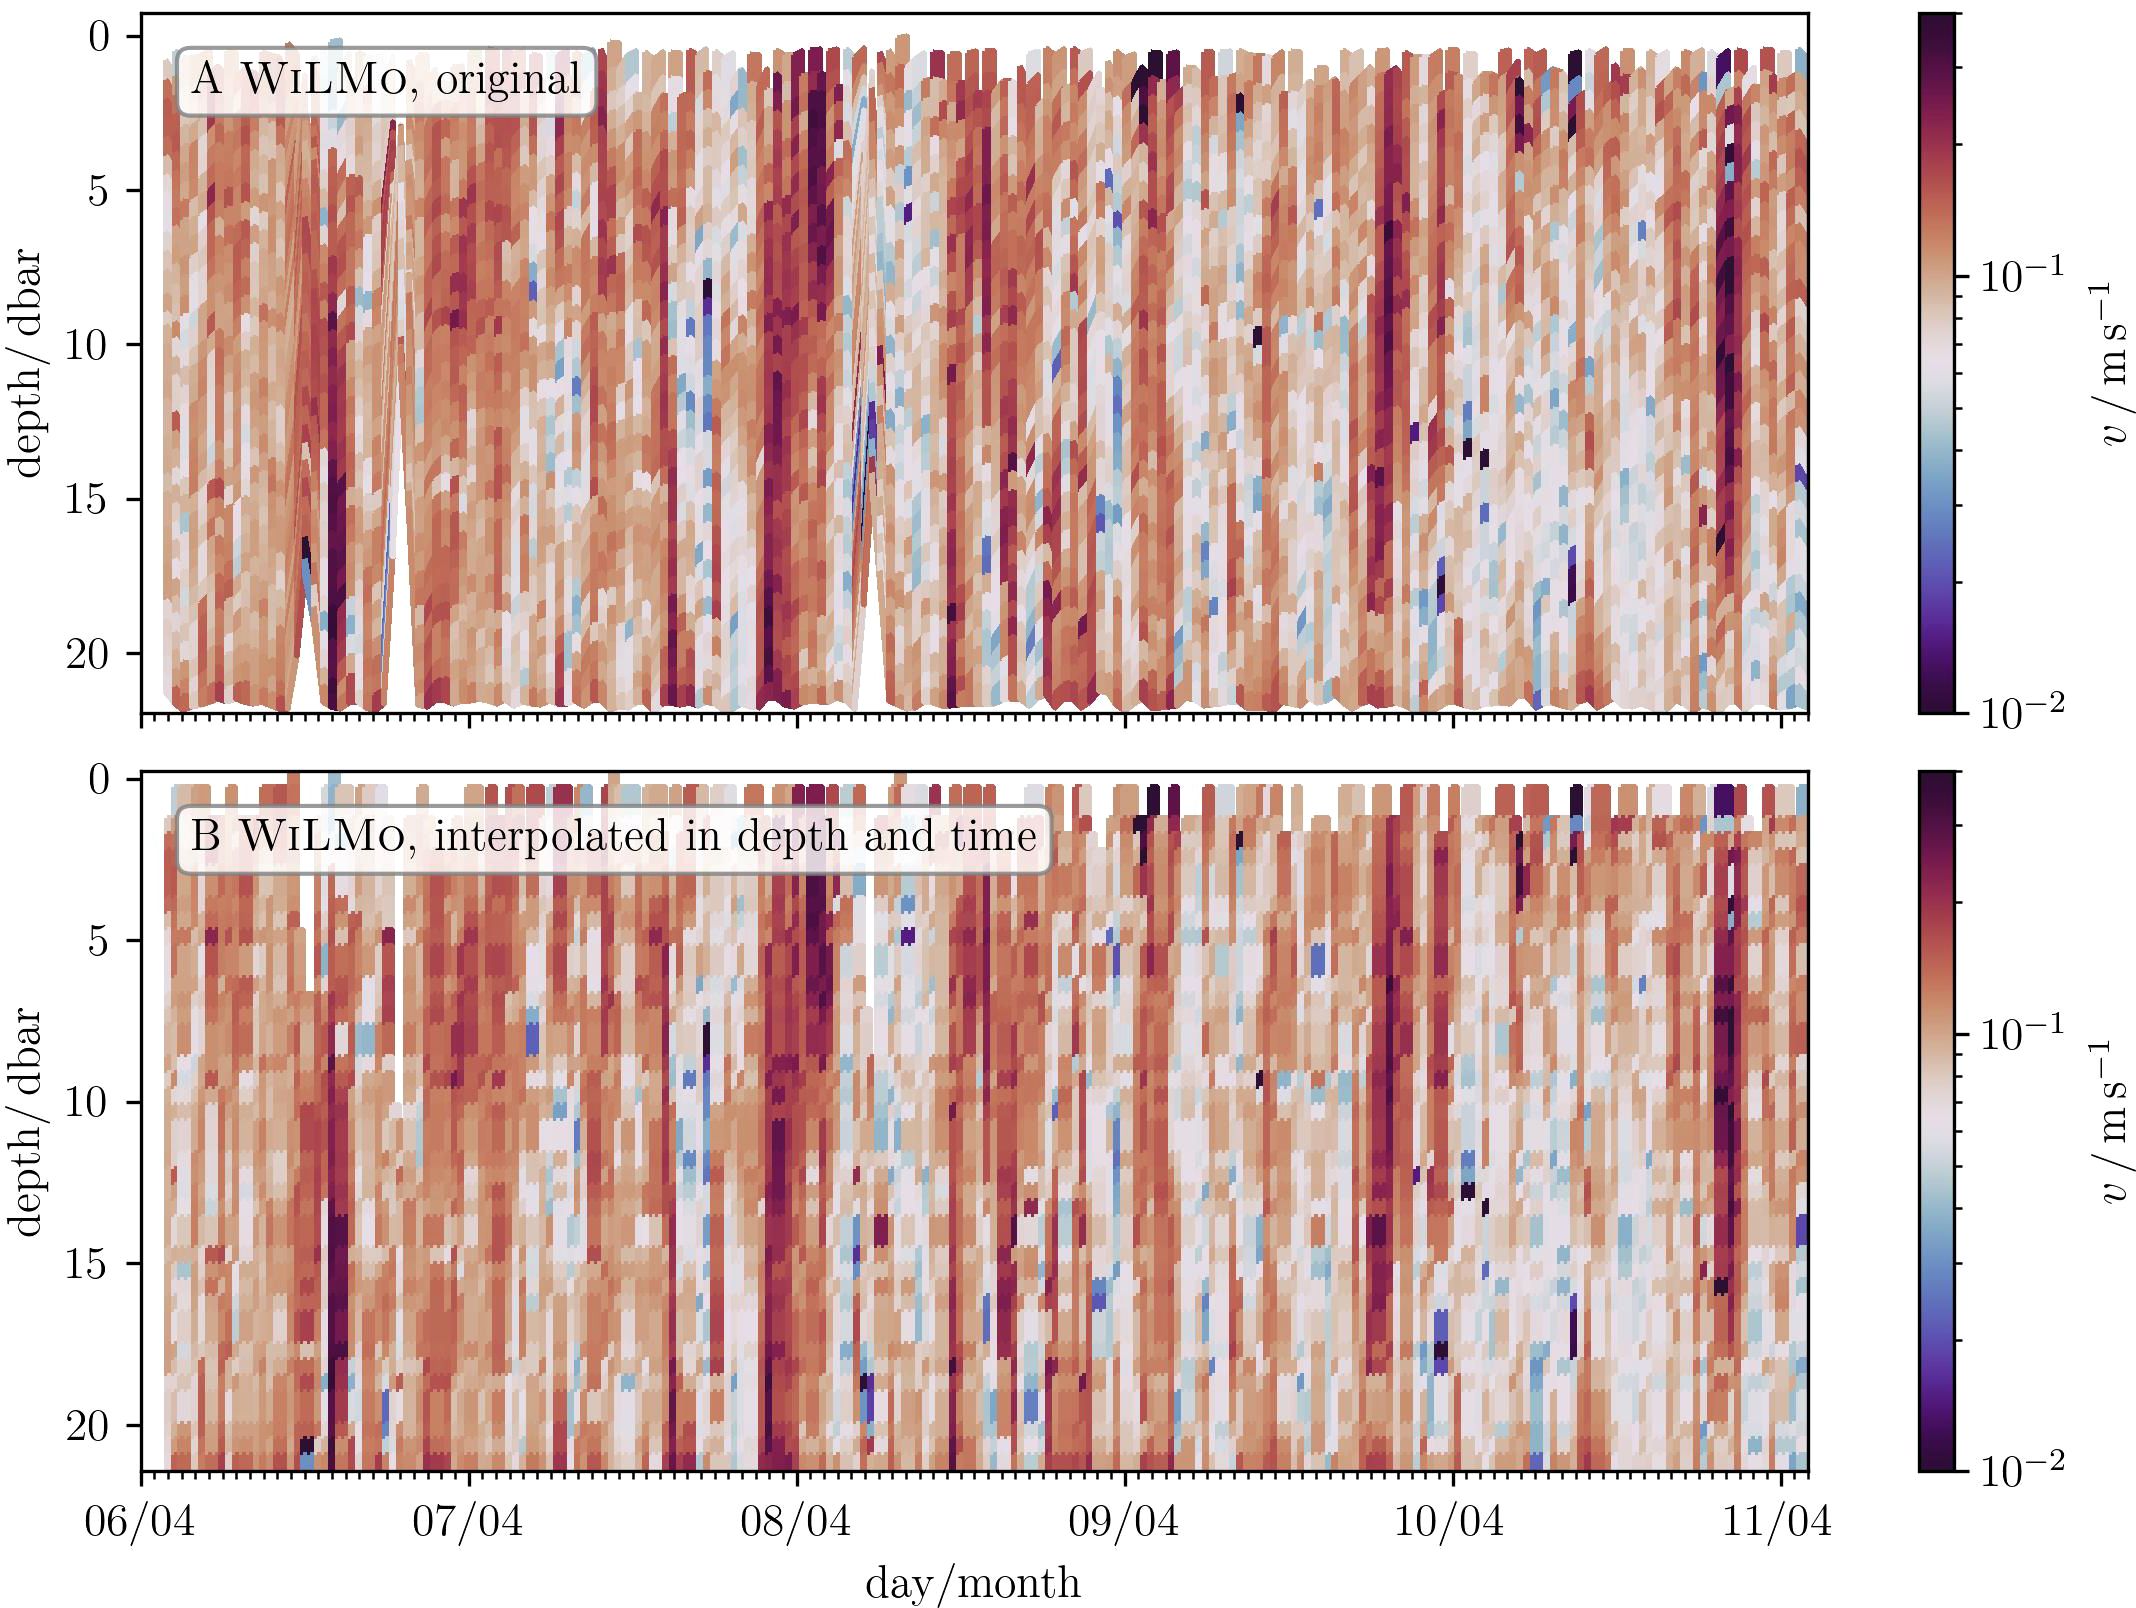
- ^ In Appendix (C) the original flow velocity data from WILMO are compared to interpolated data. The interpolation is performed to achieve the same data size as the ADCP dataset, necessary for computing the residual.
- ^ The data points for the steady-state measurements must be excluded, otherwise, we add redundant information to the statistics.
- ^ Egidora (MMSI 211770520) is a research vessel owned by FTZ and anchored in Büsum harbor, Schleswig-Holstein, Germany.
- ^ The mounting platform is owned by a local aquaculture company and so is the power source. As a result, we cannot control whether or not WILMO is powered. This depends on the needs of the company. For example, if the staff is cleaning the cages the power source is prioritized for other purposes.
- ^ The second winch was purchased second-hand at a very favorable price and was originally intended for visual sewer inspections, where a trolley with mounted cameras was pulled through the pipes by the winch. This is a nice example of cost reduction and interchangeability of the hardware parts within WILMO.
References
Barnard A. H., Barth J. A., Levine M. D., Rhoades B. K., Koegler J. M., Derr A. R., et al. (2010). “The coastal autonomous profiling and boundary layer system (CAPABLE),” in OCEANS 2010 MTS/IEEE SEATTLE, Seattle, WA, USA, 1–7. doi: 10.1109/OCEANS.2010.5664447
Bauer J. E., Cai W.-J., Raymond P. A., Bianchi T. S., Hopkinson C. S., Regnier P. A. G. (2013). The changing carbon cycle of the coastal ocean. Nature 504, 61–70. doi: 10.1038/nature12857
Baumert H. Z., Simpson J. H., Sündermann J. (Eds.) (2005). Marine Turbulence: Theories, Observations, and Models. 1. publ. edn (Cambridge [u.a.]: Cambridge University Press).
Carlson D., Ostrovskii A., Kebkal K., Gildor H. (2013). Moored automatic mobile profilers and their application. 169–206.
Clements J. C., Chopin T. (2017). Ocean acidification and marine aquaculture in North America: Potential impacts and mitigation strategies. Rev. Aquacult. 9, 326–341. doi: 10.1111/raq.12140
Coohill T. P., Sagripanti J.-L. (2009). Bacterial inactivation by solar ultraviolet radiation compared with sensitivity to 254 nm radiation. Photochem. Photobiol. 85, 1043–1052. doi: 10.1111/j.1751-1097.2009.00586.x
Cooley S., Schoeman D., Bopp L., Boyd P., Donner S., Ghebrehiwet D., et al. (2022). “Ocean and coastal ecosystems and their services,” in Climate change 2022: Impacts, Adaptation and Vulnerability. Contribution of Working Group II to the Sixth Assessment Report of the Intergovernmental Panel on Climate Change. Eds. Pörtner H. O., Roberts D. C., Tignor M., Poloczanska E. S., Mintenbeck K., Alegría A., Craig M., Langsdorf S., Löschke S., Möller V., Okem A., Rama B. (Cambridge University Press, Cambridge, UK and New York, NY, USA). book Section 3. doi: 10.1017/9781009325844.005
Delauney L., Compère C., Lehaitre M. (2010). Biofouling protection for marine environmental sensors. Ocean. Sci. 6, 503–511. doi: 10.5194/os-6-503-2010
FAO (2022). The State of World Fisheries and Aquaculture 2022. Towards Blue Transformation. Tech. rep (Rome: FAO). doi: 10.4060/cc0461en
Feely R. A., Alin S. R., Newton J., Sabine C. L., Warner M., Devol A., et al. (2010). The combined effects of ocean acidification, mixing, and respiration on pH and carbonate saturation in an urbanized estuary. Estuarine. Coast. Shelf. Sci. 88, 442–449. doi: 10.1016/j.ecss.2010.05.004
Feistel R., Wright D. G., Jackett D. R., Miyagawa K., Reissmann J. H., Wagner W., et al. (2010). Numerical implementation and oceanographic application of the thermodynamic potentials of liquid water, water vapour, ice, seawater and humid air – Part 1: Background and equations. Ocean. Sci. 6, 633–677. doi: 10.5194/os-6-633-2010
Fofonoff N. P., Millard R. C. Jr. (1983). “Algorithms for the computation of fundamental properties of seawater,” in UNESCO Technical Papers in Marine Sciences, vol. 44. (UNESCO, Paris, France), 53pp. doi: 10.25607/OBP-1450
Jin J.-Y., Dae Do J., Park J.-S., Park J. S., Lee B., Hong S.-D., et al. (2021). Intelligent buoy system (INBUS): automatic lifting observation system for macrotidal coastal waters. Front. Mar. Sci. 8. doi: 10.3389/fmars.2021.668673
Kaiser D., Voynova Y. G., Brix H. (2023). Effects of the 2018 European heatwave and drought on coastal biogeochemistry in the German Bight. Sci. Total. Environ. 892, 164316. doi: 10.1016/j.scitotenv.2023.164316
Kitidis V., Shutler J. D., Ashton I., Warren M., Brown I., Findlay H., et al. (2019). Winter weather controls net influx of atmospheric CO2 on the north-west European shelf. Sci. Rep. 9, 20153. doi: 10.1038/s41598-019-56363-5
Le Menn M., Lefevre D., Schroeder K., Borghini M. (2023). Study of the origin and correction of compass measurement errors in Doppler current meters. Front. Mar. Sci. 10. doi: 10.3389/fmars.2023.1254581
Lochthofen N., Frommhold L., Ludszuweit J., Soltwedel T. (2021). A subsea winched profiling system (SWIPS) for long-term high-resolution measurements in ocean surface layers. Mar. Technol. Soc. J. 55, 165–171. doi: 10.4031/MTSJ.55.2.3
Macovei V. A., Callies U., Calil P. H. R., Voynova Y. G. (2022). Mesoscale advective and biological processes alter carbon uptake capacity in a shelf sea. Front. Mar. Sci. 9. doi: 10.3389/fmars.2022.827075
Mathis M., Lacroix F., Hagemann S., Nielsen D. M., Ilyina T., Schrum C. (2024). Enhanced CO2 uptake of the coastal ocean is dominated by biological carbon fixation. Nat. Climate Change 14, 373–379. doi: 10.1038/s41558-024-01956-w
McDougall T. J., Barker P. M. (2011). Getting Started with TEOS-10 and the Gibbs Seawater (GSW) Oceanographic Toolbox. Ed. McDougall T. J. 28.
Melet A., Teatini P., Le Cozannet G., Jamet C., Conversi A., Benveniste J., et al. (2020). Earth observations for monitoring marine coastal hazards and their drivers. Surveys. Geophys. 41, 1489–1534. doi: 10.1007/s10712-020-09594-5
Mensah V., Menn M. L., Morel Y. (2009). Thermal mass correction for the evaluation of salinity. J. Atmospheric. Oceanic. Technol. 26, 665–672. doi: 10.1175/2008JTECHO612.1
Muthukumar T., Aravinthan A., Lakshmi K., Venkatesan R., Vedaprakash L., Doble M. (2011). Fouling and stability of polymers and composites in marine environment. Int. Biodeterioration. Biodegradation. 65, 276–284. doi: 10.1016/j.ibiod.2010.11.012
Nelson K. L., Boehm A. B., Davies-Colley R. J., Dodd M. C., Kohn T., Karl. G., et al. (2018). Sunlight-mediated inactivation of health-relevant microorganisms in water: A review of mechanisms and modeling approaches. Environ. Sci. Processes. Impacts. 20, 1089–1122. doi: 10.1039/c8em00047f
Oka E. (2005). Long-term sensor drift found in recovered argo profiling floats. J. Oceanogr. 61, 775–781. doi: 10.1007/s10872-005-0083-6
Park Y.-G., Seo S., Kim D. G., Noh J., Park H. M. (2021). Coastal observation using a vertical profiling system at the southern coast of korea. Front. Mar. Sci. 8. doi: 10.3389/fmars.2021.668733
Petersen W. (2014). FerryBox systems: State-of-the-art in Europe and future development. J. Mar. Syst. 140, 4–12. doi: 10.1016/j.jmarsys.2014.07.003
Petersen W., Reinke S., Breitbach G., Petschatnikov M., Wehde H., Thomas H. (2018). FerryBox data in the north sea from 2002 to 2005. Earth Syst. Sci. Data 10, 1729–1734. doi: 10.5194/essd-10-1729-2018
Roquet F., Madec G., Brodeau L., Nycander J. (2015). Defining a simplified yet “Realistic” Equation of state for seawater. J. Phys. Oceanogr. 45, 2564–2579. doi: 10.1175/JPO-D-15-0080.1
Ryan E., Turkmen S., Benson S. (2020). An Investigation into the application and practical use of (UV) ultraviolet light technology for marine antifouling. Ocean. Eng. 216, 107690. doi: 10.1016/j.oceaneng.2020.107690
Schofield O., Bergmann T., Bissett P., Grassle J., Haidvogel D., Kohut J., et al. (2002). The long-term ecosystem observatory: an integrated coastal observatory. IEEE J. Oceanic. Eng. 27, 146–154. doi: 10.1109/JOE.2002.1002469
Send U., Fowler G., Siddall G., Beanlands B., Pittman M., Waldmann C., et al. (2013). SeaCycler: A moored open-ocean profiling system for the upper ocean in extended self-contained deployments. J. Atmospheric. Oceanic. Technol. 30, 1555–1565. doi: 10.1175/JTECH-D-11-00168.1
TheArgoScienceTeam (1999). On the Design and Implementation of Argo A Global Array of Profiling Floats.
Venkatesan R., Senthilkumar P., Vedachalam N., Murugesh P. (2017). Biofouling and its effects in sensor mounted moored observatory system in Northern Indian Ocean. Int. Biodeterioration. Biodegradation. 116, 198–204. doi: 10.1016/j.ibiod.2016.10.034
Voynova Y. G., Lebaron K. C., Barnes R. T., Ullman W. J. (2015). In Situ response of bay productivity to nutrient loading from a small tributary: The Delaware Bay-Murderkill Estuary tidallycoupled biogeochemical reactor. Estuarine. Coast. Shelf. Sci. 160, 33–48. doi: 10.1016/j.ecss.2015.03.027
Wallace R. B., Baumann H., Grear J. S., Aller R. C., Gobler C. J. (2014). Coastal ocean acidification: The other eutrophication problem. Estuarine. Coast. Shelf. Sci. 148, 1–13. doi: 10.1016/j.ecss.2014.05.027
Wang Z. A., Moustahfid H., Mueller A. V., Michel A. P. M., Mowlem M., Glazer B. T., et al. (2019). Advancing observation of ocean biogeochemistry, biology, and ecosystems with cost-effective in situ sensing technologies. Front. Mar. Sci. 6. doi: 10.3389/fmars.2019.00519
Zang X., Zhang Z., Fan W. (2021). A novel profiler driven by tidal energy for long term oceanographic measurements in offshore areas. J. Mar. Sci. Eng. 9, 534. doi: 10.3390/jmse9050534
Appendix A. The deployment site in Patas
Figure A1 A shows the deployment site in Patas, northern Bali. As described in section (2), WILMO consists of three distinct units. Figure A1 B show the work unit (winch and MPP) mounted on the service platform, which is actually required for the aquafarming staff. The red label UWC stands for underwater camera, which is mounted on the end of a bamboo pile 3 m under the water surface. The security camera (SC) is mounted underneath the roof, looking at WILMO. Figure A1 C shows the control-and communication units installed inside the hut. The units are partly covered because the table above the boxes is also used for cooking. The connectors are waterproof and the hut provides additional protection for all devices. The power connector is located inside the hut as well.
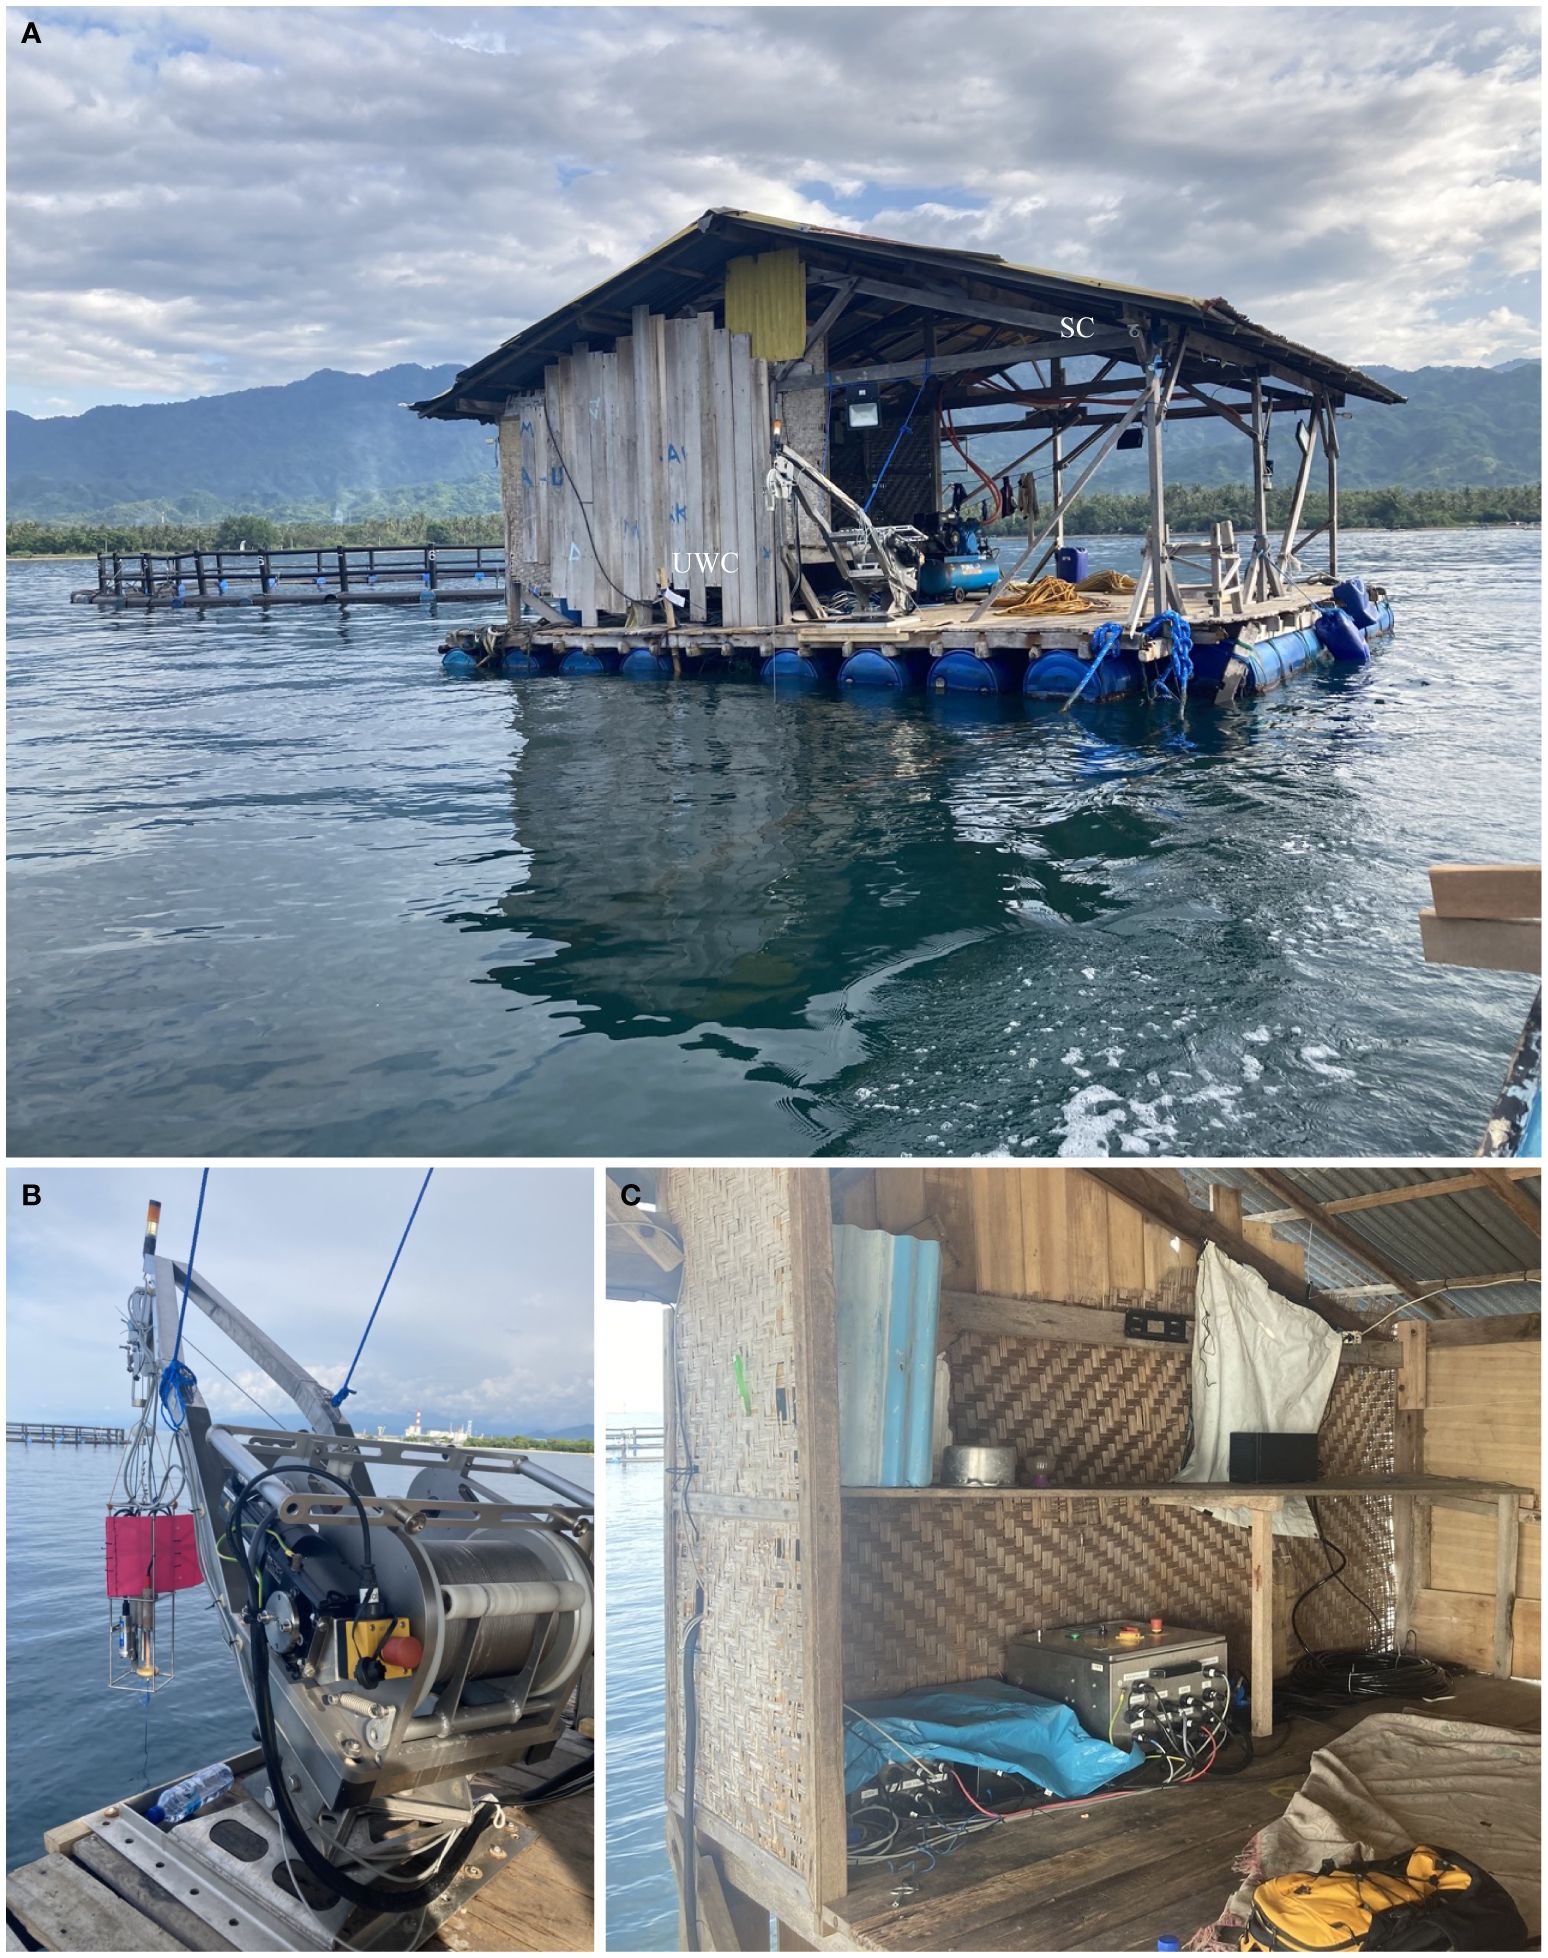
Figure A1. WILMO and the deployment site. (A) shows WILMO mounted securely on a platform (B) at a distance of ∼ 600 m to the coast of Patas, northern Bali, Indonesia. It is protected underneath a roof and easily accessible for maintenance. The red plastic fin visible in (A) additionally suppresses any axial rotation of the MPP. The communication- and control unit including the electrical hardware (C) are mounted inside the hut and are partly covered for protection. The main and security switches and the manual control are visible. All boxes are water resistant and made of stainless steel. The abbreviations SC and UWC refer to security camera and underwater camera, respectively, and indicate the locations of the devices. The UWC is situated at the end of a pile, approximately three meters below the surface, and is not visible in the image.
Appendix B. The graphical control interface
The user connects to the web page over the public IP address and is prompted to log in initially. The first tab contains a description and some information about WILMO, which is not shown in Figure A2. The controls and settings (Figure A2 A) are available in the control tab, where the red dots turn to green when active. The user can start or stop WILMO and has control over the DDC (LOGO)!, can switch the auto run functionality or additional devices such as cameras or lights. After running the instrument, the boxes for setting parameters change to text and the submit buttons vanish. Figure A2 B shows live graphs of the motor current, cable length (measured from turns of the pulley), and depths data. The data presented in here are simulated data, as the web interface was developed during the campaign in Patas. Consequently, only data from the laboratory are available. These data do not include information from the solar modules. Figure A2 C, shows the full logging stream to verify the proper functionality of WILMO. This is a particularly useful tool when the device is controlled remotely. It should be noted that the camera streams are not yet integrated on this webpage and remain as a future task.
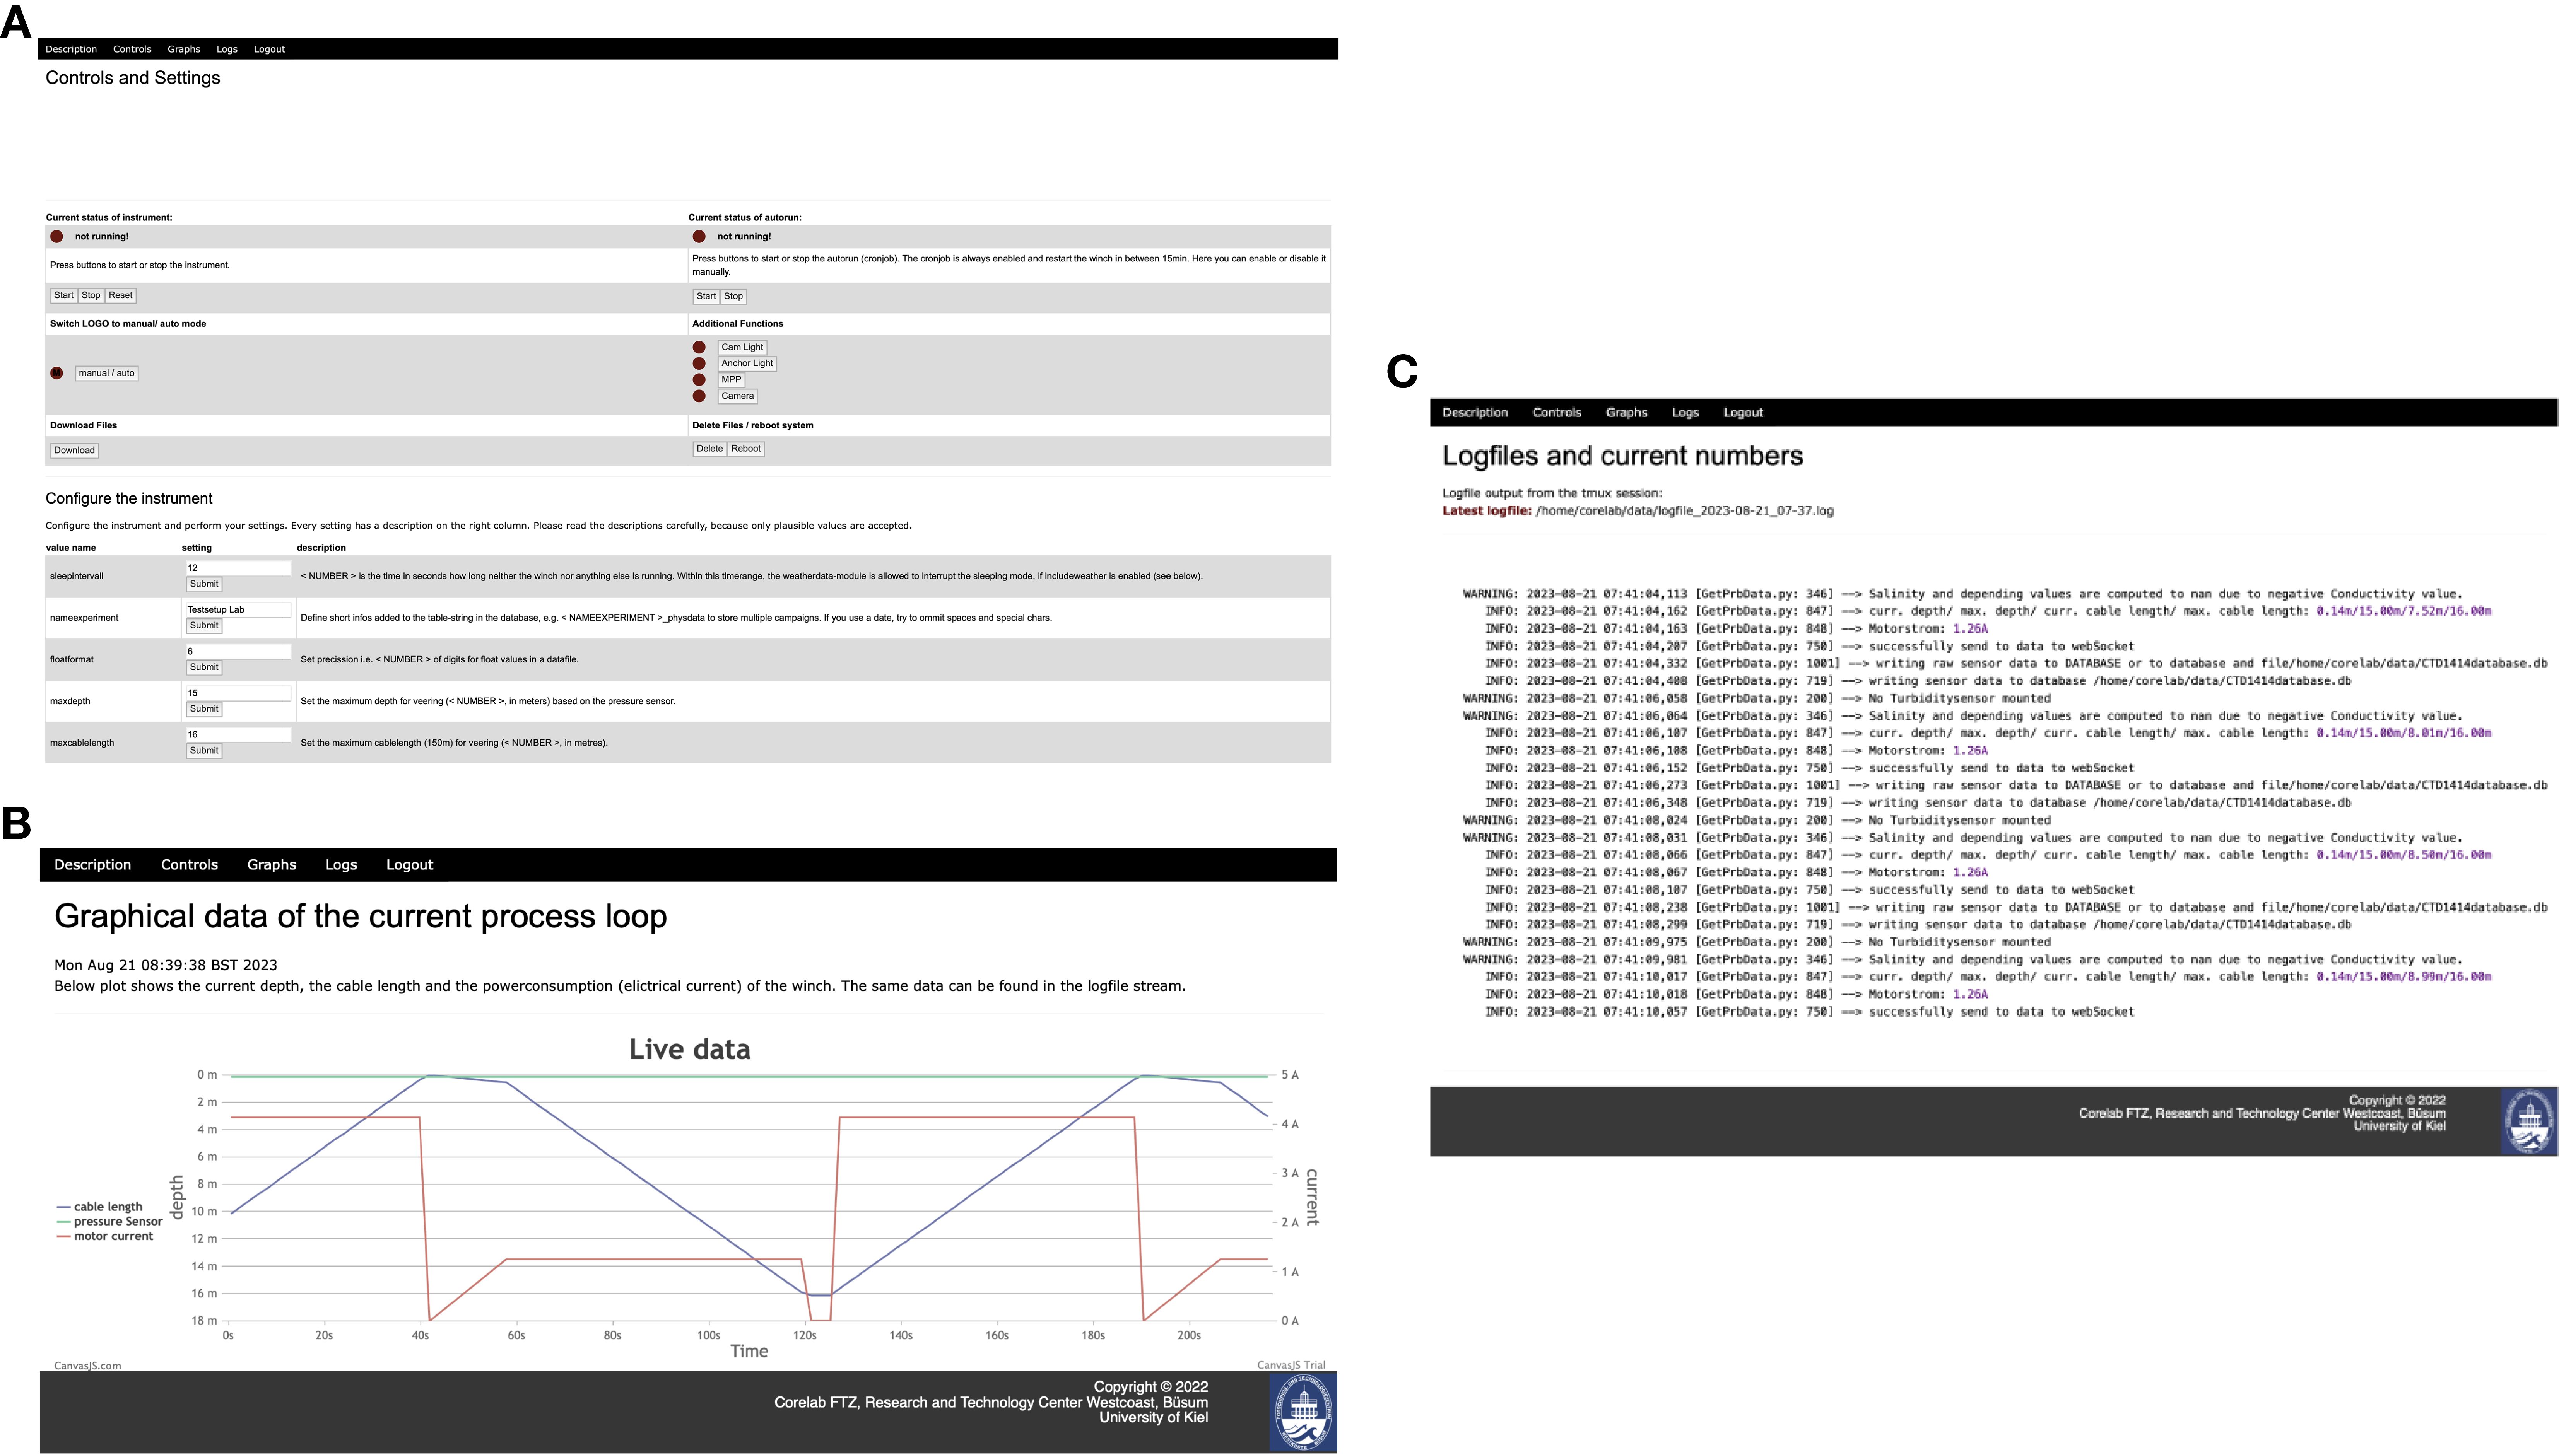
Figure A2. The graphical control and inspection interface is structured in different tabs. (A) shows the control tab, where only some of the adjustable parameters are shown. (B) is a live graph for the motor current, the cable length and the depth. The data shown are simulated data in the lab. The stream of the log file is shown in (C).
Appendix C Interpolation quality used for residual computation
The flow velocity dataset from WILMO has a higher resolution than that of the ADCP02 and the data are ordered differently. In order to compute the residual of the two datasets (section 3.2.2), WILMOs data are reduced and interpolated. Figure A3 shows the flow velocity map before (Figure A3 A) and after (Figure A3 B) interpolating the vertical and temporal ranges corresponding to the resolution of the ADCP02 dataset. Only minor differences in magnitude can be found. Differences occur at the surface and the ground, because ordering the data means to add, remove or combine values regarding the closest match algorithm.
Keywords: autonomous, observation, coastal ocean, CTD profiling, monitoring, measurement system
Citation: Deschner SC, Bojens G, Orhan K, Nasukha A and Voigt W (2024) WILMO: an automated profiling system for coastal waters. Front. Mar. Sci. 11:1450207. doi: 10.3389/fmars.2024.1450207
Received: 17 June 2024; Accepted: 05 September 2024;
Published: 24 October 2024.
Edited by:
Philipp Friedrich Fischer, Alfred Wegener Institute Helmholtz Centre for Polar and Marine Research (AWI), GermanyReviewed by:
Marc Le Menn, Service Hydrographique et Océanographique de la Marine (SHOM), FranceViviana Piermattei, Foundation Euro-Mediterranean Center on Climate Change (CMCC), Italy
Copyright © 2024 Deschner, Bojens, Orhan, Nasukha and Voigt. This is an open-access article distributed under the terms of the Creative Commons Attribution License (CC BY). The use, distribution or reproduction in other forums is permitted, provided the original author(s) and the copyright owner(s) are credited and that the original publication in this journal is cited, in accordance with accepted academic practice. No use, distribution or reproduction is permitted which does not comply with these terms.
*Correspondence: Stephan C. Deschner, c3RlcGhhbi5kZXNjaG5lckBoZXJlb24uZGU=
 Stephan C. Deschner
 Gero Bojens2
 Kadir Orhan
 Afifah Nasukha
