- 1Innovative Institute of Animal Healthy Breeding, Zhongkai University of Agriculture and Engineering, Guangzhou, China
- 2College of Animal Science and Technology, Zhongkai University of Agriculture and Engineering, Guangzhou, China
Epinephelus bilobatus, Epinephelus maculatus and Epinephelus longispinis are three groupers that share common morphological characteristics and coloration patterns and have been morphologically confused and misidentified with each other for a long time. Complete mitochondrial genomes of the three groupers were determined and analyzed in this study. Mitogenomes of E. bilobatus, E. maculatus and E. longispinis were 17, 354 bp, 17, 066 bp and 17, 221 bp in size respectively and consisted of 13 protein-coding genes, two ribosomal RNA genes and one control region. However, different from most teleosts, which contain canonical 22 tRNAs, more numbers of tRNAs were identified in the three groupers with 27 tRNAs in E. bilobatus and E. longispinis and 25 tRNAs in E. maculatus. The increased number of tRNAs was due to the presence of tandemly duplicated tRNA-Asp genes that were located between tRNA-Ser and COII genes (six duplications in E. bilobatus and E. longispinis, four duplications in E. maculatus). Intact gene tandem duplication was an uncommon feature that was found in the typical teleost mitogenomes. The phylogenetic trees of the 32 groupers (genus Epinephelus) that were constructed based on 12 protein-coding genes revealed that Epinephelus species with tandemly duplicated tRNA-Asp genes were clustered into one monophyletic group, distinct from other Epinephelus species without any duplication features, which indicated that tandemly duplicated tRNA-Asp genes may be the particular linage-specific characteristics that evolve from a common ancestor and have the ability to distinguish them from other Epinephelus species. The results of the mitogenomes comparative analyses of the three groupers revealed the genetic distance of mitogenomes between each two species to be 0.062 (E. bilobatus vs E. maculatus), 0.091 (E. bilobatus vs E. longispinis) and 0.087 (E. maculatus vs E. longispinis). All values were far greater than the minimum value of 0.020 for species identification, which shows that they were three independent species at molecular level. Regarding the relationships between the three groupers, E. bilobatus was found to be more closely related to E. maculatus in comparison to E. longispinis. The results provide valuable molecular data for the species identification and phylogenetic analyses on E. bilobatus, E. maculatus and E. longispinis, and also provided a new insight into the tandem gene duplication features of Epinephelus mitogenomes.
1 Introduction
The mitochondrial genomes (mitogenomes) of vertebrates are circular and their covalently closed double-stranded DNA molecules range in size from 15~20 kb (Boore, 1999). Typically, the structures contain 13 protein-coding genes (PCGs), two ribosomal RNA (rRNA) genes, 22 transfer RNA (tRNA) genes and one noncoding control region (CR) (Wolstenholme, 1992; Boore, 1999). Due to their characteristics of simple structure, maternal inheritance, conserved gene arrangement, and a high evolutionary rate, the mitogenomes are widely used as an effective molecular marker for various evolutionary studies, which include molecular phylogeny, species identification, population genetics and adaptive evolution (Sharma et al., 2020; Wang et al., 2022; Zhao et al., 2022; Zhou et al., 2023).
The gene order of the mitogenomes of different vertebrates is generally conserved and they share the same organization. However, as sequencing technology has developed, more mitogenomes are sequenced and available online, A variety of patterns such as gene rearrangement, loss and duplication that deviate from the normal gene organization have been found in different species, including fish, amphibians, reptiles and mammals (Miya and Nishida, 1999; San Mauro et al., 2006; Papetti et al., 2007; Kumazawa et al., 2014; Prada and Boore, 2019; Zhao et al., 2022). Regarding fish mitogenomes, some reports have discovered the special structure of gene rearrangement, including in the orders Anguilliformes, Pleuronectiformes, Perciformes and Myctophiformes (Ki et al., 2008; Poulsen et al., 2013; Shi et al., 2014; Lü et al., 2019). However, few studies have reported gene duplication (Williams et al., 2012; Zhuang et al., 2013). Although tandem repeats are commonly found in the control region of some mitogenomes (Bentzen et al., 1998; Terencio et al., 2013; Su et al., 2015), intact gene tandem duplication may be rare in fish mitogenomes. Over 10,000 complete mitogenomes of fish are available in the NCBI database, but the percentage of gene duplication in fish mitogenomes is potentially below 1%.
Fish of the genus Epinephelus, which are commonly known as groupers, are global marine fish that are mainly distributed in tropical and subtropical waters worldwide. They often inhabit the coastal waters of coral reefs, although some species live in estuaries or on rocky reefs (Baldwin et al., 1994; Craig et al., 2012). They show wide variation in terms of external appearance, from almost uniform to diverse patterns of spots, blotches, stripes bands and reticulations. Most groupers share similar appearances and color patterns, making it difficult to distinguish between them (Baldwin et al., 1994; Craig et al., 2012). The two groupers Epinephelus bilobatus (Randall and Allent, 1987) and Epinephelus maculatus (Bloch, 1790) are both reticulated coral-reef groupers. E. maculatus is distributed in areas of the Indo-Western Pacific and E. bilobatus is only found in the northwestern Australia. Morphologically, both groupers share resembled morphological appearance: brown in color, rounded caudal fin, close-set dark brown spots extend onto soft dorsal, caudal and anal fins where the pale interspaces form a network pattern. E. bilobabtus was previously confused with E. maculatus and illustrated in color (as “Epinephelus maculatus”) by Allen (Allen, 1985) and Sainsbury et al (Sainsbury et al., 1985). Randall was able to distinguish them in 1987 and described E. bilobatus as a new species (Randall and Allent, 1987). E. bilobabtus differs from E. maculatus as it usually has 16 instead of 17 dorsal soft rays, fewer scales in longitudinal series, fewer gill rakers and has three large, bilobed, dark brown spots or close-set pairs of spots along the base of the dorsal fin. In addition, Epinephelus longispinis (Kner, 1864) was also misidentified as E. maculatus (Baldwin et al., 1994; Nair, 2018) due to similarities in terms of the number of fin rays, scales and gill rakers, morphometric features, elevated anterior dorsal-fin spines and a distinct step-like indentation on the ventral edge of the maxilla.
Despite the morphology-based descriptions, no molecular studies have been conducted on the three debated species and whether they are three distinct species at the molecular level is unclear. This study determines the complete mitogenome sequences of E. bilobabtus, E. maculatus and E. longispinis and comparatively analyses their mitogenome structure and nucleotide variation as a means of verifying their species validity. Gene duplications and their phylogenetic relationships with the previously published Epinephelus mitogenomes are investigated in order to infer their evolutionary status among species. The results will provide molecular evidence for species identification and offer further insights into gene duplication and phylogenetic relationships for the Epinephelus species.
2 Materials and methods
2.1 Sample collection and genomic DNA extraction
Specimens of E. maculatus and E. longspinis were collected from the fish market in Sanya City, Hannan Province, China. E. bilobabtus was collected from the fish market in Shenzhen City, Guangdong Province and was imported from Australia. Species identifications were performed in accordance with FAO Groupers of the World (Baldwin et al., 1994; Craig et al., 2012; Froese and Pauly, 2023). A small piece of fresh muscle tissue was sampled and immediately preserved in 95% ethanol. Total genomic DNA was extracted using a Tissue Genomic DNA Extraction kit (Omega, USA). The protocol of the manufacturer was followed and the CAN was stored at -20°C. All experimental procedures were conducted in agreement with the guidelines for the care and use of laboratory animals approved by the Institutional Animal Care and Use Committee in Zhongkai University of Agriculture and Engineering, Guangdong, China. The approval code and date were as follow, Approval code: ZHKUMO-2023-087, Date: 24 Jun 2023.
2.2 Primer design and long-PCR amplification
The complete mitochondrial genome of the three groupers was amplified using the long polymerase chain reaction (PCR) method. 16 primer pairs were designed for amplifying contiguous and overlapping segments of the three grouper mitogenomes based on the previous methods of (Zhuang et al., 2009). The parameters for PCR reactions were followed according to manufacturer recommendations. All PCR products were purified using a QIAquick Gel Extraction Kit (Qiagen, German) and determined by sanger sequencing.
2.3 Sequence analysis
The sequencing data was manually proofread and edited using ChromasPro v.1.42 and the three whole mitogenomes were then assembled using Sequencher v.4.7 (Gene Codes Corp.) The mitogenome information was deposited in GenBank. The three mitogenomes were annotated with MITOS2 Web Server (Bernt et al., 2013). The boundaries of 13 protein-coding genes and two ribosomal RNA (rRNA) genes were identified and annotated based on the alignments with other mitogenomes of related Epinephelus species using DNAman v6 software (Lynnon Biosoft, San Ramon, CA, USA) (Wang, 2015). The tRNA genes and their secondary structures were identified by online tRNAscan-SE Search Server v2.0 (Washington University School of Medicine, St Louis, MO, USA) (Lowe and Chan, 2016).
The circular genome map of the three mitogenomes was created using CGView Server v1.0 (Grant and Stothard, 2008) (Figure 1). The base compositions, relative synonymous codon usage (RSCU) values, for protein-coding genes, pairwise sequence identities and divergences were calculated using the MEGA X program (Kumar et al., 2018) (Tokyo Metropolitan University, Tokyo, Japan). Strand asymmetry was calculated using the following formulas: AT skew = [A−T]/[A+T] and GC skew = [G−C]/[G+C].
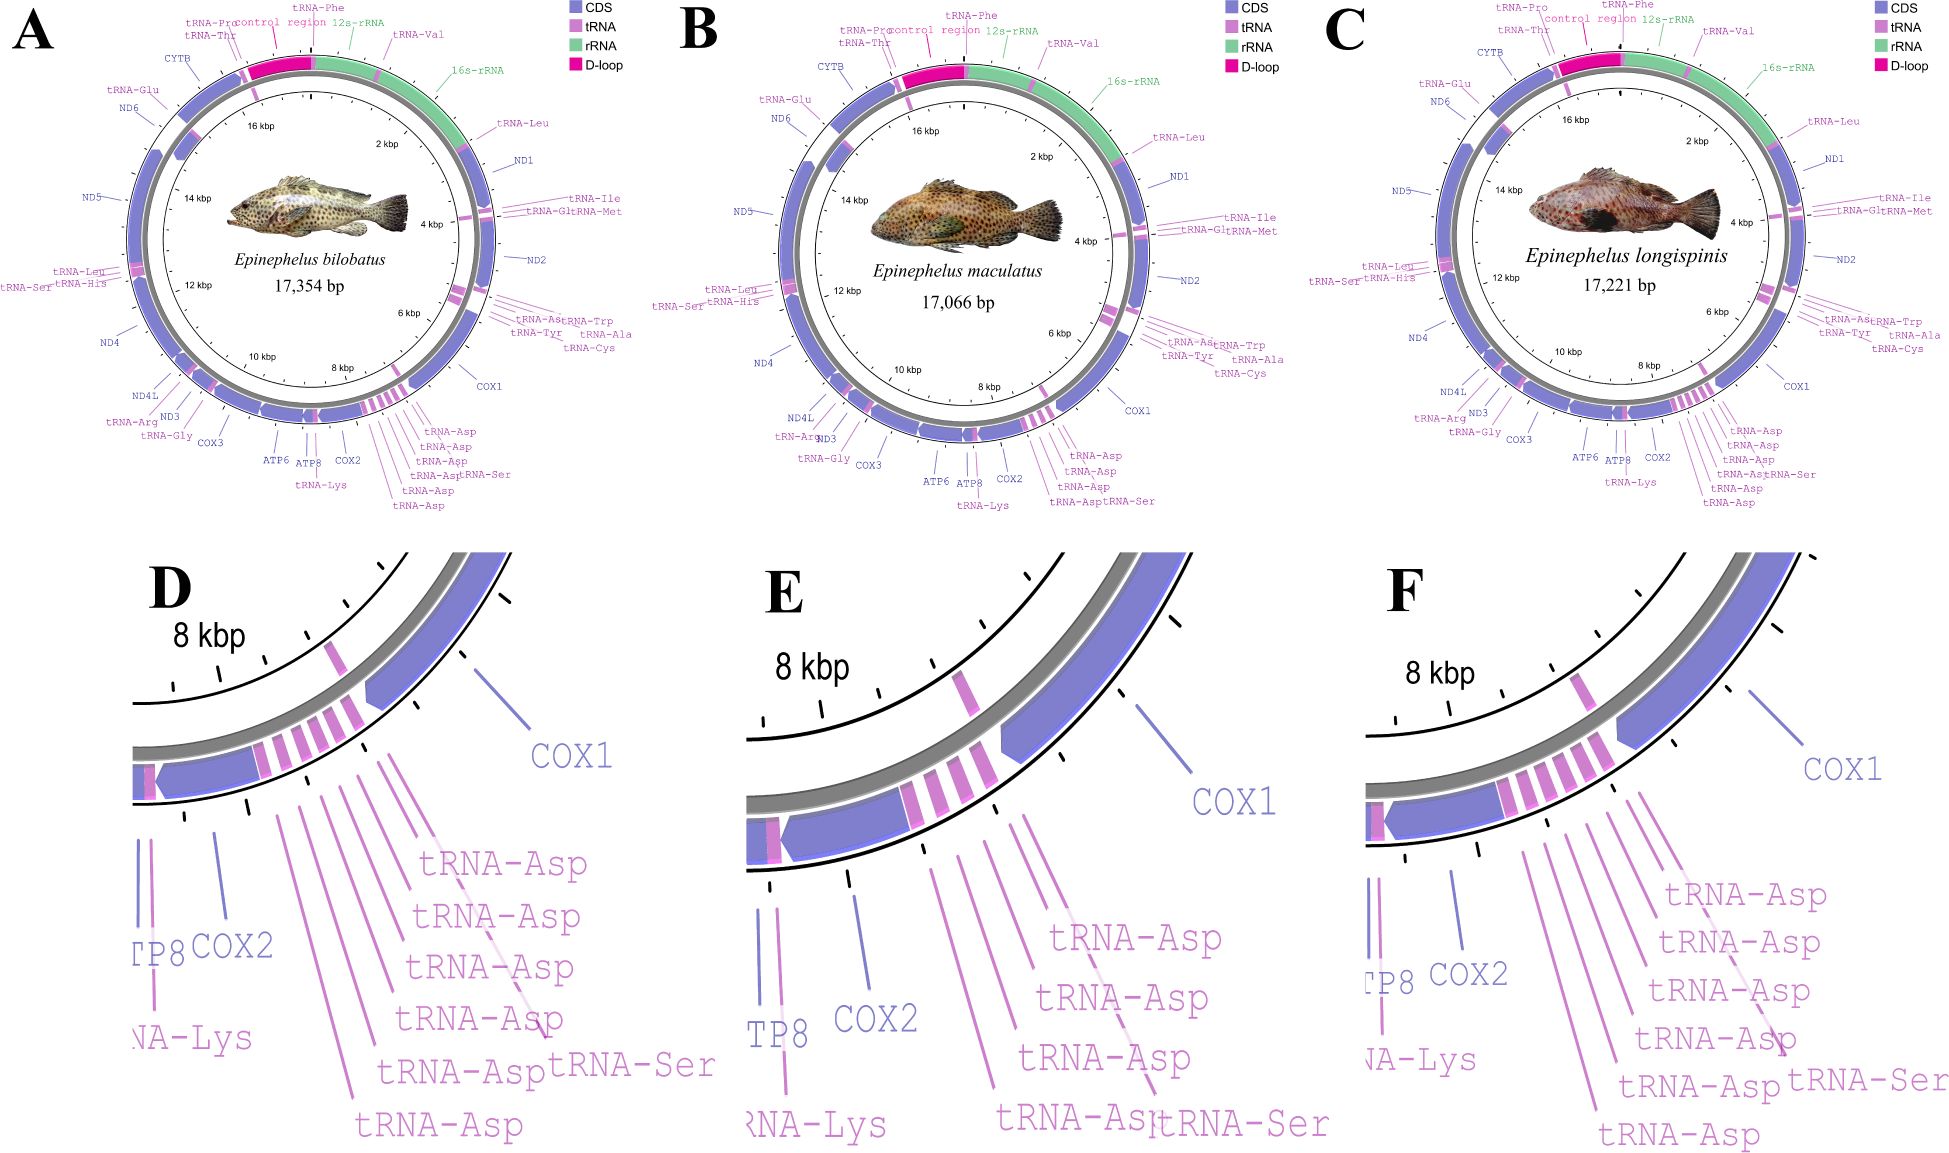
Figure 1. Graphical maps of mitogenome of E. bilobatus (A), E. maculatus (B) and E. longispinis (C); structure of tandem duplication tRNA-Asps of E. bilobatus (D), E. maculatus (E) and E. longispinis (F).
2.4 Phylogenetic analysis
29 Epinephelus mitogenomes that were available in the NCBI database were downloaded and used for phylogenetic analysis (Table 1) and Cephalopholis species Cephalopholis leopardus and Cephalopholis boenak which were also in family Epinephelidae and closely related with Epinephelus, were chosen as the outgroups. 12 PCGs (excluding ND6 gene) were concatenated for the phylogenetic analyses. The ND6 gene was not used due to its heterogeneous base composition and consistently poor phylogenetic performance (Miya et al., 2003; Shi et al., 2011). The sequences were aligned using MAFFT v.7.407 (Nakamura et al., 2018) under default settings. Poorly aligned positions and divergent regions were then eliminated using Gblocks v.0.91b (Castresana, 2000). The best sequence evolution model was determined through the use of PartitionFinder version 2.1.1 (Australian National University, Canberra, ACT, Australia) (Lanfear et al., 2017) and the GTR+I+G (general time reversible) model was determined as being the best model for data computing. Phylogenetic relationships were reconstructed using the Maximum Likelihood (ML) and Bayesian inference (BI) methods. ML phylogenetic analysis was performed using RAxML v.8.2.9 (Stamatakis, 2014) and a consensus tree was obtained with 1,000 bootstrap replicates. Bayesian phylogenetic analysis was performed using MrBayes v.3.2.7a (Ronquist et al., 2012) with the Markov chain Monte Carlo (MCMC) method. The MCMC simulation was run for 10 million generations and trees were sampled and saved every 1,000 generations (10,000 trees saved per run). The initial 25% of the runs were discarded as burn-in and the bootstrap value of the internal branch of the phylogenetic tree was supported by the posterior probabilities. The final phylogenetic tree was visualized and embellished in FigTree v.1.4.3 (http://tree.bio.ed.ac.uk/sofw are/fgtree/) (Rambaut, 2020).
2.5 Divergence time estimation
The divergence time of Epinephelus species were estimated within a Bayesian framework using 13 protein-coding genes (PCGs), the uncorrelated lognormal relaxed molecular clock model was employed in BEAST v1.8.4. (Drummond et al., 2012). Three calibration points were selected basing on the fossil records in TimeTree (http://www.timetree.org/). These calibration points were: 7.1-19.2 Mya between E. hexagonatus and E. tauvina, 2.1-7.8 Mya between E. coioides and E. malabaricus. The species divergence times were estimated using the mcmctree program with parameters set as clock = 2, burnin = 2000, sampfreq = 10, and nsample = 20000. After running, the divergence time tree was visualized using software FigTree v1.4.3 (Rambaut, 2020).
3 Results
3.1 Mitogenome organization and composition
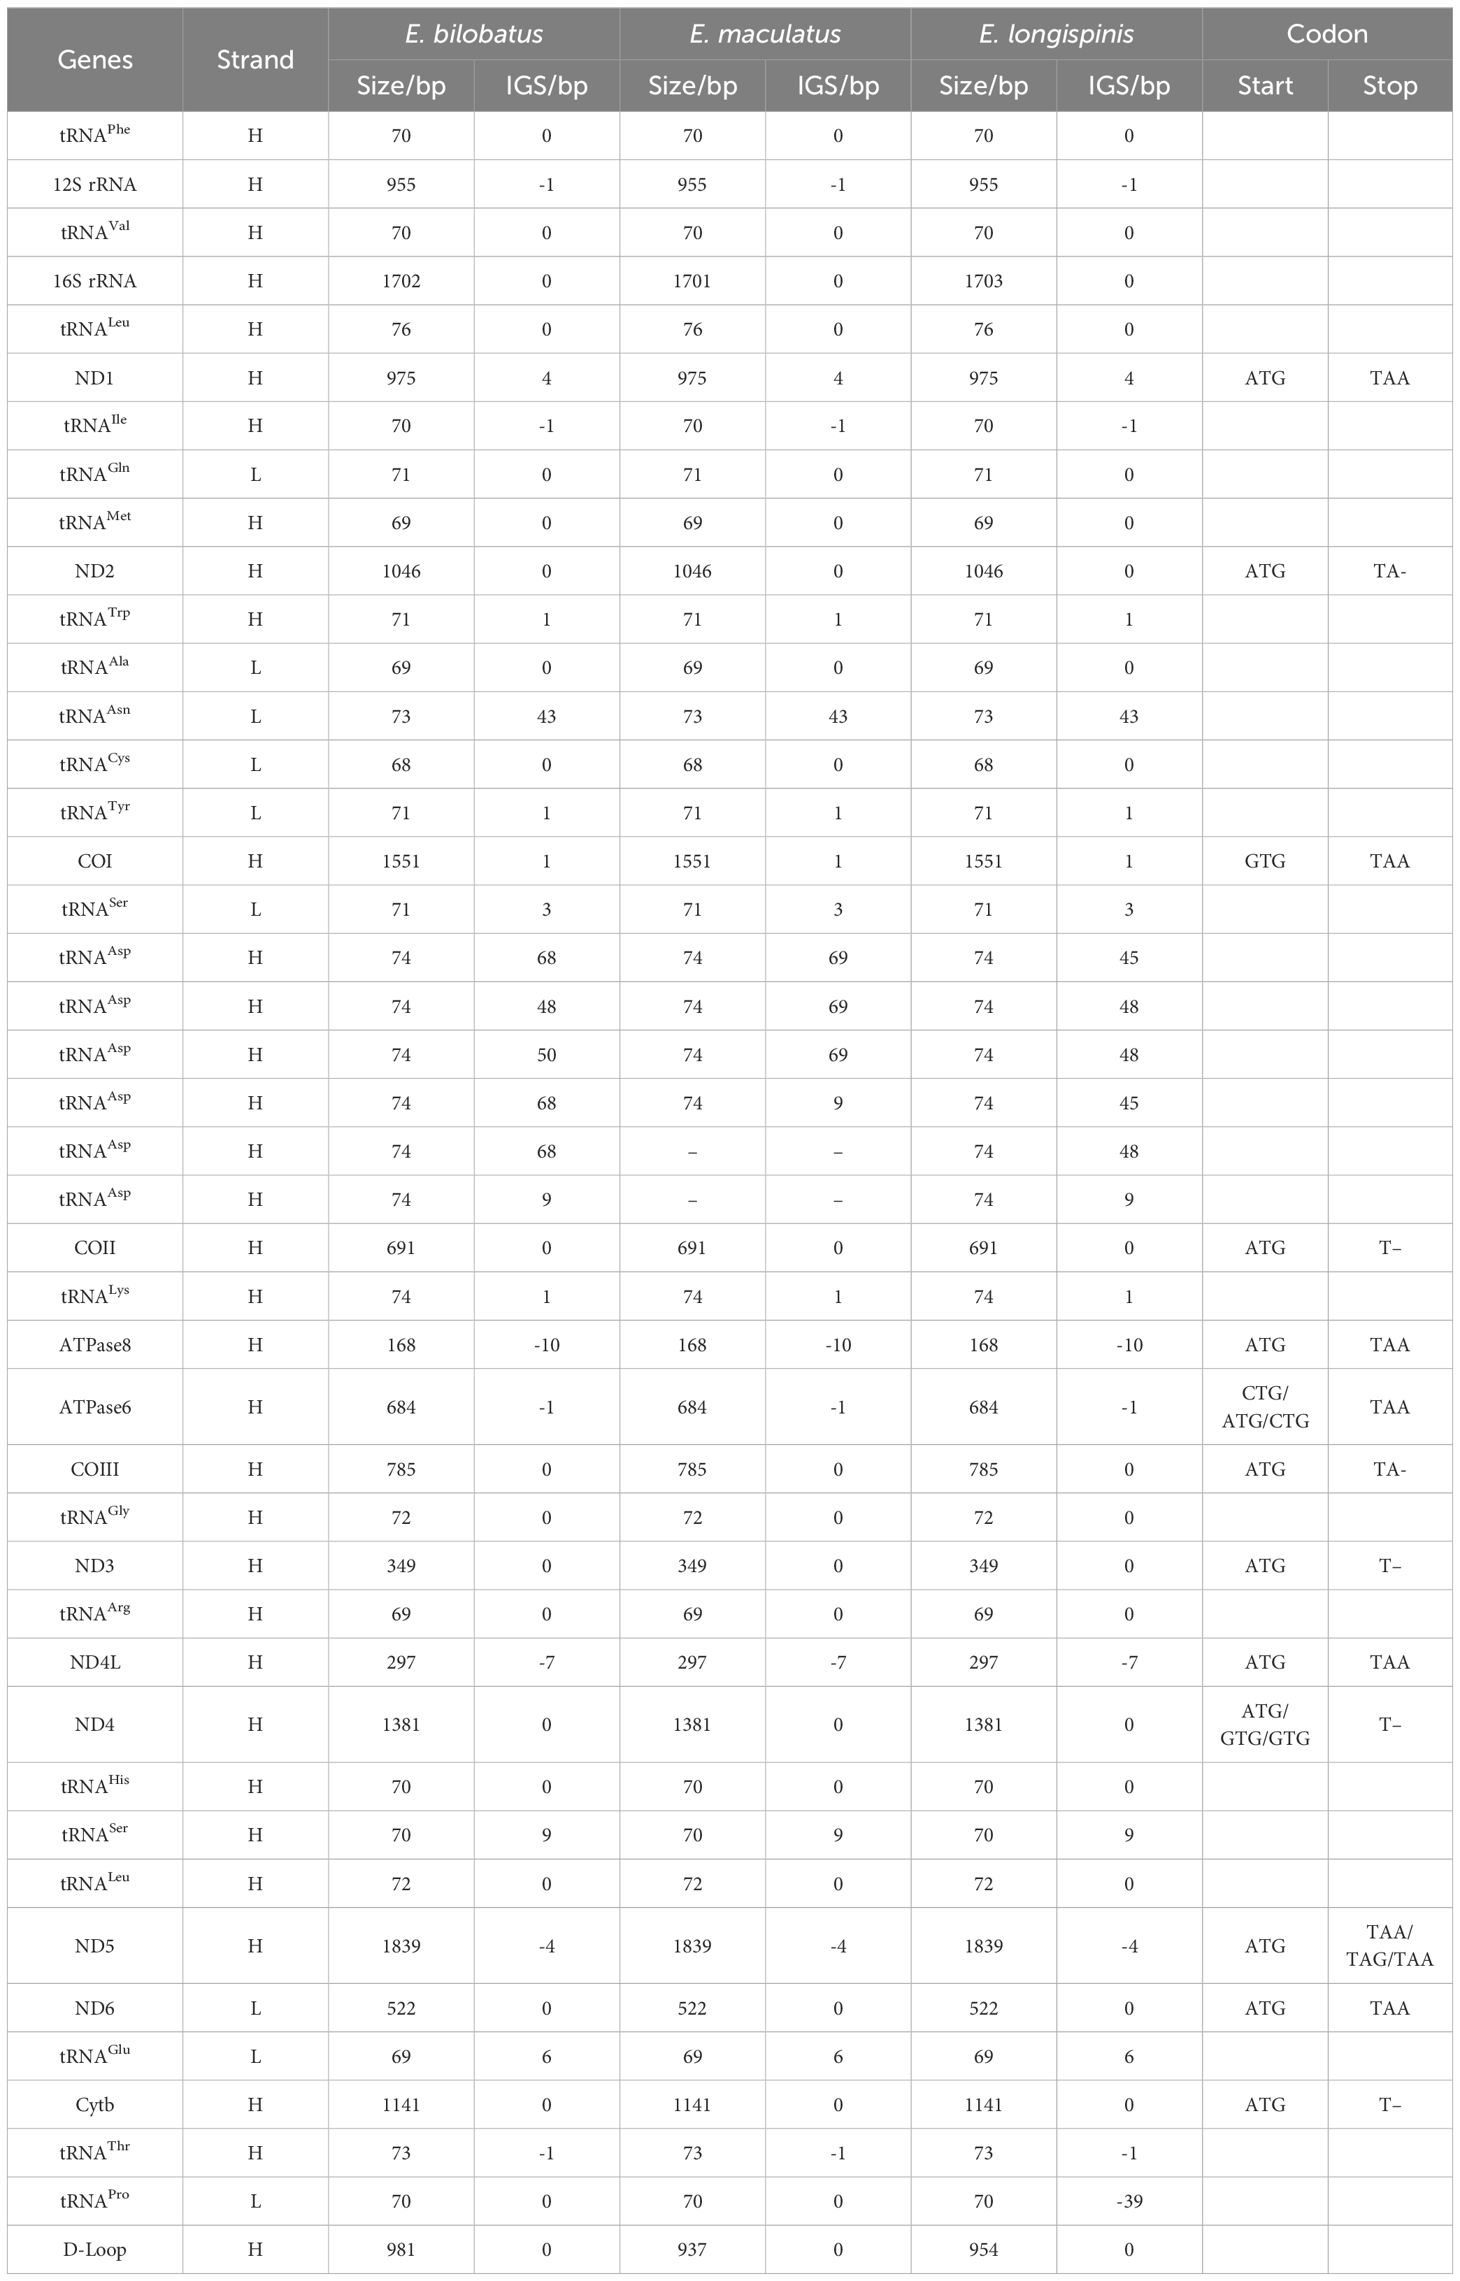
The complete mitochondrial genomes of E. bilobatus, E. maculatus and E. longispinis had respective lengths of 17,354 bp, 17,066 bp and 17221 bp (Accession number: E. bilobatus, ON321831; E. maculatus, ON321832.1 and E. longispinis, PP541399). The mitogenome organizations of the three groupers comprised 13 typical vertebrate protein-coding genes(PCGs), two ribosomal RNA (rRNA) genes and one control region. Inconsistent with most teleosts, the number of tRNAs varied; there were 27 tRNAs in E. bilobatus and E. longispinis and 25 tRNAs in E. maculatus. This was more than the number of canonical 22 tRNAs in the majority of teleosts. Certain tandem duplications of tRNA-Asp genes were found between tRNA-Ser and COII in the three mitogenomes, which led to a greater number of tRNAs in the three genomes. There were six tRNA-Asp duplications in E. bilobatus and E. longispinis and four tRNA-Asp duplications in E. maculatus. Most genes were encoded on the heavy-strand (H-strand) while eight tRNA (tRNA-Gln, tRNA-Ala, tRNA-Asn, tRNA-Cys, tRNA-Tyr, tRNA-Ser(UCN), tRNA-Glu and tRNA-Pro) and ND6 were encoded on the L-strand (Table 1) (Figures 1A–C).
The overall nucleotide compositions of the three mitogenomes were found to be similar, with the range of A: 28.54%~28.77%, G: 16.29%~16.42%, C: 28.11~28.28%, T: 26.54%~26.87%. A bias of A+T% and strong anti-bias of G was observed (Figure 2). AT-skews of the three mitogenomes were all positive and barely above zero (0.0065~0.0403), while GC-skews were all negative and below -0.20 (-0.2663~-0.2417) (Figure 3).
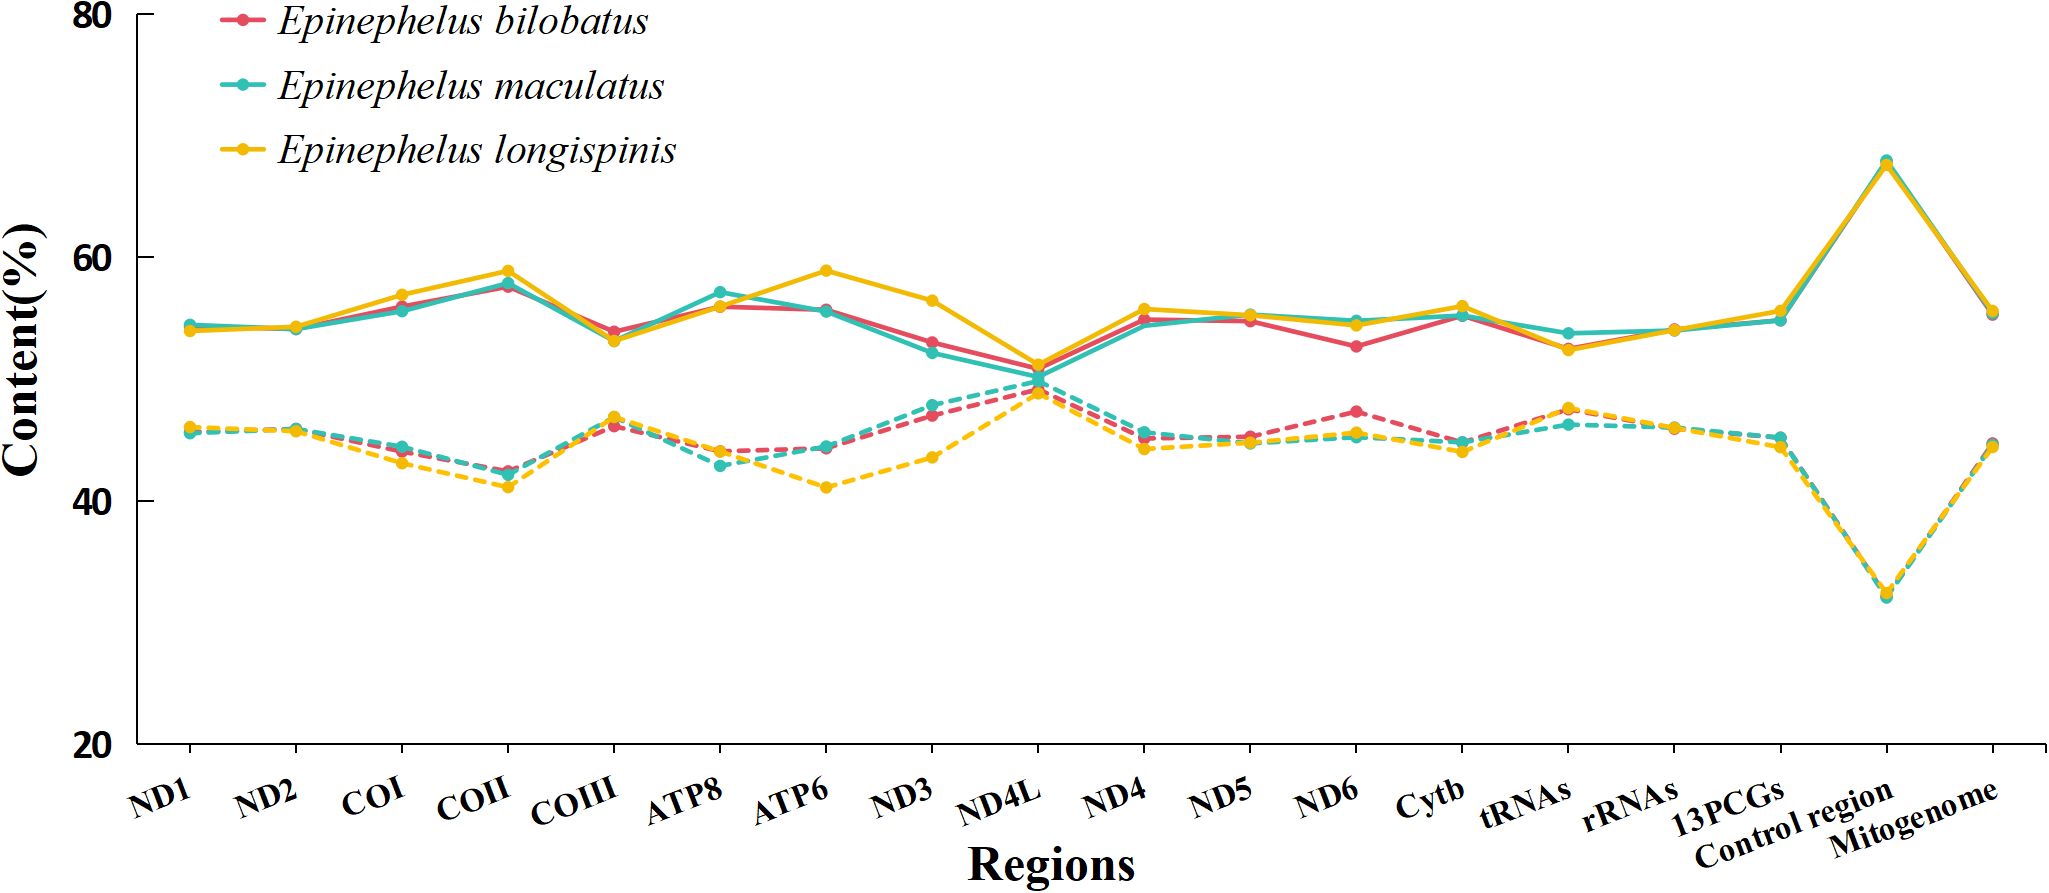
Figure 2. Base composition of the complete mitogenomes of E. bilobatus, E. maculatus and E. longispinis (Solid line represents AT content, the dashed line represents GC content).
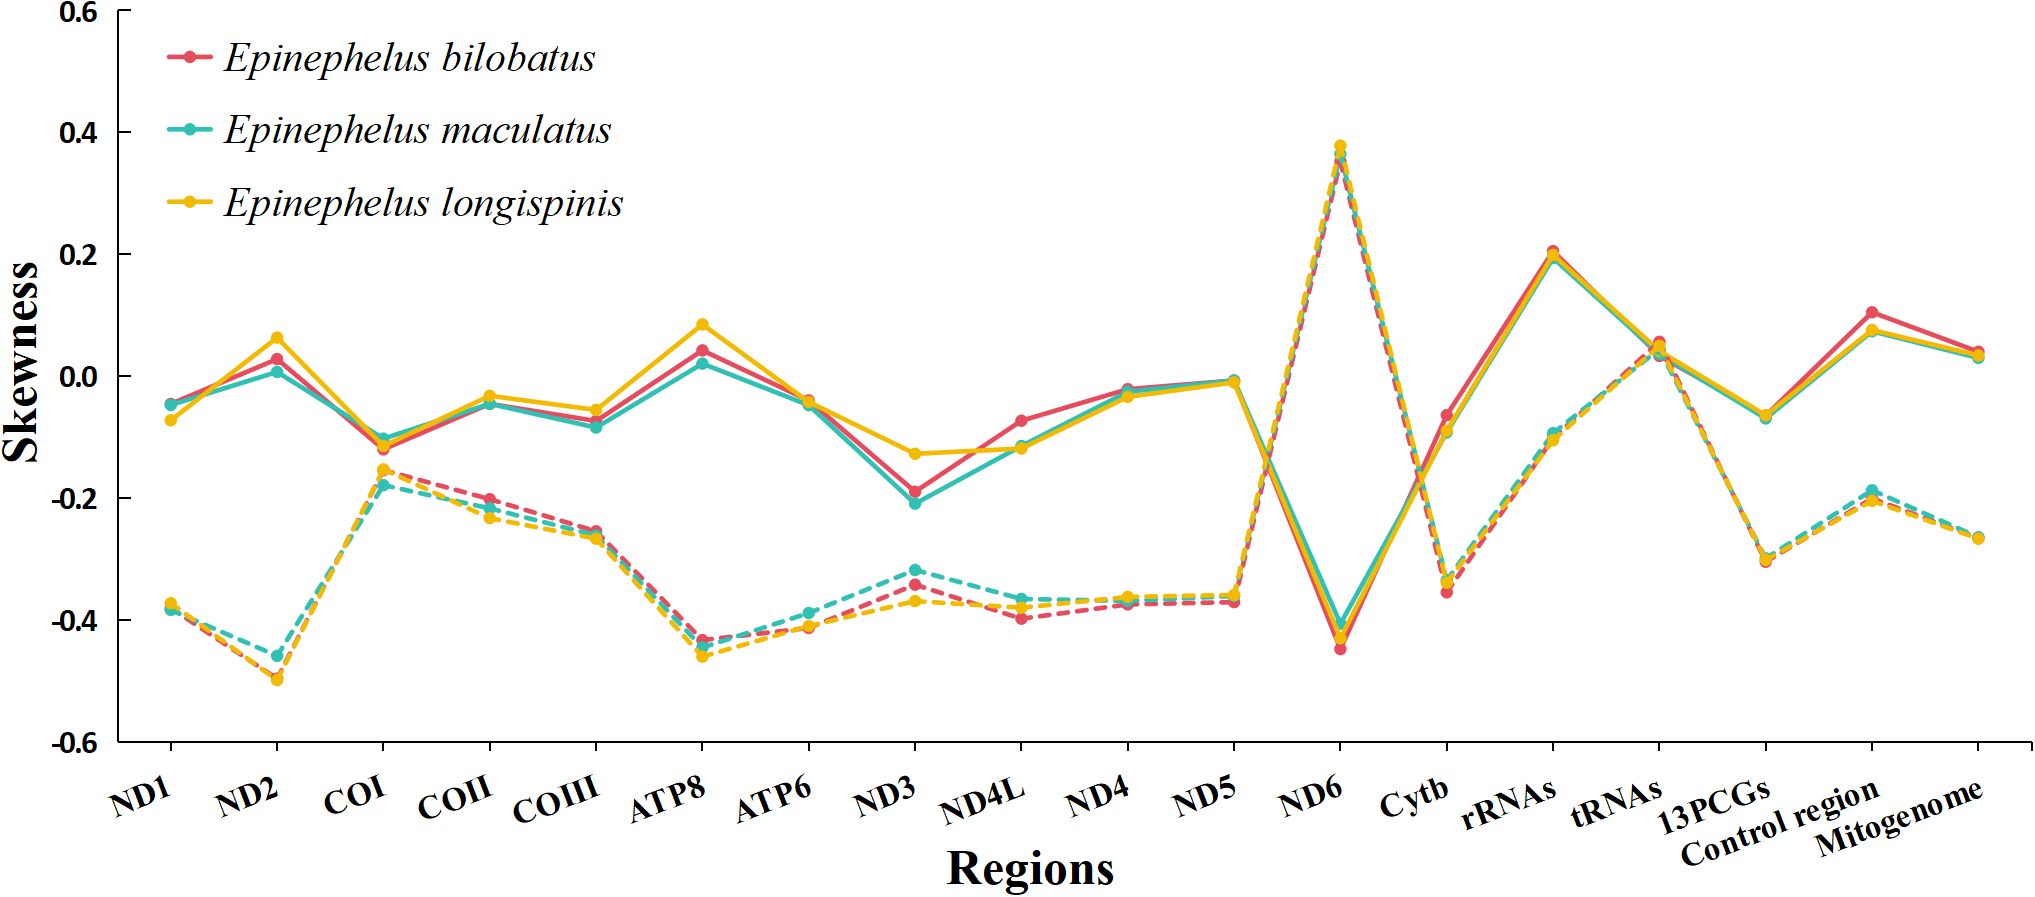
Figure 3. Skewness of the complete mitogenomes of E. bilobatus, E. maculatus and E. longispinis (Solid line represents AT skew, the dashed line represents GC skew).
3.2 Protein-coding genes
The 13 protein-coding genes of E. bilobatus, E. maculatus and E. longispinis were all 11,429 bp in length, accounting for respective total mitogenome percentages of 65.86%, 66.97% and 66.37%. All genes were found to be located on the heavy strand, except ND6 gene. AT-skews in the 13 protein-coding genes of the three mitogenomes were all negative (-0.0691 ~ -0.0639), with the exception of ND2 and ATP8 and GC-skews were negative (-0.3040 ~ -0.2986) apart from ND6. The AT-skews in ND6 (-0.4472 ~ -0.4057) and GC-skews in ND2 (-0.4980 ~ -0.4583) were lowest (Figure 3).
The majority of protein-coding genes shared the same start codon ATG, apart from COI (GTG), ATPase6 (CTG in E. bilobatus and E. longispinis) and ND4 (GTG in E. maculatus and E. longispinis). In the stop codons, ND5 was terminated with TAA (E. bilobatus and E. longispinis) or TAG (E. maculatus), while the remaining genes were all terminated with complete stop codon TAA (ND1, COI, ATPase8, ATPase6, ND4L and ND6) and incomplete stop codon TA (ND2 and COIII) or T (COII, ND3, ND4 and Cyt b).
The relative synonymous codon usage (RSCU) values of the three groupers were summarized and can be seen in Figure 4. The total number of amino acids was 3,800 in each grouper, excluding start and stop codons. The usage of both two- and four-fold degenerate codons was biased in the three groupers. Codons ending in A and C were the most abundant while G was the least used and presented a strong anti-G bias. CGA for Arg, CUA for Leu and UCA for Ser occurred most frequently, while UCG for Ser, GCG for Ala and ACG for Thr occurred the least frequently in the three mitogenomes.
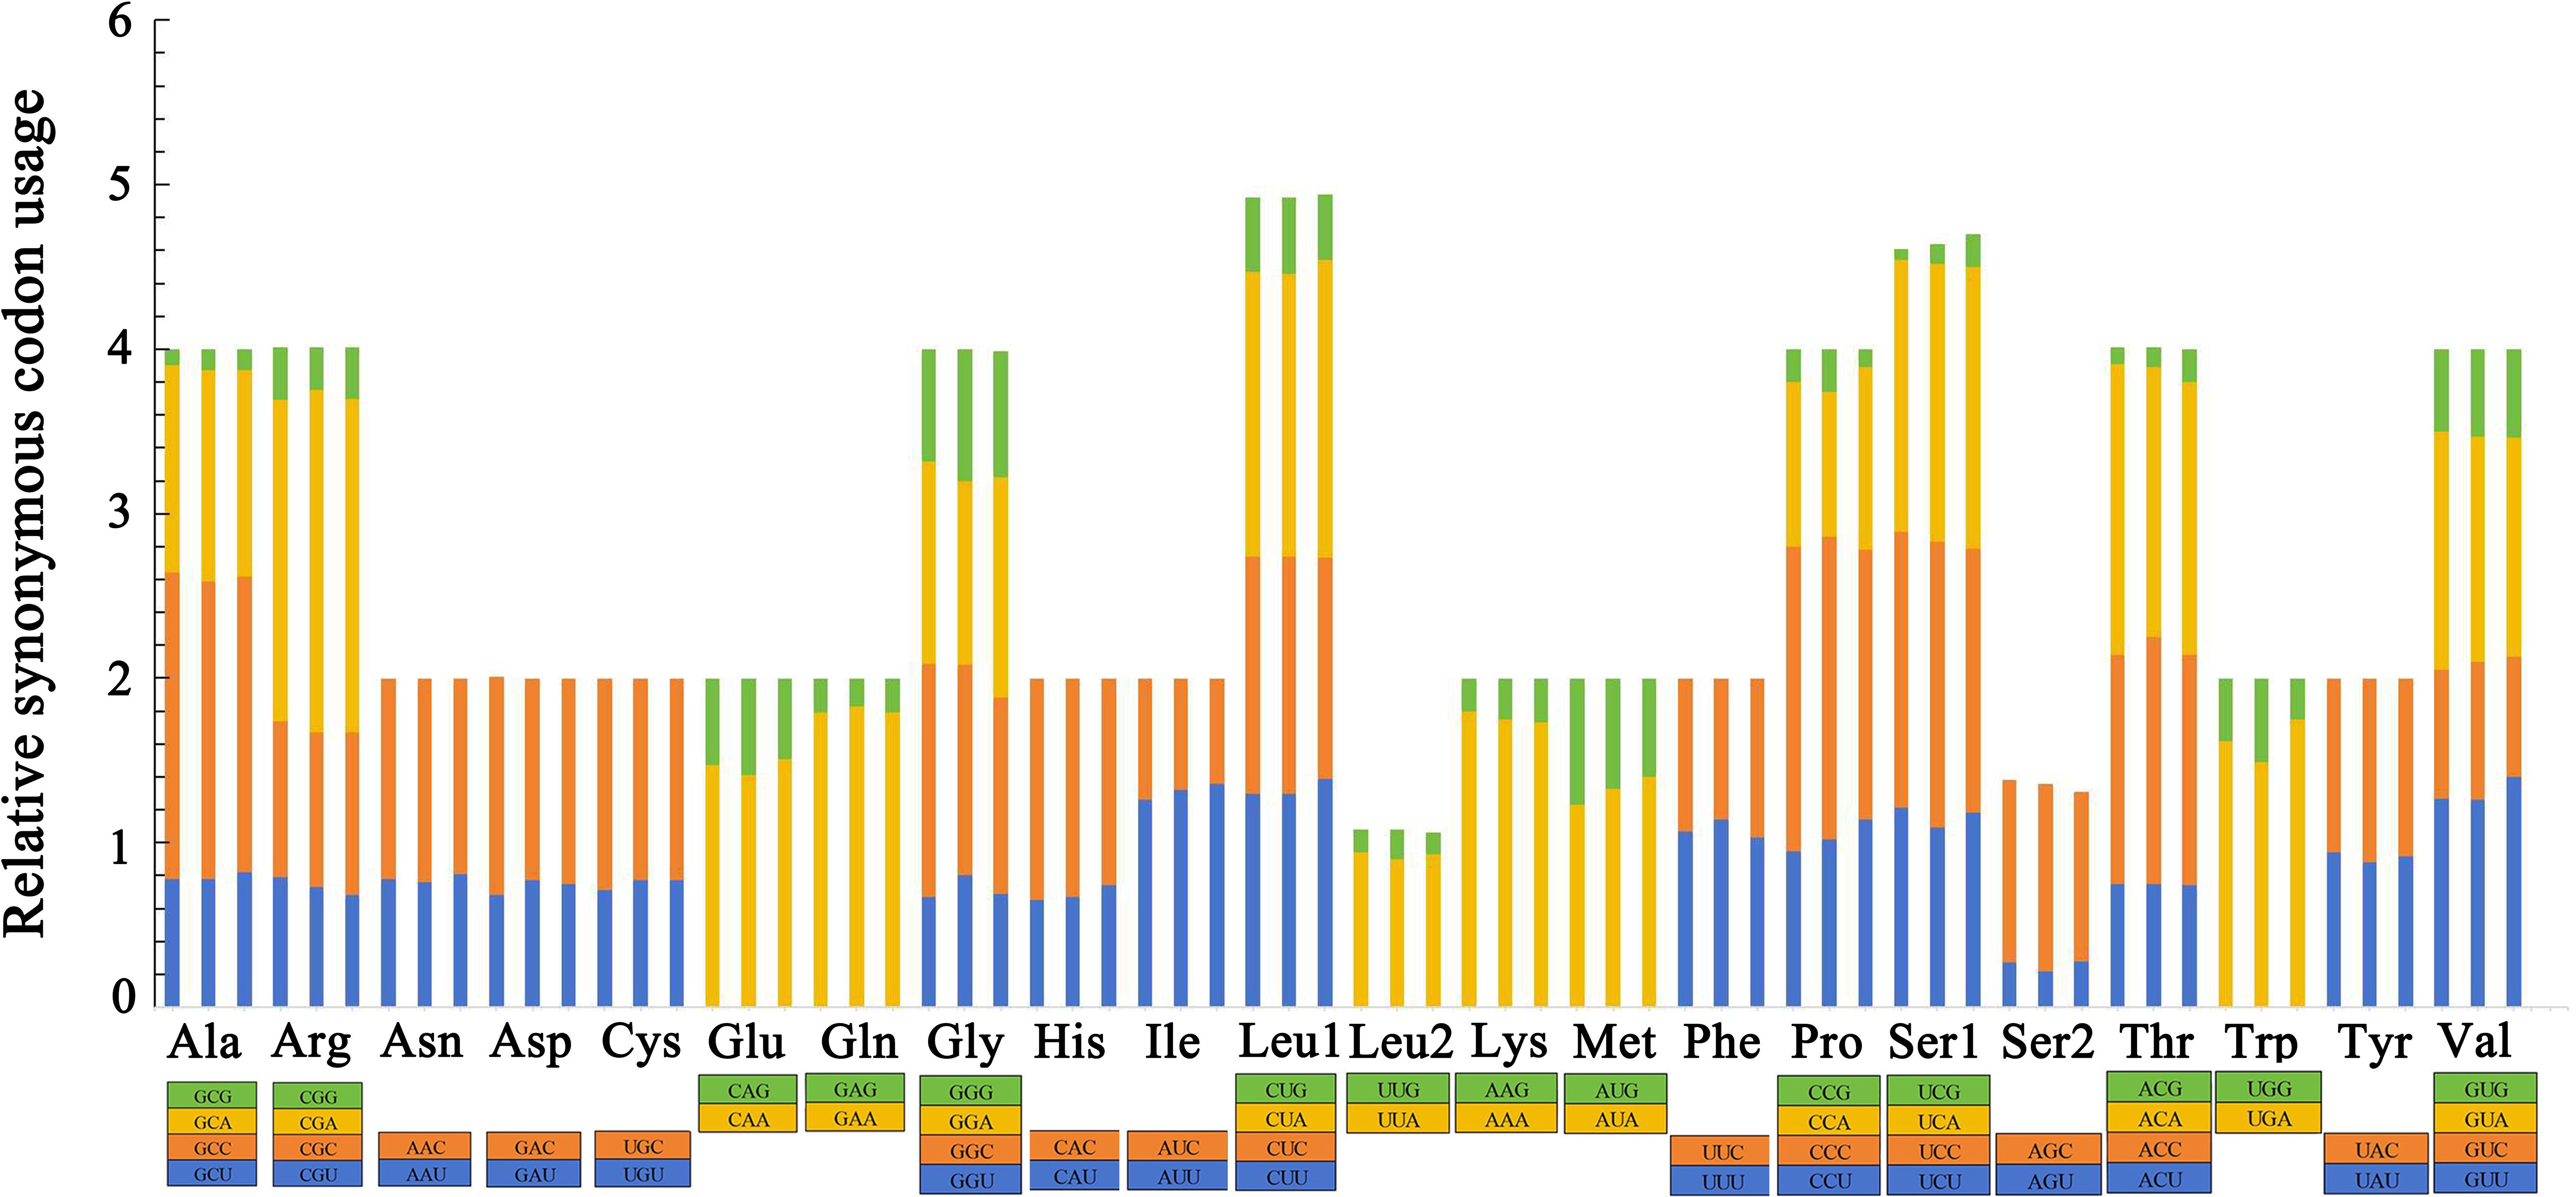
Figure 4. Relative synonymous codon usage (RSCU) in the mitogenomes of E. bilobatus (First), E. maculatus (Second) and E. longispinis (Third).
Patterns of amino acid composition in 13 PCGs of the three groupers can be seen in Figure 5. The most frequently used amino acid was found to be Leu 1 (14.37%~14.45%), followed by Ala (9.03%~9.18%) and Thr (7.74%~8.03%), while Cys (0.82%) was the least frequently used. In addition to Leu 1, the frequencies of remaining amino acids were all below 10%, mainly concentrated in the 2%~6% region.
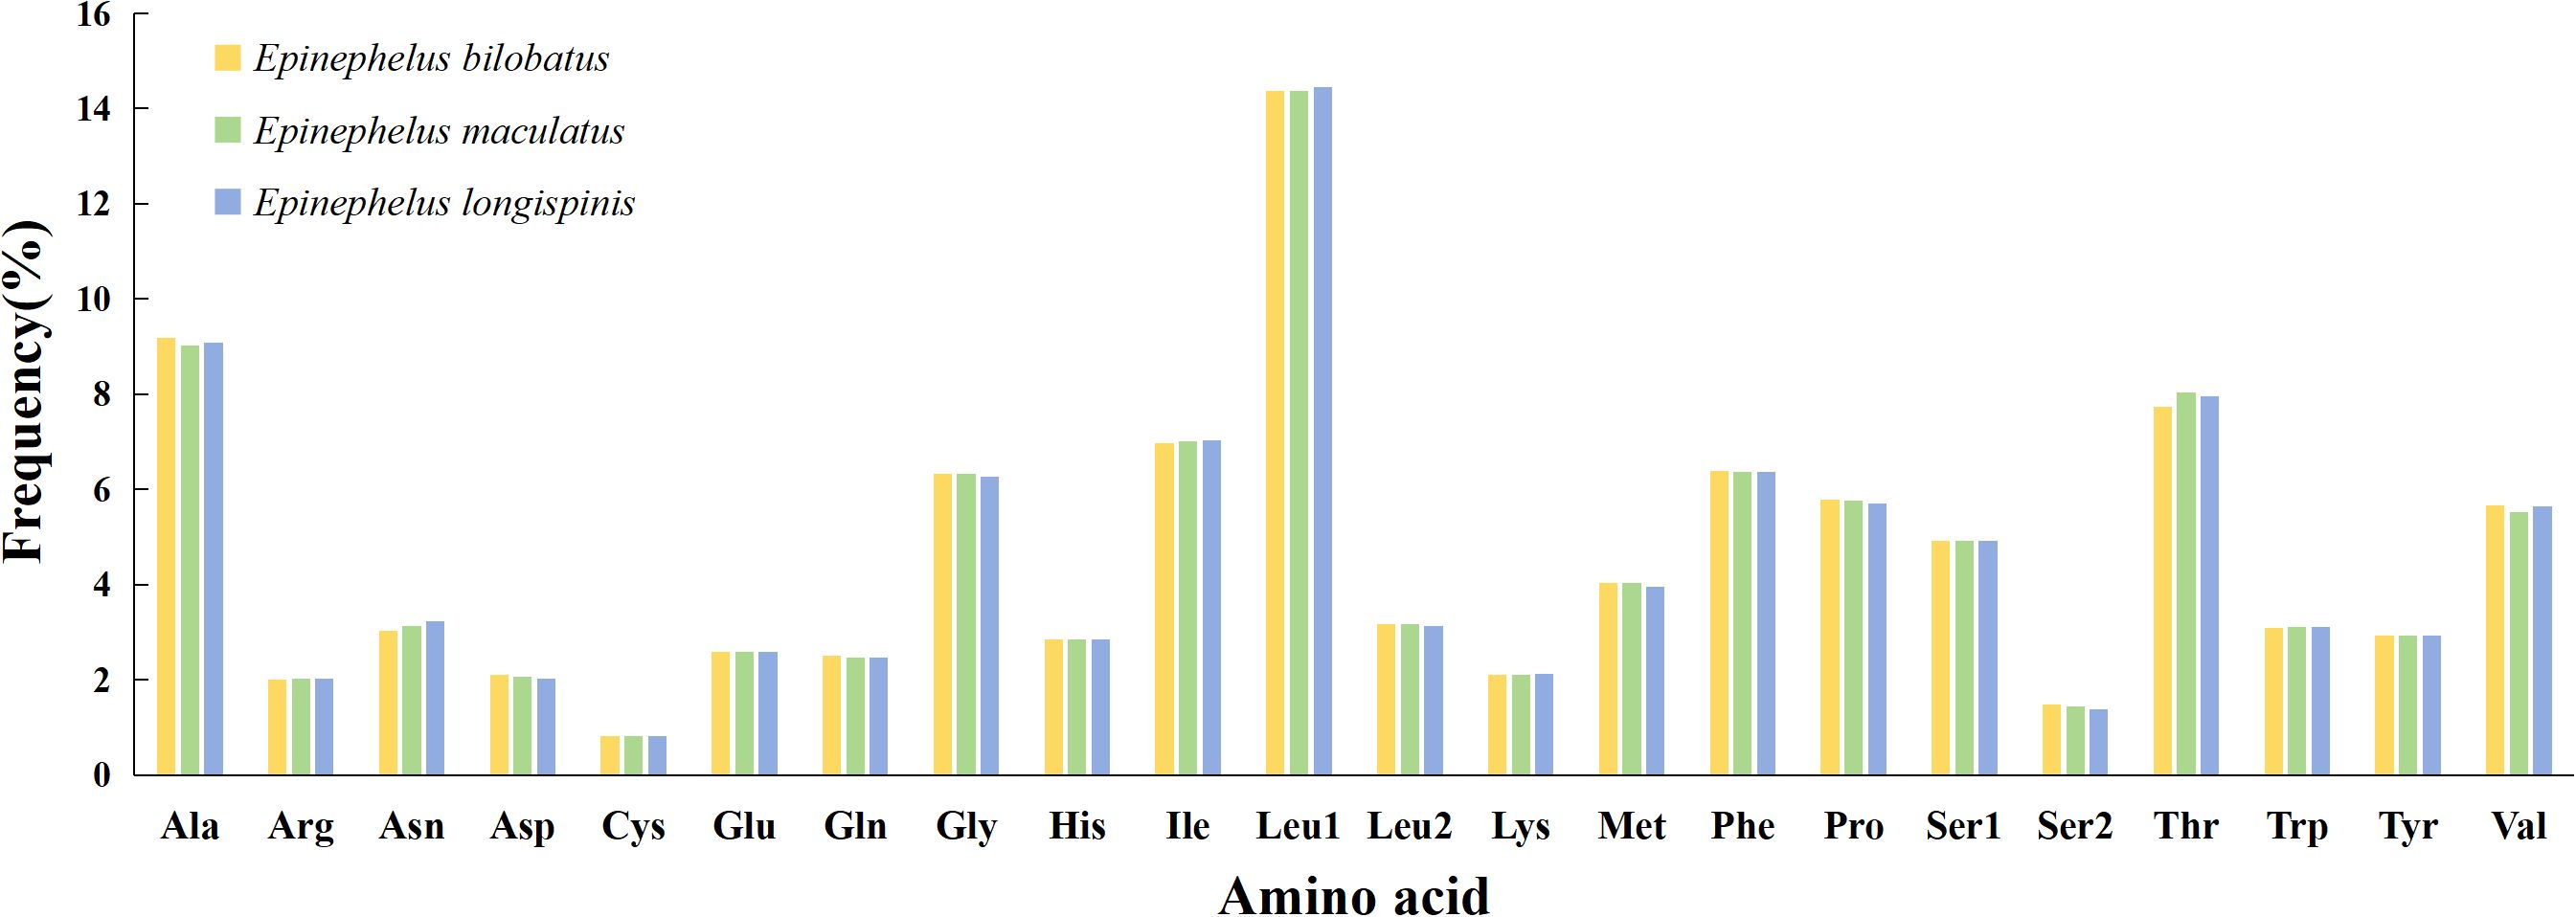
Figure 5. Amino acid composition in the mitogenome of E. bilobatus (First), E. maculatus (Second) and E. longispinis (Third).
3.3 Ribosomal RNA and transfer RNA genes
Ribosomal RNA genes of E. bilobatus, E. maculatus and E. longispinis included small subunit (12S) and large subunit (16S) rRNAs. Two ribosomal RNA genes were located between tRNA-Phe and tRNA-Leu (TAA) genes, separated by tRNA-Val gene. The 12S rRNA lengths were all 955 bp in the three groupers, while 16S rRNA was between 1701 bp (E. maculatus) ~1703 bp (E. longispinis). The A+T content of 12S rRNA ranged from 51.20%~51.73% with a positive AT skew of 0.1627~0.1820 and a negative GC skew of -0.1115~-0.0974. Similarly, the AT content of the 16S rRNA gene ranged from 55.38%~55.61% and had a positive AT skew (0.2081~0.2195) and a negative GC skew (-0.1007~-0.0910).
The respective lengths of tRNAs of E. bilobatus, E. maculatus and E. longispinis were 1932 bp, 1784 bp and 1932 bp. All tRNAs ranged in size from 68 bp (tRNA-Cys)~76 bp (tRNA-Leu). The overall A+T content of the three mitogenomes (52.38%~53.76%) was larger than GC content (46.25%~47.62%). AT skew (0.0335~0.0415) and GC skew (0.0448~0.0566) were all found to be positive. Of all the tRNAs, two forms of tRNA-Leu (UUR and CUN) and tRNA-Ser (UCN and AGY) were detected in all three groupers. All tRNAs could be folded into the typical clover-leaf secondary structure, apart from tRNA-Ser (AGY), as this lacked a dihydrouridine (DHU) stem.
3.4 Tandem duplications of tRNA genes
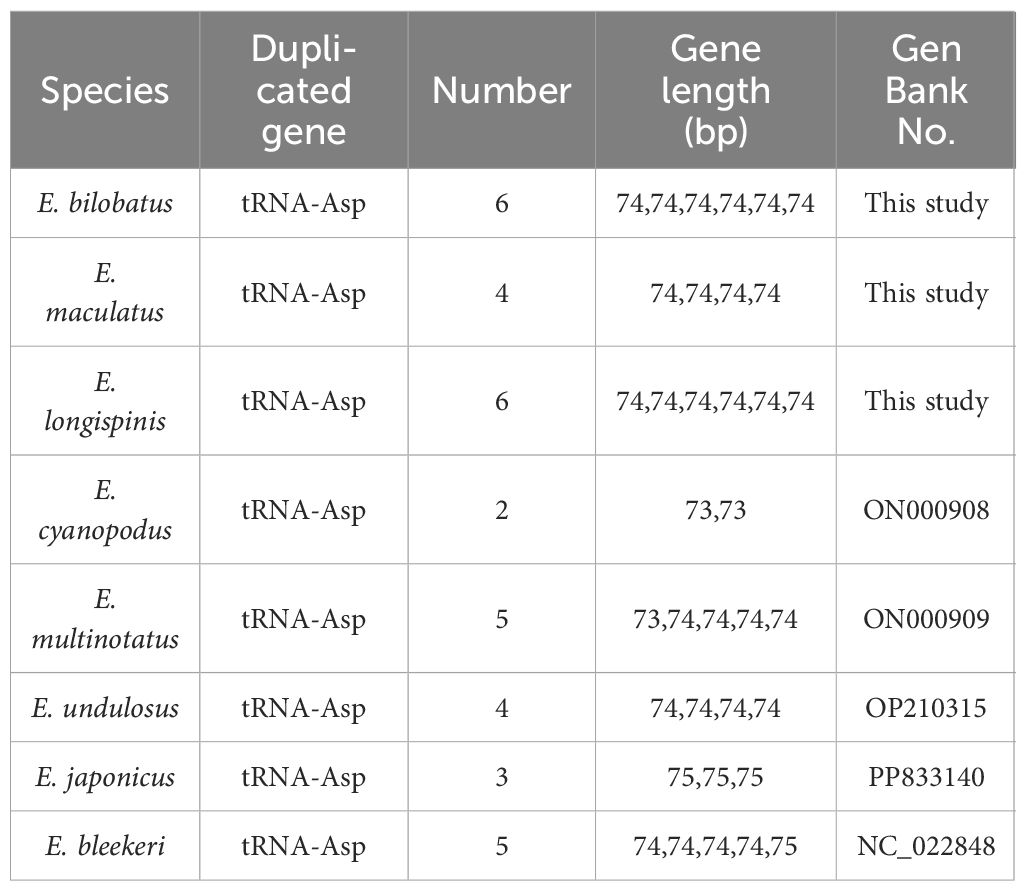
In comparison to the mitogenomes in most teleosts, which contain canonical 22 tRNAs, varied tRNA numbers were found in the three grouper. This is quite notable. In E. bilobatus and E. longispinis, there were 27 tRNAs while there were 25 tRNAs in E. maculatus (Table 1). This led to an increased number of tRNAs and multiple tandemly duplicated tRNA-Asps were identified between tRNA-Ser and COII, in which six tRNA-Asp duplications were observed in E. bilobatus/E. longispinis and four tRNA-Asp duplications were observed in E. maculatus. This is distinct from the normal mitogenome organizations that are found in other teleosts (Figures 1A–F). All the duplicated tRNA-Asp genes presented high similarity with the typical tRNA-Asp genes. Apart from tRNA-Asp2 in E. bilobatus (81.2%) and tRNA-Asp6 in E. longispinis (85.1%), the similarity rates of other duplicated tRNA-Asp were above 97% and most were 100%. By analyzing the mitogenome structures of all Epinephelus species available in GenBank, five groupers E. cyanopodus, E. multinotatus, E. japonicus, E. undulosus and E. bleekeri were also found to have tandemly duplicated tRNA-Asp genes, the duplication numbers ranged from 2 to 5, the length of tRNA-Asp genes ranged from 73 bp to 75 bp, indicating that the tRNA-Asp gene duplication might be a special structure shared in some Epinephelus species (Table 2).
3.5 Non-coding region
The control regions (CR) of E. bilobatus, E. maculatus and E. longispinis were all found to be located between tRNA-Pro and tRNA-Phe genes and determined to be 981 bp, 937 bp and 954 bp, respectively. The CR were significantly AT-rich and the A+T content ranged from 67.61% (E. longispinis)~67.98% (E. maculatus), differing from other regions of the mitogenomes. AT skews were all positive (0.0738 ~ 0.1050) and GC skews were all negative (-0.2041 ~ -0.1868). The origin of light strand replication (OL) of the three groupers was located in a cluster of five tRNA genes (Trp, Ala, Asn, Cys and Tyr), the so-called WANCY region. The OL lengths of the three groupers were all 43 bp with a predicted stable stem-loop secondary structure that featured a GC-rich stem and T-rich loop.
3.6 Mitogenome comparison and genetic distance
The pairwise KP2 genetic distances based on both complete mitogenomes and 13 PCG of the three groupers were calculated and can be seen in Table 3 and Figure 6. Great sequence divergences were observed in the entire mitogenomes in all three groupers. The values were 0.062 (E. bilobatus vs E. maculatus), 0.091 (E. bilobatus vs E. longispinis) and 0.087 (E. maculatus vs E. longispinis). The inter-specific genetic distance values among current Epinephelus species available in NCBI were found to be ranged from 0.009 to 0.168. The values (0.062, 0.091, 0.087) of the three groupers were located inside the range of Epinephelus inter-specific values and were much larger than the minimum value 0.009. For the 13 PCGs, genetic distances among the three groupers ranged from 0.037~0.087 (E. bilobatus vs E. maculatus), 0.048~0.118 (E. bilobatus vs E. longispinis) and 0.043~0.117 (E. maculatus vs E. longispinis). All values were greater than 0.030 and some even exceeded 0.100. Within the COI genes, which are commonly used as DNA barcoding for teleosts, the genetic distances between the three groupers were 0.056 (E. bilobatus vs E. maculatus), 0.084 (E. bilobatus vs E. longispinis) and 0.079 (E. maculatus vs E. longispinis). All of these values were larger than the minimum genetic distance value of 0.020 for species identification. Moreover, the inter-specific genetic distance values of COI among Epinephelus species available in NCBI were found to be ranged from 0.024 to 0.557, demonstrating that great nucleotide variations were found in the three groupers at the molecular level and that they were distinct species. Regarding the relationships between the three groupers, the lowest genetic distance was between E. bilobatus and E. maculatus, regardless of 13 PCGs or the entire mitogenome, which indicates that E. bilobatus was more closely related to E. maculatus, compared to E. longispinis.
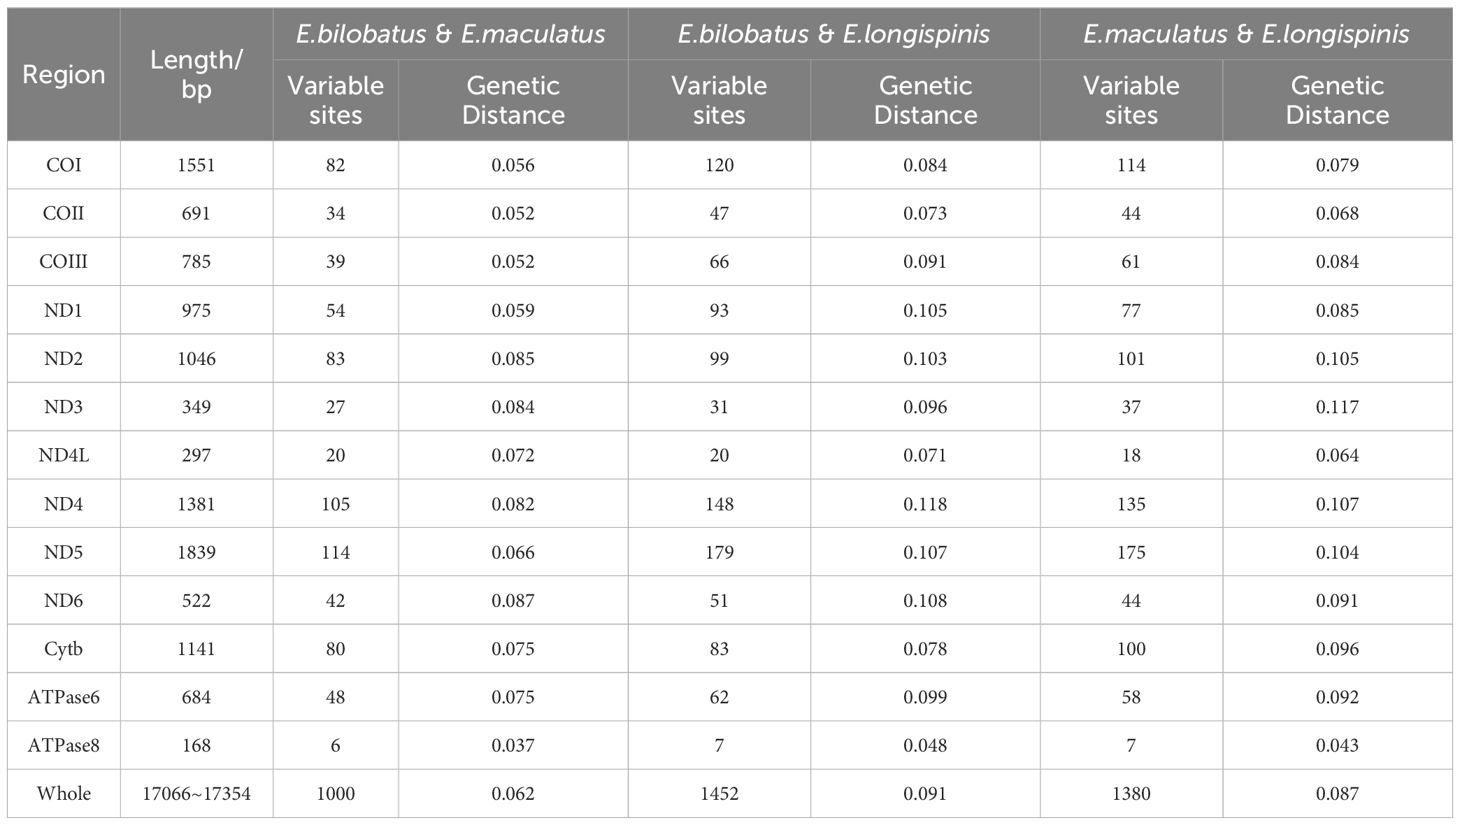
Table 3. Comparative analysis of complete mitogenome and 13 PCGs among of E. bilobatus, E. maculatus and E. longispinis.
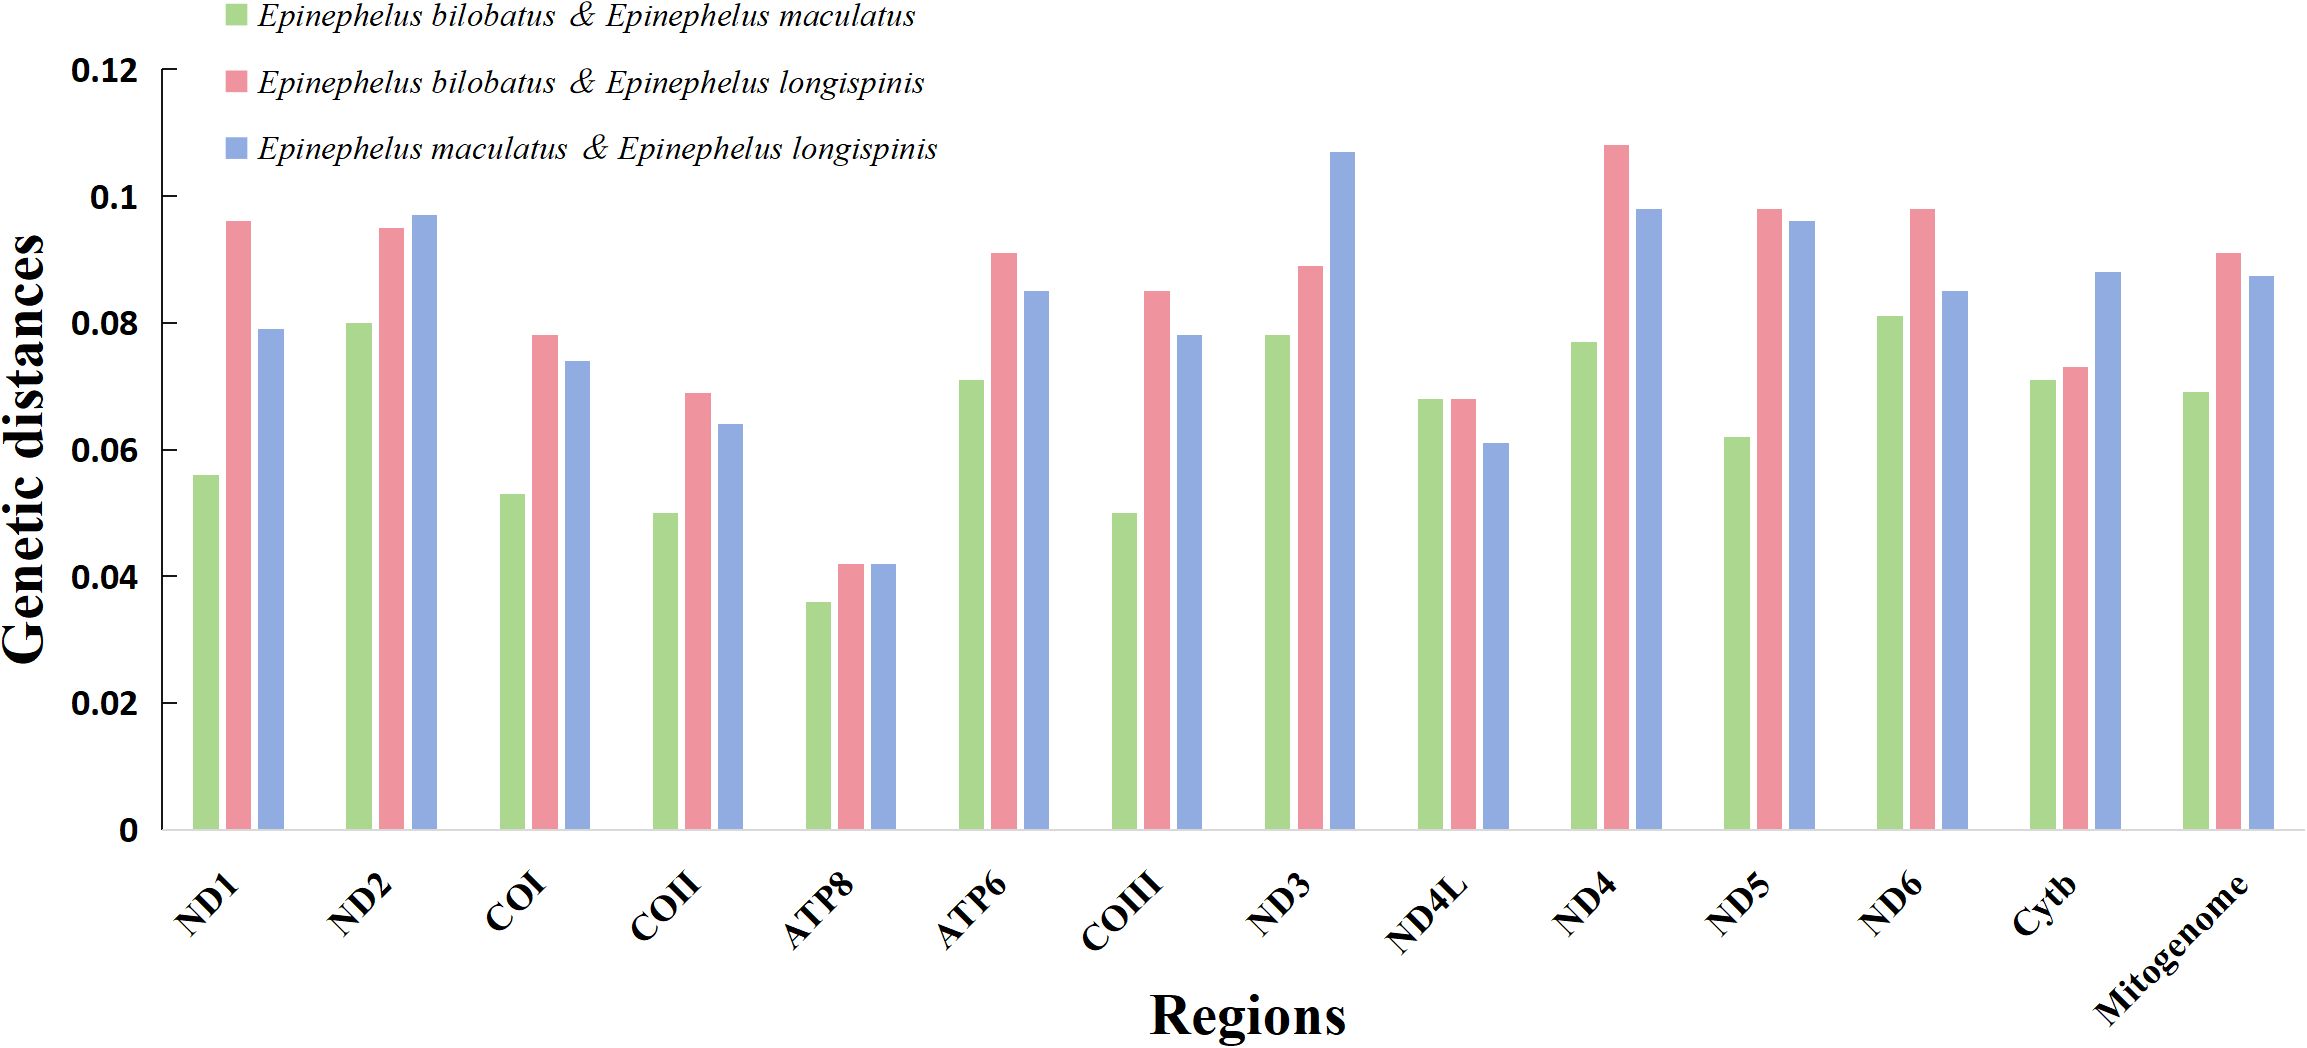
Figure 6. Comparative genetic distances of complete mitogenome and 13 PCGs among E. bilobatus, E. maculatus and E. longispinis.
3.7 Phylogenetic analyses
Phylogenetic trees (ML and BI) were constructed based on 12 PCGs from 32 Epinephelus species and two Cephalopholis outgroups to investigate the evolutionary positions and phylogenetic relationships of E. bilobatus, E. maculatus and E. longispinis in the genus Epinephelus. The results showed the ML tree and BI tree to yield identical topological structure with strong bootstrap support (left) or high posterior probabilities (right) values on most nodes (Figure 7). Two trees uniformly agreed that the 32 Epinephelus species formed two parallel clades, with the exception of species E. epistictus, which was initially separated and located at the base of the trees. Clade I contained 21 groupers and clade II contained 11 groupers. E. bilobatus, E. maculatus and E. longispinis were tightly clustered together with a bootstrap value of 100% on the ML tree and a posterior probability of 100% on the Bayesian tree, which indicates they were closely related to each other. E. bilobatus and E. maculatus were first clustered as sister species and E. longispinis was nested behind. Within the taxonomic status of the three groupers in the genus Epinephelus, the phylogenetic tree revealed their positions to be in the monophyletic group with the five groupers E. cyanopodus, E. multinotatus, E. japonicus, E. undulosus and E. bleekeri. An analysis of their mitogenome organizations and structures found that the characteristics of tandemly duplicated tRNA-Asp genes also existed in these five groupers, which was surprising. The duplication numbers ranged from 2 to 5, which was similar to the three groupers in this study. The remaining groupers in the phylogenetic tree had no such tandem duplication characters in their mitogenomes.
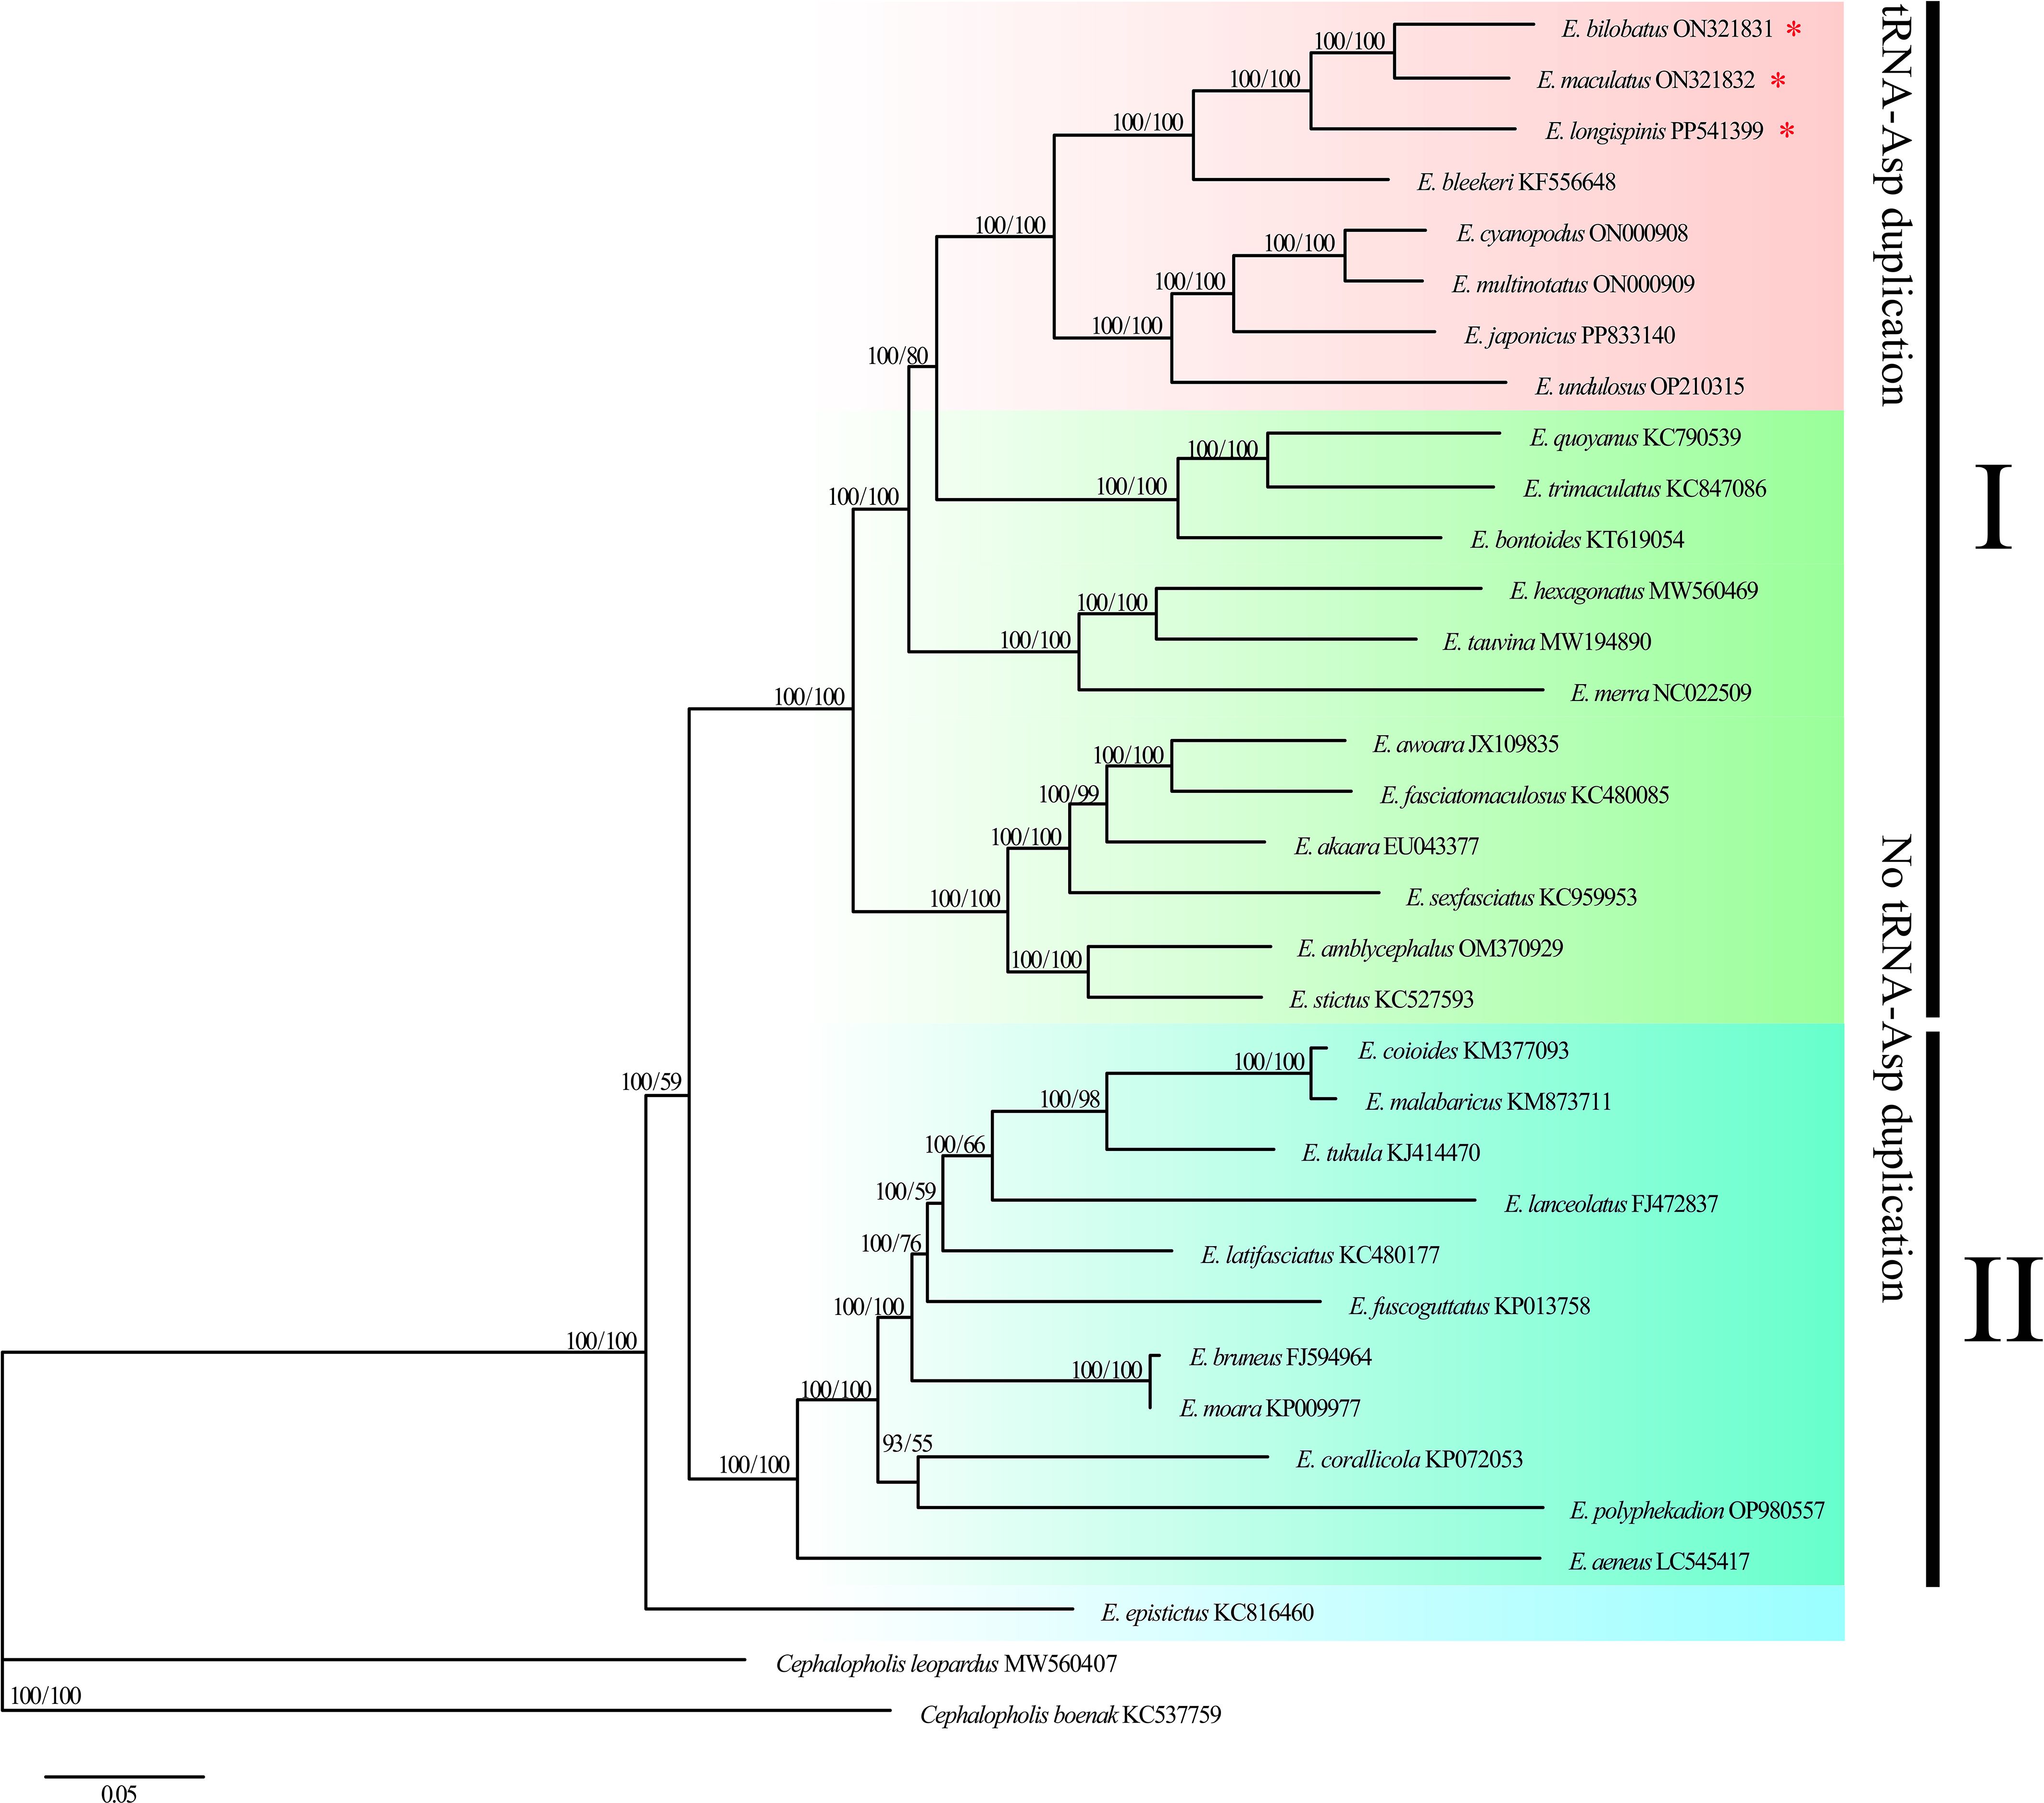
Figure 7. Molecular phylogenetic tree constructed by 32 Epinephelus species based on 12 protein-coding gene sequences. Three groupers in the present study are highlighted by asterisks.
3.8 Divergence time
The result of divergence time estimation indicated that genus Epinephelus diverged from outgroup Cephalopholis species in the Cenozoic Paleogene at about 33.26 Mya. Species in Clade I and Clade II were also diverged in Paleogene at 28.94 Mya. All Epinephelus species were differentiated in Neogene except for E. epistictus. The common ancestor of the 8 groupers with tandemly duplicated tRNA-Asp genes occurred in 17.88 Mya. Within the three grouper in this study, E. bilobatus and E. maculatus were diverged as two separate species at 9.74 Mya, and E. longispinis differentiated at 15.21 Mya (Figure 8).
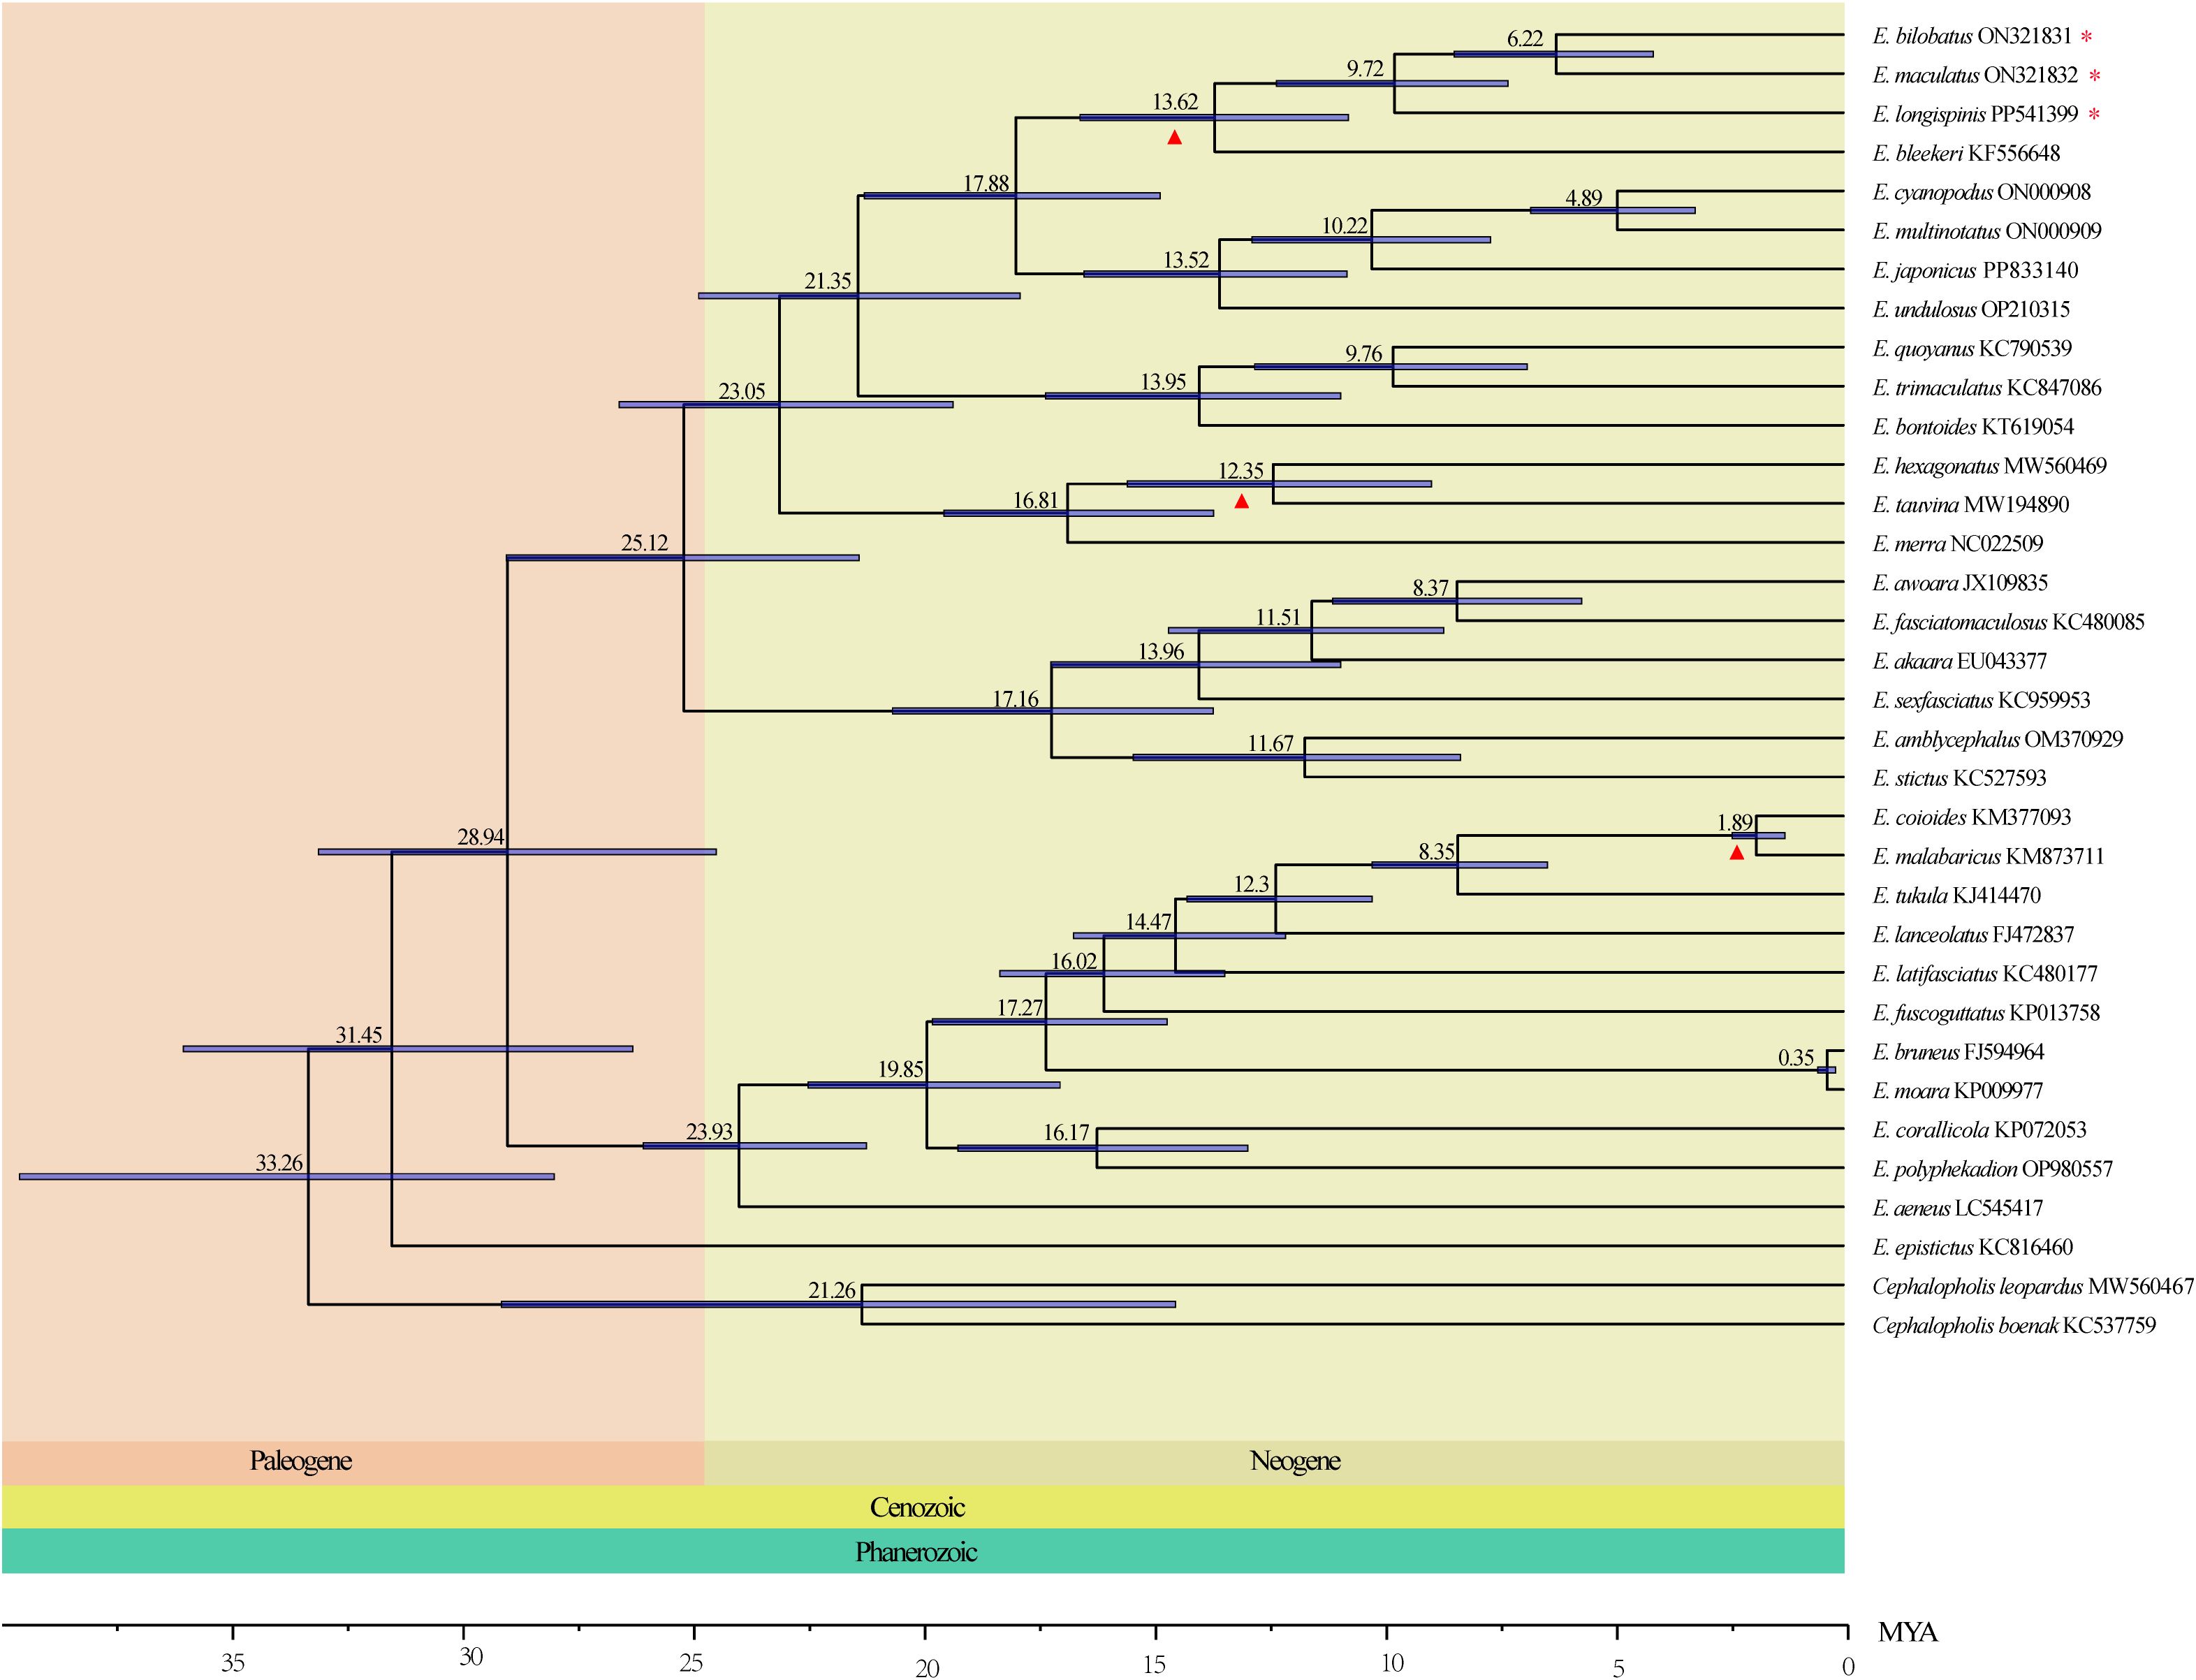
Figure 8. The Divergence time of Epinephelus estimated by Bayesian relaxed dating methods (BEAST) based on the nucleotide sequences of 13 PCGs. Fossil samples used to calibrate internal nodes are represented by an triangle. 95% highest probability density (HPD) of the estimated divergence times are represented by blue bars. Three groupers in the present study are highlighted by asterisks.
4 Discussion
4.1 Mitochondrial genome analysis
Mitogenomes of E. bilobatus, E. maculatus and E. longispinis were double-strand and consisted of 13 protein coding genes, two ribosomal RNA genes and one control region. However, different from most teleosts that contain the canonical numbers of 22 tRNAs, there were 27 tRNAs in the mitogenomes of E. bilobatus and E. longispinis and 25 tRNAs in E. maculatus. The increased number of tRNAs was due to the tandemly duplicated tRNA-Asp genes in their mitogenomes. A+T contents in the three mitogenomes were all higher than G+C content, showing an AT bias and significant anti-G bias (the G content of all groupers was just below 17%), which is in accordance with the nucleotide composition in most teleosts (Miya et al., 2003; Consuegra et al., 2015). AT-skews of the three mitogenomes were barely above zero, while the GC-skews were all negative, which indicates that A content was only slightly higher than T, while C was more prevalent than G. The absolute values of AT-skew were lower than those of GC-skew, which was in line with the findings of previous studies (Zhuang et al., 2013; Lü et al., 2019). Nucleotide skews may have been due to differential mutation and selective pressures imposed on the L- and H-strands, which resulted from the asymmetric replication of mtDNA (Clayton, 1982; Tanaka and Ozawa, 1994; Hassanin et al., 2005; Zhuang et al., 2013). Most protein-coding genes in the three mitogenomes started with the typical start codon ATG, or GTG for COI gene, as is found in many teleosts (Miya et al., 2003; Consuegra et al., 2015). However, for ATPase6 in E. bilobatus and E. longispinis, CTG was the start codon, and for ND4 in E. maculatus and E. longispinis, GTG was the start codon, a phenomenon that is uncommon in teleosts. The utilization of CTG or GTG as the special start codon has been reported in other groupers (Zhuang et al., 2013). Zhuang et al. discovered that CTG or TTG are the start codons for the gene ATP6ase in some groupers such as Epinephelus akaara, Epinephelus areolatus and Epinephelus awoara, speculating that it was a linage-specific characteristic of the more derived epinephelus clade (Zhuang et al., 2013). The use of stop codons varies among genes and there are four types of stop codons in the three mitogenomes: TAA, TAG and incomplete codons TA and T. The incomplete stop codons are completed to TAA through the post-transcriptional polyadenylation of mRNA (Ojala et al., 1981). In addition, other special stop codons have been identified in some fish, including AGG in Trichiurus japonicus (Liu and Cui, 2009), Psettodes belcheri (Kundu et al., 2023) and AGA in Sebastes owstoni (Oh et al., 2016). The different utilization of start and stop codons in fish mitogenomes may contribute to species identification and phylogenetic investigation.
4.2 Evolution of tandem duplication of tRNA-Asp gene
Multiple tandemly duplicated tRNA-Asps were identified in the mitogenomes of the three groupers, which is different from most teleosts. Six tRNA-Asp duplications were observed in E. bilobatus/E. longispinis and four tRNA-Asp duplications were observed in E. maculatus. Vertebrates have generally evolved a compact mitogenome with very few intergenic sequences and gene duplication in mitogenomes was previously considered to be quite a rare phenomenon (Minhas et al., 2023). However, as more mitogenomes are sequenced, the characteristic of gene duplications has become more prevalent (Schirtzinger et al., 2012; Formenti et al., 2021). Certain levels of gene duplication have now been observed in some fish mitogenomes. For example, in Cephalopholis argus (Zhuang et al., 2013), an additional tRNA-Asp was inserted in the middle of the control region on the L strand, which shared 97% sequence identity with the canonical H-strand coded tRNA-Asp. In Morone saxatilis mitogenome (Williams et al., 2012), additional tRNA-Ser was found downstream of the ND5 locus. In Pampus echinogaster (Li et al., 2016), another tRNA-Met gene was identified in the tRNA-IQM region. However, only one duplication copy was observed in the aforementioned fish mitogenomes. Bushra et al (Minhas et al., 2023). first observed the tandemly duplicated region of ND6/trnE/trnP/CR with one to four copies of the duplicated block in four icefish mitogenomes. It could be suggested that such structural duplication plays a potential role in the adaptation of cold environments.
However, relatively few reports have identified the multiple duplication of tRNA genes in fish mitogenomes. Five tandemly duplicated tRNA-Asps have been found in the mitogenome of Epinephelus bleekeri (Wu et al., 2015), which is similar to the duplication characteristics of the three groupers in this study. Furthermore, in mitogenomes in certain Epinephelus species – Epinephelus cyanopodus, Epinephelus multinotatus, Epinephelus undulosus and Epinephelus japonicus – which were also determined in this research (sequence data was published in NCBI), tandemly duplicated tRNA-Asp genes with 2~5 duplication copies were also found. To further infer which Epinephelus species share the features of tandemly duplicated tRNA-Asp gene, mitogenomes of Epinephelus species that were available in the NCBI database were downloaded for analysis and the phylogenetic relationships were constructed. Of the 32 Epinephelus species, only eight species were found to possess the characteristic of tandemly duplicated tRNA-Asp gene with different copy numbers. In the phylogenetic trees of genus Epinephelus, the eight Epinephelus species were all found to be clustered into a monophyletic group, which indicates that such specific mitochondrial structure may be shared by certain Epinephelus species in similar evolutionary positions.
Previous studies have shown that duplications in the nuclear genome are major contributors to adaptive evolution and generate genes that can acquire novel functions (Kondrashov, 2012). However, for mitochondrial genes, this process is not as well understood. Generally, gene duplications or deletions of mitogenomes are considered to be evidence of species evolution. Bushra et al (Minhas et al., 2023). revealed that a tandemly duplicated block of ND6/trnE/trnP/CR may evolve together through concerted or parallel evolution. At the same time, the same blocks duplicated to different degrees in four species of icefish, which indicates that gene duplications may have occurred in the common ancestor or that there was strong selection for the functionality underlying the duplicated block. tRNA-Asp gene duplication was also found in certain Epinephelus species under the similar evolutionary status in this study, which reveals that the feature of tandem tRNA-Asp gene duplication exists in their common ancestor. It is also assumed that the common ancestor has evolved such particular lineage-specific characteristics that distinguish it from other Epinephelus species in order to adapt different environments and selection pressures. However, the formation mechanism of tRNA-Asp gene duplication and its effect on the environmental adaptation of Epinephelus species require further investigation. Therefore, more individual samples of these Epinephelus species must be collected and their mitogenome data sequenced and analyzed.
4.3 Species validation and phylogenetic relationships of the three groupers
The external appearances of E. bilobatus and E. maculatus are similar - their heads and bodies are both pale brown, they are covered with round to hexagonal brown spots, spots extend onto the soft dorsal, caudal, and anal fins and large dusky blotches exist on the dorsal part of their bodies and dorsal fins. E. Longispinis also has similar body color and spots to E. maculatus. In morphological terms, classification and identification of the three species have been disputed and are confused (Baldwin et al., 1994; Craig et al., 2012). E. bilobatus was misidentified and illustrated in color as “E. maculatus” by Allen (Allen, 1985) and Sainsbury et al (Sainsbury et al., 1985). E. longispinis was also misidentified as E. maculatus (Nair, 2018). Hemadri and Randall (Baldwin et al., 1994) highlighted the distinguishing characteristics among the three groupers: E. bilobatus differs from E. maculatus by having 17 or 18 dorsal-fin rays, fewer lateral-scale series (94 to 102) and three bilobed dark blotches along body and base of dorsal fin; it also lacks the two large blackish areas on body and dorsal fin where they are separated by a large pale area with small dark spots, which are evident in E. maculatus. E. Longispinis differs from the two species by having the dark spots on the posterior body elongated into oblique streaks and a row of dark spots along the distal margin of the soft dorsal and caudal fins.
Through a comparative analysis of the sequences of complete mitogenomes and the 13 protein-coding gene of the three groupers, great divergences were found between them. The genetic distances between each species pairing were 0.062 (E. bilobatus vs E. maculatus), 0.091 (E. bilobatus vs E. longispinis) and 0.087 (E. maculatus vs E. longispinis) and the values were all greater than 0.020. In the DNA barcoding gene (COI) that is commonly used for species identification, the genetic distances between species were 0.056 (E. bilobatus vs E. maculatus), 0.084 (E. bilobatus vs E. longispinis) and 0.079 (E. maculatus vs E. longispinis). All of these values were much greater than the minimum genetic distance (0.020) for species identification, which reveals significant genetic differences between the three groupers and highlights the fact that they should be considered to be three distinct species at the molecular level. In the phylogenetic tree of 32 groupers, the three groupers were tightly clustered together with high support values, which suggests they have close relationships. Ma et al (Ma et al., 2016). used three mitochondrial genes (COI, 16S and 12S) and one nuclear gene (TMO4C4) to construct Epinephelidae phylogenetic trees that also revealed the three groupers to be clustered together. The results of this study also revealed E. bilobatus to be first cluster E. maculatus as sister species and E. longispinis was then nested behind. Within the divergence time, E. bilobatus and E. maculatus were differentiated at 9.74 Mya, and E. longispinis differentiated at 15.21 Mya. This demonstrated that in comparison to E. longispinis, E. bilobatus was more closely related to E. maculatus.
5 Conclusion
In summary, the complete mitogenomes of three morphologically confused groupers: E. bilobatus, E. maculatus and E. longispinis were first determined and comparative analyzed. Different from most teleosts which contain canonical 22 tRNAs, there were 27 tRNAs identified in E.bilobatus and E. longispinis and 25 tRNAs identified in E.maculatus. The increased number of tRNA genes is due to the novel feature of tandemly duplicated tRNA-Asp genes located between tRNA-Ser and COII genes. In E. bilobatus and E. longispinis, 6 duplicated tRNA-Asp were found, while in E. maculatus, 4 duplicated tRNA-Asp were found. Molecular phylogenetic results revealed that Epinephelus species with tandemly duplicated tRNA-Asp genes formed a monophyletic group, distinctive from other groupers without such feature, indicating that tandemly duplicated tRNA-Asp genes might be the particular linage-specific characteristics evolving from the common ancestor. For the comparative analysis of three mitogenomes, genetic distance values between each two species were all greater than 0.020, indicating that the three groupers were independent species at molecular level. The results provided valuable molecular data for the species identification and phylogenetic analyses on E. bilobatus, E. maculatus and E. longispinis, meanwhile, presented insight into the tandem gene duplication features of teleosts mitogenomes.
Data availability statement
Mitochondrial genome sequence data of this study are openly available in GenBank of the National Center for Biotechnology Information (NCBI) at https://www.ncbi.nlm.nih.gov/ under the accession number: ON321831 (E. bilobatus), ON321832 (E. maculatus) and PP541399 (E. longispinis).
Ethics statement
The animal study was approved by Animal Research Ethics Committee, Zhongkai University of Agriculture and Engineering. The study was conducted in accordance with the local legislation and institutional requirements.
Author contributions
HH: Investigation, Methodology, Visualization, Writing – original draft. ZG: Data curation, Investigation, Methodology, Software, Writing – original draft. ZH: Resources, Software, Visualization, Writing – original draft. LC: Data curation, Software, Visualization, Writing – original draft. YH: Funding acquisition, Supervision, Writing – original draft. MZ: Funding acquisition, Supervision, Writing – original draft. RL: Data curation, Funding acquisition, Methodology, Visualization, Writing – review & editing.
Funding
The author(s) declare that financial support was received for the research, authorship, and/or publication of this article. The study was supported by the Science and Technology Plan Project of Qingyuan City (NO.2022KJJH064, NO.2023KJJ005) and the Guangdong Provincial Department of Science and Technology-Rural Science and Technology Commissioner Project (NO. KTP20210367).
Acknowledgments
We are grateful to Innnovative Institute of Animal Healthy Breeding, Zhongkai University of Agriculture and Engineering for providing the facilities in the laboratory that make this study happen.
Conflict of interest
The authors declare that the research was conducted in the absence of any commercial or financial relationships that could be construed as a potential conflict of interest.
Publisher’s note
All claims expressed in this article are solely those of the authors and do not necessarily represent those of their affiliated organizations, or those of the publisher, the editors and the reviewers. Any product that may be evaluated in this article, or claim that may be made by its manufacturer, is not guaranteed or endorsed by the publisher.
References
Allen G. R. (1985). “Fishes of Western Australia,” in Pacific Marine Fishes. Eds. Burgess W., Axelrod H. R. Neptune City: Book 9.T.F.H. Publications, pp. 2207–2534.
Baldwin C. C., Johnson G. D., Heemstra P. C., Randall J. E. (1994). FAO species catalogue. Vol. 16. Groupers of the world (Family serranidae, subfamily epinephelinae). An annotated and illustrated catalogue of the grouper, rockcod, hind, coral grouper, and lyretail species known to date. Copeia 1994, 1058–1061. doi: 10.2307/1446737
Bentzen P., Wright J. M., Bryden L. T., Sargent M., Zwanenburg K. C. T. (1998). Tandem repeat polymorphism and heteroplasmy in the mitochondrial control region of redfishes (Sebastes: Scorpaenidae). J. Heredity 89, 1–7. doi: 10.1093/jhered/89.1.1
Bernt M., Donath A., Jühling F., Externbrink F., Florentz C., Fritzsch G., et al. (2013). MITOS: Improved de novo metazoan mitochondrial genome annotation. Mol. Phylogenet Evol. 69, 313–319. doi: 10.1016/j.ympev.2012.08.023
Boore J. L. (1999). Animal mitochondrial genomes. Nucleic Acids Res. 27, 1767–1780. doi: 10.1093/nar/27.8.1767
Castresana J. (2000). Selection of conserved blocks from multiple alignments for their use in phylogenetic analysis. Mol. Biol. Evol. 17, 540–552. doi: 10.1093/oxfordjournals.molbev.a026334
Clayton D. A. (1982). Replication of animal mitochondrial DNA. Cell 28, 693–705. doi: 10.1016/0092-8674(82)90049-6
Consuegra S., John E., Verspoor E., De Leaniz C. G. (2015). Patterns of natural selection acting on the mitochondrial genome of a locally adapted fish species. Genet. Selection Evol. 47, 58. doi: 10.1186/s12711-015-0138-0
Craig M. T., Sadovy de Mitcheson Y., Heemstra P. C. (2012). Groupers of the world: A field and market guide. Mar. Biol. Res. 8, 912–913. doi: 10.1080/17451000.2012.703781
Drummond A. J., Suchard M. A., Xie D., Rambaut A. (2012). Bayesian phylogenetics with BEAUti and the BEAST 1.7. Mol Biol Evol. 29 (8), 1969–1973. doi: 10.1093/molbev/mss075
Formenti G., Rhie A., Balacco J., Haase B., Mountcastle J., Fedrigo O., et al. (2021). Complete vertebrate mitogenomes reveal widespread repeats and gene duplications. Genome Biol. 22, 120. doi: 10.1186/s13059-021-02336-9
Froese R., Pauly D. (2023). Fishbase. World Wide Web electronic publication. Version. Available online at: https://www.fishbase.de. (accessed [Nov 20th, 2023]).
Grant J. R., Stothard P. (2008). The CGView Server: a comparative genomics tool for circular genomes. Nucleic Acids Res. 36, W181–184. doi: 10.1093/nar/gkn179
Hassanin A., Léger N., Deutsch J. (2005). Evidence for multiple reversals of asymmetric mutational constraints during the evolution of the mitochondrial genome of metazoa, and consequences for phylogenetic inferences. Syst. Biol. 54, 277–298. doi: 10.1080/10635150590947843
Ki J. S., Jung S. O., Hwang D. S., Lee Y. M., Lee J. S. (2008). Unusual mitochondrial genome structure of the freshwater goby Odontobutis platycephala: Rearrangement of tRNAs and an additional non-coding region. J. Fish Biol. 73, 414–428. doi: 10.1111/j.1095-8649.2008.01911.x
Kondrashov F. A. (2012). Gene duplication as a mechanism of genomic adaptation to a changing environment. Proc. R. Soc. B: Biol. Sci. 279, 5048–5057. doi: 10.1098/rspb.2012.1108
Kumar S., Stecher G., Li M., Knyaz C., Tamura K. (2018). MEGA X: Molecular evolutionary genetics analysis across computing platforms. Mol. Biol. Evol. 35, 1547–1549. doi: 10.1093/molbev/msy096
Kumazawa Y., Miura S., Yamada C., Hashiguchi Y. (2014). Gene rearrangements in gekkonid mitochondrial genomes with shuffling, loss, and reassignment of tRNA genes. BMC Genomics 15, 930. doi: 10.1186/1471-2164-15-930
Kundu S., Palimirmo F. S., Kang H. E., Kim A. R., Lee S. R., Gietbong F. Z., et al. (2023). Insights into the mitochondrial genetic makeup and miocene colonization of primitive flatfishes (Pleuronectiformes: psettodidae) in the east atlantic and indo-west pacific ocean. Biol. (Basel) 12, 1317. doi: 10.3390/biology12101317
Lanfear R., Frandsen P. B., Wright A. M., Senfeld T., Calcott B. (2017). Partitionfinder 2: New methods for selecting partitioned models of evolution for molecular and morphological phylogenetic analyses. Mol. Biol. Evol. 34, 772–773. doi: 10.1093/molbev/msw260
Li Y., Song N., Lin L., Gao T. (2016). The complete mitochondrial genome of Pampus echinogaster (Perciformes: Stromateidae). Mitochondrial DNA 27, 289–290. doi: 10.3109/19401736.2014.892081
Liu Y., Cui Z. (2009). The complete mitochondrial genome sequence of the cutlassfish Trichiurus japonicus (Perciformes: Trichiuridae): Genome characterization and phylogenetic considerations. Mar. Genomics 2, 133–142. doi: 10.1016/j.margen.2009.07.003
Lowe T. M., Chan P. P. (2016). tRNAscan-SE On-line: integrating search and context for analysis of transfer RNA genes. Nucleic Acids Res. 44, W54–W57. doi: 10.1093/nar/gkw413
Lü Z., Zhu K., Jiang H., Lu X., Liu B., Ye Y., et al. (2019). Complete mitochondrial genome of Ophichthus brevicaudatus reveals novel gene order and phylogenetic relationships of Anguilliformes. Int. J. Biol. Macromol 135, 609–618. doi: 10.1016/j.ijbiomac.2019.05.139
Ma K. Y., Craig M. T., Choat J. H., Herwerden L. V. (2016). The historical biogeography of groupers: clade diversification patterns and processes. Mol. Phylogenet. Evol. 100, 21–30. doi: 10.1016/j.ympev.2016.02.012
Minhas B. F., Beck E. A., Cheng C. H. C., Catchen J. (2023). Novel mitochondrial genome rearrangements including duplications and extensive heteroplasmy could underlie temperature adaptations in Antarctic notothenioid fishes. Sci. Rep. 13, 6939. doi: 10.1038/s41598-023-34237-1
Miya M., Nishida M. (1999). Organization of the mitochondrial genome of a deep-sea fish, Gonostoma gracile (Teleostei: Stomiiformes): First example of transfer RNA gene rearrangements in bony fishes. Mar. Biotechnol. 1, 416–426. doi: 10.1007/PL00011798
Miya M., Takeshima H., Endo H., Ishiguro N. B., Inoue J. G., Mukai T., et al. (2003). Major patterns of higher teleostean phylogenies: A new perspective based on 100 complete mitochondrial DNA sequences. Mol. Phylogenet Evol. 26, 121–138. doi: 10.1016/S1055-7903(02)00332-9
Nakamura T., Yamada K. D., Tomii K., Katoh K. (2018). Parallelization of MAFFT for large-scale multiple sequence alignments. Bioinformatics 34, 2490–2492. doi: 10.1093/bioinformatics/bty121
Oh J., Kim S., Lee E. K., Park J. H., Kim K. Y., Jang Y. S. (2016). Complete mitochondrial genome of Sebastes owstoni (Scorpaenidae, Scorpaeniformes) from the East Sea, Korea. Mitochondrial DNA A DNA Mapp Seq Anal. 27, 3952–3954. doi: 10.3109/19401736.2014.989501
Ojala D., Montoya J., Attardi G. (1981). TRNA punctuation model of RNA processing in human mitochondria. Nature 290, 470–474. doi: 10.1038/290470a0
Papetti C., Liò P., Rüber L., Patarnello T., Zardoya R. (2007). Antarctic fish mitochondrial genomes lack ND6 gene. J. Mol. Evol. 65, 519–528. doi: 10.1007/s00239-007-9030-z
Poulsen J. Y., Byrkjedal I., Willassen E., Rees D., Takeshima H., Satoh T. P., et al. (2013). Mitogenomic sequences and evidence from unique gene rearrangements corroborate evolutionary relationships of myctophiformes (Neoteleostei). BMC Evol. Biol. 13, 111. doi: 10.1186/1471-2148-13-111
Prada C. F., Boore J. L. (2019). Gene annotation errors are common in the mammalian mitochondrial genomes database. BMC Genomics 20, 73. doi: 10.1186/s12864-019-5447-1
Rambaut A. (2020). FigTree v1.4.3. Available online at: http://tree.bio.ed.ac.uk/software/figtree/. (accessed [Jan 16th, 2024]).
Randall J. E., Allent G. R. (1987). Four new Serranid Fishes of the genus Epinephelus (Percifonnes: Epinephelinae) from Western Australia. Townsend Letter. 13, 387–411.
Ronquist F., Teslenko M., van der Mark P., Ayres D. L., Darling A., Höhna S., et al. (2012). Mrbayes 3.2: Efficient bayesian phylogenetic inference and model choice across a large model space. Syst. Biol. 61, 539–542. doi: 10.1093/sysbio/sys029
Sainsbury K. J., Kailola P. J., Leyland G. G. (1985). Continental shelf fishes of northern and north-western Australia. An illustrated guide. Australia: Clouston & Hall, Canberra, 375p.
San Mauro D., Gower D. J., Zardoya R., Wilkinson M. (2006). A hotspot of gene order rearrangement by tandem duplication and random loss in the vertebrate mitochondrial genome. Mol. Biol. Evol. 23, 227–234. doi: 10.1093/molbev/msj025
Schirtzinger E. E., Tavares E. S., Gonzales L. A., Eberhard J. R., Miyaki C. Y., Sanchez J. J., et al. (2012). Multiple independent origins of mitochondrial control region duplications in the order Psittaciformes. Mol. Phylogenet Evol. 64, 342–356. doi: 10.1016/j.ympev.2012.04.009
Sharma A., Siva C., Ali S., Sahoo P. K., Nath R., Laskar M. A., et al. (2020). The complete mitochondrial genome of the medicinal fish, Cyprinion semiplotum: Insight into its structural features and phylogenetic implications. Int. J. Biol. Macromol 164. 939–948. doi: 10.1016/j.ijbiomac.2020.07.142
Shi W., Kong X. Y., Wang Z. M., Jiang J. X. (2011). Utility of tRNA genes from the complete mitochondrial genome of psetta maxima for implying a possible sister-group relationship to the pleuronectiformes. Zool Stud. 50, 665–681. doi: 10.1080/19768354.2011.604943
Shi W., Miao X. G., Kong X. Y. (2014). A novel model of double replications and random loss accounts for rearrangements in the Mitogenome of Samariscus latus (Teleostei: Pleuronectiformes). BMC Genomics 15, 352. doi: 10.1186/1471-2164-15-352
Stamatakis A. (2014). RAxML version 8: A tool for phylogenetic analysis and post-analysis of large phylogenies. Bioinformatics 30, 1312–1313. doi: 10.1093/bioinformatics/btu033
Su L. W., Liu Z. Z., Ueng Y. T., Tang W. Q., Bao B. L., Liu D., et al. (2015). The complete mitogenome of the oriental sucking barb, Garra orientalis (Cypriniformes, Cyprinidae): Repetitive sequences in the control region. Mitochondrial DNA 26, 272–273. doi: 10.3109/19401736.2013.823178
Tanaka M., Ozawa T. (1994). Strand asymmetry in human mitochondrial dna mutations. Genomics 22, 327–335. doi: 10.1006/geno.1994.1391
Terencio M. L., Schneider C. H., Gross M. C., Feldberg E., Porto J. I. R. (2013). Structure and organization of the mitochondrial DNA control region with tandemly repeated sequence in the Amazon ornamental fish. Mitochondrial DNA 24, 74–82. doi: 10.3109/19401736.2012.717934
Wang C., Ye P., Liu M., Zhang Y., Feng H., Liu J., et al. (2022). Comparative analysis of four complete mitochondrial genomes of epinephelidae (Perciformes). Genes (Basel) 13, 660. doi: 10.3390/genes13040660
Wang W. (2015). “The molecular detection of Corynespora cassiicola on cucumber by PCR assay using DNAman software and NCBI,” in Proceedings of the Computer and Computing Technologies in Agriculture IX, Beijing, China. 248–258. doi: 10.1007/978-3-319-48354-2_26
Williams E. P., Peer A. C., Miller T. J., Secor D. H., Place A. R. (2012). A phylogeny of the temperate seabasses (Moronidae) characterized by a translocation of the mt-nd6 gene. J. Fish Biol. 80, 110–130. doi: 10.1111/j.1095-8649.2011.03158.x
Wolstenholme D. R. (1992). Animal mitochondrial DNA: structure and evolution. Int. Rev. Cytol 141, 173–216. doi: 10.1016/S0074-7696(08)62066-5
Wu X., Xie Z., Yang L., Yang H., Yue L., Hou L., et al. (2015). The complete mitochondrial genome of the duskytail grouper Epinephelus bleekeri (Serranidae: Epinephelinae). Mitochondrial DNA 26, 722–723. doi: 10.3109/19401736.2013.845758
Zhao B., Gao S., Zhao M., Lv H., Song J., Wang H., et al. (2022). Mitochondrial genomic analyses provide new insights into the “missing” atp8 and adaptive evolution of Mytilidae. BMC Genomics 23, 738. doi: 10.1186/s12864-022-08940-8
Zhou Q., Xiang H. M., Zhang M. Y., Liu Y., Gu Z. R., Lan X. Y., et al. (2023). Two complete mitochondrial genomes of leptobrachium (Anura: megophryidae: leptobrachiinae): characteristics, population divergences, and phylogenetic implications. Genes (Basel) 14, 768. doi: 10.3390/genes14030768
Zhuang X., Ding S., Wang J., Wang Y., Su Y. (2009). A set of 16 consensus primer pairs amplifying the complete mitochondrial genomes of orange-spotted grouper (Epinephelus coioides) and Hong Kong grouper (Epinephelus akaara). Mol. Ecol. Resour 9, 1551–1553. doi: 10.1111/j.1755-0998.2009.02716.x
Keywords: mitogenome, groupers, tandem duplications, taxonomy, phylogenetic analysis
Citation: He H, Gao Z, Hu Z, Cai L, Huang Y, Zhou M and Liang R (2024) Comparative characterization and phylogenetic analysis of complete mitogenome of three taxonomic confused groupers and the insight to the novel gene tandem duplication in Epinephelus. Front. Mar. Sci. 11:1450003. doi: 10.3389/fmars.2024.1450003
Received: 16 June 2024; Accepted: 05 September 2024;
Published: 30 September 2024.
Edited by:
Li Gong, Zhejiang Ocean University, ChinaReviewed by:
Lang Zhang, Chinese Academy of Fishery Sciences (CAFS), ChinaChao Li, South China Normal University, China
Sen Yang, Guangdong Ocean University, China
Copyright © 2024 He, Gao, Hu, Cai, Huang, Zhou and Liang. This is an open-access article distributed under the terms of the Creative Commons Attribution License (CC BY). The use, distribution or reproduction in other forums is permitted, provided the original author(s) and the copyright owner(s) are credited and that the original publication in this journal is cited, in accordance with accepted academic practice. No use, distribution or reproduction is permitted which does not comply with these terms.
*Correspondence: Rishen Liang, bGlhbmdyaXNoZW4wMUAxNjMuY29t
†These authors share first authorship
 Haobin He1,2†
 Meng Zhou
 Rishen Liang