 Xiaofang Liu1,2
 Jun Sun
 Wenzhuo Yan
 Yujian Wen
- 1State Key Laboratory of Biogeology and Environmental Geology, China University of Geosciences (Wuhan), Wuhan, China
- 2College of Marine Science and Technology, China University of Geosciences (Wuhan), Wuhan, Hubei, China
- 3Research Centre for Indian Ocean Ecosystem, Tianjin University of Science and Technology, Tianjin, China
Diatoms (> 2 μm) have traditionally been identified as the primary biological agents linking the carbon (C) and silicon (Si) cycles. However, recent research has shown that picophytoplankton species (< 2 μm) also play a crucial role in the intertwined Si-C biogeochemical cycling in marine ecosystems. In this study, we examined the spatial distribution and vertical variation of micro/nano-diatoms and picophytoplankton in the eastern Indian Ocean (EIO), aimed to differentiate the contributions of living carbon and biogenic silica (bSi) stocks between diatoms and picophytoplankton. The study revealed that the abundance of picophytoplankton surpasses that of diatoms by four to seven orders of magnitude. Synechococcus was predominantly presented in the upper layer, while Prochlorococcus, picoeukaryotes, and diatoms were primarily located in the middle layer. Aggregation Boosted Tree (ABT) and Generalized Additive Models (GAM) analyses revealed that temperature and silicate (DSi) levels strongly influenced the diatom and picophytoplankton communities in the EIO. The fractions smaller than 2 μm made substantial contributions of 86.20%, 55.69%, and 96.86% to chlorophyll a (Chl-a), particulate organic carbon (POC), and living carbon biomass, respectively, underscoring the ecological significance of picophytoplankton in the carbon cycle of oligotrophic regions. Picophytoplankton represented a 33.06% of bSi stocks in the area, comparable to the contribution of diatoms (> 20 μm). Moreover, estimated contributions of diatom living carbon and silicon quota averaged 0.47% and 0.66%, respectively, while that of Synechococcus stood at 2.58% and 1.77%, indicating the predominance of Synechococcus as a weakly siliceous organism with high cell abundance in oligotrophic seas. Overall, this study draws on data from diatom and picophytoplankton biomass in the EIO to offer insights into the disproportionate carbon and silicon budgets in oligotrophic oceans from a biological perspective.
1 Introduction
Diatoms, unicellular phytoplankton with silicified cell walls typically exceeding 2 μm in diameter, contribute nearly 40% of the ocean’s primary productivity, fixing about one billion tons of carbon dioxide (CO2) annually (Roberts et al., 2007; Tréguer et al., 2018). Dissolved silica is mainly from siliceous weathering, and then absorbed by diatoms through water movement, influencing the vertical flux of silicon (Si) and carbon (C) in the ocean, thereby demonstrating a strong linkage between the marine Si and C cycles mediated by diatoms (Tréguer et al., 2021; Zhao et al., 2024). According to Brzezinski and Nelson (1986), an assumption in the Si cycle is that diatoms overwhelmingly dominate biogenic silica (bSi) stocks (Brzezinski and Nelson, 1986). Although the presence of other siliceous organisms (such as silicoflagellates and Rhizarians) may lead to an underestimation of the contribution of diatoms to bSi stocks, the assumption that diatoms are the primary contributors to bSi is still widely accepted. However, a study revealed that smaller cyanobacteria cells can accumulate substantial amounts of Si (Baines et al., 2012). Subsequently, some field studies have also demonstrated that pico-sized phytoplankton can accumulate considerable bSi content in various nutrient-poor waters such as the North Atlantic, South Pacific, Sargasso Sea and Western Pacific Ocean (Ohnemus et al., 2016; Krause et al., 2017; Leblanc et al., 2018b; Wei et al., 2021a).
Picophytoplankton (< 2 μm) constitute the smallest category of phytoplankton, encompassing both prokaryotes and eukaryotes. The prokaryotic subset within this group belongs to the cyanobacteria phylum, specifically the genera Prochlorococcus (Pro) and Synechococcus (Syn) (Waterbury et al., 1979; Chisholm et al., 1988). In oligotrophic areas, Pro, Syn, and picoeukaryotes (PEuks) accounting for at least 10% of global primary productivity and have a major role in the material circulation (Visintini et al., 2021). Historically, it was believed that picophytoplankton, such as cyanobacteria, had a minor role in exporting particulate organic carbon (POC) and bSi stocks compared to larger diatoms, due to the gravitational settling of particles (Buesseler, 1998; Legendre and Le Fèvre, 1995). However, with ocean warming and diminishing nutrient availability, Syn and Pro are anticipated to thrive, emerging as key players in future C export dynamics (Flombaum et al., 2013; Martiny et al., 2013). Recent research underscores the significant accumulation of bSi within picophytoplankton and emphasizes the crucial role of small phytoplankton in silicon cycle, challenging previous assumptions (Baines et al., 2012; Krause et al., 2017; Leblanc et al., 2018b). In combining with the study by Baines, only 10-20% of bSi stocks in the Eastern Equatorial upwelling zone were associated with living diatoms, and a suggestion was proposed to utilize the cellular bSi stocks content as a measure of the weighting in living diatom and Syn cells (Baines et al., 2012). Although the contribution of Syn to bSi stocks is quantitatively important, and sometimes it contributes more bSi stocks than living diatom cells, which was inferred only from individual cellular bSi quotas at a station (Krause et al., 2017). Moreover, the role of nano-diatoms in the Si cycle may have been ignored, and studies have noted their regional importance on a global scale (Leblanc et al., 2018a, b). Therefore, it is necessary to assess the role of size fractions phytoplankton in C and Si cycle, which may be more pronounced in oligotrophic conditions where diatoms abundance is low.
The East Indian Ocean (EIO) is typically characterized as an oligotrophic sea, with its interaction by the monsoon playing a significant role in shaping regional and global circulation systems (McClanahan et al., 2016). Previous studies have primarily focused on assessing phytoplankton biomass (Wei et al., 2019; Chen et al., 2023), with fewer investigations conducted on bSi stocks and POC content within size fractions. Recent datasets have shown that picophytoplankton largely drive variations in bSi stocks compared to diatoms, raising questions about the dominance and influence of picophytoplankton and diatoms on C and Si cycling in oligotrophic regions (Wei et al., 2021a, b). In this context, we examined the picophytoplankton and diatom abundance in the EIO. The objectives of this study were to (i) investigate the determinants influencing spatial and vertical distribution patterns of picophytoplankton and diatom; (ii) differentiate the contributions of different phytoplankton taxa (micro/nano-diatoms and pico-sized classes) to a living C and bSi stocks. (iii) highlight the significance of picophytoplankton in the Si-C biogeochemical cycles within oligotrophic regions. This research will provide new insights into the extent and variability of bSi stocks and POC in the EIO.
2 Materials and methods
2.1 Study area and sampling
The cruise was conducted aboard the R/V Shiyan6 in the EIO (10°S-15°N, 80°E-95°E) from March 11 to May 20, 2022 (Figure 1). Seawater samples were collected using 12 L Niskin bottles equipped with conductivity-temperature-depth (CTD) sensors (Sea-Bird Electronics Inc., Bellevue, USA) in situ. Hydrological parameters (such as depth, temperature, and salinity) were detected by CTD sensors. Sampling was conducted at six different depths: 5, 25, 50, 75, 100 and 150m. The collected samples were analyzed for phytoplankton abundances, chlorophyll a (Chl-a), nutrients, POC, and bSi concentrations independently.
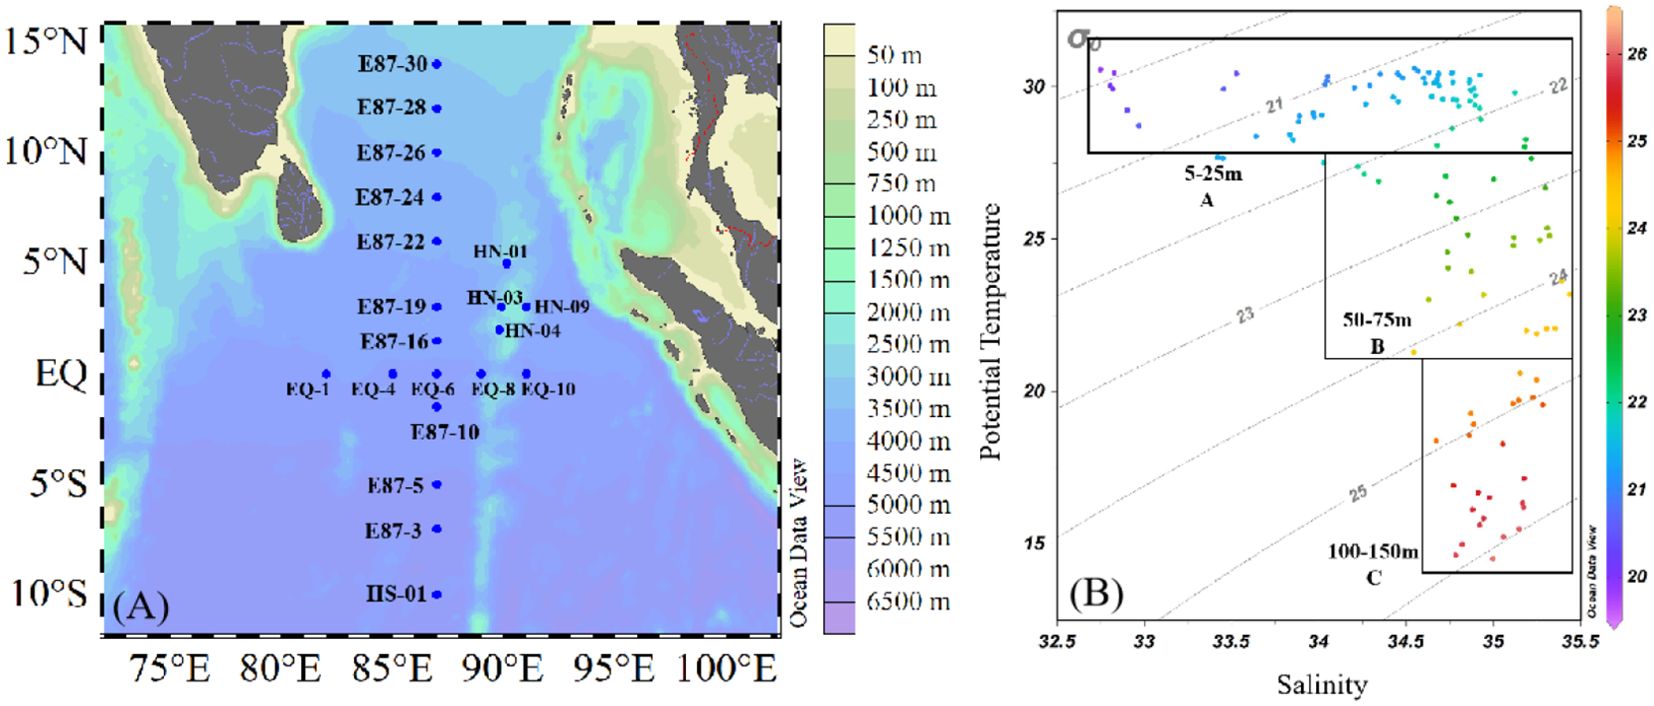
Figure 1. Sampling map (A) and temperature-salinity (B) diagrams of EIO in March to May 2022.
Micro/nanophytoplankton samples (1 L each) from different water layers were collected in plastic bottles. They were fixed with formaldehyde (1% final concentration) and stored in darkness at room temperature until further analysis (Sun et al., 2003). Picophytoplankton samples were fixed with paraformaldehyde (1% final concentration) on board. Subsequently, all samples were stayed in the dark for 10-15 min and then rapidly frozen at -80°C until analysis in the lab (Jiao et al., 2005).
The size-fractionated Chl-a samples with 2 L seawater were passed through three successive filter holders (47-mm diameter) with 20 μm nylon membrane, followed by 2 μm and 0.2 μm pore size polycarbonate filters. Similarly, for size-fractionated bSi collection, 2–4 L of seawater underwent sequential filtration through 20 μm nylon membrane, 2 μm, and 0.2 μm polycarbonate membrane filters (47-mm diameter) under low vacuum pressure (<0.004 MPa) (Zhang et al., 2019). A sufficient volume of seawater was filtered to ensure the detection of low concentrations of size-fractionated bSi. The size-fractionated POC were collected from 6 L of water and divided into two portions. One portion was filtered using a pre-burned (450 °C for 4h) Whatman 0.7 μm filter (GF/F) to capture total POC. The other portion was filtered through 2 μm polycarbonate membrane filter, and the filtrate was retained by secondary filtration to obtain a small fraction (picophytoplankton POC, <2 μm). Following filtration, filters were rinsed with distilled deionized water to ensure complete sample collection (Liu et al., 2019). The entire POC filtration process segregated suspended particles into total and pico-fractions, which were subsequently stored in a -80°C refrigerator until laboratory analysis.
For brevity, Chl-a, bSi and POC were categorized into size fractions: total (>0.2 μm), micro- (>20 μm), nano- (2–20 μm), and pico-fractions (< 2 μm) (i.e., 0.2–2 μm particle sizes). Nutrient samples (100 mL) were filtered through 0.45 µm cellulose acetate membrane filters. They were immediately frozen at -20 °C for subsequent analysis.
2.2 Laboratory analysis of nutrients, Chl-a, bSi, and POC
The nutrient samples were analyzed using a Technicon AA3 AutoAnalyzer (Bran+Luebbe) to measure dissolved inorganic phosphate (DIP), dissolved silicate (DSi), nitrate (NO3-N), nitrite (NO2-N), and ammonium (NH4-N) through classical colorimetric methods. The detection limits provided by the AA3 AutoAnalyzer were 0.001 μM for DIP, 0.03 μM for DSi, 0.02 μM for NO3-N and NO2-N, and 0.01 μM for NH4-N, respectively. For convenience, the sum of NO3-N, NO2-N and NH4-N were defined as dissolved inorganic nitrogen (DIN) and measured using the copper‐cadmium column reduction method (Collos et al., 1992). Additionally, DIP and DSi were determined using molybdenum blue reagents and standard molybdic acids, respectively (Brzezinski and Nelson, 1986; Karl and Tien, 1992).
The Chl-a samples were extracted from the filters with 5mL 90% acetone (4°C for 24h). Afterwards, we removed the filters and measured the Chl-a concentrations through the non-acidification method on a CE Turner Designs Fluorometer following the protocol by Welschmeyer (Welschmeyer, 1994). The fluorescence was further calculated to Chl-a concentration according to a standard curve (Sigma Chemical Co).
Size-fractionated bSi samples were initially dried for 12-24 h (60°C) and then analyzed using the sequential NaOH-HF digestion method outlined by Brzezinski and Nelson (1995). All reactions were carried out in Teflons tubes to ensure minimal and consistent blank values (Krause et al., 2009). During the NaOH digestion process for bSi extraction, a variable amount of lithogenic silica (LSi) was observed to dissolve alongside the bSi, potentially causing interference in bSi measurements (Brzezinski and Nelson, 1995). In order to reduce the error of analyzed procedure, the digestion time for bSi was extended to over 60 min, effectively minimizing the impact of LSi interference (Leblanc et al., 2018b). Previous studies have revealed that the 15% LSi interference was highest in typical oligotrophic regions, such as the Sargasso Sea (Baines et al., 2012; Krause et al., 2017). Therefore, to correct the LSi interference thoroughly, we assumed that 15% LSi dissolved during the first NaOH digestion in our study. This correction led to a conservative underestimation of size-fractionated bSi but did not alter the relative contribution or distribution of bSi standing stocks. POC samples were acidified with HCl and dried at 60 °C before analysis using a Costech ECS4010 Elemental Analyzer (Costech International S.P.A., Milan, Italy).
2.3 Analysis of phytoplankton
In the laboratory, the micro/nano-diatom samples were concentrated into 100 mL settlement columns for 48 h by the Utermöhl method (Sun et al., 2002). Then, species recognition and cell enumeration were identified with an inverted microscope (AE2000, Motic, Xiamen, China) at magnifications of 200× or 400×. Phytoplankton taxonomy identification was carried out as described by Yamaji (1991) and Sun et al. (2003).
Picophytoplankton samples were distinguished by flow cytometry (Becton-Dickinson Accuri C6) equipped with blue (488 nm) and red (638 nm) excitation lights. After melting the frozen samples, 2 μm fluorescent beads (Polysciences) were added as an internal reference to 1 mL replicated samples for subsequent analysis (Wei et al., 2019). The samples were then measured at a high flow rate of 60 µL/min for 3 min. Three groups of picophytoplankton were discriminated through a two-parameter distribution map, which includes light scattering (Forward scatter, FSC; Side scatter, SSC; identifying cell size) and fluorescence parameters (FL3, chlorophyll; FL2, phycoerythrin). Specifically, the Syn group, characterized by phycoerythrin presence, was distinguished based on FL2 height, while the Pro and PEuks groups lacking phycoerythrin were differentiated. Furthermore, the Pro and PEuks groups containing chlorophyll were discerned by the discrepancy in FL3 and SSC heights.
2.4 Data calculation and statistical analysis
For estimation of the living diatom’s carbon biomass, volume parameters associated with diatoms were measured using a fluorescence microscope (RX50) at 200× (or 400×) magnification. Each diatom cells were measured 25-30 times to calculate and the average cell volume based on the model and formula by Sun and Liu (2003). Subsequently, the estimation of diatom carbon biomass was based on Eppley (Eppley et al., 1970). Similarly, the silicon quotas in living diatoms were calculated using the silica-volume relationship as described by Conley et al. (1989). The carbon biomass of the picophytoplankton based on the carbon conversion factor of Wei et al. (2019): 129 fg C/cells for Syn, 32 fg C/cells for Pro, 160 fg C/cells for PEuks. Besides, the cellular Si quotas in Syn was developed from Wei et al. (2020). The depth-integrated biomass of diatoms and picophytoplankton in the water column was determined using the trapezoidal integration method (Uitz et al., 2006).
We tested for normality before analyzing the data. Pearson correlation analysis (r and p-values; SPSS v25) were used to assess the relationship between phytoplankton and environmental factors. Redundancy analysis with vegan package (RDA, R v4.2.1; Dixon, 2003) was used to investigate the variance in diatom and picophytoplankton communities explained by environmental factor. Aggregate boosted tree (ABT) analysis was performed by “gbmplus” package (R v4.2.1; De’Ath, 2007) to quantify the impacts of key variables on biological parameters. Generalized additive models (GAM) were developed using the R package “mgcv” to further explore the response of diatoms and picophytoplankton to key explanatory variables (R v4.2.1). We employed a family of Poisson error distributions in GAM with log as link function. The degree of smoothing for each predictor variable was limited to select the best value. The R square values were used to access the goodness of fit of the model. All levels of statistical significance were set at p < 0.05. Box plots and contribution plots of biotic and abiotic parameters were generated using OriginPro 8.5.
3 Results
3.1 Hydrological parameters and nutrients
The spatial and vertical distributions of environmental parameters (temperature, salinity, dissolved oxygen (DO), DIN, DIP, and DSi) are shown in Figure 2, which present large spatial variability along latitudinal gradients. We can observe that the water temperature increased with latitude from the southern latitude to the northern hemisphere, with the highest temperatures at stations near the Bay of Bengal (BOB). On the contrary, salinity exhibit an opposite trend to temperature, being lowest in the vicinity of the BOB. According to the vertical depth of the study area, water masses were divided into three groups, including group A (upper 5-25m), group B (middle 50-75m) and group C (bottom 100-150m) (Figure 1B). In the upper layer, the temperature ranged from 28.28 to 30.61°C, averaging 29.94 ± 0.62°C, with salinity ranging from 32.75 to 34.92, averaging 34.14 ± 0.66. The middle layer exhibited lower temperatures than the upper layer, ranging from 18.42 to 30.49°C (average 27.56 ± 2.64°C), with salinity varying from 33.42 to 35.32 (average 34.71 ± 0.49). In the deeper layers, temperatures decreased significantly while salinity increased, with temperatures ranging from 14.54 to 28.67°C (average 19.86 ± 3.85°C) and salinity ranging from 34.63 to 35.44 (average 35.00 ± 0.21).
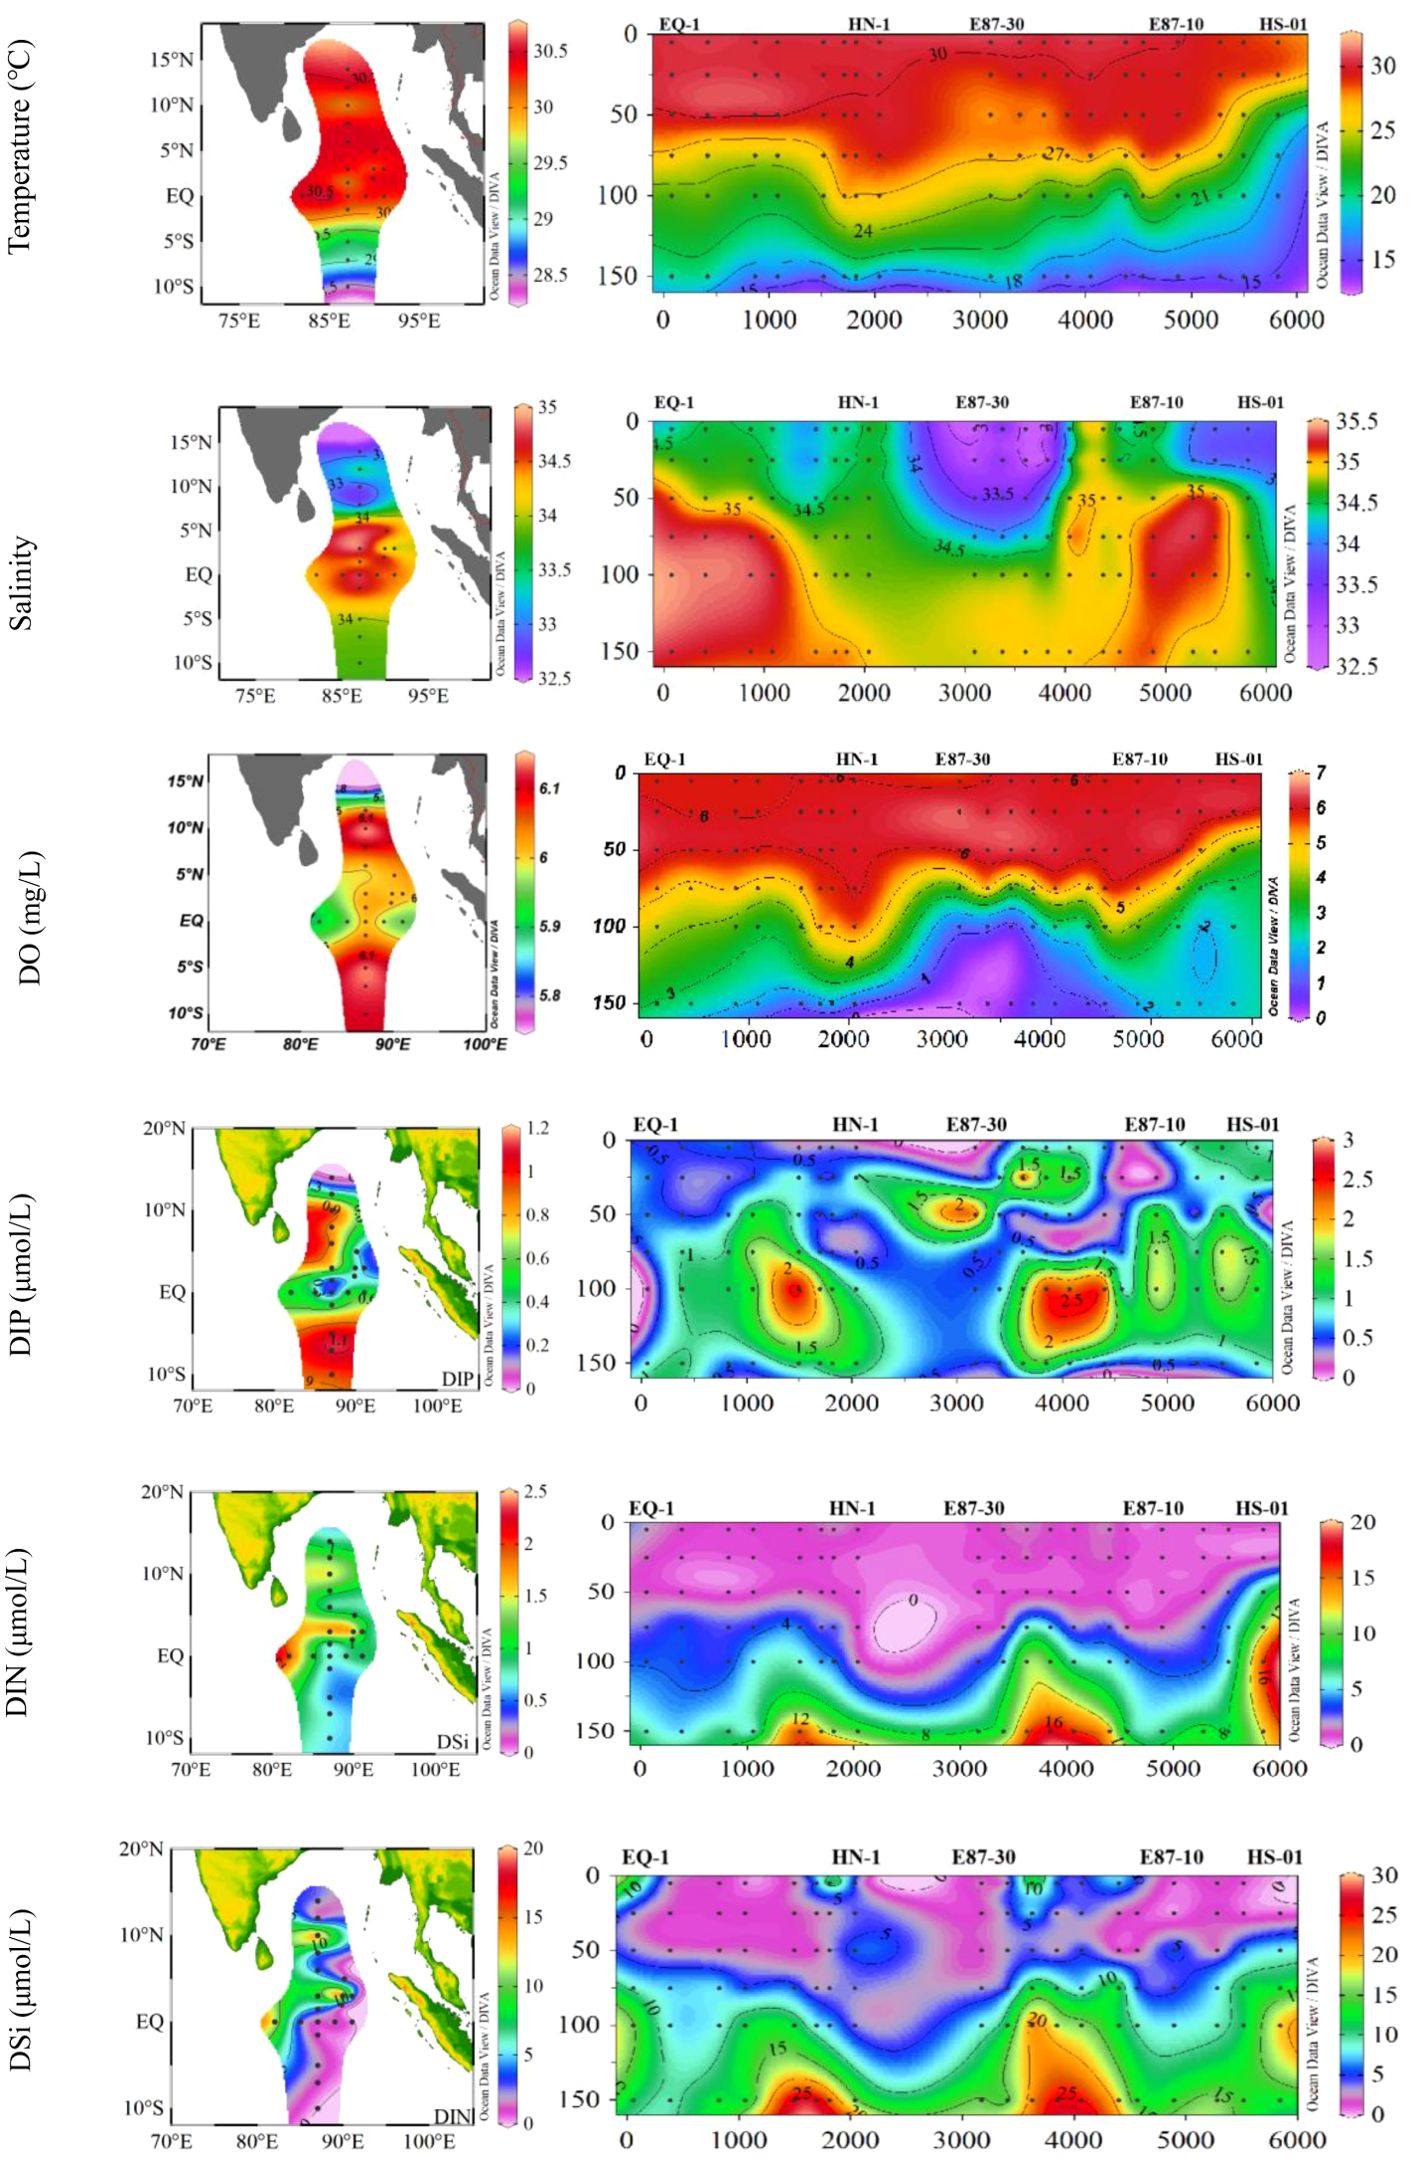
Figure 2. The surface and vertical distributions of environmental parameters.
Besides, high value of DO and DIP was observed in the southern part of the study area, while lower concentrations of DO and nutrients were observed in the northern part. Nutrient concentrations were found to be depleted in the middle layer and a pronounced stratification was occurred in vertical distribution.
3.2 Distribution of biotic compounds
Figure 3 presented the horizontal distribution of size-fractionated biotic compounds in the surface, including Chl-a, bSi and POC. We found that these parameters were lower near the BOB, while higher Chl-a values were found near the equator. In terms of vertical distribution, Chl-a content was generally greater near the middle layer (Figure 4).
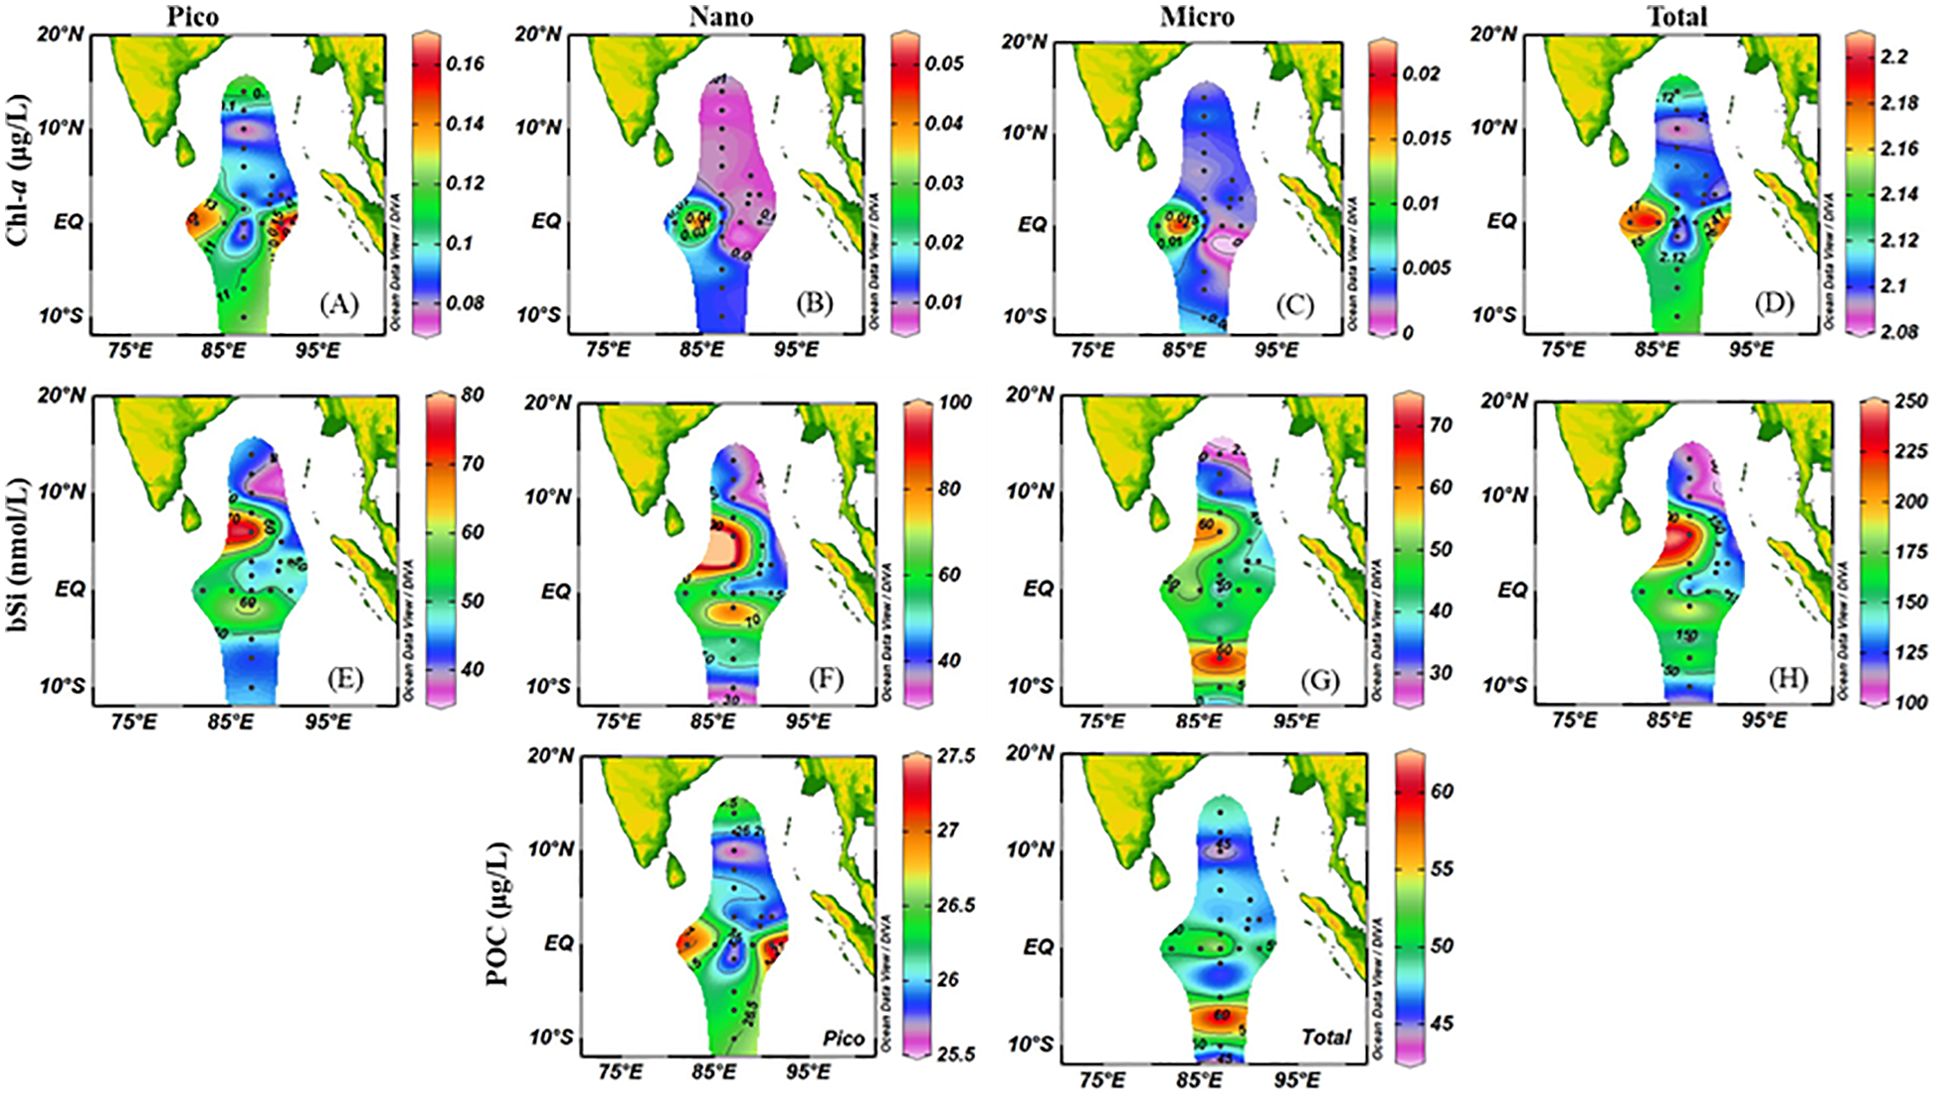
Figure 3. Horizontal distribution of abiotic compounds ((A), pico-sized Chl-a; (B), nano-sized Chl-a; (C), micro-sized Chl-a; (D), total Chl-a; (E), pico-sized bSi; (F), nano-sized bSi; (G), micro-sized bSi; (H), total bSi).
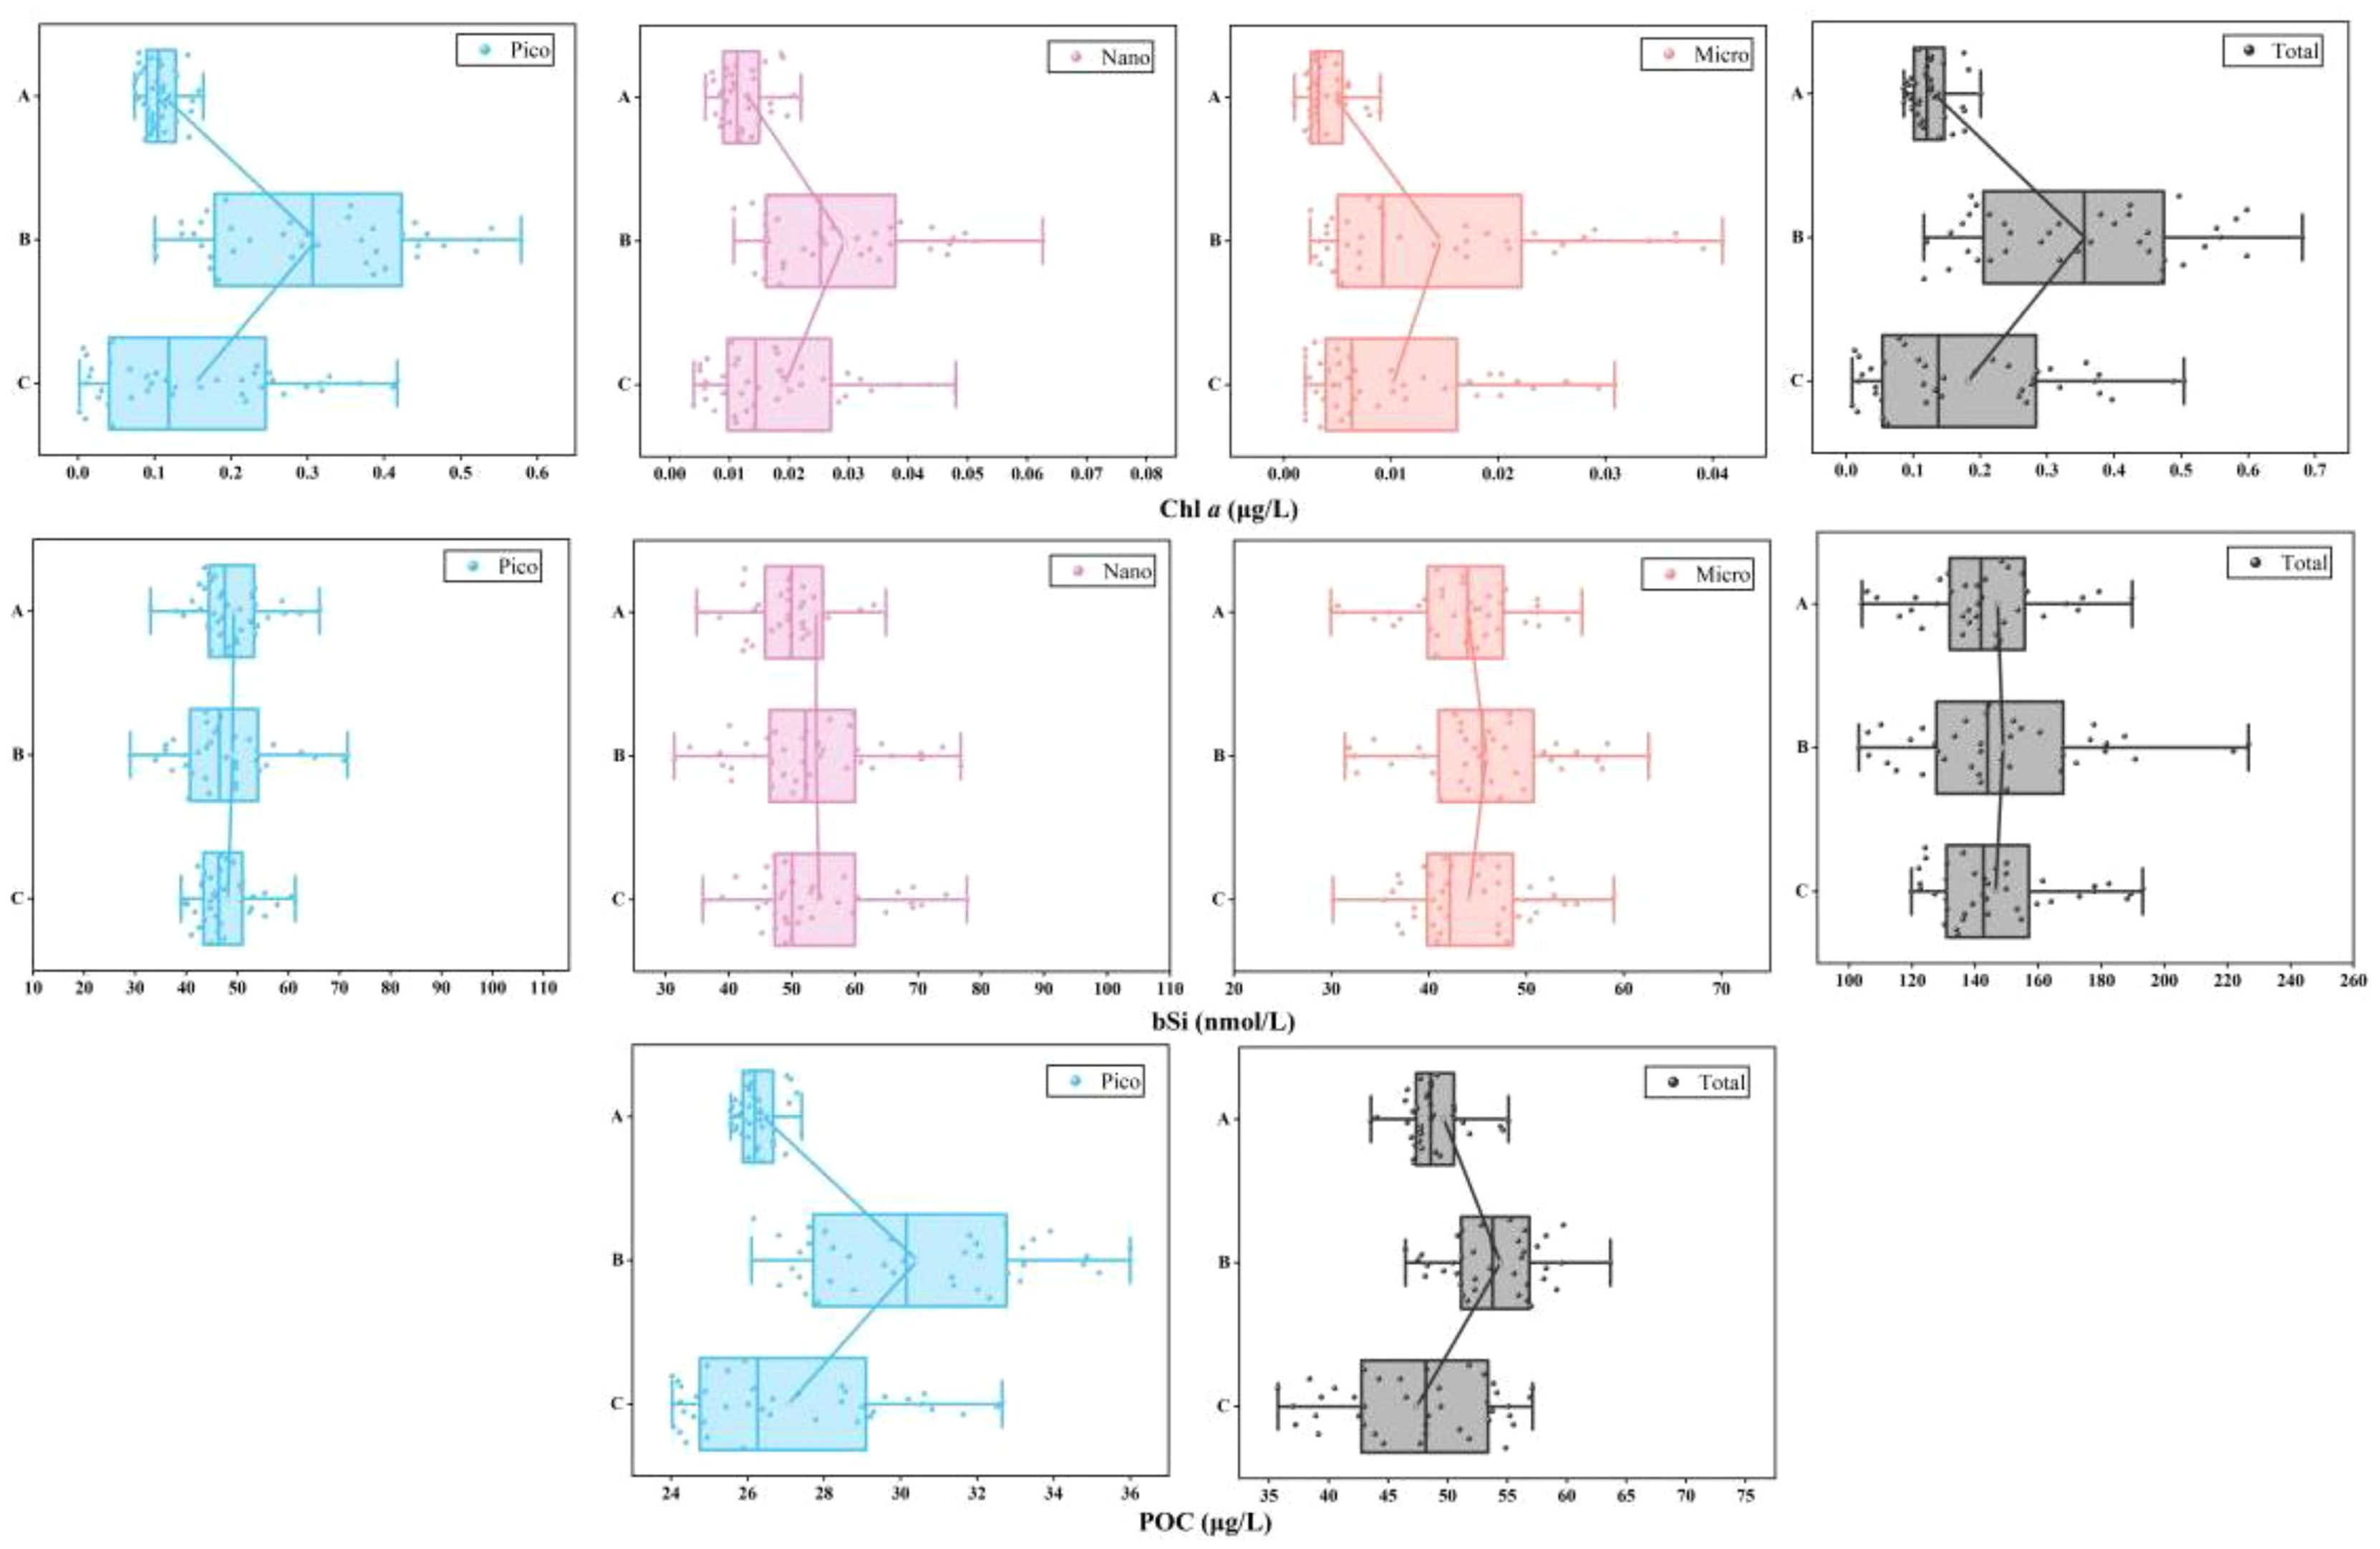
Figure 4. Distribution of biotic compounds among the three groups.
We observed similar vertical distribution trend in size-fractionated bSi standing stocks (Figure 4). The total bSi contents in group A varied between 104.07 and 239.55 nmol/L, with an average content of 147.12 nmol/L. In group B, total bSi contents ranged from 103.12 to 226.69 nmol/L, averaging 148.87 nmol/L, while group C exhibited relatively lower contents (ranging from 119.79 to 193.15 nmol/L, mean 146.53 nmol/L). Surprisingly, we noted that the size-fractionated bSi standing stocks was not greatly changed by the depth. The average bSi content in the < 2 μm (pico-bSi) size fraction for the three groups was 49.27, 49.09 and 48.13 nmol/L, respectively. In addition, measurable POC was surveyed at all sampling stations, including pico-POC (POC <2 μm) and total-POC size fractions as illustrated in Figure 4. Pronounced vertical trends were evident in POC concentrations for both size fractions, and higher levels observed near the subsurface that gradually decreased with increasing water depth up to 150m. Specifically, pico-POC concentrations peaked in group B, with an average value of 30.44 μg/L, whereas group C exhibited a slightly lower average of 27.07 μg/L, closer to the mean of group A at 26.40 μg/L.
3.3 Distribution and variation of cell abundance for micro/nano-diatom and picophytoplankton
The surface distribution of micro/nano-diatoms and picophytoplankton cell abundance is presented in Figure 5. The cell abundance of picophytoplankton exceeded that of micro/nano-diatoms by four to seven orders of magnitude. There is no doubt that picophytoplankton dominated in oligotrophic areas. Specifically, the average water column percentage of cell abundance for Syn, Pro and PEuks was 8.26%, 85.60%, 6.14%, respectively, highlighting Pro as the primary contributor to picophytoplankton. On the whole, lower cell abundance was observed at stations close to the BOB in the northernmost part of study area. Higher cell abundance of Pro was found at the equator, while Syn and PEuks exhibited relatively higher cell abundance in the southernmost part of the study area.
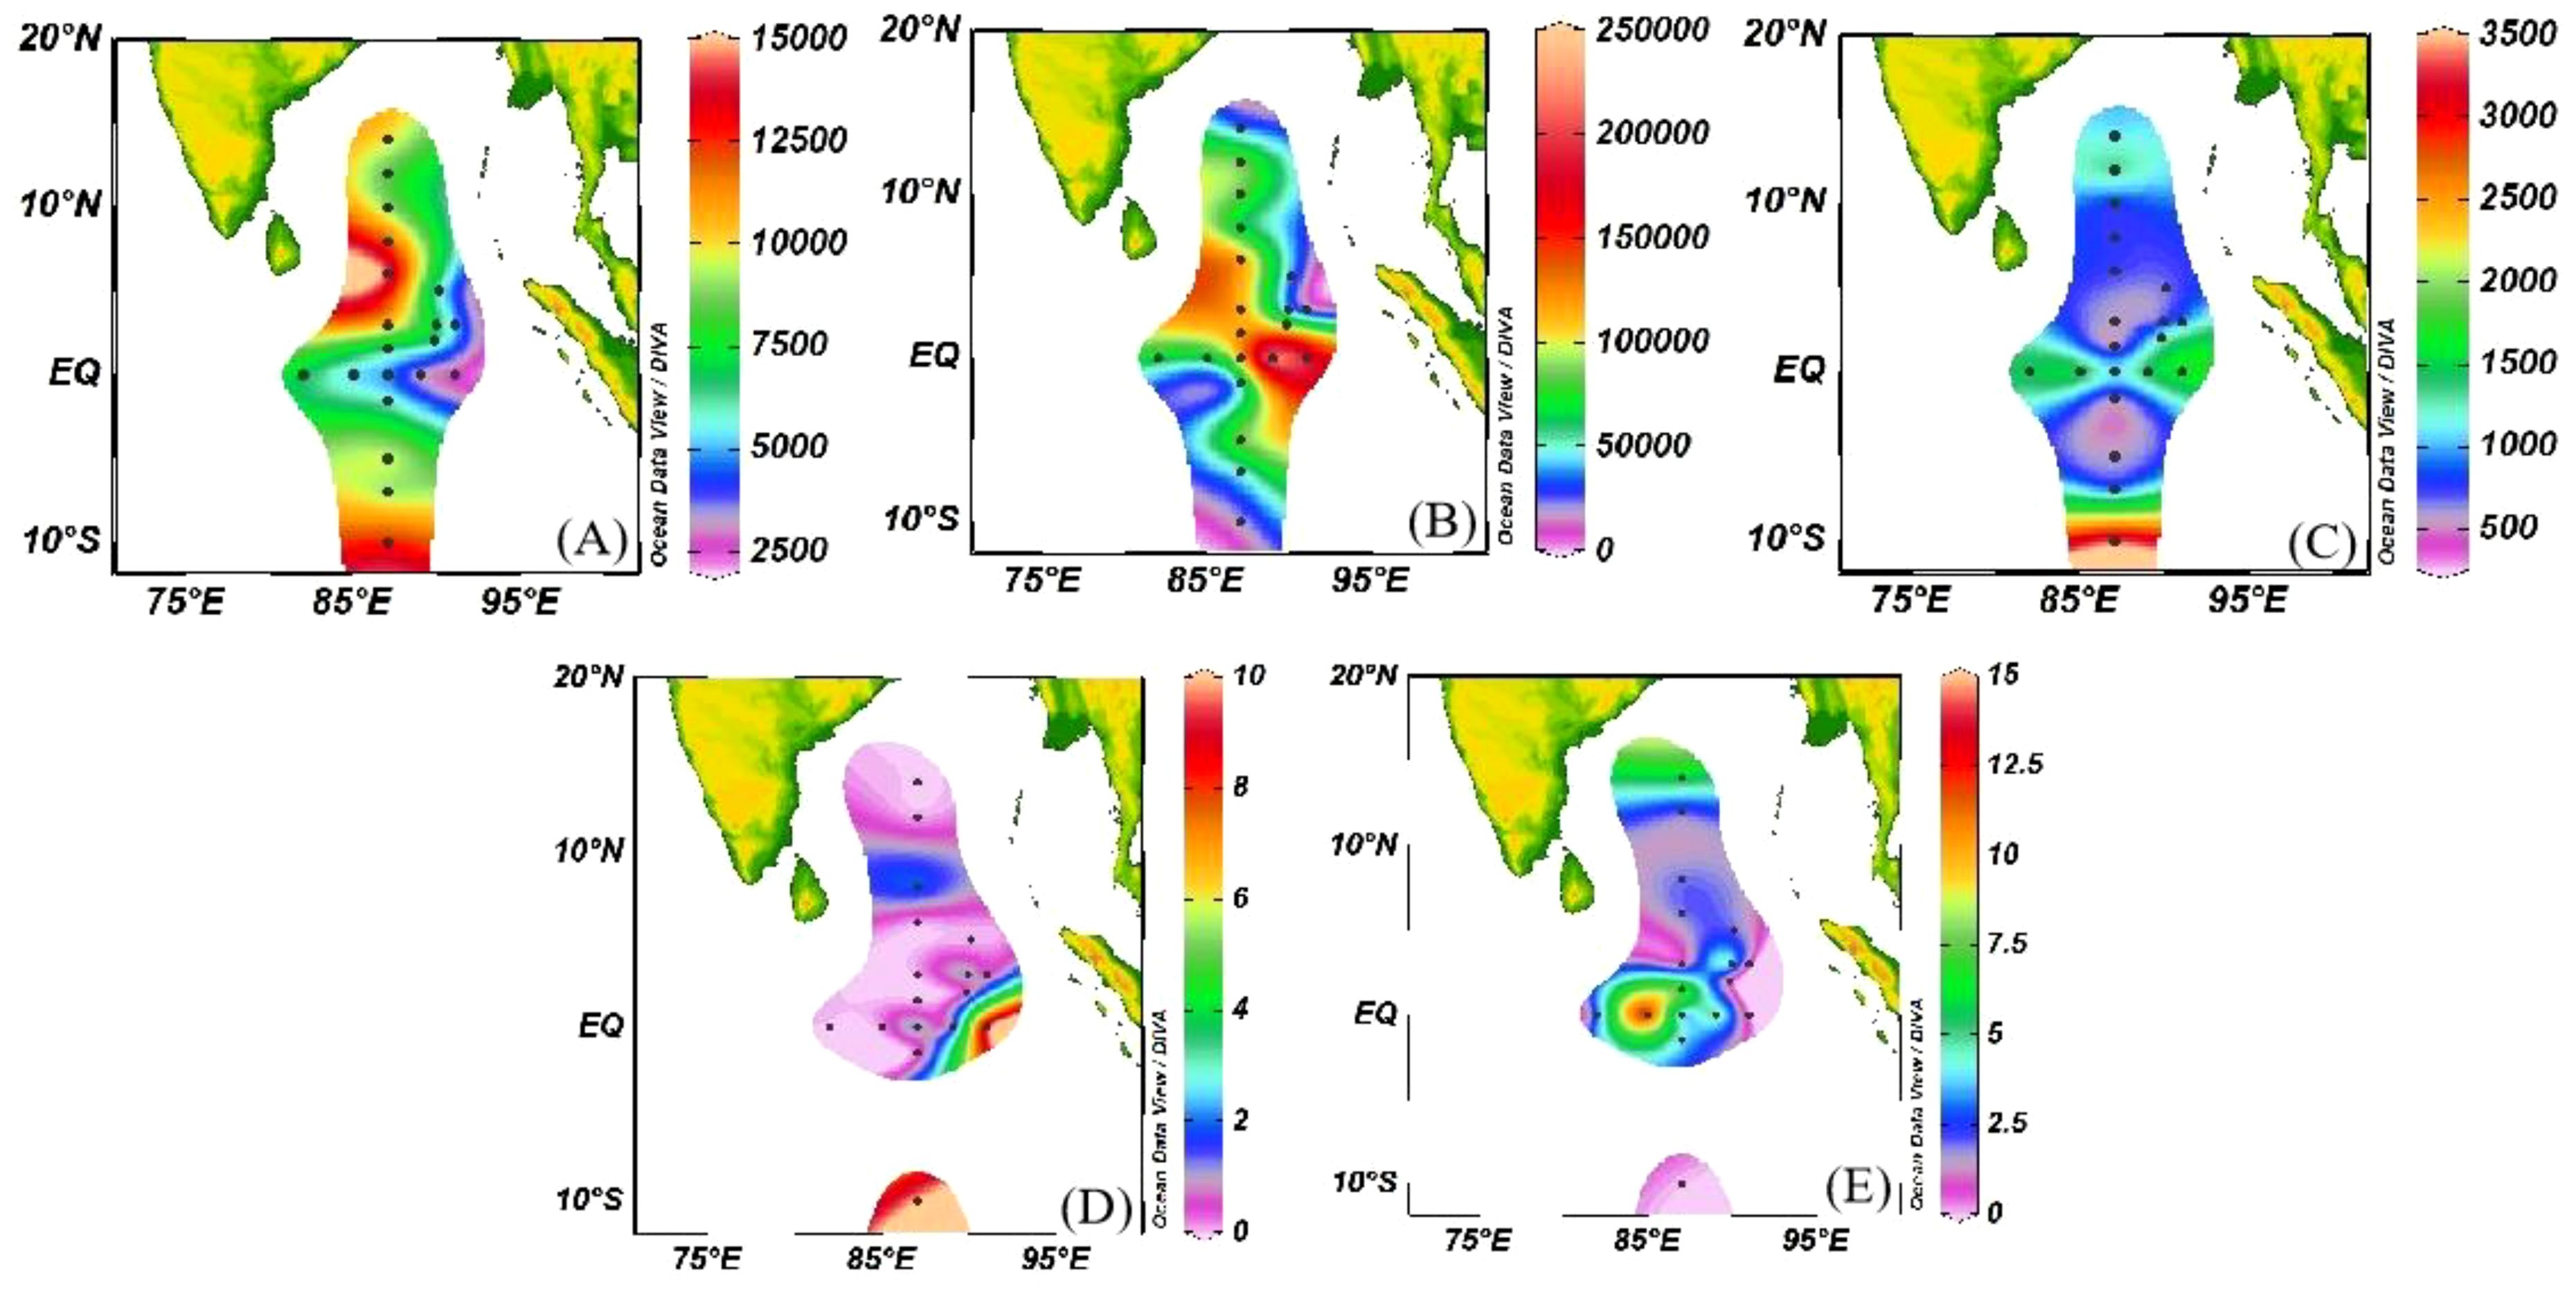
Figure 5. Surface distribution of micro/nano diatom and picophytoplankton cell abundance. (A) Synechococcus; (B) Prochlorococcus; (C) picoeukaryotic; (D) Micro-diatoms; (E) Nano-diatoms.
The vertical phytoplankton abundance was varied significantly among different layers (Figure 6). The abundance of Syn showed notable differences among the layers, with the group A having significantly higher abundance (mean 7.64×10³ cells/mL) compared to the group B and C (mean 5.89×10³ cells/mL, 3.04×10³ cells/mL, respectively). Pro abundance in group A and B was higher than in group C, with mean values of 8.80×10⁴ cells/mL, 7.13×10⁴ cells/mL, and 1.63×10⁴ cells/mL, respectively. PEuks was predominantly found in the middle layer, with an average abundance of 4.58×10³ cells/mL. Group A exhibited lower abundance compared to group C (mean of 1.25×10³ cells/mL for A and 1.63×10³ cells/mL for C). Micro/nano diatoms showed an abundance peak in group B, while their abundance was relatively low in group A.
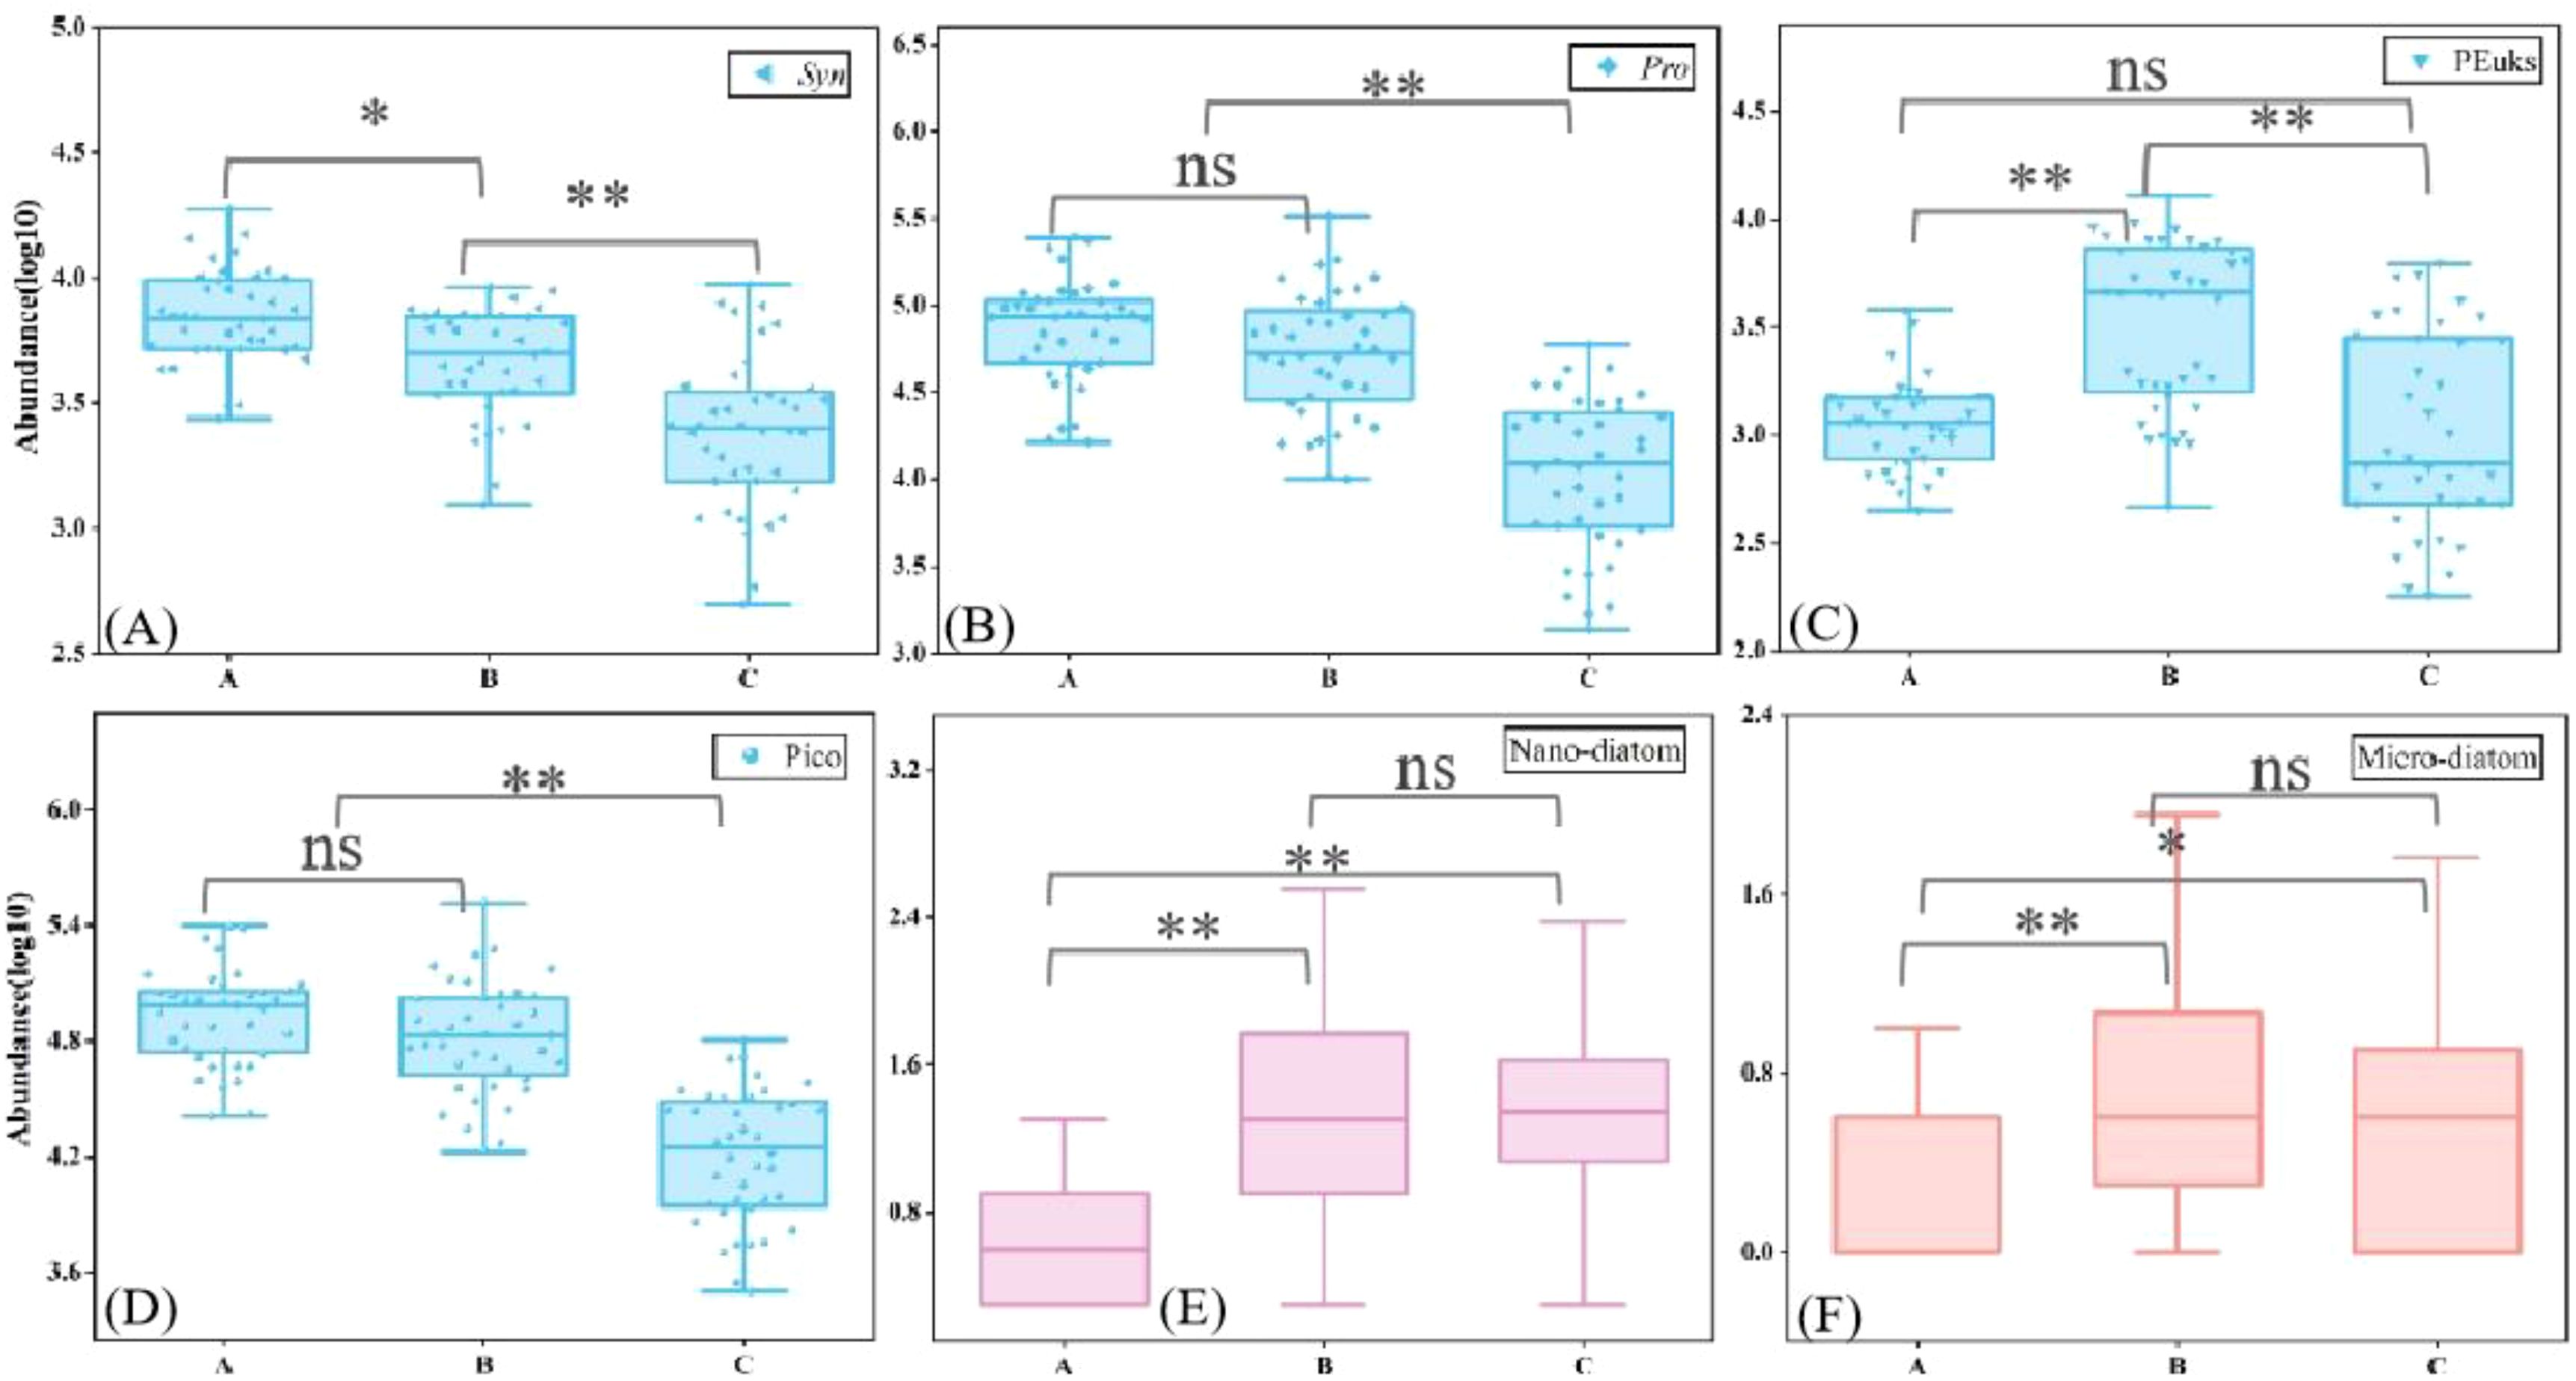
Figure 6. Cell abundance of the phytoplankton community among the three groups. (A) Synechococcus; (B) Prochlorococcus; (C) picoeukaryotes; (D) Picophytoplankton; (E) Nano-diatoms; (F) Micro-diatoms (ns is p> 0.05; * is p<0.05; ** is p< 0.01).
3.4 Factors regulating the dynamics of micro/nano-diatoms and picophytoplankton
RDA and Person correlation analysis had been performed to determine which environmental variables influenced the dynamics of diatom and picophytoplankton (Figure 7). Our RDA revealed that nutrients played a crucial role in phytoplankton communities and were significantly negatively correlated with picophytoplankton (Figures 7B, C). In contrast, there was no significant correlation between diatom in the >2 μm size fraction and environmental parameters in the Person correlation analysis (p>0.05). Subsequently, the ABT analysis presented that temperature and DSi had a potential influence on the diatom abundance, which the relative effect can exceed other environmental parameters (Figure 7D). Similarly, the relative effect of temperature and DSi together on picophytoplankton abundance was more than 37%. The GAM model was applied to more accurately observe the response of cell abundance to the temperature and DSi (Figure 7E). A positive correlation was observed between temperature and the diatom abundance, with the abundance being suppressed only when the temperature exceeded 28°C. The picophytoplankton communities regulated by temperature and had great plasticity, with a peak at 22°C and 27°C. In addition, another peak was observed around 30°C, which also showed that picophytoplankton was more adaptive at high temperature compared to diatom. DSi values (<5 μmol/L) clearly favored the diatom (>2μm) community. In contrast, we found that picophytoplankton had a clear minimum under the conditions of special DSi (10 μmol/L).
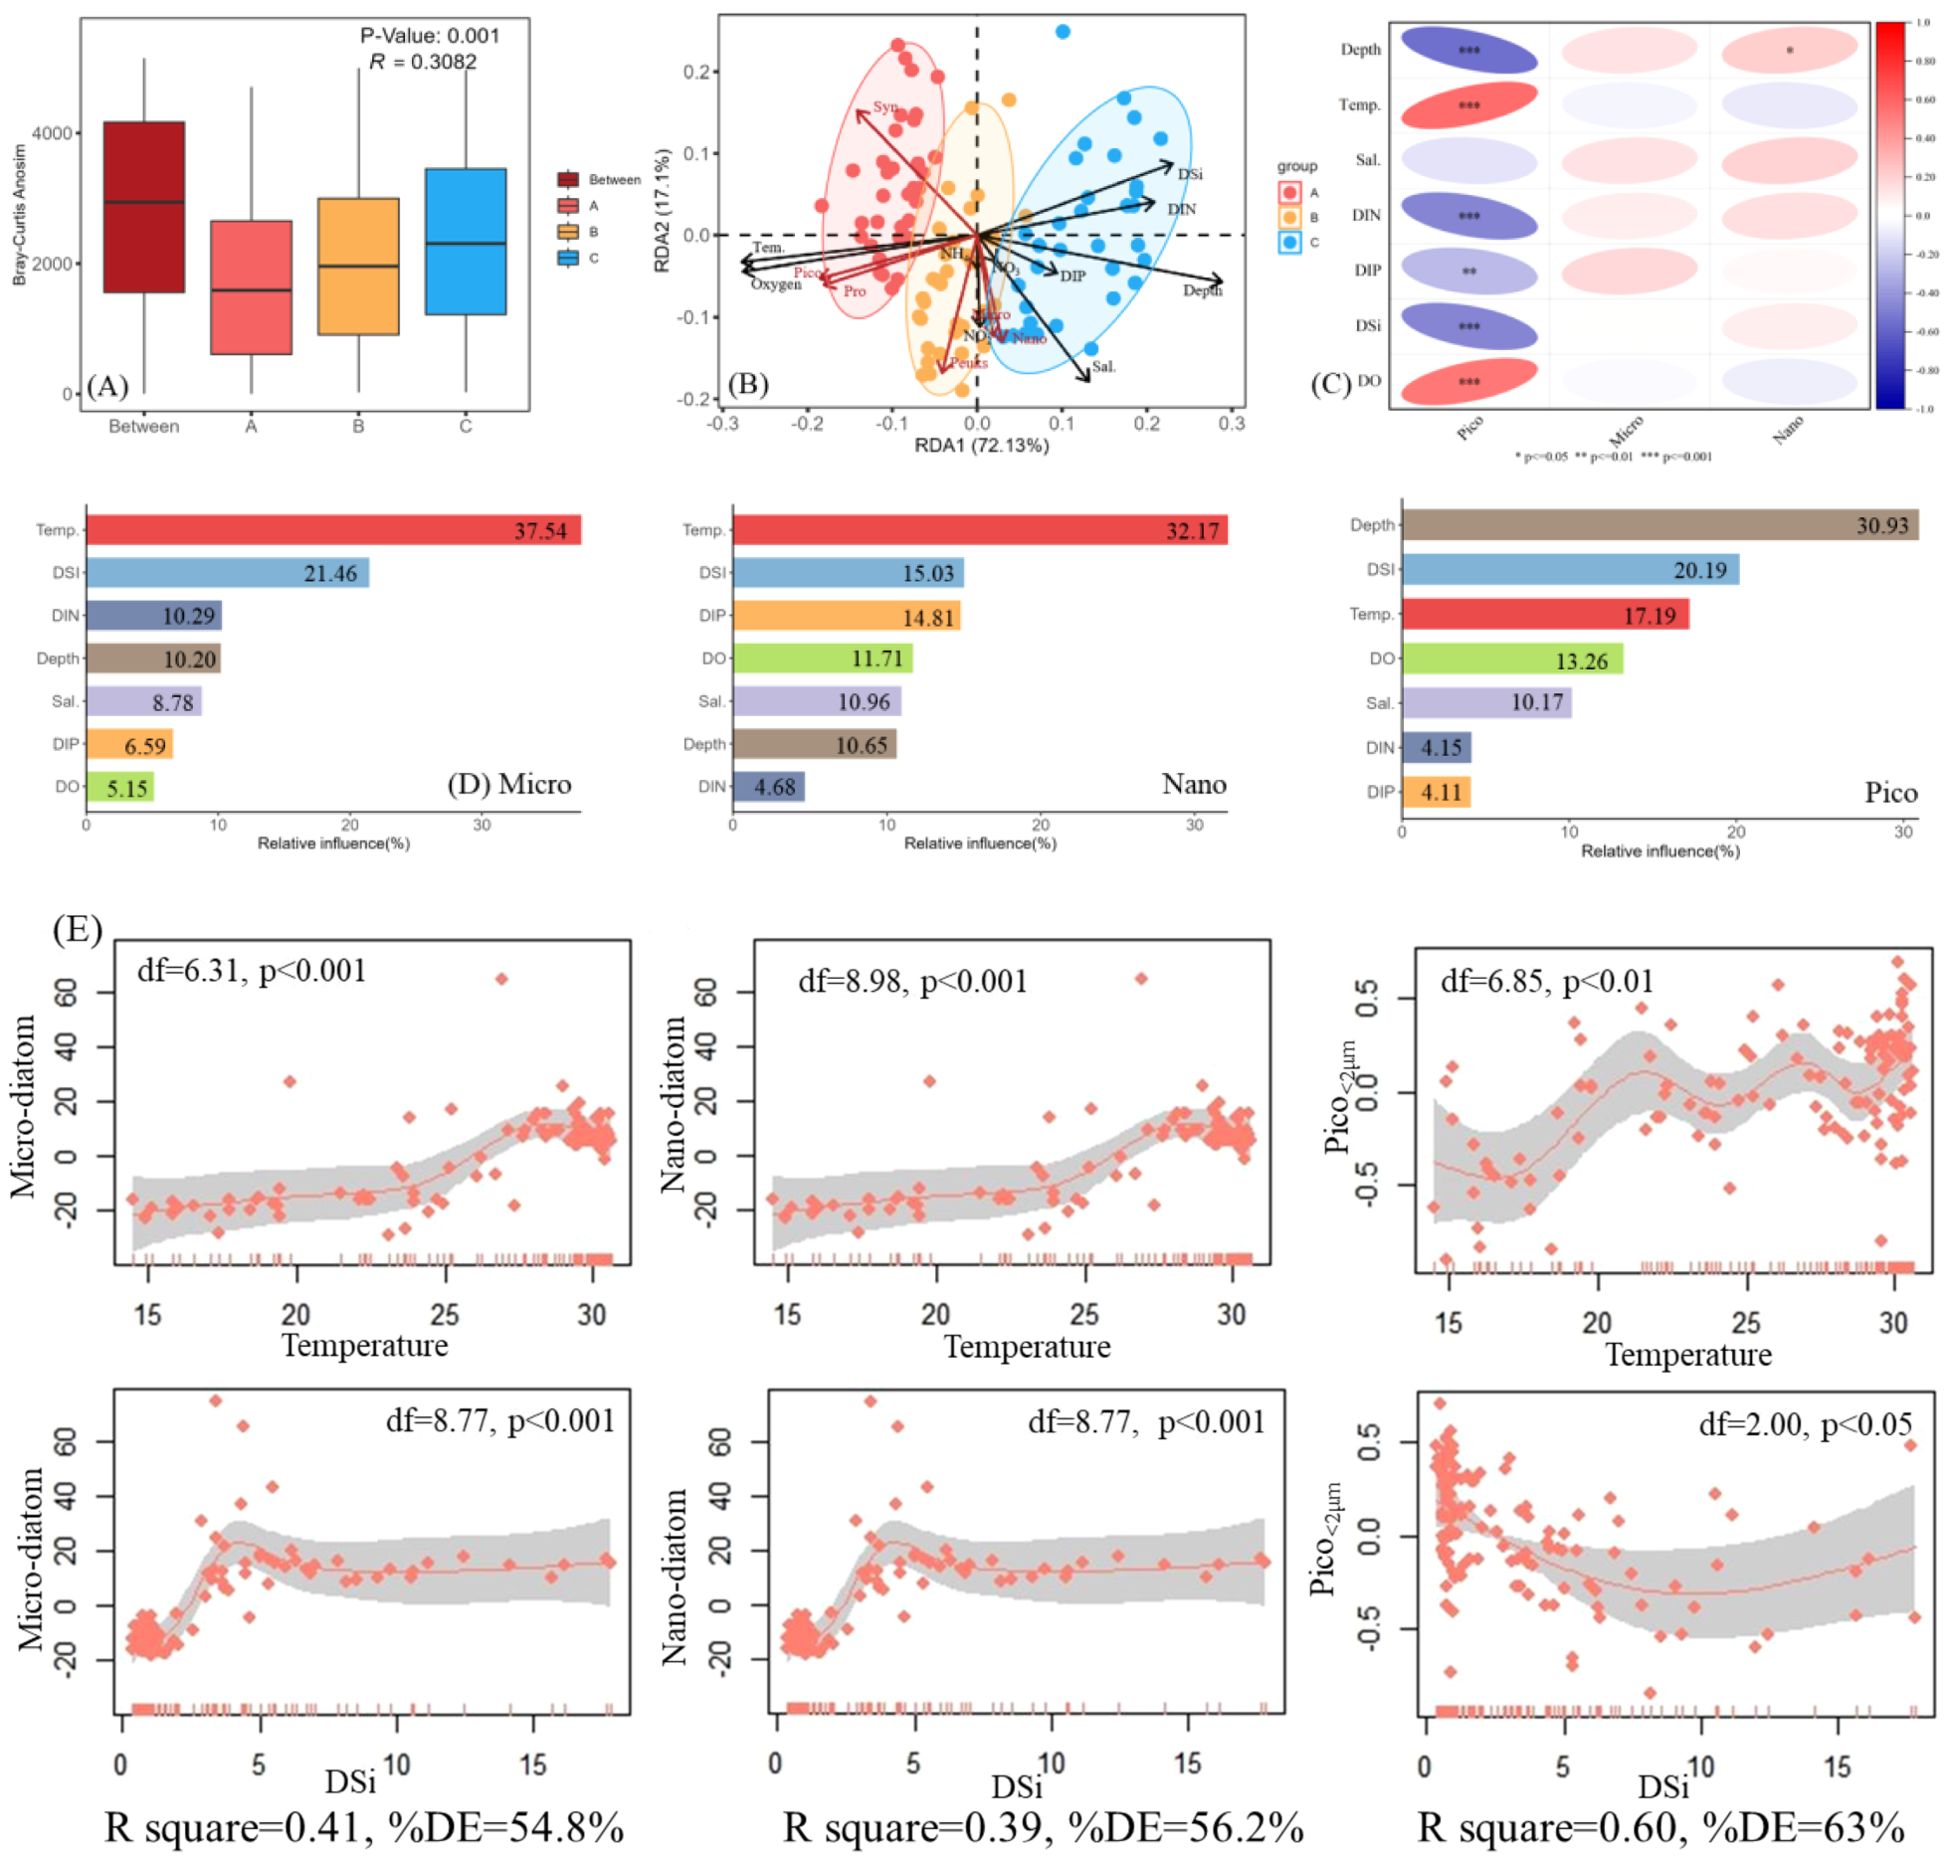
Figure 7. Relationships between cell abundance (micro/nano diatom and picophytoplankton) and environmental parameters. (A) ANOSIM analyses based on Bray-Curtis distance; (B) RDA analysis between cell abundance and environmental factors; (C) Pearson correlation analysis between cell abundance and environmental factors; (D) ABT analysis for the relative influences (%) of environmental parameters on picophytoplankton abundance; (E) GAM modeling of cell abundance variation with temperature and DSi.
3.5 Contribution of size-fractioned biomass in EIO
The comparison of size-fractionated biomass percentage in the EIO is shown in Figure 8. All contribution analyses are based on the average depth-weighted values. Pico-Chl-a accounted for a considerable proportion of total-Chl-a, contributing 86.20%. The nano-Chl-a contribution was the second largest (9.25%) and micro-Chl-a accounted for the least at 4.54% (Figure 8A). The average contributions of various size fractions to bSi were as follows: bSi2-20 μm (36.66%), bSi<2 μm (33.06%) and bSi>20 μm (30.28%) (Figure 8B). In order to improve the accuracy of the measurement, the fractionated determination of POC was classified into micro/nano-POC (POC >2 μm) and pico-POC. The average POC contribution in the < 2 μm size fraction to total POC was 55.69%, with microplankton and nanoplankton together contributing 44.31% to total POC (Figure 8C). Subsequently, the living carbon biomass of phytoplankton was estimated by microscope and cell volume conversion (Sun et al., 1999). We found that the living carbon biomass of picophytoplankton ranged from 1.63 to 12.86 μg C/L, representing 96.86% of the total biomass and indicating the dominance of picophytoplankton in the contribution of carbon biomass in the investigated area compared to diatoms (Figure 8D). In various groups, the living carbon biomass of Pro was significantly higher than that of Syn and PEuks in study area. The biomass of Pro varied from 0.53 to 9.31 μg C/L, which contributed to 59.55% of the picophytoplankton total biomass (Figure 8E). The biomass of Syn ranged from 0.29 to 1.83 μg C/L, accounting for 22.29%, while PEuks exhibited lower biomass compared to Pro and Syn, at 18.17%. Besides, we made a rough estimate for the cellular Si contents of living Syn based on the previous studies (Wei et al., 2022). The depth- weighted average Si quotas for Syn cells ranged from 0.35 to 1.20 nmol/L, which represented 1.77% of bSi in the < 2 μm size fraction (Figure 8F). Apparently, the silicon and carbon biomass proportions of living cell diatoms were 0.66% and 0.47%, which further reflected the coupling of diatoms between C and Si cycling. In addition, an obvious correlation between the size-fractionated bSi stocks and phytoplankton abundance was observed, which indicated that environmental regulation indirectly affects bSi stocks through phytoplankton abundance (Figures 8H, I). There was a strong correlation between nano-diatom and size-fractionated bSi stocks, indicating that diatom detritus might largely influences the variability of bSi in the < 2 μm size fraction. Meanwhile, linear regression analyses demonstrated a notable effects of Syn abundance on the bSi in the < 2 μm size fraction, implying that variations in Syn abundance appeared to have a relatively large control over the bSi flux regulation.
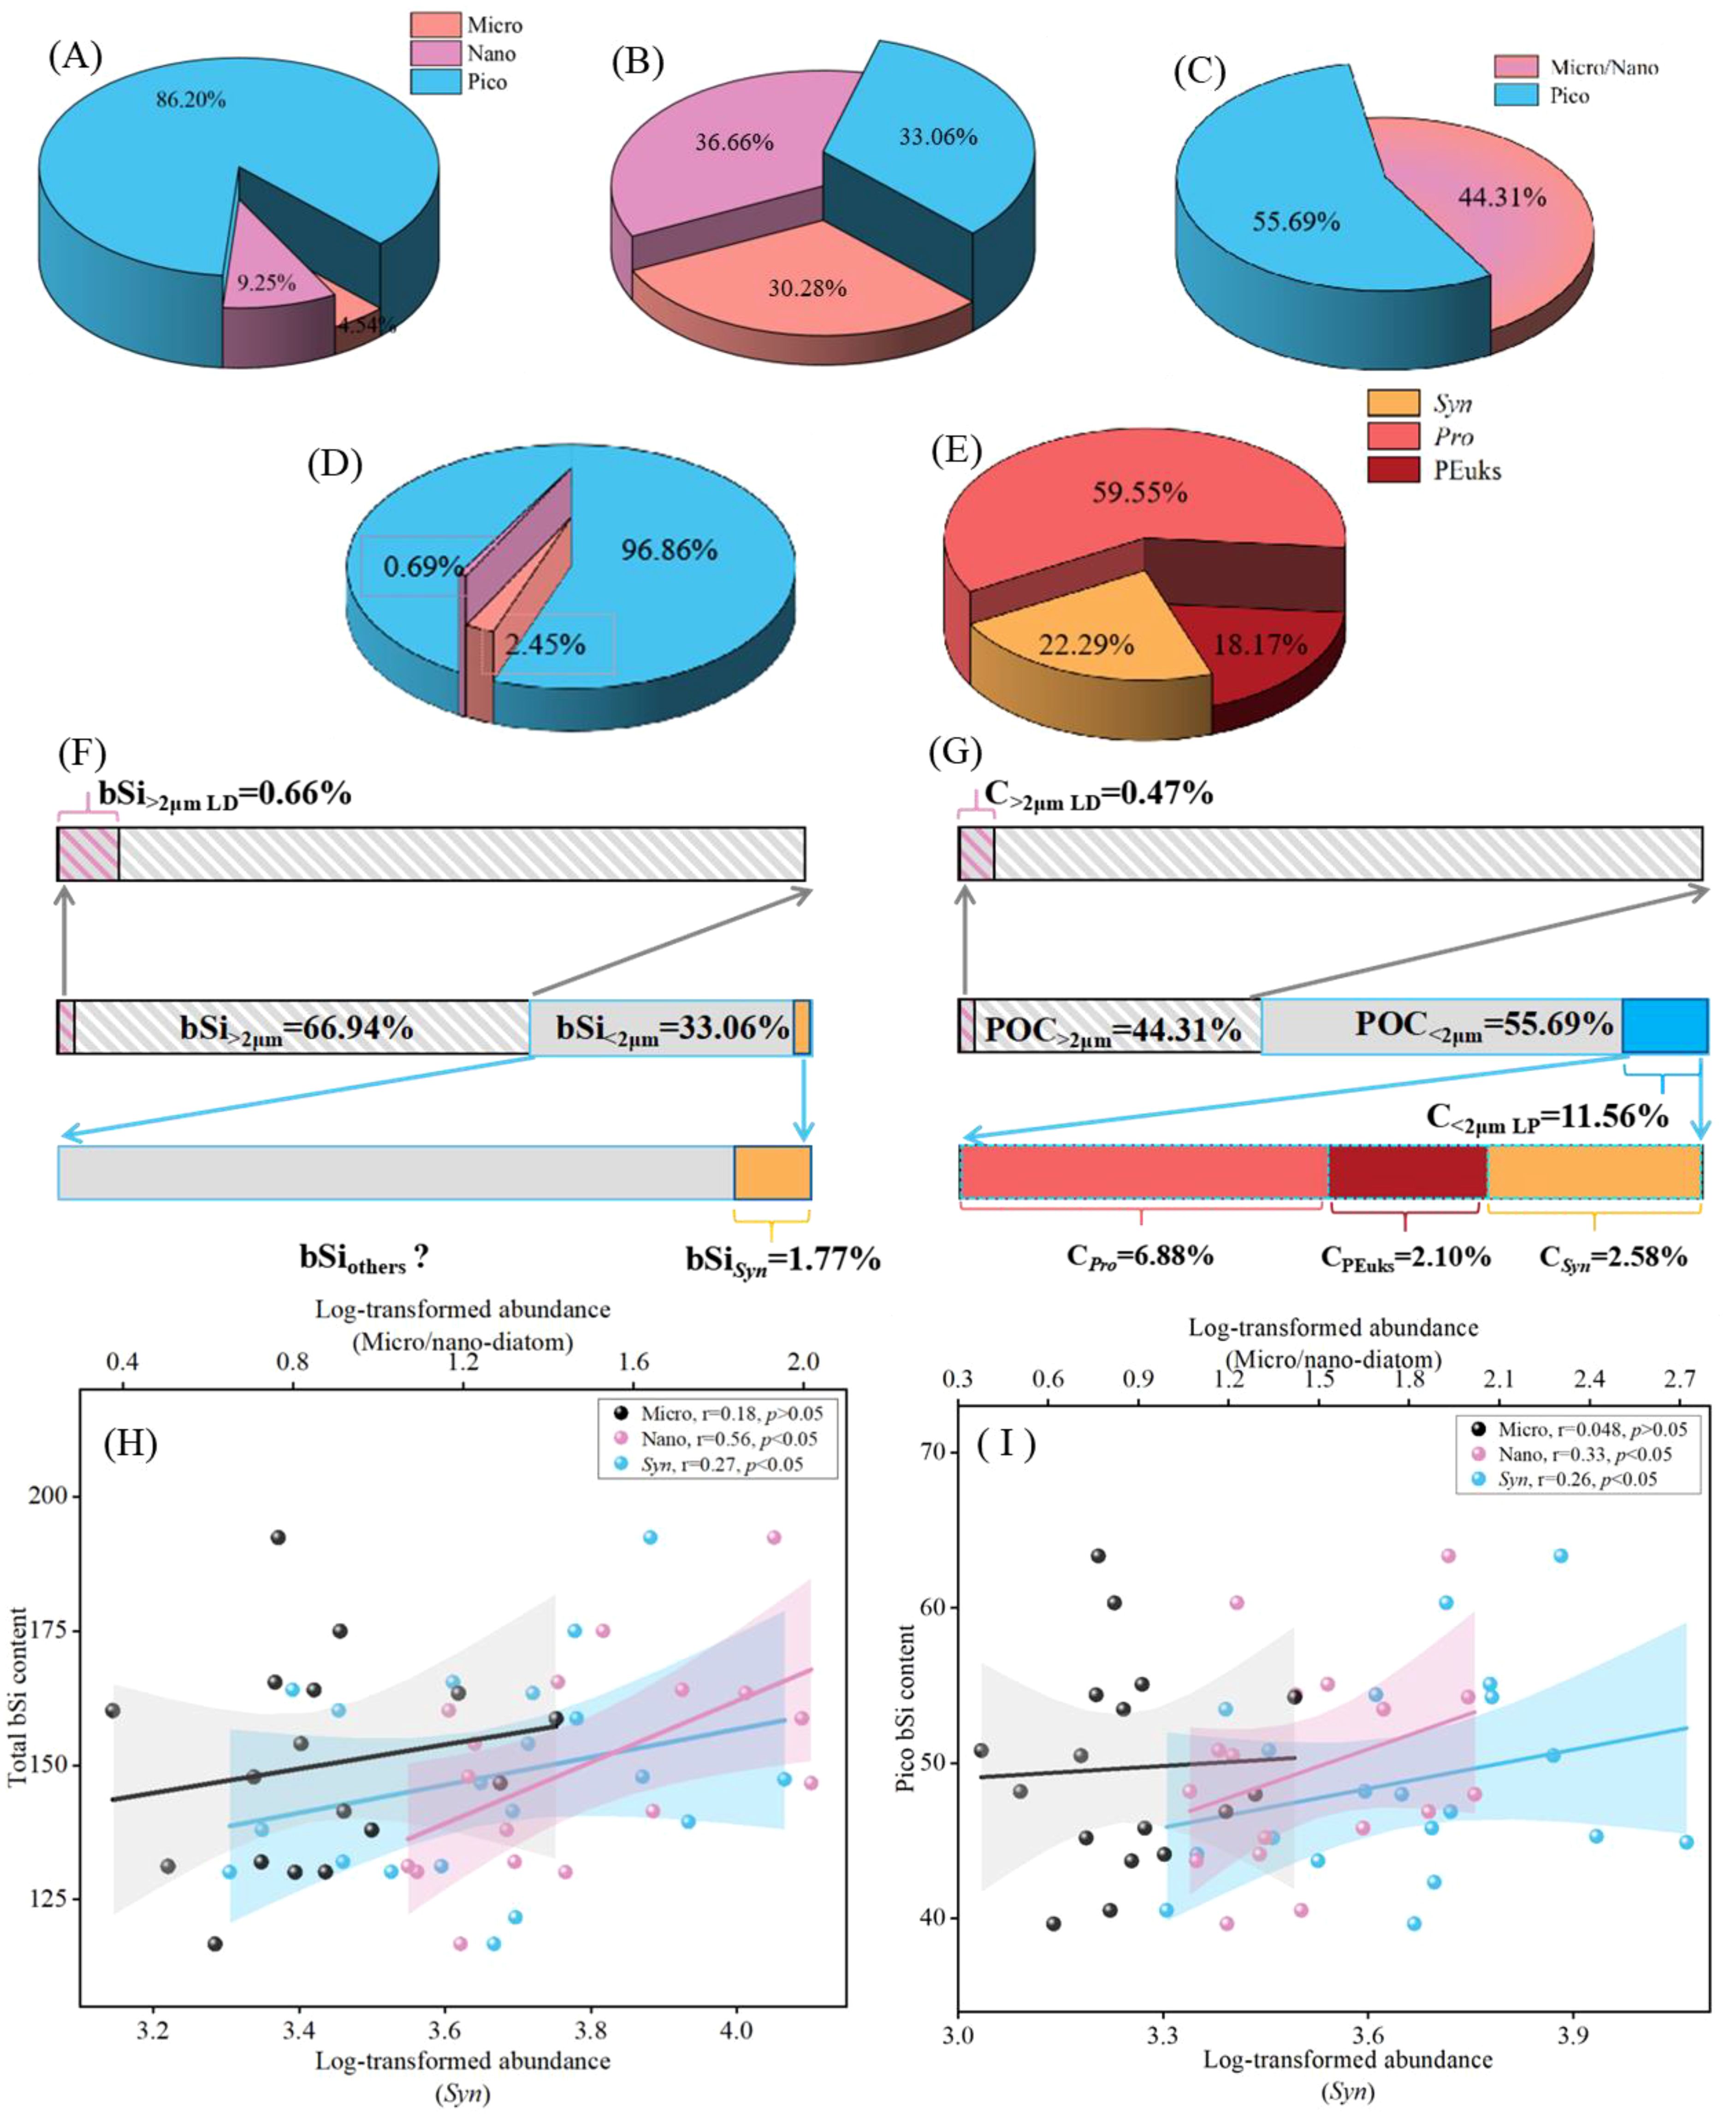
Figure 8. Contribution of the depth-weighted average size-fractioned biomass. (A) Chl-a; (B) bSi; (C) POC; (D) living carbon (Micro/Nano-diatoms and picophytoplankton); (E) living carbon (picophytoplankton); (F) percentage of bSi for Syn; (G) POC vs living carbon (LD, living diatom; LP, living picophytoplankton); (H) relationship between total bSi and phytoplankton abundance; (I) Pico-bSi and phytoplankton abundance. Colored line refers the least square regression. Corresponding colored shaded areas denote 95% confidence bands.
4 Discussion
4.1 Factors influencing the dynamics of phytoplankton communities
Diatoms with a unique requirement for silicon and the ubiquitous picophytoplankton are major contributors to carbon fixation in marine ecosystems; their prominent role in biogeochemical cycles is crucial for understanding future oceanic C and Si cycle behavior (Flombaum et al., 2013; Bopp et al., 2005). Various theories based on laboratory experiments and field studies have shown that phytoplankton dynamics can be modelled in terms of temperature, light, and nutrient etc (Flombaum et al., 2013; Dutkiewicz et al., 2015). Although knowledge about phytoplankton ecology is well developed, the key determinants of diatom and picophytoplankton abundance variability currently remain unclear in the C and Si cycle in the EIO. ABT analyses accurately quantify the relative impacts of each environmental variable on diatom and picophytoplankton abundance, further identifying the key determinants of the dynamic responses for diatom and picophytoplankton in the EIO, temperature and DSi (Figure 7). For diatom, the relative effect of temperature and DSi clearly exceeded other environmental parameters. Diatoms in the group B were more pronounced compared to group A and group C (Figure 6), which were more pronounced towards the euphotic depth, corresponding to a decreasing temperature gradient from the surface to the euphotic zone, suggesting that diatom assembly and their adaptive mechanisms shown a tendency for growth and survival in low temperatures (Mishra et al., 2017). Another potential reason for this variation was linked to nutrient. Diatoms exhibited a noticeable shift in their response to silicate concentration at 5 μmol/L, showing a preference for higher levels of silicate that promotes their survival (Figure 7). Previous studies have also indicated that the dominance of diatoms in phytoplankton communities was constrained when ambient silicate concentrations fall below 2 μmol/L (Egge and Aksnes, 1992).
For picophytoplankton, their abundance was significant correlated with temperature, and three peaks was occurred in the nonlinear pattern (Figure 7). This variation in thermal response is also related to species specific diversity, such as different ecotypes in picophytoplankton (Johnson et al., 2006; Callieri, 2017). Compared with Pro and PEuks, Syn was more plastic in the thermal adaption (Liu et al., 2021). Generally, temperatures in surface layer exceeding 28°C, coupled with intense solar ultraviolet radiation, inhibit the growth of Pro and PEuks. This is a good explanation for the high abundance of Syn in the surface (Figures 5, 6). Doubtless, depth is directly associated with light intensity and we noted that the relative effect of depth on the picophytoplankton abundance was 30.93%. This observation was further illustrated the existence of different peaks in picophytoplankton abundance in response to temperature. When the optimum temperature for phytoplankton growth is exceeded, heightened membrane fluidity and accelerated degradation rates of proteins and enzymes exert pressure on algal cells (Raven and Geider, 1988; Staehr and Sand-Jensen, 2006). In addition, the correlation and GAM analysis showed the fact that picophytoplankton negatively correlated with DSi at a concentration < 10 μmol/L, suggesting that diatoms are more sensitive to silicate compared to picophytoplankton. Picophytoplankton were more prevalent in nutrient-depleted waters, likely due to their higher surface-volume ratio, enhancing nutrient absorption capabilities (Chisholm, 1992; Wei et al., 2022).
4.2 Contributions of picophytoplankton to C and bSi stocks
Diatoms have been long recognized as the primary organisms responsible for the export of bSi in the ocean (Brzezinski et al., 2011). However, doubts arose with the discovery of measurable silicon in picophytoplankton, and the doubt was whether diatoms maintain a predominant role in the global silica cycle (Tang et al., 2014). Compared with diatoms, picophytoplankton have higher surface-volume ratio, which can provide a competitive advantage in nutrient uptake in oligotrophic ocean (Partensky et al., 1999). A good indication of the fact that <2 μm fraction has a large proportion of the Chl a and POC content (Figures 8A, C). In recent years, the contribution of picophytoplankton to bSi stocks has been recognized, and the variation of size fractionated bSi stocks has been preliminary observed in few stations in oligotrophic oceans (Ohnemus et al., 2016; Wei et al., 2021b). However, the contribution of living cells of diatoms and picophytoplankton is ambiguous in the comparison of bSi and carbon stocks. Therefore, given this dearth of information, we distinguished the contribution of living cells of diatoms and picophytoplankton (Figures 8F, G).
A basic knowledge is that diatoms have relatively low carbon biomass in nutrient-poor waters, but the measured bSi stocks are disproportionate to carbon. In this study, the contribution of living diatom carbon was 0.47% and the living silicon quota was 0.66%. In correspondence, the contribution of living Syn carbon was 2.58%, with the living silicon quota contribution of Syn being 1.77% (Figures 8F, G). It demonstrated that diatoms, as a strongly silicified organism, still contribute a relatively high bSi stocks despite its low abundance in nutrient-poor waters and this reflects the obligatory for silicon by diatoms (Krause et al., 2018). The relationship between diatom abundance and size-fracionated bSi stocks was well a good illustration of the importance of diatom silica stocks (Figures 8H, I). The difference in contributions suggested that living Syn makes a small but sustainable contribution towards the bSi stocks in the EIO, which was consistent with previous study (1.2%-12.3% in WPO) (Wei et al., 2021a). Obviously, silicification of Syn provides an additional pathway for silicon uptake that is not governed by diatoms. Similarly, concepts have been suggested by Ohnemus (Ohnemus et al., 2016). Syn biomass would be much larger than that of diatoms if the interactions between Si and C cycle in the oligotrophic oceans could be accurately modelled. Picophytoplankton can be transported to the deep sea by sinking particles, and once intracellular silicon accumulation is quantified, it will likely provide an additional explanation or pathway for the transport of silicon particulate matter to the deep sea (Richardson and Jackson, 2007; Lomas et al., 2010; Deng et al., 2015; Guidi et al., 2016). We observed little variability in the relationship between Syn and size-fractionated bSi stocks, suggesting that Syn may have a robust contribution to bSi stocks based on its high abundance in the oligotrophic oceans (Figures 8H, I). Besides, the contribution of cyanobacteria to the marine silicon cycle may be significantly greater if the decomposition process of Syn can produce bSi (Tang et al., 2014). Based on this theory, the contribution of bSi in the size <2 μm fraction is also provided by other types of biotic or abiotic particles in addition to Syn. It gives a possibility that Pro and PEuks would be considered as a candidate group for silica accumulation. As expected, more recently evidences were found that PEuks have a biological requirement for silicon. The diameter size <3 μm PEuks (such as Triparma laevis) can absorb DSi to build silica shields around cells (Booth and Marchant, 1987; Kuwata et al., 2018; Yamada et al., 2014). Besides, the presence of diatom-like Si transporters in PEuks suggests a substantial contribution to the picophytoplankton bSi pool (Durak et al., 2016). Although there is no available evidence that Pro can accumulate silicon due to limitations in technology, we believe that Pro could be a candidate in the future investigations based on its phylogenetic similarity to Syn and importance in biogeochemical cycling (Krause et al., 2017; Wei et al., 2023).
4.3 What are the sources of non-living C and bSi stocks contributions?
In our study, the quota contributions of silicon and carbon to total biomass were low in living cells (diatoms and picophytoplankton), which is consistent with Wei’s findings in the EIO (Wei et al., 2021a). Some cases have been proposed where the detrital bSi accounts for 65-90% in total bSi pool (Leblanc et al., 2018b; Wei et al., 2021a). This suggests that living cells do not play a dominant role in oceanic silicon and carbon stocks. For example, data from Ohnemus et al. showed that the contribution of Syn to total bSi stocks in the North Atlantic was consistently less than 4%; and the contribution of Si quota in living Syn estimated by Baines et al. in the Pacific ranged from 2 to 11% (Baines et al., 2012; Ohnemus et al., 2016). The limited contribution of Syn implies the presence of a substantial detritus pool in the ocean, indicating that bSi stocks are not exclusively associated with living cells. Silicon quotas were detected in the extracellular polymers of Syn, suggesting that silicon can be deposited on extracellular organic matter (Tang et al., 2014). Similarly, if picophytoplankton candidates Pro and PEuks aggregate in a similar process to form EPS-Si, it would greatly emphasize the role of picophytoplankton in global C and Si cycling. Detrital phytoplankton can continue to accumulate bSi through abiotic processes and grazer pathways, which would greatly increase the contribution of picophytoplankton related bSi stocks. There is also high proportion of detrital POC that we observed, likely originating from other living microzooplankton, fecal pellets, organismal death and molts, and aggregation (Stukel et al., 2015). Although the source of the high proportion of debris has been discussed in open-ocean system, the detrital bSi cannot be quantified by alkaline digestion methods individually (Goering et al., 1973; Krause et al., 2010). On the whole, despite the large proportion of detritus, decomposing picophytoplankton in living cells still provided a significant contribution in bSi detritus.
5 Conclusions
In this study, we investigated the phytoplankton associated with the silica cycle from size fractions perspective, mainly including micro/nano-diatoms and picophytoplankton, and compared the spatial and vertical distributions and biomass contribution in the EIO. Apparently, picophytoplankton cell abundance was found to dominate in the EIO, at least four to seven orders of magnitude higher than diatoms. The results of ABT and GAM showed that temperature and DSi were reliable predictors of micro/nano-diatoms and picophytoplankton in the EIO. And there were distinct differences in response curves to key environmental determinants between diatoms and picophytoplankton. The importance of picophytoplankton in the carbon cycle in oligotrophic seas is adequately confirmed by our survey dataset. The contributions of Chl-a, POC and living carbon biomass of picophytoplankton were 86.20%, 55.69%, and 96.86%, respectively. Surprisingly, pico-bSi stocks (33.06%) was not a largest contributor to our survey area, with a lower contribution than that of nano-bSi (33.66%), but this still hardly shakes the importance of picophytoplankton to total bSi stocks. We found that the contribution of living carbon and silicon quota in diatom and picophytoplankton was modest, at 0.47%, 0.66% for diatoms, and 2.58% and 1.77% for Syn, respectively. It indicated that the carbon and silicon pools in the open ocean is composed most of detrital material rather than living cells. In response, diatoms have a higher capacity to accumulate bSi stocks than Syn, but the abundance of Syn will overwhelmingly accumulate more bSi stocks in oligotrophic seas. These findings will invigorate our exploration of biologically derived detritus and other organisms (e.g., Pro, PEuks) in silicon accumulation, and provide insights into biologically explaining the disproportionate carbon and silicon budgets in the oligotrophic ocean.
Data availability statement
The original contributions presented in the study are included in the article/supplementary material, further inquiries can be directed to the corresponding author.
Author contributions
XL: Data curation, Writing – original draft, Writing – review & editing. XZ: Writing – review & editing. SY: Writing – review & editing. WY: Writing – review & editing. YW: Writing – review & editing. JS: Conceptualization, Data curation, Formal analysis, Funding acquisition, Investigation, Methodology, Project administration, Resources, Software, Supervision, Validation, Visualization, Writing – review & editing. XW: Writing – review & editing, Funding acquisition.
Funding
The author(s) declare financial support was received for the research, authorship, and/or publication of this article. This work was supported by the National Natural Science Foundation of China grants (No. 41876134, 41676112 and 41276124), the Chang jiang Scholar Program of Chinese Ministry of Education (T2014253) to JS. The projects were supported by the "CUG Scholar" Scientific Research Funds at China University of Geosciences (Wuhan) to JS (Project No.2020087) and XW (Project No.2021248). Data and samples were collected onboard of R/ V Shiyan-6 implementing the open research cruise, NORC2022-10 and NORC2022-303 supported by NSFC Ship time Sharing Project (project number: 42149910).
Conflict of interest
The authors declare that the research was conducted in the absence of any commercial or financial relationships that could be construed as a potential conflict of interest.
Publisher’s note
All claims expressed in this article are solely those of the authors and do not necessarily represent those of their affiliated organizations, or those of the publisher, the editors and the reviewers. Any product that may be evaluated in this article, or claim that may be made by its manufacturer, is not guaranteed or endorsed by the publisher.
References
Baines S. B., Twining B. S., Brzezinski M. A., Krause J. W., Vogt S., Assael D., et al. (2012). Significant silicon accumulation by marine picocyanobacteria. Nat. Geosci. 5, 886. doi: 10.1038/ngeo1641
Booth B. C., Marchant H. J. (1987). Parmales, a new order of marine Chrysophytes with descriptions of three new genera and seven new species. J. Phycol. 23, 245–260. doi: 10.1111/j.1529-8817.1987.tb04132.x
Bopp L., Aumont O., Cadule P., Alvain S., Gehlen M. (2005). Response of diatoms distribution to global warming and potential implications: A global model study. Geophys. Res. Lett. 32, L19606. doi: 10.1029/2005GL023653
Brzezinski M. A., Krause J. W., Church M. J., Karl D. M., Li B., Jones J. L., et al. (2011). The annual silica cycle of the North Pacific subtropical gyre. Deep-Sea. Res. Part I. 58, 988–1001. doi: 10.1016/j.dsr.2011.08.001
Brzezinski M. A., Nelson D. M. (1986). A solvent extraction method for the colorimetric determination of nanomolar concentrations of silicic acid in seawater. Mar. Chem. 19, 139–151. doi: 10.1016/0304-4203(86)90045-9
Brzezinski M. A., Nelson D. M. (1995). The annual silica cycle in the Sargasso Sea near Bermuda. Deep. Sea. Res. Part I. 42, 0–1237. doi: 10.1016/0967-0637(95)93592-3
Buesseler K. O. (1998). The decoupling of production and particulate export in the surface as a tracer of upper ocean. Global Biogeochem. Cycles. 12, 297–310. doi: 10.1029/97GB03366
Callieri C. (2017). Synechococcus plasticity under environmental changes. FEMS Microbiol. Lett. 364, fnx229. doi: 10.1093/femsle/fnx229
Chen Z., Gu T., Sun J. (2023). Disentangling environmental effects on picophytoplankton communities in the Eastern Indian Ocean. Environ. Res. 225, 115635. doi: 10.1016/j.envres.2023.115635
Chisholm S. W., Olson R. J., Zettler E. R., Goericke R., Waterbury J. B., Welschmeyer N. A. (1988). A novel free-living prochlorophyte abundant in the oceanic euphotic zone. Nature 334, 340–343. doi: 10.1038/334340a0
Collos Y., Yin K., Harrison P. J. (1992). A note of caution on reduction conditions when using the cadmium-copper column for nitrate determinations in aquatic environments of varying salinities. Mar. Chem. 38, 325–329. doi: 10.1016/0304-4203(92)90040-H
Conley D. J., Kilham S. S., Theriot E. (1989). Differences in silica content between marine and freshwater diatoms. Limnol. Oceanog. 34, 205–212. doi: 10.4319/lo.1989.34.1.0205
De’Ath G. (2007). Boosted trees for ecological modeling and prediction. Ecology 88, 243–251. doi: 10.1890/0012-9658(2007)88[243:BTFEMA]2.0.CO;2
Deng W., Monks L., Neuer S. (2015). Effects of clay minerals on the aggregation and subsequent settling of marine Synechococcus. Limnol. Oceanogr. 60, 805–816. doi: 10.1002/lno.10059
Dixon P. (2003). VEGAN, a package of R functions for community ecology. J. Veg. Sci. 14, 927–930. doi: 10.1111/j.1654-1103.2003.tb02228.x
Durak G. M., Taylor A. R., Walker C. E., Probert I., de Vargas C., Audic S., et al. (2016). A role for diatom- like silicon transporters in calcifying coccolithophores. Nat Commun 7, 10543. doi: 10.1038/ncomms10543
Dutkiewicz S., Morris J., Follows M., Scott J., Levitan O., Dyhrman S., et al. (2015). Impact of ocean acidification on the structure of future phytoplankton communities. Nat. Clim. Change 5, 10002–11009. doi: 10.1038/nclimate2722
Egge J. K., Aksnes D. L. (1992). Silicate as regulating nutrient in phytoplankton competition. Mar. Ecol. Prog. Ser. 83, 281–289. doi: 10.3354/meps083281
Eppley R. W., Reid F. M. H., Strickland J. D. H. (1970). Estimates of phytoplankton crop size, growth rate, and primary production. Calif. Univ. Scripps. Inst. Oceanogr. Bull. 17, 33–42.
Flombaum P., Gallegos J. L., Gordillo R. A., Rincon J., Zabala L., Jiao N., et al. (2013). Present and future global distributions of the marine Cyanobacteria Prochlorococcus and Synechococcus. Proc. Natl. Acad. Sci. U.S.A. 110, 9824–9829. doi: 10.1073/pnas.1307701110
Goering J. J., Nelson D. M., Carter J. A. (1973). Silicic acid uptake by natural populations of marine phytoplankton. Deep-Sea. Res. 20, 777–789. doi: 10.1016/0011-7471(73)90001-6
Guidi L., Chaffron S., Bittner L., Eveillard D., Larhlimi A., Roux S., et al. (2016). Plankton networks driving carbon export in the oligotrophic ocean. Nature 532, 465–470. doi: 10.1038/nature16942
Jiao N., Yang Y., Hong N., Ma Y., Harada S., Koshikawa H., et al. (2005). Dynamics of autotrophic picoplankton and heterotrophic bacteria in the east China sea. Cont. Shelf. Res. 25, (10). doi: 10.1016/j.csr.2005.01.002
Johnson Z. I., Zinser E. R., Coe A., McNulty N. P., Woodward E. M. S., Chisholm S. W. (2006). Niche partitioning among Prochlorococcus ecotypes along ocean-scale environmental gradients. Science 311, 1737–1740. doi: 10.1126/science.1118052
Karl D. M., Tien G. (1992). MAGIC: A sensitive and precise method for measuring dissolved phosphorus in aquatic environments. Limnol. Oceanogr. 37, 105–116. doi: 10.4319/lo.1992.37.1.0105
Krause J. W., Brzezinski M. A., Baines S. B., Collier J. L., Twining B. S., Ohnemus D. C. (2017). Picoplankton contribution to biogenic silica stock and production rates in the sargasso sea. Global Biogeochem. Cycles. 31, (5). doi: 10.1002/2017GB005619
Krause J. W., Brzezinski M. A., Landry M. R., Baines S. B., Nelson D. M., Selph K. E., et al. (2010). The effects of biogenic silica detritus, zooplankton grazing, and diatom size structure on silicon cycling in the euphotic zone of the eastern equatorial Pacific. Limnol. Oceanogr. 55, 2608–2622. doi: 10.4319/lo.2010.55.6.2608
Krause J. W., Duarte C. M., Marquez I. A., Assmy P., Fernandez-Mendez M., Wiedmann I., et al. (2018). Biogenic silica production and diatom dynamics in the Svalbard region during spring. Biogeosci. Discuss. 15, 6503–6517. doi: 10.5194/bg-15-6503-2018
Krause J. W., Lomas M. W., Nelson D. M. (2009). Biogenic silica at the Bermuda Atlantic time-series study site in the sargasso sea: temporal changes and their inferred controls based on a 15-year record. Global Biogeochem. Cycles. 23, GB3004. doi: 10.1029/2008GB003236
Kuwata A., Yamada K., Ichinomiya M., Yoshikawa S., Tragin M., Vaulot D., et al. (2018). Bolidophyceae, a sister picoplanktonic group of diatoms: a review. Front. Mar. Sci. 5, 370. doi: 10.3389/fmars.2018.00370
Leblanc K., Cornet V., Rimmelin-Maury P., Grosso O., Helias-Nunige S., Brunet C., et al. (2018b). Silicon cycle in the tropical South Pacific: contribution to the global Si cycle and evidence for an active pico-sized siliceous plankton. Biogeosciences 15, 5595–5620. doi: 10.5194/bg-15-5595-2018
Leblanc K., Queguiner B., Diaz F., Cornet V., Michelrodriguez M., De Madron X. D., et al. (2018a). Nanoplanktonic diatoms are globally overlooked but play a role in spring blooms and carbon export. Nat. Commun. 9, 953. doi: 10.1038/s41467-018-03376-9
Legendre L., Le Fèvre J. (1995). Microbial food webs and the export of biogenic carbon in oceans. Aquat. Microb. Ecol. 9, 69–77. doi: 10.3354/ame009069
Liu J. T., Huang B. ,. Q., Chang Y., Du X. Q., Liu X., Yang R. J., et al. (2019). Three-dimensional coupling between size-fractionated chlorophyll-a, POC and physical processes in the Taiwan Strait in summer. Prog. Oceanogr. 176, 102129–. doi: 10.1016/j.pocean.2019.102129
Liu K., Suzuki K., Chen B., Liu H. (2021). Are temperature sensitivities of Prochlorococcus and Synechococcus impacted by nutrient availability in the subtropical northwest Pacific? Limnol. Oceanogr. 66, 639–651. doi: 10.1002/lno.11629
Lomas M. W., Steinberg D. K., Dickey T., Carlson C. A., Nelson N. B., Condon R. H., et al. (2010). Increased ocean carbon export in the Sargasso Sea linked to climate variability is countered by its enhanced mesopelagic attenuation. Biogeosciences 7, 57–70. doi: 10.5194/bg-7-57-2010
Martiny A. C., Pham C. T. A., Primeau F. W., Vrugt J. A., Moore J. K., Levin S. A., et al. (2013). Strong latitudinal patterns in the elemental ratios of marine plankton and organic matter. Nat. Geosci. 6, 279–283. doi: 10.1038/ngeo1757
McClanahan T. R., Maina J. M., Graham N. A. J., Jones K. R. (2016). Modeling reef fish biomass, recovery potential, and management priorities in the western Indian ocean. PloS One 11, e0154585. doi: 10.1371/journal.pone.0154585
Mishra R. K., Babula J., Anilkumar N. P., Ravidas Krishna N., Venkateswaran Bhaskar P., Melena S. A. (2017). Variability of chlorophyll- a and diatoms in the frontal ecosystem of Indian ocean sector of the southernocean. Pol. Polar. Res. 38, 375–392. doi: 10.1515/popore-2017-0014
Ohnemus D. C., Rauschenberg S., Krause J. W., Brzezinski M. A., Collier J. L., Geraci-Yee S., et al. (2016). Silicon content of individual cells of Synechococcus from the North Atlantic Ocean. Mar. Chem. 187, 16–24. doi: 10.1016/j.marchem.2016.10.003
Partensky F., Blanchot J., Vaulot D. (1999). Differential distribution and ecology of Prochlorococcus and Synechococcus in oceanic waters: A review. Bull. Inst. Oceanogr. 19, 457–475. doi: 10.1525/bio.2011.61.10.3
Raven J. A., Geider R. J. (1988). Temperature and algal growth. New Phytol. 110, 441–461. doi: 10.1111/j.1469-8137.1988.tb00282.x
Richardson T. L., Jackson G. A. (2007). Small phytoplankton and carbon export from the surface ocean. Science 315, 838–840. doi: 10.1126/science.1133471
Roberts K., Granum E., Leegood R. C., Raven J. A. (2007). Carbon acquisition by diatoms. Photosyn. Res. 93, 79–88. doi: 10.1007/s11120-007-9172-2
Staehr P. A., Sand-Jensen K. A. J. (2006). Seasonal changes in temperature and nutrient control of photosynthesis, respiration and growth of natural phytoplankton communities. Freshw. Biol. 51, 249–262. doi: 10.1111/j.1365-2427.2005.01490.x
Stukel M. R., Mislan K. A. S., Décima M., Hmelo L. (2015). Detritus in the pelagic ocean. Limnol. Oceanogr. 3, 49–76. doi: 10.4319/ecodas.2014.978-0-9845591-3-8.49
Sun J., Liu D. (2003). Geometric models for calculating cell biovolume and surface area for phytoplankton. J. Plankton. Res. 11, 1331–1346. doi: 10.1093/plankt/fbg096
Sun J., Liu D. Y., Feng S. Z. (2003). Preliminary study on marine phytoplankton sampling and analysis strategy for ecosystem dynamic research in coastal waters. Oceanol. Limnol. Sin. 34, 224–232. doi: 10.3321/j.issn:0029-814X.2003.02.014
Sun J., Liu D., Qian S. (1999). Study on phytoplankton biomass: phytoplankton measurement biomass from cell volume or plasma volume. Acta Oceanol. Sin. 21, 75–85.
Sun J., Liu D. Y., Qian S. B. (2002). A quantative research and analysis method for marine phytoplankton: an introduction to utermöhl method and its modification. J. Oceanogr. Huanghai. Bohai. Seas. 20, 105–112. doi: 10.3969/j.issn.1671-6647.2002.02.016
Tang T., Kisslinger K., Lee C. (2014). Silicate deposition during decomposition of cyanobacteria may promote export of picophytoplankton to the deep ocean. Nat. Commun. 5, 1–7. doi: 10.1038/ncomms5143
Tréguer P., Bowler C., Moriceau B., Dutkiewicz S., Gehlen M., Aumont O., et al. (2018). Influence of diatom diversity on the ocean biological carbon pump. Nat. Geosci. 11, 27–37. doi: 10.1038/s41561-017-0028-x
Tréguer P. J., Sutton J. N., Brzezinski M., Charette M. A., Devries T., Dutkiewicz S., et al. (2021). Reviews and syntheses: the biogeochemical cycle of silicon in the modern ocean. Biogeosciences 18, 1269–1289. doi: 10.5194/bg-18-1269-2021
Uitz J., Claustre H., Morel A., Hooker S. B. (2006). Vertical distribution of phytoplankton communities in open ocean: an assessment based on surface chlorophyll. J. Geophys. Res. Oceans. 111, 1–23. doi: 10.1029/2005JC003207
Visintini N., Martiny A. C., Flombaum P. (2021). Prochlorococcus, Synechococcus, and picoeukaryotic phytoplankton abundances in the global ocean. Limnol. Oceanogr. Lett. 6, 207–215. doi: 10.1002/lol2.10188
Waterbury J. B., Watson S. W., Guillard R., Brand L. E. (1979). Widespread occurrence of a unicellular, marine, planktonic, cyanobacterium. Nature 277, 293–294. doi: 10.1038/277293a0
Wei Y., Huang D., Zhang G., Zhao Y., Sun J. (2020). Biogeographic variations of picophytoplankton in three contrasting seas: the Bay of Bengal, South China Sea and Western Pacific Ocean. Aquat. Microb. Ecol. 84, 91–103. doi: 10.3354/ame01928
Wei Y., Qu K., Cui Z., Sun J. (2023). Picocyanobacteria–A non-negligible group for the export of biomineral silica to ocean depth. J. Environ. Manage. 342, 1–10. doi: 10.1016/j.jenvman.2023.118313
Wei Y., Sun J., Chen Z., Zhang Z., Zhang G., Liu X. (2021a). Significant contribution of picoplankton size fraction to biogenic silica standing stocks in the Western Pacific Ocean. Prog. Oceanogr. 192, 102516. doi: 10.1016/j.pocean.2021.102516
Wei Y., Sun J., Li L., Cui Z. (2022). Synechococcus silicon accumulation in oligotrophic oceans. Limnol. Oceanogr. 67, 552–566. doi: 10.1002/lno.12015
Wei Y., Sun J., Zhang X., Wang J., Huang K. (2019). Picophytoplankton size and biomass around equatorial eastern Indian Ocean. MicrobiologyOpen. 8, 1–11. doi: 10.1002/mbo3.629
Wei Y., Wang X., Gui J., Sun J. (2021b). Significant pico and nanoplankton contributions to biogenic silica standing stocks and production rates in the oligotrophic eastern Indian Ocean. Ecosystems 1, 1–16. doi: 10.1007/s10021-021-00608-w
Welschmeyer N. A. (1994). Fluorometric analysis of chlorophyll-a in the presence of chlorophyll b and pheopigments. Limnol. Oceanogr. 39, 1985–1992. doi: 10.4319/lo.1994.39.8.1985
Yamada K., Yoshikawa S., Ichinomiya M., Kuwata A., Kamiya M., Ohki K. (2014). Effects of silicon-limitation on growth and morphology of Triparma laevis NIES-2565 (Parmales, Heterokontophyta). PloS One 9, e103289. doi: 10.1371/journal.pone.0103289
Zhang D., Jian S., Sun J., Leng X., Zhang G. (2019). Spatial-temporal dynamics of biogenic silica in the southern Yellow Sea. Acta Oceanol. Sin. 38, 101–110. doi: 10.1007/s13131-019-1516-1
Keywords: diatoms, picophytoplankton, particulate organic carbon (POC), biogenic silica (bSi), size-fractions
Citation: Liu X, Zhao X, Sun J, Yue S, Yan W, Wen Y and Wu X (2024) Picophytoplankton is the main contributor to living carbon and biogenic silica stocks in the oligotrophic Eastern Indian Ocean. Front. Mar. Sci. 11:1449869. doi: 10.3389/fmars.2024.1449869
Received: 16 June 2024; Accepted: 15 August 2024;
Published: 04 September 2024.
Edited by:
Guangchao Zhuang, Ocean University of China, ChinaCopyright © 2024 Liu, Zhao, Sun, Yue, Yan, Wen and Wu. This is an open-access article distributed under the terms of the Creative Commons Attribution License (CC BY). The use, distribution or reproduction in other forums is permitted, provided the original author(s) and the copyright owner(s) are credited and that the original publication in this journal is cited, in accordance with accepted academic practice. No use, distribution or reproduction is permitted which does not comply with these terms.
*Correspondence: Xi Wu, d3V4aTEyMDFAY3VnLmVkdS5jbg==