 Paul McElhany
 D. Shallin Busch
94% of researchers rate our articles as excellent or good
Learn more about the work of our research integrity team to safeguard the quality of each article we publish.
Find out more
BRIEF RESEARCH REPORT article
Front. Mar. Sci., 15 November 2024
Sec. Global Change and the Future Ocean
Volume 11 - 2024 | https://doi.org/10.3389/fmars.2024.1449345
A published analysis of ocean acidification thresholds for decapod crustaceans highlights data showing the negative effects of low pH on many species. However, the methods used in the paper have substantial flaws that call into question the proposed thresholds. The quantitative metrics calculated for the meta-analysis are uninformative with respect to pH sensitivity, which raises concerns about the validity of the thresholds developed by the expert opinion process. We recommend against using the published thresholds and for a reanalysis of the data to identify new thresholds.
Identifying thresholds of biological response to environmental stressors can provide valuable information for marine resource managers (Heinze et al., 2021). In the field of ocean acidification (OA), meta-analysis of species pH exposure experiments have been used to develop thresholds or relative risk metrics for multiple taxa (Bednaršek et al., 2019; Bednaršek et al., 2021b; Hancock et al., 2020; Cornwall et al., 2022). Decapod crustaceans are an important ecological and economic component of marine ecosystems, and species in this group are potentially vulnerable to OA. Using quantitative analysis based on published data from species pH exposure experiments and expert opinion, Bednaršek et al. (2021a) developed pH exposure thresholds for a number of biological responses of decapods. The Bednaršek et al. (2021a) thresholds have been used in other analyses to characterize potential risk of decapod species to OA (Alin et al., 2023; Alin et al., 2024; Hamilton et al., 2023; Zeldis et al., 2022; Siegel et al., 2022). Although there is no doubt that many decapod species are sensitive to elevated CO2 and exhibit thresholds in their sensitivity, the quantitative analysis in Bednaršek et al. (2021a), which informs the expert opinion, has several methodological issues which raise questions about the utility of the recommended thresholds. This brief research report describes the methodological issues and discusses the implications for our current understanding of pH thresholds for decapods. It does not recommend a specific pathway for re-evaluation of the data, but does provide some relevant references that could guide a re-evaluation.
We evaluated the methods used to derive the two quantitative metrics presented in Bednaršek et al. (2021a) for threshold development (least squares regression and piecewise regression). We then compared their quantitative values to the final threshold recommendations to better understand how much the quantitative metric values likely influenced the expert opinion based results.
The LSR threshold is defined by Bednaršek et al. (2021a) as:
“…the data were fitted to least squares regression (LSR). When the LSR was significant (p value < 0.05), a threshold value was calculated as pH at which the response variable had decreased by 25% of the difference between the highest and lowest pH treatment in the dataset. The significance of this 25% decline is to determine in a systematic fashion where the response parameter substantially differed from the control value.”
This metric is fundamentally flawed as a method for establishing OA sensitivity thresholds. The metric has no relationship to pH sensitivity – it is purely a function of the range of pH values used in the experiments that are part of the meta-data set. Because the model is a linear relationship, a 25% decline in the range of the fitted response corresponds to a 25% decline in the range of experimental pH. A metric based only on experimental pH range was calculated as:
Where pH75 is 75% of the way between the minimum and maximum experimental pH values from all of the studies used for a particular response analysis. As an example, the Bednaršek et al. (2021a) Supplementary Figure S2 shows the data that contributed to the LSR threshold for decapod hatching success. The lowest pH tested (pHmin) was 7.18 in an experiment from Miller et al. (2016) and the highest pH tested (pHmax) was 8.03 in an experiment from Swiney et al. (2016). The pH75 based on these pHmin and pHmax values is 7.82, which is the same as the LSR value for hatching success reported in Bednaršek et al. (2021a; Table 1). The range of values in the literature that researchers have used for experiments is not a useful metric for setting response thresholds as it has no inherent relationship to the sensitivity of organisms to pH.

Table 1. Table comparing pH75 and LSR values for each of the response metrics assessed in Bednaršek et al. (2021a).
A second metric used to develop the thresholds was a piecewise regression of biological response vs. pH that was fit with the R package “segmented” using fitting methods described in Muggeo (2017). Conceptually, the fitted breakpoint in a linear segmented model could provide threshold information as it could indicate a value where biological response to pH changes abruptly. However, as implemented in Bednaršek et al. (2021a), the analysis is uninformative. The regression fit was based on pooling all data points from all the studies, and treating each point as an independent value, thus implicitly giving more weight to studies that have larger sample sizes. In a meta-analysis, studies are usually weighted by the inverse of the study variance estimate (Viechtbauer, 2010; Cuijpers, 2016). By treating each of the data points as independent values, the studies were given essentially arbitrary weights based on the number of pH levels or biological response levels selected by the experimenter. Treating all the data for each study as independent also inflates the sample size, making it more likely to incorrectly claim statistical significance. This issue was particularly acute for the survival analyses. For some studies, the survival response used in the model was a single point for each pH value – the fraction of individuals surviving at the end of the experiment. For other studies, a data point was included for every time step in a survival curve at each pH value. For example, in the analysis of juvenile survival, the Agnalt et al. (2013) study on European lobster is represented by three data points on end-point survival while the Long et al. (2013) study on red king crab is represented by over 300 data points from the daily time step survival curves (see Bednaršek et al. (2021a) Figure 4). The Long et al. (2013) study does not contain 100 times as much information on pH thresholds as the Agnalt et al. (2013) study – the skewed weighting is an artifact of inappropriately treating the data.
The response families used for the quantitative metrics in the Bednaršek et al. (2021a) study are inappropriate for some datasets because the models are not well suited to the data being examined. As examples, Bednaršek et al. (2021a) fit piecewise regression models to hatching success (Supplementary Figure S2) and survival (Supplementary Figures S7-S12). In both cases, probability is treated as a response, with a normal (Gaussian) error distribution assumed. An entire class of models (logistic regression, a binomial response with a logit link) has been developed for modeling probabilities; using these approaches would have been the best treatment of the data (Viechtbauer, 2010). Assuming a normal response, as Bednaršek et al. (2021a) did, is especially problematic at low or high probability values, where standard errors may be less than zero or greater than one.
The final thresholds presented in Bednaršek et al. (2021a) are the result of an expert opinion process in which a group of scientists combined a consideration of the quantitative analysis described above, their own expertise in some aspect of decapod OA sensitivity and open discussion to reach consensus threshold values. With this process, it is not possible to know exactly how much the flawed quantitative analyses influenced the final thresholds. However, it is possible to get some idea of their contribution by comparing the final thresholds to the quantitative analysis results (Table 2) and by reviewing the discussion text in the paper. The expert threshold is identical to one of the quantitative estimates for four of the response metrics (adult respiration, adult search time, long-term juvenile survival and long-term adult survival) and the expert threshold appears to be a small rounding adjustment of one of the quantitative measures for three of the thresholds (hatching, short-term larval survival, and medium-term adult survival). Thus, half of the expert threshold values appear to match one of the quantitative estimates. The range of pH thresholds in Bednaršek et al. (2021a) that match a quantitative metric is 7.4 - 7.8 and the range that do not match a metric is 7.52 - 7.75. In several places in the text, it is explicitly stated that a threshold was based on one of the quantitative metrics, for example, with regard to hatching success: “Considering the two findings where significant effects were observed, the expert panel unanimously set the threshold for hatching success at pH 7.82, based largely on an LSR of 7.82” and with regard to respiration: “This observation was supported by an LSR- derived threshold of 7.77 (p <0.0001, R2 = 0.17).” However, in some cases (adult and juvenile growth), it was explicitly stated that the quantitative analyses were ignored, for example: “The final adult and juvenile threshold identified was unanimously set at 7.75 for 105 days (Table 2), based on significant experimental effects in individual studies rather than statistical threshold analyses.”
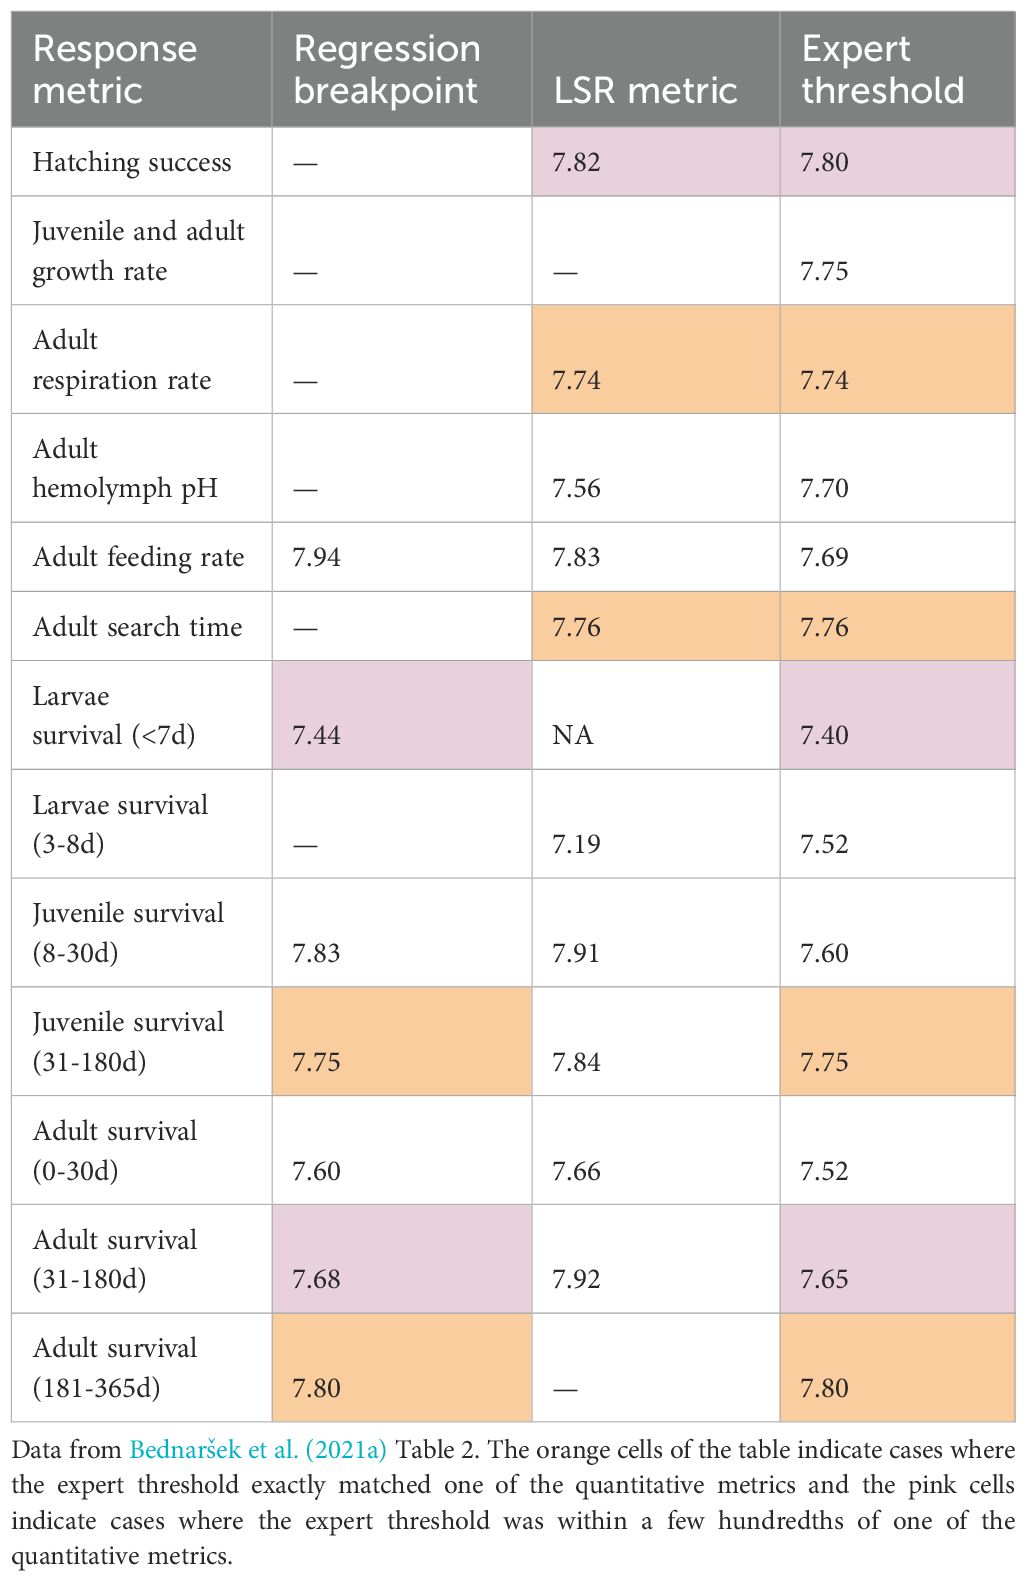
Table 2. Comparison of the quantitative metrics and expert pH thresholds for decapods.
The development of quantitative metrics combining the results from multiple studies should rely on standard meta-analysis techniques that use estimates of effect size to provide a valid unit of comparison Kroeker et al., 2010. The quantitative measures in Bednaršek et al. (2021a) are uninformative with regard to the question they attempt to answer. Although the final thresholds were established by expert consensus, the process was confounded by the fact that the information provided to the expert panel was not an accurate synthesis of the available literature. We suggest that further work is needed to identify OA thresholds for decapods. As such, we recommend that the thresholds presented in Bednaršek et al. (2021a) not be used in studies evaluating OA risks or for establishing management goals for decapods, and suggest re-evaluation of the published works based on them. Any reconsideration of decapod sensitivity to OA should apply appropriate methods tailored to the available data as described in the established statistical literature on meta-analysis (e.g., Borenstein et al., 2021; Harrer et al., 2021).
This critique has focused on specific methodological issues in Bednaršek et al. (2021a) and not on broader questions about OA thresholds, which are key to address when presenting thresholds so that they are used appropriately. For example, presentation of a generic global decapod threshold created by pooling across all species and locations would likely require nuanced discussion to guide readers away from making mistakes in its application. Given the general variability in pH sensitivity at the species and/or population level, the range in local baseline pH conditions, the importance of variability in pH on species response, and the importance of co-stressors like temperature or food availability (Kroeker et al., 2013; Vargas et al., 2017, 2022), we believe that a generic, global-level threshold may not be particularly predictive of OA risk to a focal species of interest or of the vulnerability of biota in a particular region. Although generic thresholds are a useful means of summarizing the literature and provide some information when comparing high-level taxonomic groups, it is important to be explicit about their limitations, especially when thresholds may be considered in a management or regulatory context.
Publicly available datasets were analyzed in this study. The data are available in the published paper: Bednarsek, Nina, Richard Ambrose, Piero Calosi, Richard K. Childers, Richard A. Feely, Steven Y. Litvin, W. Christopher Long, et al. “Synthesis of Thresholds of Ocean Acidification Impacts on Decapods.” Frontiers in Marine Science 8 (2021): 1542. https://doi.org/10.3389/fmars.2021.651102.
PM: Conceptualization, Formal analysis, Investigation, Methodology, Writing – original draft, Writing – review & editing. DB: Conceptualization, Investigation, Methodology, Writing – original draft, Writing – review & editing.
The author(s) declare financial support was received for the research, authorship, and/or publication of this article. The authors were supported by the NOAA Ocean Acidification Program and the NOAA Northwest Fisheries Science Center for the research and publication of this article.
The authors declare that the research was conducted in the absence of any commercial or financial relationships that could be construed as a potential conflict of interest.
The author(s) declared that they were an editorial board member of Frontiers, at the time of submission. This had no impact on the peer review process and the final decision.
All claims expressed in this article are solely those of the authors and do not necessarily represent those of their affiliated organizations, or those of the publisher, the editors and the reviewers. Any product that may be evaluated in this article, or claim that may be made by its manufacturer, is not guaranteed or endorsed by the publisher.
Agnalt A.-L., Grefsrud E. S., Farestveit E., Larsen M., Keulder F. (2013). Deformities in larvae and juvenile European lobster (Homarus gammarus) exposed to lower pH at two different temperatures. Biogeosciences 10, 7883–7895. doi: 10.5194/bg-10-7883-2013
Alin S. R., Newton J. A., Feely R. A., Siedlecki S., Greeley D. (2024). Seasonality and response of ocean acidification and hypoxia to major environmental anomalies in the southern Salish Sea, North America, (2014–2018). Biogeosciences 21, 1639–1673. doi: 10.5194/bg-21-1639-2024
Alin S., Siedlecki S., Berger H., Feely R., Waddell J., Carter B., et al. (2023). Evaluating the evolving ocean acidification risk to Dungeness crab: time-series observations and modeling on the Olympic Coast, Washington, USA. Oceanog. 36, 138–147 doi: 10.5670/oceanog.2023.216
Bednaršek N., Ambrose R., Calosi P., Childers R. K., Feely R. A., Litvin S. Y., et al. (2021a). Synthesis of thresholds of ocean acidification ion decapods. Front. Mar. Sci. 8. doi: 10.3389/fmars.2021.651102
Bednaršek N., Calosi P., Feely R. A., Ambrose R., Byrne M., Chan K. Y. K., et al. (2021b). Synthesis of thresholds of ocean acidification impacts on echinoderms. Front. Mar. Sci. 8. doi: 10.3389/fmars.2021.602601
Bednaršek N., Feely R. A., Howes E. L., Hunt B. P. V., Kessouri F., León P., et al. (2019).Systematic review and meta-analysis toward synthesis of thresholds of ocean acidification impacts on calcifying pteropods and interactions with warming. Available online at: https://www.frontiersin.org/article/10.3389/fmars.2019.00227 (Accessed May 3, 2022).
Borenstein M., Hedges L. V., Higgins J. P. T., Rothstein H. R. (2021). Introduction to Meta-Analysis. United Kingdom: John Wiley & Sons Ltd. doi: 10.1002/9780470743386
Cornwall C. E., Harvey B. P., Comeau S., Cornwall D. L., Hall-Spencer J. M., Peña V., et al. (2022). Understanding coralline algal responses to ocean acidification: Meta-analysis and synthesis. Global Change Biol. 28, 362–374. doi: 10.1111/gcb.15899
Cuijpers P. (2016). Meta-analyses in mental health research: A practical guide (Amsterdam, The Netherlands: Vrije Universiteit Amsterdam).
Hamilton S. L., Kennedy E. G., Zulian M., Hill T. M., Gaylord B., Sanford E., et al. (2023). Variable exposure to multiple climate stressors across the California marine protected area network and policy implications. ICES J. Mar. Sci. 80, 1923–1935. doi: 10.1093/icesjms/fsad120
Hancock A. M., King C. K., Stark J. S., McMinn A., Davidson A. T. (2020). Effects of ocean acidification on Antarctic marine organisms: A meta-analysis. Ecol. Evol. 10, 4495–4514. doi: 10.1002/ece3.6205
Harrer M., Cuijpers P., Furukawa T., Ebert D. (2021). Doing Meta-Analysis with R: A Hands-On Guide. 1st ed (New York: Chapman and Hall/CRC). doi: 10.1201/9781003107347
Heinze C., Blenckner T., Martins H., Rusiecka D., Döscher R., Gehlen M., et al. (2021). The quiet crossing of ocean tipping points. Proc. Natl. Acad. Sci. 118, e2008478118. doi: 10.1073/pnas.2008478118
Kroeker K. J., Kordas R. L., Crim R., Hendriks I. E., Ramajo L., Singh G. S., et al. (2013). Impacts of ocean acidification on marine organisms: quantifying sensitivities and interaction with warming. Global Change Biol. 19, 1884–1896. doi: 10.1111/gcb.12179
Kroeker K. J., Kordas R. L., Crim R. N., Singh G. G. (2010). Meta-analysis reveals negative yet variable effects of ocean acidification on marine organisms. Ecol. Lett. 13, 1419–1434. doi: 10.1111/j.1461-0248.2010.01518.x
Long W. C., Swiney K. M., Harris C., Page H. N., Foy R. J. (2013). Effects of ocean acidification on juvenile red king crab (Paralithodes camtschaticus) and Tanner crab (Chionoecetes bairdi) growth, condition, calcification, and survival. PloS One 8, e60959. doi: 10.1371/journal.pone.0060959
Miller J. J., Maher M., Bohaboy E., Friedman C. S., McElhany P. (2016). Exposure to low pH reduces survival and delays development in early life stages of Dungeness crab (Cancer magister). Mar. Biol. 163, 118. doi: 10.1007/s00227-016-2883-1
Muggeo V. M. R. (2017). Interval estimation for the breakpoint in segmented regression: a smoothed score-based approach. Aust. New Z. J. Stat 59, 311–322. doi: 10.1111/anzs.12200
Pick J. L., Nakagawa S., Noble D. W. A. (2019). Reproducible, flexible and high-throughput data extraction from primary literature: The metaDigitise r package. Methods Ecol. Evol. 10, 426–431. doi: 10.1111/2041-210X.13118
Siegel K. R., Kaur M., Grigal A. C., Metzler R. A., Dickinson G. H. (2022). Meta-analysis suggests negative, but pCO2-specific, effects of ocean acidification on the structural and functional properties of crustacean biomaterials. Ecol. Evol. 12, e8922. doi: 10.1002/ece3.8922
Swiney K. M., Long W. C., Foy R. J. (2016). Effects of high pCO2 on Tanner crab reproduction and early life history—Part I: long-term exposure reduces hatching success and female calcification, and alters embryonic development. ICES J. Mar. Sci. 73, 825–835. doi: 10.1093/icesjms/fsv201
Vargas C. A., Cuevas L. A., Broitman B. R., San Martin V. A., Lagos N. A., Gaitán-Espitia J. D., et al. (2022). Upper environmental pCO2 drives sensitivity to ocean acidification in marine invertebrates. Nat. Clim. Change 12, 200–207. doi: 10.1038/s41558-021-01269-2
Vargas C. A., Lagos N. A., Lardies M. A., Duarte C., Manríquez P. H., Aguilera V. M., et al. (2017). Species-specific responses to ocean acidification should account for local adaptation and adaptive plasticity. Nat. Ecol. Evol. 1, 84. doi: 10.1038/s41559-017-0084
Viechtbauer W. (2010). Conducting meta-analyses in R with the metafor package. J. Stat. Softw. 36, 1–48. doi: 10.18637/jss.v036.i03
Keywords: decapod, ocean acidification, thresholds, meta-analysis, ocean change
Citation: McElhany P and Busch DS (2024) Ocean acidification thresholds for decapods are unresolved. Front. Mar. Sci. 11:1449345. doi: 10.3389/fmars.2024.1449345
Received: 14 June 2024; Accepted: 21 October 2024;
Published: 15 November 2024.
Edited by:
Iris Eline Hendriks, Spanish National Research Council (CSIC), SpainReviewed by:
Sam Dupont, University of Gothenburg, SwedenCopyright © 2024 McElhany and Busch. This is an open-access article distributed under the terms of the Creative Commons Attribution License (CC BY). The use, distribution or reproduction in other forums is permitted, provided the original author(s) and the copyright owner(s) are credited and that the original publication in this journal is cited, in accordance with accepted academic practice. No use, distribution or reproduction is permitted which does not comply with these terms.
*Correspondence: Paul McElhany, cGF1bC5tY2VsaGFueUBub2FhLmdvdg==
Disclaimer: All claims expressed in this article are solely those of the authors and do not necessarily represent those of their affiliated organizations, or those of the publisher, the editors and the reviewers. Any product that may be evaluated in this article or claim that may be made by its manufacturer is not guaranteed or endorsed by the publisher.
Research integrity at Frontiers
Learn more about the work of our research integrity team to safeguard the quality of each article we publish.