 Peijie Shi
 Wankang Yang1,2,3*
- 1Second Institute of Oceanography, Ministry of Natural Resources (MNR), Hangzhou, China
- 2Key Laboratory of Ocean Space Resource Management Technology, Ministry of Natural Resources (MNR), Hangzhou, China
- 3Key Laboratory of Nearshore Engineering Environment and Ecological Security of Zhejiang Province, Hangzhou, China
Sanmen Bay (SMB) is one of the important harbors in Zhejiang Province. It is a semi-enclosed shallow bay that has undergone large-scale land reclamation activities. Long-term reclamation has changed the hydrodynamic conditions of SMB, such as tide, residual current, tidal prism, water exchange capacity, and tidal asymmetry. In this study, three typical periods of numerical models, based on historical charts and remote sensing, were established to investigate the influence of reclamation activities on the hydrodynamic conditions of SMB from 1971 to 2020. These model results reveal that the amplitude and phase of M2, the main tidal components in SMB, decreased by ~0.1–0.3 m and ~ 5°–15°, respectively, over the last half-century. Additionally, under the influence of ~200 km2 reclamation, many hydrodynamic conditions in SMB also changed. This includes the reduction of a residual current and tidal prism, an increase in residence time, and a change in tidal asymmetry characteristics. The residence time in nearby Xiayangtu exhibited a downward trend from 2003 to 2020, because land reclamation squeezed, and thus, enhanced the residual current eddy. The water-exchange capacity of the bay became weaker with the reduction of tidal prism to one-third and an increase in residence time. The tidal asymmetry characteristic of SMB changed from half of flood dominant to fully flood dominant by the influence of shoreline and bathymetry, which raised the flood risk. Research on the response of the hydrodynamic environment to reclamation activities in SMB reminds the local government to reassess the impact of land reclamation on the hydrodynamic environment.
1 Introduction
The coastal zone, which is situated at the interface of water and land, harbors approximately half of the global population and economy. Reclamation projects have been implemented by numerous countries worldwide to mitigate the scarcity of land resources that results from rapid economic development (Sengupta et al., 2023). Bays, as an important part of the coastal zone, confront urgent environmental challenges that arise from land reclamation projects.
Reclamation can weaken tidal dynamics by reducing tidal amplitude (Yanagi and Onishi, 1999) and tidal velocity (Manda and Matsuoka, 2006; Wisha et al., 2018). In some bays, like Lingding Bay, reclamation activities increase the amplitude of tides, and thus, increase the risk of flooding (Zhang et al., 2010; Chu et al., 2022). Changes in shoreline and depth caused by reclamation projects influence the ability of bay water exchange with the open sea, for instance, tidal prism (Shi et al., 2011; Lyu et al., 2021) and residence time (Xu et al., 2021). The reduction in water exchange capacity has detrimental effects on pollutant dispersion and fisheries in bays. Reclamation indirectly affects tidal asymmetry (Gao et al., 2014; Li et al., 2018), which plays a vital role in sediment transport that determines the navigation function of the bay.
Sanmen Bay (SMB), located in eastern China, is one of three major bays in Zhejiang Province. Surrounded by hills on three sides, SMB is a semi-closed tongue-like bay with the direction generally NW-SE in the plane, and the bay mouth is towards the southeast. And there are more than 100 islands in the bay. SMB is a bay with strong tide, the average tidal range exceeding 4 m. Additionally, the value of is less than 0.4, indicating that the semi-diurnal component is dominant (Song et al., 2017). Under the influence of land reclamation, artificial shoreline became the most important type of shoreline, followed by bedrock shoreline. The multi-islands, irregular coastlines resulted in extremely complex hydrodynamic conditions in SMB. The land reclamation around SMB started in the last century and peaked in the 1970s and early 2000s (Lin et al., 2021). Figure 1 presents the distribution of SMB reclamation projects from 1971 to 2020. By 2003, approximately 100 km2 of land was reclaimed from the sea, of which Hucheng Port was the main reclamation. Consequently, an about 95 km2 of land was reclaimed by 2020, of which main reclamations were in Xiayangtu, Shepantu and Sanshantu. The hydrodynamic environment of SMB affected by reclamation has been extensively investigated in previous studies. This included investigations on variations in tide (Yang et al., 2019), tidal current dynamics (Xu et al., 2018), tidal prism (Xie and Wu, 2006), water-exchange capacity (Huang et al., 2019), and sediment siltation patterns (Mu and Huang, 2013). However, the aforementioned researchers investigated only a part of SMB’s reclamation period, and did not study the hydrodynamic environment as a whole. In addition, research on tidal asymmetry was not conducted in SMB.

Figure 1. Shoreline changes in SMB in 1971, 2003, and 2020.
Therefore, this study will comprehensively and systematically research the long-term evolution of the hydrodynamic environment of SMB. The response of tides, tidal currents, tidal prism, water-exchange capacity, and tidal asymmetry to SMB’s long-term reclamation was studied, which is a reminder for government and a reference for similar investigations.
2 Data and methods
2.1 Coastline and bathymetry extraction
Historical remote sensing maps for SMB in 1971, 2003, and 2020 were collected, and historical shorelines from the historical remote sensing images were extracted. The historical remote sensing images of 1971 and the maps of 2003 and 2020 were obtained from KH-9 satellite imagery (USGS), Google Earth, respectively. The water depth values of SMB were extracted from the proximate year charts acquired from the Navigation Guarantee Department of the Chinese Navy Headquarters. Other water depth values were derived from situ measurements and datasets of the General Bathymetric Chart of the Oceans (Table 1). All bathymetric data are unified under the same depth datum.
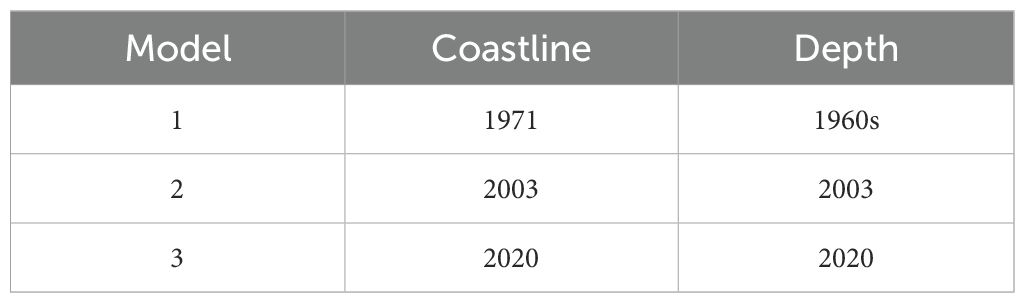
Table 1. Details of the model coastline and depth.
2.2 Numerical model
In this study, MIKE 21 was used to simulate the hydrodynamic environment of SMB, which is based on the numerical solution of the Navier-Stokes equation, unstructured triangular meshes, and wet and dry boundaries (Danish Hydraulic Institute, 2012). Compared with the structural meshes, the unstructured meshes exhibit superior adaptability to the complex regions like SMB (Liu et al., 2024a, 2024b). In recent years, this model has been extensively applied in hydrodynamic scientific research (Wisha et al., 2018; Cao et al., 2019; Pan and Liu, 2020; Xu et al., 2021). This model is composed of a continuity equation and two horizontal momentum equations:
where h is the total water depth, t is time, x and y are the Cartesian coordinates, and are depth average values of velocity components in x and y directions, S is the magnitude of the discharge due to point sources, f is the Coriolis parameter, is gravitational acceleration, η is surface elevation, is the reference density of water, is atmospheric pressure, ρ is the density of water, and are the x and y components of surface wind, and are the components of bottom stress, and are the velocity by which the water is discharged into ambient water, and , , , and are components of the wave radiation stress tensor. , , and include viscous friction, turbulent friction, and differential advection estimated using eddy viscosity formulation.
The simulation domain covered the entire study area, including the nearby East China Sea and parts of the Yellow Sea. The mesh along SMB was refined to 100 m, while the maximum grid size at the open boundary was set to 43 km (Figure 2). The model elements and node numbers for the whole model domain for 1971, 2003 and 2020 were 230211 and 441816, 201013 and 386281, and 199334 and 381814, respectively.

Figure 2. Computational model mesh in 2020.
The rivers in SMB are short mountain streams, and there are more than 30 main streams, and some larger rivers upstream built water conservancy facilities. The average runoff of all rivers is 85 m3/s (China Gulf History Compilation Committee, 1992). In addition, we referred to a large number of excellent papers on SMB (Huang et al., 2019; Yang et al., 2019; Yao et al., 2022), all believed that the river had no significant effect on the model. Based on the above evidence, we concluded that the influence of runoff could not be considered in the model assumptions. Additionally, the wave and wind forces are not considered here because of their general weakness. SMB has a large area of tidal flats, which can either be flooded and dried out; hence, the dry-wet boundary is utilized in the model. When the water depth is less than the wetting depth (0.1 m), the problem is reformulated. Hence, an element is removed from the calculation only if the water depth is less than the drying depth (0.005 m). The flooding depth (0.05 m) determines when an element is flooded. The Manning coefficient was set to 70–140 m1/3/s, which was adopted with the water depth, and the horizontal eddy viscosity coefficient was set as 0.28. We used the eight tidal constituents (M2, S2, N2, K2, K1, O1, P1, and Q1) to force the open sea boundary of the model from the MIKE 21 toolbox, which provides tidal constituents with a spatial resolution of 0.25° based on TOPEX/POSEIDON altimetry data.
2.3 Model validation
The models of 2003 and 2020 were validated using three long-term tide stations (T1, T2, and T3) from 24 April 2003 to 24 May 2003, and from 16 December 2019 to 15 January 2020. In addition, five continuous current stations (C1, C2, C3, C4, and C5) were utilized to verify the model during neap, middle tide and spring. Figure 3 shows the distribution of tide and current stations. The methods of root mean square error (RMSE) and skill score (Willmott, 1981; Sun et al., 2015; Gou et al., 2023) were used to quantify the model performance as follows:
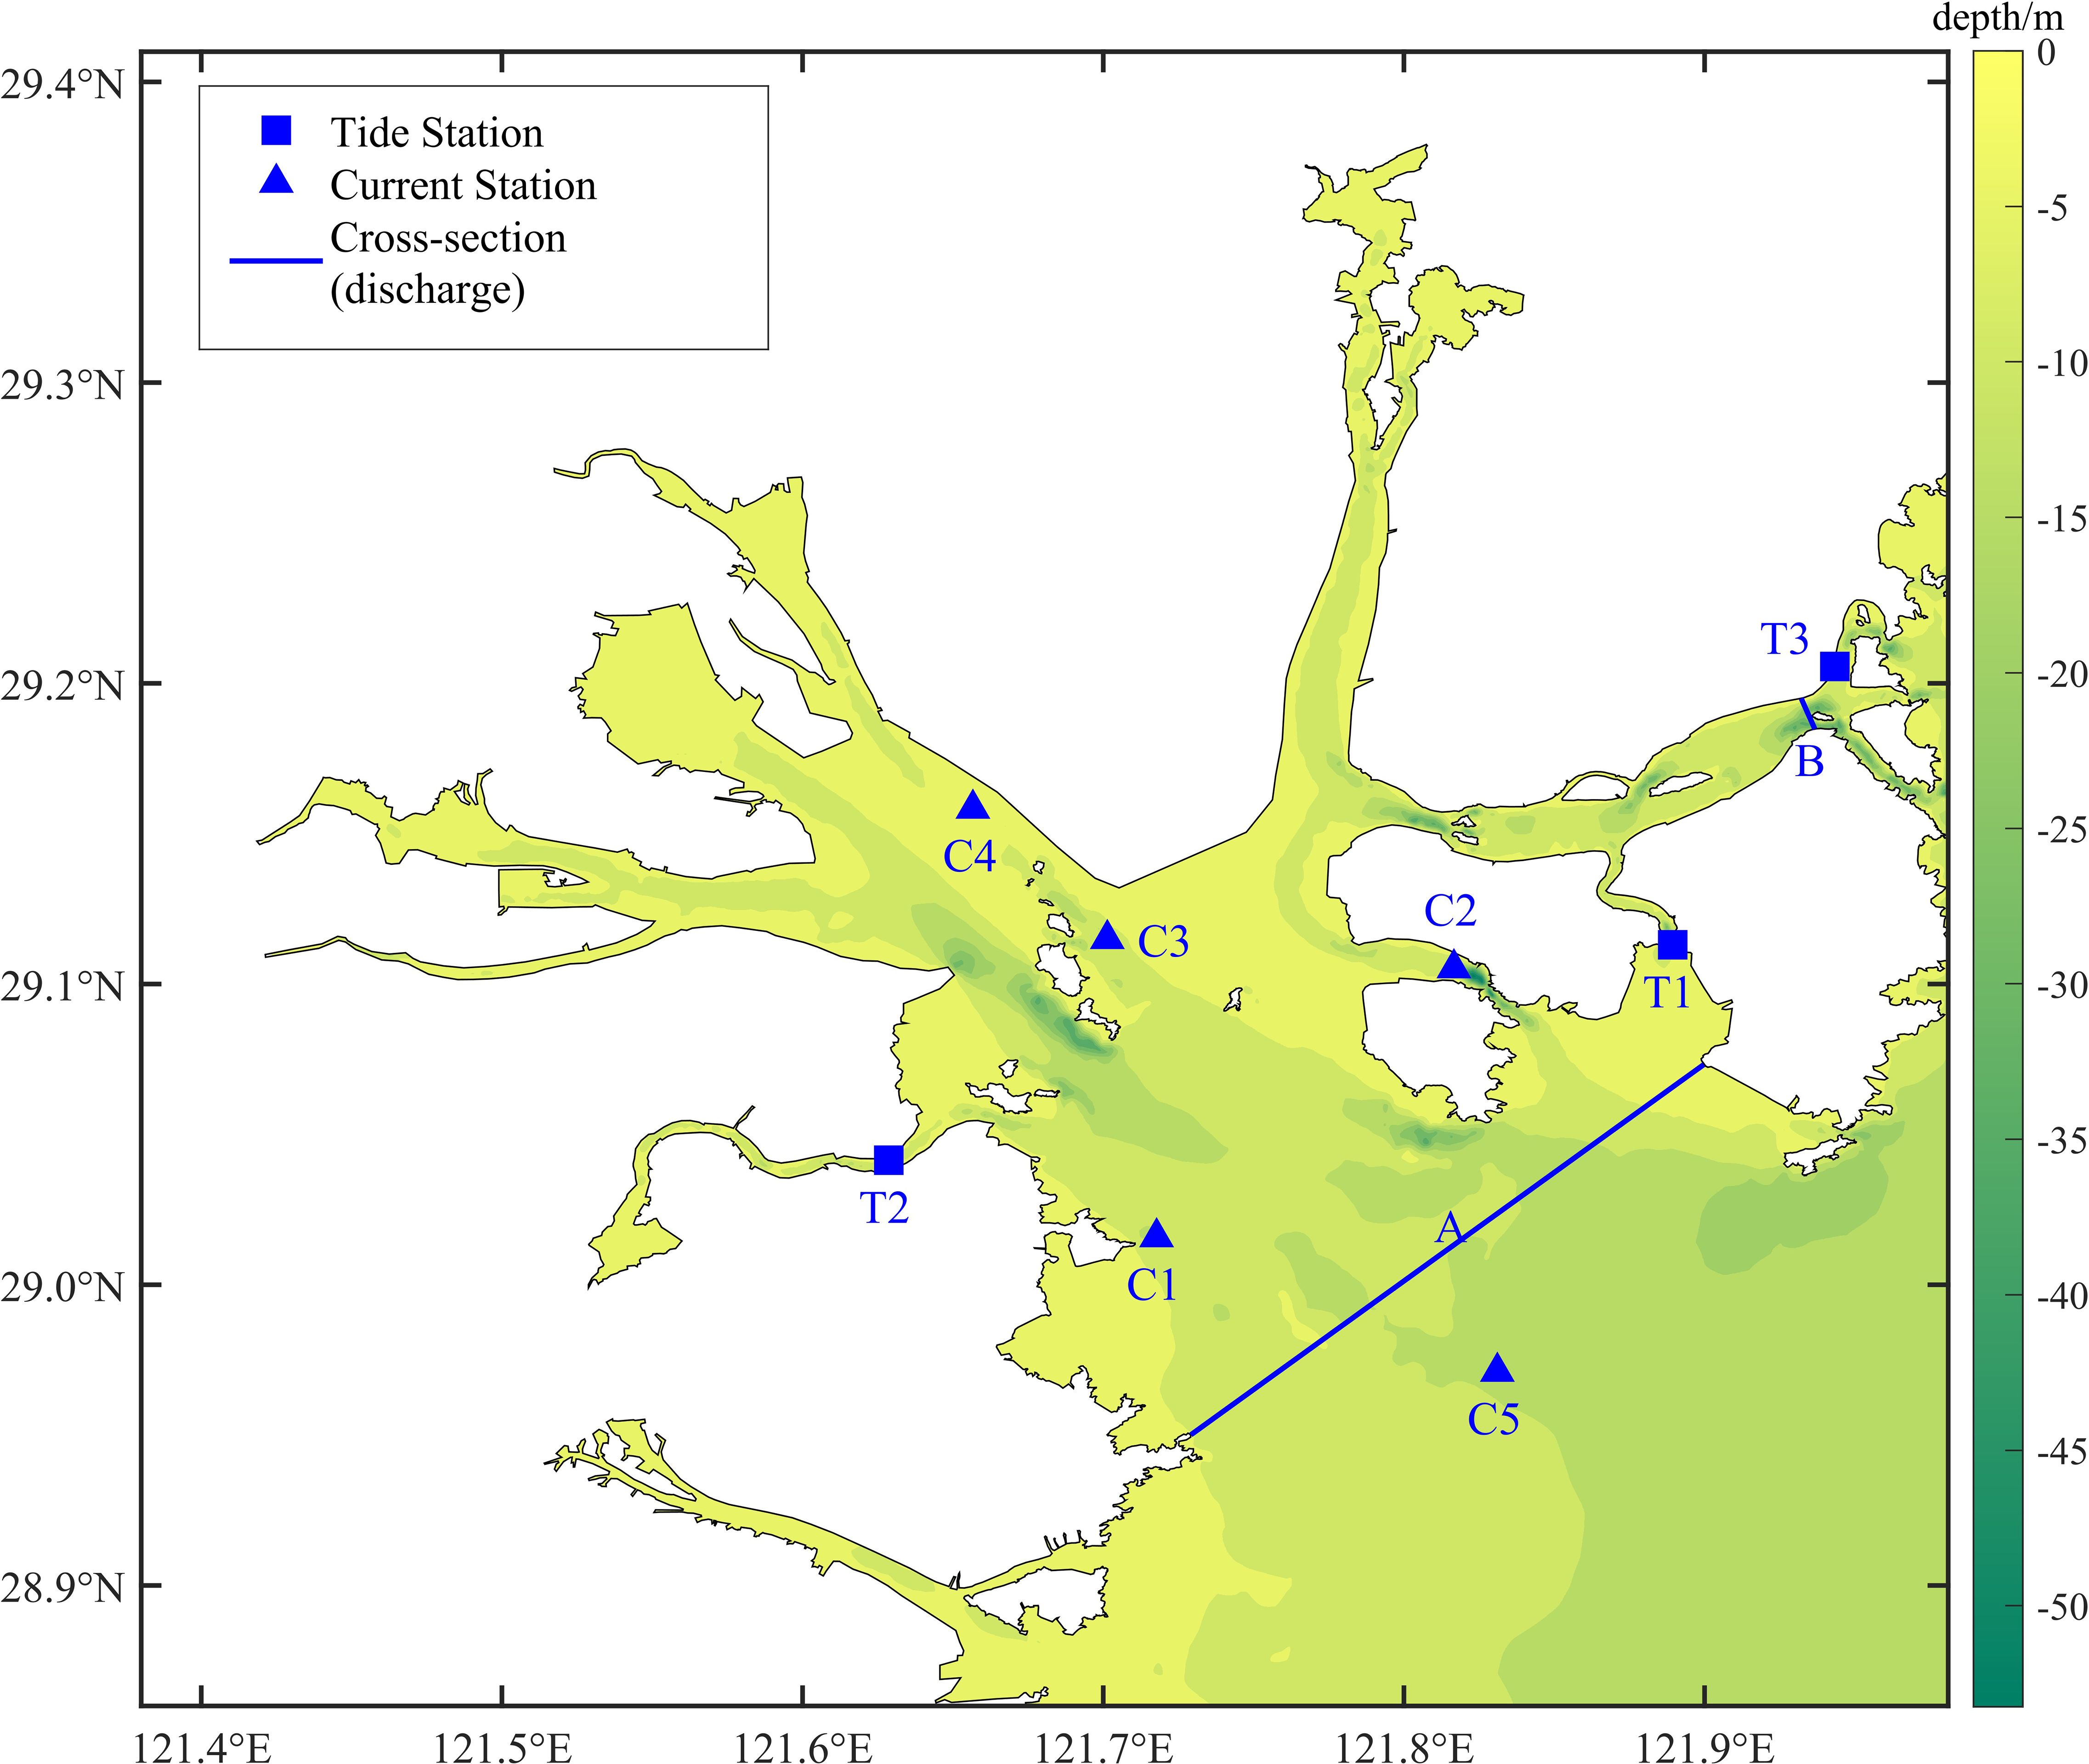
Figure 3. Distribution map of tide station, current station, and cross section.
where and are the simulated and the observed data, respectively; is the mean value of the observed data; and N is the number of observed data. A skill score between 0.65 and 1.0 indicates excellent performance and in the range of ~0.5–0.65 indicates very good performance. The lower the skill score, the poorer the performance.
Figure 4 denotes that the simulated tide levels match the observation data excellently, with the RMSE less 0.28 m and the skill score exceeding 0.98. The skill score of the current speed and direction ranges between 0.75–0.94 and 0.83–0.96, respectively (Table 2), and the RMSE of current speed and direction ranges 0.1–0.18 m/s and 35°–79°, respectively (Figure 5). The error of the current direction is mainly affected by the deviation of tide turning during ebb and flow. In addition, the major tide constituents by the T-Tide toolbox (Pawlowicz et al., 2002) were validated. The average absolute errors of the major tidal constituents’ (M2, S2, K1, O1, and MS4) amplitudes are 0.08, 0.08, 0.02, 0.03, and 0.02 m, respectively, and the phases are 5°, 4°, 9°, 12°, and 13°, respectively (Table 3). Shallow water tide is challenging to simulate because of its small amplitude. The T3 station in this study is located in Shipu Channel and the hydrodynamic conditions here are complicated; therefore, the phase deviation is a little large. In summary, the established model can simulate SMB water level and current fluctuation excellently.
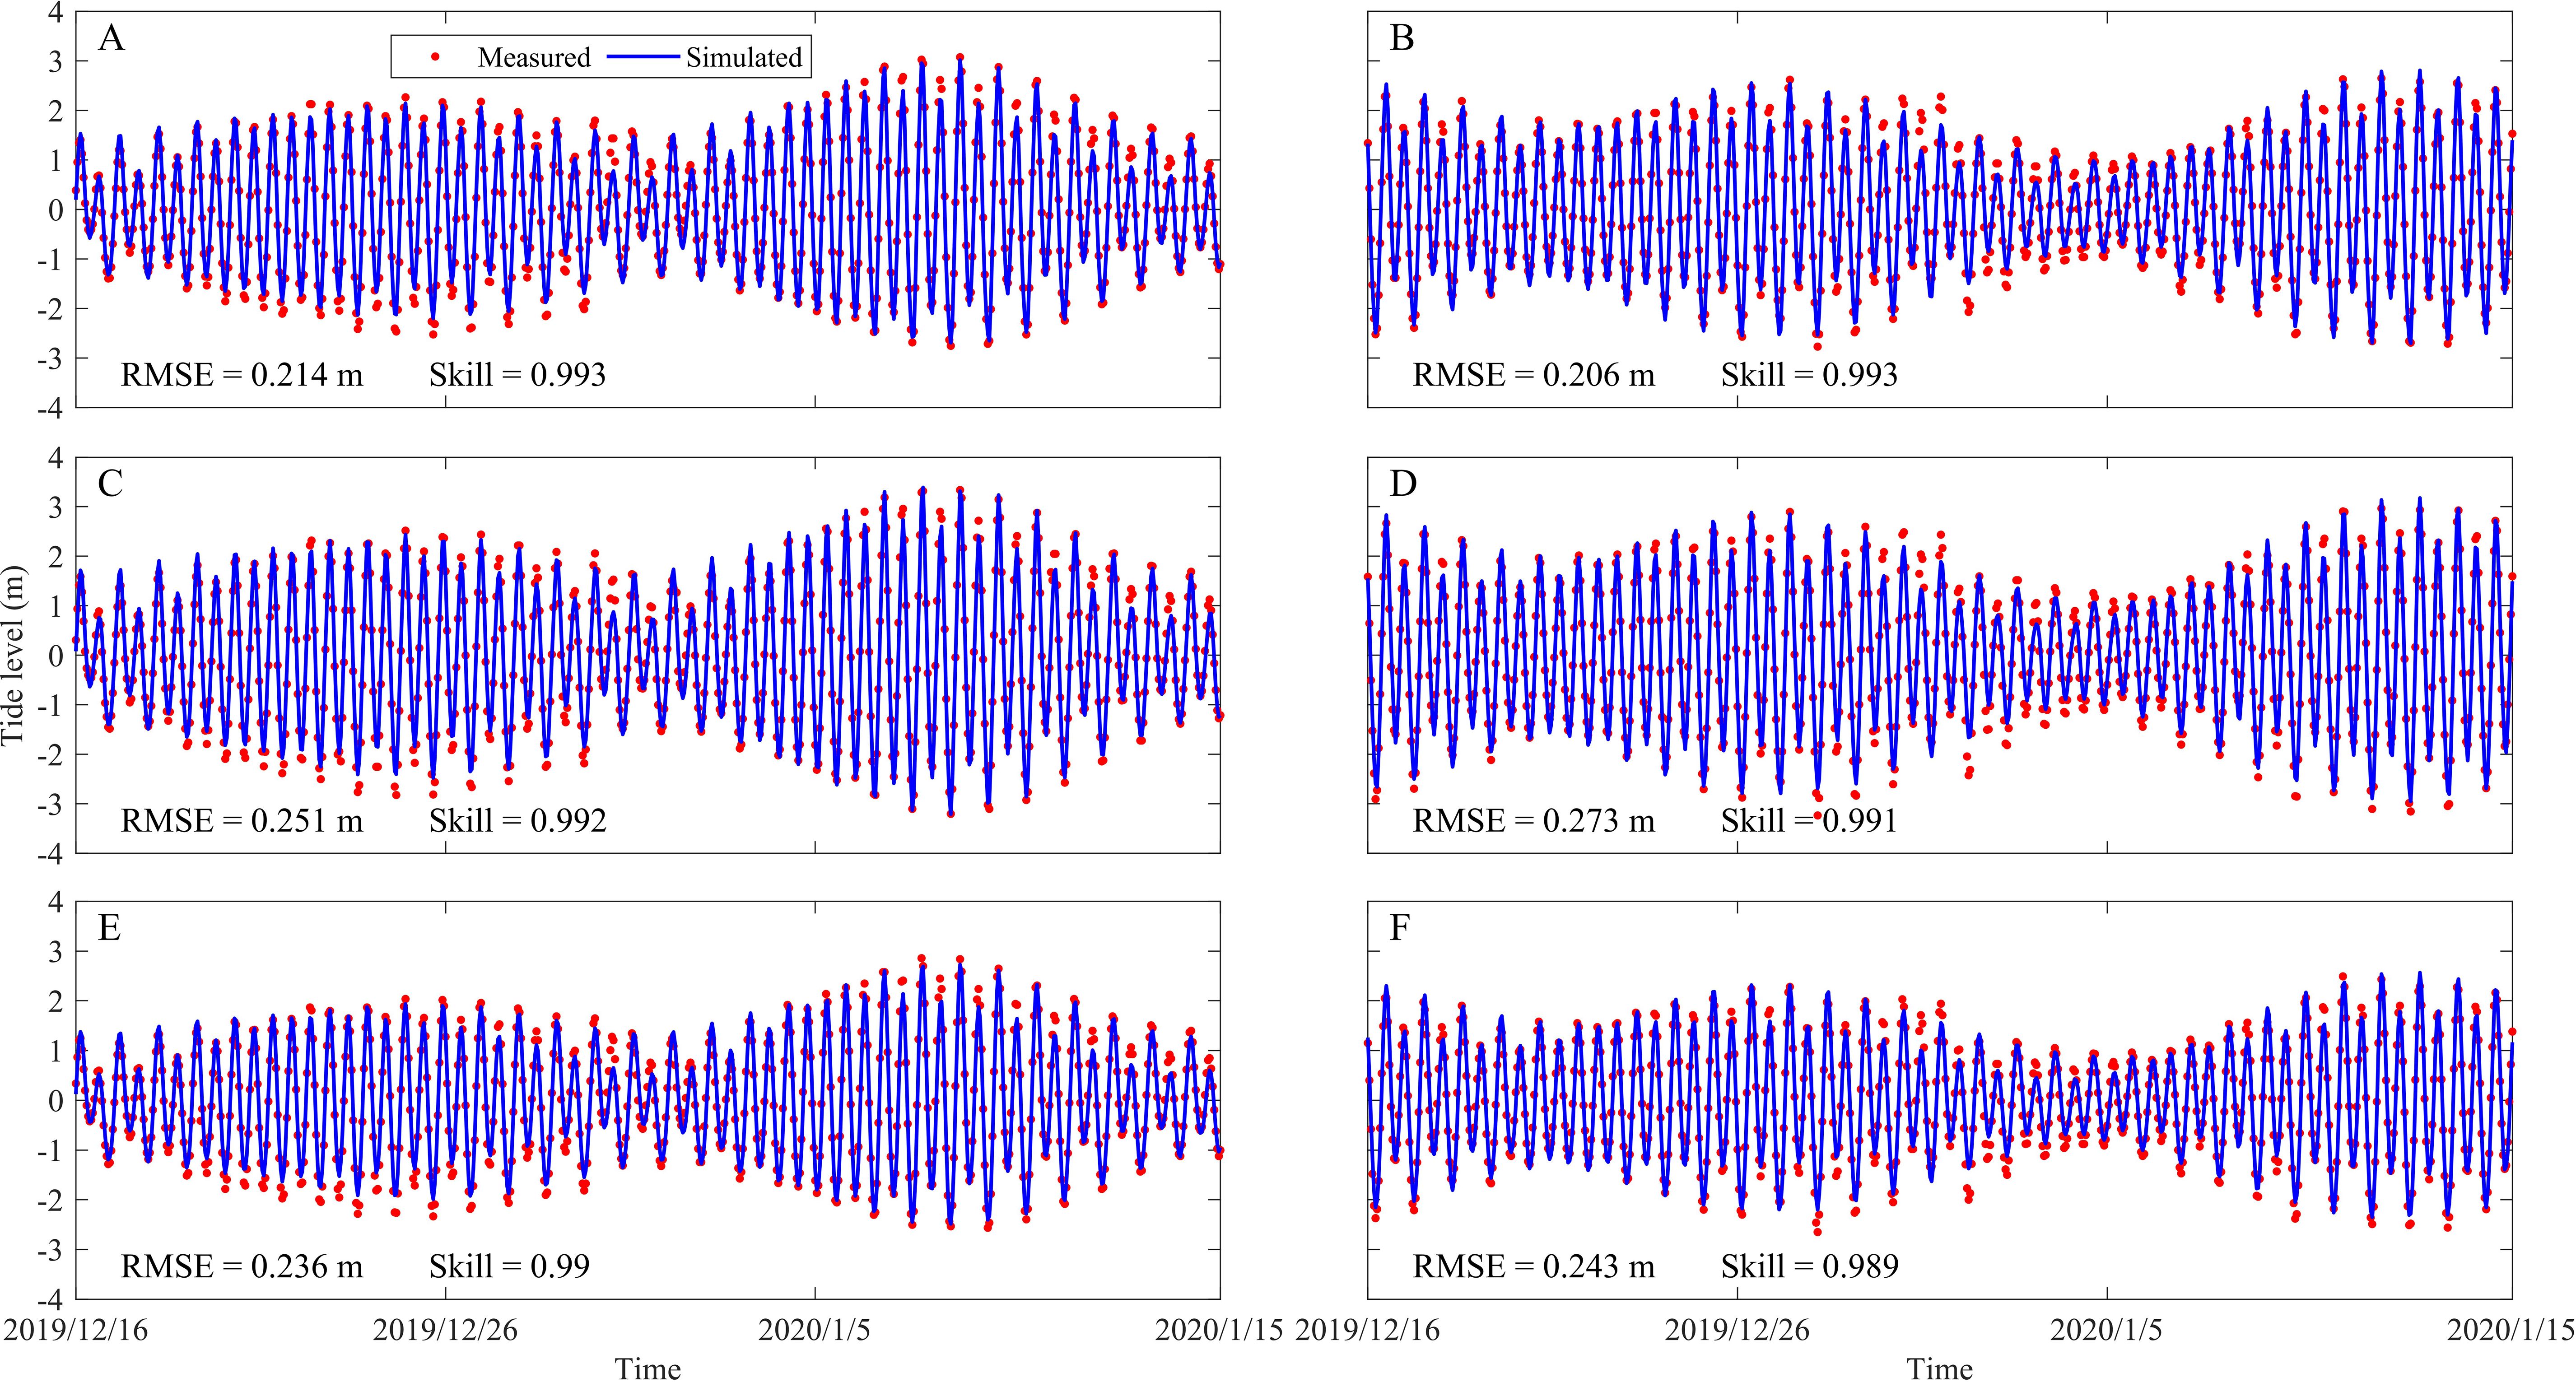
Figure 4. Comparisons between simulated and measured tide levels at T1 in 2003 (A), 2020 (B), at T2 in 2003 (C), 2020 (D), and at T3 in 2003 (E), 2020 (F).
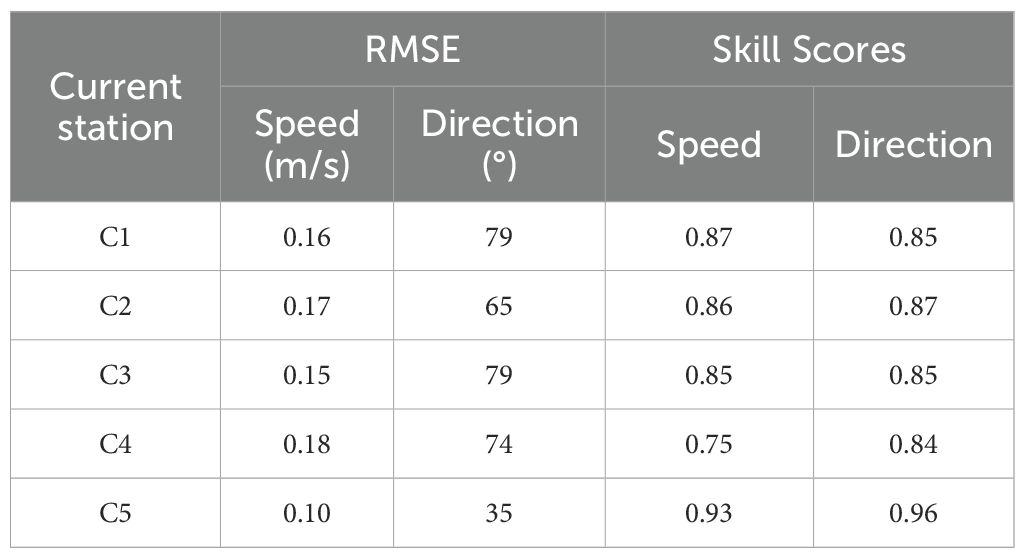
Table 2. RMSE and skill scores value in tidal current station.
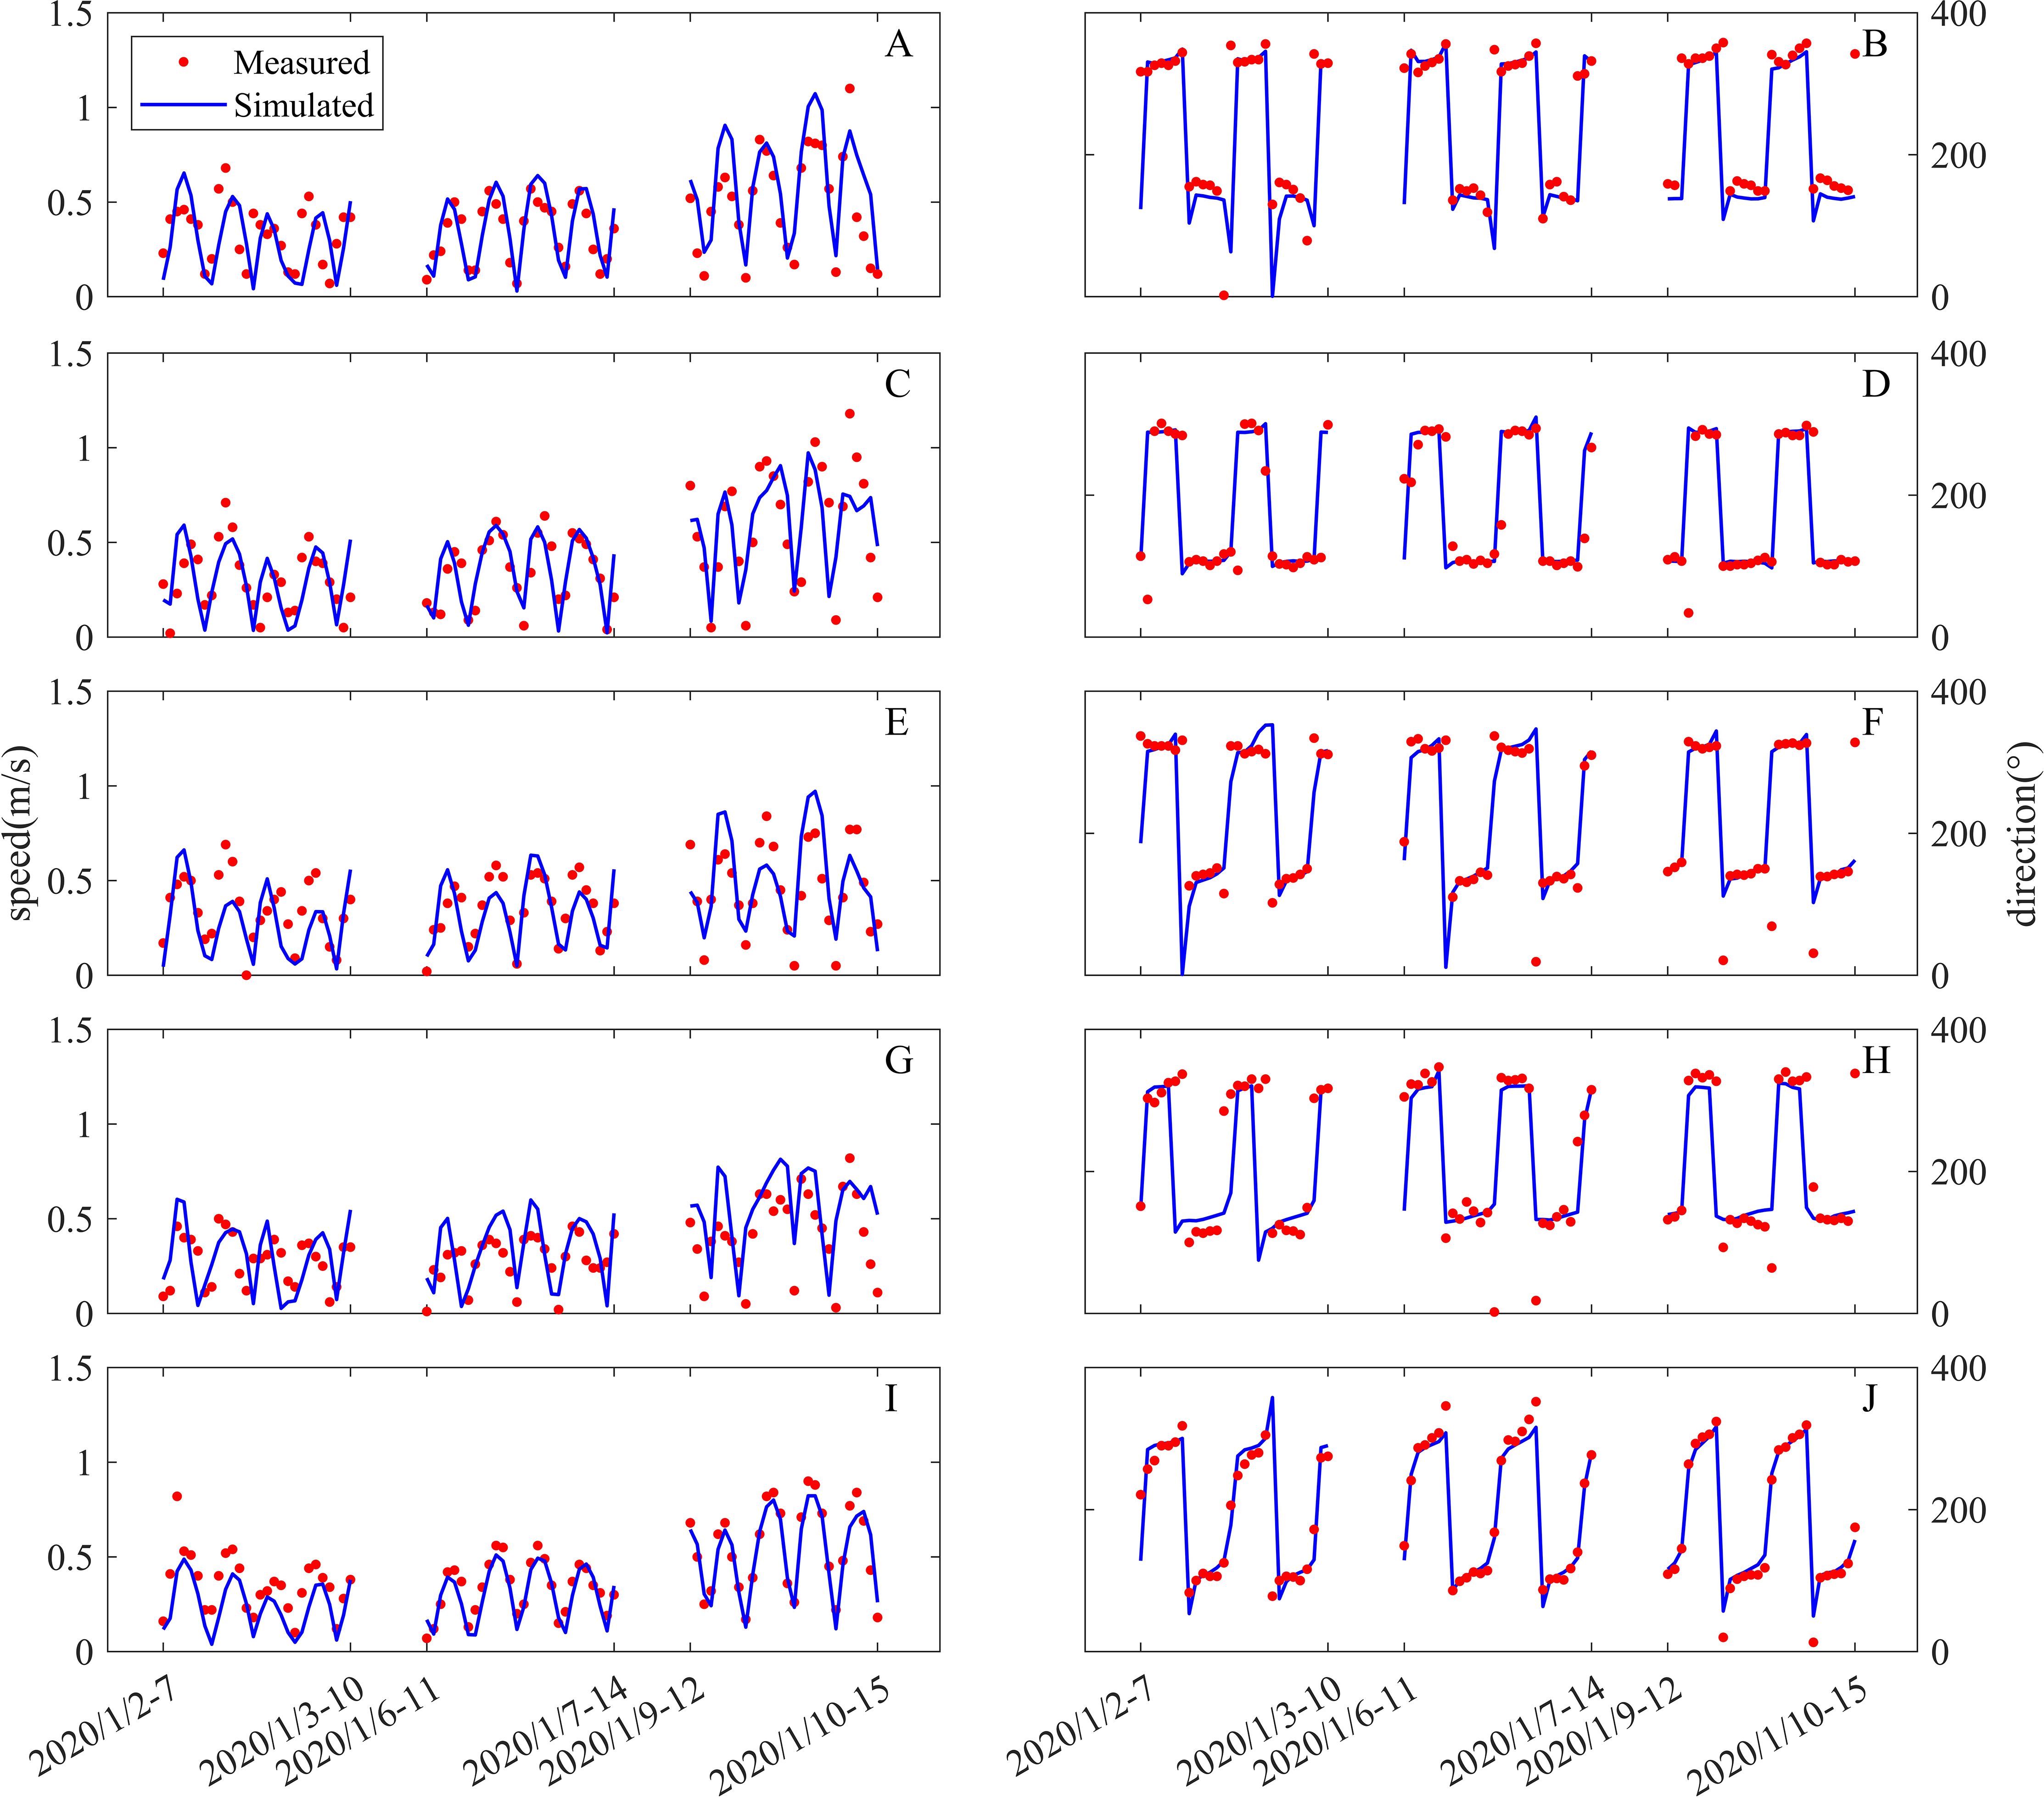
Figure 5. Comparisons between simulated and measured current speed and direction at C1 (A, B), C2 (C, D), C3 (E, F), C4 (G, H), and C5 (I, J).
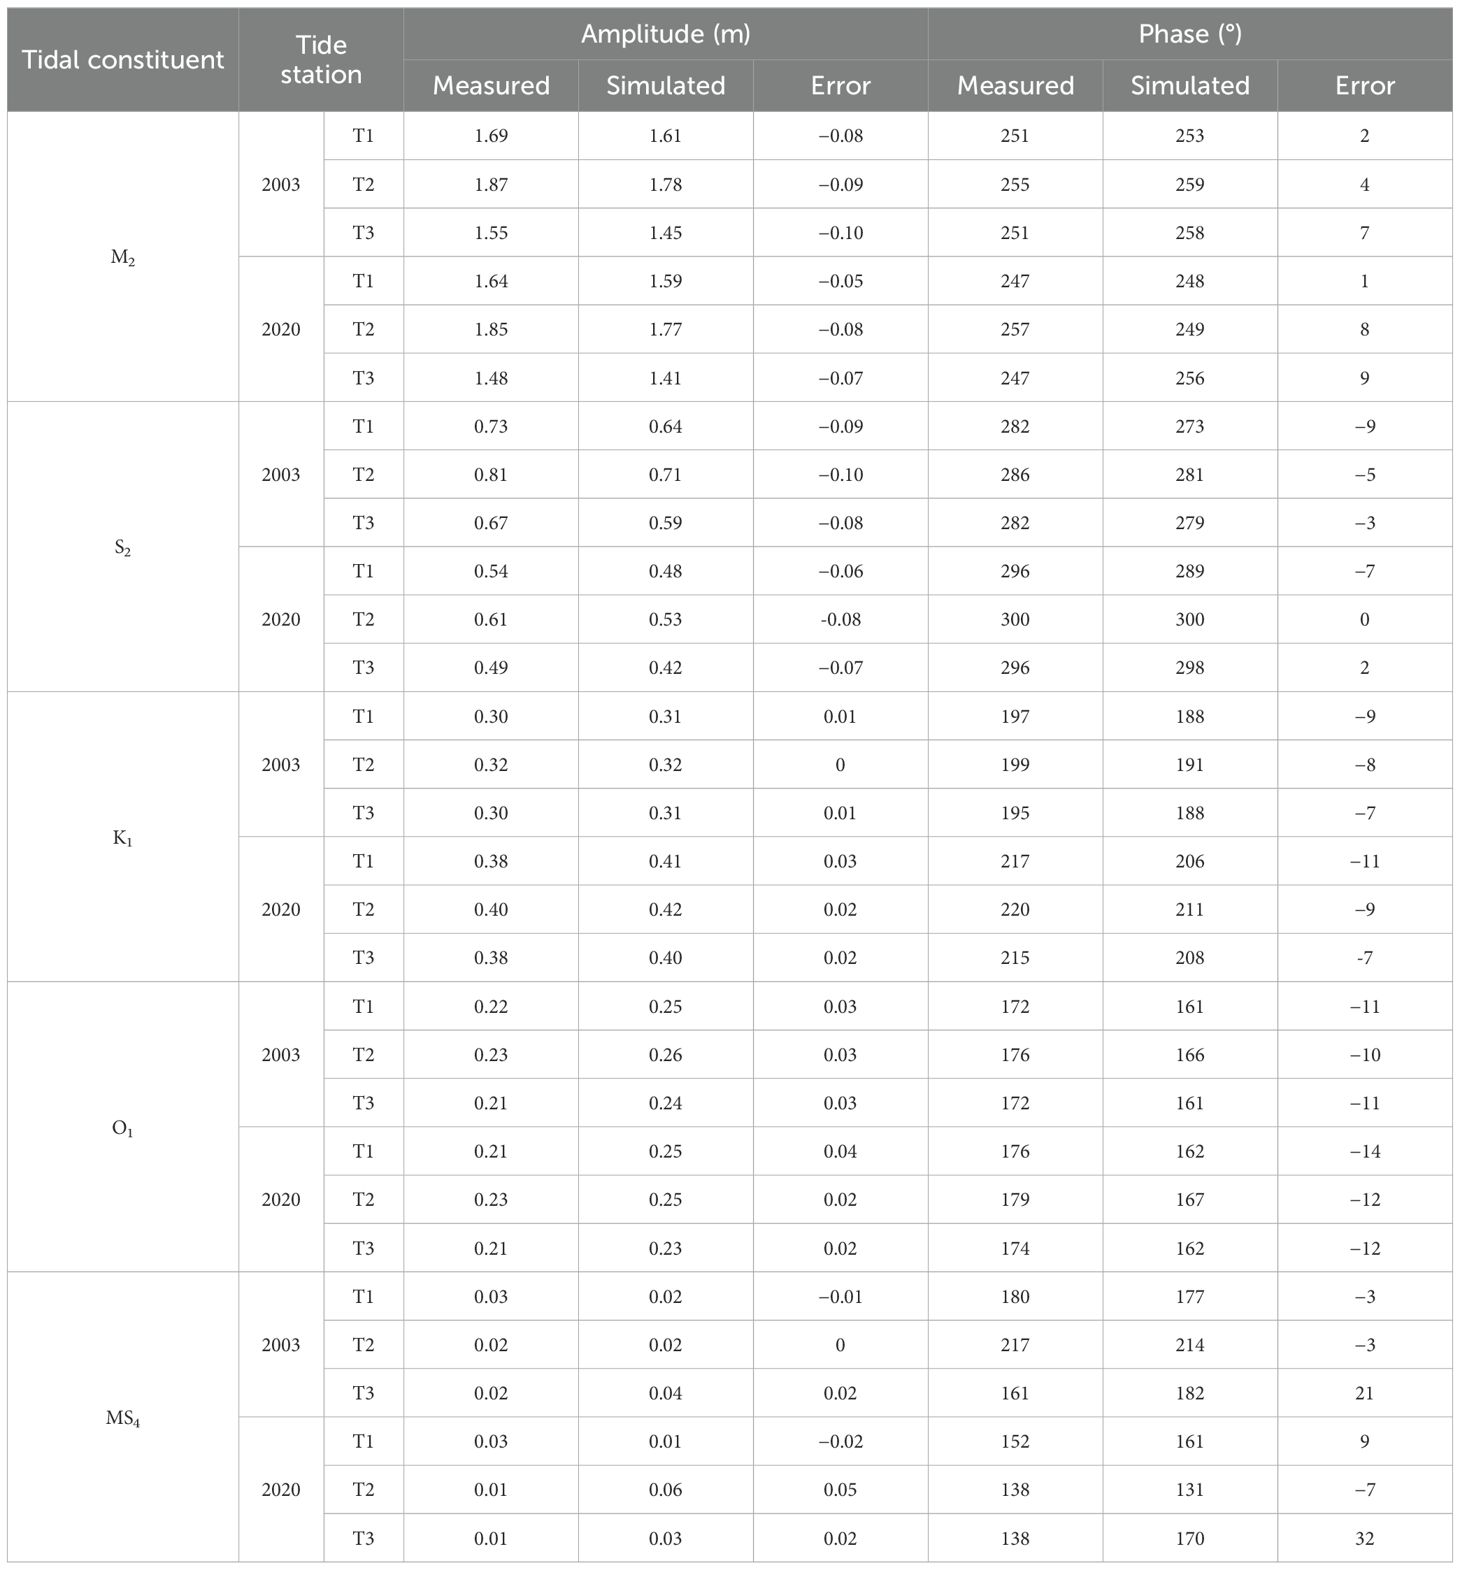
Table 3. Comparison of harmonic constants (M2, S2, K1, O1, and MS4) between measured and simulated results.
2.4 Data analysis
2.4.1 Co-tidal chart
The influence of coastline and water depth on tide was analyzed by comparing the co-tidal charts. The T-Tide toolbox was used to calculate the amplitude and phase, the main components of the SMB tide (M2), in the same month.
2.4.2 Tidal residual current
Residual currents are weaker than tidal currents, but they can indicate the long-term transport direction of mass. The most frequent form of calculation of the residual current is the Euler residual current because of its simplicity. Based on the tidal current of one month, the Euler residual current was calculated.
2.4.3 Tidal prism
The tidal prism reflects the bay’s capacity in water exchange with the open sea. In this research, tidal prism was calculated by integrating the product of the instantaneous cross-sectional area and velocity through the inlet over half a tidal cycle. This method yields the most straightforward and accurate tidal prism, with accurate cross-sectional area and current velocity. The result of the tidal prism was averaged over a month for its reasonability. Figure 3 presents the cross-section, and the formula is as follows:
where T1 and T2 are the beginning and end times of flood and ebb, n is the number of grid points, V is the current velocity perpendicular to the section, and S and H represent the area and water depth of grid points, respectively.
2.4.4 Residence time calculation
Residence time is one of the most frequently used timescales to reflect the water-exchange capacity of a bay. It determines the transport and redistribution of pollutants and suspended sediments. In this study, Eulerian residence time, which is widely used in other bays is applied (Sun et al., 2018; Xu et al., 2021; Yuan et al., 2021). At the beginning, a conserved substance with a concentration of 1 g/L was released in each grid cell inside SMB. When the conserved substance decreases, the conserved substance mass (CSM) is calculated as follows:
where the subscript labels the grid points within the bay, C is the mass of the gird cell, V is the grid cell, and = 1 g/L is the initial conditions. The numerator and denominator of Equation 6 are the total tracer mass inside the bay at time t and time t0, respectively. The residence time at the gird cell is defined as the duration for the mass at that grid cell to decrease below e–1 (37%) g/L of its initial value.
2.4.5 Tidal-duration asymmetry
Tidal-duration asymmetry has an important effect on the net sediment transport (Pritchard, 2005). Tidal-duration asymmetry can be calculated from the skewness of the tide, which is later simplified by the formula calculated by the harmonic parameters of the tide (Song et al., 2011). The calculation conditions need to satisfy two tidal constituents (such as M2 and M4) with twice the difference in frequency, or three tidal constituents (such as O1, K1 and M2) which the sum of two is the same in frequency as the third. Semi-diurnal tides are predominant in SMB, and the pair M2-S2-MS4 is larger than the second largest contribution, the pair M2-M4. Hence, only M2, S2, and their compound tide, MS4, are considered when calculating tidal-duration asymmetry. The formula is as follows:
The subscripts 1, 2, and 3 labels tidal constituents M2, S2, and MS4, respectively. a, ω, and φ are the amplitude, frequency, and phase, respectively. If γ3 > 0, the flood-tide duration is shorter. This leads to a stronger flood current and the system is referred to as flood dominant (Walton, 2002). If γ3 < 0, the system is referred to as ebb dominant.
3 Results and discussion
3.1 Variations in tidal amplitude and phase
The main tidal constituent M2 of SMB is analyzed by co-tidal to investigate the response of the tidal amplitude and phase to the change in the water depth and shoreline, we analyze the main tidal constituent M2 of SMB by co-tidal charts (Figures 6, 7). Changes in shoreline and water depth decreased the M2 amplitude in SMB by 0.1–0.3 m. This was primarily observed during the period from 2003 to 2020 (0.1–0.25 m), with a comparatively smaller decrease during the period from 1971 to 2003 (0.05–0.1 m) (Figure 6). The drop in area amplitude was mainly observed on the high-intensity reclamation zone, with a reduction in amplitude of approximately 0.3 m observed in Xiayangtu and Sanshantu. When only the shoreline changes were considered, the amplitude of M2 in SMB decreased approximately 0.1 m from 2004 to 2017 (Yang et al., 2019). This implies that the change in water depth had a greater impact on amplitude decline.
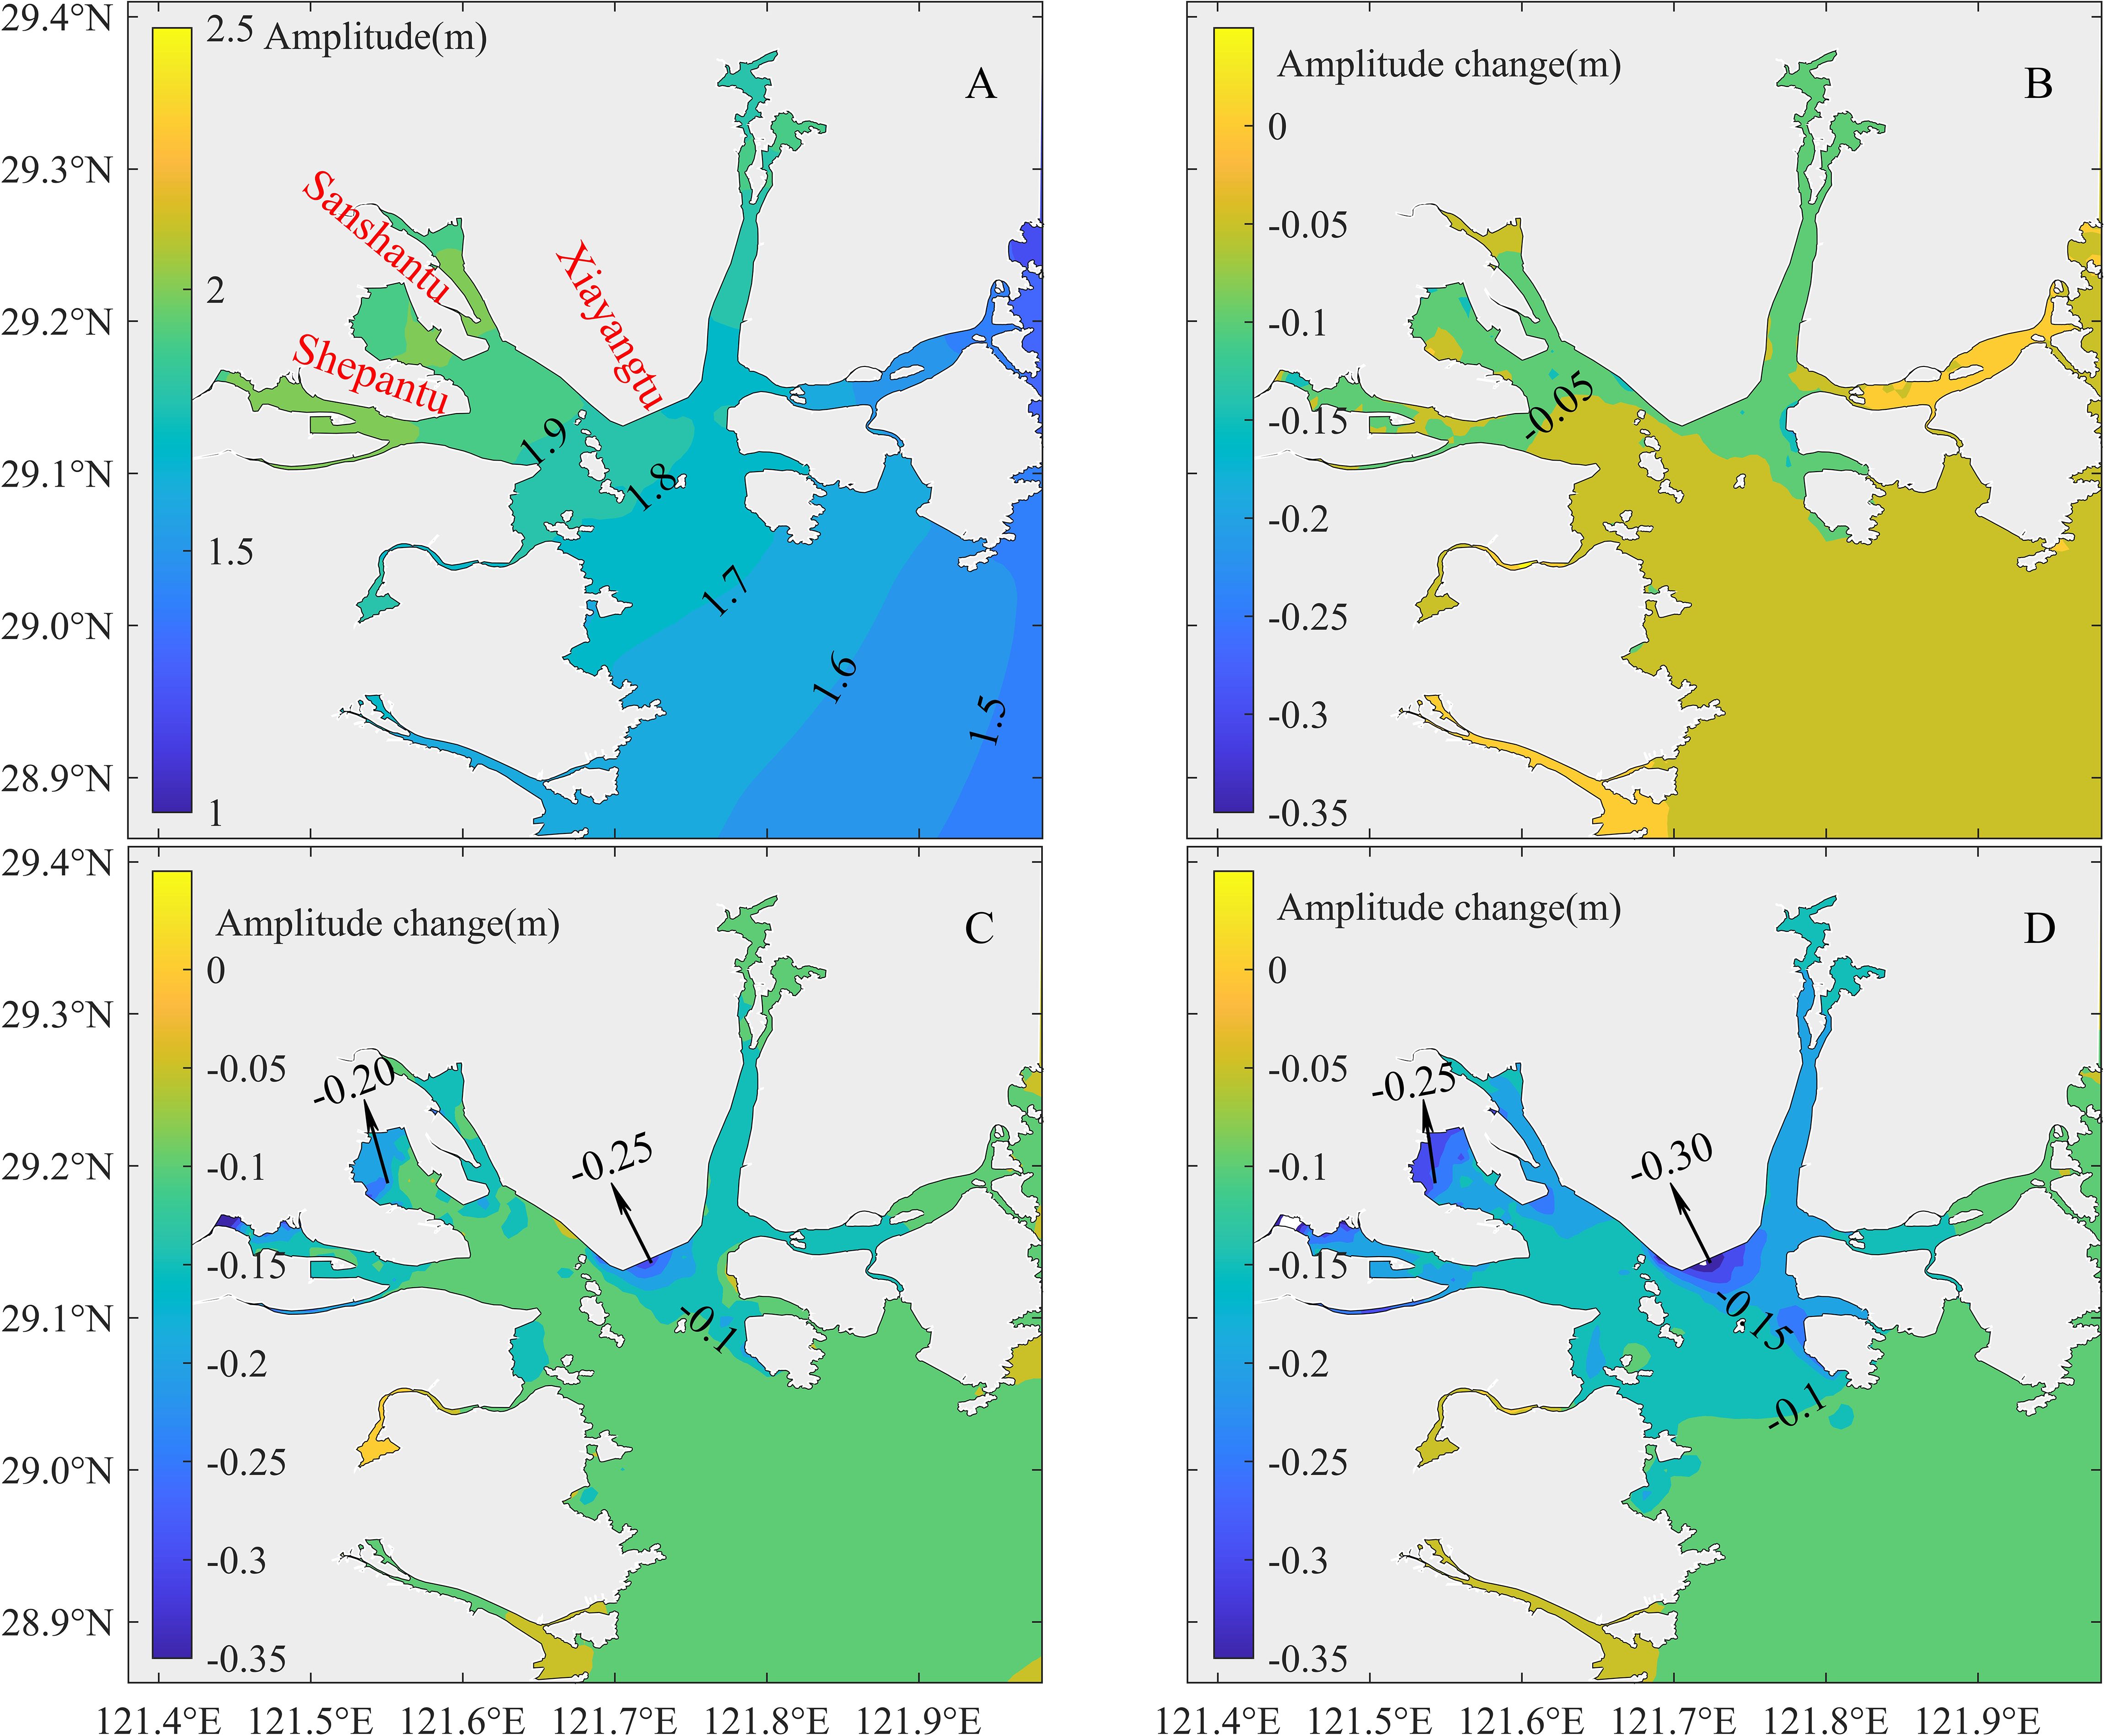
Figure 6. Contour maps of changes in the M2 tidal amplitudes in 1971 (A), 1971–2003 (B), 2003–2020 (C), 1971–2020 (D).
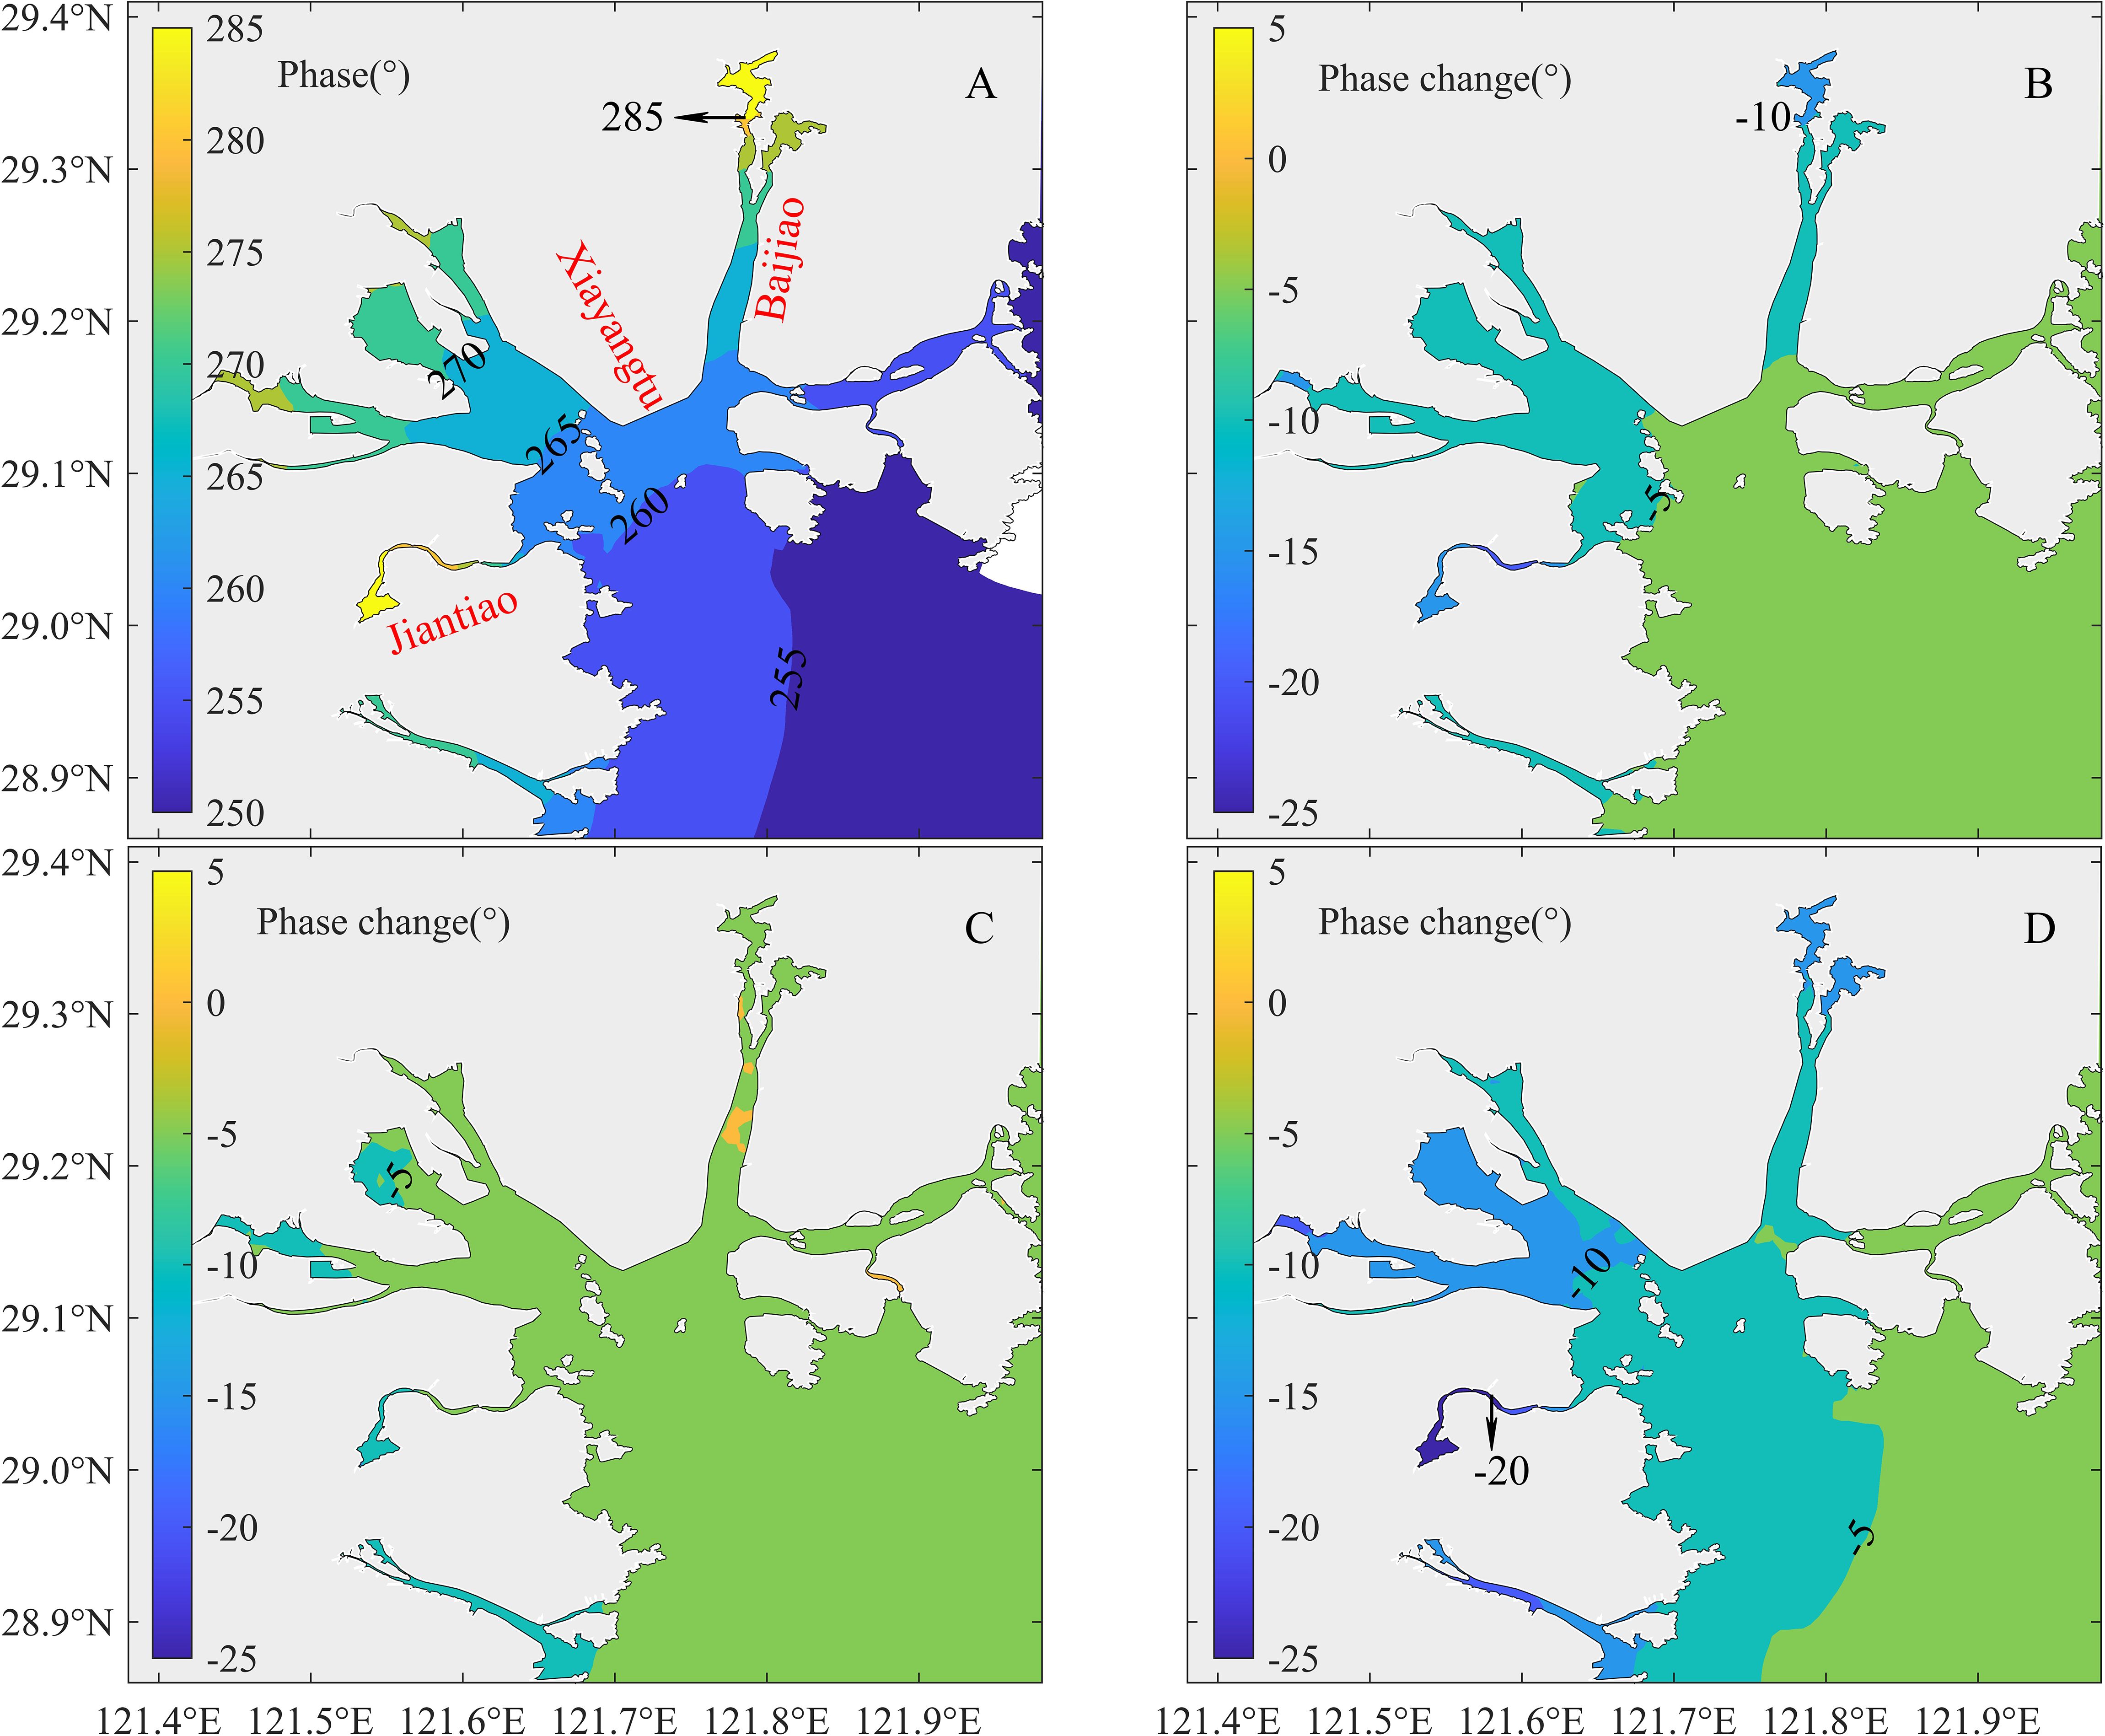
Figure 7. Contour maps of changes in the M2 tidal phases in 1971 (A), 1971–2003 (B), 2003–2020 (C), 1971–2020 (D).
Figure 7A depicts the northward propagation of the M2 tidal wave in 1971 with a phase range between 250° and 285°. With the progression of reclamation, there was a decrease in the M2 phase by 5°–10°from 1971 to 2003 (Figure 7B). Notably, Jiantiao Channel, Baijiao Channel, and the water north of Xiayangtu experienced a more significant decline. From 2003 to 2020, the phase of M2 reduced by approximately 5°, including several other channels (Figure 7C). In summary, Figure 7D illustrates the phase dropped by 5°–15°from 1971 to 2020, with the intensity gradually increasing from the outer to the inner regions of the bay. Moreover, Jiantiao Channel exhibited greater over 20° decrease.
Land reclamation changed the shoreline and topography of SMB, and influenced the patterns of SMB’s tidal propagation. Reclamation has covered large tidal flats and narrowed the bay. This has accelerated the tidal propagation speed. Fortunately, the synchronization between tidal amplitude and tidal propagation did not increase; otherwise, it would have elevated the risk of flooding. Notably, bay sedimentation leads to an increase in tidal amplitude (Yang et al., 2019). Hence, the change in SMB’s water depth should be given more attention in the future.
3.2 Variations in tidal residual current
Figure 8 indicates that residual currents are mostly less than 0.1 m/s in most scenarios, and larger (0.3 m/s) near the island margin. In addition, the overall residual current intensity exhibited a significant decrease from 1971 to 2003 but displayed minimal changes from 2003 to 2020. There are three to four major residual current eddies in SMB with red character, all of which are clockwise eddies. Residual current eddy a was stable from 1971 to 2020, but became gradually stronger, which is related to nearby reclamations in, Hucheng Port and Xiayangtu. Due to Xiayangtu reclamation project, the center of residual current eddy b moved a few kilometers toward Huaao Island, and the intensity increased from 2003 to 2020. Residual current eddy c just existed in 1971, whereas residual current eddy d decreased only in intensity. Cumulative changes in residual current over the past 50 years indicate weaker water-exchange capacity, which is discussed in the latter part of this article.
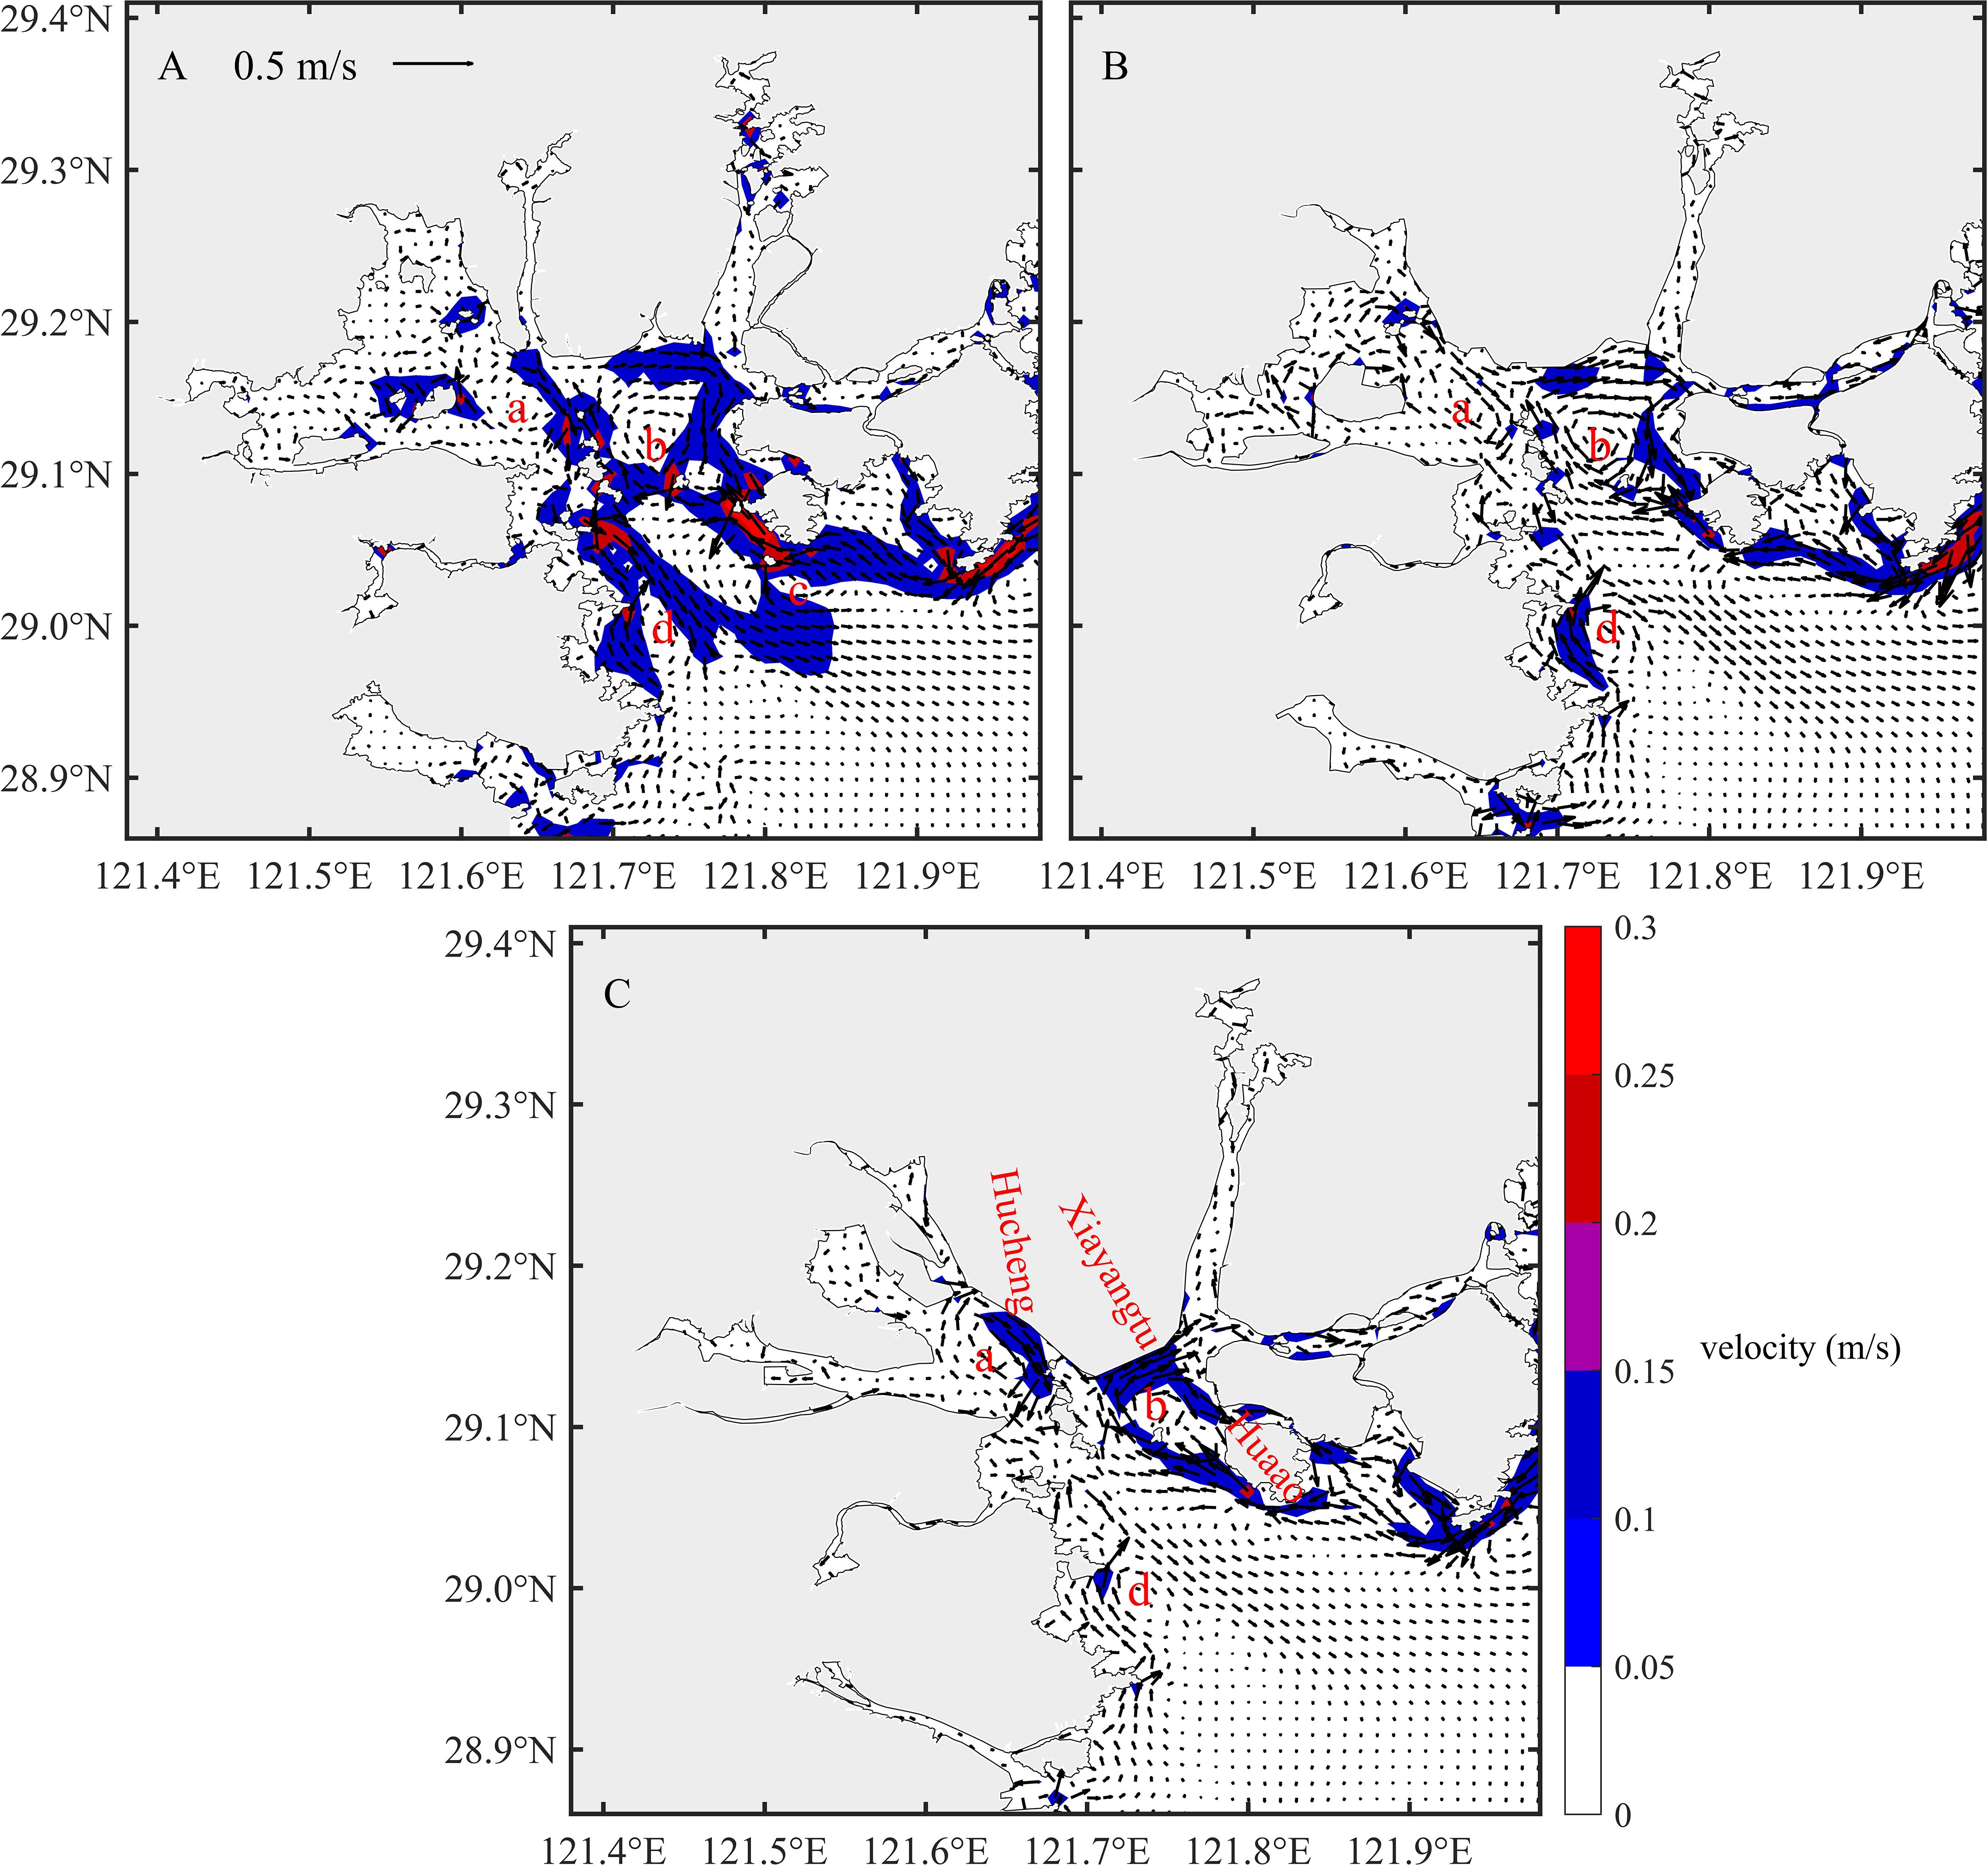
Figure 8. Spatial distribution of residual current in 1971 (A), 2003 (B) and 2020 (C).
3.3 Change of tidal prism
The reclamation location has an important effect on the tidal prism. Table 4 denotes that the tidal prism of SMB decreased by 1.02 × 10⁹ m3 (34.9%) from 1971 to 2020. In the first stage (1971–2003), there was a decline of 18.3%, which aligns with findings reported in the existing literature (Xie and Wu, 2006), and in the subsequent stage (2003–2020), a decline of 16.6% was observed. From a temporal perspective, the decline in tidal prism during both periods exhibited similarities. However, from a spatial standpoint, cross-section A experienced a significant decrease in the first stage, whereas cross-section B encountered a substantial decline in the subsequent stage. The implementation of the Xiayangtu reclamation project in section B exerts a significant influence on the tidal current path, which leads to a substantial reduction in tidal prism.

Table 4. Tidal prism of SMB, unit: 109m3.
Previous studies held an optimistic attitude toward the forecast of tidal prism after the 2003 reclamation of SMB, and the predicted decrease was not greater than 10% (Xie and Wu, 2006; Peng et al., 2014). The tidal prism of a bay is determined by the bay area. The exact size of the reclamation area is not known because of forecasting before reclamation. Therefore, the area of reclamation might be underestimated. Another reason is that the impact of the reclamation project on tidal prism is continuous. This is because after a reclamation project is completed, the bay would need a few more years to adjust the sediment-flushing process to suit the reclamation project. If SMB is still in the sedimentation process stage in the future, the tidal prism may further decline.
3.4 Residence time
The residence time gradually increased from the mouth of the bay to the inner regions, with a residence time of less than 10 days at the bay’s entrance and exceeded 30 days at its deeper sections (Figure 9). The distribution of residence time is mostly influenced by three factors: the distance to the bay entrance, the pattern of the tidal current, and the extent of inter-tidal flat areas (Xu et al., 2021). The residence time distribution pattern of most bays exhibits a continuous increase in residence time from the bay mouth toward the inner regions. This is owing to the increasing distance from the open sea beyond the bay. A belt of low residence time area in SMB extends from the outer sea to Xiayangtu. This implies a strong residual current in this area, which is exactly verified by the residual current distribution in Figure 8. Changes in the shoreline and water depth increased the residence time generally, like Jiantiao Channel, whereas the residence time in the nearby seas of Xiayangtu, Sanshantu, and Shepantu reduced from 2003 to 2020. The increase of residual current eddies a and b enhanced the water exchange capacity of the nearby seas, which reduced their residence time. There are many tidal flat areas in SMB, and the residence time in these tidal flat areas is greater than 30 d, because of the weak hydrodynamic.
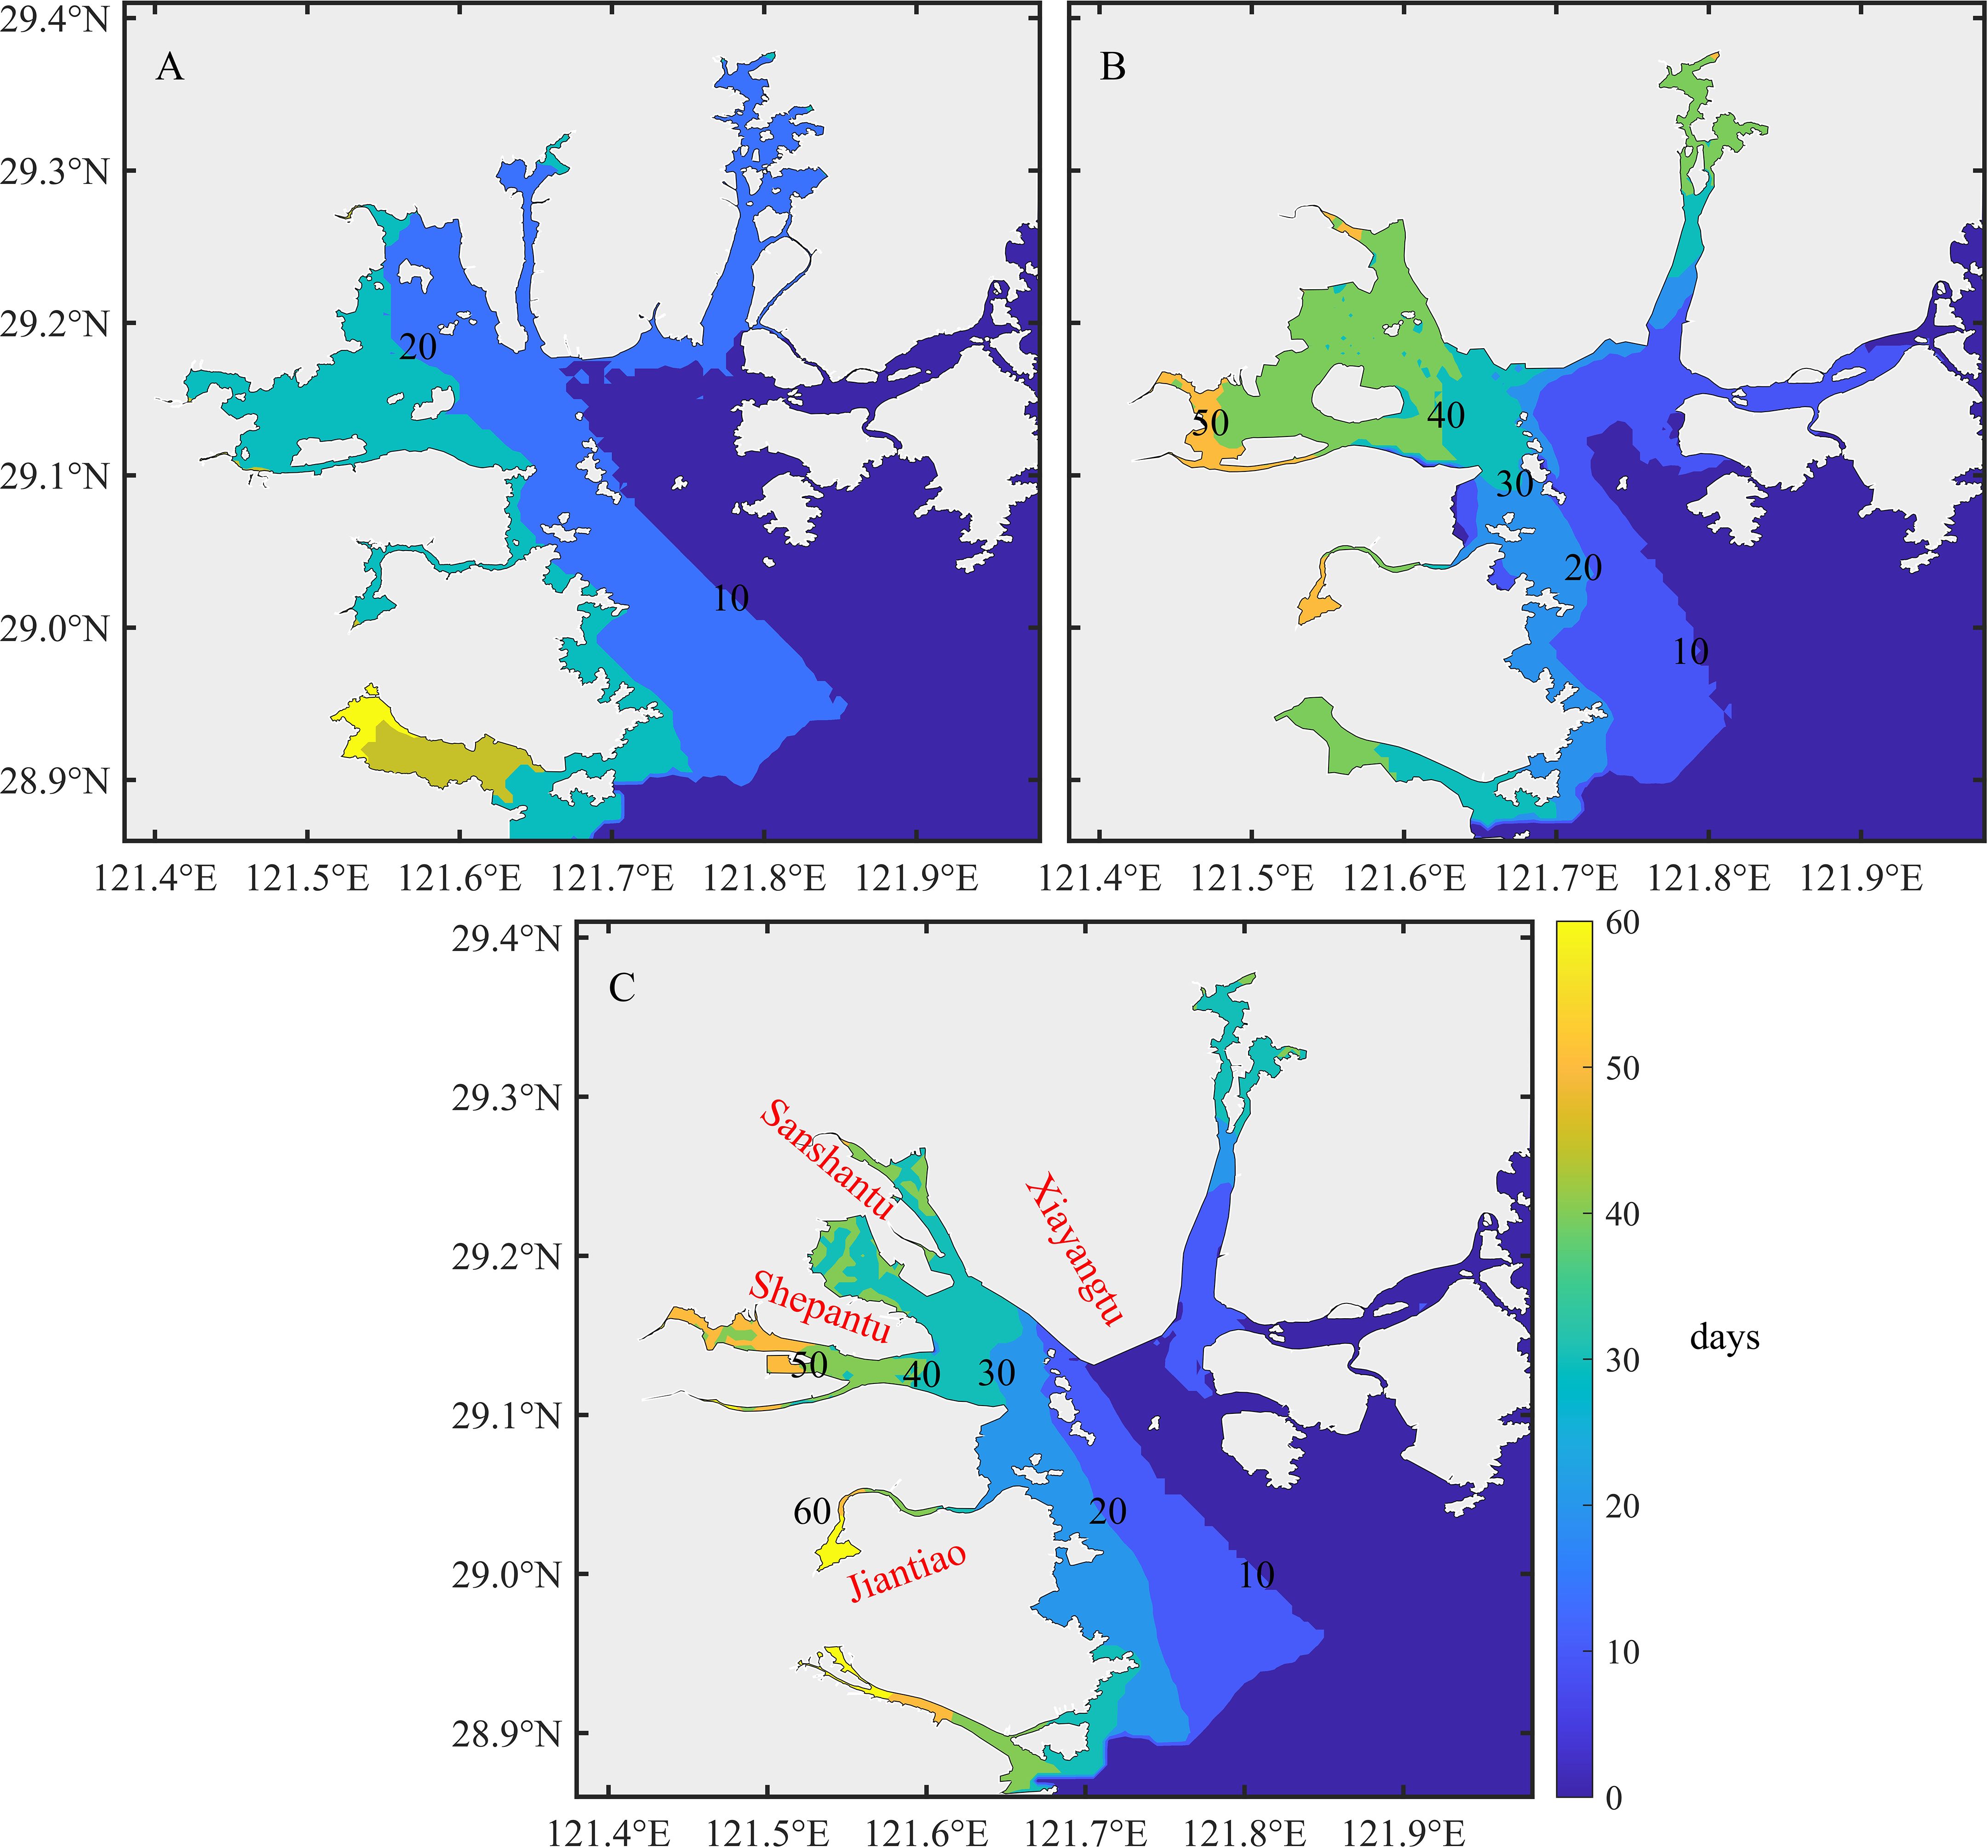
Figure 9. Spatial distribution of residence time in 1971 (A), 2003 (B) and 2020 (C).
3.5 Tidal-duration asymmetry
The distribution of tidal-duration asymmetry γ3 in the bay reduces from the inner side to the outer side. This indicates the increase in ebb intensity (Figure 10). The white dashed line in which γ3 equals to zero pushes out into the bay. Thus, the characteristic of the whole SMB tidal-duration asymmetry changes from half of flood dominant to fully flood dominant over the past 50 years.
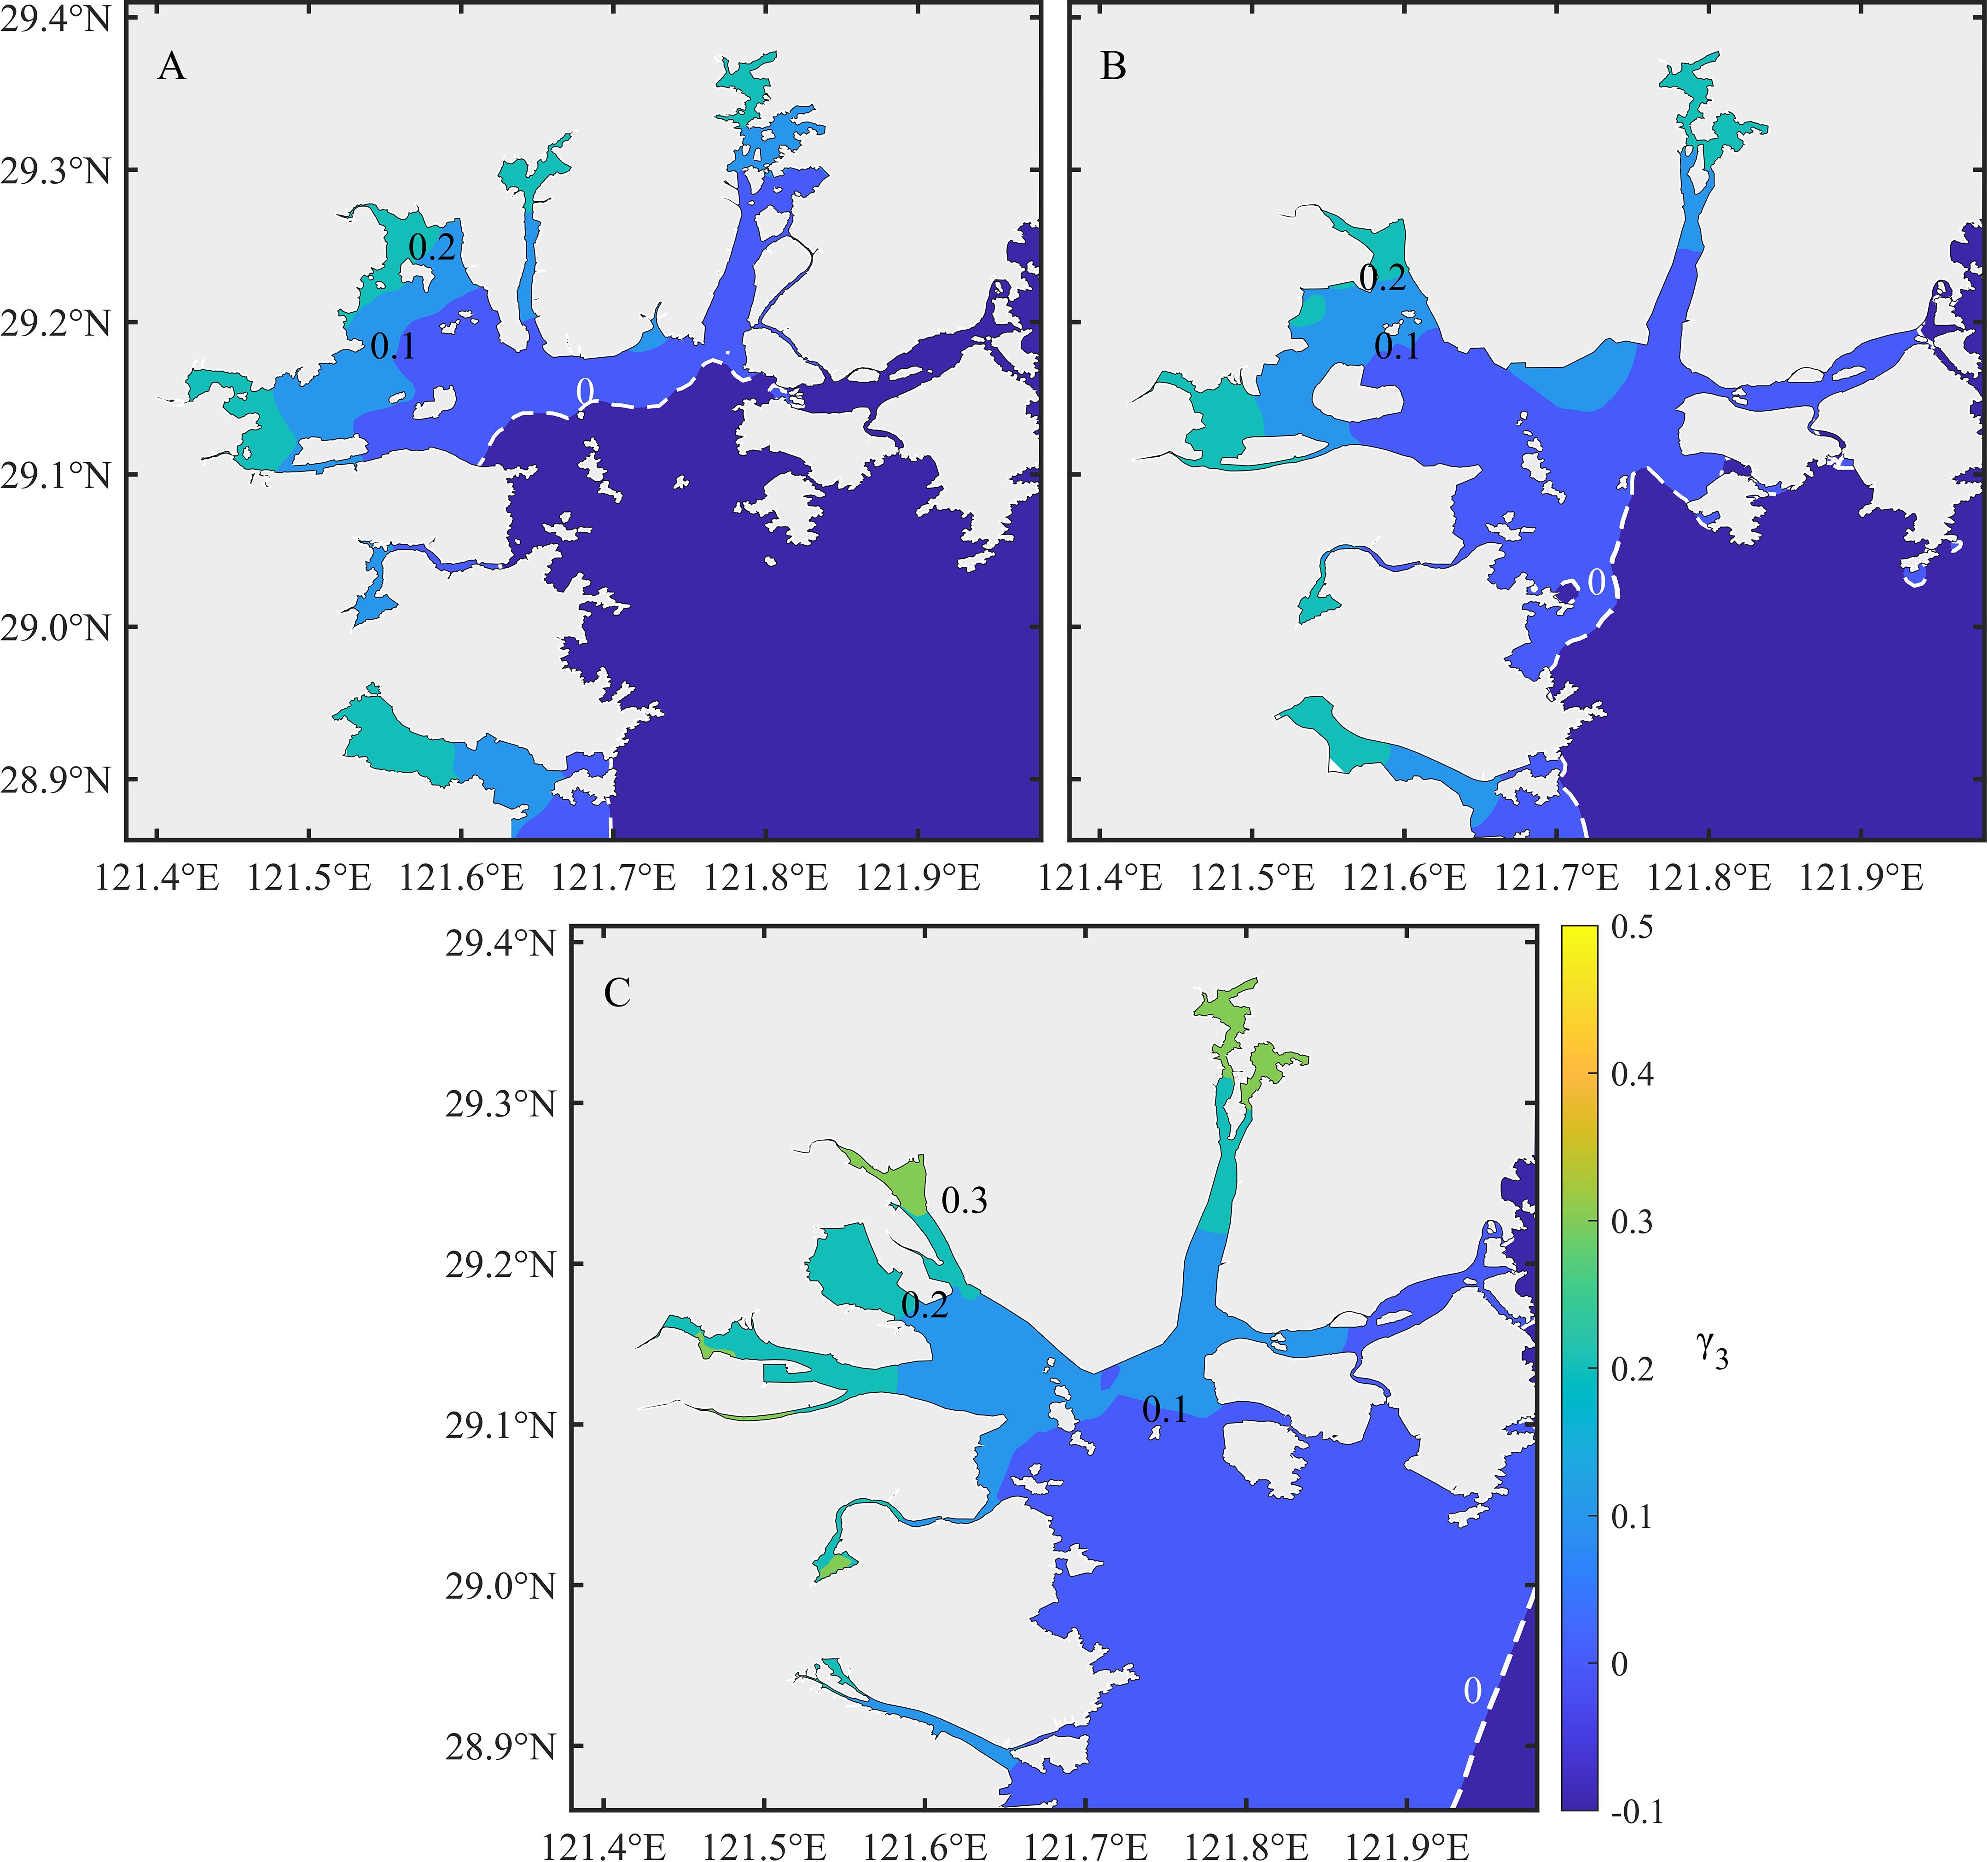
Figure 10. Spatial distribution of tidal asymmetry in 1971 (A), 2003 (B) and 2020 (C).
According to Equation 8, γ3 is directly calculated from the amplitude and phase of the semi-diurnal component and their compound tide. Furthermore, shorelines along with bathymetric and nonlinear terms change the amplitude and phase of the tide. This indirectly influences tidal-duration asymmetry. The loss of tidal flat caused by reclamation reduces shoaling effect by increasing of the γ3 and enhancing flood dominance (Gao et al., 2014; Li et al., 2018). Water depth has a similar effect on tidal-duration asymmetry: it decreases γ3 as the mean water depth of the bay increases by dredging and sand mining (Yang et al., 2022). When bottom friction or advection is not considered, the value of tidal-duration asymmetry weakens (Gao et al., 2014; Li et al., 2018).
The entire SMB has become flood dominant, exacerbating flood risk, especially during rising sea levels. This is a reminder to the government with regard to the imperative of perpetually monitoring the bay in the future.
4 Conclusion
,In the past five decades, SMB has undergone extensive land reclamation, which resulted in a reclamation area of nearly 200 km2. This has had a significant impact on the hydrodynamic environment of the bay. In this study, the responses of several typical hydrodynamic environmental parameters to reclamation are investigated using numerical models.
The amplitude and phase of the major tidal component (M2) decreased by 0.1–0.3 m, 5°–15°, respectively. The residual current also decreased, but land reclamation squeezed enhanced the residual current eddy. The water-exchange capacity of the bay became weaker: then, the tidal prism reduced to one-third and the residence time increased. The decrease in residence time between 2003 and 2020 can be partially attributed to the intensification of the tidal residual current eddy. The characteristic of the tidal-duration asymmetry has changed from half of flood dominant to fully flood dominant over the past 50 years. This has increased the risk of flooding. The profound and lasting impact of reclamation on the hydrodynamic environment of SMB reminds the local government to strengthen the dynamic monitoring of the bay and to implement adaptive management strategies for future reclamation projects.
Data availability statement
The raw data supporting the conclusions of this article will be made available by the authors, without undue reservation.
Author contributions
PS: Methodology, Visualization, Writing – original draft. WY: Conceptualization, Methodology, Writing – review & editing. XX: Validation, Visualization, Writing – review & editing. FZ: Visualization, Writing – review & editing.
Funding
The author(s) declare financial support was received for the research, authorship, and/or publication of this article. This research was funded by the National Key R&D Program of China (Grant No. 2023YFC3008100).
Acknowledgments
We are sincerely grateful to the two reviewers for their constructive comments.
Conflict of interest
The authors declare that the research was conducted in the absence of any commercial or financial relationships that could be construed as a potential conflict of interest.
Publisher’s note
All claims expressed in this article are solely those of the authors and do not necessarily represent those of their affiliated organizations, or those of the publisher, the editors and the reviewers. Any product that may be evaluated in this article, or claim that may be made by its manufacturer, is not guaranteed or endorsed by the publisher.
References
Cao D. F., Shen Y. M., Su M. R., Yu C. X. (2019). Numerical simulation of hydrodynamic environment effects of the reclamation project of Nanhui tidal flat in Yangtze Estuary. J. Hydrod. 31, 603–613. doi: 10.1007/s42241-019-0006-4
China Gulf History Compilation Committee (1992). China Gulf History (Vol. V) the Bay of Shanghai and northern Zhejiang Province (Beijing: China Ocean Press).
Chu N., Yao P., Ou S., Wang H., Yang H., Yang Q. (2022). Response of tidal dynamics to successive land reclamation in the Lingding Bay over the last century. Coast. Eng. 173, 104095. doi: 10.1016/j.coastaleng.2022.104095
Danish Hydraulic Institute (2012). “MIKE 21 and MIKE 3 flow model FM,” in Hydrodynamic and Transport Module Scientific Documentation. Available at: https://manuals.mikepoweredbydhi.help/2017/Coast_and_Sea/MIKE_321_FM_Scientific_Doc.pdf.
Gao G. D., Wang X. H., Bao X. W. (2014). Land reclamation and its impact on tidal dynamics in Jiaozhou Bay, Qingdao, China. Estuar. Coast. Shelf Sci. 151, 285–294. doi: 10.1016/j.ecss.2014.07.017
Gou X., Liang H., Cai T., Wang X., Chen Y., Xia X. (2023). The impact of coastline and bathymetry changes on the storm tides in Zhejiang coasts. J. Mar. Sci. Eng. 11, 1832. doi: 10.3390/jmse11091832
Huang P. Y., Hu H., Zhang M. M. (2019). “Cumulative effect of the perennial reclamation projects on water exchange in Sanmen Bay,” in IOP Conf. Ser: Earth Environ. Sci, Vol. 344. 012156, IOP Publishing. doi: 10.1088/1755-1315/344/1/012156
Lyu H., Zhang S., Song D., Bao X. (2021). The cummulative effect of land reclamation on hydrodynamics in Qinzhou Bay. Oceanol. Limnol. Sin. 52, 823–833. doi: 10.11693/hyhz20201200342
Li L., Guan W., Hu J., Cheng P., Wang X. H. (2018). Responses of water environment to tidal flat reduction in Xiangshan Bay: Part I hydrodynamics. Estuar. Coast. Shelf Sci. 206, 14–26. doi: 10.1016/j.ecss.2017.11.003
Lin M., Cai T., Wang X., Xia X. (2021). Temporal and spatial evolution characteristics of the coastline in Sanmen Bay, Zhejiang in past 100 years. J. Mar. Sci. 39, 47–55. doi: 10.3969/j.issn.1001-909X.2021.01.006
Liu G., Ji T., Wu G., Tian H., Yu P. (2024b). Cross-scale modeling of shallow water flows in coastal areas with an improved local time-stepping method. J. Mar. Sci. Eng. 12, 1065. doi: 10.3390/jmse12071065
Liu G., Ji T., Wu G., Yu P. (2024a). Improved Local Time-Stepping Schemes for Storm Surge Modeling on unstructured grids. Environ. Model. Software 179, 106107. doi: 10.1016/j.envsoft.2024.106107
Manda A., Matsuoka K. (2006). Changes in tidal currents in the Ariake Sound due to reclamation. Estuar. Coasts 29, 645–652. doi: 10.1007/BF02784289
Mu J. B., Huang S. C. (2013). Influence of tidal gate on hydrodynamic and sedimentary environment. Adv. Mat. Res. 726, 3434–3438. doi: 10.4028/www.scientific.net/AMR.726-731.3434
Pan Z., Liu H. (2020). Impact of human projects on storm surge in the Yangtze Estuary. Ocean Eng. 196, 106792. doi: 10.1016/j.oceaneng.2019.106792
Pawlowicz R., Beardsley B., Lentz S. (2002). Classical tidal harmonic analysis including error estimates in MATLAB using T_TIDE. Comput. Geosci. 28, 929–937. doi: 10.1016/S0098-3004(02)00013-4
Peng K., Yao Y., Chen Q. (2014). Cumulative response of tidal prism of Shipu Channel to reclamation projects in Sanmen Bay. Transac. Oceanol. Limnol. 1, 169–178. doi: 10.13984/j.cnki.cn37-1141.2014.01.013
Pritchard D. (2005). Suspended sediment transport along an idealised tidal embayment: settling lag, residual transport and the interpretation of tidal signals. Ocean Dyn. 55, 124–136. doi: 10.1007/s1023-005-0004-7
Sengupta D., Choi Y. R., Tian B., Brown S., Meadows M., Hackney C. R., et al. (2023). Mapping 21st century global coastal land reclamation. Earth's Future 11, e2022EF002927. doi: 10.1029/2022ef002927
Shi J. H., Li G., Wang P. (2011). Anthropogenic influences on the tidal prism and water exchanges in Jiaozhou Bay, Qingdao, China. J. Coast. Res. 27, 57–72. doi: 10.2112/JCOASTRES-D-09-00011.1
Song Z., Shi W., Zhang F., Wu Q., Yang B., Zhou Y., et al. (2017). Field observation and analysis on the characteristics of tidal dynamics in Sanmen Bay. J. Appl. Oceanogr. 36, 279–285. doi: 10.3969/J.ISSN.2095-4972.2017.02.015
Song D., Wang X. H., Kiss A. E., Bao X. (2011). The contribution to tidal asymmetry by different combinations of tidal constituents. J. Geophys. Res. 116, C12007. doi: 10.1029/2011JC007270
Sun Z., Huang S., Nie H., Jiao J., Huang S., Zhu L., et al. (2015). Risk analysis of seawall overflowed by storm surge during super typhoon. Ocean Eng. 107, 178–185. doi: 10.1016/j.oceaneng.2015.07.041
Sun Y.-J., Jalón-Rojas I., Wang X. H., Jiang D. (2018). Coastal upwelling by wind-driven forcing in Jervis Bay, New South Wales: a numerical study for 2011. Estuar. Coast. Shelf Sci. 206, 101–115. doi: 10.1016/j.ecss.2017.11.022
Walton T. L. J. (2002). Tidal velocity asymmetry at inlets rep., U.S. Army Eng. Res. and Dev. Cent. Vicksburg, Miss. Available at http://chl.erdc.usace.army.mil/library/publications/chetn/pdf/chetn-iv-47.pdf.
Willmott C. J. (1981). On the validation of models. Phys. Geogr. 2, 184–194. doi: 10.1080/02723646.1981.10642213
Wisha U. J., Al Tanto T., Pranowo W. S., Husrin S. (2018). Current movement in Benoa Bay water, Bali, Indonesia: pattern of tidal current changes simulated for the condition before, during, and after reclamation. Reg. Stud. Mar. Sci. 18, 177–187. doi: 10.1016/j.rsma.2017.10.006
Xie Y., Wu D. (2006). “Preliminary analysis on the influence of beach reclamation on the water dynamics and seabed of Sanmen Bay,” in Proceedings of the 2006 academic annual meeting of Hydraulic Society (Beach utilization and ecological protection) (Beijing: China Water & Power Press), 146–151.
Xu X. F., He Q. Q., Song D., Yang Z. L., Yu L. L. (2018). Comparison of hydrodynamic influence between different types of bay reclamations. J. Hydrod. 30, 694–700. doi: 10.1007/s42241-018-0075-9
Xu C., Zhou C., Ma K., Wang P., Yue X. (2021). Response of water environment to land reclamation in Jiaozhou Bay, China over the last 150 years. Front. Mar. Sci. 8. doi: 10.3389/fmars.2021.750288
Yanagi T., Onishi K. (1999). Change of tide, tidal current, and sediment due to reclamation in Tokyo Bay. Oceanog. Jpn. 8, 411–415. doi: 10.5928/kaiyou.8.411
Yang W., Feng X., Yin B. (2019). The impact of coastal reclamation on tidal and storm surge level in Sanmen Bay, China. J. Oceanol. Limnol. 37, 1971–1982. doi: 10.1007/s00343-019-8247-1
Yang Q., Hu S., Fu L., Zhang P., Chu N., Liu F., et al. (2022). Responses of tidal duration asymmetry to morphological changes in Lingding Bay of the Pearl River Estuary. Front. Mar. Sci. 9. doi: 10.3389/fmars.2022.983182
Yao Y., Zhu J., Li L., Wang J., Yuan J. (2022). Marine environmental capacity in Sanmen Bay, China. Water. 14, 2083. doi: 10.3390/w14132083
Yuan Y., Jalón-Rojas I., Wang X. H. (2021). Response of waterexchange capacity to human interventions in Jiaozhou Bay, China. Estuar. Coast. Shelf Sci. 249, 107088. doi: 10.1016/j.ecss.2020.107088
Keywords: Sanmen Bay, land reclamation, coastline and bathymetry changes, residual current, water exchange, tidal asymmetry
Citation: Shi P, Yang W, Xu X and Zhang F (2024) Response of hydrodynamic environment to land reclamation in Sanmen Bay, China over the last half-century. Front. Mar. Sci. 11:1448565. doi: 10.3389/fmars.2024.1448565
Received: 13 June 2024; Accepted: 05 August 2024;
Published: 26 August 2024.
Edited by:
Yifei Zhao, Nanjing Normal University, ChinaReviewed by:
Guoxiang Wu, Ocean University of China, ChinaXingru Feng, Chinese Academy of Sciences (CAS), China
Copyright © 2024 Shi, Yang, Xu and Zhang. This is an open-access article distributed under the terms of the Creative Commons Attribution License (CC BY). The use, distribution or reproduction in other forums is permitted, provided the original author(s) and the copyright owner(s) are credited and that the original publication in this journal is cited, in accordance with accepted academic practice. No use, distribution or reproduction is permitted which does not comply with these terms.
*Correspondence: Wankang Yang, eWFuZ3dhbmthbmdAMTI2LmNvbQ==