- National Coral Reef Institute, Nova Southeastern University, Dania Beach, FL, United States
The unprecedented mortality of stony corals on Florida’s Coral Reef from stony coral tissue loss disease (SCTLD) was mitigated on some priority sites and corals through the use of a topical amoxicillin paste to halt disease lesion progression. One management concern about the use of antibiotics on these corals was the impact it may have on gametogenesis. We used histology to assess gametogenesis within Orbicella faveolata and Montastraea cavernosa samples from six sites and across three treatment groups. The sites covered the geographic regions of the Florida Keys, including both inshore and offshore habitats. The treatment groups were: healthy corals, samples adjacent to active SCTLD lesions, and samples adjacent to previous SCTLD lesions that were halted by topical amoxicillin. Across both species, colonies from all sites and treatment groups were producing normal oocytes and spermaries. For M. cavernosa, gametogenesis metrics did not differ among treatment groups. Among O. faveolata colonies, healthy corals exhibited higher fecundity and higher oocyte presence than treated corals and larger oocytes than diseased corals. However, of the treated corals, those which had been treated more frequently had higher fecundity than those that were treated less frequently, suggesting that diminished fecundity throughout the group may have been the result of disease occurring earlier in gametogenesis rather than the treatment itself. Fecundity of O. faveolata colonies in the diseased group was highly dependent on whether the corals were from nearshore or offshore environments. The relationship between disease, treatment, and habitat warrants further examination, but we show that amoxicillin treatments do not prevent gametogenesis in corals.
1 Introduction
Coral colonies can live for hundreds of years, but the perpetuity of coral reef ecosystems depends on colony longevity and on successful sexual reproduction as new coral settlers are needed to replace lost adults. As coral reefs continue to come under increasing pressures from climate change, increased disease prevalence/severity, deteriorating water quality, and other stressors, novel genetic recombination arising from sexual reproduction is necessary to maintain genetic diversity and potentially create genotypes with increased resistance to these stressors. However, factors influencing corals’ ability to reproduce are still poorly studied. Efforts to promote successful reproduction of corals continue to expand, and include land-based assisted fertilization, field-based gamete collection and fertilization, and the development of field-based spawning hubs that bring individuals closer together in order to increase the probability of successful reproduction. Here we examine two factors that may impact the ability of corals to undergo gametogenesis: 1) the presence of stony coral tissue loss disease (SCTLD) lesions and the amoxicillin treatments used to prevent resultant mortality, and 2) geographic differences, including inshore/offshore variation as well as site-specific differences.
The geology of reefs in the Florida Keys includes an offshore bank-barrier reef, ranging from 6.5 to 10.5 km offshore, characterized by spur-and-groove formations. Between this offshore reef and the Keys archipelago, there are thousands of small inshore patch reefs. Overall, coral cover, density, species diversity, and calcification rates are higher on inshore reefs than offshore reefs (Lirman and Fong, 2007; Manzello et al., 2015). These characteristics make it probable that if gametogenesis and spawning are equal across inshore and offshore colonies, then the inshore reefs are more likely to have higher fertilization and thus contribute more to coral planulae available for settlement. However, most spawning observations in the Florida Keys have been on offshore reefs, and it is unknown whether these inshore corals are even capable of gametogenesis. Another reef invertebrate, the queen conch Strombus gigas, has been found to lack gonad development at inshore reefs, and transplant experiments between inshore and offshore individuals have identified differing environmental conditions, rather than genetic factors, to be the culprit (Delgado et al., 2004). Inshore and offshore reefs are subject to different stressors, with nutrient levels, turbidity, and temperature extremes generally decreasing as distance from the shore increases (Lirman and Fong, 2007). While all corals along Florida’s Coral Reef are subject to what has seemingly become routine heat stress, inshore reefs suffer from a higher number of heat stress days when compared to offshore reefs (Manzello, 2015), and inshore reefs showed notable paling/bleaching each summer from 2019-2022 (Neely lab, pers. obs.) while offshore reefs did not. Despite this, the inshore reefs show a quicker rate of recovery following heat stress and a higher calcification rate in these circumstances which may contribute to persistence of inshore coral reef cover (Manzello et al., 2015). In this study, we sampled a variety of inshore and offshore reefs to determine whether gametogenesis varied between reef types.
Another factor which may influence the ability of corals to undergo gametogenesis is SCTLD and/or the in-water treatments used to halt SCTLD lesions. Stony coral tissue loss disease spread through Florida’s Coral Reef (FCR) following its first documentation near Miami in late 2014 (Precht et al., 2016). At least 20 species of coral, including primary reef-building and Endangered Species Act-listed species, are susceptible to rapidly progressing lesions that often result in whole colony mortality (Hawthorn et al., 2024). Beginning in 2017, SCTLD spread beyond Florida and continued to spread through the Caribbean, causing significant declines in coral cover, species diversity, and colony density (Alvarez-Filip et al., 2022).
The unprecedented and devastating nature of SCTLD prompted the development of in-water treatments to halt active SCTLD lesions and prevent colony mortality. Amoxicillin mixed in a proprietary paste called Base2b is applied topically to active lesions and has been shown to halt SCTLD lesions with high efficacy (Neely et al., 2020, 2021; Shilling et al., 2021; Walker et al., 2021) As of March 2024, over 4800 corals in the Florida Keys were treated with the amoxicillin paste, with a four-year survival rate of 92% (Neely, 2023). However, the antibiotic treatment is not prophylactic, and some colonies develop new lesions after treatment. As such, corals treated in the Florida Keys were monitored every two months and, for those developing new lesions, additional treatments were applied. Despite gametogenesis and spawning in treated corals being repeatedly observed (B. Walker, K. O’Neil, H. Koch, pers comm; Renegar et al. (2024)), regulatory concerns about potentially negative effects of these amoxicillin treatments on reproduction persist.
In this study, we assessed gametogenesis in hermaphroditic Orbicella faveolata and gonochoric Montastraea cavernosa colonies from six sites. We histologically compared tissues from healthy colonies with those directly adjacent to active SCTLD lesions and those directly adjacent to previously-diseased, amoxicillin-treated tissues to determine whether SCTLD and/or antibiotic treatments impacted gametogenesis. The metrics utilized to assess reproductive status were the percent presence of gametes (oocytes and spermaries), polyp fecundity, and maximum oocyte diameter. Understanding the impacts of SCTLD and amoxicillin treatments on reproductive capacity is important to inform treatment protocols and support best management practices.
2 Methods
2.1 Sample collection
Multi-year disease intervention work and semi-monthly monitoring of Orbicella faveolata and Montastraea cavernosa colonies across the Florida Keys provided patient histories of corals exhibiting SCTLD and receiving treatments across a multitude of reefs. Three paired inshore patch reef and offshore fore-reef sites were selected from the Upper, Middle, and Lower Keys regions (Figure 1). The six reef locations were: Molasses Reef, Sombrero Reef, Looe Key, Cheeca Rocks, Marker 48, and Newfound Harbor. All sites were between 3 and 8 meters in depth.
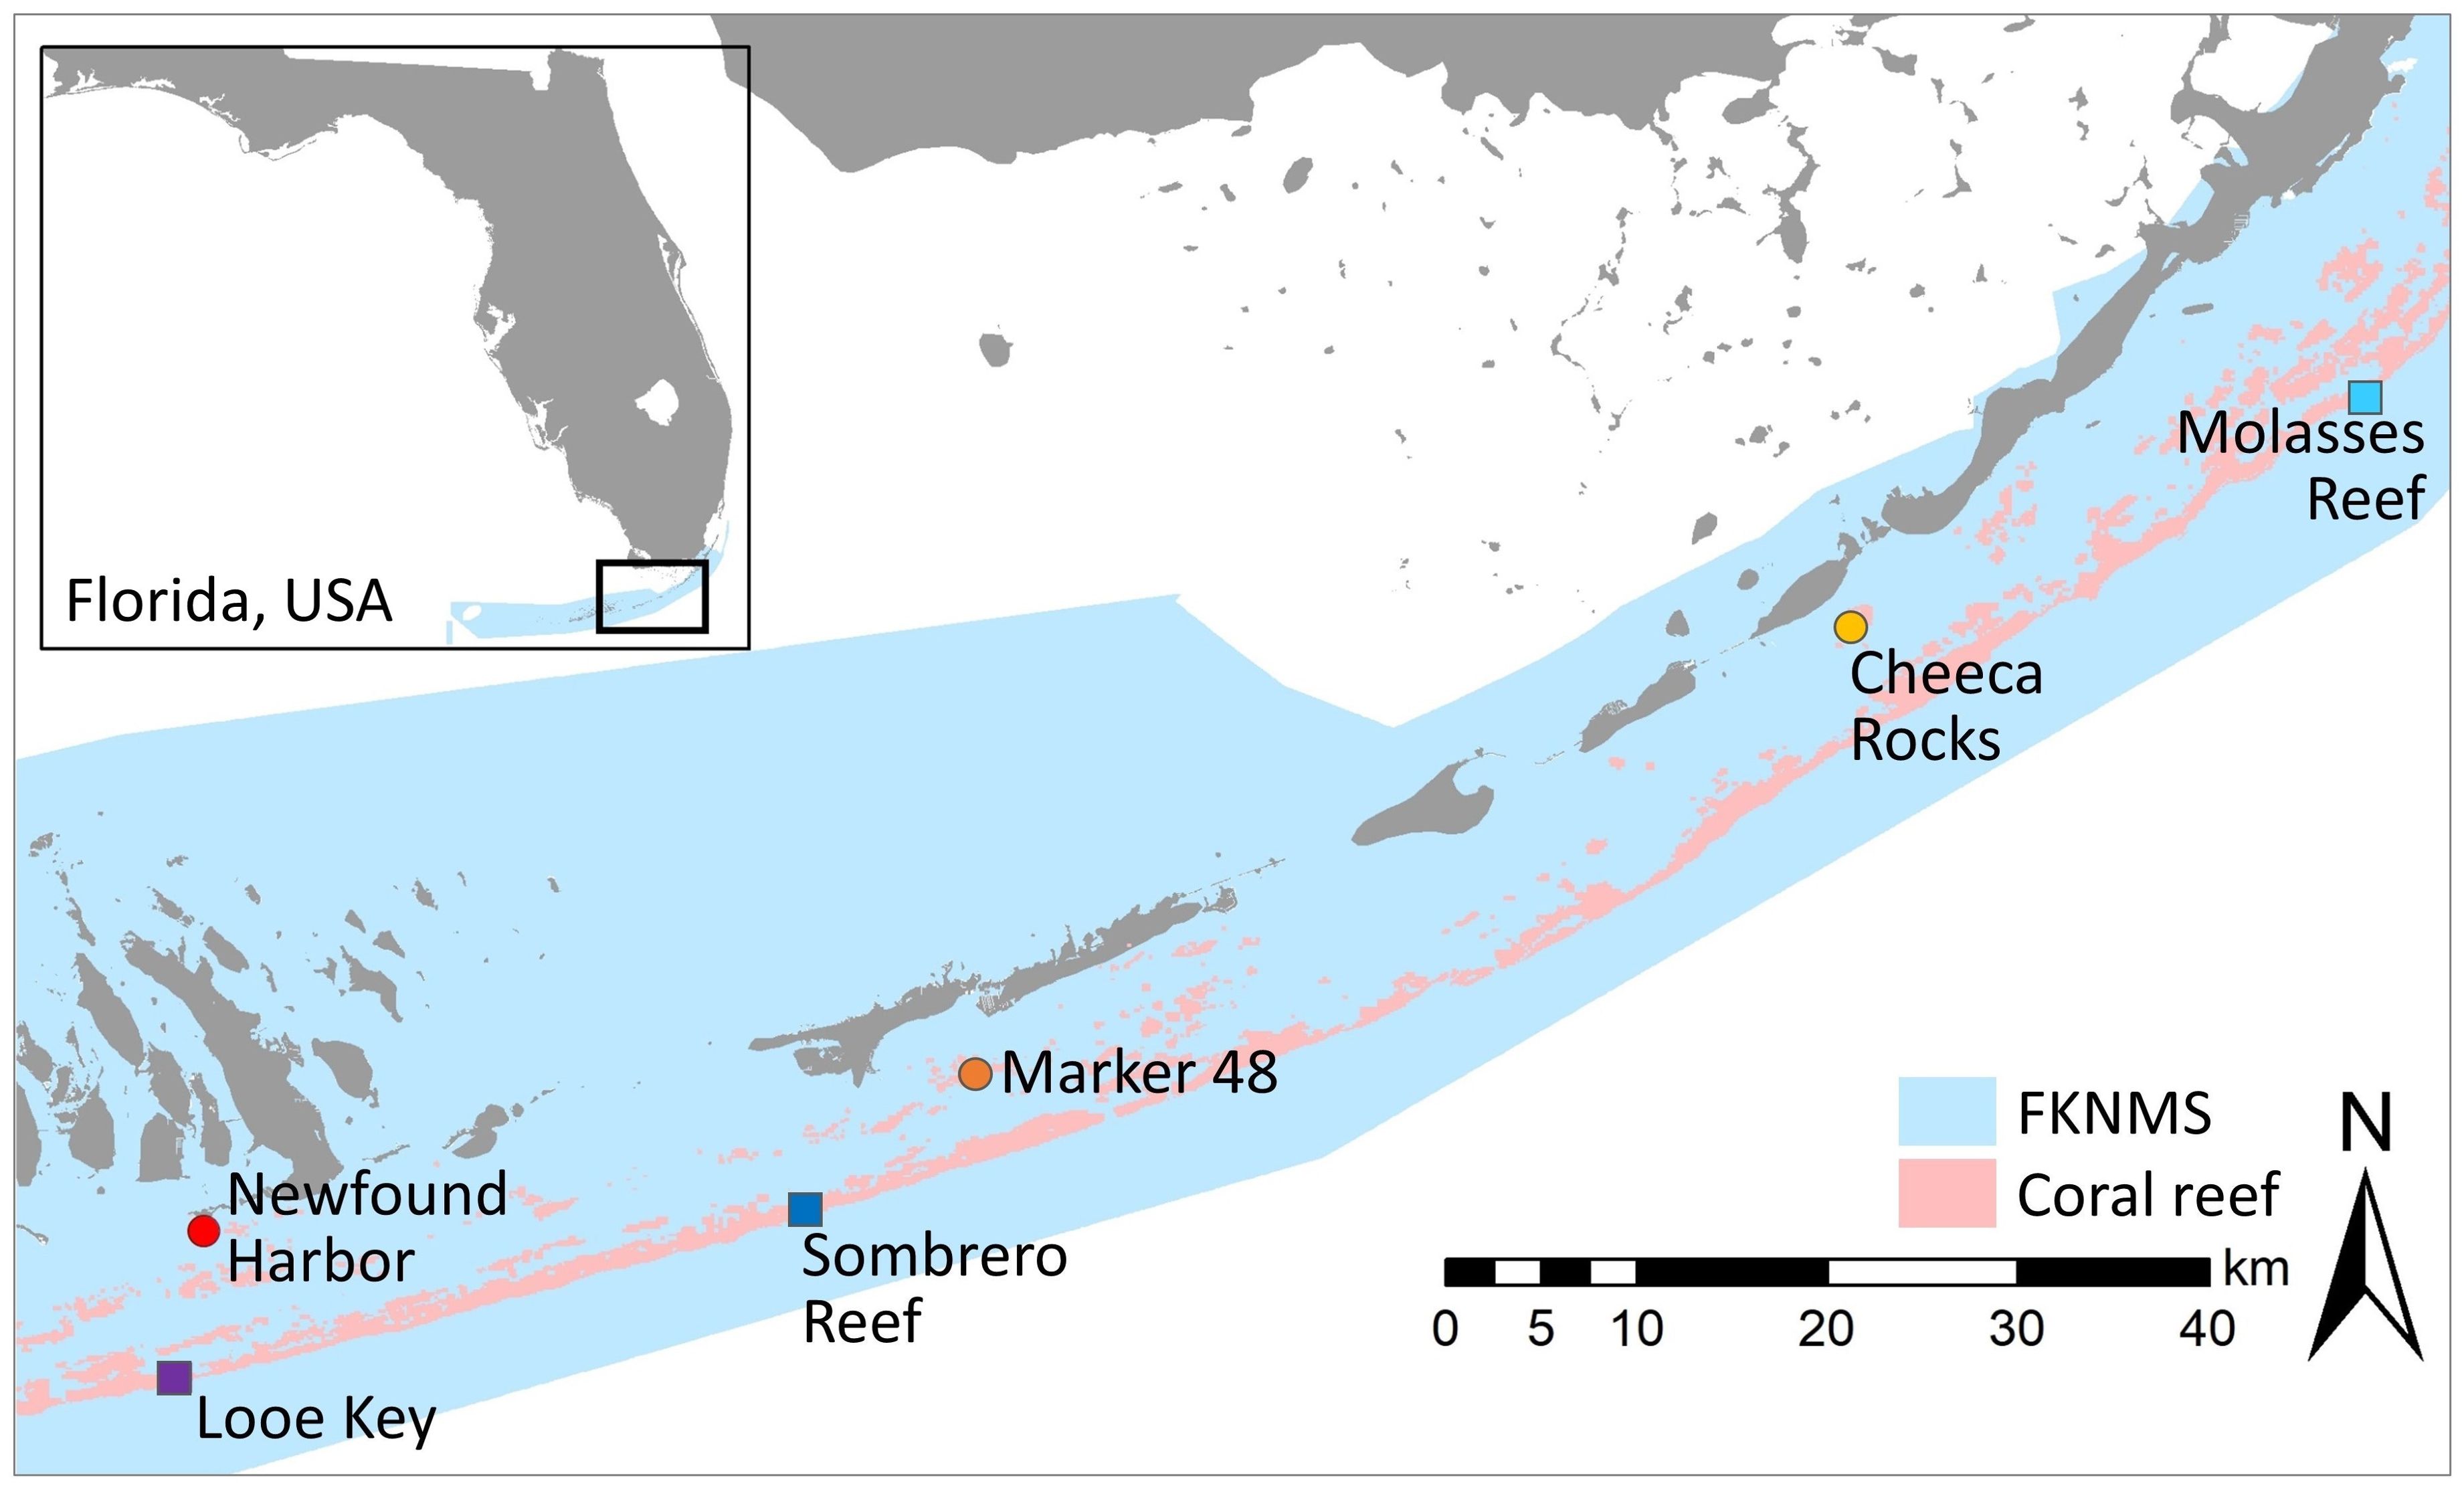
Figure 1. Map identifying the three inshore and three offshore reefs within the Florida Keys National Marine Sanctuary where histological samples were taken. Inshore reefs are warm-tone circles; offshore reefs are cool-tone squares.
The six study sites were part of long-term disease intervention work (Neely et al., 2021). Corals at four of the sites (Molasses, Sombrero, Looe, and Newfound Harbor) had been under a treatment and monitoring regime since early 2019; corals at Marker 48 and Cheeca Rocks had been monitored and treated as needed since early 2020. From those respective start dates, sites were visited every two months, and all SCTLD-affected corals were tagged, mapped, and treated for SCTLD using the standard topical Base2b + amoxicillin. The disease and treatment history of each tagged coral at each site was thus documented, allowing for health histories to be used in classifying corals for sampling (Supplementary Figure S1). Corals were identified from treatment histories as:
1. Healthy, defined as a coral that had never been observed with SCTLD and had never been treated. Though these corals did not have targeted monitoring data before this experiment, we presume they have been unaffected because a) they were chosen for their largely intact coral cover and lack of unusual live/dead tissue margins and b) their location on the reef among other tagged colonies would have made SCTLD lesions during any previous monitoring apparent and they would have thus been tagged and treated.
2. Actively diseased, defined as a coral with actively progressing SCTLD lesion(s) during the time of sampling, but which had never previously been observed with lesions or been treated. Lesions were a mix of acute and sub-acute, but all had at least 1cm of recent mortality.
3. Treated, defined as a coral that was not currently affected by SCTLD but had been treated with topical amoxicillin for SCTLD lesions in the past. Treated corals had generally received their most recent treatment within six months of the sampling date, however, three O. faveolata colonies and one M. cavernosa colony in the “treated” group had received their most recent treatment over a year prior to sampling. Analyses were conducted both with and without these outlier colonies. All results exhibited the same statistical trends, and so the analyses detailed here were run with all treated samples. See Supplementary Figure S1 for full treatment histories of each coral.
The sampling goal was to collect 5 samples of each species in each treatment group from each of the six sites, for a total of 180 samples evenly divided between the two species and treatment groups (Figure 2). Though M. cavernosa is a gonochoric species and was predicted to thus yield lower sample sizes for most reproductive metrics, logistical and permitting considerations necessitated equal core numbers between species. At some sites (particularly Molasses Reef which had few remaining live coral colonies), it was not possible to collect all desired samples. In total, 81 O. faveolata and 65 M. cavernosa samples were collected in the weeks leading up to predicted spawning in August 2022 (between 08/04/2022 - 08/14/2022). This late-stage collection was done to assess fecundity, gamete presence, and oocyte size at the end of gametogenesis.
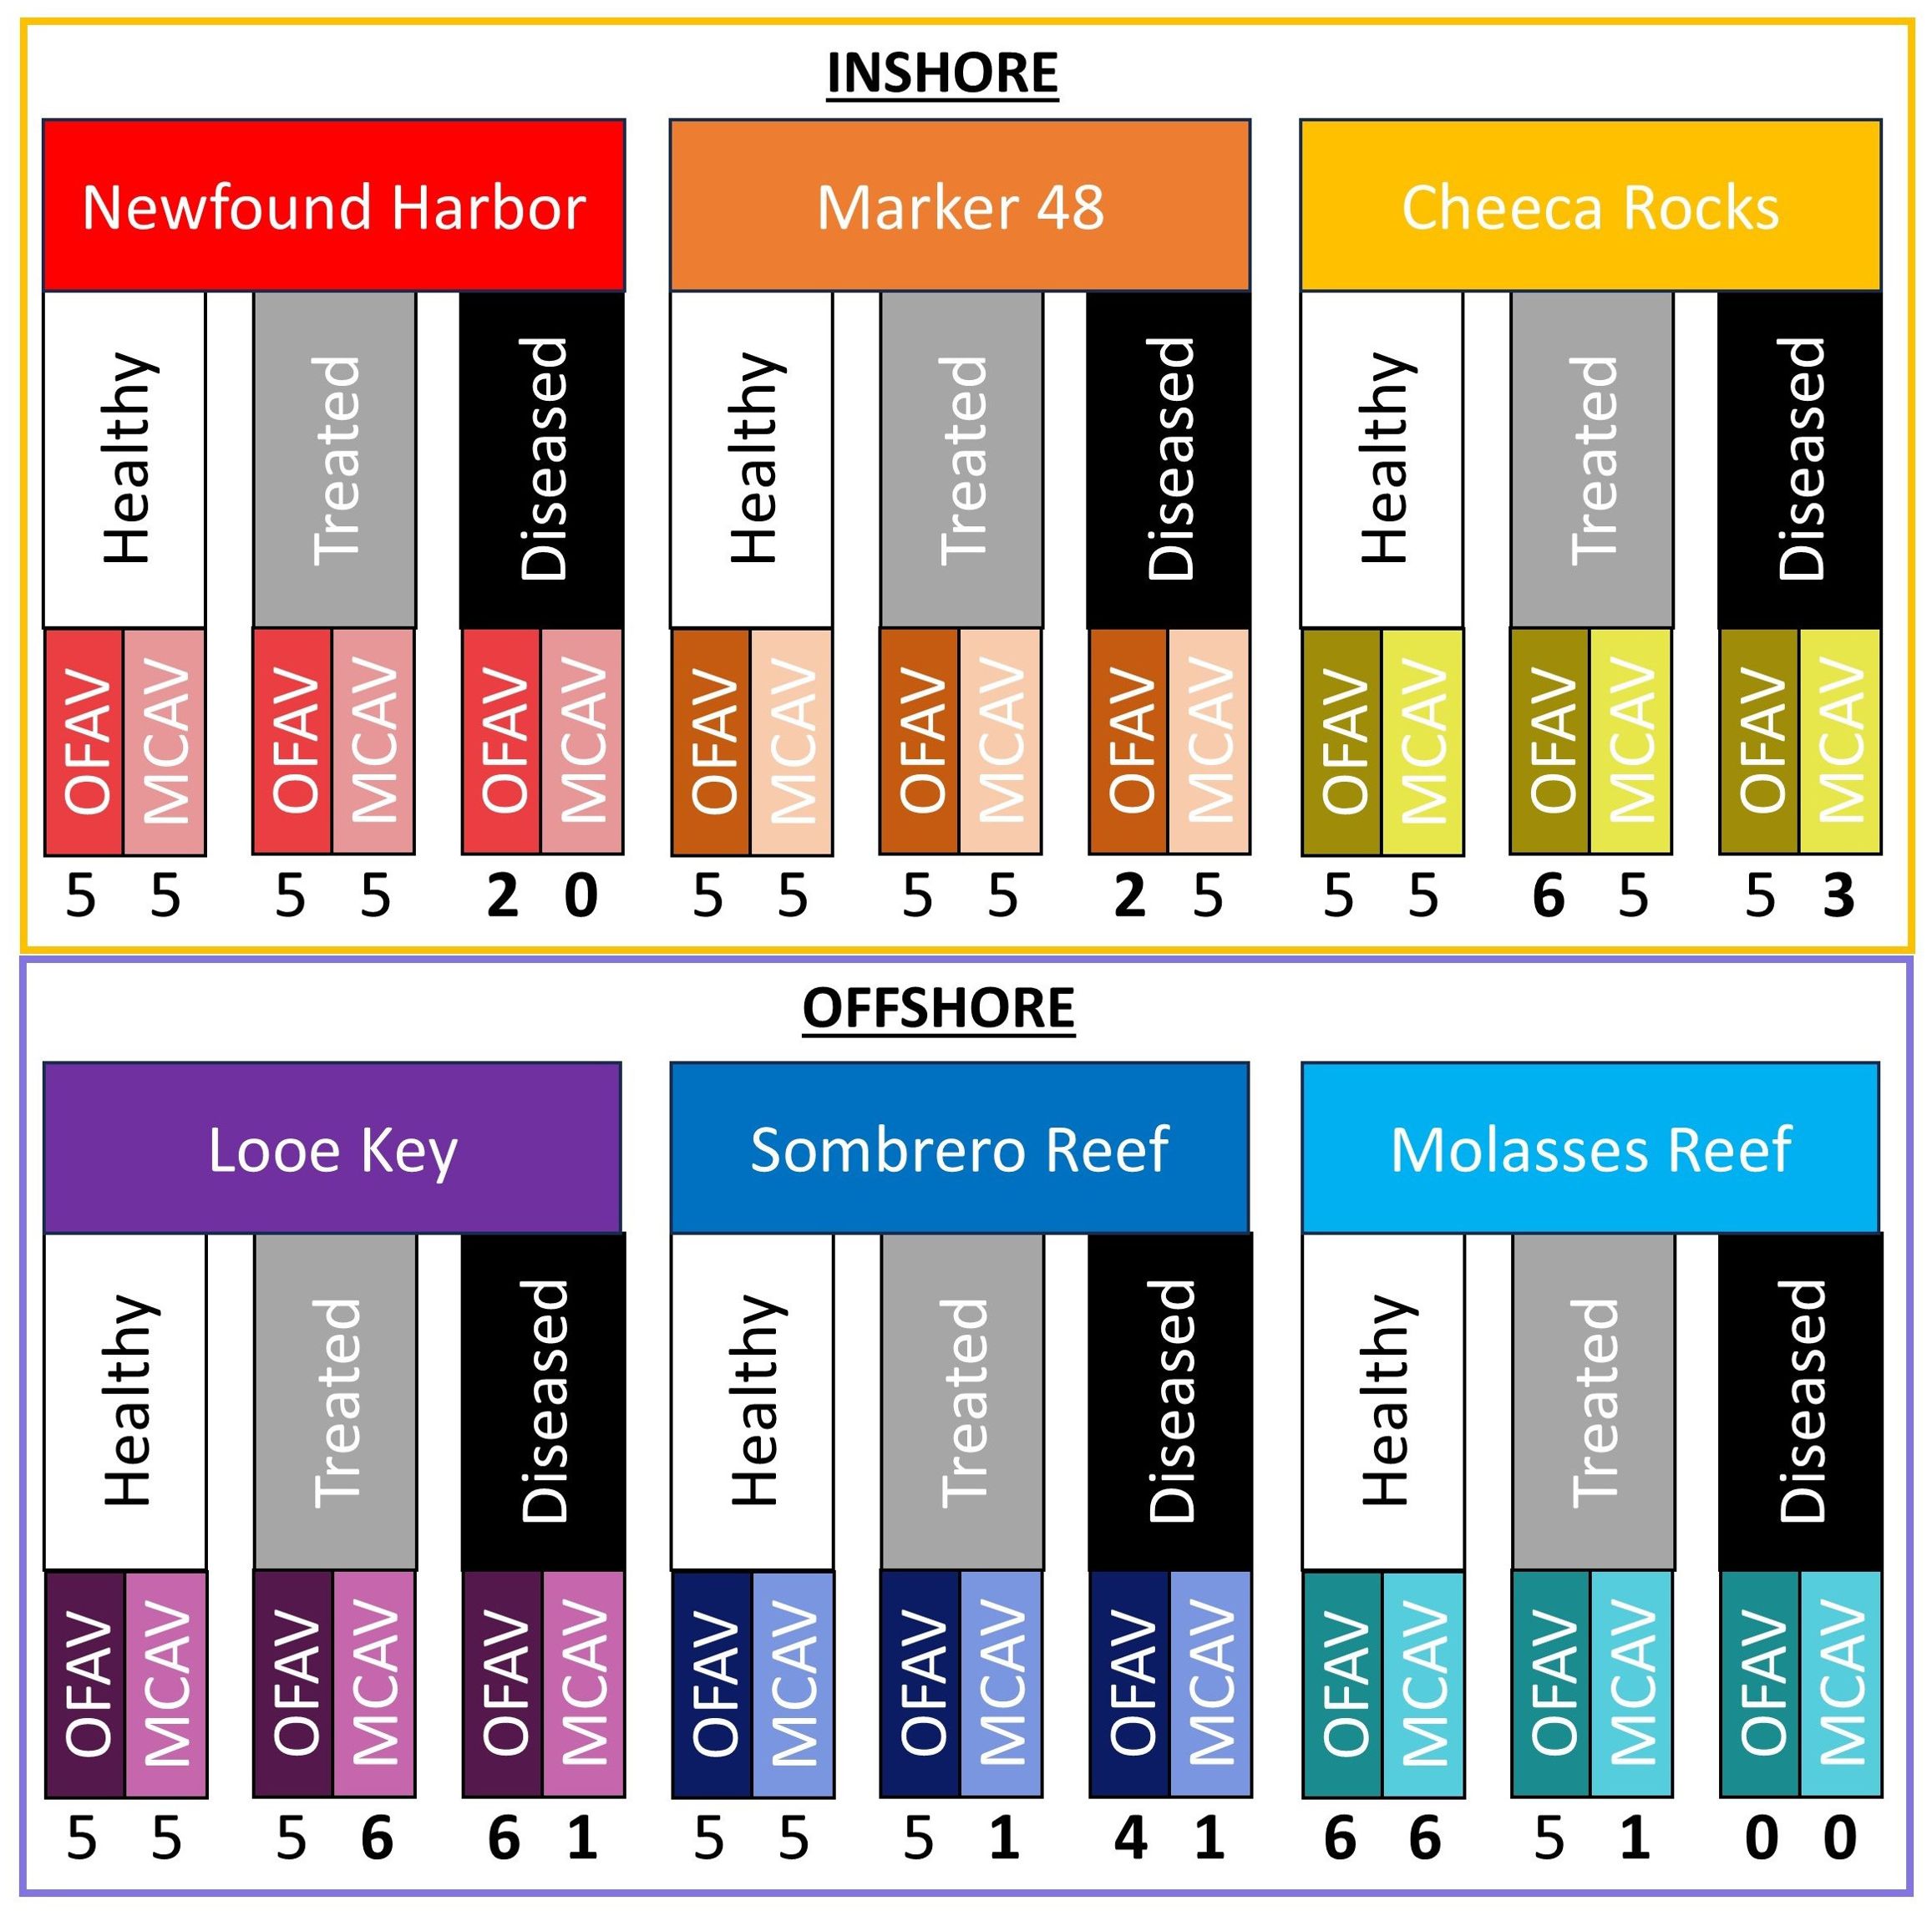
Figure 2. Study design showing sample size across the two species (OFAV, Orbicella faveolata; MCAV, Montastraea cavernosa), three health statuses (healthy, treated, diseased), and six reef locations (three inshore and three offshore). Numbers in bold represent deviations from the planned five samples, which was largely driven by the lack of actively diseased colonies at some sites.
Divers took samples from the sides of colonies using a diamond tipped 2 cm hole saw attached to an underwater drill (Nemo 5M). On actively diseased corals, samples were taken adjacent to the active disease lesion. On treated corals, cores were taken adjacent to the previously-treated tissue area. Upon removal from the colony, cores were placed in labeled Whirlpak sample bags with small holes punched throughout and immediately transferred to 10% zinc-buffered formalin (Z-fix, prepared in seawater and kept in a cooler) when brought to the surface.
2.2 Histology
Histological preparation of tissue samples took place in the Nova Southeastern University Coral Histology Laboratory. Samples were rinsed and decalcified in a 5% HCl/ethylenediamine tetra acetic acid (EDTA) seawater solution, dehydrated in a graded series of ethanols and xylene, and embedded in paraffin wax (Paraplast Plus). Longitudinal and transverse sections (4 µm) were made with a Leica RM 2235 microtome, floated on a warm water bath to flatten, and mounted on slides. A total of 5 slides were prepared for each sample, with sections collected at 5 different tissue depths. Because of the difference in polyp size between species, sections were separated by 100µm for O. faveolata and 300 µm for M. cavernosa. Sections were cleared in xylene, stained with modified Heidenhain’s aniline blue, and mounted using Cytoseal 60. Stained slides were viewed with an Olympus BX 43 light microscope at magnifications ranging from 4X to 60X and photographed with an Olympus DP21 digital camera.
Histological sections were assessed for three metrics of reproductive capacity and gametogenesis: 1) percent presence of gametes, 2) polyp fecundity, and 3) oocyte maximum diameter. Assessment of these reproductive metrics in relationship to treatment group (healthy, diseased, and treated), habitat (inshore, offshore) and site (offshore: Looe, Sombrero, and Molasses; inshore: Newfound, Marker 48, and Cheeca Rocks) were carried out for both O. faveolata and M. cavernosa.
For the hermaphroditic O. faveolata, presence of both ovaries and spermaries were assessed for each colony (Figures 3A, B). For the gonochoric M. cavernosa, only ovaries or spermaries were expected for each colony (Figures 3C, D). The percentage of colonies with spermaries and with ovaries was compared among treatments, sites, and habitats.
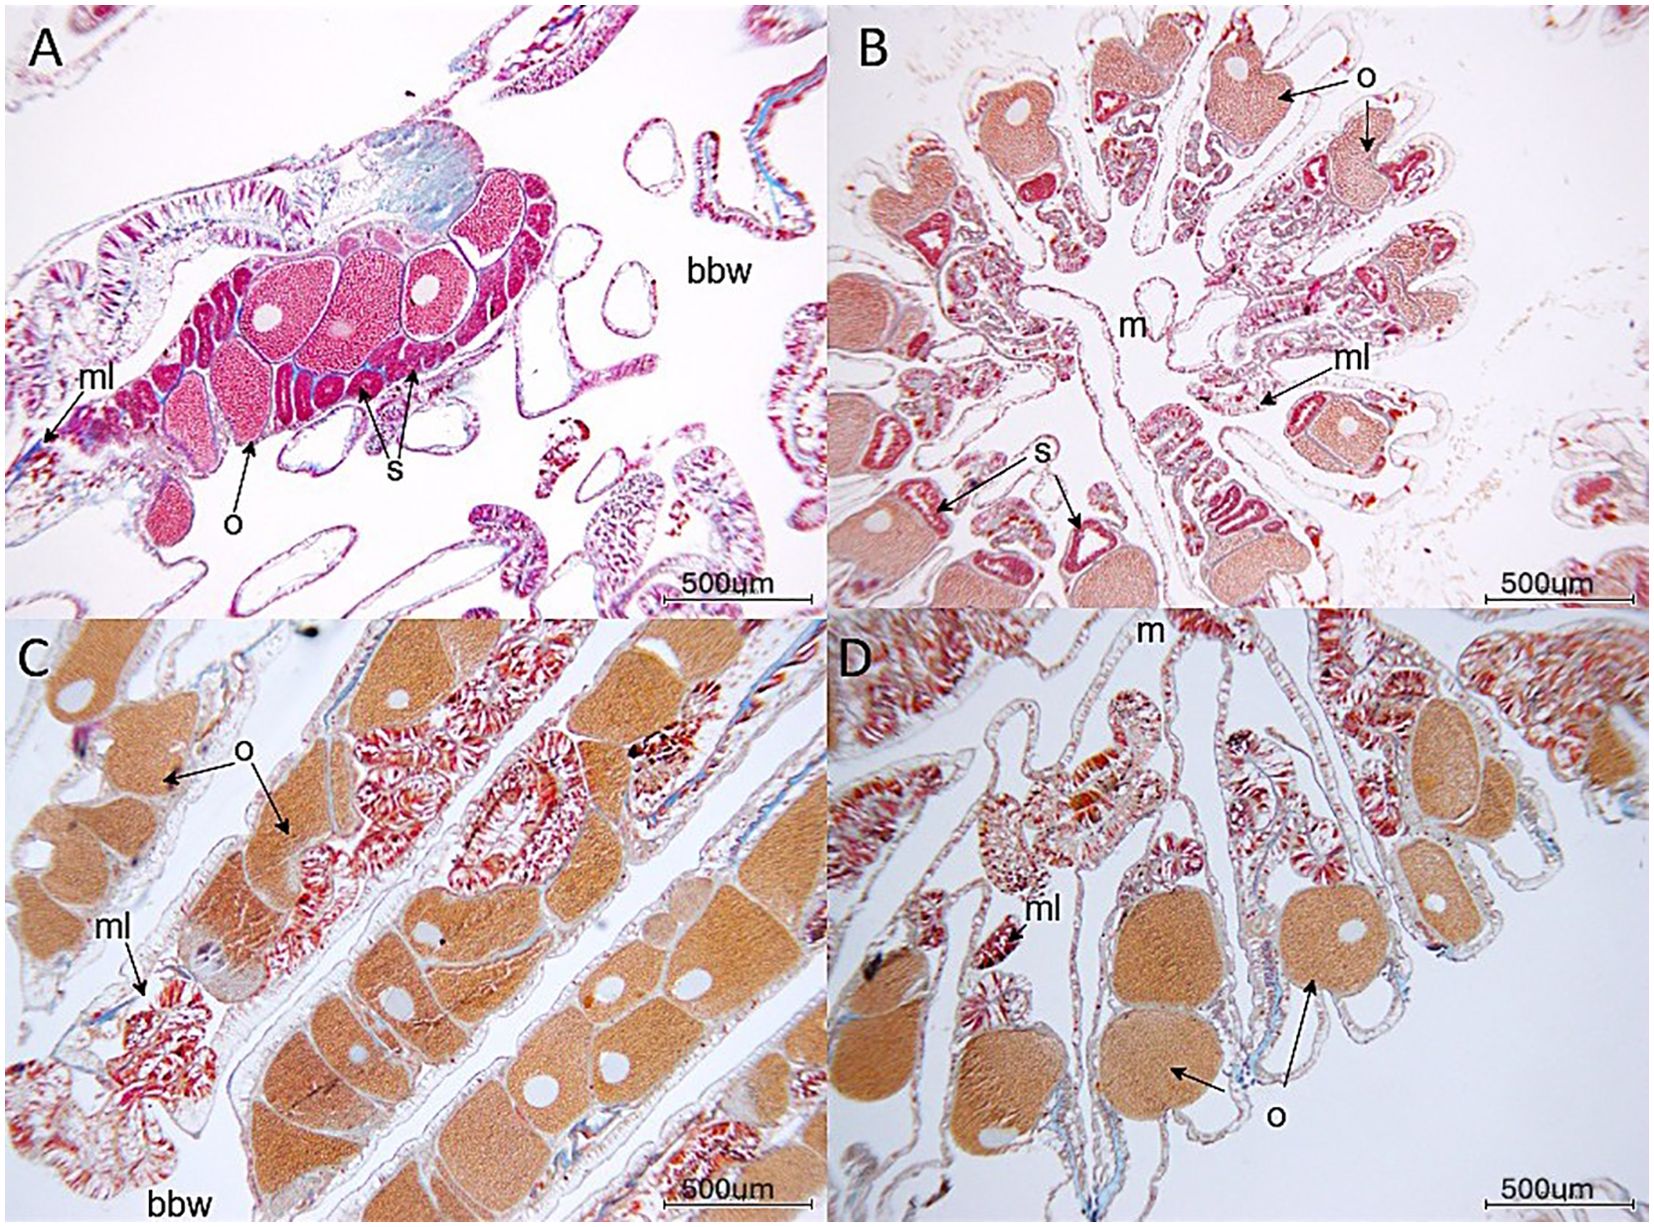
Figure 3. Gametes in (A) Orbicella faveolata (longitudinal section through polyp), (B) Orbicella faveolata (cross section through polyp), (C) Montastraea cavernosa (longitudinal section through polyp) and (D) Montastraea cavernosa (cross section through polyp). o, oocyte; s, spermary; ml, mesenterial lining; bbw, basal body wall in longitudinal sections; m, mouth/oral region. Slide photographs were taken of mid-depth sections of the polyps.
Fecundity per polyp was estimated as the product of the average number of gonads per polyp in cross-section for 5-10 polyps per sample and the average number of oocytes or ova per gonad in longitudinal section for 3-5 polyps per sample.
The maximum diameter of each complete oocyte (defined as those with visible nuclei) was assessed from micrographs using ImageJ (Image J with 68-bit Java 8, Version 1.53u 2022). A total of 1682 complete oocytes were measured for O. faveolata, and a total of 1006 for M. cavernosa.
2.3 Analyses
To compare the proportion of colonies containing oocytes, containing spermaries, or containing no gametes across treatments, sites, and/or habitats, we used Fisher’s exact tests and pairwise comparisons to determine post-hoc differences. A binomial generalized linear model (GLM) was used to determine treatment:site interactions for presence and absence data.
Fecundity data did not meet the Shapiro-Wilk normality assumptions nor the Bartlett assumptions for homogeneity of variances, so a log transformation was applied, and differences among treatment groups and sites were compared using Welch’s ANOVA. Post-hoc analyses were done with Games-Howell tests. Comparisons of fecundity between habitats (inshore/offshore) were assessed with a Welch’s t-test. Tests for O. faveolata fecundity were conducted both with and without the inclusion of empty (non-fecund) colonies, and both sets of results are reported. When only healthy colonies were analyzed for location and site differences, normality assumptions were met, and we used traditional ANOVA tests.
Maximum oocyte diameter data did meet all assumptions. We used a standard t-test to compare diameters between inshore/offshore habitats and used One-Way ANOVAs to compare diameters between treatment groups and between sites. Post-hoc Tukey’s tests examined pairwise comparisons. All statistical analyses were conducted in R Studio version 4.1.1 (R Core Team, 2013). Analyses of the two species were conducted separately.
Because fecundity of treated O. faveolata colonies was lower than that of healthy colonies, we further explored the relationships between fecundity and treatment history by evaluating relationships between the number of oocytes per polyp (fecundity) and 1) the total number of times the coral had been treated, 2) the number of times the coral had been treated in the past year, and 3) the number of days since last treatment. We assessed these relationships with linear regressions.
3 Results
3.1 Orbicella faveolata
3.1.1 Presence/absence of gametes
Oocytes were present in 94% of healthy corals, 68% of treated corals, and 68% of diseased corals (Figure 4A). These differences among treatments were significant (Fisher’s exact test: p = 0.03); a higher proportion of healthy corals contained oocytes compared to treated corals (post-hoc pairwise: p = 0.02), but diseased corals did not differ significantly from either healthy or treated corals. Spermaries were present in 94% of healthy corals, 84% of treated corals, and 74% of diseased corals (Figure 4B); none of these groups varied significantly from any others (p = 0.29).
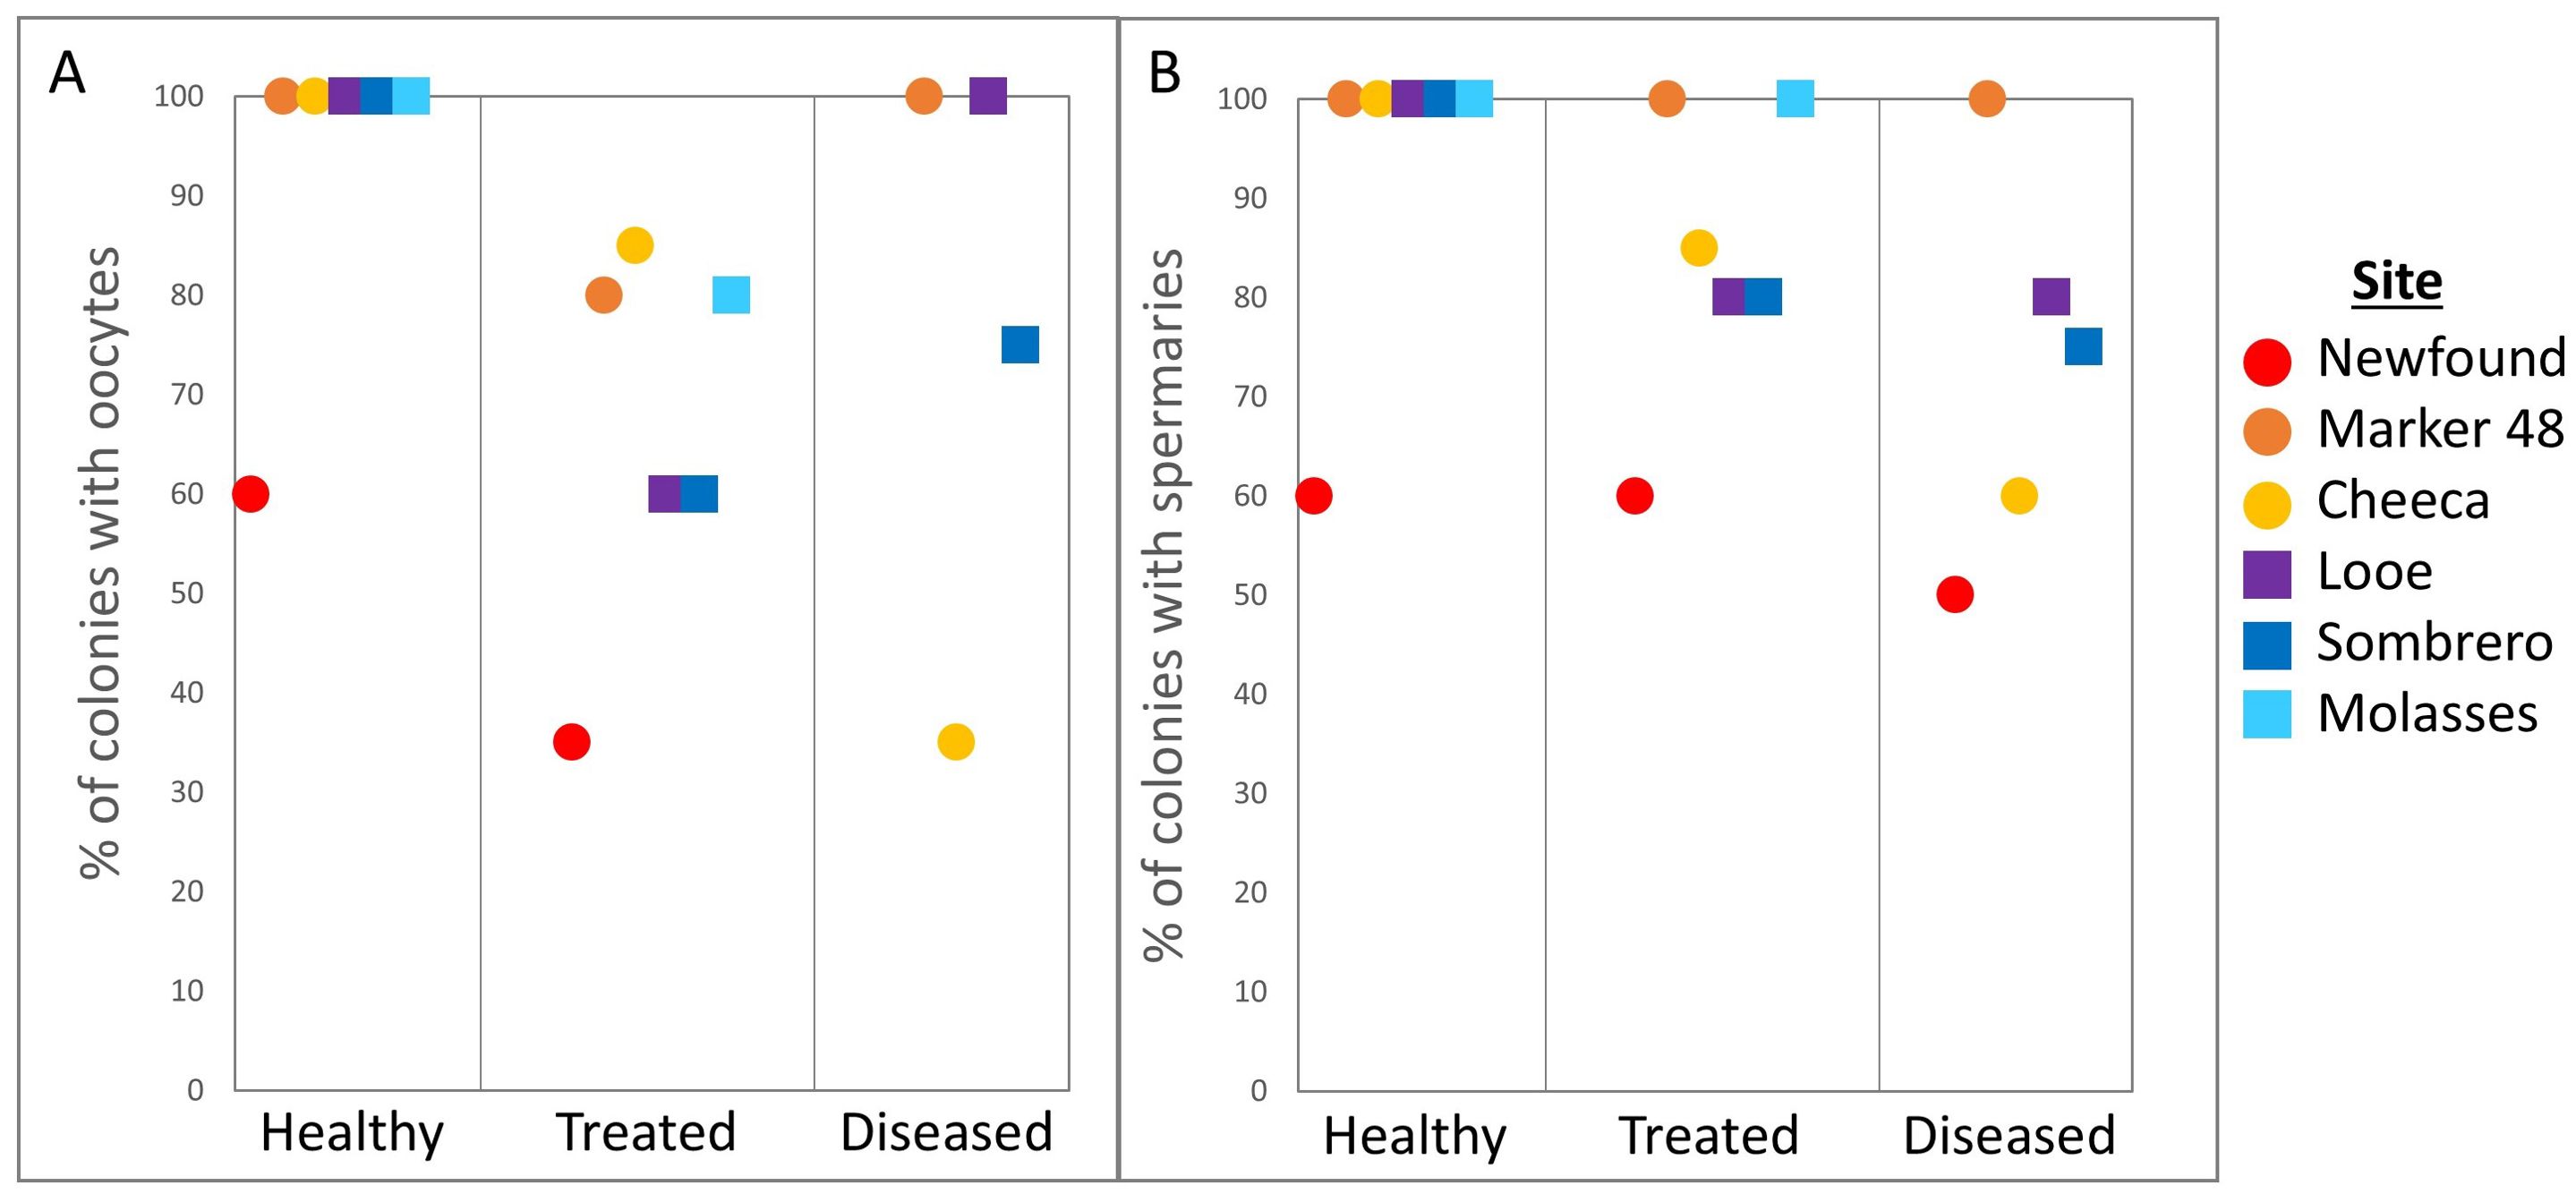
Figure 4. Percentage of Orbicella faveolata colonies containing (A) oocytes and (B) spermaries across treatments and sites.
Across all inshore sites, oocytes were present in 70% of coral colonies, and spermaries were present in 80%. Across offshore sites, 85% of colonies contained oocytes and 90% contained spermaries. These inshore/offshore differences were not significant (oocyte p = 0.1, spermary p = 0.2).
Comparisons of the proportion of colonies containing spermaries among the six reef sites yielded no significant differences (p = 0.06). However, the proportion of corals containing oocytes nearly reached the α-value for differences between sites (p = 0.051) and encouraged pairwise testing. The proportions of coral containing oocytes was smaller at Newfound Harbor (45%) than at Marker 48 (92%, post-hoc pairwise: p = 0.03), Looe Key (88%. p = 0.02), and Molasses (91%. p = 0.03).
No significant treatment:site interactions existed for either oocyte presence or spermary presence. A binomial GLM was additionally conducted for oocyte presence and confirmed that “healthy” as a treatment group was a positive significant predictor of presence (p = 0.02) while “Newfound’’ as a site was a negative significant predictor of oocyte presence (p = 0.03). The binomial GLM for spermary presence did not differ from the Fisher’s exact test results, confirming that neither treatment nor site were significant predictors.
3.1.2 Fecundity
Average polyp fecundity for O. faveolata ranged from 0 – 97.5 oocytes per polyp (Figure 5). Treatment type significantly affected fecundity (Welch’s ANOVA: F(2,41.37) = 9.1, p < 0.001). Polyp fecundity in healthy corals (55.3 ± 6.5 oocytes/polyp) was significantly higher than in treated corals (21.2 ± 4.5 oocytes/polyp. Games-Howell: p <0.001). Diseased coral fecundity averaged 34.8 (± 9.3) oocytes/polyp and did not differ significantly from healthy or treated colonies (Games-Howell: all p > 0.05). These patterns were true even if empty corals were removed from analyses; treatment groups differed significantly (Welch’s ANOVA: F(2, 27.66) = 5.8, p = 0.007), healthy corals had higher fecundity than treated corals (Games-Howell: p = 0.005), and diseased coral fecundity did not differ from that of healthy or treated colonies.
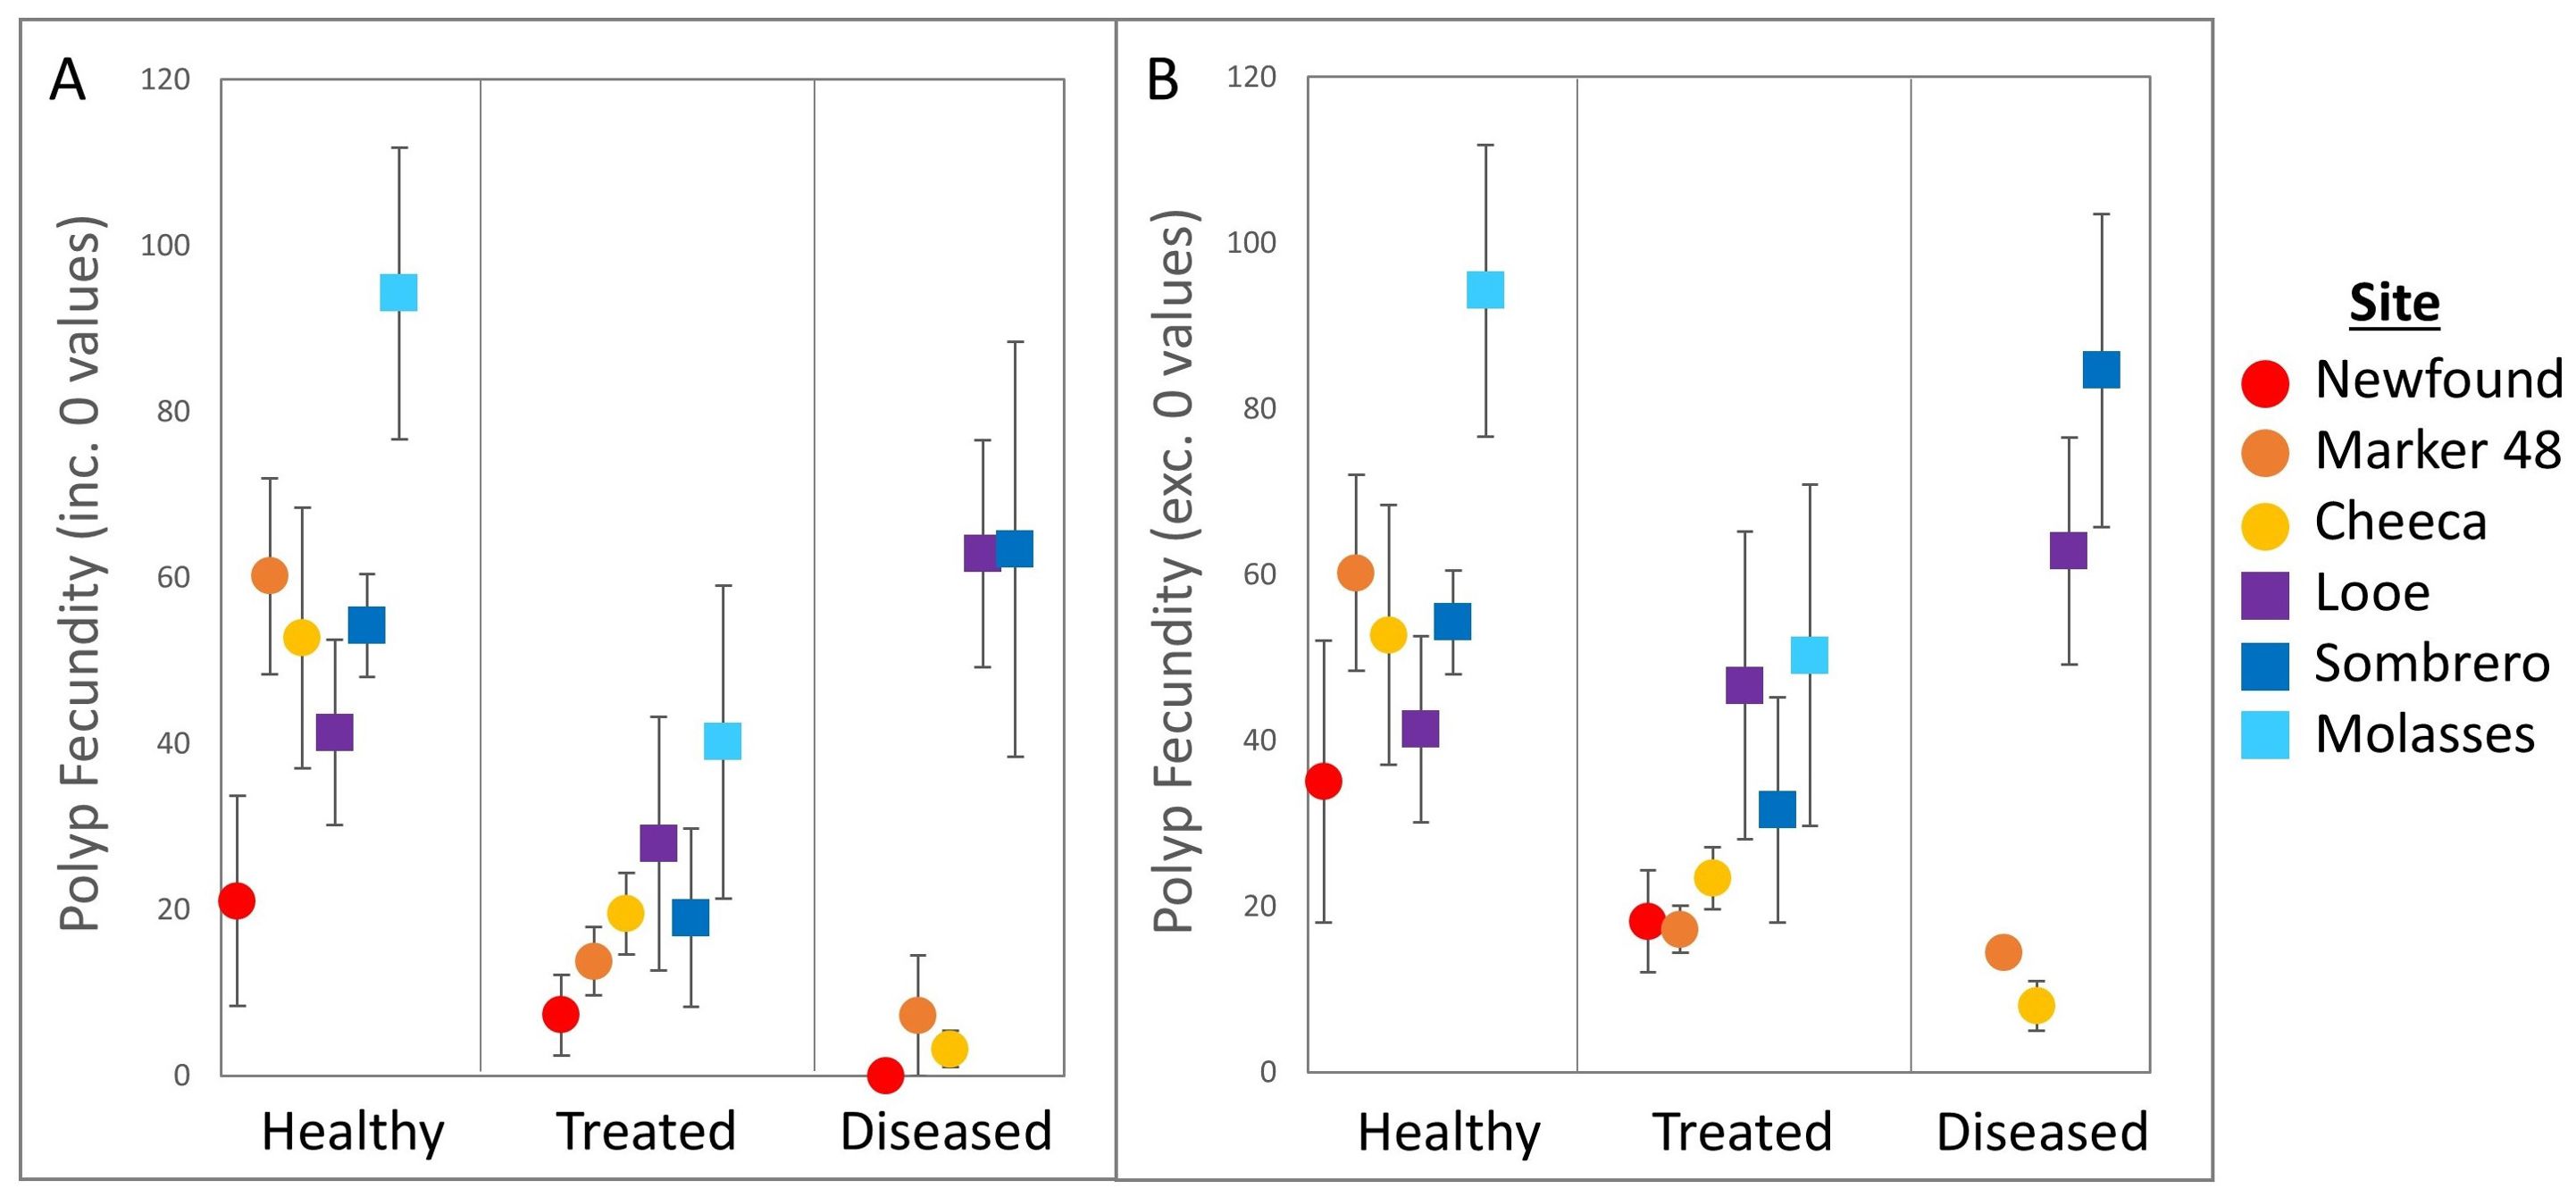
Figure 5. Polyp fecundity (mean ± SE) across treatments and sites for (A) all sampled Orbicella faveolata colonies and (B) only colonies with gametes present.
Between inshore and offshore habitats, offshore corals were more fecund (51.5 ± 5.9 oocytes/polyp) than inshore corals (23.1 ± 3.6 oocytes/polyp. Welch’s t-test: p < 0.001). This was also true when empty colonies were excluded from analyses (p = 0.002).
Polyp fecundity varied significantly among sites (Figure 5. Welch’s ANOVA: F(5,33.53) = 4.3, p = 0.003). Fecundity was significantly lower at Newfound Harbor (11.8 ± 5.8 oocytes/polyp) than at both Molasses Reef (69.7 ± 14.9 oocytes/polyp. Games-Howell: p = 0.03) and at Looe Key (45.2 ± 11.3 oocytes/polyp. p = 0.03). Fecundity among all other sites was not significantly different (all p > 0.05). When non-fecund colonies were removed there were no significant differences in polyp fecundity between sites (Welch’s ANOVA: F(5, 22) = 2.22, p = 0.08).
There were no significant interactions between treatment group and site for polyp fecundity (Two-way ANOVA: F(9,64) = 1.94, p = 0.06). This remained true if non-fecund corals were removed from analyses (F(8, 46)= 1.5, p = 0.17).
3.1.3 Maximum oocyte diameter
Average maximum oocyte diameter for O. faveolata ranged from 60.3 - 656.7 µm (Figure 6. N = 1682) and varied significantly with treatment group (ANOVA: F(2,1679) = 4.8, p = 0.01). Oocyte diameter in healthy corals (350.0 ± 2.2 µm) was significantly larger than in diseased corals (333.8 ± 3.4 µm. Tukey’s: p = 0.005), while oocyte size in treated corals (341.27 ± 3.5 µm) did not significantly differ from either healthy or diseased corals.
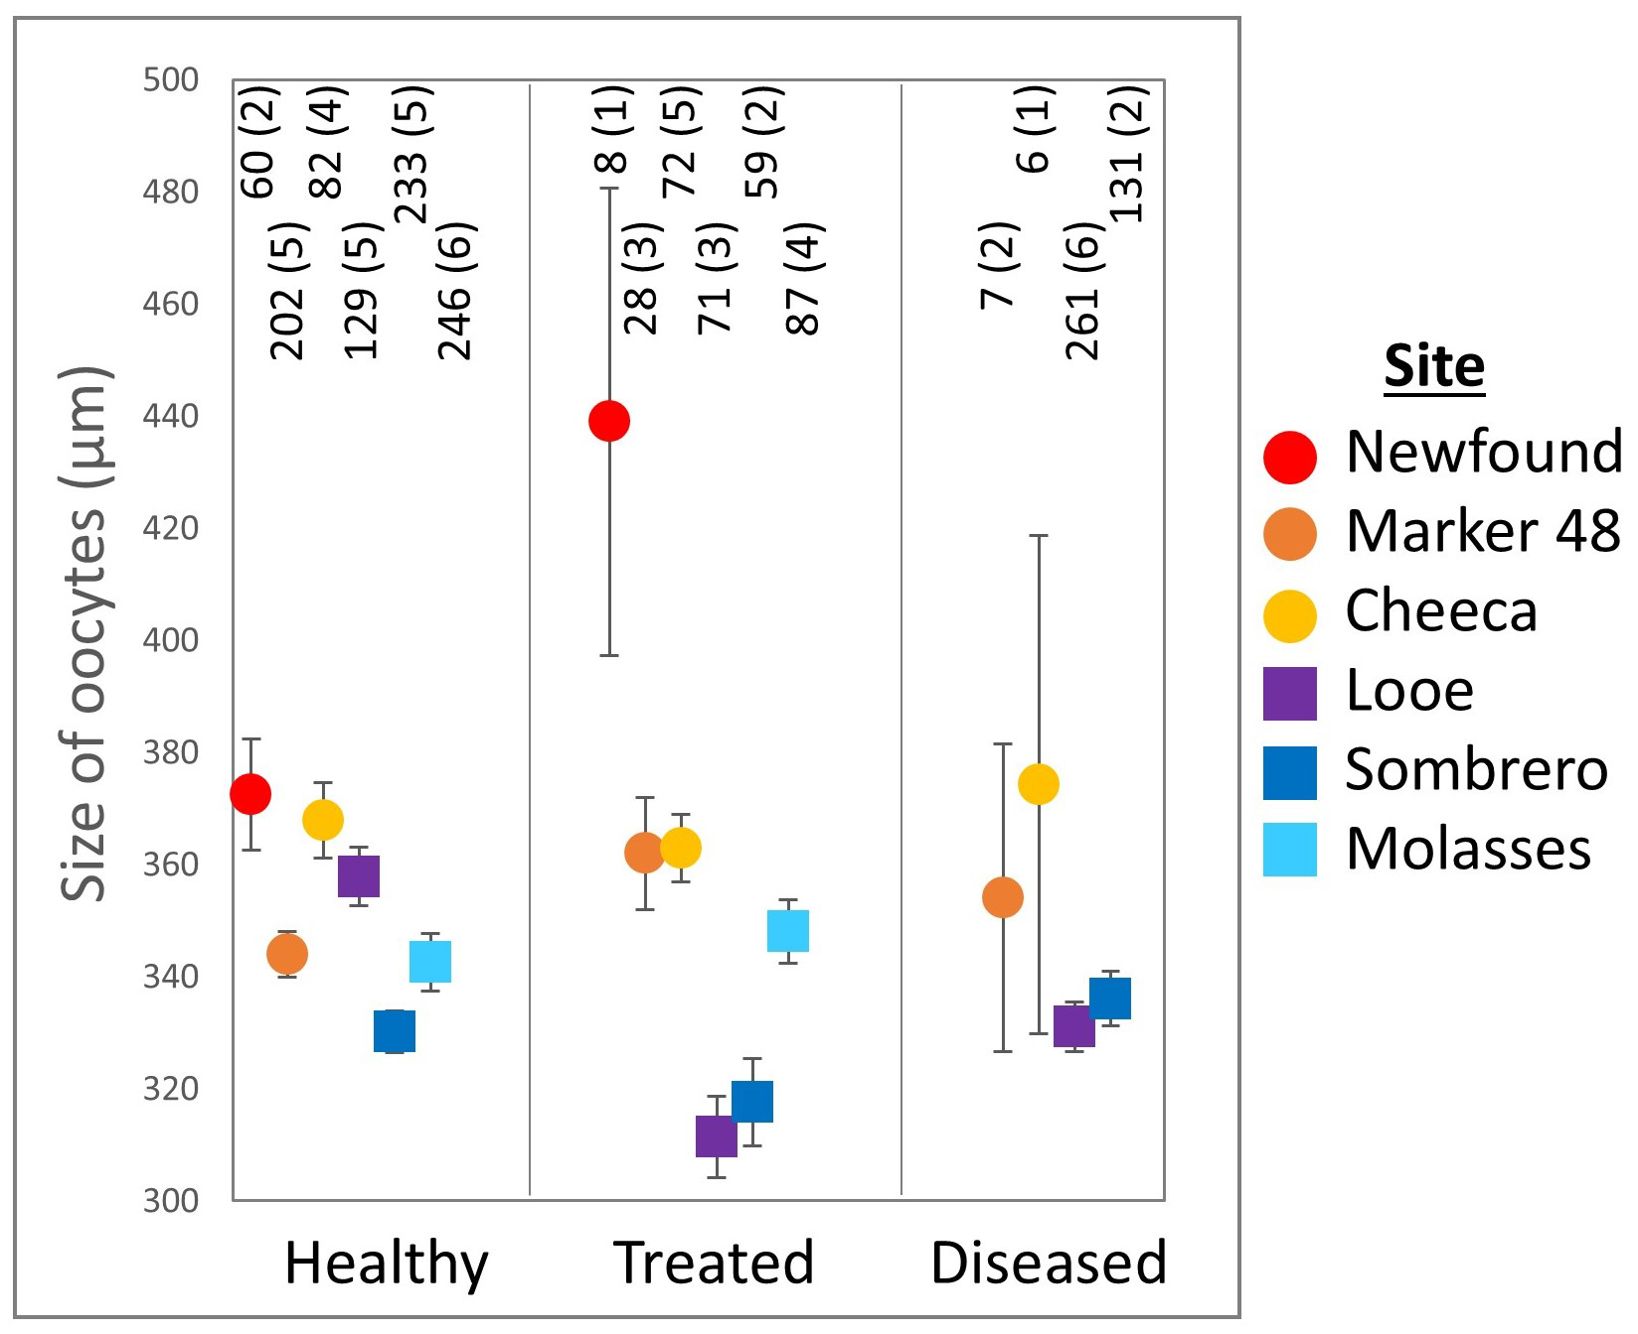
Figure 6. Maximum Orbicella faveolata oocyte diameter (mean ± SE) across treatments and sites. The number of oocytes and the number of colonies (in parentheses) are shown above each point.
Corals on offshore reefs had significantly smaller oocytes (335.7 ± 3.6 µm) than corals on inshore reefs (358.1 ± 3.1 µm. t-test: p < 0.001). Oocyte size also varied significantly across sites (ANOVA: F(5,1676) = 12.7, p < 0.001). Corals at Sombrero Reef had significantly smaller oocytes (330.4 ± 2.8 µm) than corals at Newfound Harbor (380.3 ± 10.2 µm. Tukey’s: p < 0.001), Cheeca Rocks (365.9 ± 4.6 µm. p < 0.001), and Marker 48 (346.4 ± 4.3 µm. p = 0.03). Oocytes at Molasses Reef (344 ± 5.6 µm) were significantly smaller than those at Newfound Harbor (p < 0.001) and Cheeca Rocks (p = 0.007). There were no other significant site-specific differences.
3.1.4 Healthy colony site comparison
Because the number of treated and diseased colonies varied across sites, the reproductive metrics of only healthy, untreated corals were independently assessed.
Neither oocyte nor spermary presence varied significantly across habitat or sites. Fecundity did not vary between inshore/offshore habitat, regardless of whether empty colonies were included or excluded. However, fecundity did vary significantly between sites (ANOVA: F(5,25) = 3.4, p = 0.02), with fecundity at Molasses Reef (94.2 ± 17.6 oocytes/polyp) higher than at Newfound Harbor (21.0 ± 12.6 oocytes/polyp. Tukey’s: p = 0.006). Fecundity did not differ between any other sites. If non-fecund colonies were excluded, there were no significant differences among sites.
Maximum oocyte diameter of healthy coral was higher on inshore reefs (354 ± 3.4 µm) than on offshore reefs (341 ± 2.8 µm. t-test: p = 0.002). Maximum oocyte diameter also differed between sites (ANOVA: F(5,946) = 7.4, p < 0.001). Oocytes were significantly larger at Newfound Harbor (372 ± 9.8 µm) than at Marker 48 (343.9 ± 4.1 µm. Tukey’s: p = 0.04), Molasses Reef (342.6 ± 5.2 µm. p = 0.02), and Sombrero Reef (330.2 ± 3.7 µm. p < 0.0001). Oocytes at Cheeca Rocks (367.9 ± 6.7 µm) were significantly larger than those at Molasses Reef (p = 0.03) and Sombrero Reef (p < 0.001), and oocytes at Looe Key (357.9 ± 5.3 µm) were significantly larger than those at Sombrero Reef (p = 0.002).
3.1.5 Treatment frequency and fecundity
Among corals previously treated with amoxicillin, fecundity was not significantly correlated with the total number of times treated (Figure 7A. Linear regression: p = 0.18). There was also no relationship with the number of days since the previous treatment (Figure 7C), regardless of whether the three outliers that had not been treated in over 800 days were included (p = 0.17) or excluded (p = 0.41). However, fecundity was positively related to the number of times a colony was treated in the previous year (Figure 7B. R2 = 0.19; p = 0.01), although these correlations were not significant within each habitat group.

Figure 7. Polyp fecundity of Orbicella faveolata colonies across sites for corals that had previously received amoxicillin treatments, compared to (A) the total number of times a colony was treated, (B) the number of times the coral was treated in the year preceding sampling, and (C) the number of days since the last treatment.
3.2 Montastraea cavernosa
3.2.1 Presence/absence
The gonochoric nature of M. cavernosa necessitated adjustments to gamete presence calculations, as corals without gametes could not be classified as male or female and are termed “empty.” Oocytes were present in 40% of healthy corals, 22% of treated corals, and 18% of diseased corals (Figure 8A); these differences were not significant (Fisher’s exact test: p = 0.25). Spermaries were present in 42% of healthy corals, 48% of treated corals, and 64% of diseased corals (Figure 8B); these differences were also not significant (p = 0.4). The percentage of corals containing no gametes also did not differ among groups (p = 0.51); empty corals constituted 18% of healthy corals, 30% of treated corals, and 18% of diseased corals (Figure 8C).

Figure 8. Percentage of Montastraea cavernosa colonies containing (A) oocytes, (B) spermaries, and (C) devoid of gametes (empty) across treatments and sites.
Among inshore colonies, 25% contained oocytes, 44% contained spermaries, and 31% were empty; for offshore colonies, 37% contained oocytes, 52% contained spermaries, and 11% were empty. None of these differences between inshore and offshore colonies were significant (oocytes p = 0.41, spermaries p = 0.29, empty p = 0.11). There were also no differences between sites in the proportions of colonies containing oocytes (p = 0.59), containing spermaries (p = 0.93), or that were empty (p = 0.55).
There were no significant treatment:site interactions for oocyte presence, spermary presence, or empty colonies. An additional binomial GLM was conducted to support the Fisher exact tests and confirmed that there were no significant differences in M. cavernosa oocyte (p = 0.05), spermary (p = 0.3), or empty colony presence (p = 0.15) with both treatment and site.
3.2.2 Fecundity
Fecundity of healthy M. cavernosa colonies (111.7 ± 16.5 oocytes/polyp) was approximately double that of treated corals (55.4 ± 23.7 oocytes/polyp) and 4x that of diseased ones (26.2 ± 24 oocytes/polyp), but these differences were not significant (Figure 9. ANOVA: F(2,17) = 3.1, p = 0.06).
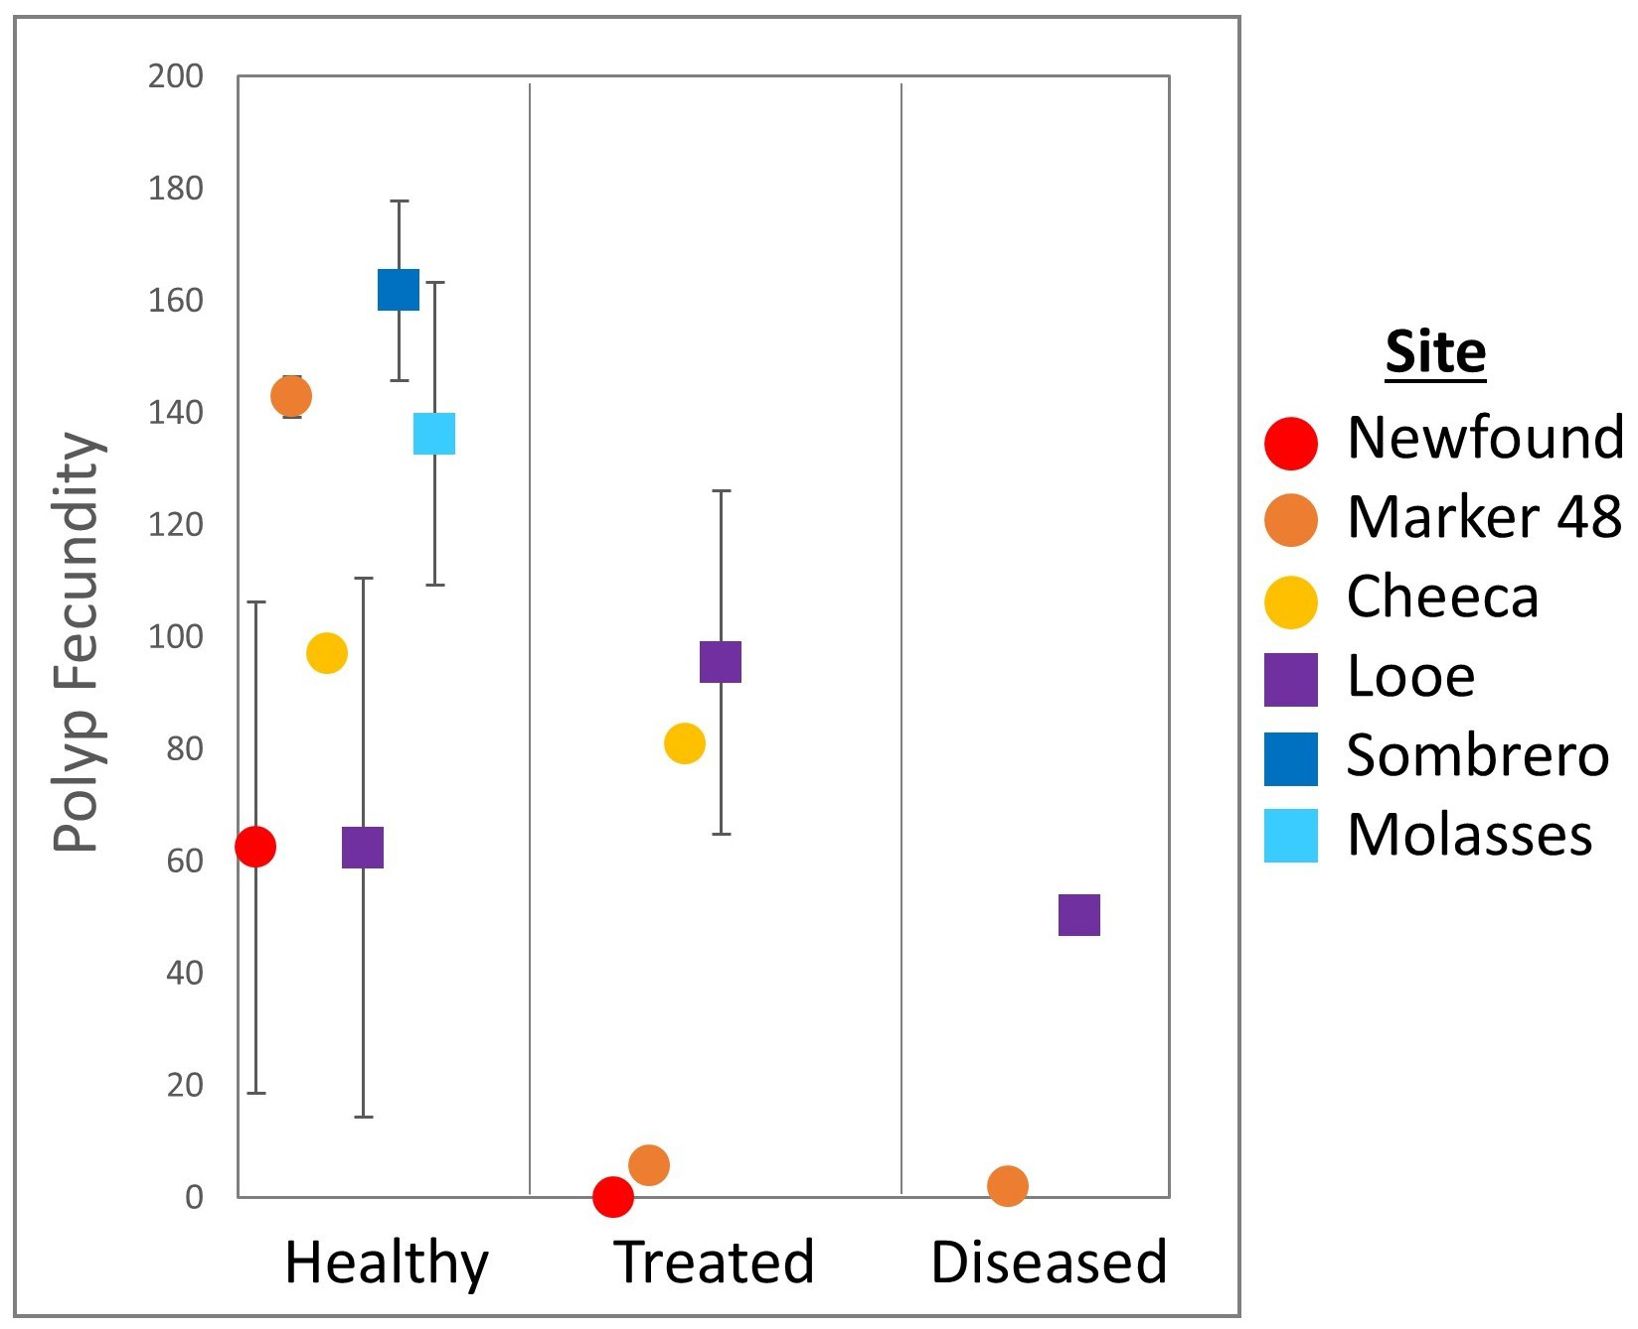
Figure 9. Polyp fecundity (mean ± SE) of Montastraea cavernosa colonies across treatments and sites.
Colonies at offshore sites averaged twice the fecundity (112.3 ± 17.4 oocytes/polyp) of those at inshore sites (65.8 ± 20.2 oocytes/polyp) but there was no significant difference between the two groups (Welch’s t-test: p = 0.09). Average fecundity at sites ranged from 73.2 (± 20.3) oocytes/polyp at Looe Key to 161.8 (± 16.1) oocytes/polyp at Sombrero Reef, but polyp fecundity did not differ significantly among sites (Welch’s ANOVA: F(5,14) = 1.8, p = 0.17). There was no significant interaction between treatment group and site (Two-way ANOVA: F(4,8) =1.3, p = 0.35).
The gonochoric nature of M. cavernosa resulted in low sample sizes for fecundity assessments. In addition to colonies being either male or female, empty colonies could not be included in fecundity values. A power analysis with existing sample sizes and a moderate effect with Cohen’s d identified current power for fecundity with both treatment group and site between 0.11 and 0.17. This highly increases the chance for type II error of failing to reject the null hypothesis when it is false. Power analysis also indicated that a sample size of 52 would be needed for accurate power for the treatment group, and an N = 32 would be required to appropriately assess site differences.
3.2.3 Maximum oocyte diameter
Average maximum oocyte diameter in M. cavernosa ranged from 212.9 to 723.3 µm (Figure 10, N = 1006). There was no significant difference in maximum oocyte diameter between healthy (455.3 ± 3.6 µm), treated (459.6 ± 11.7 µm), and diseased corals (465.6 ± 15.0 µm. ANOVA: F(2,1003) = 0.2, p = 0.8).
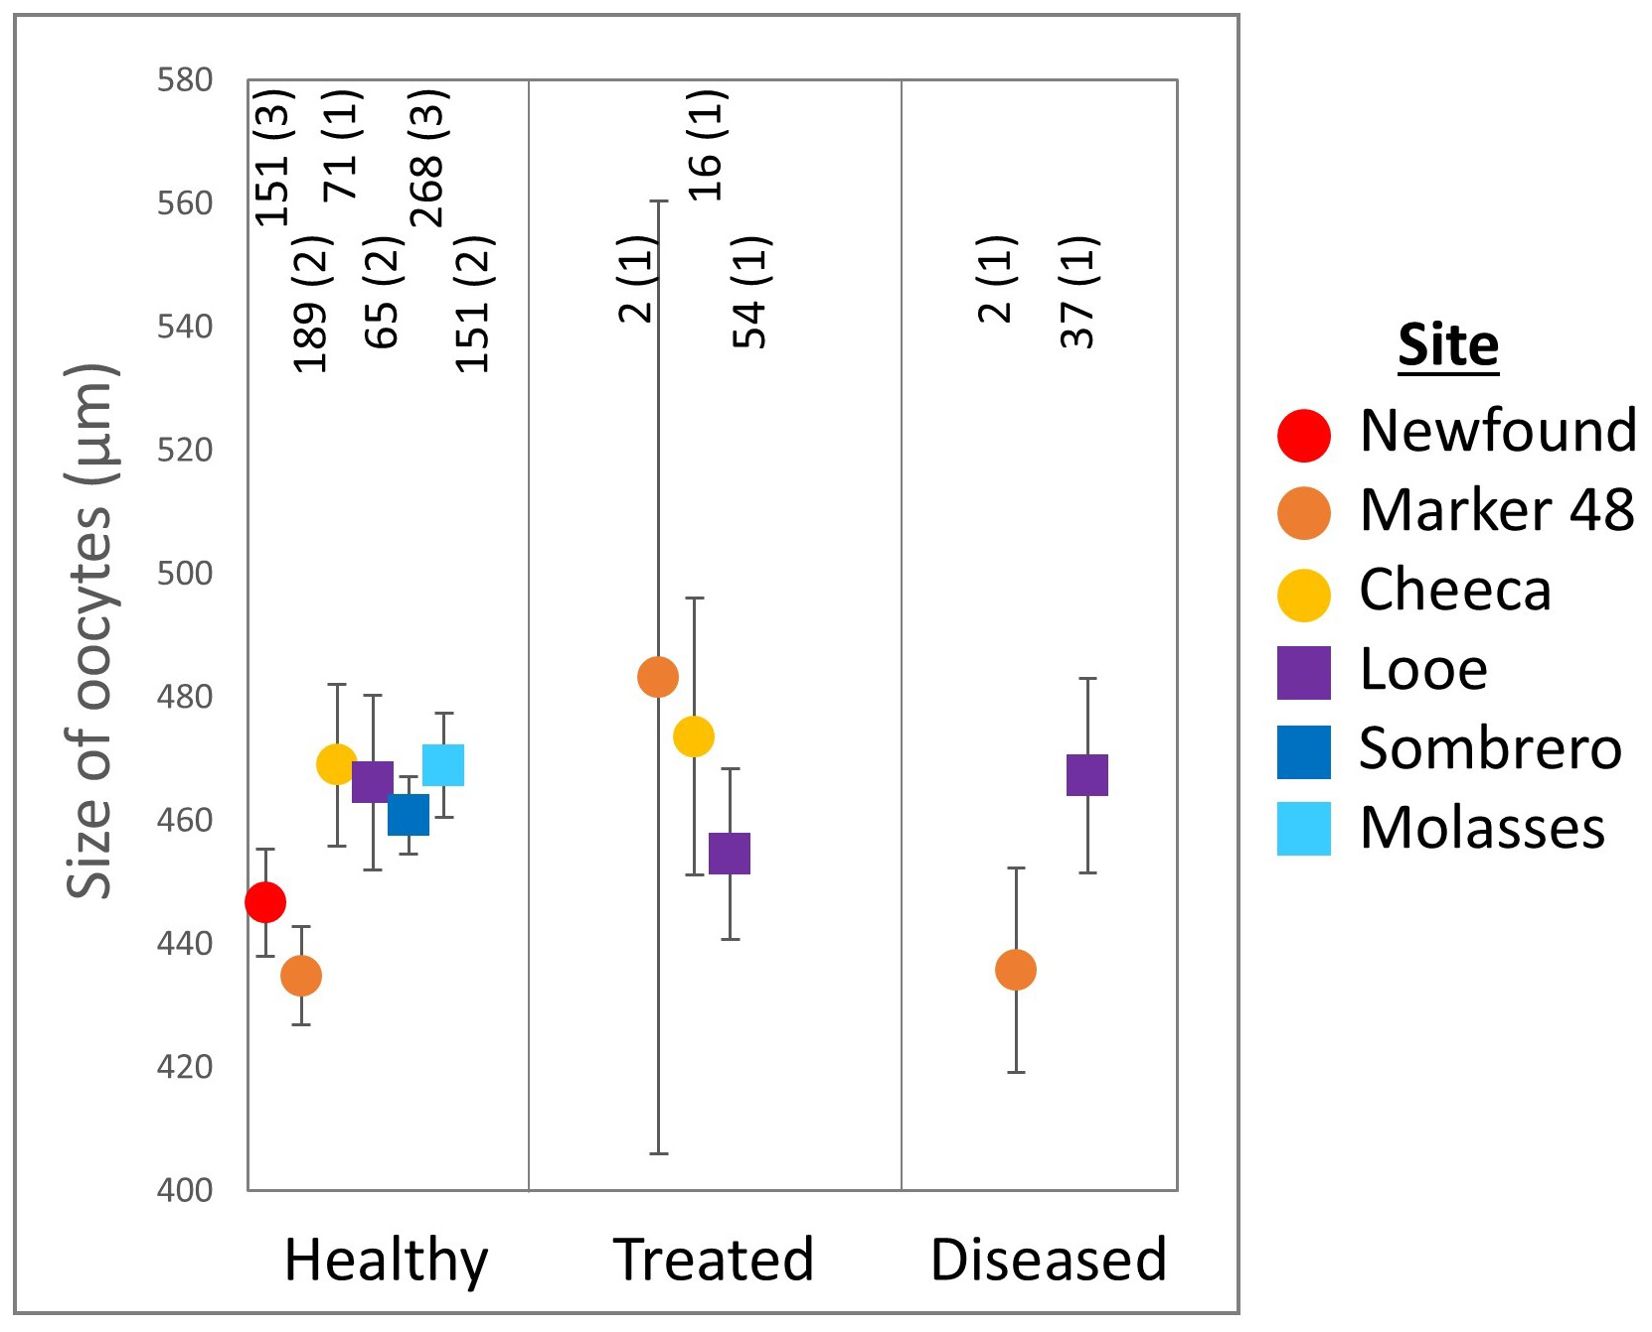
Figure 10. Maximum Montastraea cavernosa oocyte diameter (mean ± SE) across treatments and sites. The number of oocytes and the number of colonies (in parentheses) are shown above each point. Note that for several groups, only one colony had measurable oocytes.
Oocytes from inshore corals were significantly smaller (446.3 ± 5.2 µm) than oocytes from offshore corals (463.4 ± 4.3 µm. t-test: p = 0.01). Oocyte size varied significantly across site (ANOVA: F(5,1000) = 2.7, p = 0.02). Oocytes from corals at Molasses Reef were significantly larger (468.8 ± 8.5 µm) than those at Marker 48 (435.3 ± 7.9 µm. Tukey’s: p = 0.04), but there were no other significant differences among sites.
3.2.4 Healthy colony site comparison
For healthy M. cavernosa corals, there were no differences between habitats (inshore/offshore) for oocyte presence (Fisher's exact: p = 0.83), spermary presence (p = 0.74), or empty colonies (p = 0.85). There were also no differences between reef sites for oocyte presence (p = 0.83), spermary presence (p = 0.74), or the proportion of empty colonies (p = 0.8).
Fecundity of healthy corals did not vary between the inshore and offshore habitat types (t-test: p = 0.37), nor did it vary between sites (ANOVA: p = 0.26). Maximum oocyte diameter of healthy corals did vary between habitats (t-test: p = 0.008), as did oocyte size between sites (ANOVA: F(5,889) = 2.6, p = 0.02), however Tukey’s post-hoc analysis did not identify site-specific differences.
4 Discussion
This study assessed the relationships of SCTLD-infection, amoxicillin treatments, and geography on three metrics of coral reproduction in the two reef-building species Orbicella faveolata and Montastraea cavernosa.
4.1 Health status
Gamete presence, fecundity, and oocyte size are related metrics that all assess whether, and to what extent, gametogenesis occurred in corals (Table 1). Healthy O. faveolata colonies had significantly larger oocytes compared to diseased colonies (Figure 6), but the difference may not be biologically relevant. The difference in averages between the two groups is small (just 16 µm, a 4.6% size reduction in the diseased colonies compared to the healthy ones), and all oocyte sizes fall within the range of measurements reported by Holstein et al. (2015). As oocytes in all groups appeared to be normally developed with no notable abnormalities, it seems unlikely that this difference in oocyte maximum diameter is one of biological significance.
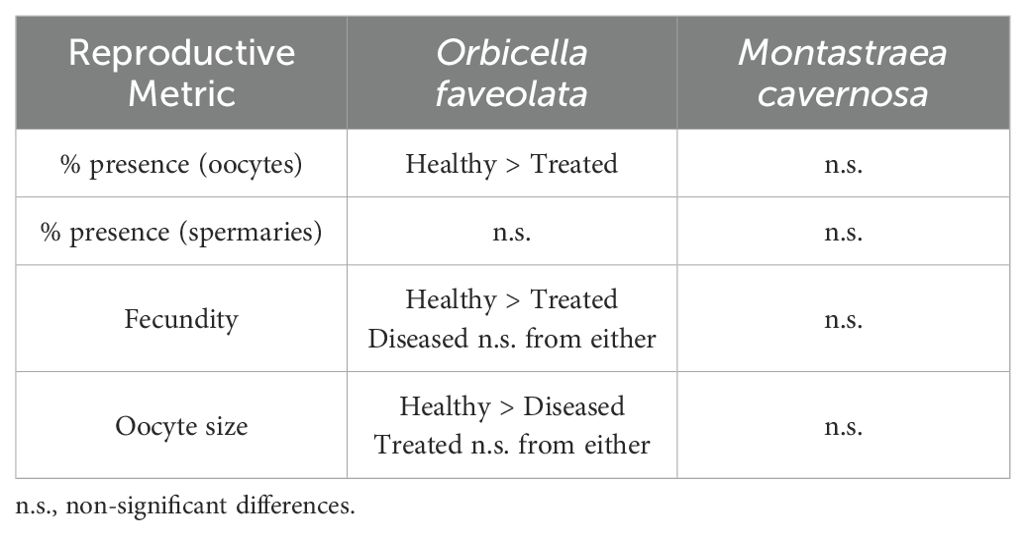
Table 1. Summary of significant differences for the reproductive metrics of Orbicella faveolata and Montastraea cavernosa among treatment groups.
Polyp fecundity for both species fell within expected ranges from past studies. Our observed average fecundity for healthy O. faveolata (55 oocytes/polyp) was lower than found in mesophotic reefs (87 – 144 oocytes/polyp) by Holstein et al. (2015), but higher than found in control colonies (~25 oocytes/polyp) by Weil et al. (2009). Weil et al. also measured fecundity in tissues adjacent to active yellow band disease, where fecundity (~12 oocytes/polyp) was notably lower than that of any of the treatment groups in our SCTLD study. For M. cavernosa, our observed average fecundity (112 oocytes/polyp) is within the range of the 62-139 oocytes/polyp found by Acosta and Zea (1997).
Among healthy O. faveolata, 100% of the samples at 5 of the 6 sites were gravid – a significantly higher proportion than for treated corals, which did not exhibit 100% gravidity at any of the sites (Figures 4A, 5). Healthy corals also had the highest fecundity of the treatment groups, but this was significant compared only to amoxicillin-treated corals. We would expect, based on resource allocation theory, for healthy corals to have the most energy reserves and thus potential for gamete presence and high fecundity. Indeed, reproductive studies on corals affected by white plague (Borger and Colley, 2010) and yellow band disease (Weil et al., 2009) both showed that disease-adjacent tissues had lower reproductive output than tissues further from lesions. However, some wild SCTLD-affected colonies have been observed spawning (Quiroz et al., 2023; Neely lab, pers. obs.), and we demonstrate here that most disease-adjacent tissues are still producing gametes, indicating that SCTLD infections do not prevent gametogenesis.
Fecundity analyses of diseased corals must take into consideration the state of the coral during the full gametogenic cycle, not just at the time of sampling. As samples were taken at the end of gametogenesis (just before spawning), actively diseased colonies had only been diseased for, at most, the last two months of gametogenesis, as corals showed no signs of disease during the previous monitoring period (Supplementary File 1). As SCTLD lesions progress rapidly across coral tissue (Florida Coral Disease Response Research & Epidemiology Team, 2018; Eaton et al., 2021), the core sites were only very recently (on the order of days) experiencing disease signs. Within these tissues, gametogenesis would have been expected to occur normally until disease lesions were proximal; therefore, we might expect healthy coral and diseased coral fecundity to be similar.
In treated corals, which were not diseased during sampling but experienced SCTLD earlier in the gametogenic cycle, infections may have caused a reallocation of energy reserves from gametogenesis to survival. That oocytes might be more detrimentally impacted than spermaries is also not surprising. Spermaries develop much later in the gametogenic cycle than oocytes and require less energy to produce (Szmant, 1991; Holstein et al., 2015). SCTLD infections earlier in gametogenesis may thus be more likely to impact oocyte development, and corals may preferentially reduce oocyte development over spermary development if energy reserves are limited.
Fecundity of actively diseased corals varied greatly depending on whether the corals were inshore or offshore (Figure 5), with diseased offshore corals showing high fecundity similar to healthy corals, while diseased inshore corals had almost no oocytes. We can only theorize why this geographic pattern exists, but one possible explanation is that inshore sites are subject to greater thermal stress during the summers than offshore sites. Corals at all three inshore sites exhibited paling during the previous (2021) summer while offshore corals did not. Paling and bleaching are known to negatively impact gametogenesis in subsequent years (Levitan et al., 2014; Leinbach et al., 2021). Though gametogenesis proceeded unimpeded in healthy corals at these inshore sites, perhaps the combined stressors of prior paling plus disease resulted in partial to total failure of gametogenesis in these corals, though as we suggest above, gametogenesis should have been well underway before disease lesions developed. This hypothesis, as well as other possible habitat-specific effects, would require further testing.
The disparity in diseased coral fecundity between habitats (Figure 5) also complicates our understanding of how amoxicillin treatments may or may not impact gametogenesis. At inshore sites, where diseased colonies’ fecundity was very low, treated corals’ fecundity was intermediate between healthy and diseased individuals. At offshore sites, where diseased coral fecundity was similar to that of healthy corals, treated coral fecundity was lower compared to both. It is possible that treatments and/or the presence of disease earlier in gametogenesis depressed fecundity compared to healthy corals. It is also possible that treatment of disease mitigated disease stress and allowed for improved gametogenesis compared to actively diseased corals. Most certainly, treatment of diseased corals prevented their probable mortality, which would eliminate all reproductive potential for the full lifespan of the colony.
The effects of amoxicillin on reproduction have been studied mostly in mammals. In the United States, amoxicillin is classed within USFDA pregnancy category B, meaning animal reproduction studies have failed to demonstrate a risk to the fetus (Briggs et al., 2011). Jepsen et al. (2003) found that babies born to women who had utilized amoxicillin during pregnancy had a slightly higher birth weight compared to controls, with the authors proposing this was likely a result of those fetuses not having infections that would cause lower birth rates. Studies of amoxicillin effects on reproduction in rodents also found no impaired fertility or harm to the fetus (Promoting the Quality of Medicines (PQM), 2017). However, Fahmy et al. (2017) did find increased sperm morphological anomalies in mice given high doses of amoxicillin-clavulanic acid. We found no such sperm anomalies in our coral samples.
Within the marine environment, studies of amoxicillin impacts are rare. In zebrafish, high doses of amoxicillin resulted in premature hatching of embryos (Oliveira et al., 2013). One non-reproductive study on a cnidarian (Hydra vulgaris) did not identify amoxicillin as being detrimental to survival, feeding, or bud formation (Pascoe et al., 2003). A recent paper by Renegar et al. (2024) assessed gametogenesis across seven O. faveolata colonies with various amoxicillin treatment histories and found no discernable patterns.
We would expect that if amoxicillin had a negative impact on fecundity, then increased amoxicillin treatments throughout gametogenesis would further decrease fecundity. In contrast, fecundity of treated corals had a positive relationship with the number of amoxicillin treatments applied in the year preceding core collections (Figure 7B). This is surprising in that, even assuming amoxicillin has no negative impact on gametogenesis, multiple treatment timepoints are also indicative of SCTLD occurrence at multiple timepoints. It is possible that, in addition to quickly halting disease and thus preventing any need for reproductive corals to redirect their energy resources, these treatments conferred other benefits on gametogenesis. Studivan et al. (2023) showed that these amoxicillin treatments “reset” gene expression pathways to those of healthy corals, which may benefit the immune response, and possibly confer advantages to gametogenesis. This hypothesis would, however, require further testing.
In summary, healthy corals had the highest oocyte presence (Figure 4A), fecundity (Figure 5), and oocyte size (Figure 6) of the three treatment groups. Among diseased corals, there was a distinct difference between low-fecundity inshore colonies and high-fecundity offshore colonies. Corals with disease earlier in their gametogenic cycle that were treated with amoxicillin had lower fecundity compared to healthy corals, but it is unknown whether this is due to the treatments themselves or the occurrence of disease during gametogenesis. The positive relationship between the number of times a coral was treated and fecundity (Figure 7B) suggests that it is not the treatment itself which depressed fecundity, but again this would require further testing. We show with certainty that treating corals with amoxicillin does not prevent gametogenesis, and by keeping these corals alive, amoxicillin treatments also allow the coral to contribute gametes for years to come.
4.2 Geography
Reproductive metrics were assessed across six Florida Keys reefs, including three onshore and three offshore sites (Tables 2, 3). Because treatment groups were uneven across sites, conclusions about geographic influences were drawn from healthy corals only.
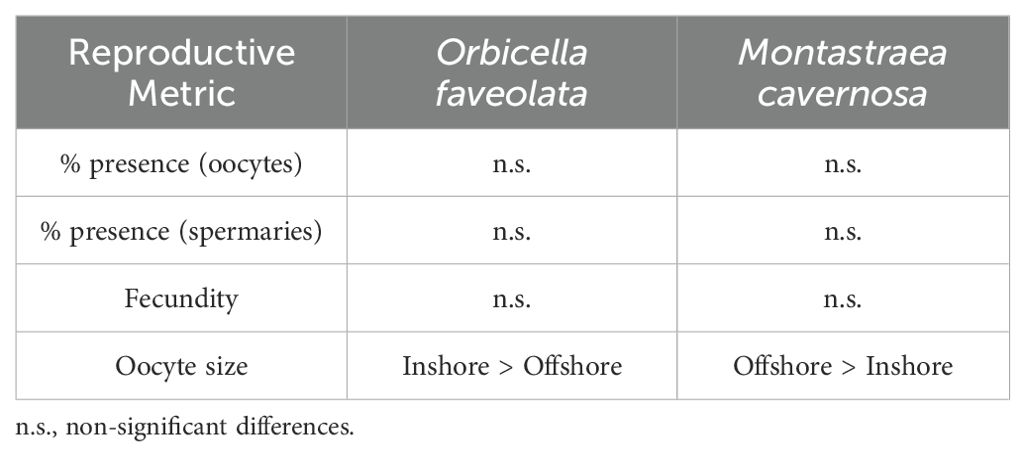
Table 2. Summary of significant differences for the reproductive metrics of healthy Orbicella faveolata and Montastraea cavernosa colonies between inshore and offshore locations.
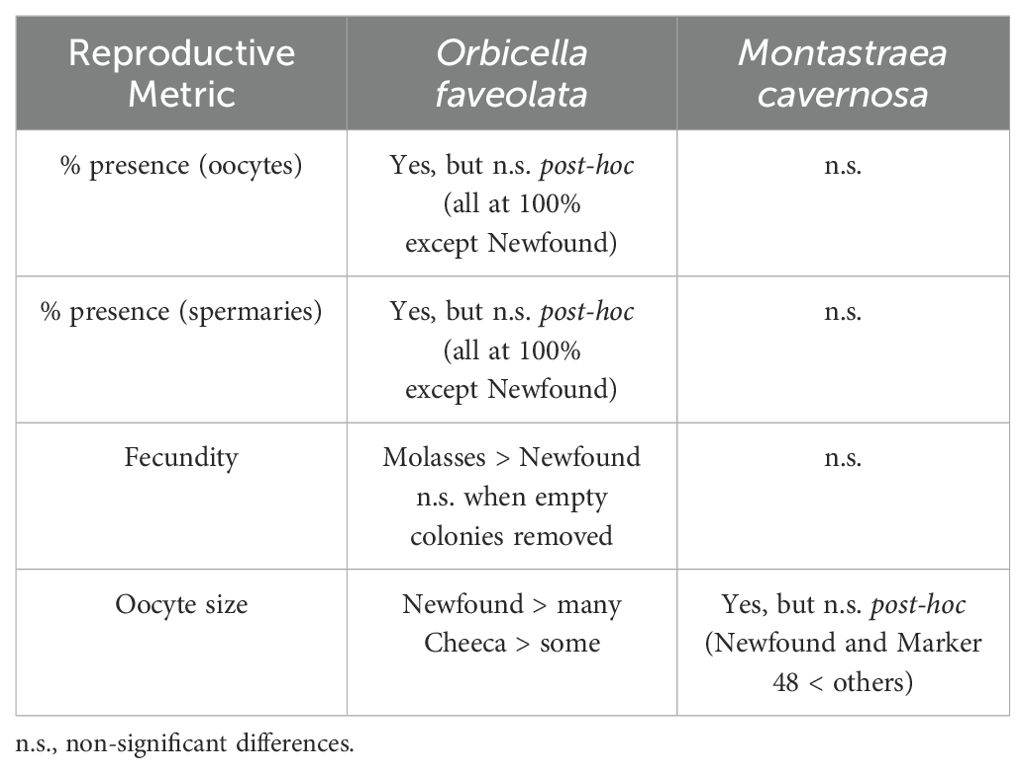
Table 3. Summary of significant differences for the reproductive metrics of healthy Orbicella faveolata and Montastraea cavernosa colonies among reef sites.
Oocytes were larger at inshore sites for O. faveolata, smaller at inshore sites for M. cavernosa, and greatest for O. faveolata on two inshore reefs – Newfound Harbor and Cheeca Rocks – than on many others. However, the differences are likely not biologically relevant as all fall within the expected size range for the species. There were no inshore/offshore differences in the proportion of healthy colonies with oocytes, the proportion with spermaries, or fecundity for either species. Coral fecundity studies in other regions have documented some inshore-offshore gradients. The coral Mussimilia braziliensis had higher fecundity at inshore reefs than offshore reefs off Brazil (Pires et al., 2011), and Pratchett et al. (2019) found higher coral fecundity at inshore Great Barrier Reef sites compared to mid- and offshore sites. However, the “inshore” locations in both of these studies were further from land than even our offshore reefs, and so conditions would not be expected to be comparable.
Our results show that corals at all sites were capable of producing gametes, and that with one exception, the inshore sites produced gametes at levels commensurate with offshore counterparts. While it is unknown why gamete percent presence and fecundity were lower at Newfound Harbor, it may be related to environmental differences including closer proximity to shore, shallower depth, and greater temperature variation compared to the other sites. Temperature loggers placed at Newfound Harbor the year preceding sampling recorded lower water temperatures during the previous winter compared to other sites, but temperatures aligned with other sites by March when gametogenesis typically begins. Paling and bleaching in the previous summer (2021) was also more notable at Newfound Harbor than at other sampling sites, which may have also impeded gamete development. However, these factors clearly do not limit gametogenesis entirely, as other corals at this site had normal fecundity values.
In general, these high-density inshore reefs appear highly capable of contributing reproductively to Florida’s Coral Reef. Because of the greater abundance, density, and diversity of corals at these sites, as compared to the depauperate offshore reefs, they are in fact more likely to have successful fertilization, and to provide a greater number of larvae to the system than offshore reefs. We suggest that their protection, including continuing SCTLD treatments to prevent mortality, be prioritized if preservation of reef-scale reproductive capacity is a management goal.
Data availability statement
The raw data supporting the conclusions of this article will be made available by the authors, without undue reservation.
Ethics statement
The manuscript presents research on animals that do not require ethical approval for their study.
Author contributions
HM: Data curation, Formal analysis, Investigation, Software, Writing – original draft, Writing – review & editing. KN: Conceptualization, Data curation, Funding acquisition, Investigation, Methodology, Project administration, Resources, Supervision, Visualization, Writing – original draft, Writing – review & editing. DR: Investigation, Methodology, Resources, Supervision, Writing – review & editing.
Funding
The author(s) declare financial support was received for the research, authorship, and/or publication of this article. Funding for this work was provided by a Nova Southeastern University President’s Faculty Research and Development Grant (PFRDG).
Acknowledgments
We are grateful to Sydney Gallagher and Michelle Dobler for their assistance in collecting core samples. All work was conducted under Florida Keys National Marine Sanctuary permit FKNMS-2022-066.
Conflict of interest
The authors declare that the research was conducted in the absence of any commercial or financial relationships that could be construed as a potential conflict of interest.
Publisher’s note
All claims expressed in this article are solely those of the authors and do not necessarily represent those of their affiliated organizations, or those of the publisher, the editors and the reviewers. Any product that may be evaluated in this article, or claim that may be made by its manufacturer, is not guaranteed or endorsed by the publisher.
Supplementary material
The Supplementary Material for this article can be found online at: https://www.frontiersin.org/articles/10.3389/fmars.2024.1445735/full#supplementary-material
References
Acosta A., Zea S. (1997). Sexual reproduction of the reef coral Montastrea cavernosa (Scleractinia: Faviidae) in the Santa Marta area, Caribbean coast of Colombia. Mar. Biol. 128, 141–148. doi: 10.1007/s002270050077
Alvarez-Filip L., González-Barrios F. J., Pérez-Cervantes E., Molina-Hernández A., Estrada-Saldívar N. (2022). Stony coral tissue loss disease decimated Caribbean coral populations and reshaped reef functionality. Commun. Biol. 5, 1–10. doi: 10.1038/s42003-022-03398-6
Borger J. L., Colley S. (2010). The effects of a coral disease on the reproductive output of Montastraea faveolata (Scleractinia: Faviidae). Rev. Biol. Trop. 58, 99–110.
Briggs G. G., Freeman R. K., Yaffe S. J. (2011). Drugs in pregnancy and lactation: a reference guide to fetal and neonatal risk (Philadelphia, PA: Lippincott Williams & Wilkins).
Delgado G. A., Bartels C. T., Glazer R. A., Brown-Peterson N. J., McCarthy K. J. (2004). Translocation as a strategy to rehabilitate the queen conch (Strombus gigas) population in the Florida Keys. Fishery Bull. 102, 278.
Eaton K. R., Landsberg J. H., Kiryu Y., Peters E. C., Muller E. M. (2021). Measuring stony coral tissue loss disease induction and lesion progression within two intermediately susceptible species, Montastraea cavernosa and Orbicella faveolata. Front. Mar. Sci. 8, 717265. doi: 10.3389/fmars.2021.717265
Fahmy M. A., Farghaly A. A., Omara E. A., Hassan Z. M., Aly F. A., Donya S. M., et al. (2017). Amoxicillin–clavulanic acid induced sperm abnormalities and histopathological changes in mice. Asian Pacific J. Trop. Biomedicine 7, 809–816. doi: 10.1016/j.apjtb.2017.08.002
Florida Coral Disease Response Research & Epidemiology Team (2018).Case definition: stony coral tissue loss disease. Available online at: https://floridadep.gov/sites/default/files/Copy%20of%20StonyCoralTissueLossDisease_CaseDefinition%20final%2010022018.pdf. (Accessed December 15, 2023).
Hawthorn A. C., Dennis M., Kiryu Y., Landsberg J., Peters E., Work T. M. (2024). Stony coral tissue loss disease (SCTLD) case definition for wildlife (Reston, VA: US Geological Survey).
Holstein D. M., Smith T. B., Gyory J., Paris C. B. (2015). Fertile fathoms: deep reproductive refugia for threatened shallow corals. Sci. Rep. 5, 1–12. doi: 10.1038/srep12407
Jepsen P., Skriver M. V., Floyd A., Lipworth L., Schønheyder H. C., Sørensen H. T. (2003). A population-based study of maternal use of amoxicillin and pregnancy outcome in Denmark. Br. J. Clin. Pharmacol. 55, 216–221. doi: 10.1046/j.1365-2125.2003.01750.x
Leinbach S. E., Speare K. E., Rossin A. M., Holstein D. M., Strader M. E. (2021). Energetic and reproductive costs of coral recovery in divergent bleaching responses. Sci. Rep. 11, 23546. doi: 10.1038/s41598-021-02807-w
Levitan D. R., Boudreau W., Jara J., Knowlton N. (2014). Long-term reduced spawning in Orbicella coral species due to temperature stress. Mar. Ecol. Prog. Ser. 515, 1–10. doi: 10.3354/meps11063
Lirman D., Fong P. (2007). Is proximity to land-based sources of coral stressors an appropriate measure of risk to coral reefs? An example from the Florida Reef Tract. Mar. pollut. Bull. 54, 779–791. doi: 10.1016/j.marpolbul.2006.12.014
Manzello D. P. (2015). Rapid recent warming of coral reefs in the Florida keys. Sci. Rep. 5, 1–10. doi: 10.1038/srep16762
Manzello D. P., Enochs I. C., Kolodziej G., Carlton R. (2015). Recent decade of growth and calcification of Orbicella faveolata in the Florida Keys: an inshore-offshore comparison. Mar. Ecol. Prog. Ser. 521, 81–89. doi: 10.3354/meps11085
Neely K. L. (2023). Florida Keys coral disease intervention strike teams: final report (Miami FL: Florida DEP).
Neely K. L., Macaulay K. A., Hower E. K., Dobler M. A. (2020). Effectiveness of topical antibiotics in treating corals affected by Stony Coral Tissue Loss Disease. PeerJ 8, e9289. doi: 10.7717/peerj.9289
Neely K. L., Shea C. P., Macaulay K. A., Hower E. K., Dobler M. A. (2021). Short- and long-term effectiveness of coral disease treatments. Front. Mar. Sci. 8. doi: 10.3389/fmars.2021.675349
Oliveira R., McDonough S., Ladewig J. C., Soares A. M., Nogueira A. J., Domingues I. (2013). Effects of oxytetracycline and amoxicillin on development and biomarkers activities of zebrafish (Danio rerio). Environ. Toxicol. Pharmacol. 36, 903–912. doi: 10.1016/j.etap.2013.07.019
Pascoe D., Karntanut W., Müller C. T. (2003). Do pharmaceuticals affect freshwater invertebrates? A study with the cnidarian Hydra vulgaris. Chemosphere 51, 521–528. doi: 10.1016/S0045-6535(02)00860-3
Pires D. O., Segal B., Caparelli A. C. (2011). Reproductive effort of an endemic major reef builder along an inshore–offshore gradient in south-western Atlantic. J. Mar. Biol. Assoc. United Kingdom 91, 1613–1616. doi: 10.1017/S0025315410000767
Pratchett M. S., Hoey A. S., Tan C. H., Kuo C. Y., Bauman A. G., Kumaraswamy R., et al. (2019). Spatial and temporal variation in fecundity of Acropora spp. in the Northern Great Barrier Reef. Diversity 11, 60. doi: 10.3390/d11040060
Precht W. F., Gintert B. E., Robbart M. L., Fura R., van Woesik R. (2016). Unprecedented disease-related coral mortality in Southeastern Florida. Sci. Rep. 6, 31374. doi: 10.1038/srep31374
Promoting the Quality of Medicines (PQM) (2017). Product Information Report: Amoxicillin (Rockville, Maryland: U.S. Pharmacopeial Convention).
Quiroz S. M., Renteria R. T., Tapia G. G., Miller M. W., Grosso-Becerra M. V., Banaszak A. T. (2023). Coral affected by stony coral tissue loss disease can produce viable offspring. PeerJ 11, e15519. doi: 10.7717/peerj.15519
R Core Team (2013). R: A language and environment for statistical computing (Vienna, Austria: R Foundation for Statistical Computing).
Renegar D. A., Noren H. K., Turner N. R., Figueiredo J., Walker B. K. (2024). Southeast Florida large Orbicella faveolata are highly fecund without evident disease intervention effects. Front. Mar. Sci. 11, 1369222. doi: 10.3389/fmars.2024.1369222
Shilling E. N., Combs I. R., Voss J. D. (2021). Assessing the effectiveness of two intervention methods for stony coral tissue loss disease on Montastraea cavernosa. Sci. Rep. 11, 1–11. doi: 10.1038/s41598-021-86926-4
Studivan M. S., Eckert R. J., Shilling E., Soderberg N., Enochs I. C., Voss J. D. (2023). Stony coral tissue loss disease intervention with amoxicillin leads to a reversal of disease-modulated gene expression pathways. Mol. Ecol. 32, 5394–5413. doi: 10.1111/mec.v32.19
Szmant A. M. (1991). Sexual reproduction by the Caribbean reef corals Montastrea annularis and M. cavernosa. Mar. Ecol. Prog. Ser. 7, 13–25. doi: 10.3354/meps074013
Walker B. K., Noren H., Buckley S., Pitts K. (2021). Optimizing stony coral tissue loss disease (SCTLD) intervention treatments on Montastraea cavernosa in an endemic zone. Front. Mar. Sci. 8, 746. doi: 10.3389/fmars.2021.666224
Keywords: Montastraea cavernosa, Orbicella faveolata, stony coral tissue loss disease (SCTLD), fecundity, amoxicillin, coral reproduction, Florida’s Coral Reef
Citation: Mazurek HE, Neely KL and Renegar DA (2025) The impact of stony coral tissue loss disease and amoxicillin treatments on coral gametogenesis. Front. Mar. Sci. 11:1445735. doi: 10.3389/fmars.2024.1445735
Received: 08 June 2024; Accepted: 23 December 2024;
Published: 22 January 2025.
Edited by:
Joshua Patterson, University of Florida, United StatesReviewed by:
Sonora Meiling, University of the Virgin Islands, US Virgin IslandsAshley Rossin, Louisiana State University of Alexandria, United States
Copyright © 2025 Mazurek, Neely and Renegar. This is an open-access article distributed under the terms of the Creative Commons Attribution License (CC BY). The use, distribution or reproduction in other forums is permitted, provided the original author(s) and the copyright owner(s) are credited and that the original publication in this journal is cited, in accordance with accepted academic practice. No use, distribution or reproduction is permitted which does not comply with these terms.
*Correspondence: Karen L. Neely, a25lZWx5MEBub3ZhLmVkdQ==
 Hannah E. Mazurek
 Karen L. Neely
 D. Abigail Renegar