 Xingxing Wen
 Lingrui Ge
 Kejun Liu
- College of Animal Science and Technology, Hunan Biological and Electromechanical Polytechnic, Changsha, China
Introduction: As the aquaculture industry intensifies to enhance production efficiency and capacity, the risk of disease outbreaks in high-density systems, such as those for largemouth bass, has escalated. This necessitates the exploration of novel strategies for disease prevention and control. Studies have shown that Atractylodes macrocephala polysaccharide (AMP) possesses the functions of promoting growth and enhancing immune capacity, making it a potential feed additive in animal production.
Methods: This study aimed to assess the impact of AMP on the growth performance, serum biochemical indices, and intestinal flora structure of largemouth bass. A total of 360 healthy largemouth bass (mean weight: 15.25 ± 1.29 g) were randomly assigned to four groups, each with three replicates. The groups were fed diets supplemented with 0% (Group D, control group), 0.4% (Group A), 0.8% (Group B), or 1.2% (Group C) AMP for 42 days.
Results: The results showed that the addition of an appropriate amount of AMP in the feed significantly improved the weight gain rate (WGR) and specific growth rate (SGR) of largemouth bass, reduced the feed conversion ratio (FCR), and enhanced growth performance. AMP reduced the levels of AST and ALT, indicating a hepatoprotective effect on largemouth bass, with significant differences from the control group (P < 0.05). AMP also improved the intestinal microbiota composition of largemouth bass, positively affecting intestinal health. The analysis of intestinal microbiota revealed 1,288 amplicon sequence variants (ASVs) in the intestine of largemouth bass in Group B, dominated by Firmicutes and Bacteroidota. In contrast, Group C (1.2%) had 920 ASVs, with Fusobacteriota and Firmicutes as the major components, while the relative abundance of Firmicutes was lower, showing significant differences from the control Group D. The functional analysis of intestinal microbiota based on KEGG showed significant differences (P < 0.05) among the four groups in Carbon metabolism, Biosynthesis of amino acids, and Metabolic pathways.
Discussion: The study concludes that the inclusion of AMP at 0.8% – 1.2% in the feed can enhance the growth performance and intestinal health of largemouth bass, offering a promising strategy for disease prevention and control in intensive aquaculture settings.
1 Introduction
The largemouth bass, a carnivorous fish native to North America, was introduced to China in 1983 (He et al., 2020). It is popular among aquaculturists due to its strong adaptability, rapid growth, ease of catching, and short breeding cycle. In addition, its delicious and nutritious meat, absence of intramuscular bones, and elegant appearance render it suitable for consumption, which leads to promising market prospects, making it one of the main freshwater fish breeding species in China (Zhang and He, 1994; Bai et al., 2008). According to the statistical data from “China Fishery Statistical Yearbook 2023,” the annual output of largemouth bass in China in 2022 was 802,500 tons, with a production value exceeding 20 billion yuan. In pursuit of higher production efficiency and increased capacity, the aquaculture industry is gravitating towards intensification, making largemouth bass vulnerable to diseases under artificial high-density breeding conditions. This necessitates enhanced disease prevention strategies. Research has shown that polysaccharides can reduce the incidence of diseases by enhancing the immunity of animals, serving as potential immune enhancers (Huang et al., 2015; Kong et al., 2020; Li et al., 2019; Wang et al., 2023). Atractylodes macrocephala Polysaccharide (AMP), an extract of the traditional Chinese medicine Atractylodes macrocephala, is the core active ingredient of the herb. It possesses pharmacological effects such as immune regulation, gastrointestinal mucosa protection, liver protection, antibacterial, and antioxidant properties, making it an efficient, low-toxicity, and well-defined polysaccharide from traditional Chinese medicine (National Pharmacopoeia Commission, 2020; Bailly, 2021). As a feed additive, AMP is widely used in animal production. AMP has significant effects on promoting growth, enhancing macrophage phagocytosis, and enhancing cellular and humoral immunity in livestock and poultry within a certain dose range (Yang et al., 2018; Wang et al., 2023). In the aquaculture industry, studies have also found that extracts of Atractylodes macrocephala can improve the growth performance and disease resistance of Macrobrachium nipponense, Oncorhynchus mykiss, and Pseudobagrus fulvidraco (Bai et al., 2023; Lu et al., 2024; Zhuo et al., 2022). Currently, there are few reports on the application of AMP as a feed additive in largemouth bass, and its mechanism of action remains unclear. Therefore, this study takes largemouth bass as the research subject, analyzing the effects of different addition levels of AMP on the growth performance, serum biochemical indicators, and intestinal flora of largemouth bass. This marks the first comprehensive exploration of the optimal additive concentration range of AMP in largemouth bass, aiming to provide a theoretical basis for the application of AMP in the basic feed for largemouth bass aquaculture.
2 Materials and methods
2.1 Experimental feed design
Three experimental diets with a control were prepared. The nutritional composition and levels of the experimental feeds are shown in Table 1. The protein sources for the test feeds were imported fishmeal, soybean meal, and other raw materials, while the fat sources were fish oil, peanut oil, and other raw materials. The experimental diet contained three concentrations of 0.4%, 0.8%, or 1.2% AMP. The control did not add AMP. AMP was purchased from Shanxi Senyuan Biotechnology Co., Ltd., Xi’an, China. The initial materials were crushed using an 80-mesh screen to remove large particles and then precisely weighed according to the specific feed formula’s proportions. The mixed feed was put into a batch mixer, where a measured amount of distilled water was added to ensure thorough blending. Subsequently, a ring die granulator was employed to shape the mixed feed into pellets with a standardized diameter of 1.5 mm. These pellets were then dried in an oven at 60 °C. Finally, the feed was air-dried and collected in sealed bags, which were subsequently placed in a freezer at a temperature of -25°C for preservation.
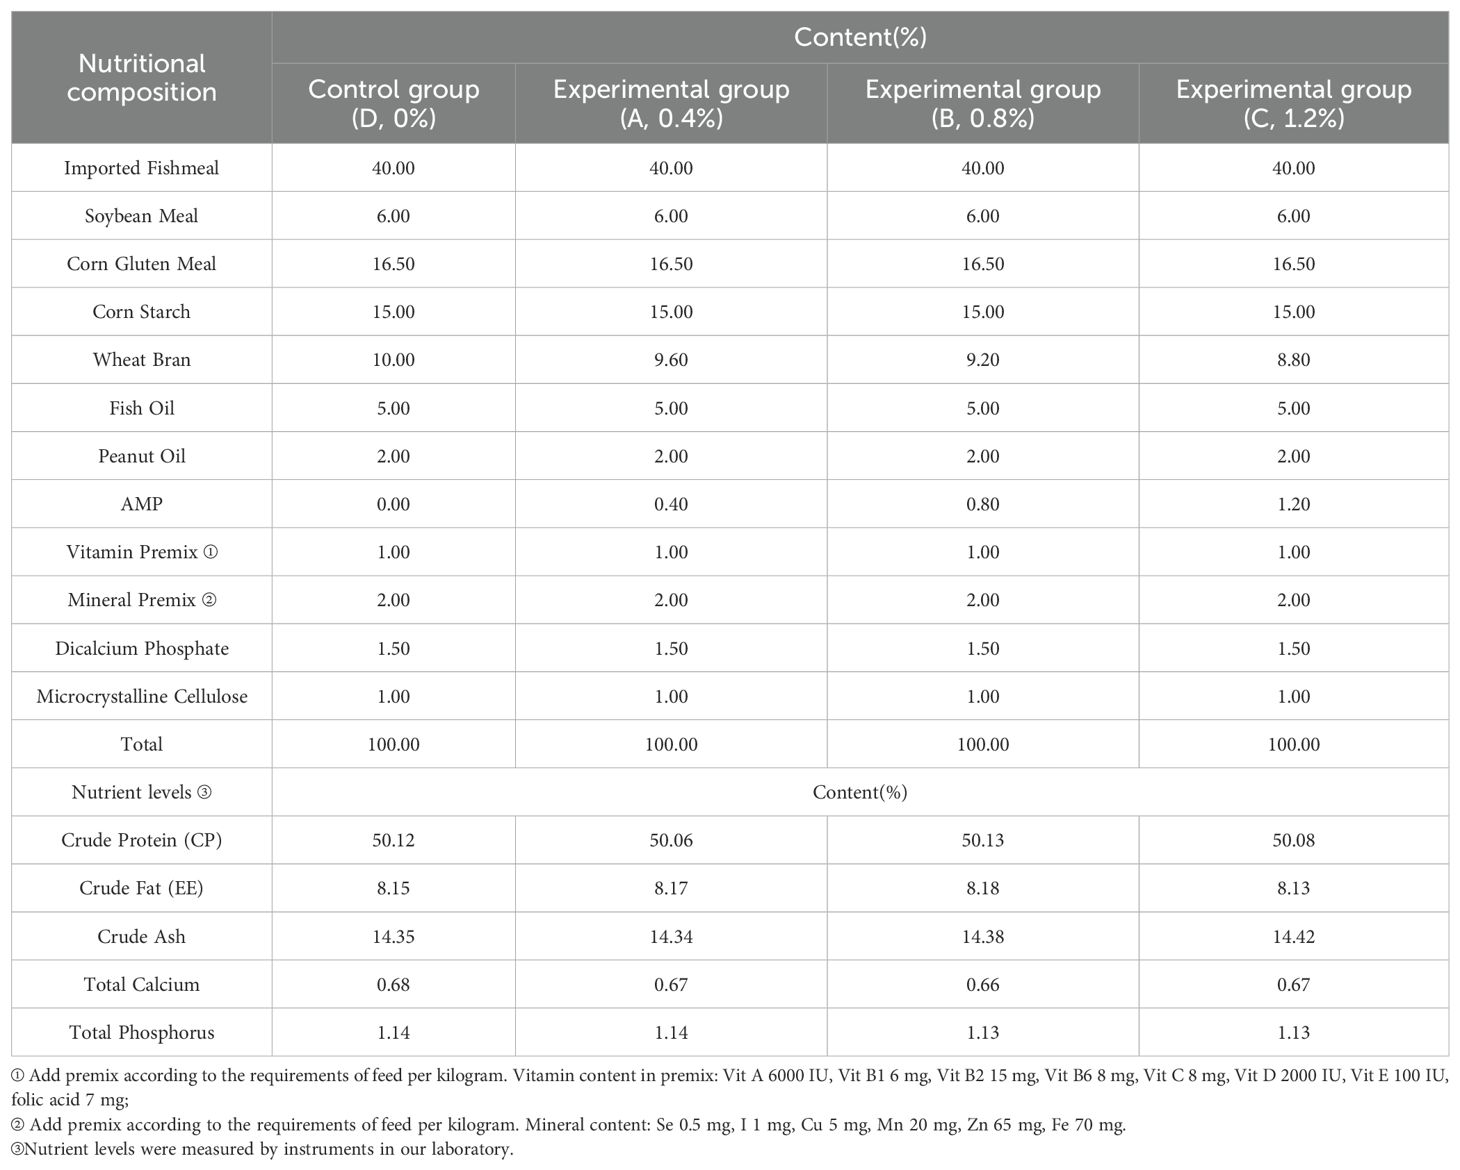
Table 1. Nutrient composition and nutrient level of experimental feed.
2.2 Husbandry methods
The largemouth bass were obtained from Hunan Aoyu Aquaculture Co., Ltd. (Yueyang, China) and were temporarily reared in a laboratory recirculating aquaculture system for 2 weeks to adapt to the environment, during which they were fed a basic diet ad libitum every day. All animals studies were performed according to protocols approved by the Animal Care Advisory Committee of Animal Science and Technology, Hunan Biological And Electromechanical Polytechnic. A total of 360 healthy largemouth bass (mean weight: 15.25 ± 1.29 g) were randomly divided into four groups with three parallel sets in each group. Each group was fed a diet supplemented with 0% (Group D, control group), 0.4% (Group A), 0.8% (Group B), and 1.2% (Group C) AMP for 42 days. The largemouth bass were raised in an indoor culture barrels (200 L) with water exchanged once every two weeks to ensure optimal growth conditions. During the experiment, the water temperature in the tanks was maintained at 23-25 °C. The feeding amount for the largemouth bass was determined based on their body weight, and feeding was conducted at 7:00 am, 12:00 pm, and 6:00 pm every day and adjusted promptly according to feeding intensity or other factors. The remaining feed was collected one hour after each feeding to avoid its influence on water quality. Regular inspections were conducted, and the water quality in the barrels was monitored daily, including dissolved oxygen, ammonia nitrogen, pH, and water temperature, to ensure favorable breeding conditions. At 42 d, The growth performance of each group was tested and 8 largemouth bass were randomly selected from each group, and serum immune indexes and intestinal microbial population data were collected. The control group (Group D) consisted of largemouth bass labeled D1-D8, while the experimental groups (Groups A, B and C) consisted of largemouth bass labeled A1-A8, B1-B8 and C1-C8 respectively.
2.3 Measurement and calculation of growth performance
Each group of largemouth bass individuals was weighed on day 42 of the experiment, and the body weight gain, body length and number of deaths of largemouth bass were recorded. The daily food intake of largemouth bass was calculated, and the liver mass of largemouth bass was weighed. The following formulae were used to calculate growth performance of largemouth bass:
The variables used in the calculations were as follows: W2 represents the body mass of largemouth bass at 42 d; W1 represents for the initial mass of largemouth bass; t represents the number of days of testing largemouth bass; WTF represents for the total feed intake during the trial phase of largemouth bass per replicate; WTG represents total weight gain per replicate; Wh represents for the liver mass of largemouth bass; N2 represents for the final quantity; N1 represents the initial number of largemouth bass.
2.4 Determination of serum indexes
After the feeding, 8 largemouth bass were randomly selected from each group for blood collection. Blood was collected from the tail vein of the fish using a 2 mL sterile syringe. The blood samples were refrigerated at 4 °C for 4 h, and then centrifuged at 4 °C and 5000 RPM for 10 minutes. Subsequently, the serum was separated and analyzed for various indicators. The kits from Nanjing Jiancheng Bioengineering Institute were utilized to detect biochemical parameters like cholesterol (CHOL), triglyceride (TG), alkaline phosphatase (ALP), total protein (TP), serum albumin (ALB), aspartate aminotransferase (AST), and alanine aminotransferase (ALT). Additionally, serum immune indices including superoxide dismutase (SOD), malondialdehyde (MDA), complement C3, and C4 were also measured.
2.5 Intestinal microflora changes and bioinformatics analysis
2.5.1 Intestinal sample collection
In order to study the microbial population in the intestinal tract of largemouth bass, the intestinal tracts of largemouth bass in the experimental group and the control group were sampled respectively. Before sampling, we anesthetized the largemouth bass by placing them in water to which 100 μg MS-222 had been added per liter of water for 2 min. After removal, wipe 75% ethanol on the body surface of the largemouth bass quickly disassembled and removed the intestine, and squeezed the intestinal contents into a 5 ml centrifuge tube. The samples were then frozen with liquid nitrogen and stored at -80 °C for analysis of intestinal flora changes of largemouth bass.
2.5.2 Analysis of microflora changes in intestinal samples
The intestinal genome DNA of largemouth bass was extracted and sequenced using the combined multiomics technology of Shanghai OE Biotech Co., Ltd. Genomic DNA extraction was performed using a dedicated DNA extraction kit, and its concentration was accurately determined through agarose gel electrophoresis and NanoDrop spectrophotometric analysis. This purified genomic DNA served as the template for defining the sequencing region, with specific primers added to ensure thorough mixing. The resulting mixture was then processed in a Takara PCR instrument, ensuring the validity and precision of the detection values.
The FASTQ-formatted raw data underwent primer sequence trimming using cutadapt software. Subsequently, DADA2 processed the raw sequences in accordance with Qiime2’s established protocols, yielding high-quality sequences and ASV abundance tables. The diversity of the obtained data was analyzed, and the intestinal microflora information of largemouth bass was obtained through various algorithms. This information was used to analyze the changes of intestinal microflora of largemouth bass by AMP.
2.6 Statistical analysis
Statistical analysis was performed according to Excel to sort out the recorded data. The recorded data results were expressed as (Mean ± SD). The normality of the data was tested by SPSSAU, and then Duncan was used to conduct one-way ANOVA on the obtained data to find significant differences between the data (P < 0.05).
3 Results
3.1 Changes in growth performance
According to Table 2, it can be seen that the WGR and SGR of largemouth bass with AMP added to the feed exhibited an upward trend within a certain concentration range. The WGR and SGR of each experimental group were significantly improved compared to the control group (P < 0.05), with Group B (0.8% AMP) demonstrating the best effect. The feed coefficient of each experimental group decreased significantly compared to the control group (P < 0.05). However, there was no significant difference between Group B (0.8% AMP) and Group C (1.2% AMP) (P > 0.05). The hepatosomatic index (HSI) of each experimental group was significantly lower than that of the control group (P < 0.05), and the HSI increased with the increase in concentration among the experimental groups. However, there was no significant difference between the experimental groups. (P > 0.05).
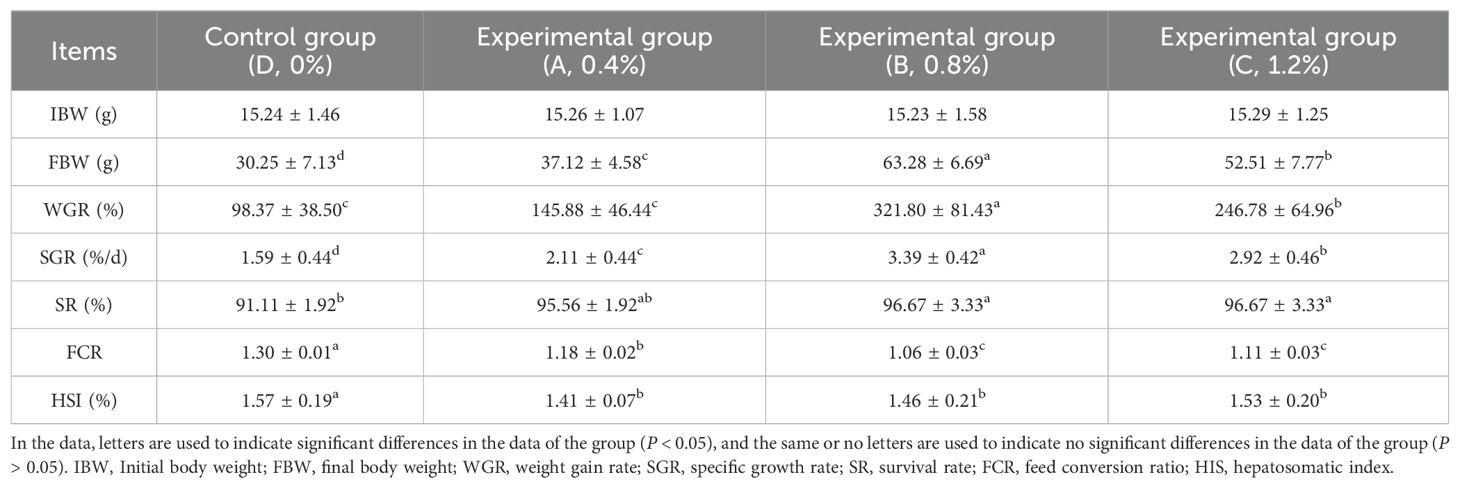
Table 2. Growth performance of largemouth bass.
3.2 Changes in serum biochemical indicators
3.2.1 Effect of AMP on serum liver function indicators
The serum liver function index data are shown in Table 3. There were no significant differences in the levels of TP and ALB in the serum of largemouth bass among the experimental groups, except for Group C (1.2% AMP) where the TP level decreased slightly and was significantly different from the control group and other experimental groups. The levels of AST and ALT showed a downward trend with increasing amounts of AMP added within a certain range and were significantly different from the control group (P < 0.05). The ALP level showed an upward trend with increasing amounts of AMP added within a certain range. Compared to the control group, Groups A and B did not have significant differences, while Group C (1.2% AMP) had a significant increase compared to the control group.
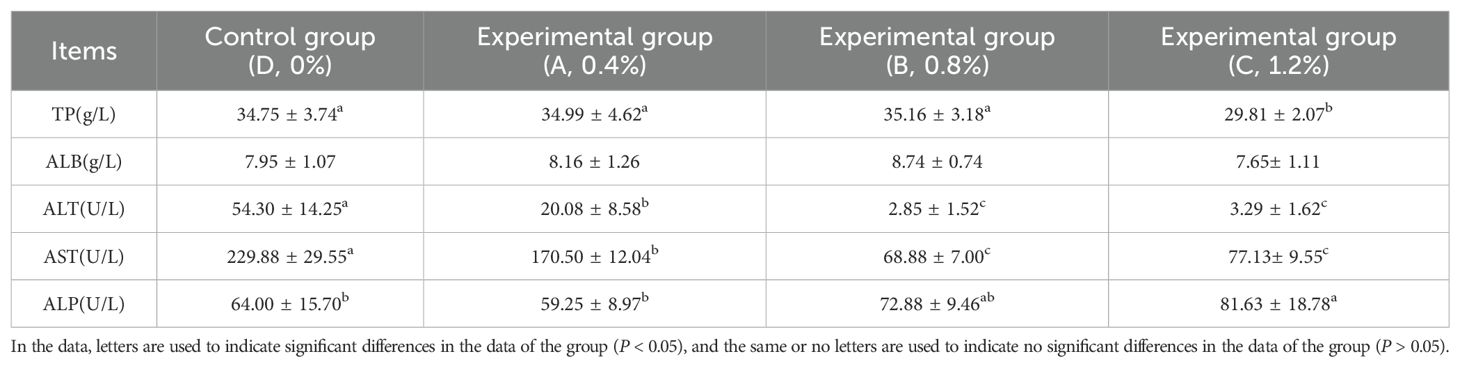
Table 3. Serum liver function indicators of largemouth bass.
3.2.2 Effect of AMP on lipid metabolism indicators
As shown in Table 4, with the increasing dosage of AMP, the levels of TG and CHOL in the serum of the experimental groups exhibited a trend of initially increasing and then decreasing. Specifically, the TG level in the high-dosage group (Group C, 1.2% AMP) was significantly lower than that of the other groups (P < 0.05), while the TG levels in the low-dosage group (Group A, 0.4% AMP) and the medium-dosage group (Group B, 0.8% AMP) were significantly higher than that of the control group (P < 0.05). In terms of CHOL levels, Group A and Group C were significantly lower than the control group, while there was no significant difference between Group B and the control group.
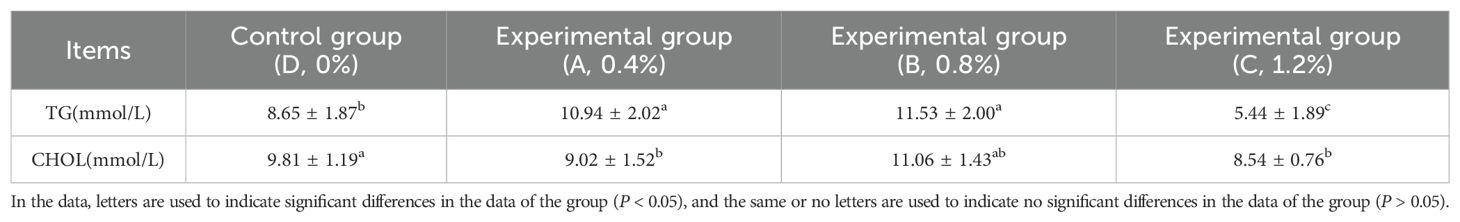
Table 4. Serum lipid metabolism indicators of largemouth bass.
3.2.3 Effect of AMP on serum antioxidant and non-specific immune indicators
As shown in Table 5, with the increase in the dosage of AMP, the SOD content in each experimental group exhibited a trend of first increasing and then decreasing. Group B (0.8% AMP) was significantly higher than the other groups (P < 0.05). Additionally, the MDA content in each experimental group was significantly lower than that in the control group, with Group B (0.8% AMP) being significantly lower than the other groups (P < 0.05). Furthermore, the C3 content of each experimental group was higher than that of the control group, and Group B (0.8% AMP) showed a significantly higher content than the other groups (P < 0.05). However, there was no significant difference in C4 content among the remaining groups.
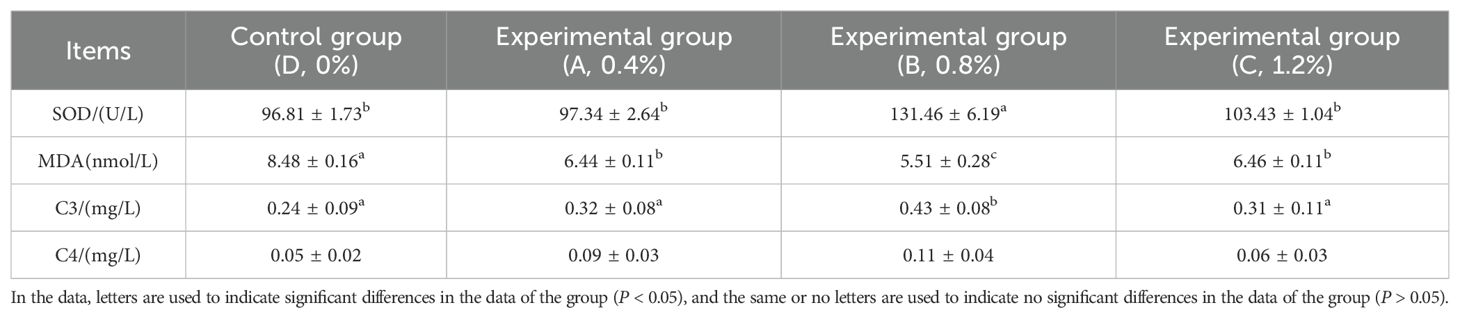
Table 5. Serum antioxidant and non-specific immune indicators of largemouth bass.
3.3 Structural characteristics of intestinal flora
3.3.1 Analysis of differences in intestinal flora groups
The changes in intestinal flora may be the primary reason for the enhancement of largemouth bass growth and metabolic levels by AMP. The structure of intestinal flora was studied using 16S rDNA amplicon sequencing technology. First, principal co-ordinates analysis (PCoA) was performed based on Weighted Unifrac distance to reflect the beta diversity of different groups. The PCoA plot (Figure 1) showed that the intestinal flora of Group C was significantly different from that of groups A, B, and D [permutation multivariate analysis of variance (PerMANOVA), P=0.001], indicating that Group C formed a unique flora.
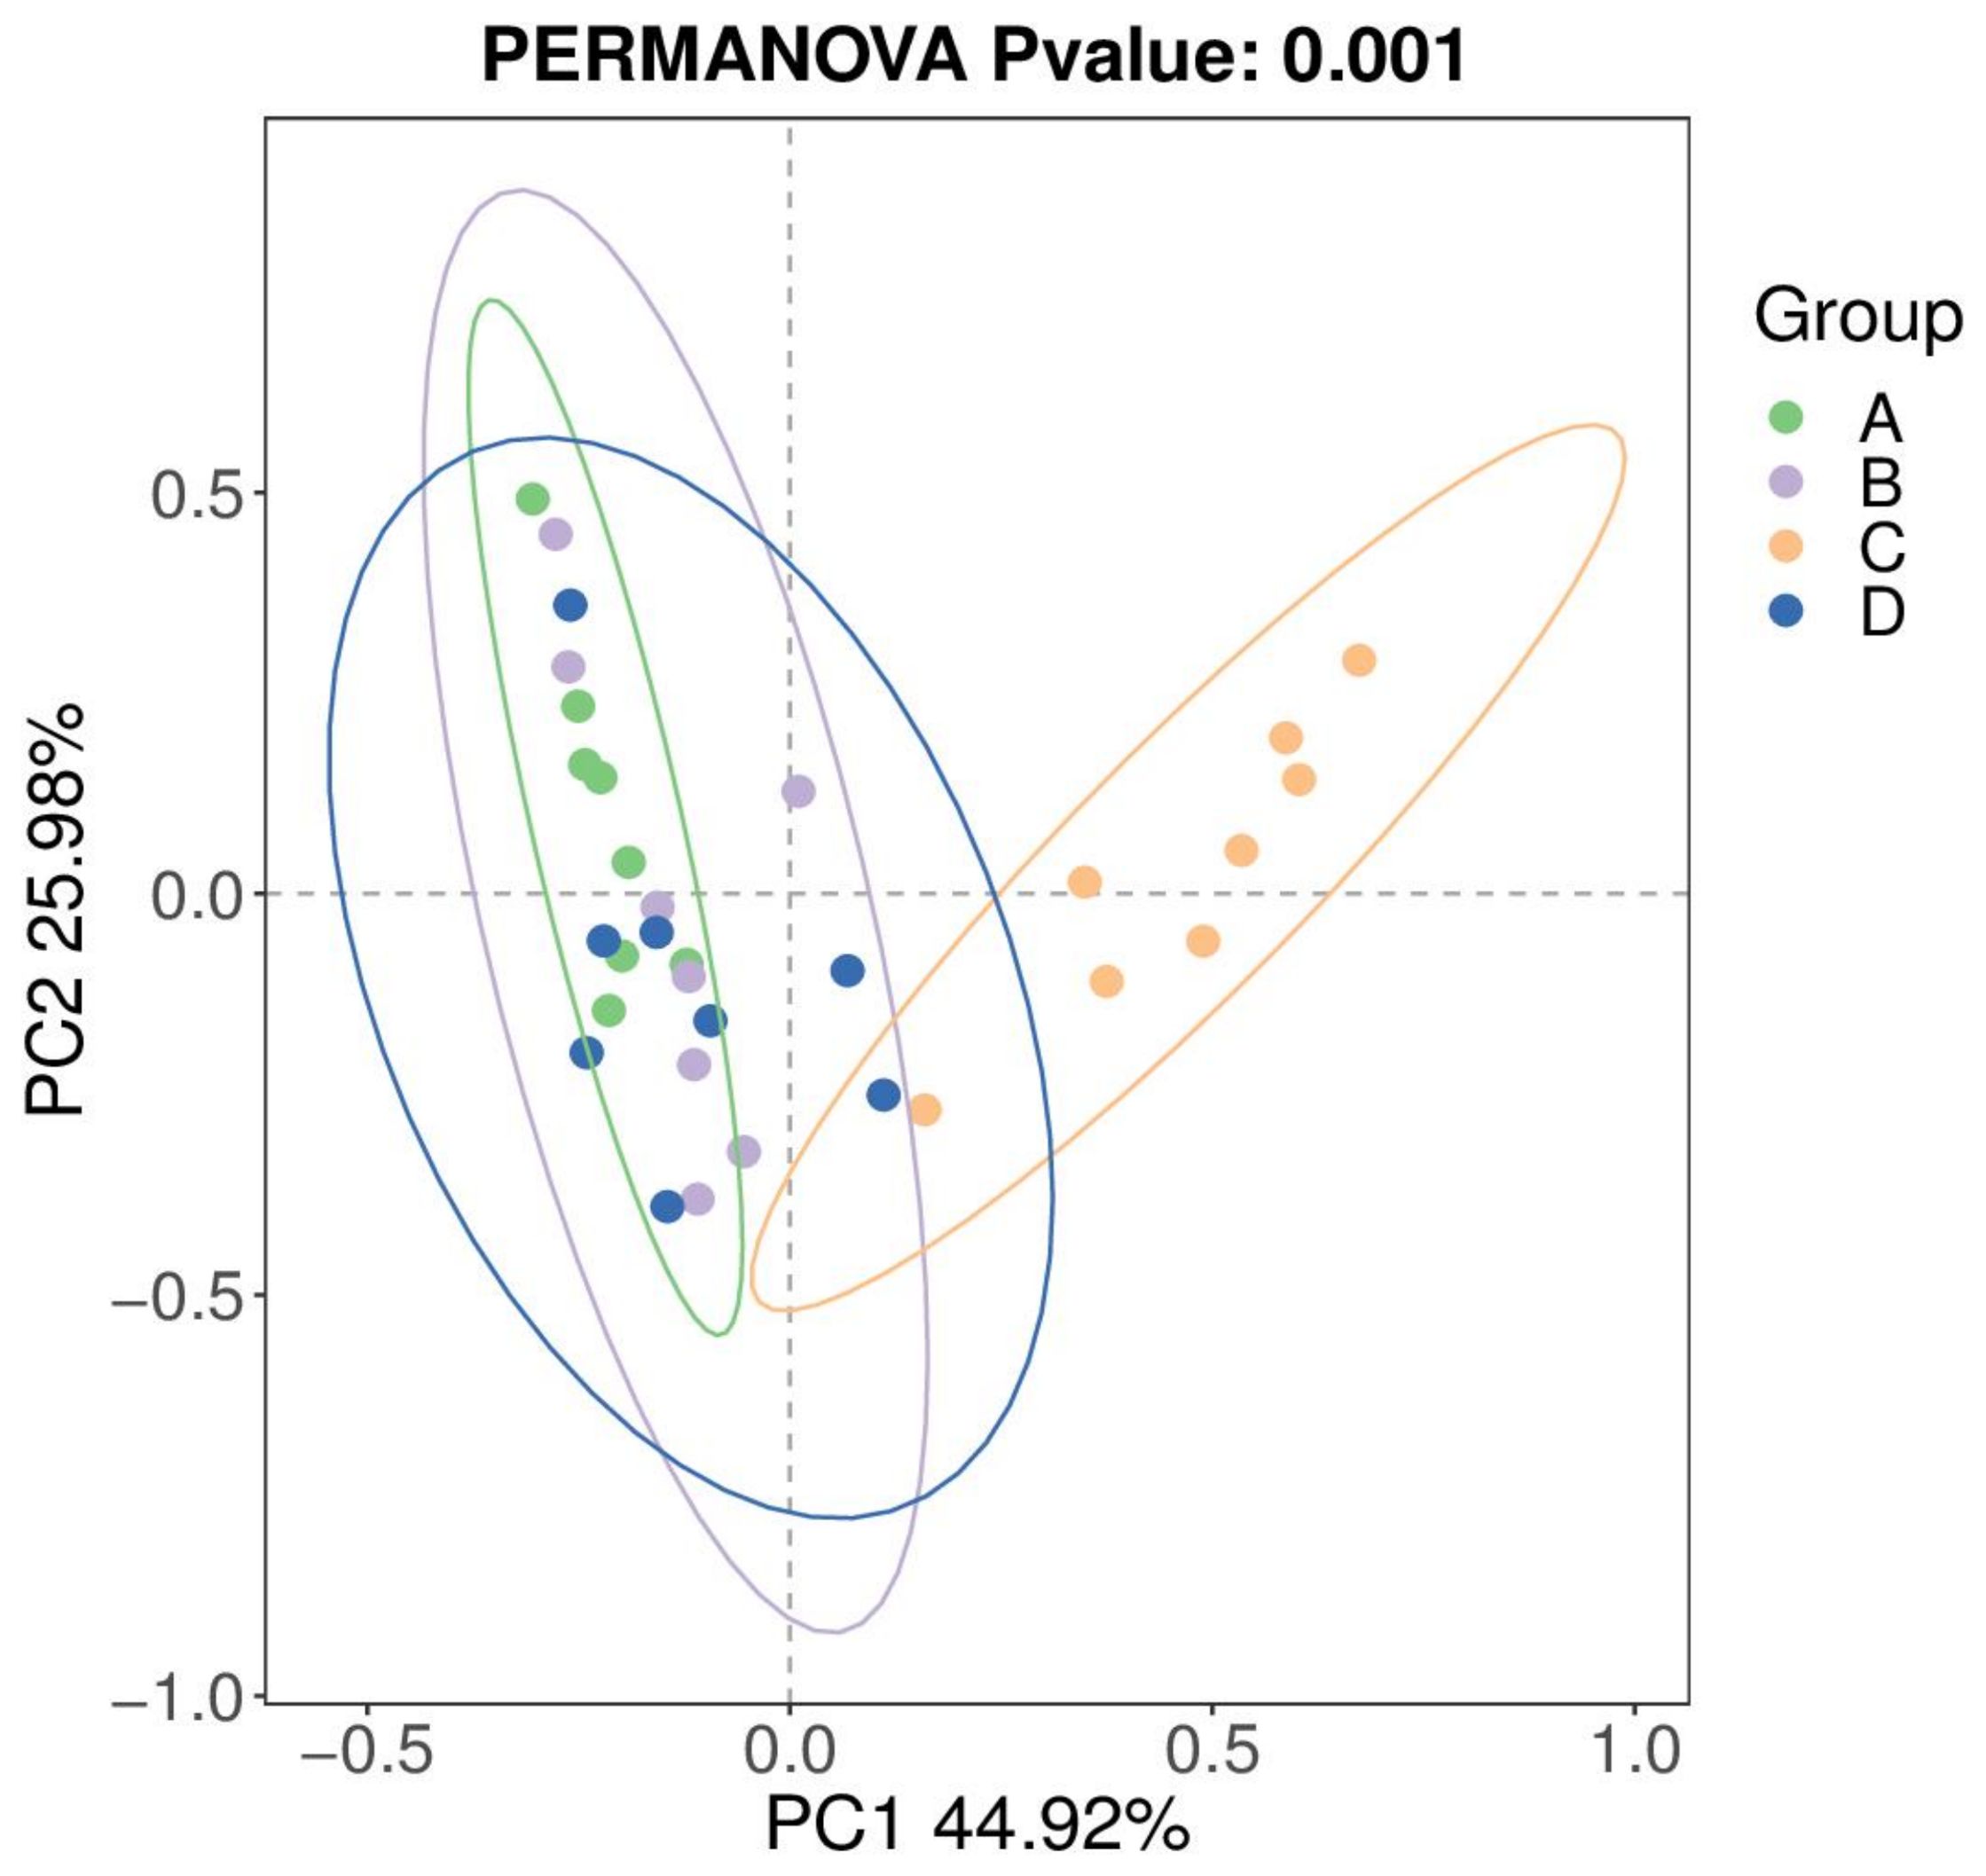
Figure 1. PCOA based on Weighted Unifrac distance. Each point in the figure represents a sample, samples in the same group are represented by the same color, and the color area represents the confidence interval. A1-8 are the 8 samples from Group A; B1~8 are the 8 samples from Group B; C1~8 are the 8 samples from Group C; D1~8 are the 8 samples from Group D. FIGURE 2, FIGURE 4 and FIGURE 5 are the same.
3.3.2 Characteristics and changes of intestinal flora
Analysis of the composition and structure of the intestinal flora revealed that Group B (0.8% AMP) possessed the highest number of ASVs (amplicon sequence variants) in largemouth bass intestinal flora, reaching 1288 species, followed by groups D (0% AMP) and C (1.2% AMP) with 943 and 920 species respectively, and group A (0.4% AMP) had the least (714 species). There were few shared ASVs among the four groups, indicating significant individual differences among the samples within each group. Specifically, each sample shared only 2 ASVs (Figures 2A, B).
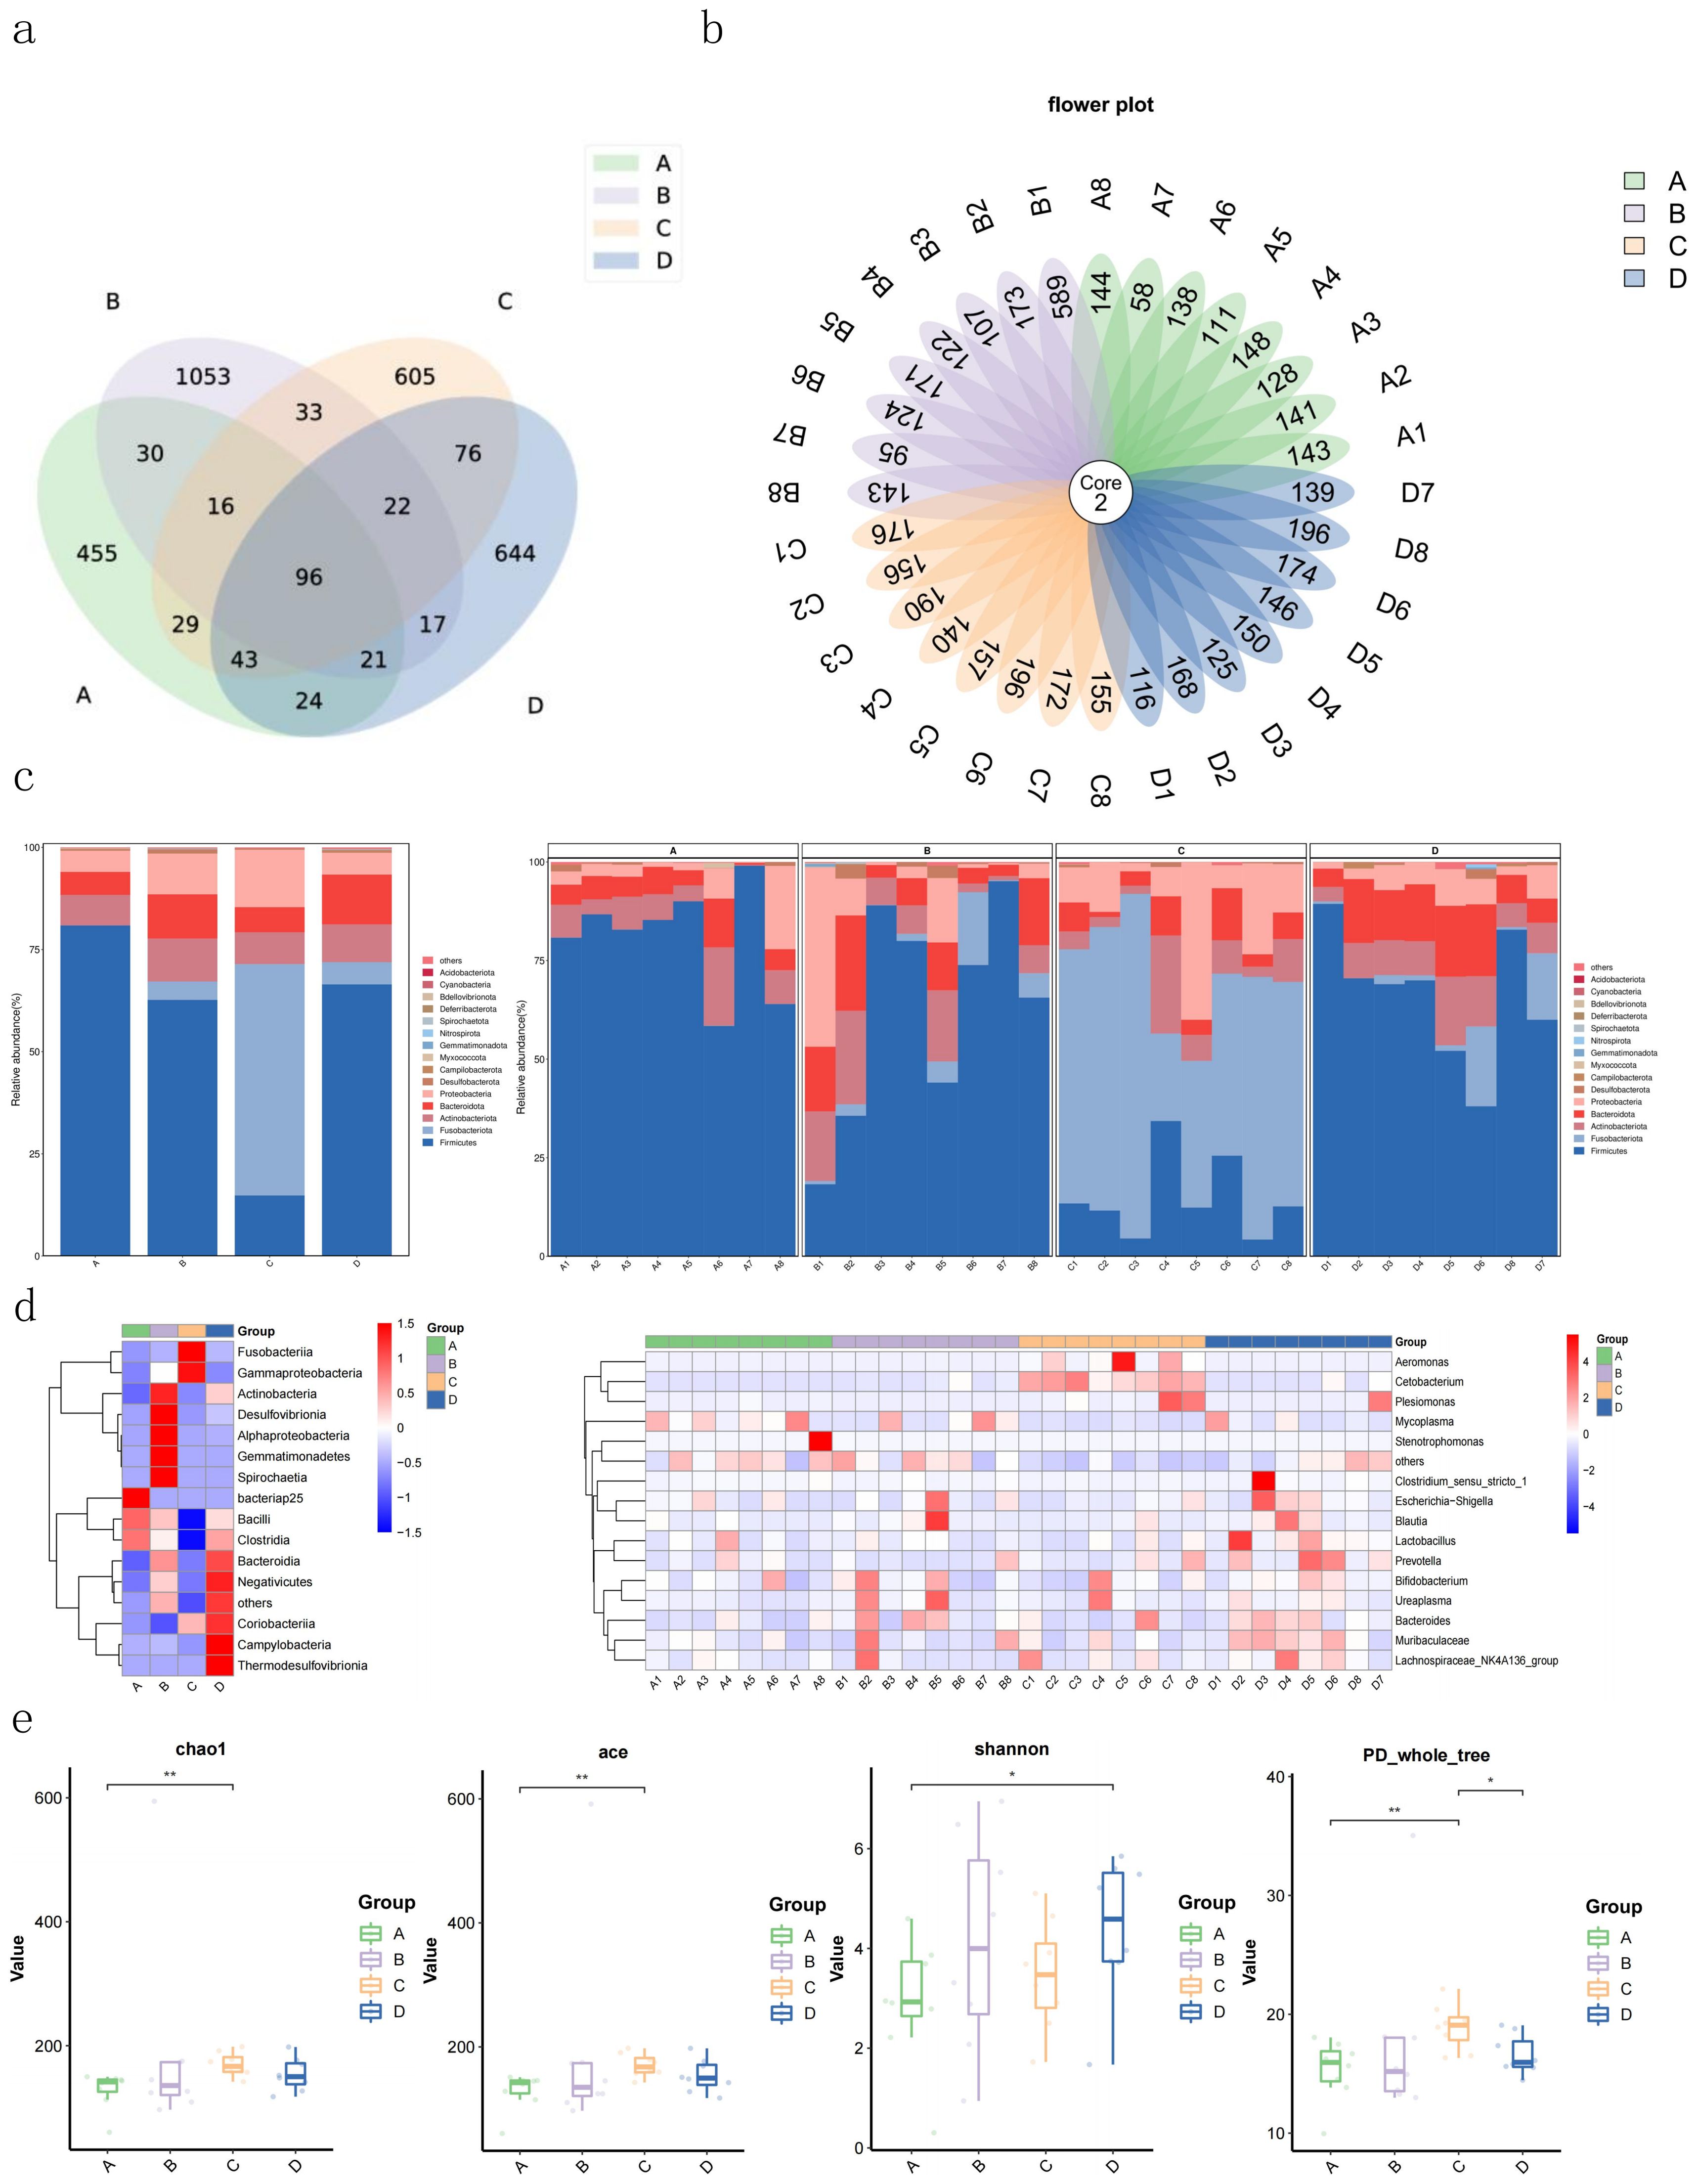
Figure 2. Effects of AMP on Intestinal Microflora of Largemouth Bass. (A, B) Venn diagram based ASVs; (C) relative abundance analysis of dominant bacterial phyla in intestinal microflora; (D) heatmap of species abundance at genus level of intestinal microflora for each sample and each group; (E) diversity analysis. In the figure, * mean P < 0.05, ** mean P <0.01, and *** mean P < 0.001.
Differences were observed in the intestinal flora structure of largemouth bass among the groups (Figure 2C). In Group A (0.4% AMP), the relative abundance of Firmicutes, Actinobacteriota, Bacteroidota, and Proteobacteria accounted for over 99%, with Firmicutes comprising 80.9%. In Group B (0.8% AMP), the relative abundance of Firmicutes, Bacteroidota, and Actinobacteriota totaled more than 84%, with Firmicutes accounting for 62.7%. Group D (0% AMP) exhibited a relative abundance of Firmicutes, Bacteroidota, Actinobacteriota, Fusobacteriota, and Proteobacteria that exceeded 98%, with Firmicutes comprising 66.5%. Notably, Group C (1.2% AMP) differed significantly from groups A, B, and D, with Fusobacteriota, Firmicutes, and Proteobacteria accounting for 85.5%, of which Fusobacteriota comprised 56.6%.
Cluster analysis was performed on the top 15 bacterial genera with relative abundance, and a heat map was drawn (Figure 2D). It was evident that the relative abundance of the four groups differed significantly at the genus level. When comparing the variations in bacterial abundance among individual samples, we found that in Group A (0.4% AMP), the relative abundance of Mycoplasma and others was high. In Group B (0.8% AMP), the relative abundance of Bifidobacterium, Bacteroides, and others was relatively high. In Group C (1.2% AMP), the relative abundance of Cetobacterium and Aeromonas was relatively high. In Group D (0% AMP), the relative abundance of Prevotella, Bacteroides, Muribaculaceae, and others was relatively high, and there were significant abundance differences among the different groups. Additionally, the abundance of Cetobacterium and Aeromonas in Group C (1.2% AMP) was lower compared to other groups.
The alpha diversity index of the intestinal flora can intuitively reflect the species diversity within each group. As shown in Figure 2E, there are differences in the Chao1 index, ACE index, Shannon index, Simpson index, and PD_whole_tree index among the four groups. Specifically, the median values of Chao1 index, ACE index, and PD_whole_tree index were Group C > Group D > Group A > Group B. The median values of Shannon index and Simpson index were Group C > Group B > Group D > Group A.
3.3.3 Analysis of differential bacterial groups
In order to further analyze the differences in the composition of intestinal flora in each group, LEfSe analysis was performed to find biomarkers in each group. From the bar chart showing the distribution of linear discriminant analysis (LDA) scores in Figure 3A, we can see that 9 biomarkers were discovered in the intestinal microbiota of Group A (0.4% AMP), with 8 having LDA scores greater than 4, including Firmicutes, Bacilli, Mycoplasma, Mycoplasmatales, Mycoplasmataceae, Clostridiales, Clostridiaceae, and Clostridia. In Group B (0.8% AMP), 4 biomarkers were identified, with only 1 having an LDA score greater than 4, belonging to the class Acidimicrobiia. Group C (1.2% AMP) exhibited 18 biomarkers, with 10 having LDA scores greater than 4, including Fusobacteriia, Fusobacteriota, Fusobacteriales, Fusobacteriaceae, Cetobacterium, Aeromonadales, Aeromonadaceae, Aeromonas, Ruminobacter, and Alloscardovia. 7 biomarkers were found in the intestinal microbiota of Group D (0% AMP), with only 1 having an LDA score greater than 4, belonging to the genus Gardnerella.
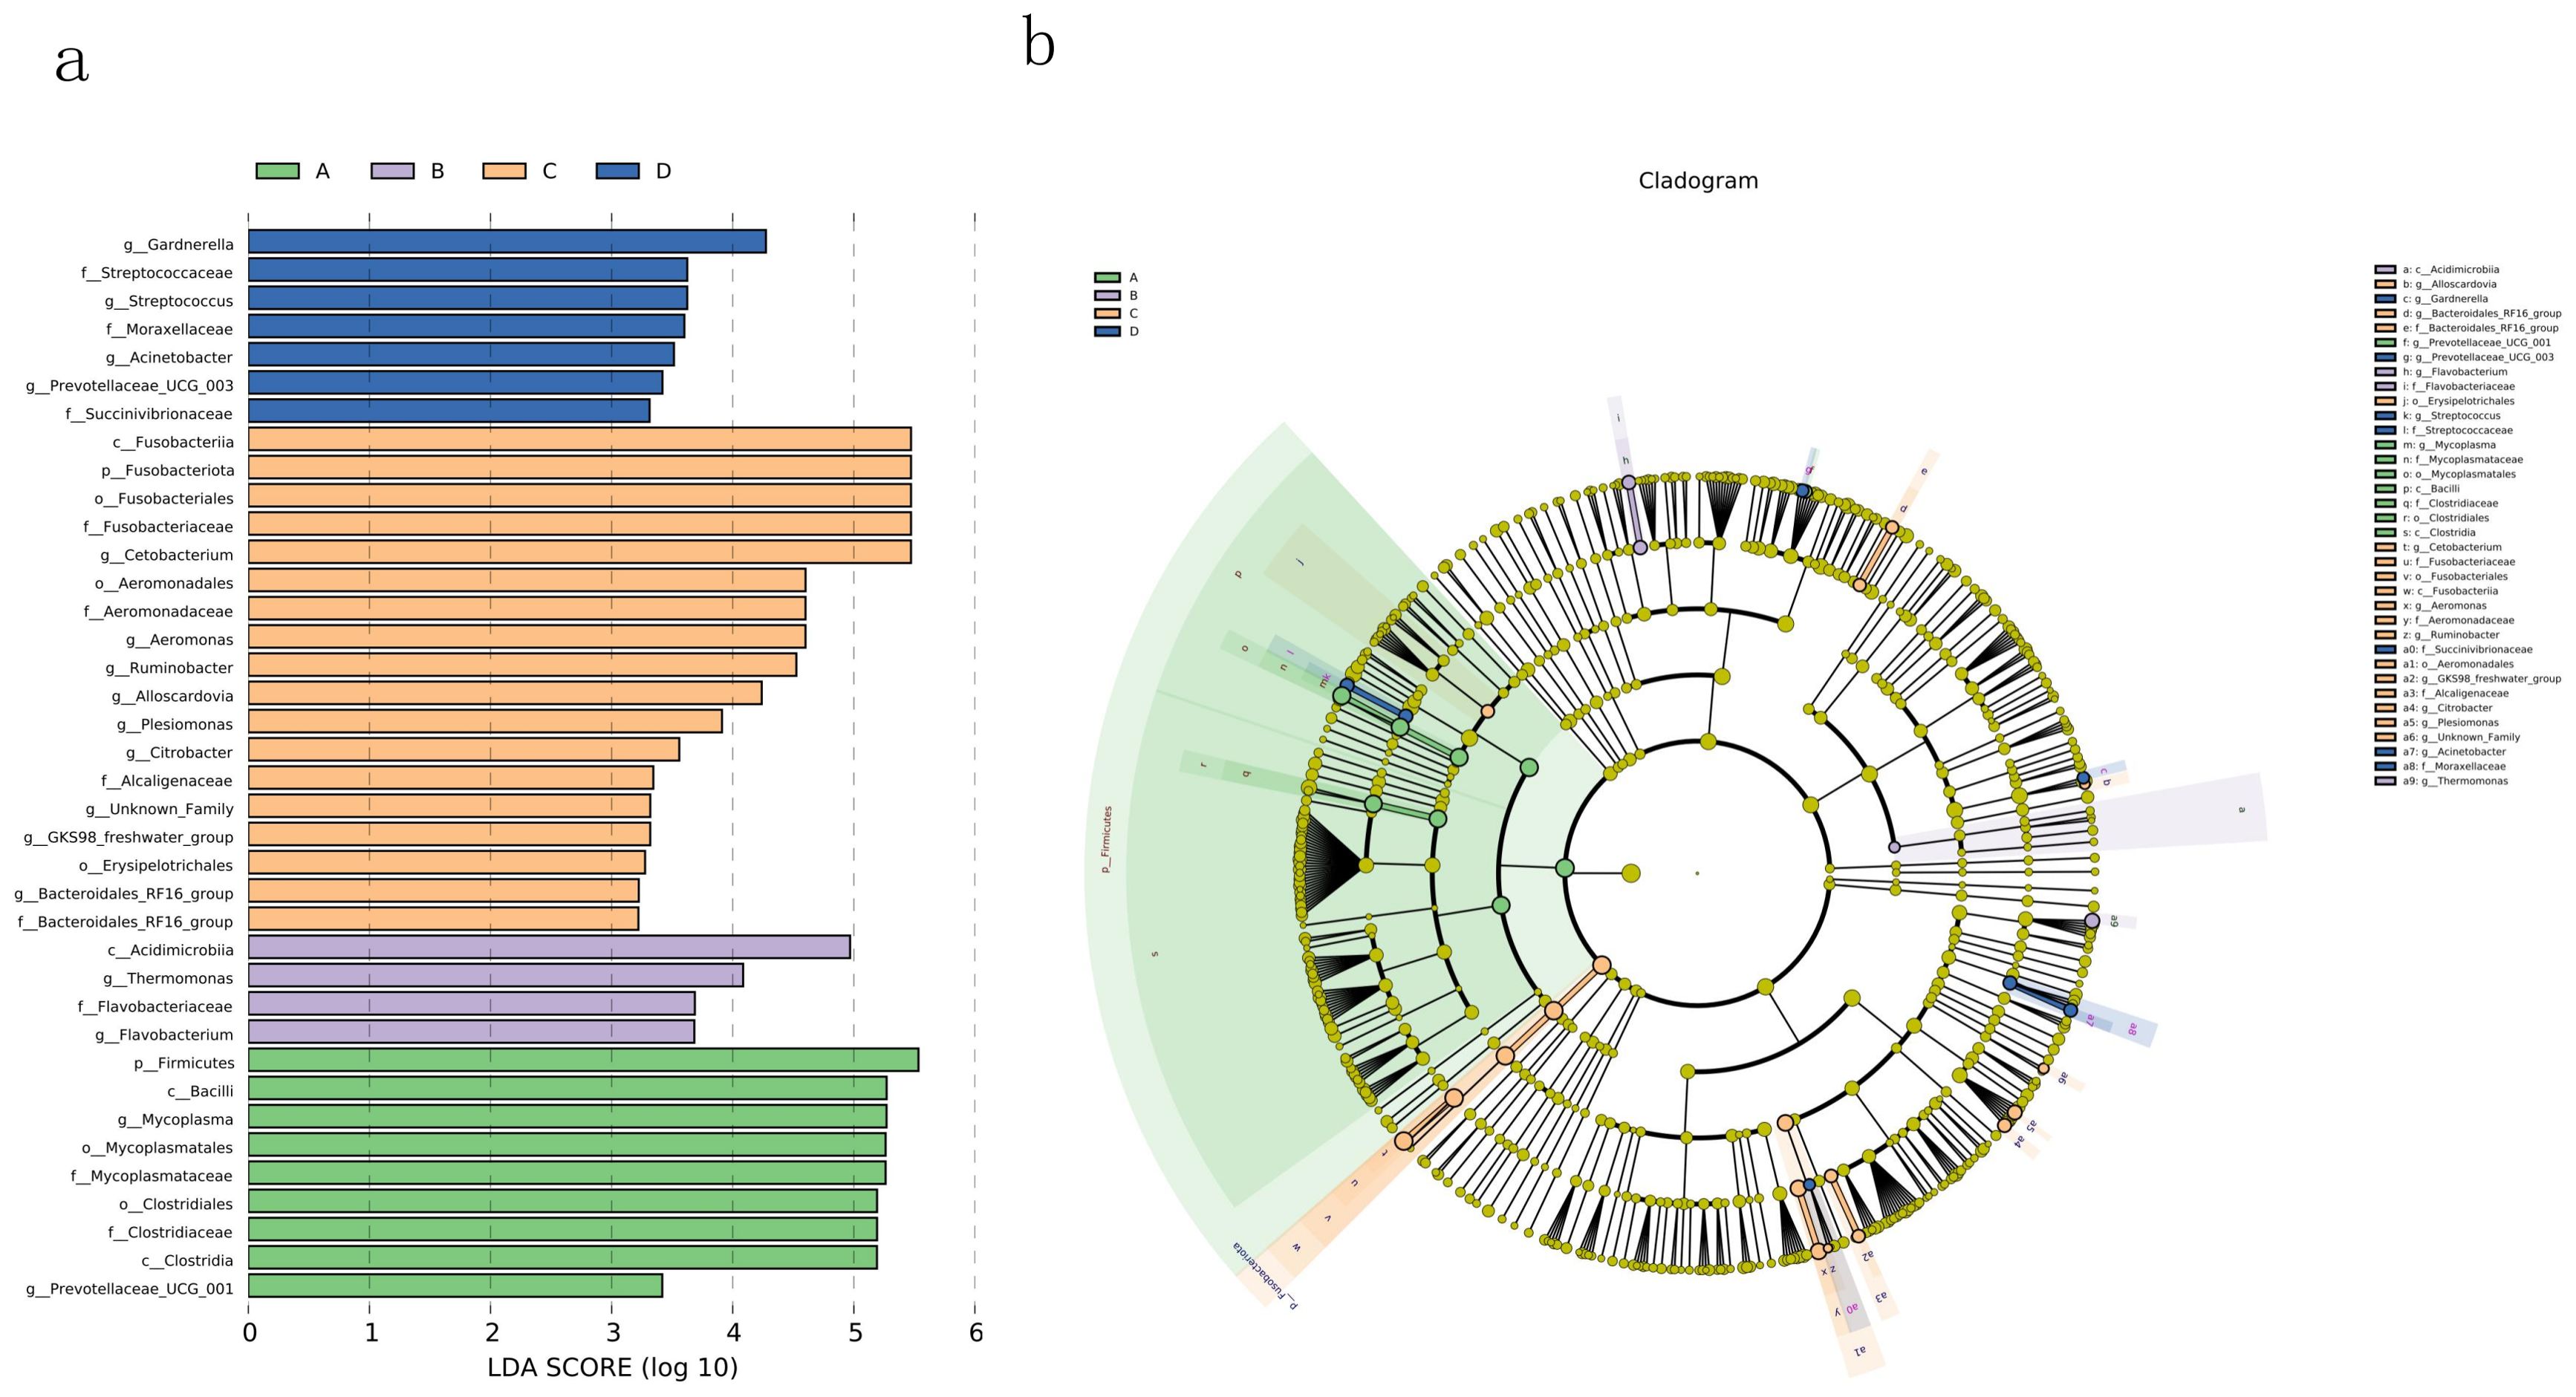
Figure 3. LEfSe analysis identified the biomarkers in different groups. (A) The LDA score distribution histogram mainly displays the species with LDA scores greater than the preset values (less strict sets as 2; more strict sets as 4), indicates that the biomarker has statistical difference; the color of the bar represents their respective groups, while the length represents the LDA score. (B) In the cladogram, the circle radiating from inside to outside in the diagram represents the classification level from kingdom (single circle) to genus (or species); each small circle at different classification levels represents a classification at that level, and the diameter of the small circle is proportional to the relative abundance. Different colors represent the microbial groups that play an important role in each group.
As shown in the cladogram (Figure 3B), the biomarkers in Group C (1.2% AMP) are not only numerous but also distributed across multiple distant genetic evolutionary branches.
The relative abundance box plot of the top 10 differential bacterial genera (biomarkers) between groups (Figure 4A) and the relative abundance heat map of the top 15 differential bacterial genera (biomarkers) between samples (Figure 4B) shows that Bacteroidales_RF16_group, Mycoplasma, and Others have higher abundance in Group A (0.4% AMP), Mycoplasma has higher abundance in Group B (0.8% AMP), Alloscardovia, Cetobacterium, Ruminobacter, and Citrobacter are commonly found in relatively higher abundance in each sample in Group C (1.2% AMP). In Group D (0% AMP), The abundance of Acinetobacter and Streptococcus was higher.
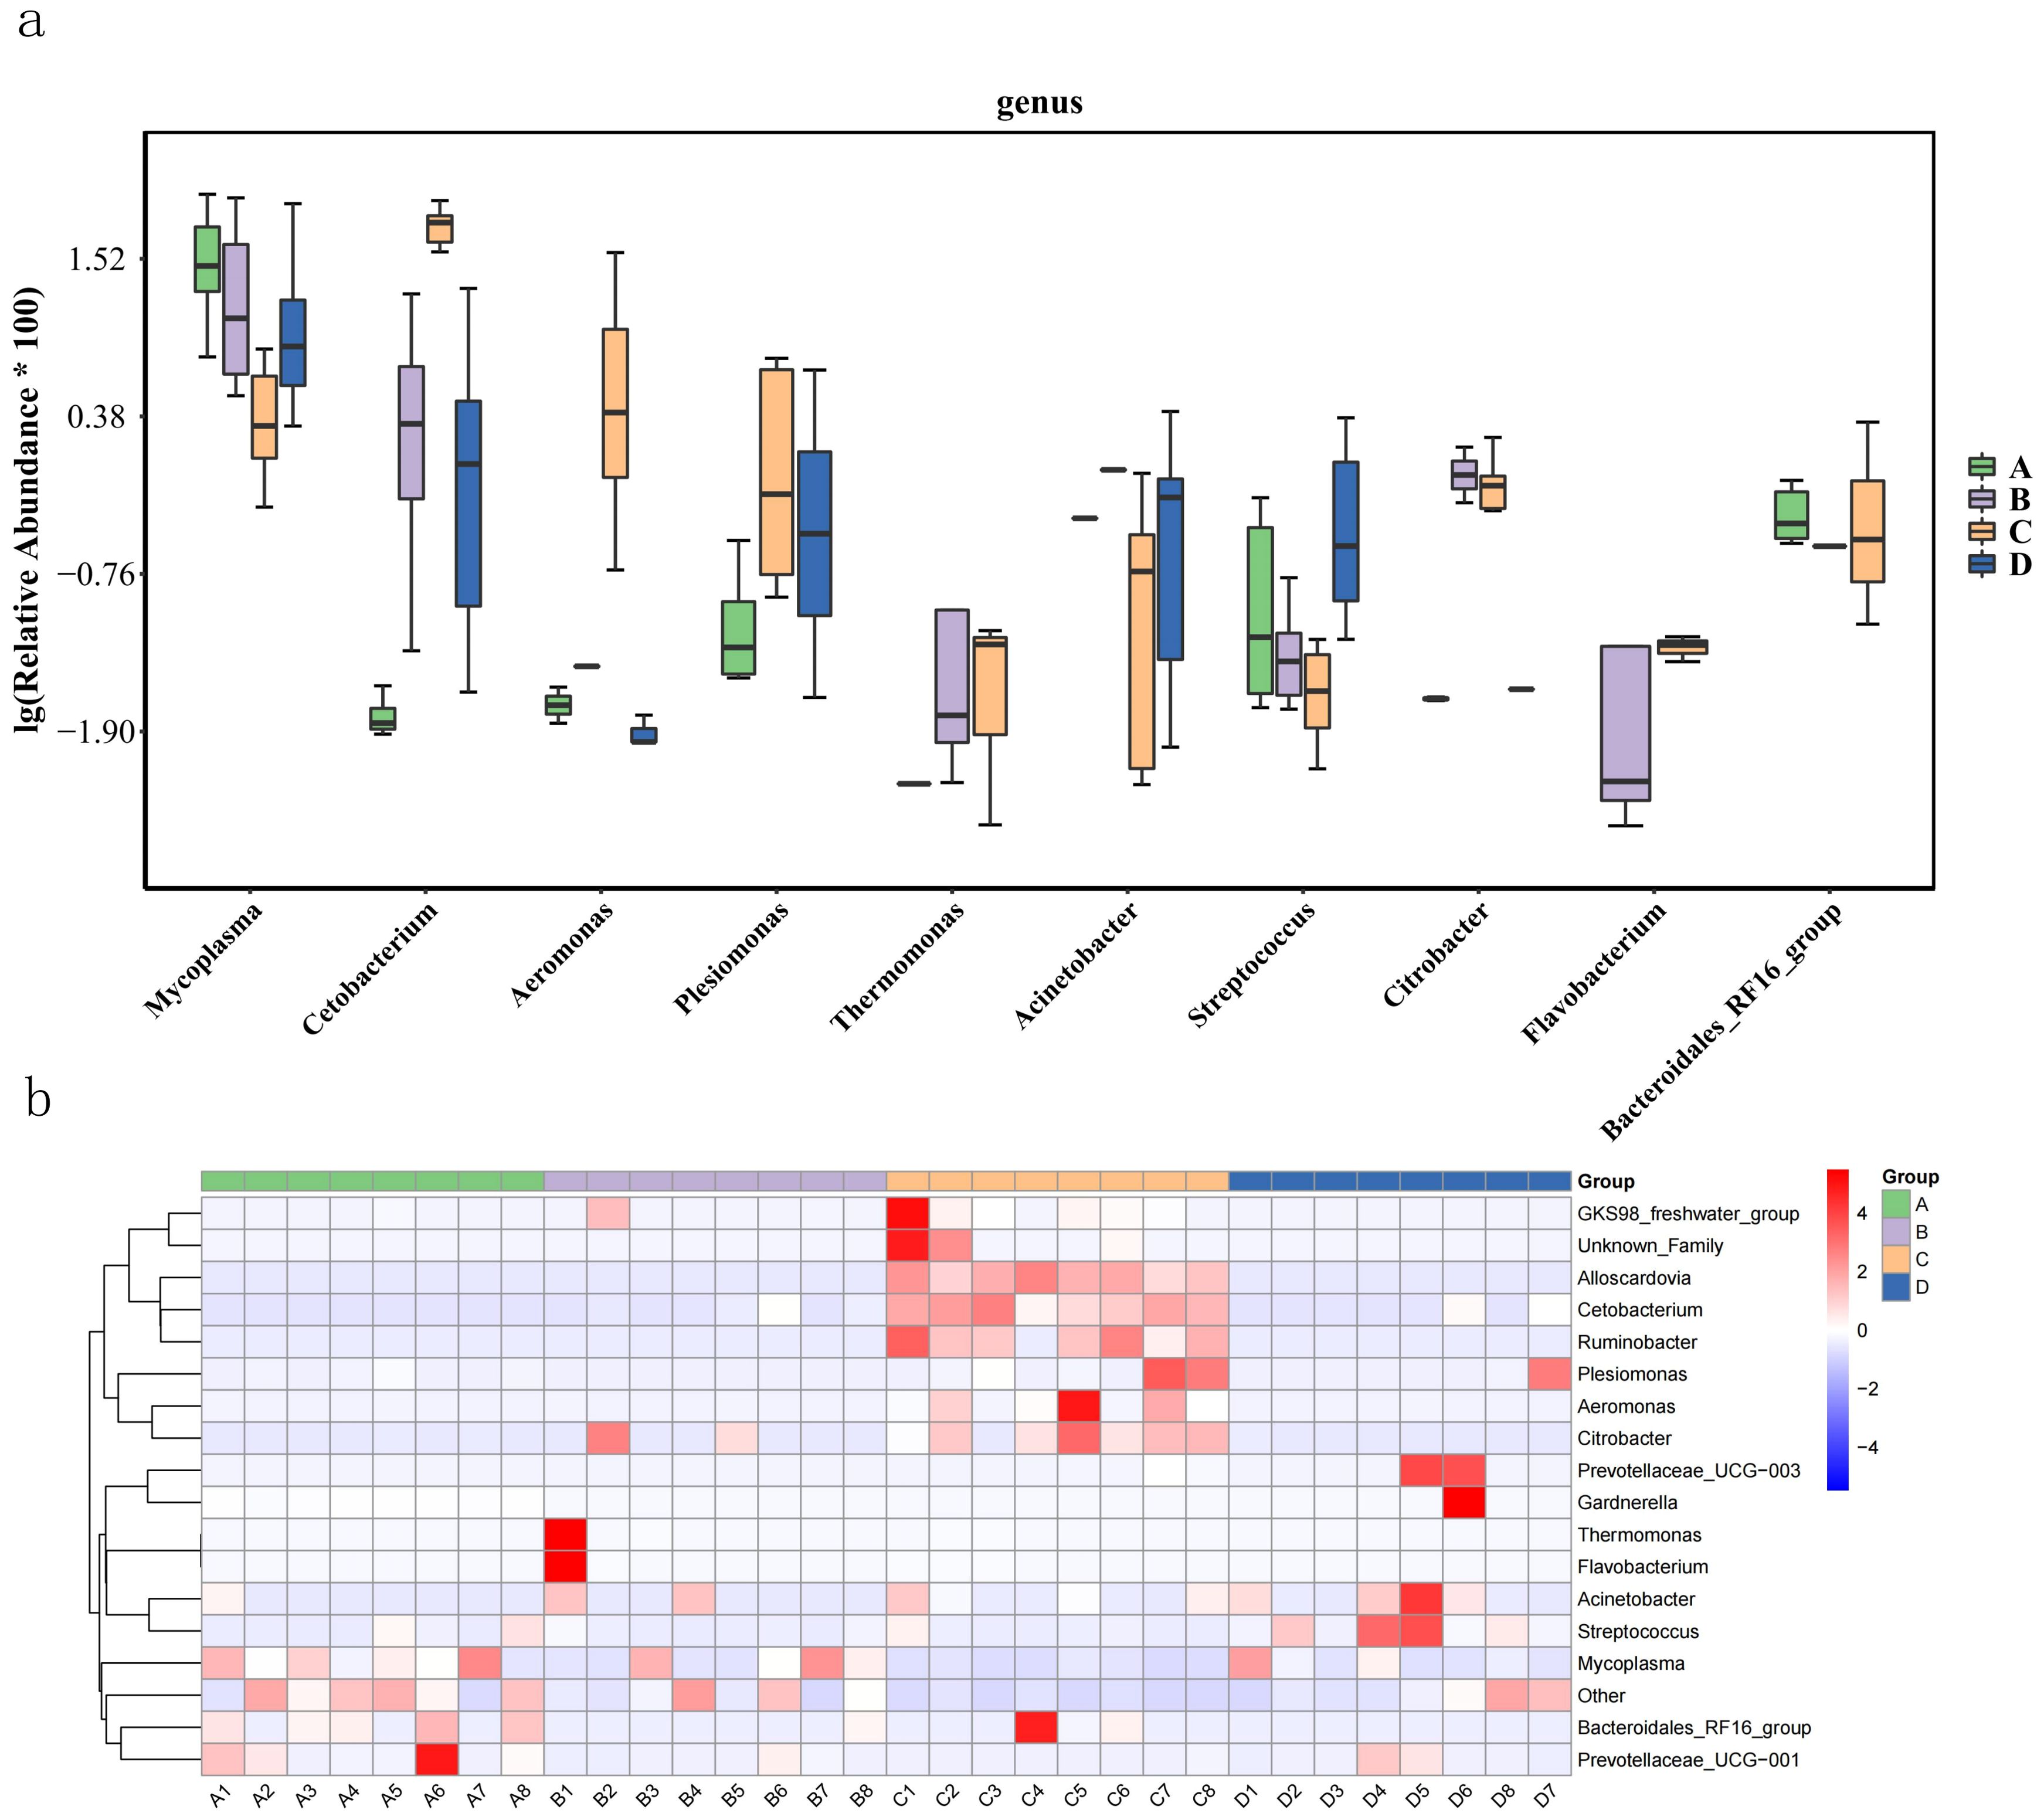
Figure 4. Effects of AMP on relative abundances of differential bacteria genus (biomarkers) in intestinal microflora of largemouth bass. (A) box diagram of relative abundance of the top 10 differential bacterial genus (biomarkers) among groups; (B) heatmap of relative abundance of the top 15 differential bacterial genus (biomarkers) among samples.
3.3.4 Functional differences of intestinal flora
Use PICRUSt2 (2.3.0b0) to predict the functional composition of known microbial genes based on 16S sequences, thereby counting the functional differences between different samples and groups. Functional prediction at level 3 based on KEGG shows that Group A, Group B, Group C, and Group D have important roles in ABC transporters, Carbon metabolism, Biosynthesis of amino acids, Microbial metabolism in diverse environments, Biosynthesis of secondary metabolites, Metabolic There are significant differences in pathways (P < 0.05, Figure 5A), and there are individual differences in the samples in each group (Figure 5B). After comparison, it was found that compared with Groups A, B, and D, Group C had better metabolism in Starch and sucrose metabolism, Purine metabolism, Pyruvate metabolism, Carbon metabolism, Metabolic pathways, Amino sugar and nucleotide sugar metabolism, Pyrimidine metabolism, and Microbial metabolism in diverse environments. Biosynthesis of amino acids, Biosynthesis of secondary metabolites, Arinoacyl-tRNA biosynthesis, ABC transporters, Quorum sensing, Ribosome, Glycolysis/Gluconeogenesis were significantly enhanced, and the order of strength was Group C > Group D > Group B > Group A.
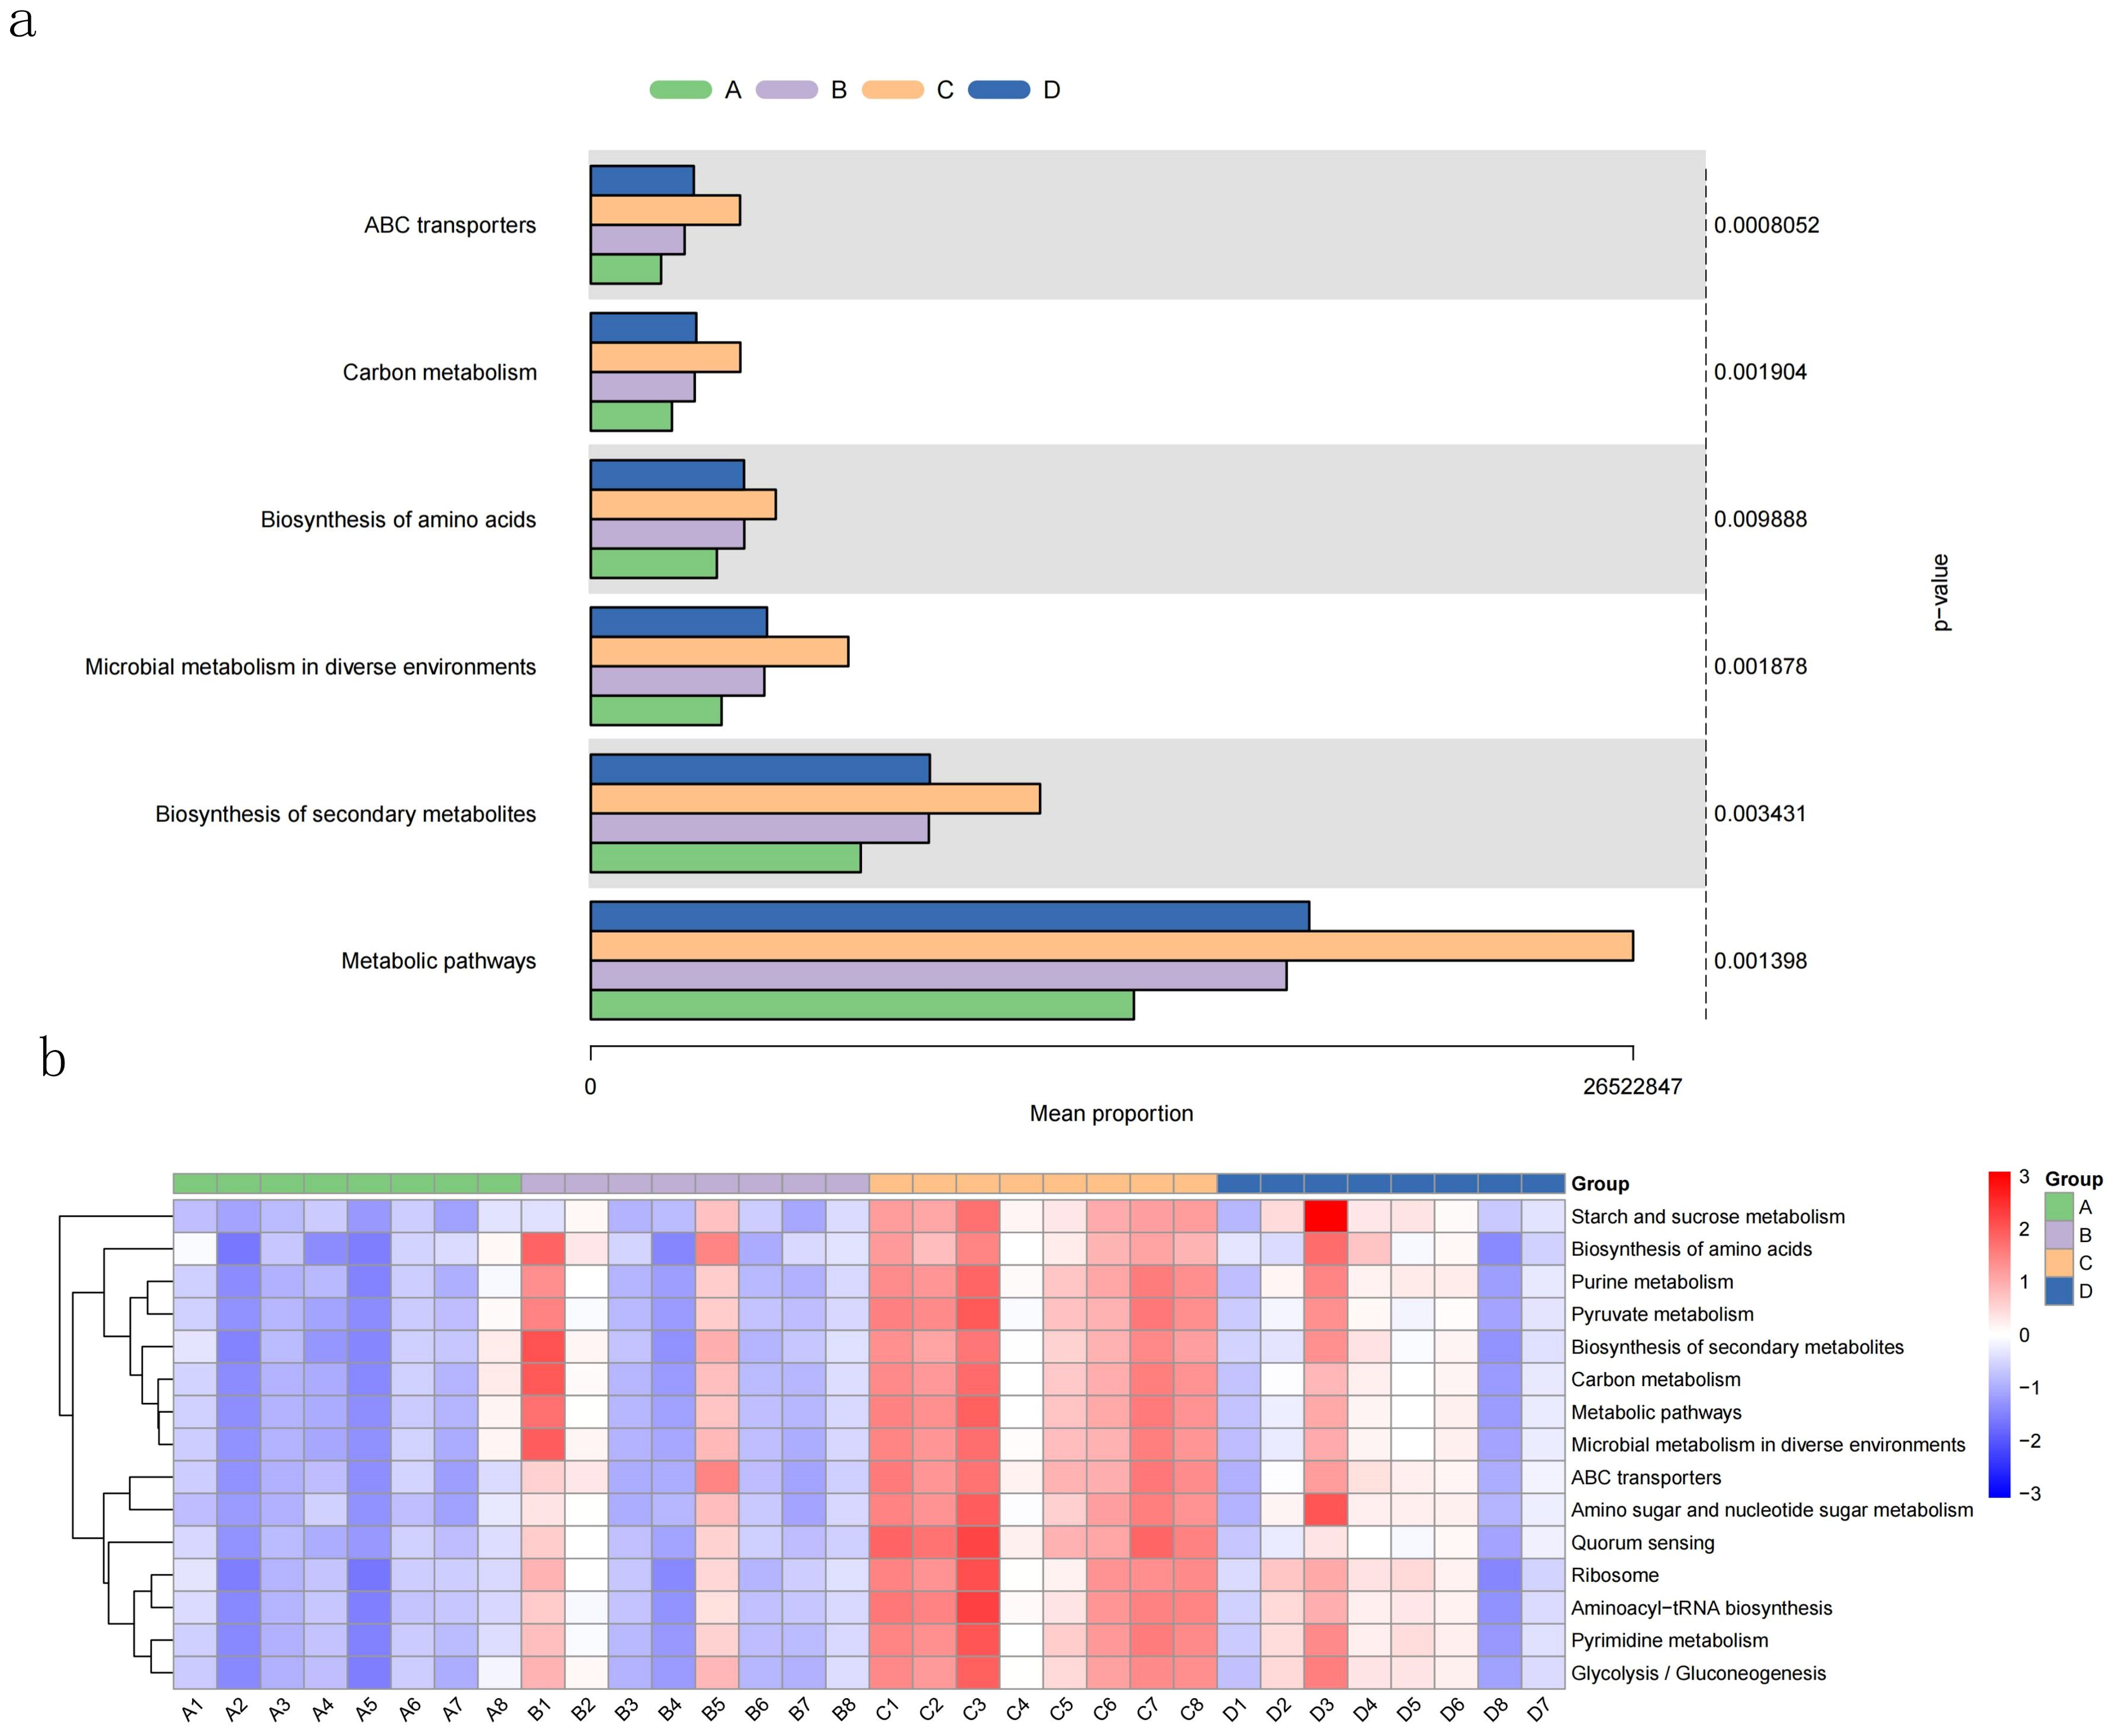
Figure 5. KEGG function prediction based on 16S of largemouth bass intestinal flora. (A) KEGG prediction results with significant differences among groups using Kruskal-Wallis method; (B) the heatmap of top15 mean proportion of predicted KEGG results with significant differences among difference samples.
4 Discussion
AMP is widely used as a feed additive in livestock and poultry production. Research indicates that AMP can promote the growth of weaned piglets and increase WGR by enhancing immunity, improving intestinal health, and reducing diarrhea rates (Li et al., 2009, 2011; Zhao and Wang, 2015; Chai et al., 2020). AMP also enhances production performance and disease resistance of ruminants by improving the immune function and anti-stress ability of poultry (Cao et al., 2022; Jing et al., 2019; Xu et al., 2015)In recent years, its application in aquatic animals has also been reported. A study by Zhuo et al. found that replacing 25% of fish meal with protein sources like soybean meal adversely affects the growth and physiological metabolism of Pseudobagrus fulvidraco (Zhuo et al., 2022). Adding AMP to the feed significantly improved these effects, indicating that AMP has a protective effect on the health of Pseudobagrus fulvidraco. Bai Ruxue et al. discovered that Atractylodes macrocephala extract can improve the growth performance, antioxidant capacity, and disease resistance of Macrobrachium japonicum (Bai et al., 2023). Lu’s research demonstrates that AMP, as a feed additive, can enhance the growth performance, immunity, antioxidant capacity, and resistance of rainbow trout against Aeromonas salmonicida (Lu et al., 2024). In our study, adding 0.4%, 0.8%, and 1.2% AMP to the feed all exhibited significant growth-promoting effects, and the FCR showed a downward trend. The WGR and SGR were highest when the concentration was 0.8%, indicating the best growth-promoting effect.
Serum biochemistry is a fundamental blood test that can quickly reflect organ inflammation, damage, and metabolic abnormalities in the body. Among these parameters, AST and ALT are commonly used clinical indicators to assess liver damage. Research indicates that the application of AMP can reduce AST and ALT levels in rats and goslings, thus playing a protective role in preventing and treating non-alcoholic steatohepatitis and improving liver immune function (Che et al., 2017; Li et al., 2022). Furthermore, studies show that with an increase in the amount of AMP added, the contents of AST and ALT exhibit a downward trend within a certain range, suggesting that AMP plays a hepatoprotective role in largemouth bass. Additionally, blood lipid levels are closely linked to the body’s lipid metabolism capabilities (Zhang et al., 2018). Serum TG and CHOL are closely related to lipid metabolism. When there is excess fat in the liver or fat metabolism disorders, their levels tend to increase (Zhang et al., 2018; Wei et al., 2019). In this study, the TG and CHOL levels in the serum of the experimental groups exhibited a trend of first increasing and then decreasing. Notably, the TG of the high-dose group (Group C) was significantly lower than that of the other groups, and the CHOL content was also significantly lower than the control group. This suggests that AMP can regulate lipid metabolism in largemouth bass, promoting lipid metabolism. These results are similar to Zhuo et al.’s study on the effects of AMP on the growth and health maintenance of Pseudobagrus fulvidraco (Zhuo et al., 2022). Moreover, peroxide ions, hydroxyl free radicals, and other reactive species generated during metabolic processes can cause cellular damage. The stronger the antioxidant capacity of an animal’s body, the more effectively it can avoid the adverse effects of oxidative reactions on the body (Chen et al., 2023).
AMP, as an immune polysaccharide, has been demonstrated by numerous studies to enhance the body’s antioxidant and non-specific immune functions (Chen et al., 2023; Miao et al., 2021). In this experiment, the SOD content and C3 levels in each test group were significantly higher than those in the control group. Conversely, the MDA content of each test group was significantly lower than that of the control group. This finding aligns with Yang's study on the impact of AMP on growth performance, serum biochemical indicators, and intestinal morphology in broiler chickens (Yang, 2023), indicating that AMP also enhances the resistance, antioxidant capacity, and immune response of aquatic animals.
Intestinal tissue and intestinal contents, together, constitute the intestinal environment, which serves as a habitat for a large number of microorganisms. These microorganisms participate in the digestion and absorption of nutrients and the regulation of the body’s immunity during the growth and development of animals, thereby having a significant impact on animal health. They play an extremely important role in growth, development, and overall well-being (Zhang, 2020; Xu and Knight, 2015). Studies have shown that the diversity and structure of fish intestinal flora are influenced by various factors, including their own genetics, the environment, individual size, and food composition. Among these factors, food composition and environmental status are the most influential (Bolnick et al., 2014; Sullam et al., 2012).
Shang et al (Shang et al., 2016). found that some bacteria in the intestine may be related to the polysaccharide content in food. Ingesting fucoidan can increase the number of lactobacilli in the intestine and reduce the number of harmful bacteria such as Escherichia coli. Huang et al (Huang et al., 2022). found in a study on mice that the addition of fucoidan changed the composition of the main intestinal flora of mice, significantly increased the abundance of beneficial bacteria at the genus Lactobacillus, and also made some beneficial bacteria The abundance of functional genes is increased. In this study, adding 1.2% AMP to the feed increased the abundance of intestinal flora of largemouth bass, but the diversity of each group decreased.
At the phylum level, the relatively abundant bacterial groups in the intestinal tract of largemouth bass in each group were Firmicutes, Actinobacteriota, Bacteroidota, Fusobacteriota, and Proteobacteria. Studies have found that among bacteria, many pathogenic bacteria are members of the Proteobacteria phylum, which increase the risk of disease in the body (Shin et al., 2015). Fusobacteria can trigger inflammation in certain parts of the host under certain conditions (Han et al., 2005). Some bacteria in the Firmicutes phylum can play important roles in cellulose decomposition and polysaccharide fermentation (Ji et al., 2016). Actinobacteria are opportunistic pathogens that may infect animals when their immunity is low, causing them to develop some chronic or subacute diseases (Mai et al., 2020). Bacteroidetes can participate in the conversion of proteins, lipids, etc., and can also participate in the metabolism of sugars and bile acids (Michaud et al., 2009). In this study, as the concentration of AMP added to the feed gradually increased, the abundance of Firmicutes in the intestinal tract of largemouth bass significantly decreased, and the abundance of Fusobacteriota and Proteobacteria increased significantly, indicating that the addition of Atractylodes macrocephala to the feed Excessive concentration of AMP is not conducive to the conversion and absorption of nutrients in the intestinal tract of largemouth bass, and protects intestinal health, thereby reducing the immunity of largemouth bass and increasing the probability of disease occurrence.
At the bacterial genus level, in this study, the dominant species of the intestinal flora of the 4 groups of largemouth bass were different. Group A (0.4% AMP)was mainly Mycoplasma, Group B (0.8% AMP) was mainly Bifidobacterium and Bacteroides, Group C (1.2% AMP) was mainly Cetobacterium and Aeromonas, and Group D was mainly intestinal flora. There are abundant probiotics such as Prevotella (Galvez et al., 2020) and Muribaculaceae (Lagkouvardos et al., 2019) in the intestinal flora, but the relative abundance of these bacteria in the AMP-added group was low, and compared with the control group, most samples in Group C had Cetobacterium, the relative abundance of Aeromonas is high, which shows that compared with the individual diversity of the intestinal flora of the fish group in the control group, Group C adjusted the intestinal flora structure of the fish group to make the intestinal flora structure of the entire fish group tend to be consistent. In this study, the addition of AMP had a significant regulatory effect on the intestinal flora structure of largemouth bass. The relationship between the intestinal flora structure and its relationship needs further study.
At the same time, KEGG function prediction based on 16S rRNA sequencing revealed that the intestinal flora regulated by Group C strengthened amino acid metabolism, fat metabolism, sugar metabolism, and various biosynthesis pathways compared to Group D. The effects observed in groups A and B were opposite. These findings (Li et al., 2023) are consistent with previous research results. It is speculated that the diverse functions of the intestinal flora in largemouth bass in this experiment also play a crucial role in metabolism and contribute to maintaining the stability of the microbiota structure. The experiment found that as the concentration increased, the metabolic function, body system, and genetic information processing expression in the intestinal tract of largemouth bass in groups A, B, and C gradually improved. At low concentrations, AMP had an inhibitory effect on these pathways. However, when the concentration reached 1.2%, it effectively promoted the expression of bodily functions, which benefits the utilization of fish body nutrients and the development of cell functions. This increase in nutrient utilization further promotes the survival and growth of the fish (Zhang et al., 2023).
5 Conclusion
Adding an appropriate amount of AMP to the feed can increase the WGR and SGR of largemouth bass, reduce the FCR, and improve the growth performance of largemouth bass. It can also lower the AST and ALT levels, protecting the liver function of largemouth bass. Additionally, it enhances the activity of serum SOD, C3, and C4 in largemouth bass, reduces MDA content, and improves the antioxidant and disease resistance of largemouth bass. It improves the composition of intestinal flora in largemouth bass, which has a positive effect on intestinal health. Based on comprehensive analysis, the recommended range of AMP in the feed is 0.8% – 1.2%.
Data availability statement
The data presented in the study are deposited in the Sequence Read Archive (https://www.ncbi.nlm.nih.gov/sra), under accession number PRJNA1118736 (https://www.ncbi.nlm.nih.gov/bioproject/PRJNA1118736/).
Ethics statement
The animal study was approved by Hunan Biological And Electromechanical Polytechnic. The study was conducted in accordance with the local legislation and institutional requirements.
Author contributions
XW: Conceptualization, Data curation, Formal analysis, Writing – original draft. LG: Supervision, Validation, Writing – review & editing. KL: Methodology, Writing – original draft. ST: Project administration, Software, Writing – review & editing. YH: Methodology, Resources, Writing – original draft.
Funding
The author(s) declare financial support was received for the research, authorship, and/or publication of this article. This work was supported by the Hunan Provincial Education Department Funding Project (23C0777); the Natural Science Foundation of Hunan Province (2024JJ8038).
Conflict of interest
The authors declare that the research was conducted in the absence of any commercial or financial relationships that could be construed as a potential conflict of interest.
Publisher’s note
All claims expressed in this article are solely those of the authors and do not necessarily represent those of their affiliated organizations, or those of the publisher, the editors and the reviewers. Any product that may be evaluated in this article, or claim that may be made by its manufacturer, is not guaranteed or endorsed by the publisher.
References
Bai J. J., Lutz-Carillo D. J., Ouan Y. C., Liang S. (2008). Taxonomic status and genetic diversity of cultured largemouth bass Micropterus salmoides in China. Aquaculture 278, 27–30. doi: 10.1016/j.aquaculture.2008.03.016
Bai R. X., Hua L. H., Liu H. K., Zhang Y. X., Zhu X. M., Yang Y. X., et al. (2023). Effects of adding Atractylodes macrocephala extract to feed on the growth, health and disease resistance of Macrobrachium japonicum. Acta Hydrobiologica Sin. 06, 30. doi: 10.7541/2023.2023.0097
Bailly C. (2021). Atractylenolides, essential components of atractylodes-based traditional hebal medicines: Antioxidant, anti-inflammatory and anticancer properties. Eur. J. Pharmacol. 891, 173735. doi: 10.1016/j.ejphar.2020.173735
Bolnick D. I., Snowberg L. K., Hirsch P. E., Lauber C. L., Knight R., Caporaso J. G., et al. (2014). Individuals’ diet diversity influences gut microbial diversity in two freshwater fish (threespine stickleback and Eurasian perch). Ecol. Lett. 17, 979–987. doi: 10.1111/ele.12301
Cao N., Yang S. Z., Hu C. Y., Lu Z. E., Liu J. N., Qian L., et al. (2022). Effects of Atractylodes polysaccharide on growth performance, slaughter performance, and immune organ development of Lingnan yellow chickens. J. Anim. Nutr. 34, 205–214. doi: 10.3969/j.issn.1006-267x.2022.01.020
Chai Y., Li Q. H., Jia J. J., Zhang W. J., Lu Q. F., Chen T., et al. (2020). Effects of Atractylodes polysaccharide on production performance and intestinal tissue morphology of weaned piglets. China Feed 15, 49–54. doi: 10.15906/j.cnki.cn11-2975/s.20201513
Che C. Y., Li H. S., Ying H., Zhou F. (2017). Study on the preventive and therapeutic effects of Atractylodes polysaccharide on non-alcoholic steatohepatitis. Chin. J. Traditional Chin. Med. 35, 1801–1803. doi: 10.13193/j.issn.1673-7717.2017.07.045
Chen H. X., Yang S. Z., Lu Z., Qian L., Li B. X., Li W. Y., et al. (2023). Atractylodes polysaccharide alleviates cyclophosphamide-induced oxidative stress and liver cell apoptosis in Lingnan yellow chickens. J. Anim. Nutr. 35, 1976–1984. doi: 10.12418/CJAN2023.185
Galvez E. J. C., Iljazovic A., Amend L., Lesker T. R., Renault T., Thiemann S., et al. (2020). Distinct polysaccharide utilization determines interspecies competition between intestinal Prevotella spp. Cell Host Microbe 28, 838–852.e6. doi: 10.1016/j.chom.2020.09.012
Han Y. W., Ikegami A., Rajanna C., Kawsar H. I., Zhou Y., Li M., et al. (2005). Identification and characterization of a novel adhesin unique to oral Fusobacteria. J. Bacteriology 187, 5330–5340. doi: 10.1128/JB.187.15.5330-5340.2005
He M., Li X., Poolsawat L., Guo Z., Yao W., Zhang C., et al. (2020). Effects of fish meal replaced by fermented soybean meal on growth performance, intestinal histology and microbiota of largemouth bass (Micropterus salmoides). Aquaculture Nutr. 26, 1058–1071. doi: 10.1111/anu.13064
Huang J., Huang H. L., Sun J. Y., Li Y., Li H. J. (2023). Regulatory effect of golden algae polysaccharide on immune function and intestinal flora in immunocompromised mouse model. Chin. J. Food Sci. 32, 92–102. doi: 10.16429/j.1009-7848.2022.05.011
Huang X. W., Yang S. S., Liu Y., Fan T., Ming W., Lin R. N., et al. (2015). Effect of dietary chitosan on growth performance, lipid metabolism, non-specific immune function and intestinal health of juvenile Jian carp (Cyprinus carpiovar. jian). Chin. J. Anim. Nutr. 27, 2106–2114. doi: 10.3969/j.issn.1006-267x.2015.07.016
Ji Y. J., Zhu Q., Geng M. M., Chen W., Yin Y. L., Kong X. F. (2016). Effects of high and low nutritional level diets on the structure and metabolites of colonic flora of Huanjiang Xiang pigs. Bull. Microbiol. 43, 1650–1659. doi: 10.13344/j.microbiol.china.150594
Jing J. L., Zhao G. X., Gong J. G., Hao Y. S., Feng Z. H. (2019). Effects of Atractylodes polysaccharide on growth performance and serum immune indicators of laying hens during the breeding period. Feed Res. 42, 35–37. doi: 10.13557/j.cnki.issn1002-2813.2019.02.011
Kong X., Duan W., Li D., Tang X., Duan Z. (2020). Effects of polysaccharides from Auricularia auricula on the immuno-stimulatory activity and gut microbiota in immunosuppressed mice induced by cyclophosphamide. Front. Immunol. 11. doi: 10.3389/fimmu.2020.595700
Lagkouvardos I., Lesker T. R., Hitch T. C. A., Gálvez E. J., Smit N., Neuhaus K., et al. (2019). Sequence and cultivation study of Muribaculaceae reveals novel species, host preference, and functional potential of this yet undescribed family. Microbiome 7, 28. doi: 10.1186/s40168-019-0637-2
Li L., Yin F., Zhang B., Peng H. Z., Li F. N., Zhu N. S., et al. (2011). Dietary supplementation with Atractylodes macrophala Koidz polysaccharides ameliorates metabolic status and improves immune function in early-weaned pigs. Livestock Sci. 142, 33–41. doi: 10.1016/j.livsci.2011.06.013
Li L. L., Zhang B., Zhu N. S., Yin Y. L., Peng H. Z., Yin X. M., et al. (2009). Effects of polysaccharides on lymphocyte proliferation and cytokines in early weaned piglets. Agric. Modernization Res. 30, 495–497.
Li C. J., Zhang J., Zhu Y. C., Kong X. H. (2019). Application of Astragalus polysaccharide in aquatic animal disease control. Fisheries Sci. 38, 881–886. doi: 10.16378/j.cnki.1003-1111.2019.06.021
Li Q. J., Zhu H. J., Qiang J., Nie Z. J., Gao J. C., Sun Y., et al. (2023). Effects of adding Acanthopanax to feed on lipid deposition, antioxidant capacity, intestinal digestive enzymes and microorganisms of Tilapia jifu. Acta Hydrobiologica Sin. 47, 1396–1407. doi: 10.7541/2023.2022.0281
Li W. Y., Wang Y. F., Li B. X., Xu S. P., Zheng M., Cao N., et al. (2022). Study on the protective effect of Atractylodes polysaccharide on the liver immune function of goslings. Guangdong Anim. Husbandry Veterinary Sci. Technol. 47, 6–13. doi: 10.19978/j.cnki.xmsy.2022.02.02
Lu S., Bian X., Wang C. A., Wang D., Shi H., Wang S., et al. (2024). Protective effects of polysaccharide from Atractylodes macrocephala Koidze (AMP) as a feed additive on growth performance, immunity, antioxidant capacity, and disease resistance against Aeromonas salmonicida in rainbow trout (Oncorhynchus mykiss). Aquaculture Int., 1–16. doi: 10.1007/s10499-024-01521-4
Mai H. B., Guo X. W., Wang J. G., Chi S. Y., Dong X. H., Yang Q. H., et al. (2020). Effects of eating different dietary proteins on the intestinal tissue morphology and bacterial composition of juvenile pearl gentian grouper. J. Dalian Ocean Univ. 35, 63–70. doi: 10.16535/j.cnki.dlhyxb.2019-123
Miao Y. F., Gao X. N., Xu D. N., Li M. C., Gao Z. S., Tang Z. H., et al. (2020). Protective effect of the newly prepared Atractylodes macrocephala Koidz polysaccharide on fatty liver hemorrhagic syndrome in laying hens. Poultry Sci. 100, 938–948. doi: 10.1016/j.psj.2020.11.036
Michaud L., Lo Giudice A., Troussellier M., Smedile F., Bruni V., Blancheton J. P. (2009). Phylogenetic characterization of the heterotrophic bacterial communities inhabiting a marine recirculating aquaculture system. J. Appl. Microbiol. 107, 1935–1946. doi: 10.1111/jam.2009.107.issue-6
National Pharmacopoeia Commission (2020). Pharmacopoeia of the People’s Republic of China (Beijing: China Medical Science and Technology Press).
Shang Q. S., Shan X. D., Cai C., Hao J. J., Li G. Y., Yu G. L. (2016). Dietary fucoidan modulates the gut microbiota in mice by increasing the abundance of Lactobacillus and Ruminococcaceae. Food Funct. 7, 3224–3232. doi: 10.1039/C6FO00309E
Shin N. R., Whon T. W., Bae J. E. (2015). Proteobacteria: microbial signature of dysbiosis in gut microbiota. Trends Biotechnol. 33, 496–503. doi: 10.1016/j.tibtech.2015.06.011
Sullam K. E., Essinger S. D., Lozupone C. A., O'Connor M. P., Rosen G. L., Knight R., et al. (2012). Environmental and ecological factors that shape the gut bacterial communities of fish: a meta-analysis. Mol. Ecol. 21, 3363–3378. doi: 10.1111/j.1365-294X.2012.05552.x
Wang L., Wang B., Wang R. C. (2023). Research progress on the biological functions of Atractylodes extracts and their application in animal production. Feed Res. 46, 160–163. doi: 10.13557/j.cnki.issn1002-2813.2023.01.034
Wang Y. Z., Xin Y. X., Li X. Y., Guo X. Z., Liu W. S., Liu W. Z., et al. (2023). Research progress on the application of lentinan in aquaculture. Feed Industry. 45, 37–42. doi: 10.13302/j.cnki.fi.2024.02.007
Wei F. F., Wang W. J., He Q. H., Zhang B. (2019). Protective mechanism of Lycium Barbarum Polysaccharide on alcohol-induced liver injury in mice. Drug Eval. Res. 42, 852–857. doi: 10.7501/j.issn.1674-6376.2019.05.008
Xu W., Guan R., Shi F. S., Du A., Hu S. (2015). Structural analysis and immunomodulatory effect of polysaccharide from Atractylodes macrocephalae Koidz. on bovine lymphocytes. Carbohydr. Polymers 174, 1213–1223.
Xu Z., Knight R. (2015). Dietary effects on human gut microbiome diversity. Br. J. Nutr. 113, S1–S5. doi: 10.1017/S0007114514004127
Yang Z. Z. (2023). Effects of Atractylodes polysaccharide on growth performance, serum biochemical indicators, and intestinal morphology of broiler chickens. Feed Res. 46, 46–50. doi: 10.13557/j.cnki.issn1002-2813.2023.12.010
Yang J. T., Cheng X., Chen H. W., Wu J. W., Zeng Y.-M. (2018). Research progress on the immunomodulatory mechanism of Atractylodes polysaccharide. Chin. J. Veterinary Drugs 52, 80–85. doi: 10.11751/ISSN.1002-1280.2018.06.13
Zhang H. X. (2020). Effects of large daphnia powder on the growth, digestion, some biochemical indicators, and intestinal health of yellow catfish (Tianjin Agricultural University).
Zhang Y. T., He Y. F. (1994). Research on largemouth bass culture. J. Zhanjiang Fisheries Univ. 1994, 23–28.
Zhang J. Y., Wang S. X., Liu D. J., Du X. K., Mu J. H., Shen X. H. (2023). Research on the intestinal flora of wheat ear fish in aquaponics system. J. Fisheries 36, 104–111. doi: 1005- 3832(2023)03- 0104- 08
Zhang D. D., Yan Y. A., Tian H. Y., Jiang G., Li X., Liu W. (2018). Resveratrol supplementation improves lipid and glucose metabolism in high-fat diet-fed blunt snout bream. Fish Physiol. Biochem. 44, 163–173. doi: 10.1007/s10695-017-0421-9
Zhao Y. F., Wang Y. Z. (2015). Effects of Atractylodes macrocephala, micron Atractylodes macrocephala and Atractylodes macrocephala polysaccharide on growth performance, intestinal morphology and microecological flora of weaned piglets. Chin. J. Anim. Husbandry 51, 65–69.
Keywords: Atractylodes macrocephala polysaccharide, Micropterus salmoides, growth performance, serum biochemical indexes, intestinal microflora
Citation: Wen X, Ge L, Liu K, Tan S and Hu Y (2024) Effects of Atractylodes macrocephala polysaccharide on growth performance, serum biochemical indexes, and intestinal microflora of largemouth bass (Micropterus salmoides). Front. Mar. Sci. 11:1441921. doi: 10.3389/fmars.2024.1441921
Received: 31 May 2024; Accepted: 16 August 2024;
Published: 03 September 2024.
Edited by:
Jie Yin, Hunan Agricultural University, ChinaReviewed by:
Cunxin Sun, Chinese Academy of Fishery Sciences (CAFS), ChinaZhigang Zhou, Chinese Academy of Agricultural Sciences, China
Copyright © 2024 Wen, Ge, Liu, Tan and Hu. This is an open-access article distributed under the terms of the Creative Commons Attribution License (CC BY). The use, distribution or reproduction in other forums is permitted, provided the original author(s) and the copyright owner(s) are credited and that the original publication in this journal is cited, in accordance with accepted academic practice. No use, distribution or reproduction is permitted which does not comply with these terms.
*Correspondence: Lingrui Ge, Z2VsaW5ncnVpQGh1bmF1LmVkdS5jbg==