 Jade Z. Zhang
 Sierra V. Petersen
 Shaun Lavis2
- 1Department of Earth and Environmental Science, University of Michigan, Ann Arbor, MI, United States
- 2Department of Environment and Natural Resources, Government of Bermuda, Crawl, Bermuda
- 3Bermuda Institute of Ocean Sciences, St. George’s, Bermuda
Since the mid-1970s, groundwater resources in Bermuda have been explored to supplement growing potable water demand on the island. Much of this work has focused on modeling the shape and size of freshwater lenses beneath the island’s surface, mainly the Devonshire Lens. Less attention has been paid to how these freshwater lenses interact with surrounding coastal seawater, a process that may grow in importance as sea levels rise. Due to isotopic differences between aquifer water and seawater, these interactions can be tracked using the oxygen isotopic composition of water (δ18Ow) samples collected from coastal and subterranean areas. A pilot study found more temporal variation in coastal seawater δ18Ow along Bermuda’s South Shore (the section of the coast closest to the Devonshire Lens) compared to elsewhere around the island and suggested that freshwater was discharging into coastal seawater from the Devonshire Lens in significant quantities. However, this study was limited by its small dataset so could not quantify the full spatial and temporal variability of δ18Ow in this area. Here, we present salinity and δ18Ow measurements from seawater samples collected around Bermuda and in wells tapping the Devonshire Lens on timescales ranging from hourly to monthly to better visualize the dynamic interaction between coastal seawater and aquifer-sourced freshwater. We find tight correlation between salinity and δ18Ow in well waters, indicating a simple linear mixing relationship between seawater and aquifer water in the subsurface. We confirm previous findings of larger variability in δ18Ow along the South Shore compared to elsewhere and relate observed changes to tidal height on hourly to monthly timescales. Surprisingly, South Shore seawater salinity does not vary in accordance with δ18Ow, implying additional mechanisms, such as the addition of salt spray, must be acting to mute salinity changes. These findings also demonstrate the potential in using δ18Ow to study submarine groundwater discharge, as salinity measurements alone did not detect as much variability. As sea levels rise and interactions between ocean and aquifer waters change, coastal and well water δ18Ow measurements may be helpful in tracking these processes, and in particular, changes in aquifer size.
1 Introduction
Underground aquifers are an important source of freshwater for populations across the world. In particular, small island nations that lack lakes or rivers rely on extraction of freshwater from underground aquifers to supply their populations with freshwater (Sherif and Singh, 1996; Barlow and Reichard, 2010). As global sea levels rise, saltwater intrusion can reduce the size of these aquifers, diminishing the availability of freshwater for local citizens (Klassen and Allen, 2017). This has already been seen today in places like south Florida (Prinos et al., 2014) and Puerto Rico (Colón-Rivera et al., 2014). The zone of interaction between aquifer water and seawater occurs underground. This boundary is known to fluctuate in response to tides (Park and Aral, 2008), sea level changes (Rasmussen et al., 2013), and changes in local precipitation (Parra et al., 2016). In places where permeability is high enough and the hydraulic head is above sea level, aquifer water can discharge directly into coastal waters, a process known as submarine groundwater discharge (SGD).
SGD occurs along most coastlines but the magnitude and controlling processes differ from place to place (Burnett et al., 2006). Multiple methods have previously been used to quantify these processes, including radon and radium, groundwater conductivity, and thermal infrared sensing, as summarized recently by Taniguchi et al. (2019). Increasingly, studies employ multiple methods side-by-side and at higher temporal resolution to quantify these processes (e.g. McKenzie et al., 2021). Due to the variability of SGD drivers and magnitudes, local and regional studies in new areas are both valuable to increase our understanding of how these processes operate generally and necessary to define the conditions in each region.
Bermuda is an island with limited freshwater supply. There are no rivers or freshwater lakes on the island from which to draw. For over 350 years, the main source of potable water in Bermuda has come from rain collected via specially designed roof catchments. Iconic white, stepped ‘Bermuda roofs’ made of limestone slow down the flow of rainwater and funnel it via gutters and pipes into underground cisterns beneath each building for storage and use. For example, the majority of Bermudan household tap water comes from this roof-top catchment. Yet despite every building on the island using this effective roof catchment system (Rowe, 2011), this system of rainwater harvesting does not meet all of Bermuda’s freshwater needs, especially for high-occupancy buildings like hotels. Rainwater catchment is supplemented by direct extraction of groundwater via ~3000 commercial and domestic wells spread across the island (Vacher and Rowe, 1997). Directly extracted groundwater is typically brackish and can be contaminated by chemicals leached from the ground such as pesticides or nitrates from cesspits (Simmons and Lyons, 1994), making this type of water inappropriate for direct consumption without reverse osmosis or desalination treatments. Increasingly, commercial reverse osmosis plants operate directly on seawater, particularly to supply high-occupancy buildings like hotels (Andrews and Laker, 2001).
Most extracted groundwater comes from the Devonshire Lens, also called the Central Lens due to its location underlying the central parish (Figure 1), which has a total area of approximately 7.2 km2 and reaches maximum thickness around 10 meters (Vacher and Rowe, 1997). Approximately 200 million gallons per day of water are withdrawn from the Devonshire Lens as supplementary water (Rowe, 2011). There are also smaller lenses elsewhere on the island (Figure 1). The Somerset (also known as the Port Royal Lens) and St. Georges Lenses are in the range of 0.5–0.7 km2 in area each, and other thin lenses that exist in Warwick and Southampton Parishes are not routinely monitored (Vacher and Rowe, 1997).
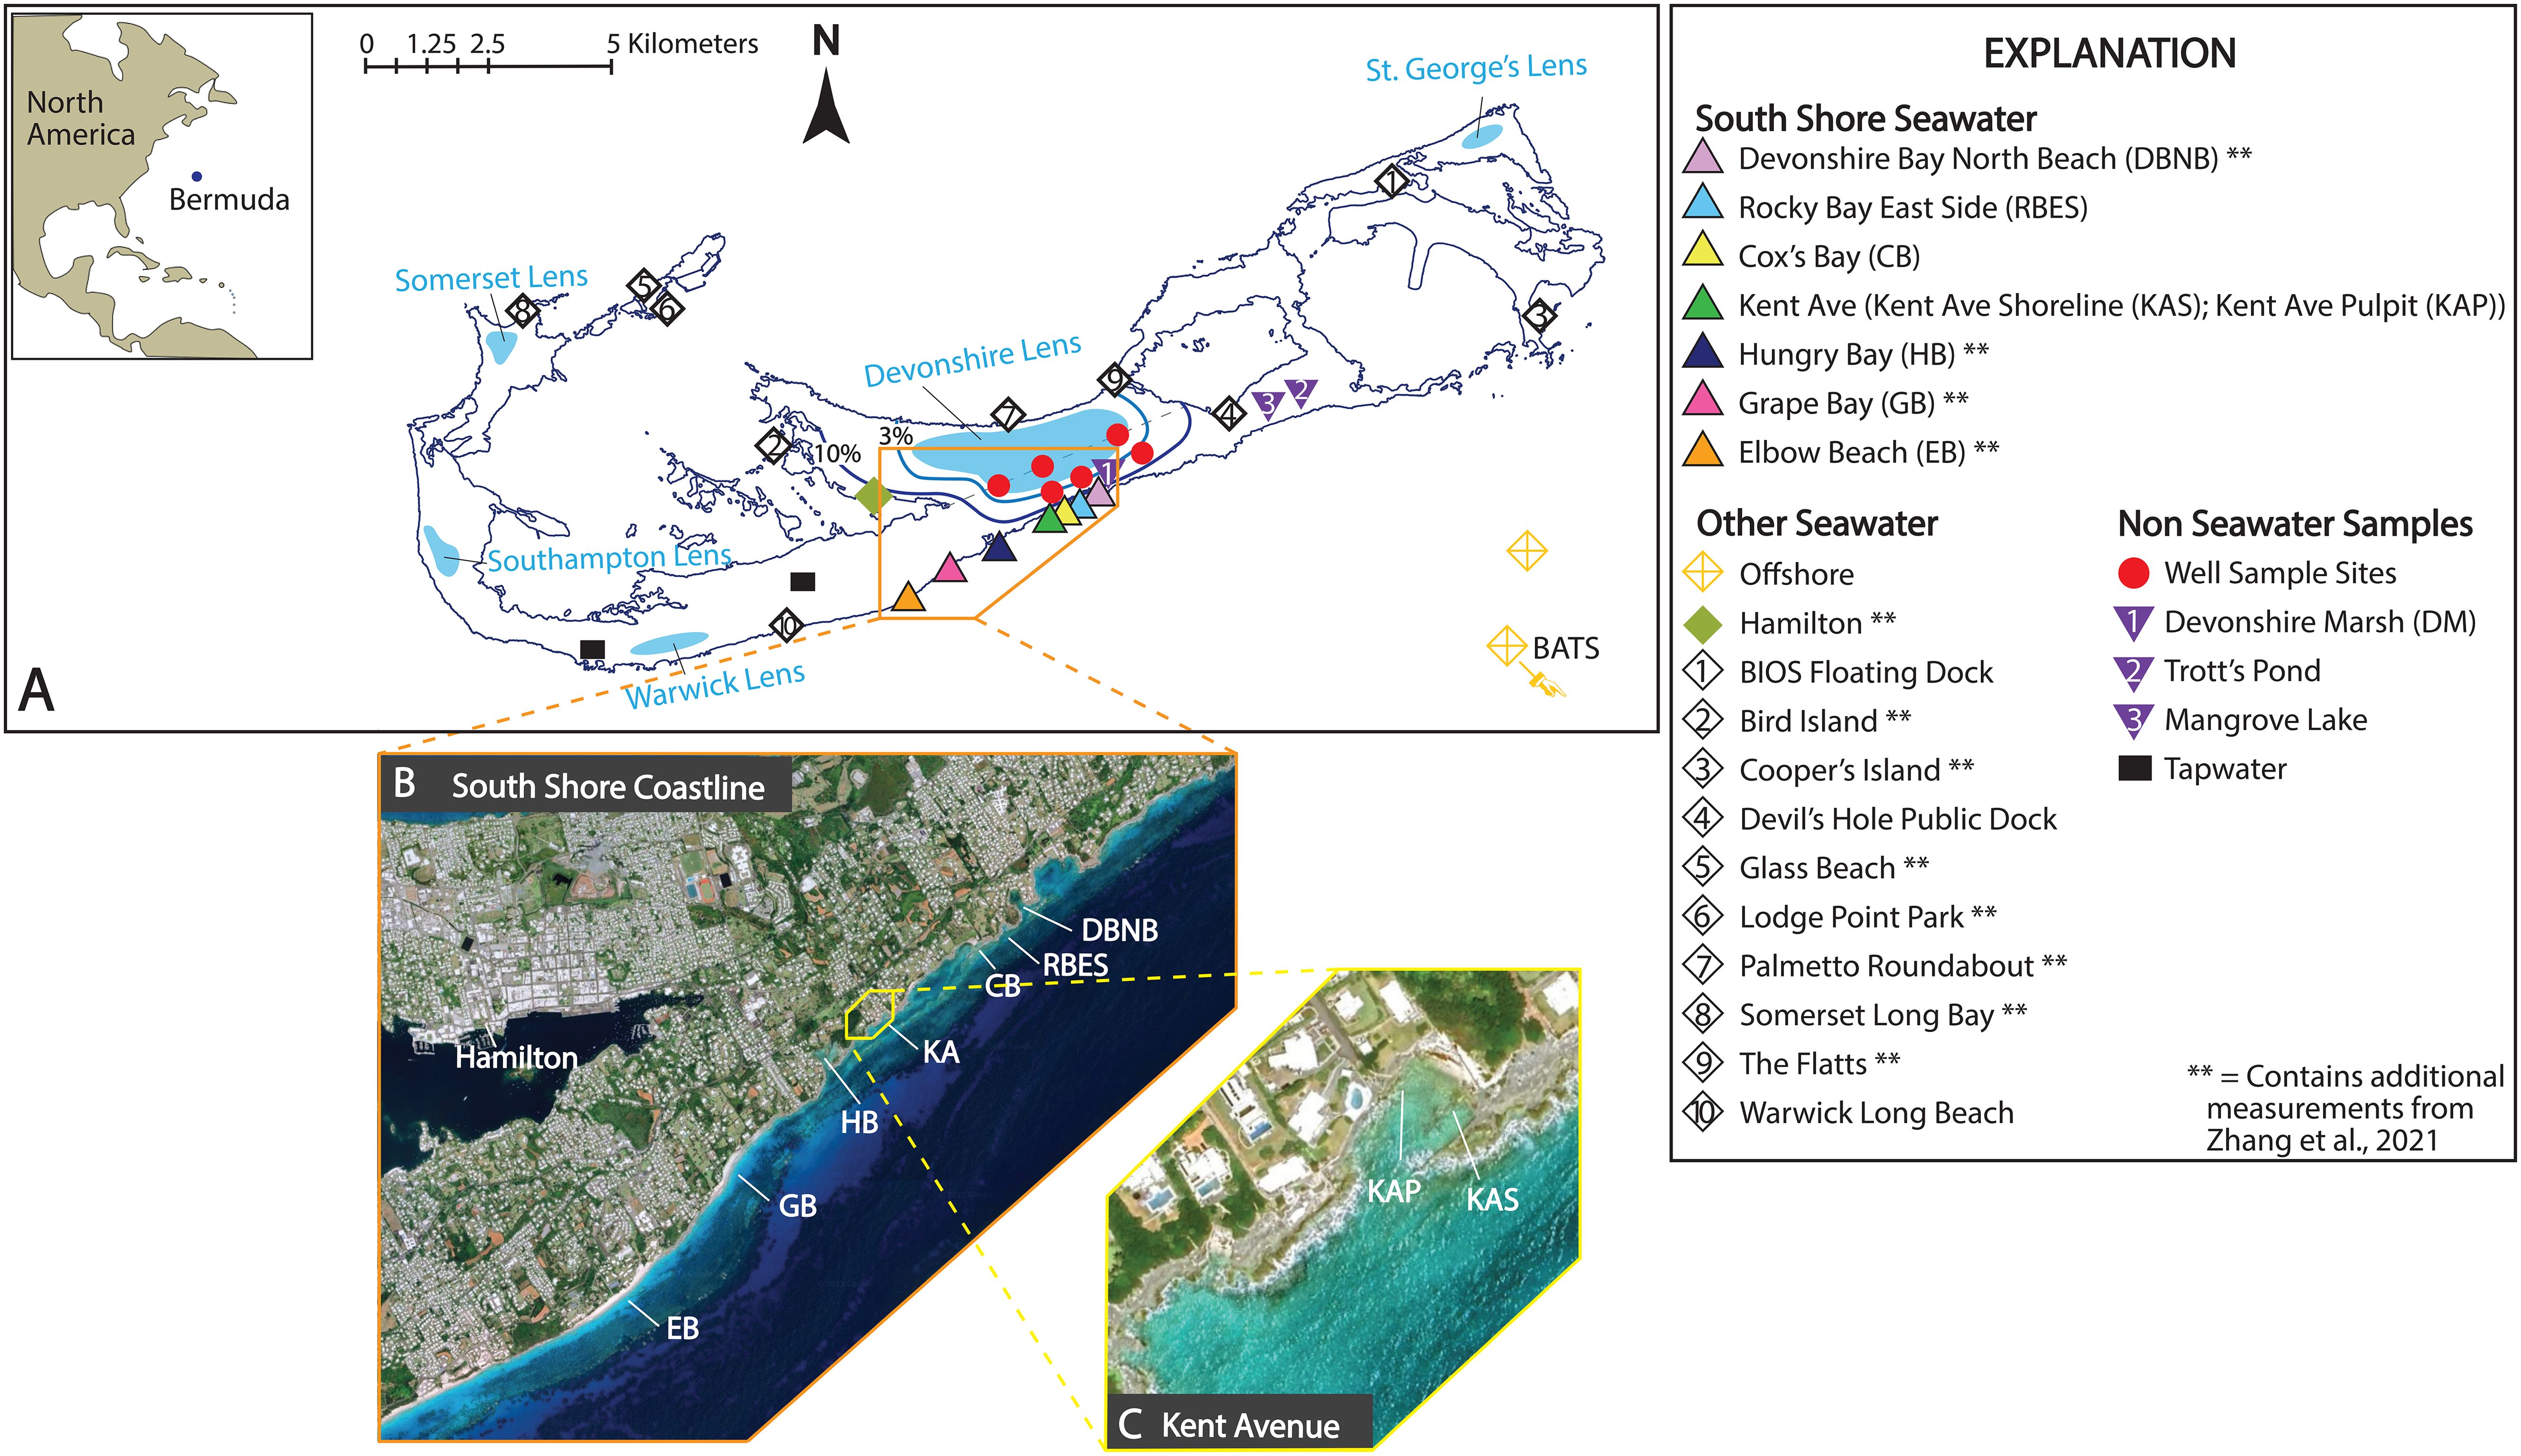
Figure 1. (A) Map of Bermuda showing water sampling sites. (B) Zoomed in satellite image of the south shore coastline. (C) Satellite image of Kent avenue showing the locations of Kent Ave Pulpit (KAP) and Kent Ave Shoreline (KAS).
The shape and hydrogeology of the Devonshire Lens is controlled by the hydraulic conductivity of the two hydrostratigraphic units containing the aquifer: the Langton Aquifer and the Brighton Aquifer (Vacher, 1978) (Figures 1, 2). The hydraulic conductivity of the Langton Aquifer is lower (around 30-120m/day) compared to the hydraulic conductivity of the Brighton Aquifer (around 1000m/day), reflecting increased porosity in the lithostratigraphic units on the south side of the island (Rowe, 1984; Vacher and Rowe, 1997). Increased porosity in the Brighton Aquifer leads to more effective mixing of freshwater and saltwater and greater inward penetration of seawater on the south side of the island (Vacher and Ayers, 1980; Vacher and Rowe, 1997). This is further demonstrated by the fact that variations in water table height in wells drilled into the Langton Aquifer are fairly insensitive to variations in sea level, whereas tidally-driven variations in water table height persist much farther inland within the Brighton Aquifer (Vacher and Rowe, 1997). As a result, on the north side of the island (Langton Aquifer) the freshwater nucleus is comparatively much thicker and the seawater-freshwater interface (50% salinity) is nearly twice as deep compared to the south side of the island (the Brighton Aquifer), and wells tapping the Brighton Aquifer generally provide more brackish water (Figure 2).
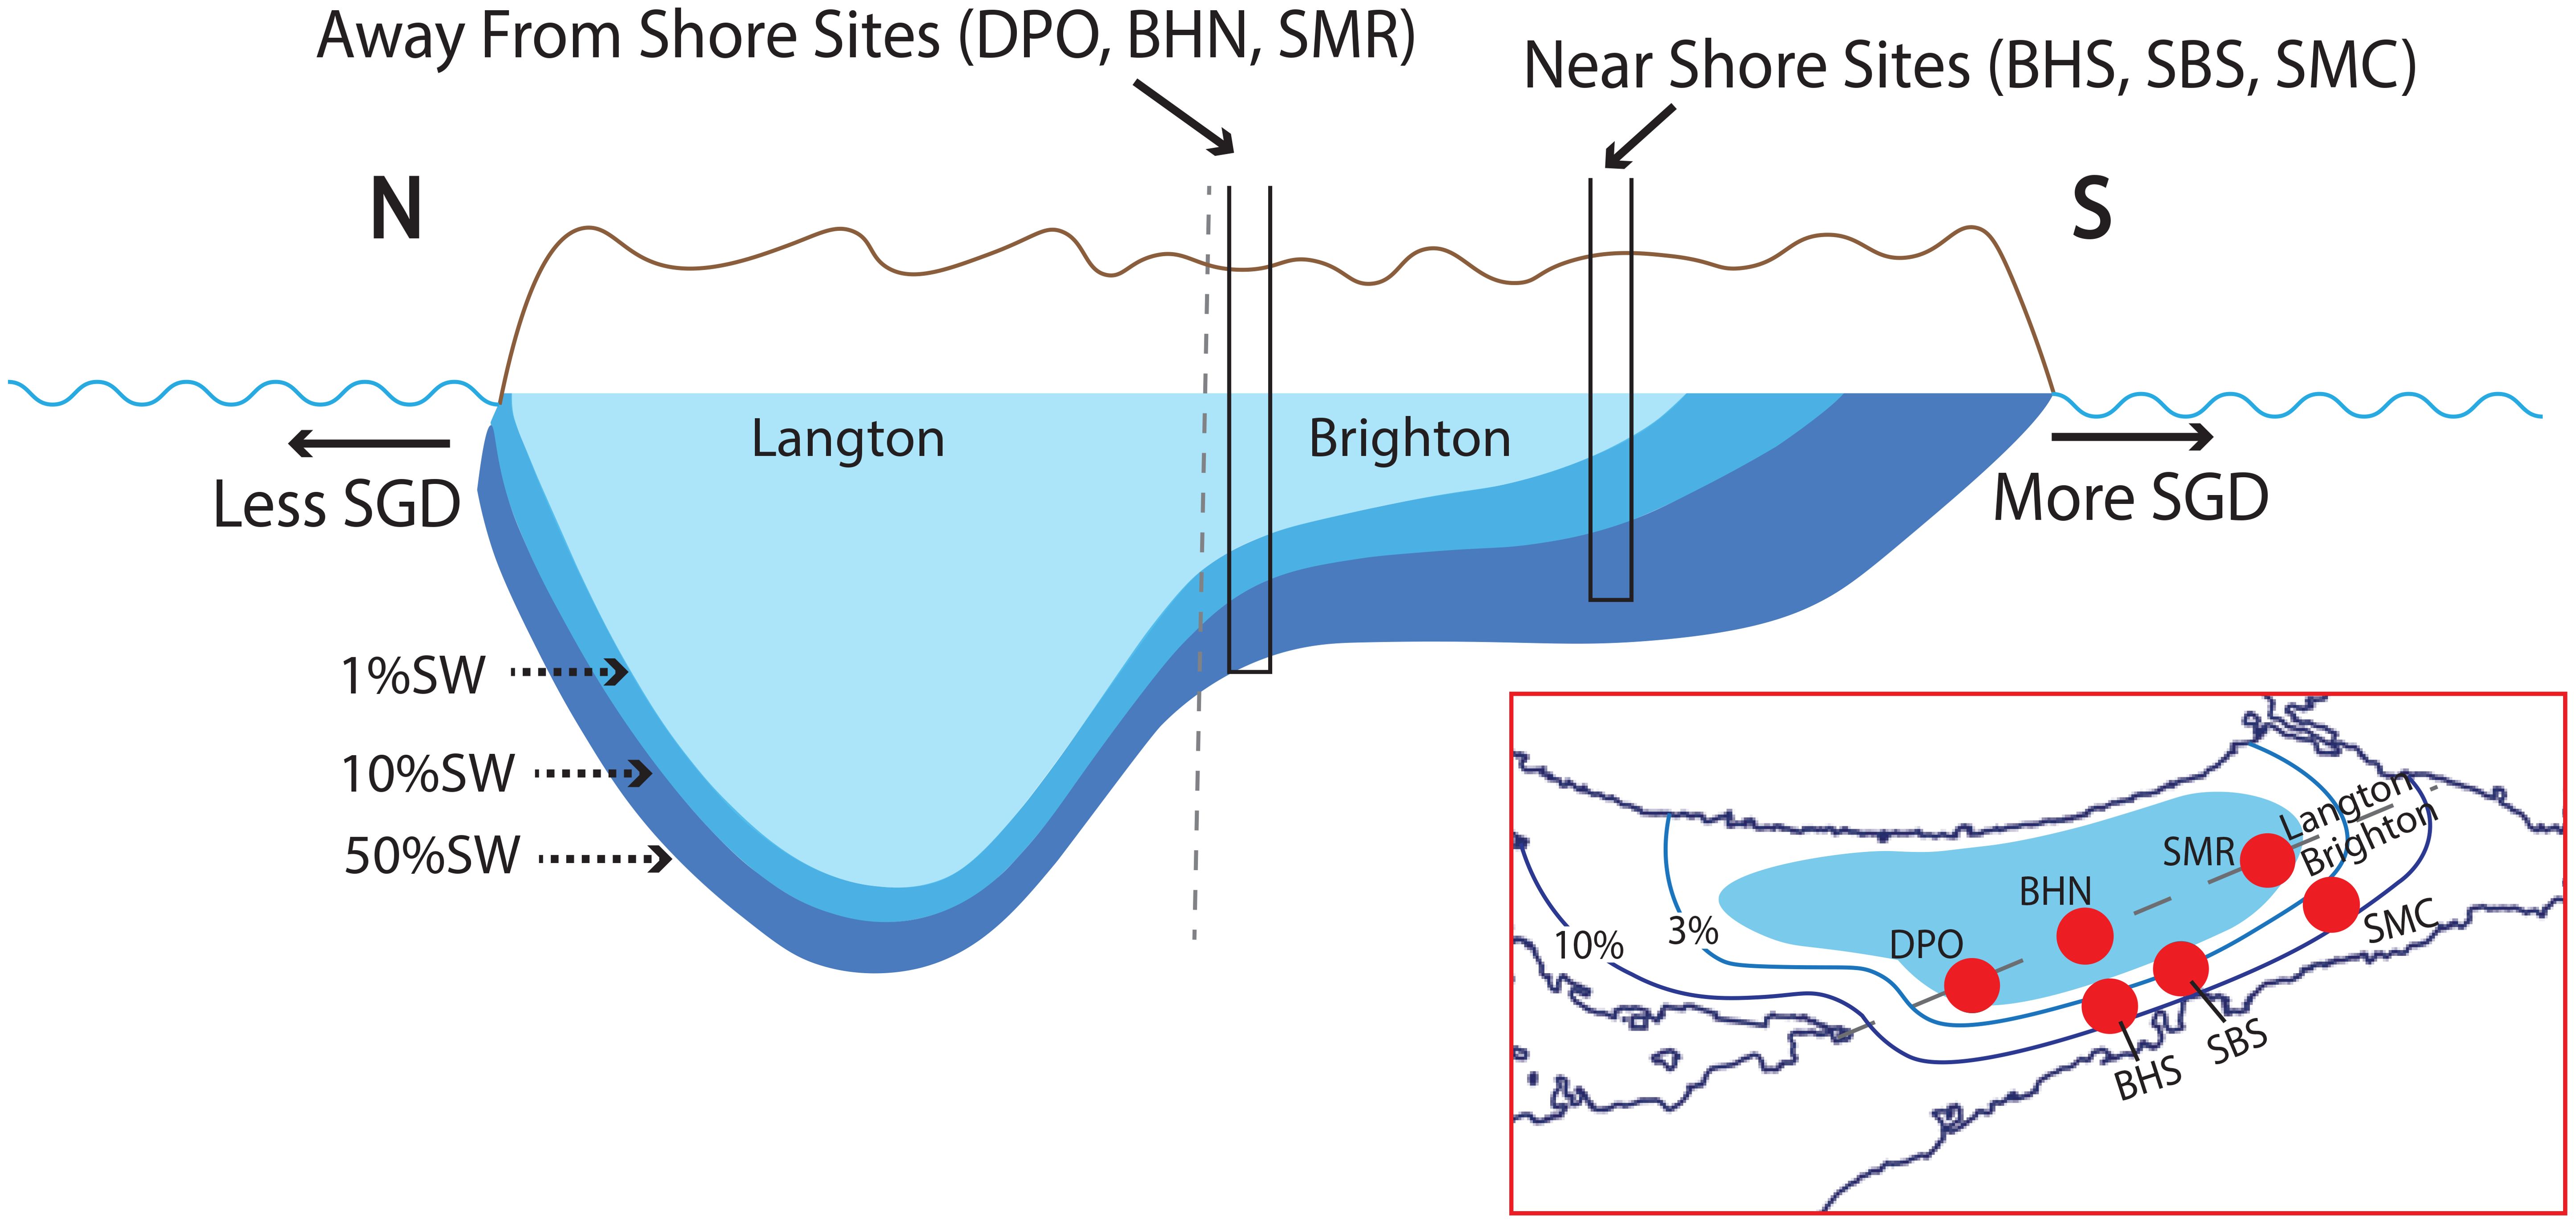
Figure 2. Schematic cross section of Devonshire Lens modified from Vacher, 1978. Isolines representing the amount of mixing based on relative salinity (Vacher, 1978). Six well locations are grouped into either the “away from shore” or the “near shore sites” based on their proximity to the south shore coastline. SGD, submarine groundwater discharge; BHN, Brighton Hill North; BHS, Brighton Hill South; DPO, Devonshire Post Office; SBS, St. Brenden South; SMC, St. March’s Church; SMR, St. Mark’s Road.
Previous work defining the extent of underground aquifers in Bermuda have used conductivity (salinity) estimates to define the position of the seawater-freshwater interface (50% contour). The oxygen isotopic composition of water (δ18Ow) can be similarly used to identify and trace seawater-freshwater interactions, as aquifer water (sourced from precipitation) and seawater have very distinct δ18Ow values (e.g. Povinec et al., 2008). One previous study measured the oxygen isotopic composition of a handful of seawater samples collected around Bermuda (Zhang et al., 2021) and found higher variability in δ18Ow in samples from the South Shore compared to elsewhere. High-resolution clumped isotope measurements in fossil bivalve shells indicated that this variation in South Shore seawater δ18O also occurred during the Last Interglacial period (~125,000 years ago) on annual timescales. The authors proposed that submarine groundwater discharge from the Devonshire Lens influenced seawater δ18Ow values along the South Shore, where the lens outcrops closest to the coastline (Figures 1A, 2), but not elsewhere. They suggested a mechanism - when sea level was lower, the increased topographic gradient between the center of the Lens and the coastal seawater height would lead to increased freshwater discharge out of the Lens into coastal waters and vice versa (Zhang et al., 2021). However, modern seawater samples collected for that study were limited in space and time, preventing direct testing of this hypothesized mechanism or investigation of variability in the timing and magnitude of discharge. Sea levels fluctuations occur on daily timescales due to tidal forces as well as annual timescales due to seasonal thermal expansion, both potentially leading to temporal changes in discharge that were not captured by this early dataset. Further, no water samples were collected directly from the aquifer to quantify the freshwater δ18Ow end-member composition.
In this study, we evaluate the variability in salinity and δ18Ow in seawater around Bermuda and in wells tapping the Devonshire Lens on multiple timescales. We present salinity and δ18Ow measurements collected bi-weekly over a period of months from sites along the South Shore, as well as hourly measurements from two South Shore sites spanning a full tidal cycle. In addition to constraining the seawater end-member, the freshwater end-member is characterized through rain, tap, and well water samples. A handful of marsh water samples were also analyzed to investigate the connectivity of marshes to the aquifer or ocean.
2 Methods
A total of 154 water samples were collected from April 2019 to March 2021, including 17 well water, 124 seawater, 7 inland marsh/pond water, 1 rainwater, and 5 tap water samples. A subset of 18 samples were previously analyzed as part of Zhang et al. (2021) using identical methods, including 17 seawater and 1 tap water and are included here as part of the larger dataset.
2.1 Water collection
2.1.1 Well water
Six wells tapping the Brighton Aquifer portion of the Devonshire Lens were sampled in August 2020, two of which were revisited in March 2021. Sampled wells were located both near the shore and further inland to investigate changes from the center of the lens to the edge (Figure 1). Wells close to the middle of the Devonshire Lens (away from the shore) are Brighton Hill North (BHN), Devonshire Post office (DPO), St. Mark’s Road (SMR); and those closer to the South Shore (near the edge of the lens) are Brighton Hill South (BHS), St. Brendan’s South (SBS), St. Mark’s Church (SMC). Samples were collected using a flow-through, double valve bailer. The bailer was gently lowered into the water column allowing water to move freely through both the top and bottom non-return ball valves until the tube was filled. After each sample was retrieved, it was then transferred into a 50ml sample vial and capped immediately to prevent evaporation. Depending on the location and the depth of the wells, 2-5 samples were taken with increasing depth from 1 to 9.5 meters below water table (Figure 3).
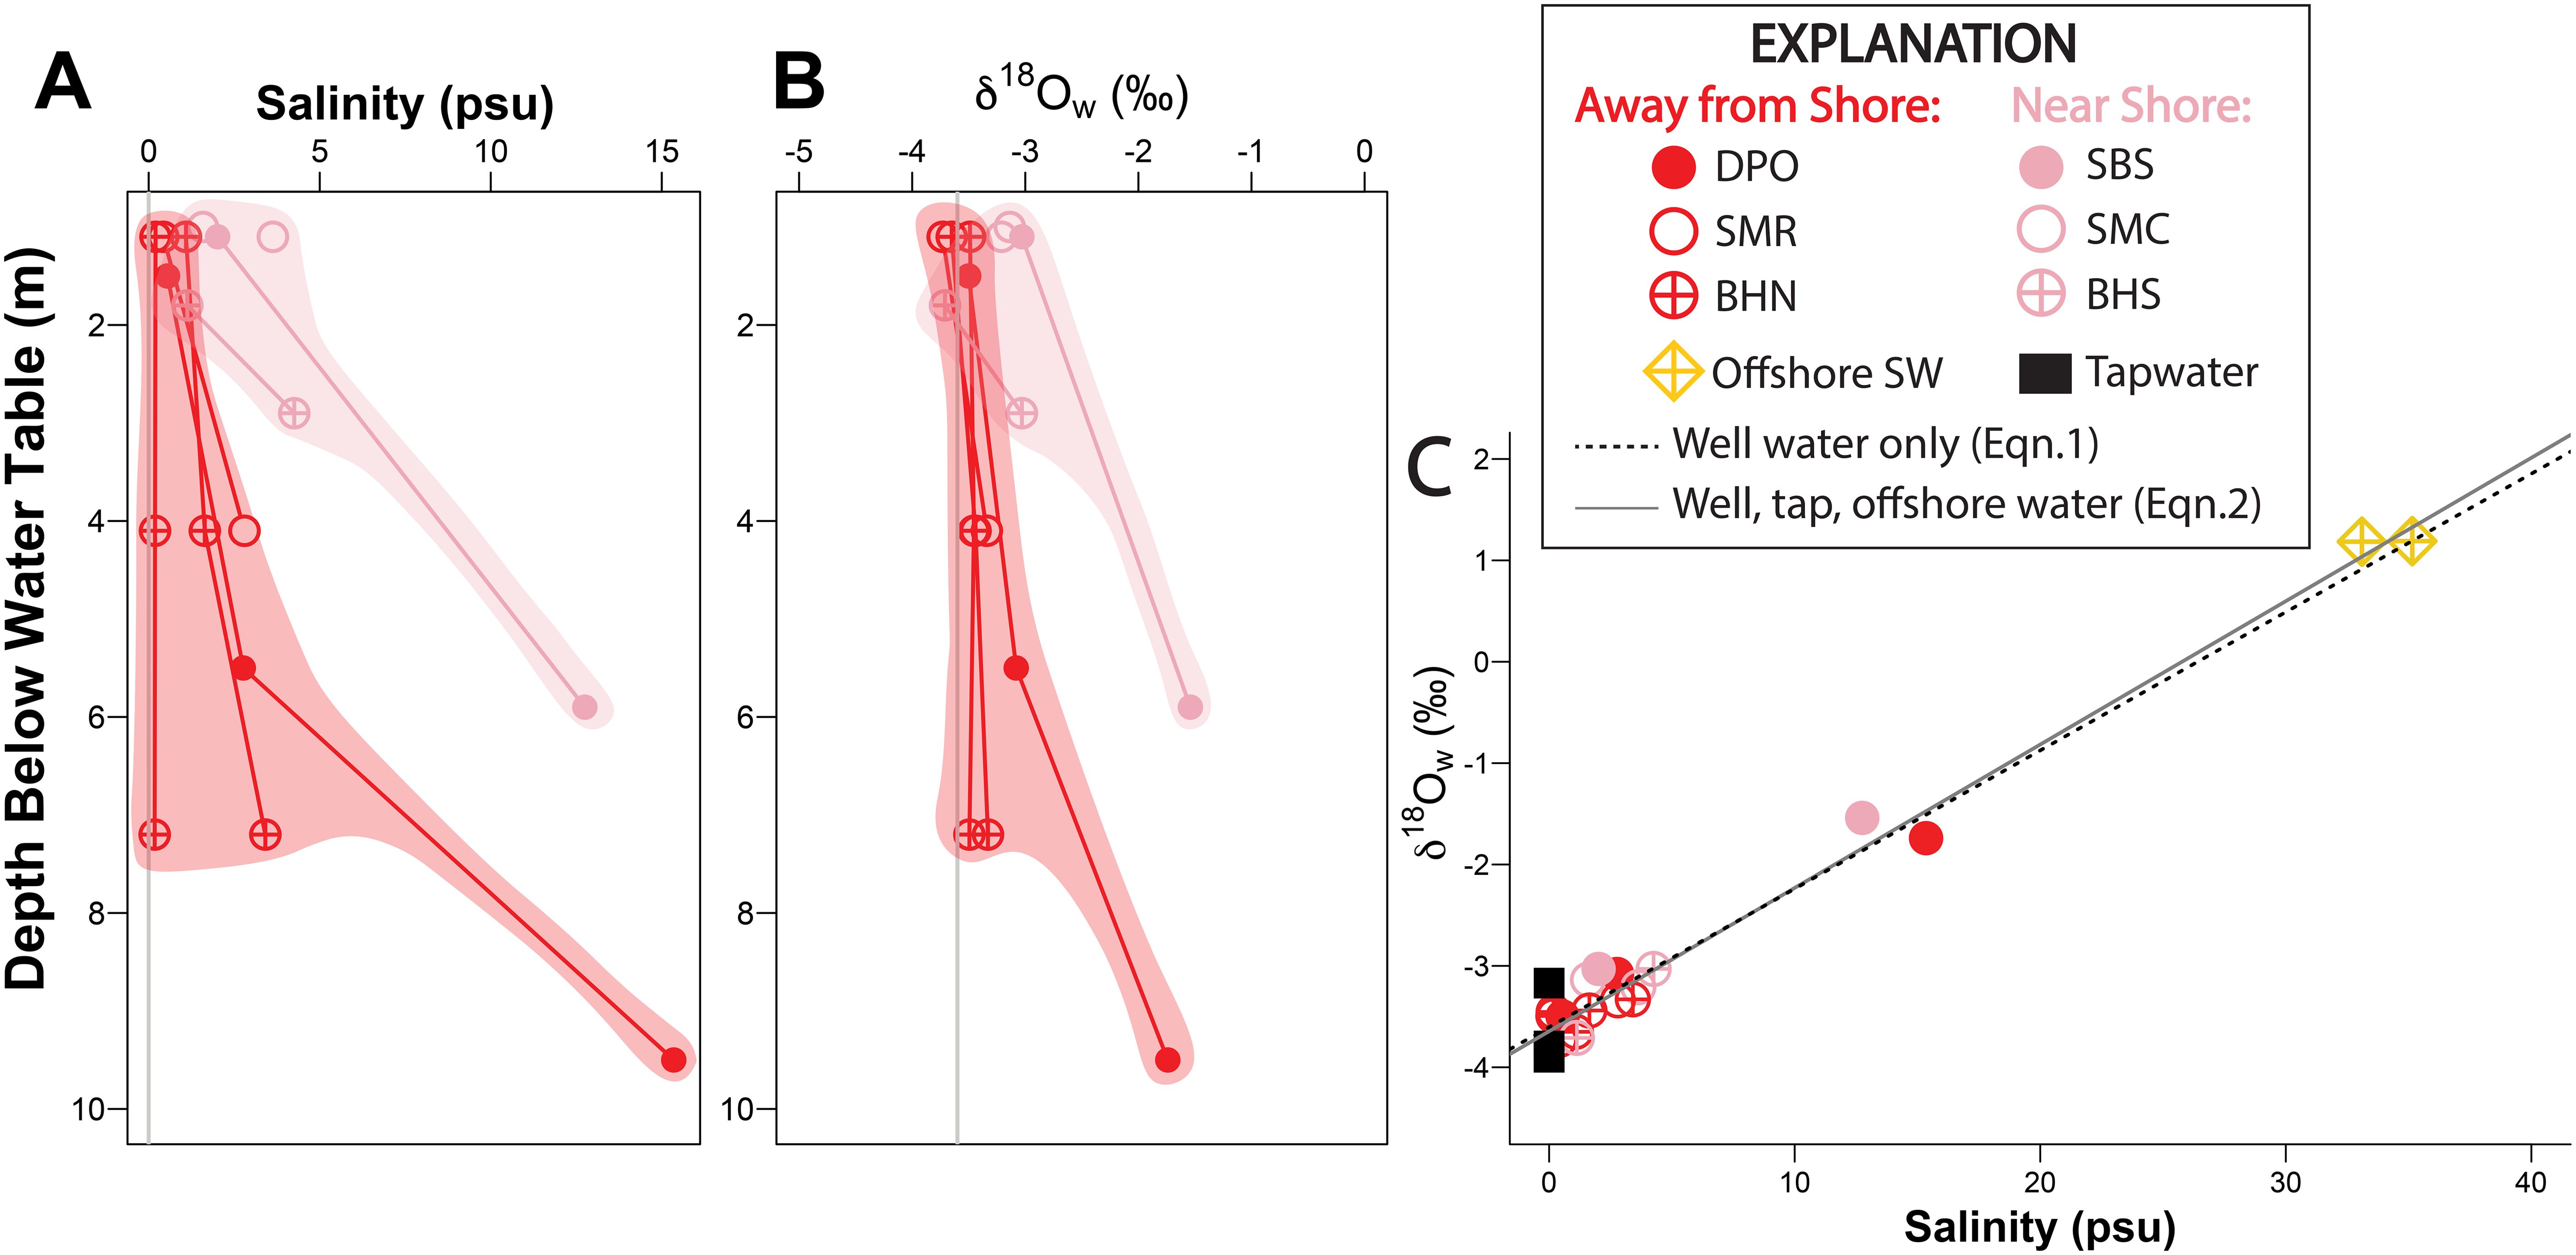
Figure 3. (A) Salinity measurements as function of depth at the six well sites. Salinity data are shaded distinguishing the two categories. (B) δ18Ow measurements as function of depth at the six well sites. δ18Ow data are shaded distinguishing the two categories. (C) δ18Ow and salinity data of the six well sites, offshore and tap water samples. A mixing line fitted through all samples are shown (Equation 2), and a trendline fitted only through the well samples are also shown (Equation 1).
Vertical coordinate information is presented in reference to the Ordnance Datum (OD), which approximates the water table height. Surface water height within each well was measured and fell approximately within 0.2 m above or below the OD depending on the well (Supplementary Figure S1). Previously, Vacher (1978) presented a general cross section of the Devonshire Lens based on converted salinity measurements in multiple wells, which we reproduce here in Figures 2, 4B. We used the distance between each of our six well sites and the South Shore coastline to place their position onto this hypothetical cross section (Figure 4B).
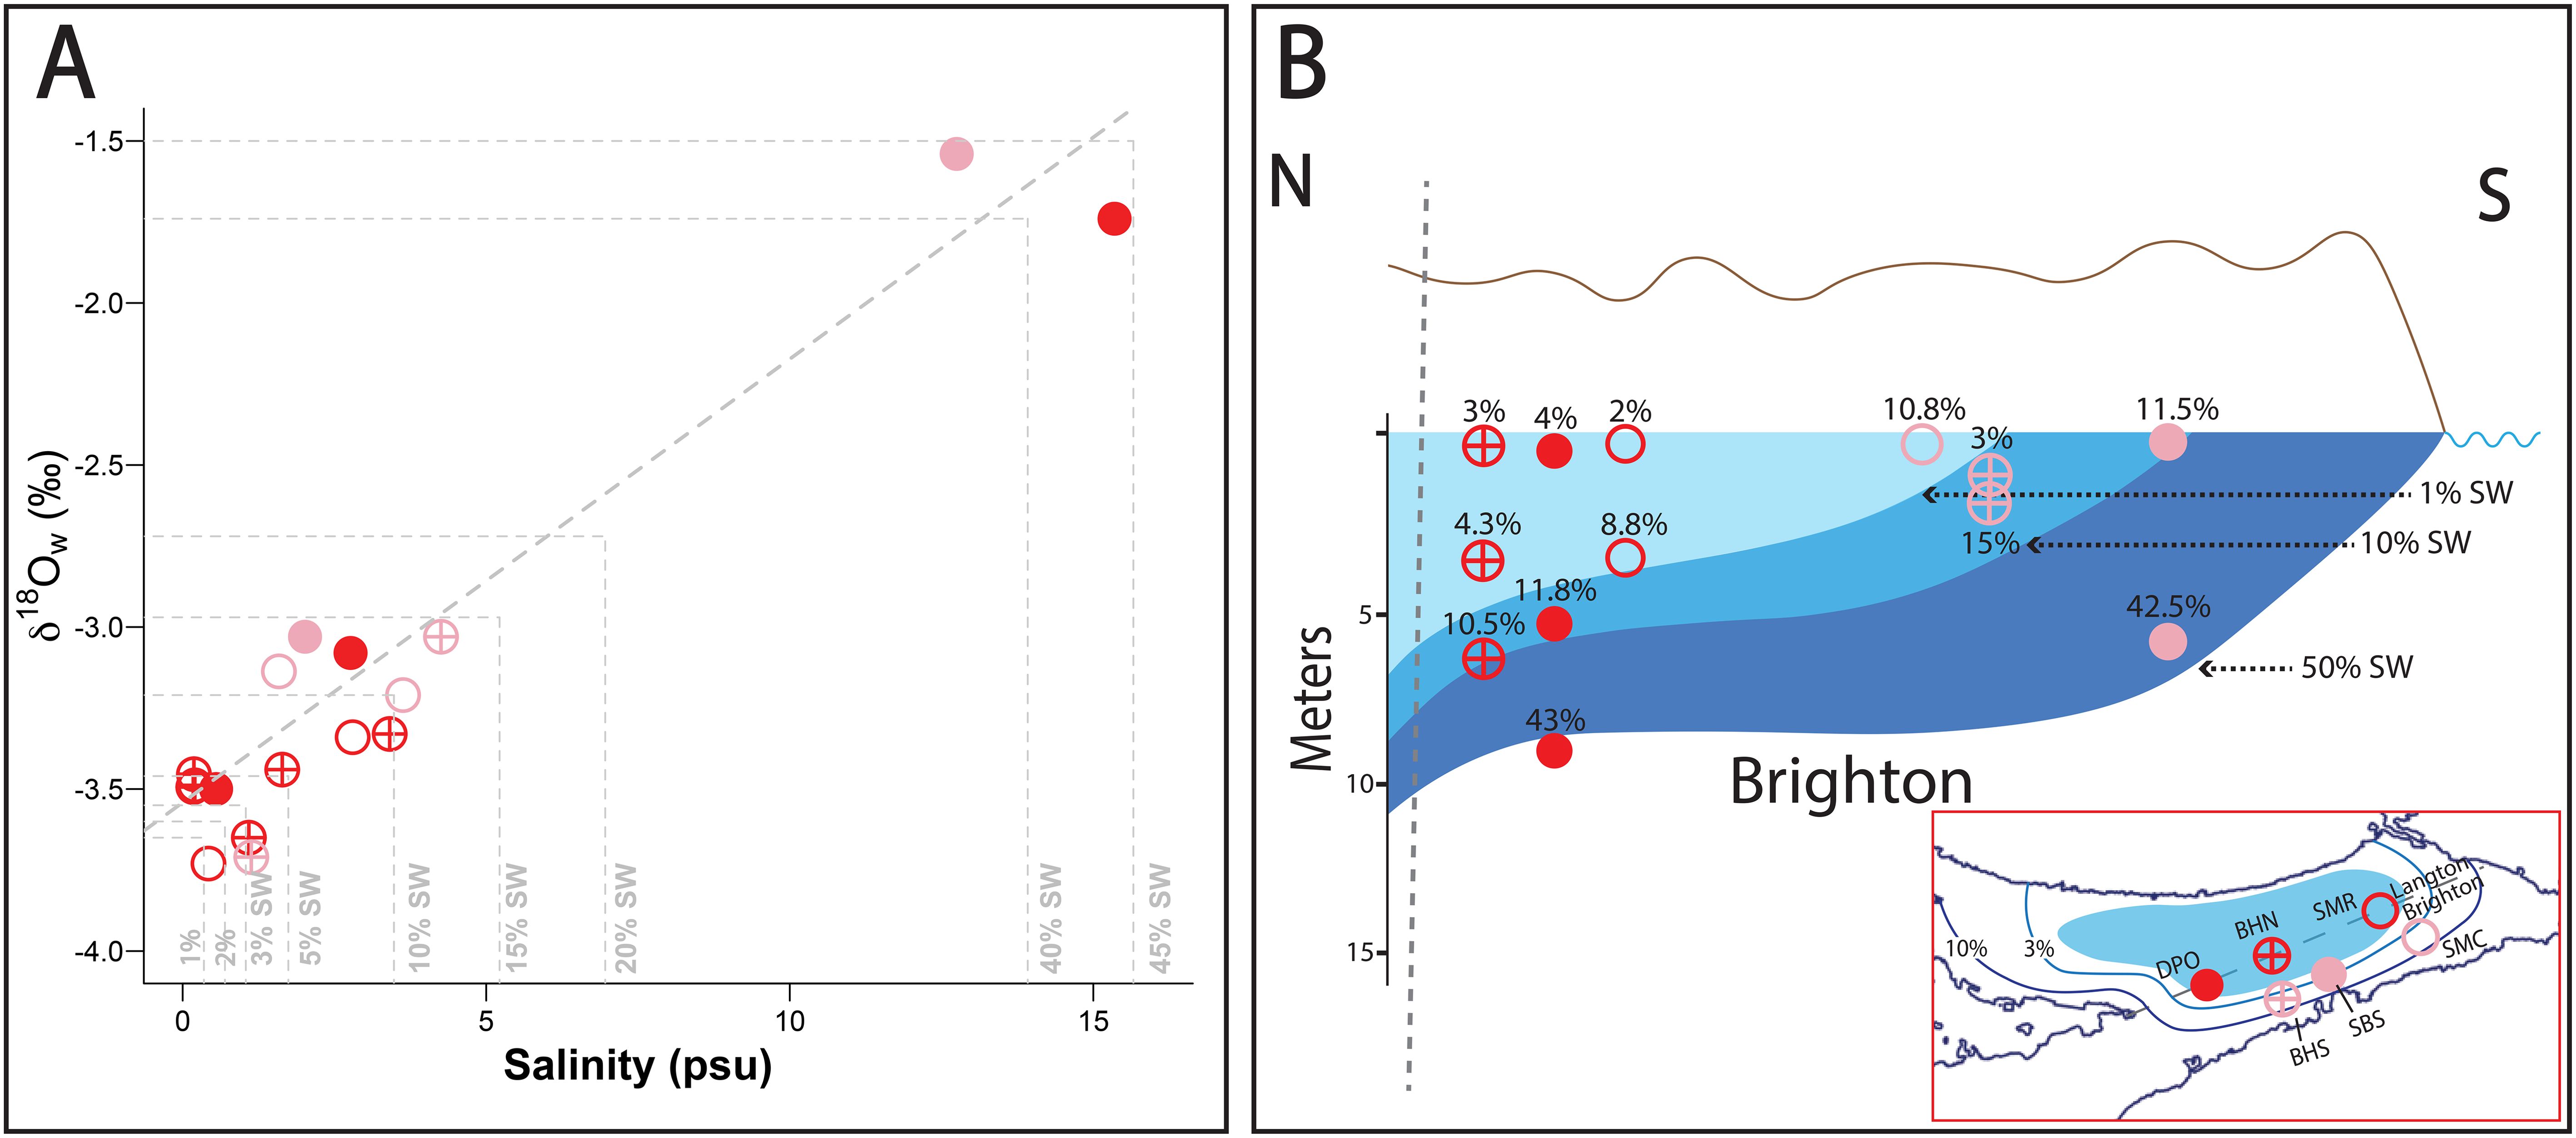
Figure 4. (A) δ18Ow and salinity data of six well sites. Points deviated from the mixing line are estimated using either δ18Ow or salinity, and an averaged number is shown. (B) Schematic cross section of the Devonshire Lens, showing the Brighton Aquifer and isolines representing the amount of mixing based on relative salinity (modified from Vacher, 1978). The six well locations are plotted as function of sample depth, with percentages indicating percent seawater based on the mixing relationship shown in (A).
2.1.2 Sea water
A total of 124 seawater samples were collected with the goal of assessing 1) variation in seawater δ18O near Devonshire Lens (along the South Shore) over both annual and tidal timescales and 2) establishing baseline variations over annual timescales in sites distal to the Lens.
To capture long term δ18Ow variability, six sites along South Shore over the period of June 2020 to December 2020 were sampled roughly twice a month. These sites include Devonshire Bay North Beach (DBNB), Rocky Bay East Side (RBES), Cox’s Bay, Kent Ave Shoreline (KAS), Hungry Bay (HB), and Grape Bay (GB). Fewer measurements from another South Shore site of Elbow Beach (EB) were also taken. Away from Devonshire Lens, our baseline site near the city of Hamilton was sampled once per week from January to March 2020 and then again once per month from July to August 2020.
In order to capture δ18Ow variability during full tidal cycle, hourly measurements were collected from two South Shore sites, Kent Ave Pulpit (KAP) and Devonshire Bay (DB). Fourteen samples were collected from KAP, roughly an hour apart starting from 5:45am until 18:14pm on May 17th 2020; on a separate occasion, ten samples were collected from DB, roughly 1-2 hours apart starting from 5:28am until 18:45pm on January 21st 2021. The site of hourly collection at Kent Avenue (the Pulpit) differed slightly from the site where bi-weekly samples were taken (the Shoreline) because water levels were too low to continually collect from the shoreline site (Figure 1C).
Individual samples were collected sporadically from a number of other sites (Cooper’s Island, Warwick Long Beach, Devil’s Hole within Harrington Sound, and a floating dock near the Bermuda Institute of Ocean Sciences (BIOS)). These data were combined with 17 other published seawater samples from 13 sites (including Cooper’s Island), previously published by Zhang et al. (2021) (Figure 1).
Additionally, two samples were collected from far offshore to represent baseline marine δ18Ow values away from the influences of any submarine groundwater discharge. One was collected at the Bermuda Atlantic Time-series Study (BATS) station (47 miles offshore to the southeast), the other was collected roughly 2.1 miles offshore to the southeast from the center of the island (Figure 1).
2.1.3 Other water types
To quantify other aqueous endmembers, rain, tap, marsh, and mangrove pond waters were collected where available (Figure 1). A single rainwater sample was collected in July 2020 after a significant storm event. Four tap water samples were collected in households located in Warwick parish from July-September 2020 and combined with data from one additional tapwater sample collected in April 2019, also from Warwick parish (Zhang et al., 2021). Seven samples from island marsh/pond environments were collected, including one sample each from Mangrove Lake and Trott’s Pond in May 2019 and five samples from two sites within Devonshire Marsh in January and March 2021.
2.2 Salinity
Prior to isotope measurements, all samples were analyzed for their salinity to assess whether this parameter correlated with δ18Ow and compare traditional methods to new ones. Salinity was measured in duplicate for all water samples using the Extech EC170 salinity meter, which has a typical uncertainty of ±2% (<0.8 ppt). 1 standard deviation (1SD) of the mean was reported as the error bar for individual samples. Salinity measurements from the EC170 were also compared against a third measurement using a Leica handheld temperature compensated refractometer, which has an uncertainty of ±0.5 ppt. Measurements from the Leica refractometer were not included in the final salinity data.
2.3 δ18Ow measurements
All samples were prepared for δ18Ow analysis at the University of Michigan, following the CO2-water equilibration method described in Zhang et al. (2021). Briefly, 4mL water samples of all types were equilibrated with tank CO2 at 1 atm for at least 48 hours, then CO2 was extracted and analyzed on a Thermo-Finnegan MAT 253 dual inlet mass spectrometer for at least 3 acquisitions of 12 sample-reference cycles at an m/z 44 beam strength of 16 V. At least two aliquots of CO2 gas from a single water equilibration were independently measured on the mass spectrometer, separated by weeks to accommodate variation in mass spectrometer behavior and standard calibration. Unknown samples were analyzed interspersed with two USGS standards (USGS 45, 46) and three in-house standards (Michigan DI water (MDIW), evaporated MDIW (EVAP), and twice evaporated MDIW (2XEVAP)) whose ‘true’ compositions were previously defined against USGS 45 and 46 through repeated measurements. A linear regression through data from these five standards within a given measurement session was used to correct unknown waters, with units reported in per mille (‰), relative to SMOW. Typical measurement uncertainty was ± 0.1‰ based on long-term reproducibility of the in-house and USGS water standards.
2.4 Tidal Information
Hourly tidal information covering the study interval was sourced from the NOAA Tides and Currents program (https://tidesandcurrents.noaa.gov/). Specifically, data was used from station #2695535, located at the Bermuda Biological Research Station (32° 22.2 N, 64° 41.7 W). The water level and water temperature sensors are located on the south bulkhead wall of the ship dock at the Bio Station. All data is quality controlled and made publicly available by the NOAA Tides and Currents program.
3 Results
3.1 δ18Ow and salinity in well water
δ18Ow values in well waters range from -3.7 to -1.5‰ and salinity varied from 0.2 to 15.2 psu. δ18Ow and salinity both increase with depth as the contribution of seawater increases (Figure 3). Well sites located further inland show gradual increases in both salinity and δ18Ow values as depth increases compared to sites located close to the South Shore coastline (Figures 3, 4), as expected based on the shape of the lens (Figure 2). Put another way, the increased influence of seawater on salinity and δ18Ow occurs at a shallower depth near the coastline than further inland.
In addition to following a similar qualitative pattern with depth, salinity and δ18Ow across all well water samples show a tight quantitative correlation (Figure 3C). A linear regression through data from the 17 well water samples (Equation 1) is statistically indistinguishable from a linear regression though data from the 17 well waters, plus 5 tap waters and 2 offshore seawaters (Equation 2), suggesting that the majority of variation in well water salinity and δ18Ow values can be explained by simple mixing between precipitation-derived freshwater and offshore seawater.
The corresponding standard errors on the slope and intercept for Equation 1 are 0.0113 and 0.0592, respectively. The corresponding standard errors on the slope and intercept for Equation 2 are 0.0047 and 0.0510, respectively.
Following this two-endmember mixing model, the percent contribution of seawater and aquifer water can be estimated using either salinity or δ18Ow (Figure 4A), resulting in similar estimates (Supplementary Figure S2). Averaging estimates using salinity and δ18Ow, well water samples range from 1% seawater in the surface-most sample from SMR to 42% in the deepest sample from DPO, with the spatial distribution generally following the previously established shape of the Devonshire Lens (Figure 4B).
3.2 δ18Ow and salinity in coastal seawater
Large variations in oxygen isotopic composition and salinity were observed in the seawater sample set, with δ18Ow values ranging from 0.4‰ up to 3.0‰ and salinity ranging from 31.5 to 38.5psu (Figure 5). The majority of this variability occurred in seawater samples collected at 7 sites along the South Shore, located in the center part of the island near the Devonshire Lens (“South Shore samples”) (Figure 1). With a small number of exceptions, non-South Shore seawater samples produced extremely consistent δ18Ow values and salinities, essentially invariant given analytical uncertainties.
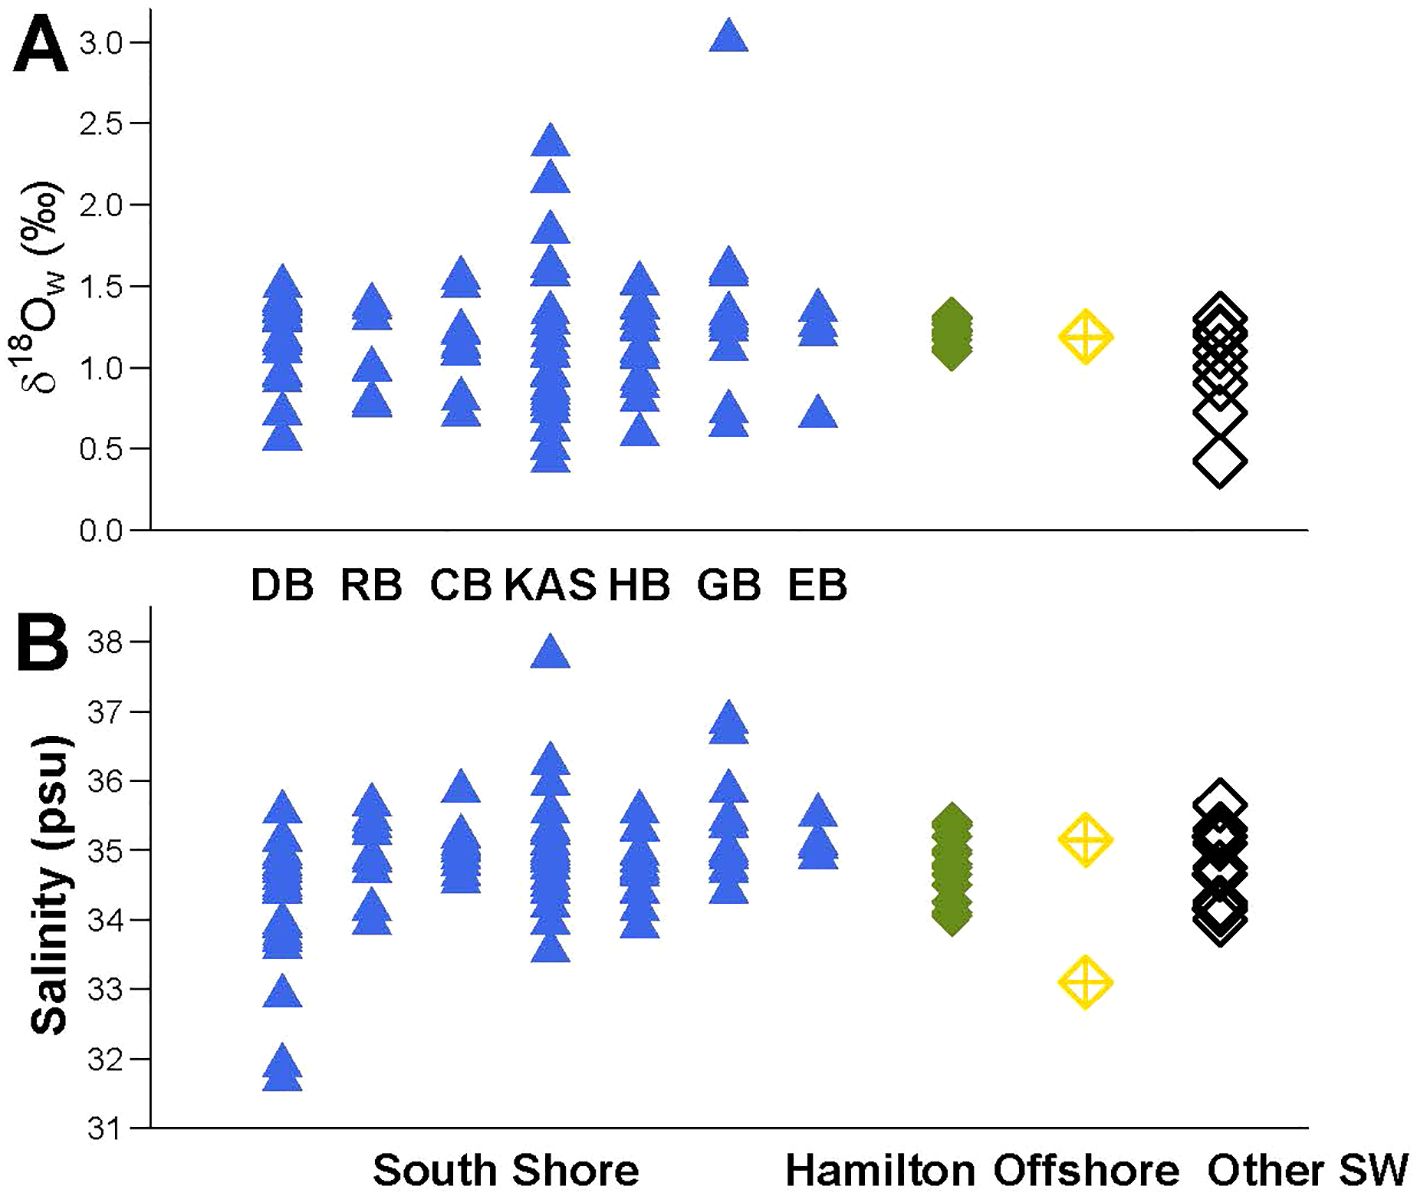
Figure 5. (A) δ18Ow measurements of all seawater. (B) Salinity measurements of all seawater.
3.2.1 Consistent δ18Ow and salinity values in non-South Shore seawater
In samples collected from the Great Sound, North Shore, and South Shore areas away from the Devonshire Lens, coastal seawater δ18Ow values and salinities were generally consistent, ranging from 0.4 ± 0.1‰ to 1.3 ± 0.1‰ and 34.0 ± 0.5psu to 35.7 ± 0.1psu. The primary exceptions to the narrow range in δ18Ow values seen in non-South Shore samples are the two samples collected from the BIOS floating dock, which have much lower δ18Ow values of 0.4 and 0.7‰, but similar fully-marine salinities (Figure 6B). The floating dock is located along a narrow inner channel near an extensive cave complex, which may affect the exchange of freshwater and seawater. However, with only two measurements, it is difficult to determine the mechanism driving the change in δ18Ow and lack of change in salinity at this site.
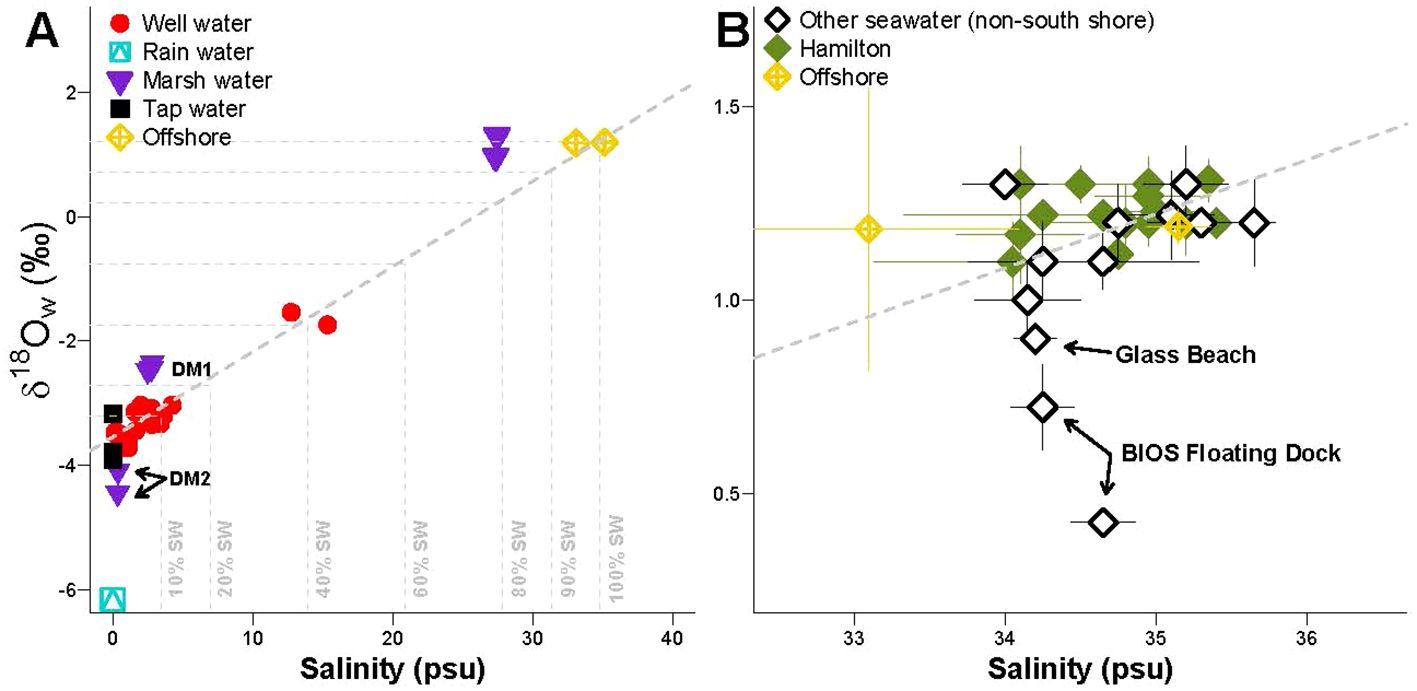
Figure 6. (A) δ18Ow and salinity data of well, rain, marsh, tap and offshore water samples. Trendline indicate mixing relationship. (B) δ18Ow and salinity data of the non-south shore seawater, Hamilton and offshore samples plotted on the mixing relationship. Errors reflect reproducibility of the measurements, reported as 1SD of the mean.
Two samples from the northwest edge of the island (Somerset Long Bay and Glass Beach) record slightly lower δ18Ow values than the rest of the non-South Shore sites (1.0‰ and 0.9‰, respectively). These sites are located close to the Somerset Lens, the second largest freshwater lens on the island (Vacher and Rowe, 1997), but with only three samples collected near this lens at different times, further systematic study would be needed to evaluate the spatial and temporal variability of seawater conditions in this area.
Excluding samples from the BIOS floating dock and the two sites near the Somerset Lens, remaining non-South Shore seawater samples show a very narrow range in δ18Ow and salinity (1.1 to 1.3 ± 0.1‰, 34.0-35.7 ± 0.5psu), consistent with the offshore seawater composition, representing baseline seawater compositions away from any terrestrial influence (1.2 ± 0.1‰, 34.5-35.5 psu, Figure 5). This holds true through time as well as space. Samples collected over a 6-month period from a dock near the city of Hamilton showed the same narrow range of variability as the offshore samples, equivalent to no variation in composition at all when uncertainty is included.
3.2.2 Temporally variable δ18Ow and salinity in South Shore seawater
Along the South Shore, δ18Ow ranged from 0.6 to 3.0‰ and salinity ranged from 31.7 to 38.5 psu (Figures 5, 7). The wide salinity range is mainly driven by samples from DBNB on the lower end and GB on the higher end. Without these two sites, the South Shore salinity ranges roughly from 34 to 36psu, similar to the temporally invariant non-South Shore site of Hamilton. The range of variability in δ18Ow is artificially expanded due to one very enriched point from Grape Bay (3.0‰), which was collected in the surf zone, and likely reflects evaporative enrichment. All other samples from Grape Bay were collected in knee-height water. Without this one point, although the total range is reduced, South Shore seawater samples still vary considerably in δ18Ow, ranging from 0.6 to 2.1‰. This variability far exceeds the narrow range in δ18Ow seen in Hamilton and other non-South Shore sites.
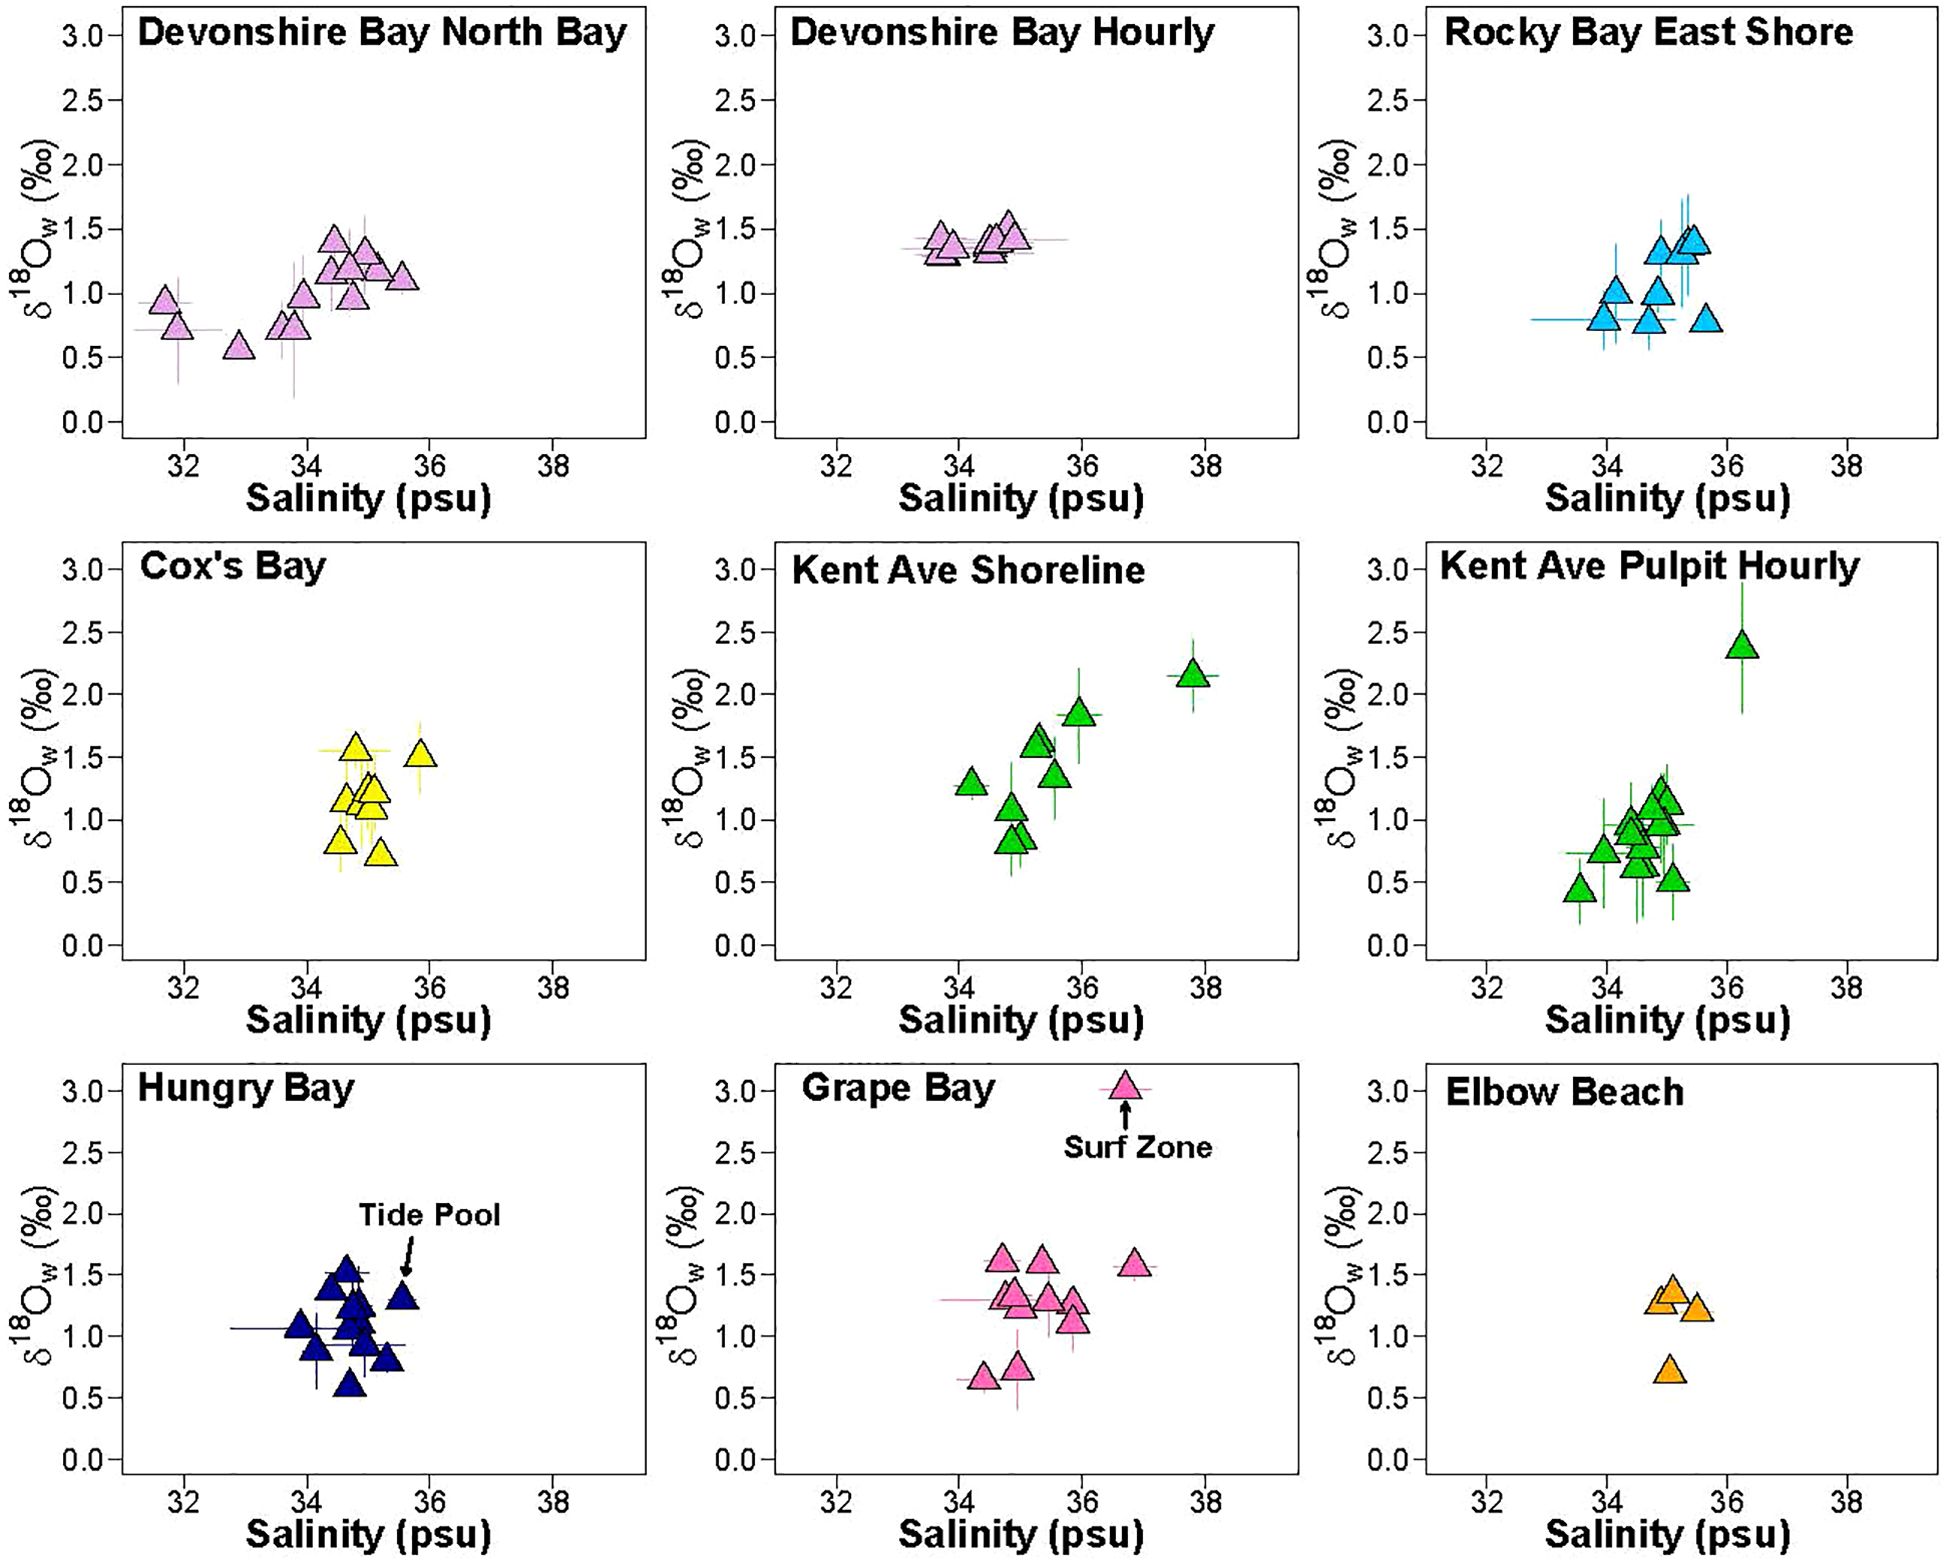
Figure 7. δ18Ow and salinity data of individual south shore sites. Trendline indicates the mixing line, and background blue cluster represents δ18Ow and salinity data of Hamilton and offshore samples. Errors reflect reproducibility of the measurements, reported as 1SD of the mean.
Variation in δ18Ow in South Shore samples tracked changes in local sea level throughout the year (Figure 8). When water levels were higher, δ18Ow values were higher, closer to or exceeding the offshore seawater value of 1.2‰. When water levels were lower, δ18Ow values trended downwards. Interestingly, salinity did not vary as clearly with sea level or correlate with δ18Ow as closely as in well water samples. For example, at KAS, salinity varied by 7psu while δ18Ow varied by 1.4‰, while at Cox’s Bay, salinity varied by less than 1.5psu while δ18Ow variation exceeded 1‰.
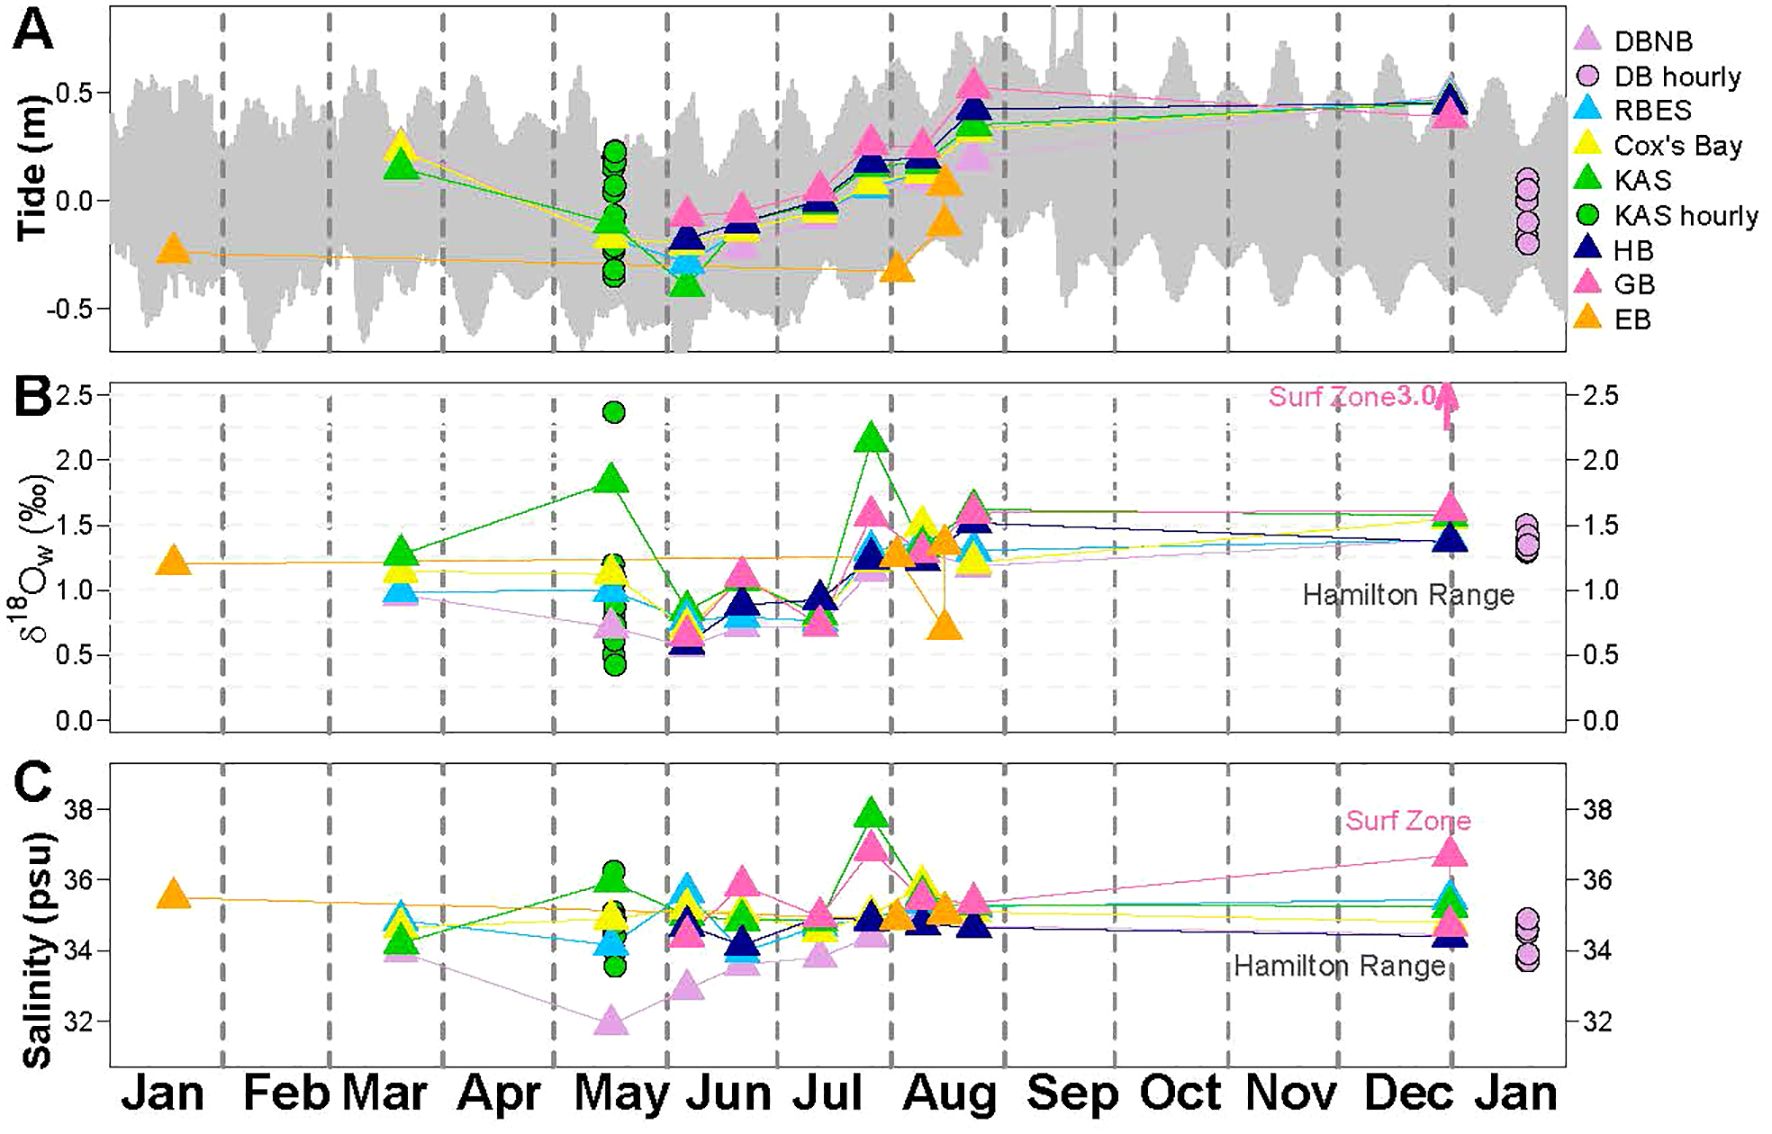
Figure 8. (A) Tidal information over the sampling months (January 2020-January 2021), points indicate sampling time. Tide is referenced to mean tide level in meters, 0 represents mean tide/sea level. (B) δ18Ow data of the 6 south shore sites. (C) Salinity data of the 6 south shore sites.
Samples collected hourly over a 12hr period from Kent Avenue Pulpit (KAP) recorded 1.4‰ variability in δ18Ow, with individual sample values ranging from 0.4 to 2.4‰ (Figure 9). Salinity varied in time with δ18Ow, ranging from 33.6 to 36.3psu (Figure 9). Both δ18Ow and salinity showed increasing values near high tide and decreasing values near low tide. Hourly measurements from Devonshire Bay (DB) recorded a similar co-variation of salinity and δ18Ow with tidal height, although with a much smaller magnitude of variation that barely exceed uncertainty. At this site, over one tidal cycle, δ18Ow ranged from 1.3 to 1.5‰ and salinity ranged from 33.7 to 34.9psu (Figure 9). Although total variation in both parameters approaches detection limits given uncertainty, higher δ18Ow and salinity values were observed at high tides and lower values were observed at low tides at both sites.
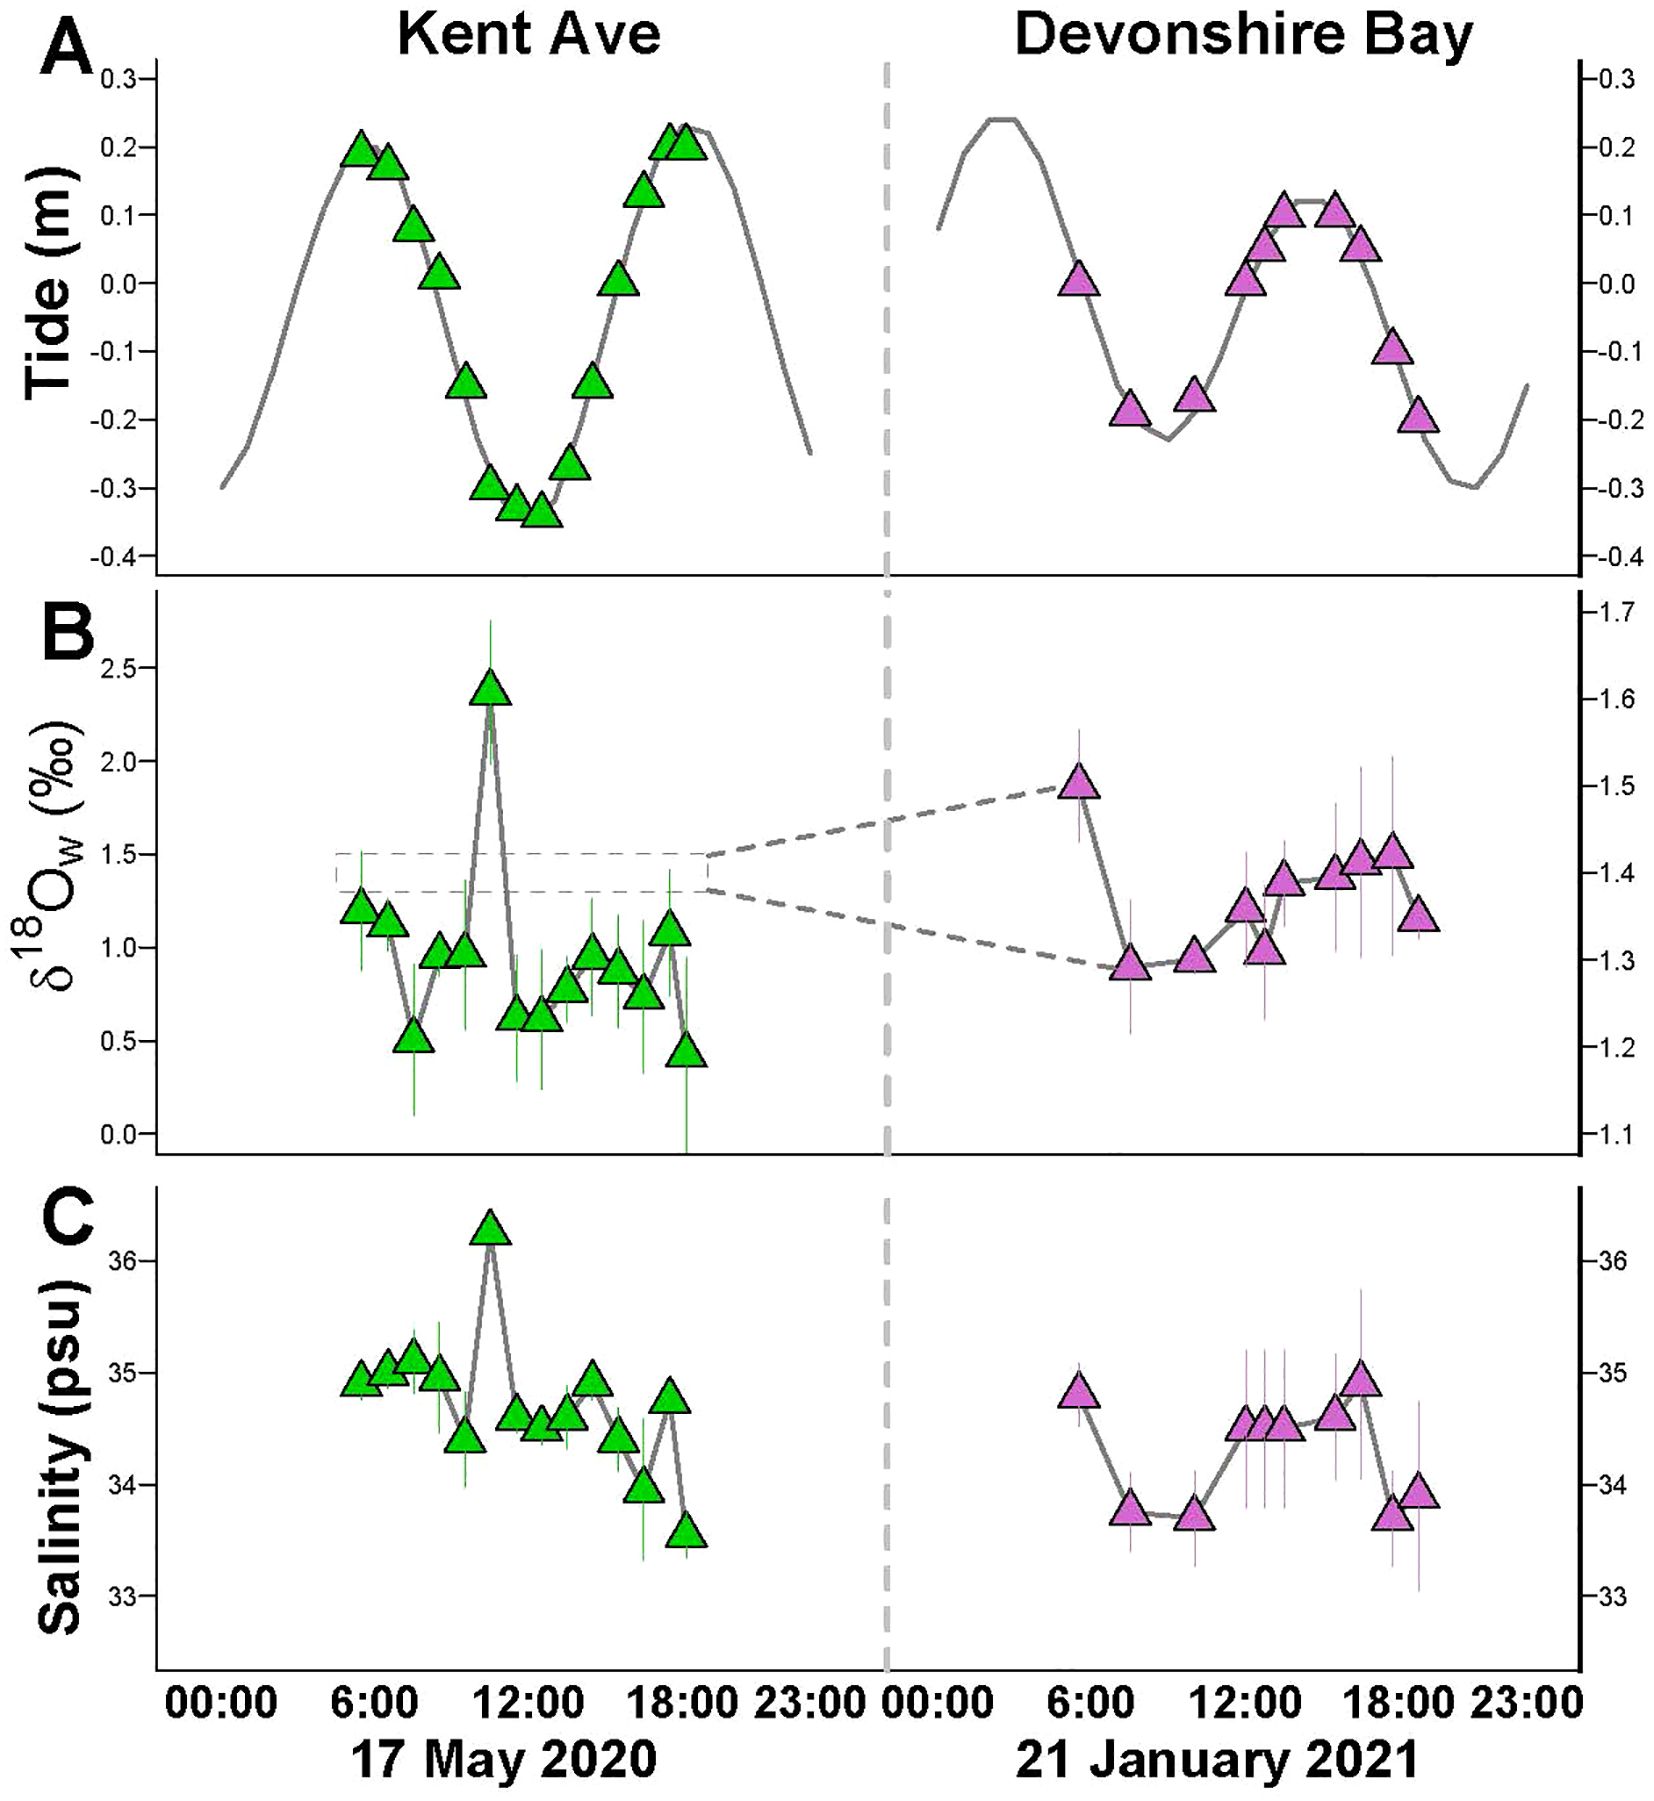
Figure 9. (A) Daily tidal information, with points indicate sampling time. (B) δ18Ow data of hourly sampling at Kent Ave and Devonshire Bay. (C) Salinity data of hourly sampling at Kent Ave and Devonshire Bay. Errors reflect reproducibility of the measurements, reported as 1SD of the mean.
Overall, seawater sampling demonstrates large scale (>1‰) variation in δ18Ow along the South Shore, correlated with sea level, whether driven by tidal or seasonal sea level changes. Non-South Shore samples demonstrate highly stable δ18Ow values across space and time, consistent with samples taken far offshore. These findings based on this new large seawater dataset align with those of Zhang et al. (2021) based on a much more limited dataset.
3.3 δ18Ow and salinity in rainwater, pond and marsh waters
Two sites within Devonshire Marsh (DM1 and DM2) were each sampled twice on the same day, roughly three hours apart. Site DM1 was revisited two months later and sampled again. Water compositions were very consistent between measurements of the same site, but sites DM1 and DM2 were significantly different (Figure 6). The three measurements from DM1 had δ18Ow values of -2.5 to -2.3‰ and non-zero salinities of 2.5 to 2.8. The two measurements from DM2 were more depleted in δ18Ow (-4.4 to -4.1‰) and had salinities indicating nearly pure freshwater (0.35 to 0.38psu). Both of these clusters of data fall off the seawater-aquifer mixing line defined by well waters (Figure 6A), indicating water in the marshes is influenced by processes other than direct connection with subterranean aquifers, such as surface evaporation.
Samples collected from inland ponds south of Harrington Sound (Trott’s Pond, Mangrove Lake) recorded δ18Ow values from 0.97 to 1.3‰ and salinities of 27.4 to 27.5psu. These high salinity values suggest a connection with the ocean via the subsurface.
The single rainwater sample recorded a δ18Ow value of -6.2‰. The tap water samples, representing integrated precipitation with a minor influence of evaporation, had δ18Ow ranging from -3.9 to -3.2‰. Both tap and rain water samples are completely fresh (salinity = 0 psu).
4 Discussion
4.1 δ18Ow and salinity define a slightly smaller Devonshire Lens than in 1978
The salinity and δ18Ow data from the well water samples align with previous depictions of the Devonshire Lens (Figure 2B) and freshwater lenses in general. Both salinity and δ18Ow values increase with depth in the well, transitioning towards the marine end-member as the contribution of seawater increases. Further, the highest-elevation samples taken in wells near the edge of the lens are more saline and enriched in δ18Ow than the highest-elevation samples taken in wells near the center of the lens (Figure 3), reflecting increased interaction between aquifer water and seawater near the edge of the lens.
The size and shape of the Devonshire Lens was previously mapped by estimating the percent seawater with depth in many wells using salinity alone (Vacher, 1978). The fitted Ghyben-Herzberg-Dupuit model of Vacher (1978) is shown in Figures 2 and 4B. Now, due to the clear distinction between the oxygen isotopic composition of freshwater and seawater, δ18Ow can similarly be used to estimate the seawater contribution at different points and, through that, define the boundaries of the lens. Using salinity and δ18Ow produce similar patterns, as shown in Supplementary Figure S2, and the average of the two methods is shown in Figure 4B.
Estimates of the extent of seawater influence in these six wells hint that the Devonshire Lens may have changed shape since it was last characterized in 1978. In the original model reproduced in Figure 4 (Vacher, 1978), the depth contours represented a cross section through the thickest part of the Brighton Aquifer, a line running southwest of well DPO. Perhaps unsurprisingly then, new data from DPO closely aligns with the model of Vacher (1978). In contrast to DPO, data from BHS, the closest coastal site to the cross section line, suggests upward motion of the 10% salinity contour.
Wells SMR and SMC also indicate shallower positions of the 10% contour, as well as the 1% contour. Wells SMR and SMC are on the northeastern edge of the lens, so the idealized cross section is not applicable. The previous model suggests the top-of-well samples taken from these two wells should contain between 3% and 10% seawater (Vacher, 1978; Vacher and Ayers, 1980, Figure 2). In particular SBS should be closer to 3% while SMC should be closer to 10%. In our new data, the surface-most sample from SBS was 11.5% and SMC was 10.8%, indicating increased seawater penetration at these sites.
Taken together, this data suggests the core of the lens has moved to the southwest (deepening of 50% contour at DPO) and that seawater incursion is greater along the South Shore (shallowing of 10% contour in BHS, SBS, and SMC). The author of the previous Devonshire Lens characterization raised the possibility that the lens size had already shrunk between the time of characterization and the time of publication due to extractions and droughts (Vacher, 1978). Our data supports this assertion but cannot quantify when that decrease in lens size occurred.
4.2 Non-South Shore seawater samples reflect regional seawater compositions
Previous researchers have assumed that seawater δ18Ow values around the island of Bermuda have been fixed in space and time, based on the lack of riverine inputs and the small land surface area (Winkelstern et al., 2017). The seawater dataset we present here demonstrates that to be true for most coastal areas of Bermuda, but not all. With the exception of samples collected near freshwater lenses (the Somerset Lens or South Shore outcrop of the Devonshire Lens) and/or the BIOS floating dock, all other seawater around the island of Bermuda appears to have a composition of 1.2 ‰ (± 0.1 ‰) and a salinity of 35 psu (± 0.5 psu). Data from Hamilton, a site that was sampled repeatedly over 6 months (Figure 10) shows that this stability persists through time as well as across space and occurs irrelevant of tidal height.
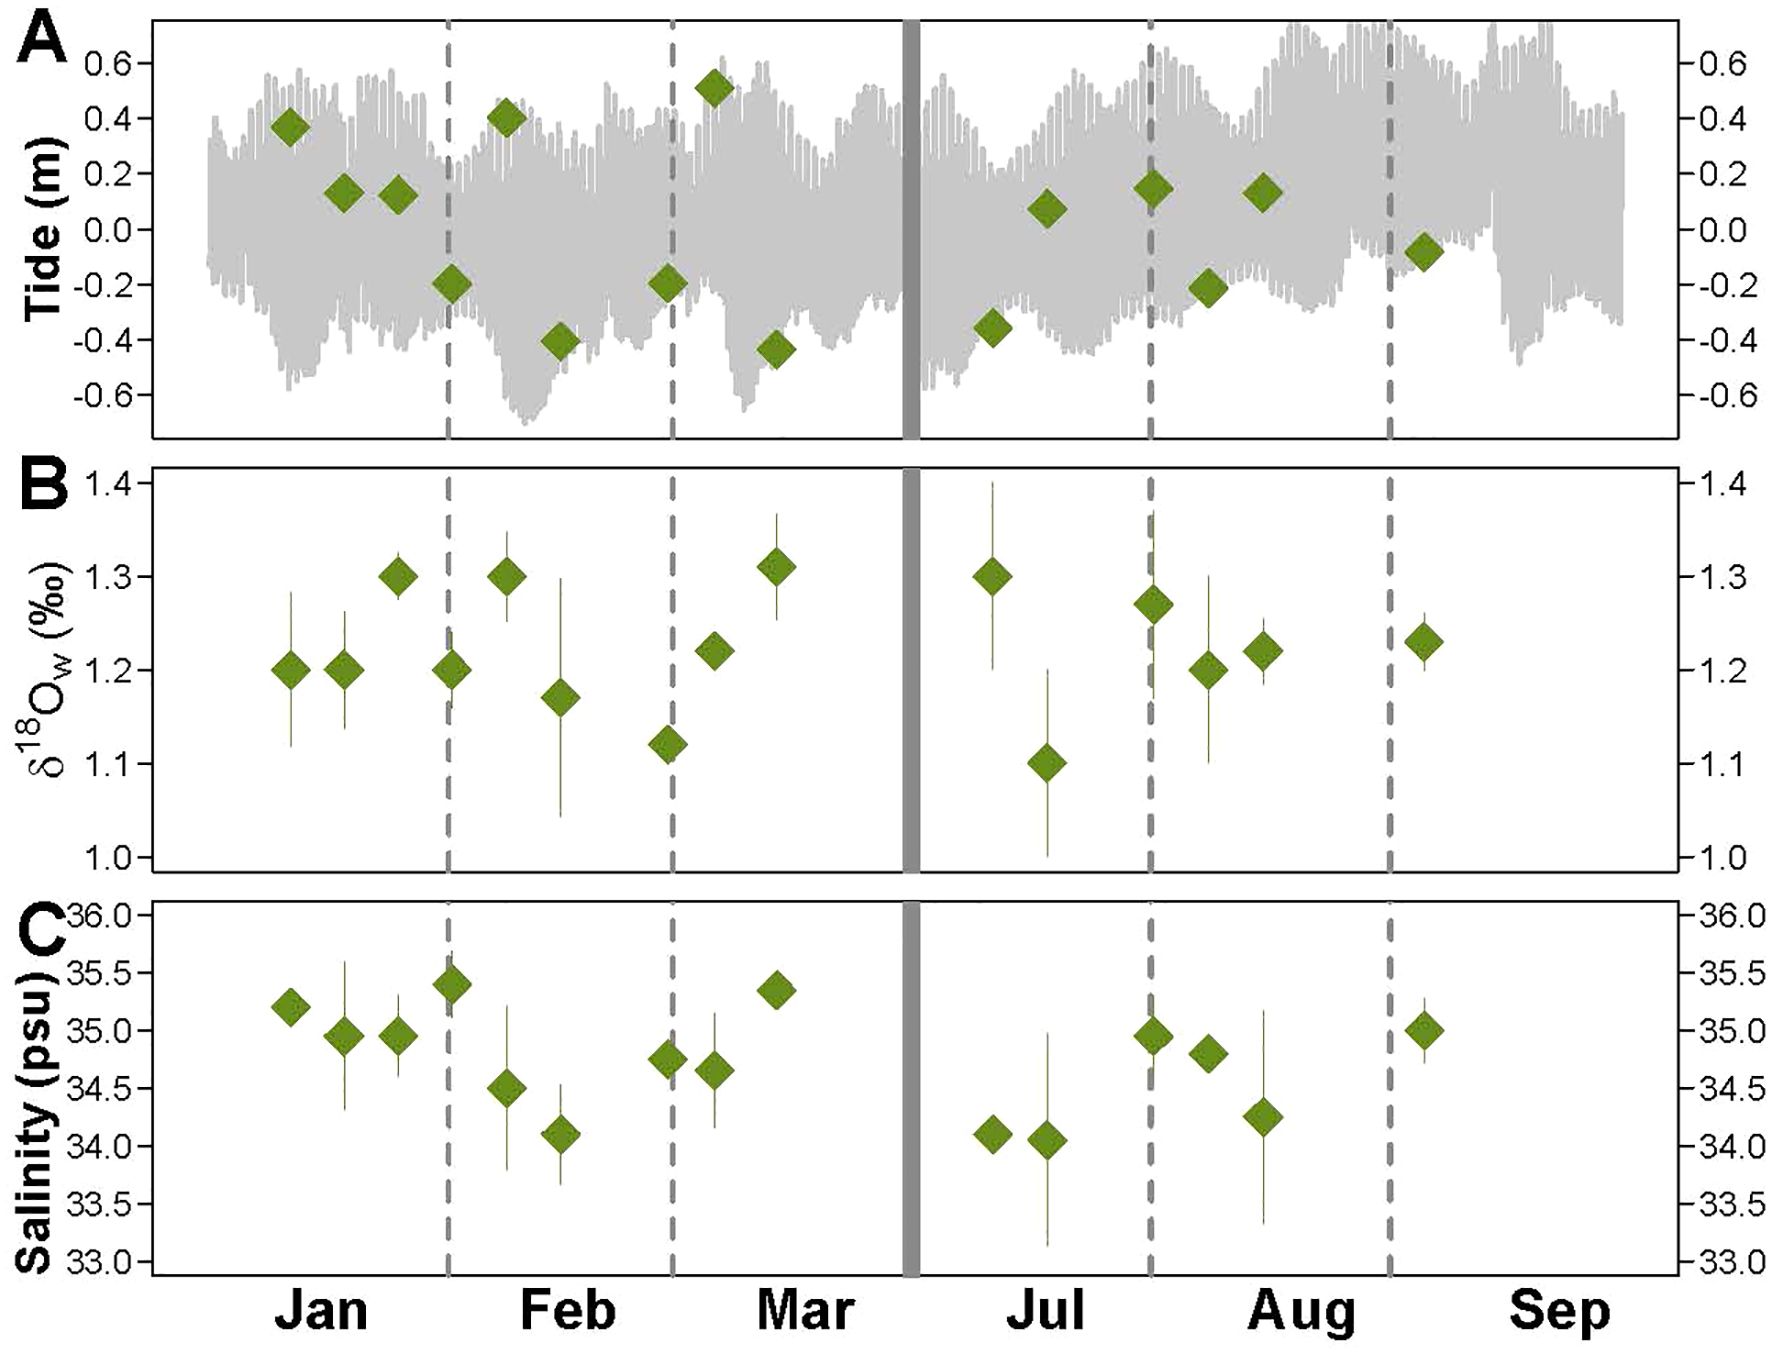
Figure 10. (A) Tidal information over the sampling months in 2020, green points indicate sampling time. (B) Hamilton δ18Ow data. (C) Hamilton salinity data. Typical instrument uncertainty is 0.1‰ and 0.1 psu for δ18Ow and salinity, respectively. Error bars here reflect reproducibility of the measurements, reported as 1SD of the mean.
The warm, salty water mass bathing Bermuda originates in the Caribbean and travels up the US East Coast as part of the Gulf Stream Current before deviating offshore to intersect Bermuda. Along this pathway, the oxygen isotopic composition and salinity are apparently minimally modified. Long-term monthly observations from BATS record salinity ranges from 36.3 to 36.7 (Griffin et al., 2022). The BATS range is much higher than our single sample collected near BATS (33.1 psu) and our overall non-South Shore salinity range (34.0 to 35.7 psu), which we cannot explain. Additionally, almost all of the South Shore salinity values are lower than the BATS salinity range as well (Figure 5). This may suggest a calibration error in the EC170 digital salinity meter, but all salinity measurements were conducted in random order intermixed with the South Shore samples, so even in the case of a calibration error, some conclusions hold. For example, it is unlikely that the salinity meter recorded a range from 31.7 to 38.5 psu for the South Shore samples and a notably more limited range of 34.0-35.7 for the non-South Shore samples due to a calibration error. Therefore, it is clear that the non-South Shore samples recorded minimally varying salinity compared to South Shore sites, and this agrees with the long-term salinity records from BATS. Further, seawater from the east coast of Florida has a composition of 0.7-1.2‰ and salinity of 34.1-34.9psu (Zhang and Petersen, 2023), similar to baseline Bermuda seawater measured here. Changes in baseline seawater composition around Bermuda may therefore reflect greater regional oceanographic processes.
4.3 South Shore δ18Ow variability and its relation to sea level height
Data from a previous study of Bermudan seawater compositions (Zhang et al., 2021) suggested that variability in seawater δ18O was greater along the South Shore compared to elsewhere around Bermuda. Our new expanded dataset, collected across more sites and a longer time period, confirms this finding (Figures 5, 7). The authors of the previous study hypothesized that South Shore seawater, unlike coastal seawater in other areas of the island, may be influenced by submarine groundwater discharge from the nearby Devonshire Lens. Since freshwater lenses are non-saline and their water is sourced from isotopically depleted precipitation, this submarine freshwater discharge should reduce both salinity and δ18Ow values of affected coastal seawater. Although this large variability in δ18Ow suggests the discharge mechanism was mainly affecting the South Shore, it does not negate the possibility of discharge along North Shore of the Devonshire Lens. A recent study from Sims et al. (2020) showed groundwater discharge with elevated levels of nitrogen was impacting the reef community on the North Shore. They observed cold, low-salinity water visibly discharging from cracks in the limestone reef in one area termed a “vent site”. Neither that or this study collected systematic samples from North Shore that would be needed to show the magnitude of δ18Ow variability and make comparisons to our South Shore sites.
Based on the proposed hypothesis, the amount of discharge should be related to local sea level, with increased discharge occurring when sea levels are lower. When sea levels are higher, the topographic gradient from island center to coast is reduced, which would reduce outwards flow of freshwater. The limited dataset in the previous study (Zhang et al., 2021) did not allow testing of the temporal component of this hypothesis or the correlation between sea level and δ18Ow values. Our new expanded dataset supports this submarine freshwater discharge hypothesis, showing increased δ18Ow values during periods of elevated sea level (Figures 8A, B). Salinity also varies with sea level, although the relationship is not as clear (Figures 8A, C). Over the sampling interval, daily tidal fluctuations and monthly lunar cycles were superimposed on annual changes in average sea level due to regional thermal expansion and contraction (Figure 8A). The relationship between δ18Ow values and sea level holds true over all three timescales, whereas the relationship between salinity and sea level is most clearly visible on tidal time scales.
4.3.1 Tidal timescales
On tidal timescales, hourly measurements of δ18Ow and salinity collected at both DB and KAP show increased values at high tides and decreased values at low tides, consistent with the submarine groundwater discharge mechanism (Figure 9). Although the patterns are similar at the two sites, the magnitude of variations are very different. Samples from KAP range from 0.4 to 2.4‰ over a single tidal cycle, whereas samples from DB range from only 1.3 to 1.5‰. The latter can barely be distinguished from invariance, given analytical uncertainty, but the pattern is clearer than in the noisier KAP time series. Salinity also varies much more at KAP (33.6 to 36.3 psu) compared to at DB (33.7 to 34.9 psu), although the magnitude of variability is more similar if the single high salinity point from KAP is not included.
This difference in magnitude of variability, and the fact that KAP shows high outliers on both tidal (Figure 9) and monthly (Figure 8) timescales may be due to the coastal geometry and the time of year of collection. First, the magnitude of the tidal cycle (high tide – low tide) that was sampled in May at KAP was >0.5m, whereas the sampled tidal cycle at DB in January fluctuated only ~0.3m. A greater tidal range would be predicted to correlate to greater variability in salinity and δ18Ow. Second, at KAP, an extended ledge is partially exposed at lower tidal heights, leading to local semi-restriction of coastal waters from the open ocean, potentially making this site more sensitive to both evaporative enrichment and freshwater outflow (Figure 1C). The slightly different KAP site was selected for hourly sampling because the established location of biweekly sampling (KAS) was sometimes without water during lowest tides. The hourly sampling at KAP was conducted in May, when low tides reach an annual minimum, enhancing the restriction, whereas the hourly sampling at DB was conducted in January, a time of intermediate sea level. Finally, wind speeds on the day of collection at DB were much higher (8-19 mph) than on the day of collection at KAP (6-8mph). Higher wind speeds would accelerate mixing away of a local salinity or δ18Ow anomaly, potentially helping explain the lower amplitude of variation at the DB site.
Overall, despite differences in magnitude and noisiness of the time series, both sites show increasing salinities and δ18Ow values with increasing tidal height (and vice versa), supporting the submarine groundwater discharge mechanism.
4.3.2 Lunar and annual timescales
Bi-weekly sampling over a period of months also showed the predicted relationship between δ18Ow and sea level height. Particularly over May-August 2020, δ18Ow values increased as sea level height increased (Figure 8). There is consistency in δ18Ow values across the six coastal sites through time, indicating a large-scale mechanism at work.
Individual high δ18Ow outliers at KAP/KAS and GB occur in May, late July, and to a lesser degree, late June. These high δ18Ow values tend to correspond to higher salinities as well, suggesting evaporative enrichment as the cause. As discussed above, unlike the other rocky shorelines, the KAP/KAS site has a coastal geometry that appears to make it susceptible to restriction and evaporative enrichment. The finding of samples from GB with elevated salinity and δ18Ow values may be explained by evaporative enrichment as well. GB is a very gently sloping, sandy beach where waves wash over large horizontal distances, promoting evaporative enrichment over subsequent wave cycles. Most GB samples were taken from the surface in knee-depth water. In December 2021, one sample was taken from the surf zone, extremely close to shore in only inches of water. This sample showed significant evaporative enrichment, with a δ18Ow value of 3.0‰ and a salinity of 36.7 psu. This suggests that evaporative enrichment is happening in the shallowest water, which would have influenced δ18Ow values and salinity of collected knee-depth waters to a varying degree based on daily conditions such as wind speed, direction, wave height, etc.
The lowest salinities (<34 psu) and δ18Ow values (<0.75‰) are seen at Devonshire Bay (DB). Of all the South Shore sites, DB is the farthest northeast, closest to the center of the Devonshire Lens. It is also a semi-enclosed bay, so it may trap freshwater discharge more readily than other sites. It is difficult to say whether proximity to the lens or local coastline geometry plays a larger role in producing low salinity and δ18Ow values at this site.
4.4 Mechanisms controlling salinity variation along South Shore
The submarine discharge mechanism predicts that salinity and δ18Ow should vary in tandem in coastal waters if discharge of aquifer water mixing with background seawater were the only control on water composition. In both the hourly and bi-weekly sampling, we see a relationship between δ18Ow values and sea level height that supports the freshwater discharge mechanism. Although in hourly sampling, the salinity changes in concert with δ18Ow, the relationship with salinity is not as apparent in the bi-weekly sampling (Figures 8, 9).
Well-water samples from the transition zone show a clear mixing relationship between salinity and δ18Ow (Figure 6A), defined by Equations 1 and 2, but South Shore seawater samples do not plot along the same mixing line (Figure 6). Excluding high salinity outliers that are likely due to evaporative enrichment (KAP/KAS and GB) and low salinity outliers driven by closest proximity to the lens and/or coastal geometry (DB), the vast majority of other salinity values fall within the stable, narrow range seen at Hamilton (~34.1-35.4 psu) (Figure 8), despite these same sites demonstrating >1‰ variability in δ18Ow. Equations 1, 2 predict a roughly ~7 psu decrease in salinity for every 1‰ decrease in δ18Ow due to mixing with pure aquifer water, a magnitude of salinity change that is not seen.
It is difficult to explain the observed low variability in salinity. Variability in δ18Ow is not inflated due to analytical reasons, as samples from Hamilton and other non-South Shore sites show very stable values. Small variations in salinity may be masked by the precision of the salinity meter (instrument precision = ± 0.1 psu), although even the less precise tool should be able to detect the predicted ~7 psu changes in salinity.
A previous study also found greater variability in δ18Ow compared to salinity in the Bermuda seawater samples (Epstein and Mayeda, 1953), although they only had a few samples. The authors suggested repeated evaporation and precipitation would remove light oxygen isotopes and transport them away in the vapor phase, while maintaining a similar salinity. This mechanism may be acting but would not apply to very local scale anomalies in δ18Ow due to freshwater discharge or uniquely target South Shore sites. Another study investigated how sea spray aerosols could deposit salt on land and elevate salinities in interior pools of water (Smith et al., 2021). Surface waters rushing over land may pick up these salt molecules and deliver them to the ocean, or to the aquifer water below as rainwater percolates down beneath the land. However, this mechanism also would not specifically target South Shore areas.
Finally, it is possible that the observed pattern of salinity and δ18Ow is the result of aliasing due to the low temporal resolution of sampling (once per 2 weeks) vs. tidal timescales and a superposition of influences of daily vs. annual-scale processes. Samples collected in June, a time of lower mean sea level, were also collected from intermediate to low tide. Samples collected in August, a time of higher mean sea level, were collected closer to the daily high tide. It is not clear how this may translate to the observed lower variability in salinity relative to δ18Ow, but we note it in the face of a lack of satisfactory alternative explanations. More work would be needed to resolve this mystery.
4.5 δ18Ow as a method for detecting submarine groundwater discharge
Classical methods of detecting SGD and aquifer size have used electrical conductivity and/or salinity measurements (Vacher, 1978; Vacher and Ayers, 1980). However, the lack of salinity change seen in South Shore seawater samples relative to the observed δ18Ow change in this study demonstrates that the unique hydrological setting of the South Shore would not have been detected by salinity measurements alone. Increasingly, studies of submarine groundwater discharge apply multi-method approaches to detect SGD and aquifer changes (Ibánhez et al., 2021; McKenzie et al., 2021). This study demonstrates that δ18Ow can be useful alongside salinity to study these aquifer-seawater processes and could be a new addition to the toolkit recently summarized by Taniguchi et al. (2019). In future work, adding in another isotopic proxy (deuterium excess) may be helpful in determining the mechanisms behind salinity vs. δ18Ow changes by helping identify the impacts of evaporation relative to mixing on coastal seawaters.
5 Conclusion
Submarine groundwater discharge is a coastal process driven by a combination of climatologic, hydrogeologic and oceanographic factors. It is often overlooked due to the challenges in quantifying it, which require assumptions based on understanding of the oceanography, hydrogeology and geochemistry of the study area. However, understanding SGD is essential for developing sustainable water and coastal nutrient budgets at both local and global scales. Here, through a systematic survey of the hydrologic system using salinity and δ18Ow measurements of various water types both around and on the island of Bermuda, we contribute to the understanding of SGD on this island platform.
Currently, in Bermuda, demand for potable water exceeds supply derived from rainwater collection. When precipitation levels decline and/or when more high-occupancy buildings like hotels are built and inhabited, alternative drinking water sources must be tapped to make up the difference. This is accomplished mainly through groundwater extraction at wells located across the island. However, unsustainable extraction from the island’s freshwater lenses could result in a reduction of the freshwater nucleus and an increase in saltwater intrusion, reducing the quality of extracted water through salt contamination, especially in wells located closer to the shoreline. Studies like this one are important in order to quantify current aquifer size through multiple metrics, understand freshwater-seawater interaction around the island, and determine a baseline against which future studies can compare.
Global warming is changing global precipitation patterns and melting ice sheets, leading to sea level rise. In Bermuda, sea levels have already risen by >0.2 m since 1930 (NOAA Tide and Current https://tidesandcurrents.noaa.gov/). As sea levels continue to rise, the size of Bermuda’s freshwater lenses will shrink, further exacerbating the issue of insufficient freshwater supply. As extraction plans evolve in the face of these forecasted changes, having a baseline understanding of the processes influencing the island’s valuable freshwater resources is all the more important.
Data availability statement
The datasets presented in this study can be found in online repositories. The names of the repository/repositories and accession number(s) can be found below: https://wateriso.utah.edu/waterisotopes/index.html Project_ID 00390.
Author contributions
JZ: Conceptualization, Data curation, Formal analysis, Funding acquisition, Investigation, Methodology, Project administration, Resources, Supervision, Validation, Visualization, Writing – original draft, Writing – review & editing. SP: Conceptualization, Funding acquisition, Investigation, Project administration, Resources, Supervision, Validation, Writing – review & editing. SL: Conceptualization, Data curation, Writing – review & editing. BW: Conceptualization, Data curation, Writing – review & editing.
Funding
The author(s) declare financial support was received for the research, authorship, and/or publication of this article. This project was supported by National Science Foundation grant 1903237, Alfred P. Sloan Research Fellowship to SP; National Science Foundation GRFP, Rackham Graduate School Merit Fellowship and University of Michigan Scott Turner Grant to JZ.
Acknowledgments
A huge thank you to Ricardo Anderson, Maria Marcano, Bruce Williams, and Shaun Lavis for collecting water samples during COVID-19, which made this research project possible. We thank Ashling Neary and Kyger C. Lohmann for isotope laboratory assistance at the University of Michigan.
Conflict of interest
The authors declare that the research was conducted in the absence of any commercial or financial relationships that could be construed as a potential conflict of interest.
Publisher’s note
All claims expressed in this article are solely those of the authors and do not necessarily represent those of their affiliated organizations, or those of the publisher, the editors and the reviewers. Any product that may be evaluated in this article, or claim that may be made by its manufacturer, is not guaranteed or endorsed by the publisher.
Supplementary material
The Supplementary Material for this article can be found online at: https://www.frontiersin.org/articles/10.3389/fmars.2024.1441113/full#supplementary-material
References
Andrews W. T., Laker D. S. (2001). A twelve-year history of large scale application of work-exchanger energy recovery technology. Desalination 138, 201–206. doi: 10.1016/S0011-9164(01)00265-X
Barlow P. M., Reichard E. G. (2010). Saltwater intrusion in coastal regions of North America. Hydrogeology J. 18, 247–260. doi: 10.1007/s10040-009-0514-3
Burnett W. C., Aggarwal P. K., Aureli A., Bokuniewicz H., Cable J. E., Charette M. A., et al. (2006). Quantifying submarine groundwater discharge in the coastal zone via multiple methods. Sci. total Environ. 367, 498–543. doi: 10.1016/j.scitotenv.2006.05.009
Colón-Rivera R. J., Feagin R. A., West J. B., López N. B., Benítez-Joubert R. J. (2014). Hydrological modification, saltwater intrusion, and tree water use of a Pterocarpus officinalis swamp in Puerto Rico. Estuarine Coast. Shelf Sci. 147, 156–167. doi: 10.1016/j.ecss.2014.06.012
Epstein S., Mayeda T. (1953). Variation of O18 content of waters from natural sources. Geochimica cosmochimica Acta 4, 213–224. doi: 10.1016/0016-7037(53)90051-9
Griffin A. J., Anderson Z., Ballard J., Bates N. R., Garley R., Johnson R., et al. (2022). Seasonal changes in seawater calcium and alkalinity in the Sargasso Sea and across the Bermuda carbonate platform. Mar. Chem. 238, 104064. doi: 10.1016/j.marchem.2021.104064
Ibánhez J. S. P., Álvarez-Salgado X. A., Nieto-Cid M., Rocha C. (2021). Fresh and saline submarine groundwater discharge in a large coastal inlet affected by seasonal upwelling. Limnology Oceanography 66, 2141–2158. doi: 10.1002/lno.11733
Klassen J., Allen D. M. (2017). Assessing the risk of saltwater intrusion in coastal aquifers. J. Hydrology 551, 730–745. doi: 10.1016/j.jhydrol.2017.02.044
McKenzie T., Dulai H., Fuleky P. (2021). Traditional and novel time-series approaches reveal submarine groundwater discharge dynamics under baseline and extreme event conditions. Sci. Rep. 11, 22570. doi: 10.1038/s41598-021-01920-0
Park C. H., Aral M. M. (2008). Saltwater intrusion hydrodynamics in a tidal aquifer. J. Hydrologic Eng. 13, 863–872. doi: 10.1061/(ASCE)1084-0699(2008)13:9(863)
Parra S. M., Valle-Levinson A., Mariño-Tapia I., Enriquez C., Candela J., Sheinbaum J. (2016). Seasonal variability of saltwater intrusion at a point-source submarine groundwater discharge. Limnology Oceanography 61, 1245–1258. doi: 10.1002/lno.10286
Povinec P. P., De Oliveira J., Braga E. D. S., Comanducci J. F., Gastaud J., Groening M., et al. (2008). Isotopic, trace element and nutrient characterization of coastal waters from Ubatuba inner shelf area, south-eastern Brazil. Estuarine Coast. Shelf Sci. 76, 522–542. doi: 10.1016/j.ecss.2007.07.041
Prinos S. T., Wacker M. A., Cunningham K. J., Fitterman D. V. (2014). Origins and delineation of saltwater intrusion in the Biscayne aquifer and changes in the distribution of saltwater in Miami-Dade County, Florida: U.S. Geological Survey Scientific Investigations Report 2014–5025, 101. doi: 10.3133/sir20145025
Rasmussen P., Sonnenborg T. O., Goncear G., Hinsby K. (2013). Assessing impacts of climate change, sea level rise, and drainage canals on saltwater intrusion to coastal aquifer. Hydrology Earth System Sci. 17, 421–443. doi: 10.5194/hess-17-421-2013
Rowe M. (1984). The freshwater “central lens” of Bermuda. J. Hydrology 73, 165–176. doi: 10.1016/0022-1694(84)90038-6
Rowe M. P. (2011). Rain water harvesting in Bermuda 1. JAWRA J. Am. Water Resour. Assoc. 47, 1219–1227. doi: 10.1111/jawr.2011.47.issue-6
Simmons J. K., Lyons W. B. (1994). The ground water flux of nitrogen and phosphorus to Bermuda’s coastal waters 1. JAWRA J. Am. Water Resour. Assoc. 30, 983–991. doi: 10.1111/j.1752-1688.1994.tb03346.x
Sims Z. C., Cohen A. L., Luu V. H., Wang X. T., Sigman D. M. (2020). Uptake of groundwater nitrogen by a near-shore coral reef community on Bermuda. Coral Reefs 39, 215–228. doi: 10.1007/s00338-019-01879-5
Smith M. E., Wynn J. G., Scharping R. J., Moore E. W., Garey J. R., Onac B. P. (2021). Source of saline groundwater on tidally influenced blue holes on San Salvador Island, Bahamas. Hydrogeology J. 29, 429–441. doi: 10.1007/s10040-020-02266-z
Taniguchi M., Dulai H., Burnett K. M., Santos I. R., Sugimoto R., Stieglitz T., et al. (2019). Submarine groundwater discharge: updates on its measurement techniques, geophysical drivers, magnitudes, and effects. Front. Environ. Sci. 7, 141. doi: 10.3389/fenvs.2019.00141
Vacher H. L. (1978). Hydrogeology of Bermuda—Significance of an across-the-island variation in permeability. J. Hydrology 39, 207–226. doi: 10.1016/0022-1694(78)90001-X
Vacher H. L., Ayers J. F. (1980). Hydrology of small oceanic islands—Utility of an estimate of recharge inferred from the chloride concentration of the freshwater lenses. J. Hydrology 45, 21–37. doi: 10.1016/0022-1694(80)90003-7
Vacher H. L., Rowe M. P. (1997). “Geology and hydrogeology of Bermuda.” in Geology and hydrogeology of carbonate islands, 54 Developments in sedimentology, eds. H. L. Vacher, and T. Quinn. (Amsterdam: Elsevier), 35–90.
Winkelstern I. Z., Rowe M. P., Lohmann K. C., Defliese W. F., Petersen S. V., Brewer A. W. (2017). Meltwater pulse recorded in Last Interglacial mollusk shells from Bermuda. Paleoceanography 32, 132–145. doi: 10.1002/2016PA003014
Zhang J. Z., Petersen S. V. (2023). Clumped and oxygen isotope sclerochronology methods tested in the bivalve Lucina pensylvanica. Chem. Geology 620, 121346. doi: 10.1016/j.chemgeo.2023.121346
Keywords: freshwater seawater interaction, isotope geochemistry, groundwater discharge, freshwater lens, coastal seawater
Citation: Zhang JZ, Petersen SV, Lavis S and Williams B (2024) Quantifying variations in δ18Ow and salinity in modern Bermudan waters on hourly to monthly timescales. Front. Mar. Sci. 11:1441113. doi: 10.3389/fmars.2024.1441113
Received: 30 May 2024; Accepted: 06 August 2024;
Published: 23 August 2024.
Edited by:
Meilin Wu, Chinese Academy of Sciences (CAS), ChinaCopyright © 2024 Zhang, Petersen, Lavis and Williams. This is an open-access article distributed under the terms of the Creative Commons Attribution License (CC BY). The use, distribution or reproduction in other forums is permitted, provided the original author(s) and the copyright owner(s) are credited and that the original publication in this journal is cited, in accordance with accepted academic practice. No use, distribution or reproduction is permitted which does not comply with these terms.
*Correspondence: Jade Z. Zhang, amFkZXp6QHVtaWNoLmVkdQ==; Sierra V. Petersen, c2llcnJhdnBAdW1pY2guZWR1