 Hayley R. Nessia
 Benn J. Hanns
 Tim R. Haggitt
 Nick T. Shears
95% of researchers rate our articles as excellent or good
Learn more about the work of our research integrity team to safeguard the quality of each article we publish.
Find out more
ORIGINAL RESEARCH article
Front. Mar. Sci. , 16 September 2024
Sec. Marine Conservation and Sustainability
Volume 11 - 2024 | https://doi.org/10.3389/fmars.2024.1440350
This article is part of the Research Topic Ocean Sustainability Science and Marine Protected Areas View all 5 articles
The value of no-take marine protected areas (MPAs) in providing fisheries-independent information to evaluate the status of adjacent fish stocks is increasingly being recognised. However, to ensure robust assessments of fisheries using this approach, MPAs need to be representative of the wider fished area and sampling should include multiple MPA and fished locations spanning the area of interest. The spiny lobster Jasus edwardsii fishery in Aotearoa New Zealand’s Hauraki Gulf has been in decline since the late 1990s, but latest stock estimates suggest a dramatic recovery following catch reductions in 2018. We compared J. edwardsii populations on shallow reefs (<20 m depth) in three marine reserves with six fished locations across the Hauraki Gulf to provide a fisheries-independent assessment of this important fishery and the degree of recovery following catch reductions. Region-wide surveys found that J. edwardsii populations within protected areas were dominated by large, legal-size individuals, whereas lobster in fished locations were mostly below or around legal-size. Total, vulnerable, and spawning stock biomass was 12-43 times higher within MPAs compared to fished locations. Overall, biomass at fished locations was <10% of that in reserves and there was little evidence of recovery following catch reductions. Our fisheries-independent data suggest that recent stock assessments have severely overestimated the recovery and state of lobster populations in the Hauraki Gulf and that populations on shallow reefs remain depleted. These findings highlight the critical need for fisheries-independent data and the value of MPA monitoring data in evaluating population status and recovery following fisheries management actions.
Accurate stock status estimates of a fished population are critical to managing sustainable harvest and the impacts on associated species and ecosystems (Hilborn et al., 2020). The traditional approach to fisheries management is to estimate the current and virgin (“B0”) stock size through a fisheries stock assessment, as a way of calculating the status of a stock relative to reference points based on these estimates (Hilborn, 2002; Caddy and Mahon, 1995). For example, in Aotearoa New Zealand, limit reference points are used to guide management actions. If a stock is estimated to be below 20% of virgin biomass, this requires a formal rebuilding plan to be implemented, whereas if a stock is estimated to be below 10%, fishery closure must be considered (Ministry For Primary Industries, 2008). Catch per Unit Effort (CPUE) data are easily obtained from fisheries data and are therefore widely used in stock assessments where it is assumed to be proportional to and therefore reflective of overall abundance in the population (Maunder and Punt, 2013; Winker et al., 2013). However, CPUE may not be reflective of actual abundance due to the influence of exogenous factors on catch rates such as target species biology, environmental conditions, fishing gear type and configuration, and fisher behaviour (Saul et al., 2020; Maunder et al., 2006). A heavy reliance on CPUE data in fisheries stock assessments can therefore lead to misrepresentation of stock status and poor stock management (Kleiven et al., 2022; Rose and Kulka, 1999; Maunder and Piner, 2015).
Fisheries-independent approaches to estimating population status can challenge and improve the accuracy of traditional stock assessments (Chen et al., 2003; Davies et al., 2011). Recently, the value of marine protected areas (MPAs) has been recognised in assessing fisheries status (Wilson et al., 2020; Hanns et al., 2022). Populations of exploited species within no-take MPAs can provide examples of unfished populations under current environmental conditions that can be compared with adjacent fished populations, provided that the MPA is of sufficient age and size to demonstrate recovery (Freeman et al., 2012; Kelly et al., 2000). This in turn allows for localised and fisheries-independent assessments of the status of fished populations. Such assessments also represent a necessary step towards ecosystem-based management (EBM) of stocks (Latour et al., 2003). It has been recognised that fished populations are governed not only by single-species processes, but also by their interactions with other species, habitats, and humans (Arkema et al., 2006; Curtin and Prellezo, 2010). It is thus necessary to include fisheries-independent data in management decisions as it is generally not possible to make ecological inferences using fishery-dependent data (Latour et al., 2003; Skern-Mauritzen et al., 2016). For example, reconstruction of the historical state of an ecosystem by Eddy et al. (2014) indicated that despite being well-managed and sustainable from a single-species perspective, the lobster fishery in Wellington, New Zealand had reduced lobster biomass enough to affect ecosystem functioning. Evidence has suggested that employing EBM strategies for fisheries not only improve yields of many species and reduces the ecological impacts of fishing (Townsend et al., 2019; Goulding et al., 2018; Kritzer et al., 2016), it may also lead to increased resilience to climate change (Holsman et al., 2020; Marzloff et al., 2016). There may also be economic benefits to fisheries, in the form of larger fish and lobsters, increased larval export, and increased catch (Costello, 2024).
The spiny lobster Jasus edwardsii is a commercially, recreationally and culturally significant species found throughout Aotearoa New Zealand and in southern Australia (Kelly and Macdiarmid, 2003). Within New Zealand, the fishery is managed through several quota management areas (QMAs), designated ‘CRA 1-10’ (Webber and Starr, 2020). The CRA 2 fishery is located in northeastern New Zealand, which includes the Hauraki Gulf, one of New Zealand’s most intensively used marine spaces (Aguirre et al., 2016). Declines in this fishery have been documented since the late 1990’s (Lascala-Gruenewald et al., 2021; Webber et al., 2018), prompting voluntary shelving of 49t of the Total Allowable Commercial Catch (TACC) in 2016-17 (Fisheries New Zealand, 2022). However, the 2017 stock assessment of CRA 2 estimated SSB to be at 19% of unfished biomass and below the soft limit of 20%, which required a formal rebuilding plan to be implemented (Webber et al., 2018). Consequently, the TACC was reduced from 200 t/year to 80 t/year (Fisheries New Zealand, 2022). Further restrictions were implemented in 2020 as part of a rebuilding plan with a halving of the recreational daily limit from six lobsters to three (Fisheries New Zealand, 2022). These changes have been followed by a large and almost instantaneous increase in CPUE (kg/potlift) in the fishery (Starr, 2022), which has been interpreted as a dramatic and rapid increase in the estimated status of the stock. The most recent stock assessment has estimated spawning stock biomass (SSB) at 40% of unfished levels (Rudd et al., 2023).
Long-term monitoring data from no-take MPAs across the range of J. edwardsii have generally shown large increases in size and abundance following protection (Davidson et al., 2002; Freeman et al., 2012; Young et al., 2016; Jack and Wing, 2010; Kelly et al., 2000; Edgar and Barrett, 1999). The recovery of J. edwardsii populations within MPAs has largely been examined from a conservation perspective, but increasingly the value and utility of MPA monitoring data in informing fisheries management has been recognised (Hanns et al., 2022; Díaz et al., 2016). In 2018/19, Hanns et al. (2022) conducted potting and dive surveys of lobster abundances within two no-take marine reserves and their adjacent fished areas in northeastern New Zealand. This work showed information collected in diver-based surveys can be used to estimate fishery status and highlighted the ability of these surveys to provide more detailed estimates of size structure compared to catch data from potting (i.e., greater representation of sublegal biomass). Using the MPA biomass as a proxy for unfished biomass, Hanns et al. (2022) estimated SSB to be at 3% of the unfished biomass, a substantially lower estimate of stock status than that reported for the wider fishery at the time. However, due to the limited spatial extent of their study, it was unclear whether the low population status reflected localised depletion in the study area or whether the findings were representative of the wider fishery.
This study aims to determine the status of J. edwardsii across the Hauraki Gulf region and provide a fisheries-independent assessment of population changes following catch reductions in 2018. Given the recent increase in lobster biomass reported in the fishery based on the latest stock assessment (Rudd et al., 2023), we use marine reserves to carry out a fisheries-independent assessment of the current status of populations across the wider Hauraki Gulf, northeastern New Zealand, and also investigate the effect of the 2018 TACC reduction on lobster populations in the Hauraki Gulf. To investigate the wider status of J. edwardsii populations across the Hauraki Gulf, we undertook dive surveys in 2021 and 2022 within and adjacent to three MPAs and at seven fished locations across the region (Figure 1). This updates and expands the findings of Hanns et al. (2022) by sampling an additional marine reserve and covering a wider range of fished locations to provide a broader picture of the current state of the lobster population in the Hauraki Gulf. To assess the degree of recovery in lobster populations following the TACC restriction in 2018, we also compare monitoring data from within and adjacent to three marine reserves from 2014-2023. Combined, these components further demonstrate the utility of using MPA monitoring data to provide a fishery-independent approach to assessing population status and evaluating the outcomes of fisheries management actions.

Figure 1. Survey sites and locations across the Hauraki Gulf Marine Park (light blue shaded area) and 905 and 906 statistical areas (boundaries depicted by red lines), northeastern Aotearoa New Zealand. No-take marine reserves (shown as pink shaded areas) include CROP (Cape Rodney-Okakari Point Marine Reserve), TAWH (Tāwharanui Marine Reserve), and HAH (Te Whanganui-o-Hei/Cathedral Cove Marine Reserve). Fished locations include MOK (The Mokohinau Islands), GBI (Aotea/Great Barrier Island), LBI (Hauturu/Little Barrier Island), LEIGH (coastal Leigh), KAW (Kawau Island), MER (Mercury Islands), WHIT (Whitianga, sites adjacent to HAH).
The Hauraki Gulf is a large embayment on the northeastern mainland of New Zealand, enclosed to the west, south and east and open to the Pacific Ocean in the north. It is heavily used by a multitude of stakeholders, containing an international port and naval base, as well as productive fishing grounds, marine reserves, and areas used for commercial activities such as aquaculture (Aguirre et al., 2016). Annual sea temperatures typically range from 14-21°C, with relatively constant salinity, and oceanic upwelling zones generated by north-westerly winds in the outer Gulf (Aguirre et al., 2016).
Jasus edwardsii is present on rocky reefs throughout the Gulf, undertaking seasonal movements onto deeper sandflats associated with feeding, reproduction, and moulting cycles (Kelly, 2001). Commercial fishing is carried out with pots, and within the Hauraki Gulf is mainly confined to reefs in the outer Gulf and at the offshore islands (Fisheries New Zealand, 2022; Supplementary Figure S1). The CRA 2 fishery is divided into four statistical areas (905-908) for reporting purposes, with statistical areas 905 and 906 falling within the bounds of the Hauraki Gulf Marine Park (Figure 1). Approximately half of the annual commercial catch in CRA2 comes from the 905 and 906 statistical areas (Starr, 2022). Jasus edwardsii harvested within New Zealand have a minimum legal size (MLS) of 60 mm tail width for female lobster, and 54 mm tail width for male lobsters, or 95 mm carapace length (CL) for both sexes (Hanns et al., 2022).
Locations within this study were either ‘reserve’ (no-take marine reserves) or ‘fished (Figure 1). Reserve locations include Cape Rodney-Okakari Point (CROP), Tāwharanui (TAWH), and Te Whanganui o Hei (HAH). Fished locations include the Mokohinau Islands (MOK), Little Barrier Island (LBI), Great Barrier Island (GBI), Leigh/Kawau Island (LEIGH/KAW), the Mercury Islands (MER), and Whitianga (WHIT).
Lobster populations across reserve and fished locations were surveyed using the underwater visual census methods developed in Macdiarmid (1991) and refined in Kelly et al. (2000). This surveying methodology employed 50 x 10 m transects (sampling 500 m2 of reef per transect) haphazardly placed across rocky reef habitat. Dive surveys were carried out over 2021 and 2022 during autumn-winter to coincide with J. edwardsii mating, thus minimising the influence of seasonal movements on inshore abundances (Kelly and Macdiarmid, 2003; Macdiarmid, 1991). During this period male and female lobster are concentrated on shallow reefs less than 20m deep (Macdiarmid, 1991; Kelly and Macdiarmid, 2003). While this may result in seasonally elevated densities on shallow reefs, this effect is assumed to be constant between reserve and fished areas, and therefore a good indicator of overall population status. Size and sex of lobsters within each transect were determined by visual estimation and direct measurement. Where possible, the sex and carapace length (to the nearest 5 mm) of all lobster observed along each transect were visually estimated without handling or capturing individual lobster (see CL measurement methods in Hanns et al., 2022). The sex of each lobster was determined using sexually dimorphic features such as the 5th periopod and pleopod anatomy (Macdiarmid, 1991).
In each location, transects were carried out to estimate the biomass and density of lobster across shallow rocky reef habitat from 0-20 m depth. For the three marine reserves and adjacent fished areas, long term monitoring of lobster involves sampling 3-5 transects shallow (0-10 m) and deep (10-20 m) sites inside and outside each reserve (Lascala-Gruenewald et al., 2021). Across the additional locations (LBI: 4 sites, GBI: 9 sites, MOK: 9 sites, and MER: 7 sites), transects were sampled across the 0-20 m depth range at each site. At each site we aimed to carry out five transects across the depth gradient but at some sites this was limited by the availability of suitable reef habitat.
All modelling was performed in R (v 4.2.2, R Core Team, 2022) using the brms package (Bürkner, 2017), which uses Bayesian inference with Markov chain Monte Carlo (MCMC) sampling using a Hamiltonian Monte Carlo algorithm implemented in Stan (Carpenter et al., 2017). For the following analyses, default non-informative priors were used with four MCMC chains with a thinning parameter of 1 and the default max tree depth of 10 for 2000 iterations, with the first 1000 iterations discarded as burn-ins for a total of 4000 posterior samples.
Analyses were undertaken on density (individuals per transect) and biomass (total weight per transect, kg/500 m2) data. Biomass data were generated by converting individual CL’s to estimates of weight (kg) using the sex-specific power curves developed in Hanns et al. (2022). Both data types were analysed as three different metrics. Density was analysed as total (all lobster observed), legal (all lobster above the MLS, CL ≥ 95 mm), and sublegal (all lobster below the MLS, CL < 95 mm). Biomass was analysed as total (biomass of all lobster observed), vulnerable (biomass of all legal-sized lobster), and spawning stock biomass (SSB; biomass of all reproductively mature female lobster). The length of maturation in northeastern New Zealand female J. edwardsii is defined in Macdiarmid (1989) as CL ≥ 87.5 mm.
Lobster density and biomass were compared between reserve and fished areas across two CRA2 statistical areas (905 and 906) using the hurdle mixed-effect model with a gamma distribution. Model design specified below (in brms syntax):
Here, ‘Stat Area’ refers to statistical area (905 and 906) and was modelled as an interaction with protection ‘Status’ (reserve and fished), while ‘Site’ (all sites surveyed within each location) was set as a population (random) effect. To account for difference in the likelihood of density or biomass equalling zeros between reserve and fished locations the hurdle, hu, component (i.e., likelihood of zero) was modelled as a function of the predicator ‘Status’.
To examine variation of lobster density and biomass across the Hauraki Gulf, differences in lobster densities and biomass between the surveyed fished locations were tested using a hurdle mixed-effect model with a gamma distribution. Model design specified below (in brms syntax):
Here, ‘Location’ refers to all fished locations surveyed and was modelled as a fixed effect and ‘Site’ (all sites surveyed within each location) was set as a population (random) effect. As the likelihood of density or biomass equalling zero was expected to vary between locations, the hu component was modelled as a function of ‘Location’.
An assessment of the status of the sampled fished population was derived from ratios between fished and reserve areas, using reserve area data as an unfished denominator or reference (B0, see Hanns et al., 2022). Ratios were determined from the model coefficients for the ‘Status’ fixed effect tested in Model 1 for 905 and 906, and the combined estimates of both statistical areas (Overall). Ratios were expressed as percentages determined from posterior conditional mean estimates, with upper and lower 95% credible intervals (CI95%). Percentage estimates were plotted in relation to the soft limit (10% of SSB0) and hard limit (20% of SSB0) performance measure points used in New Zealand fishery stock assessments (Rudd et al., 2021). When a stock assessment estimates a 50% or higher probability that SSB is below 20% of SSB0, the soft limit is breached, and a time-constrained rebuilding plan is implemented (i.e., reduced TACC). Similarly, when stock assessment estimates a 50% or higher probability SSB is below 10% of SSB0, the hard limit is breached, and fishery closure is considered (Ministry For Primary Industries, 2008). Probabilities were calculated using mean 95% credible intervals. In this study, the methods presented in Hanns et al. (2022) have been further developed to be more robust to asymmetric credible intervals and provide mean, conservative, and extreme estimates of stock status based on reserve reference levels. Formulae as follows:
Here, the x% is the estimated stock status based on the mean reserve estimate (Mean), the lower bounds of the reserve estimate’s credible interval (Conservative) and upper bounds of the reserve estimate’s credible interval (Extreme).
Monitoring of spiny lobster inside and outside the three marine reserves in the Hauraki Gulf has been carried out since 1995 for CROP, 1996 for HAH and 2009 for TAWH (Lascala-Gruenewald et al., 2021). To investigate the degree of recovery of lobster populations following the TACC reduction in 2018, marine reserve monitoring data were analysed from two survey years prior to the TACC reduction (CROP and TAWH 2016 and 2018, HAH 2015 and 2017), and all surveys following the reduction (2019-2023). Though the TACC reduction officially came into effect on 1 April, 2018, the main fishing season does not begin until July (Ministry for Primary Industries, 2024). For CROP and TAWH the 2018 survey therefore represents population levels prior to the TACC reduction. Changes in the densities of legal and sublegal lobster over this period were assessed using Generalised Linear Mixed Models. These GLMMs were run with the ‘brms’ package (Bürkner, 2017) using the ‘zero inflated negative binomial’ family, with a thinning parameter of 1 and max tree depth of 12 for 4000 iterations for a total of 8000 posterior samples Modelling was undertaken separately for each location (inside and outside CROP, TAWH and HAH) and for densities of sublegal and legal lobster. All GLMMSs were performed using informative priors based on the known effect of status on sublegal and legal lobster densities (see Supplementary Table S1 for informative priors). These analyses and associated time series extend upon the temporal trends reported in Lascala-Gruenewald et al. (2021). Model design specified below (in brms syntax):
Where ‘Density’ is the count of sublegal or legal-sized lobster on each transect, ‘Year’ is represented as continuous variable and includes the two survey years prior to the TACC reduction and all subsequent survey for each region, ‘Status’ refers to either ‘Reserve’ or ‘Fished’ sites, and ‘Site’ as a random variable. Post hoc analyses of the effects of ‘Year’ across the levels of ‘Status’ were undertaken using the ‘emmeans::emtrends’ function.
The total number of lobster observed within the three marine reserve locations (sites = 17, transects = 75, n = 780) was dramatically higher than that observed across all six fished locations (sites = 59, transects = 163, n = 235) despite differences in sampling effort (Figure 2). Of the lobster observed in the marine reserves, 63% were of legal size, while only 39% observed across fished locations were of legal size, with 32 lobster unable to be measured. Between reserve locations, observed densities across all three metrics appeared highest at HAH, while no clear differences were evident amongst the fished locations. In general, female lobster were proportionally more prevalent within reserve areas (37%) than in fished areas (24% respectively), and size distributions within reserves were much larger than fished areas (Figure 3).
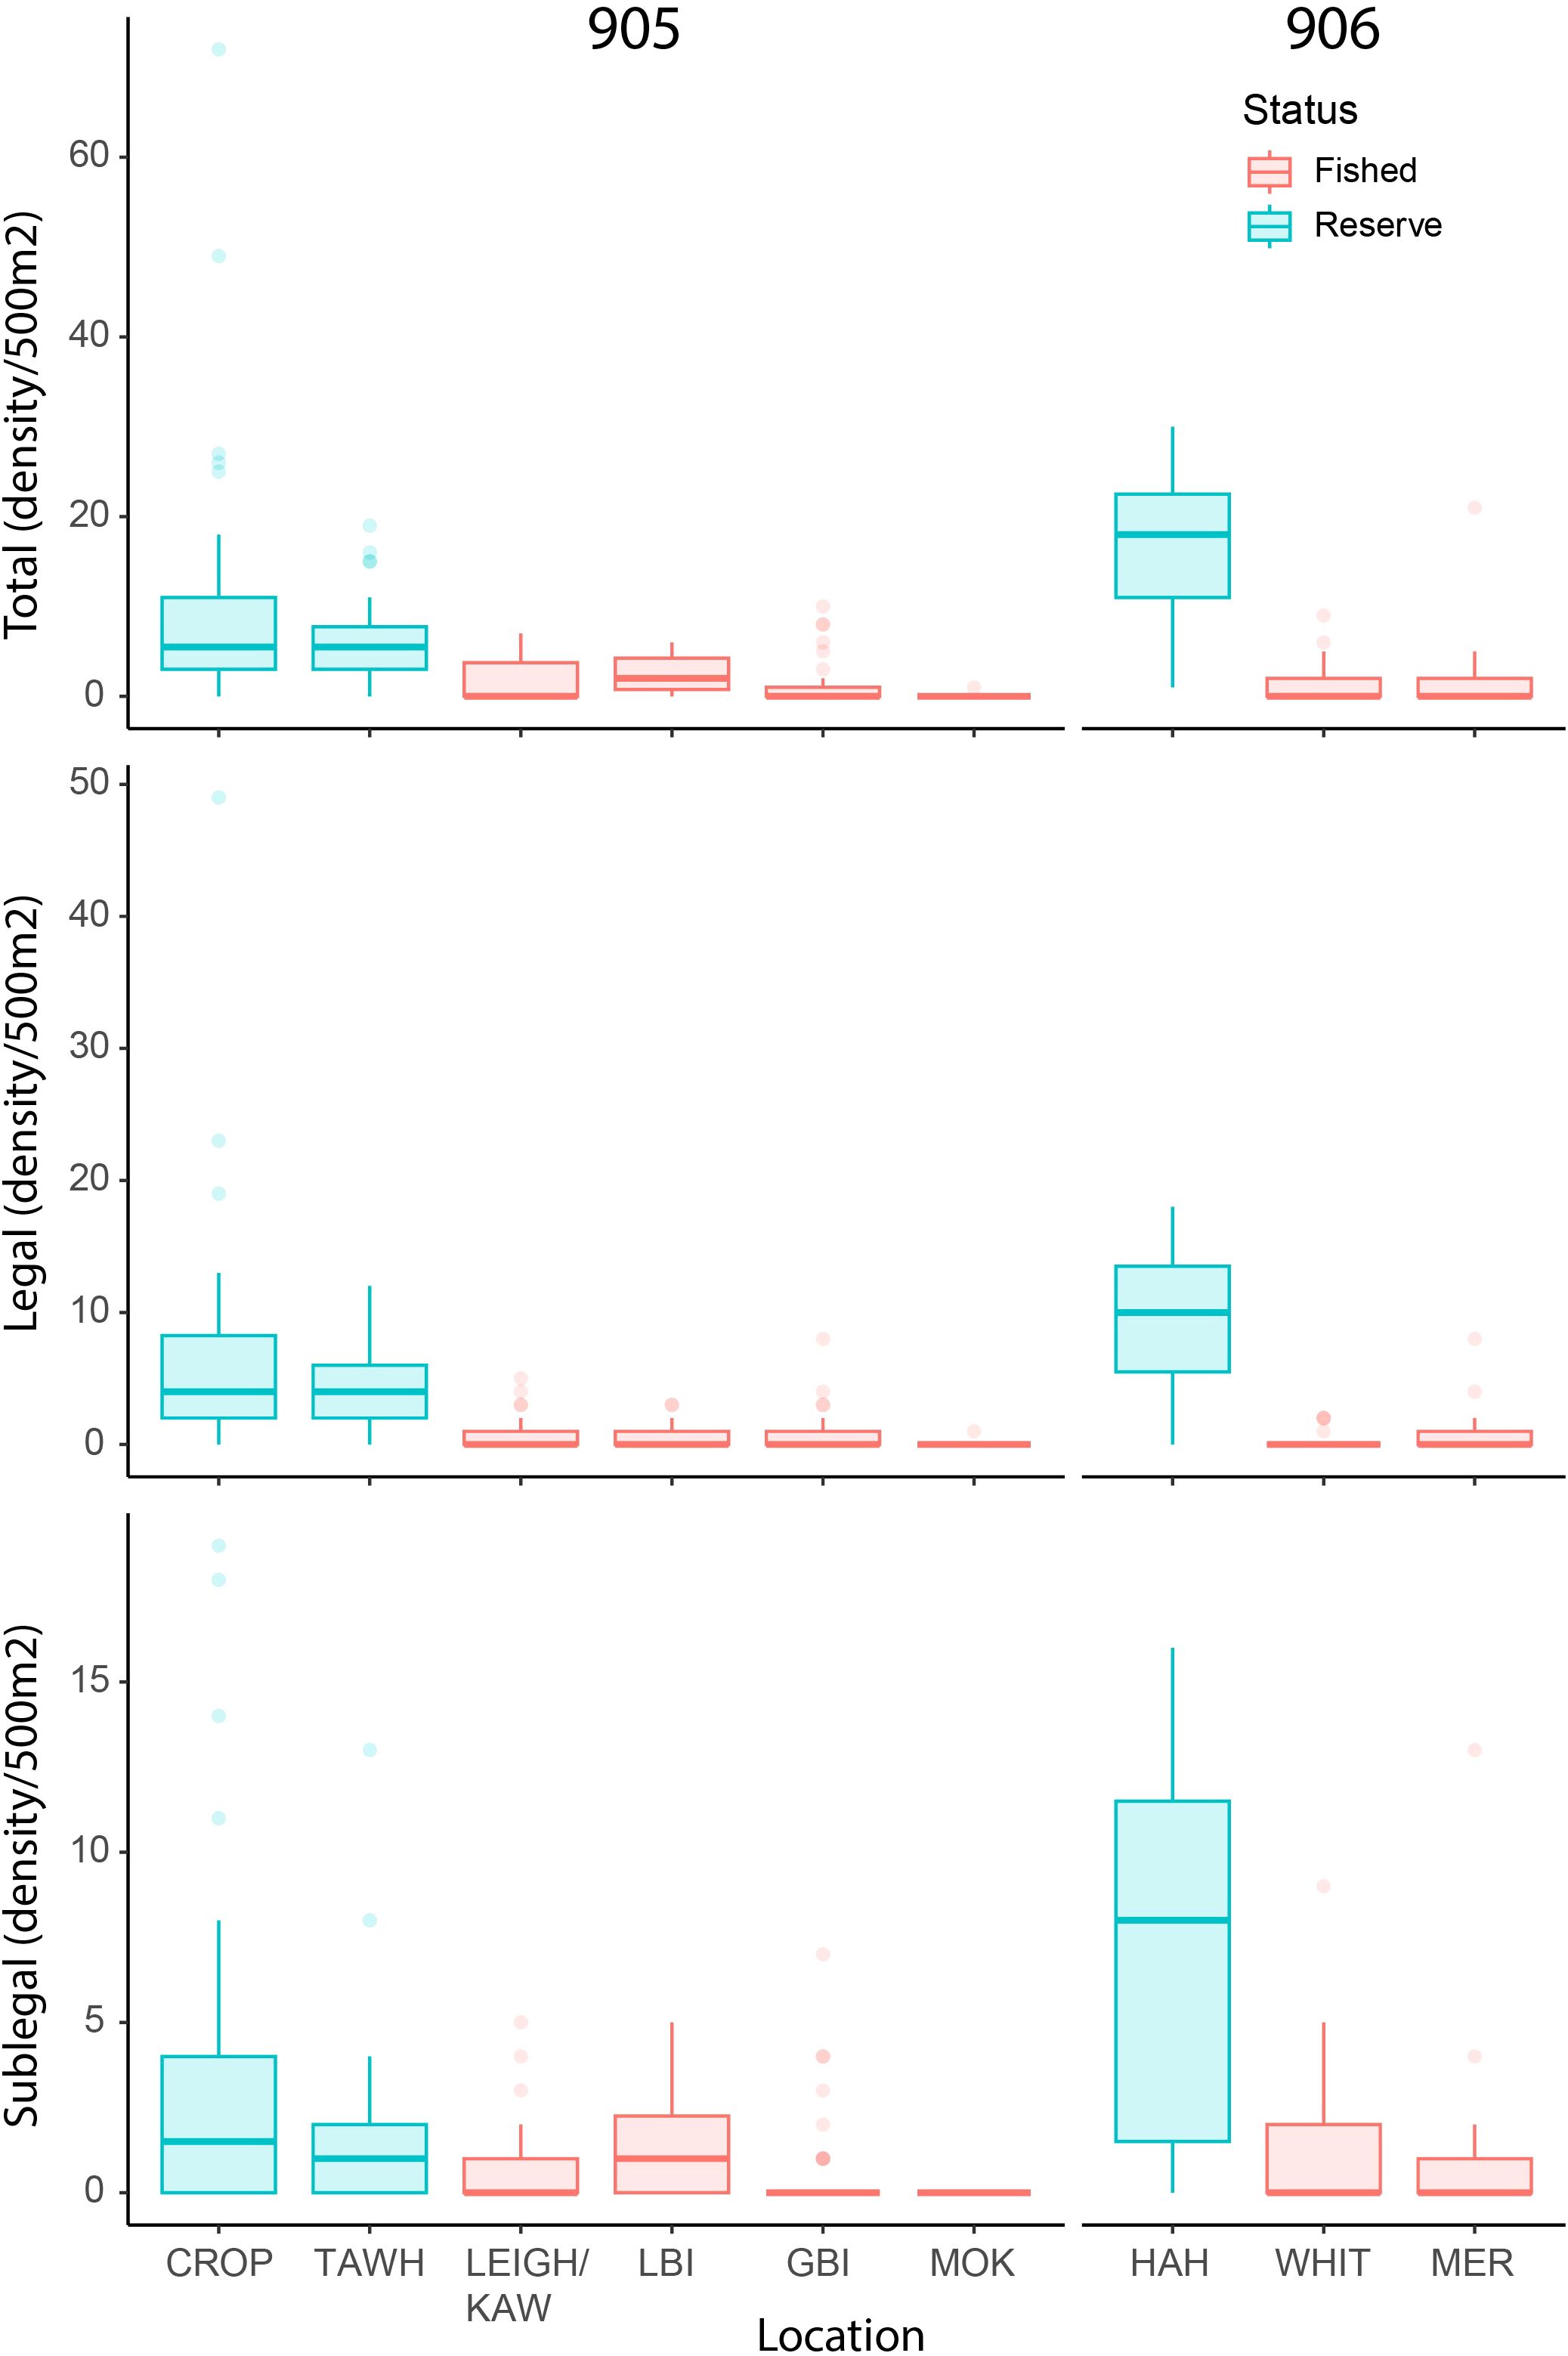
Figure 2. Observed density of total, legal (≥ 95mm carapace length; CL), and sublegal-sized (<95mm CL) lobsters. Reserve locations: Cape Rodney-Okakari Point (CROP), Tāwharanui (TAWH), and Te Whanganui-o-Hei (HAH). Fished locations: Leigh and Kawau Island (LEIGH/KAW), Little Barrier Island (LBI), Great Barrier Island (GBI), The Mokohinau Islands (MOK), Whitianga (WHIT), and the Mercury Islands (MER).
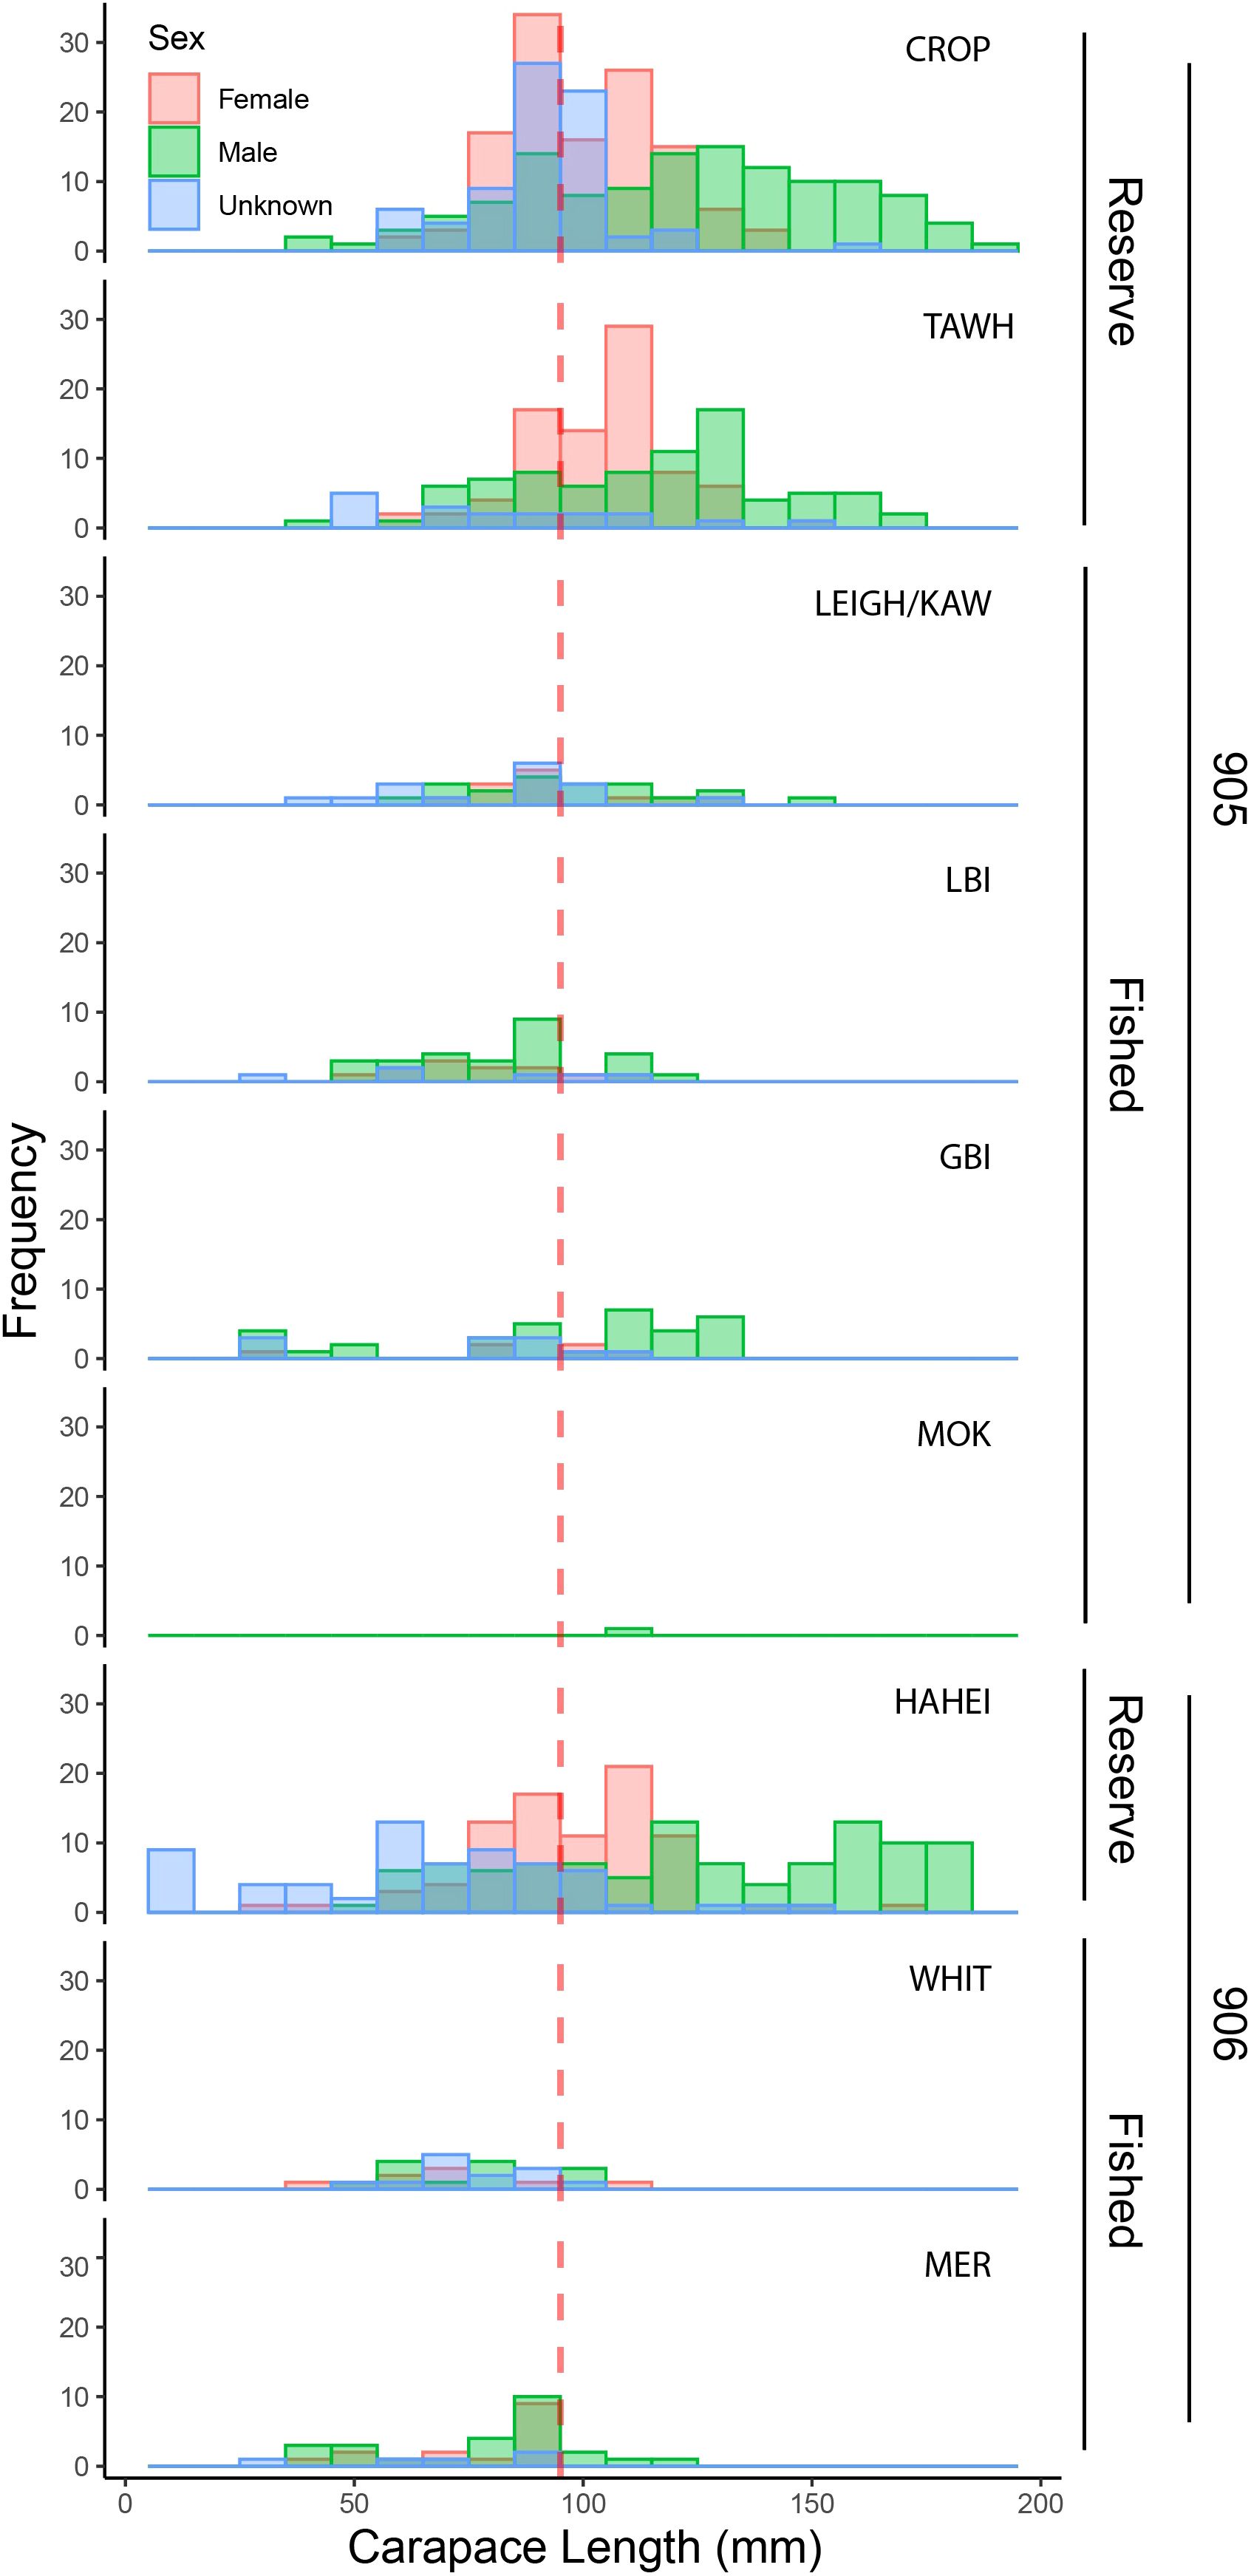
Figure 3. Size distribution of Jasus edwardsii (Female, Male, Unknown) at fished and reserve locations across the 905 and 906 stat areas. All data displayed in 10 mm bins. Red dashed line = minimum size limit (95 mm carapace length). Reserve locations: Cape Rodney-Okakari Point (CROP), Tāwharanui (TAWH), and Te Whanganui-o-Hei (HAH). Fished locations: Leigh and Kawau Island (LEIGH/KAW), Little Barrier Island (LBI), Great Barrier Island (GBI), The Mokohinau Islands (MOK), Whitianga (WHIT), and the Mercury Islands (MER).
Modelled conditional estimates indicated higher densities and biomass in reserve areas compared to fished areas across all density metrics (Figure 4A) and biomass metrics (Figure 4B). For density and biomass analyses, coefficients for the likelihood of catches equalling 0 (hu) also showed much higher likelihoods for fished areas than reserve areas (Supplementary Tables S2, S3). Conditional estimates of density and biomass across all metrics appeared higher in the 906 reserve (i.e., HAH). Although model coefficients only indicated significant interactions between status and statistical areas for mu (likelihood of non-zero parts of the model varying) for total and vulnerable biomass, pairwise comparisons of posterior highest density intervals (HDI) suggested significantly higher legal densities as well as significantly higher total and vulnerable biomass’ in the 906 reserve. Across all metrics of density and biomass, pairwise comparisons indicated no differences in fished areas between statistical areas (total density ~1.2 individuals/500m2, total biomass ~0.5 kg/500m2). Legal densities in reserves within 905 were ~9.3 times higher than 905 fished areas, and ~18.5 times higher in the 906 reserve location compared to the 906 fished locations. Estimates of total biomass were 12.9 times higher in 905 reserve areas and 42.5 times higher in the 906 reserve areas.
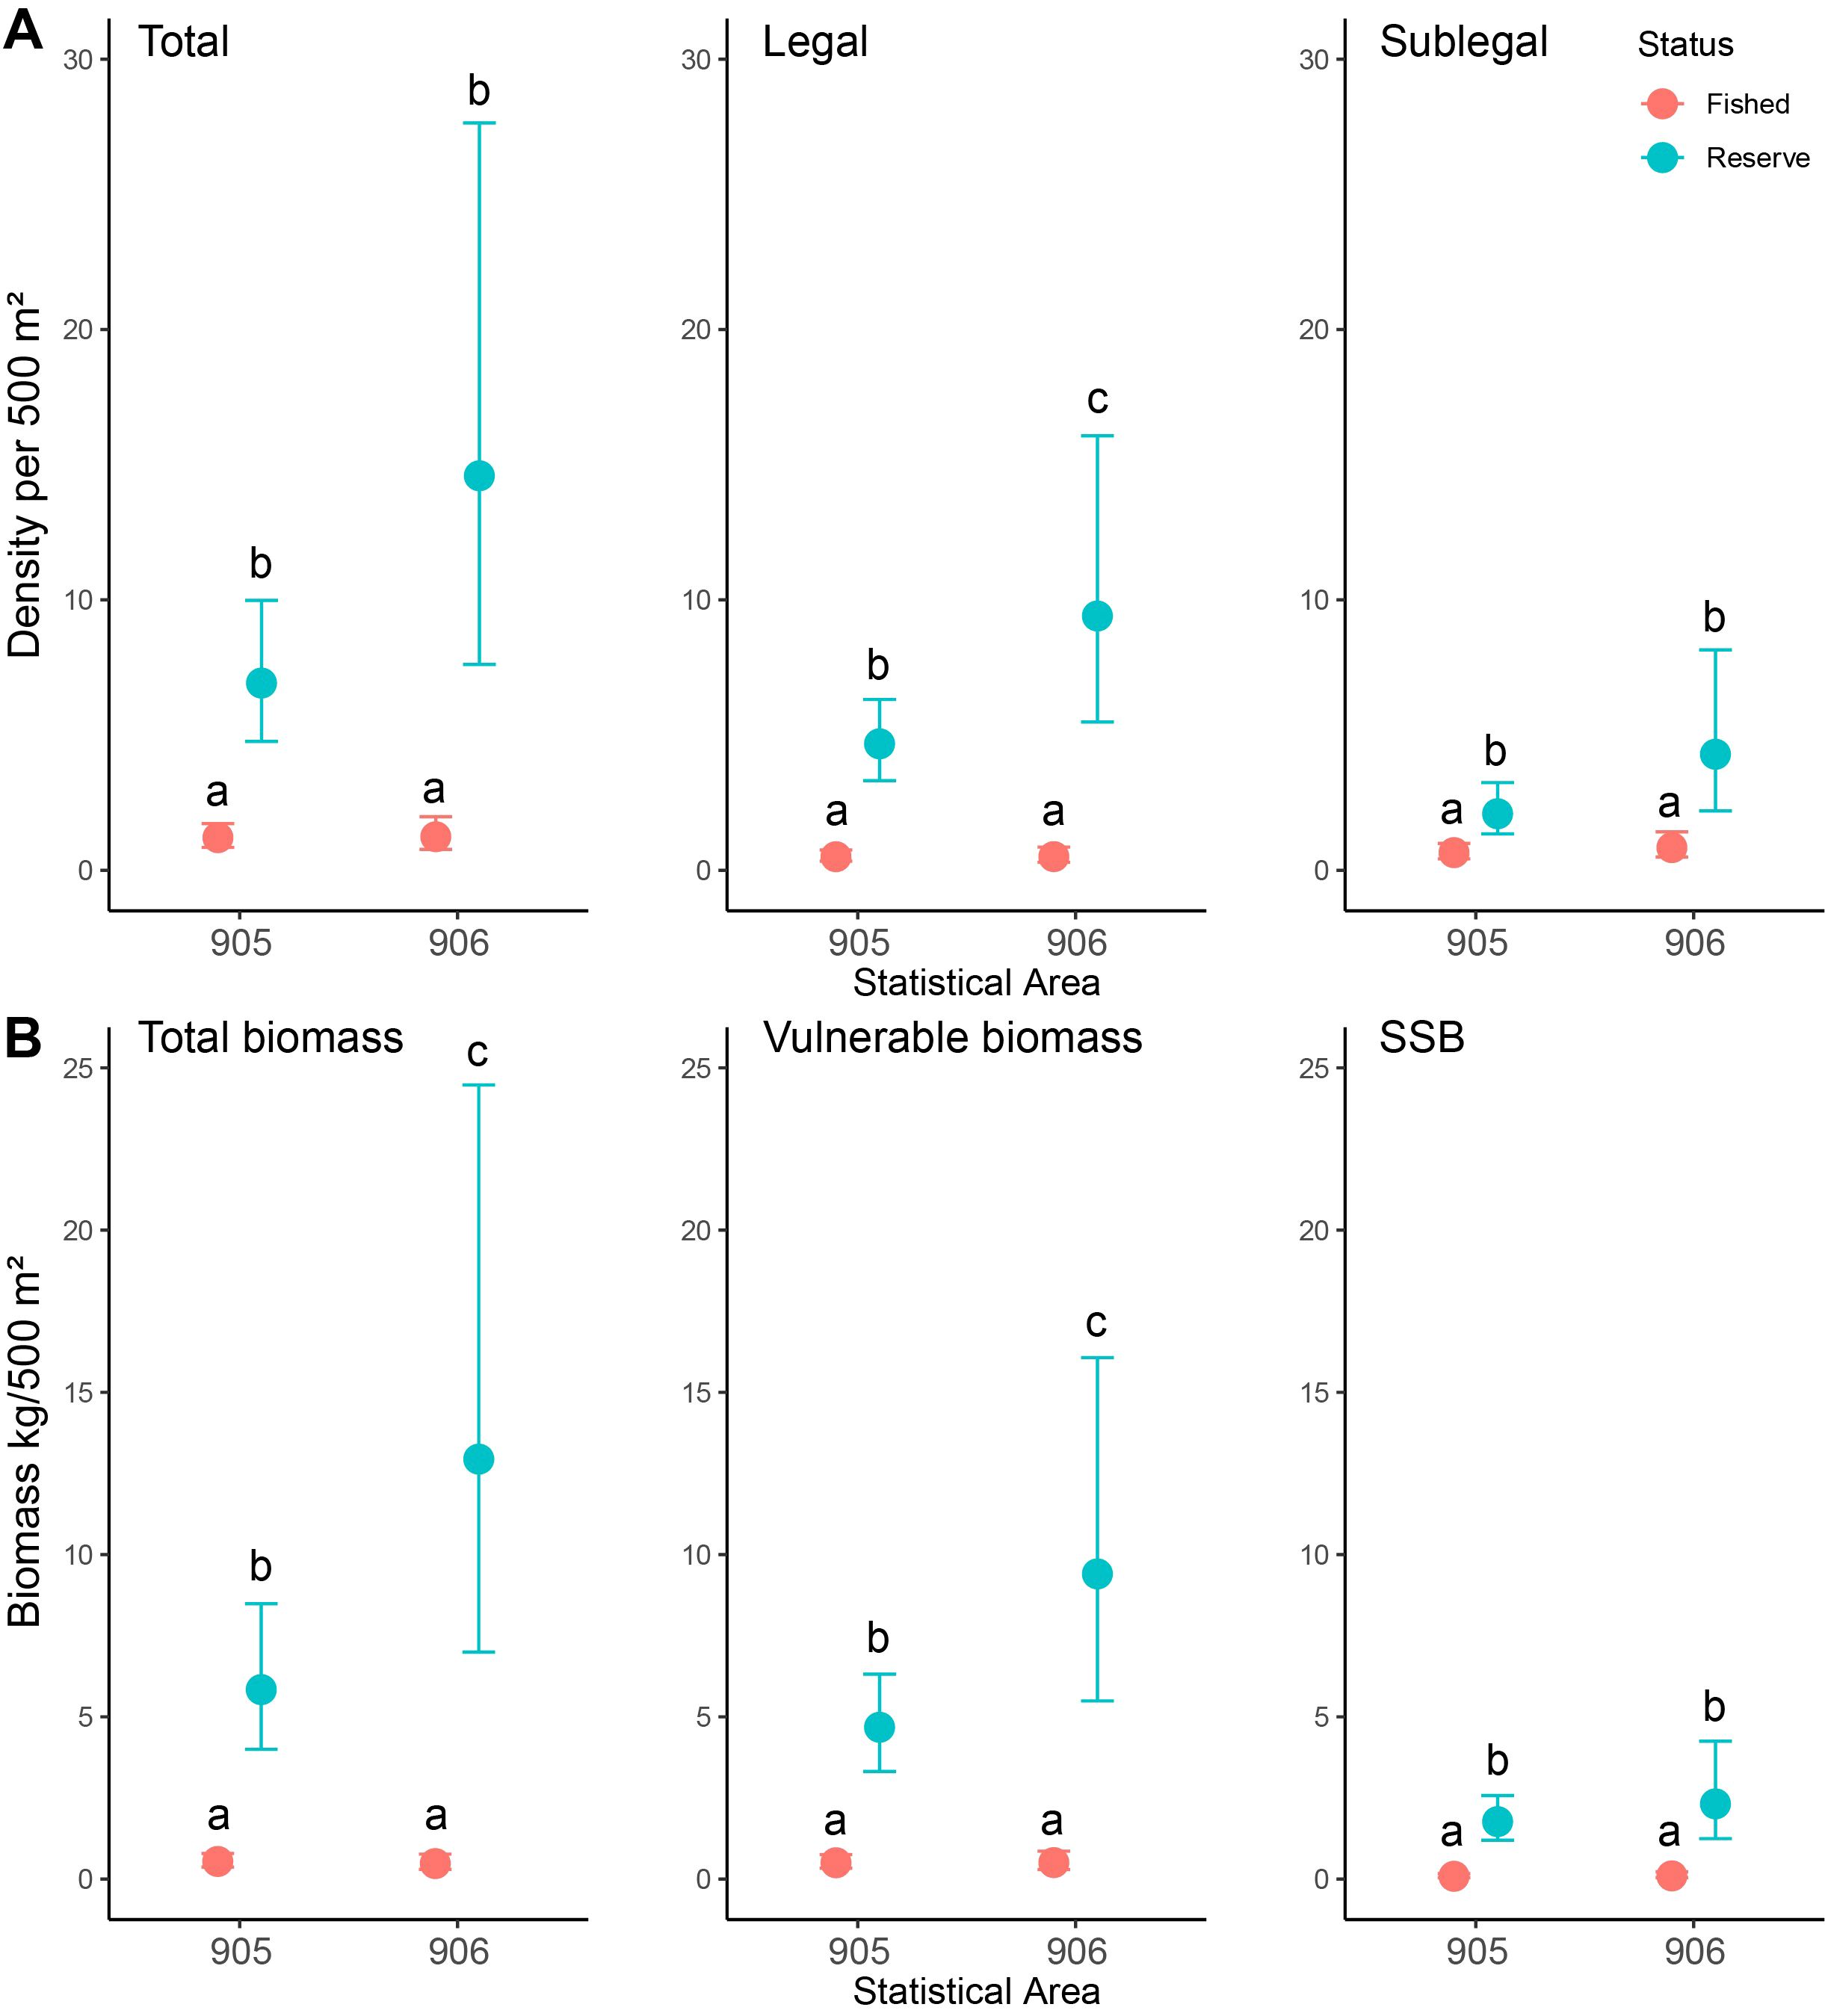
Figure 4. Predicted conditional means and 95% credible intervals for density (A) and biomass (B) metrics of J. edwardsii for fished and reserve locations in statistical reporting areas (905 and 906). Pairwise comparison groups based on assessment of posterior highest density intervals indicated by letters. (A) Density of total, legal (≥95mm carapace length; CL), and sublegal (<95mm CL) lobster. (B) Biomass of total, vulnerable (≥95 mm CL), and spawning stock (SSB; ≥87.5 mm CL).
Estimates of density and biomass were similar across all locations, except for the Mokohinau Islands (MOK) where only a solitary legal-sized male lobster was observed (Supplementary Figures S2, S3; Supplementary Tables S4, S5). Despite the low number of lobster at the Mokohinau Islands, pairwise comparisons found no differences between locations for the total and legal/vulnerable density and biomass metrics across and between both statistical areas, highlighting the high frequency of zeros (no lobster observed per 500 m2 transect) across all locations. The Mokohinau Islands were excluded from sublegal or SSB analyses as no non-zero data were available. Excluding the Mokohinau Islands, these analyses also found no differences between locations within and between the 905 and 906 statistical areas.
Using estimates of biomass from reserve areas as proxy estimates of unfished levels (B0), analyses found a 95% probability SSB is below 10% of SSB0 for 905, 906 and overall, and a 60-95% probability that all other metrics across 905, 906, and overall are below the 10% threshold (Figure 5). Across all measures, including our most conservative estimates (using upper reserve CI bounds as B0), there was a 95% probability all metrics were below 20% of unfished levels. In addition, our highest estimate relative to unfished levels (conservative 905 total biomass 14% of reserve biomass, with CI between 9.1% and 19.7%) still indicated an ~8% probability of being below the 10% threshold.
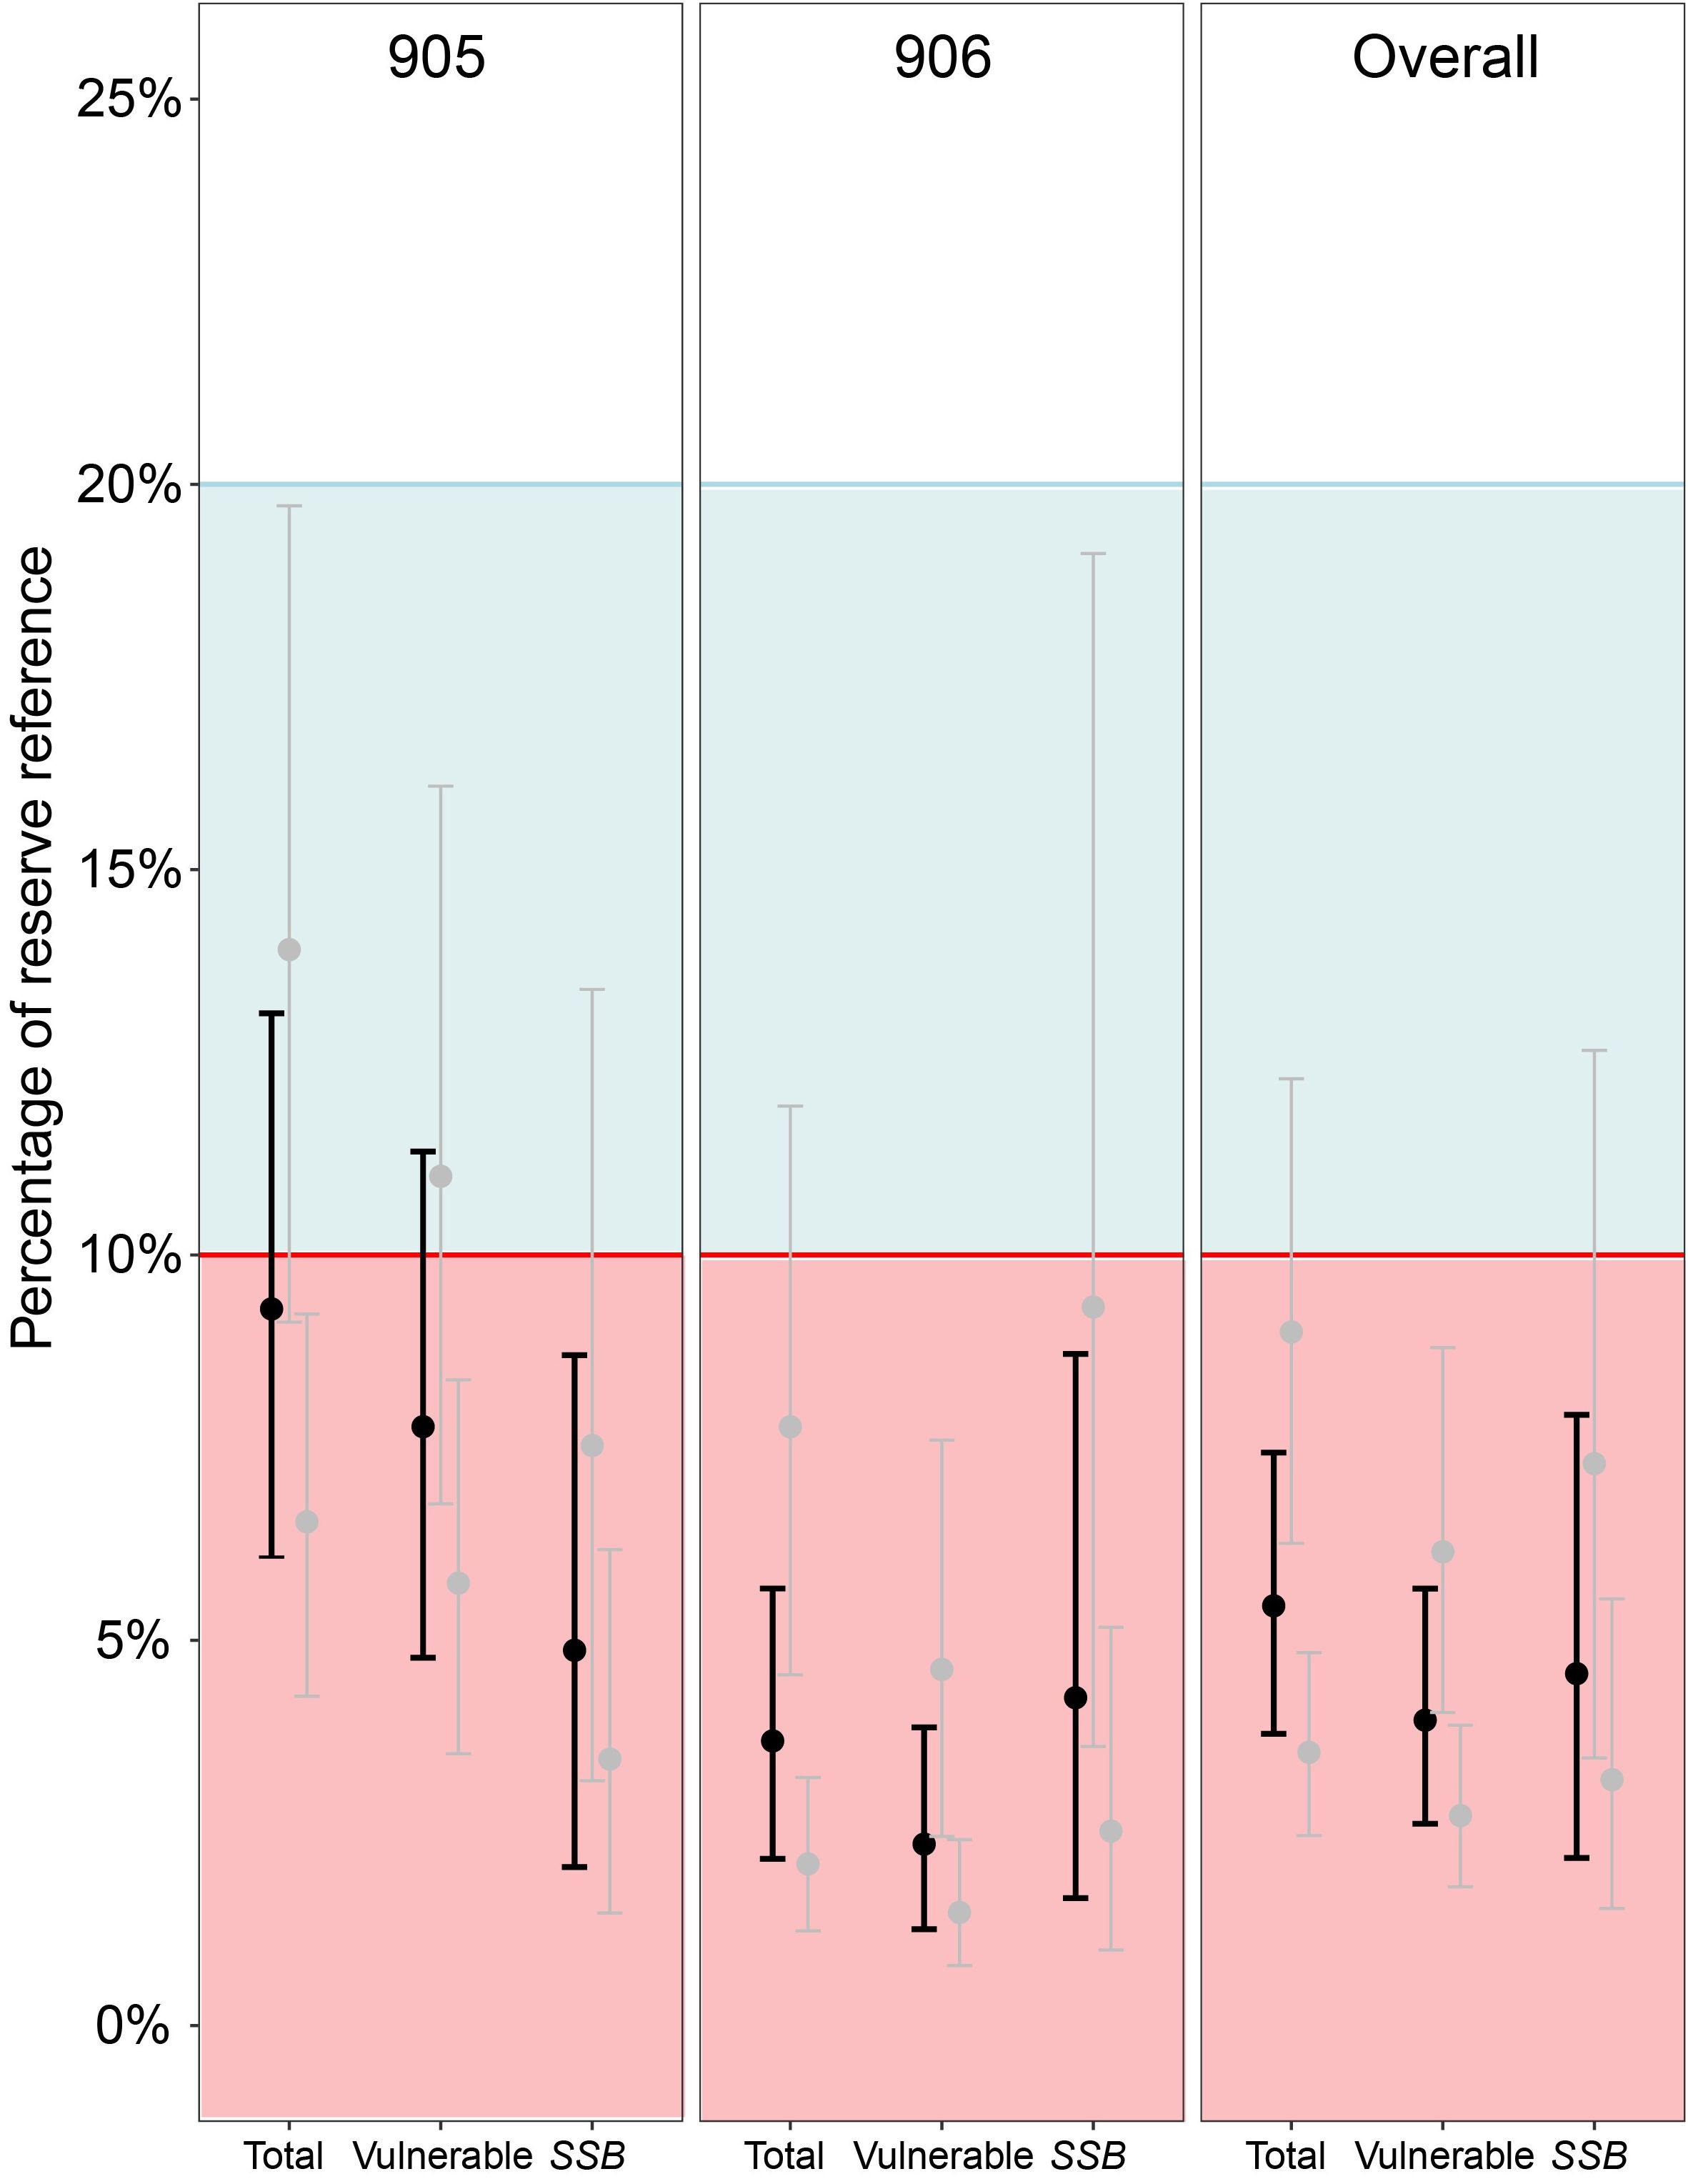
Figure 5. Estimates of the state of lobster populations on shallow reefs in statistical areas 905 and 906, and overall for this region (i.e. combined 905 and 906). Estimates calculated for total, vulnerable (≥95 mm carapace length; CL), and spawning stock (mature females; ≥87.5 mm CL, see Macdiarmid, 1989) biomass in fished areas relative to marine reserve biomass, which is used as a proxy for an unfished population. Mean modelled estimates displayed as bold black, conservative and extreme modelled estimates displayed as grey. Block colours represent the fisheries soft limit (blue, 20% of unfished levels) and hard limit (red, 10% of unfished levels).
Between 2009 and 2015/2016 densities of legal-sized lobster across the surveyed MPAs indicated decreasing trajectories, with reductions greater within the TAWH and HAH MPAs compared to CROP (Figure 6). Over this period, densities of legal lobster in the fished areas adjacent to these MPAs were extremely low (<1 legal lobster per 500 m2) and varied little. Analyses of changes in densities between 2016 and 2023 indicated no effect of year (i.e., no change) in legal densities within and outside of CROP and TAWH but found credible evidence of a positive effect of year on legal densities (i.e., increase in density) between 2015 and 2023 within and outside of HAH (Supplementary Table S6). However, these analyses also indicated credible evidence that the effect of year interacted with Status for all MPA locations. Post-hoc analyses of these interactions found credible evidence densities of legal lobster increased within and outside of HAH but no evidence of change within and outside of CROP and TAWH (Supplementary Table S8). Rates of increases in legal lobster associated with HAH differed between reserve and fished areas. Densities of legal lobster within HAH were estimated to have increased by 0.54 lobster per year, but only 0.05 legal lobster per year outside of HAH. Densities of sublegal lobster showed general declines between 2009 and 2014 within the CROP and TAWH marine reserves and between 2009 and 2017 within HAH. Analyses of densities from 2015/16 to 2023 (Supplementary Table S7) found credible evidence of increases in sublegal lobster within and outside of HAH, but no effects of year for sublegal lobster within and outside CROP and TAWH. Although not significant, patterns in the arithmetic means of sublegal densities in the fished areas adjacent to CROP and TAWH showed a small increase between 2016 and 2019, after which densities declined back to 2016 levels. Similar arithmetic patterns were apparent in the fished areas adjacent to HAH but increased again between 2022 and 2023.
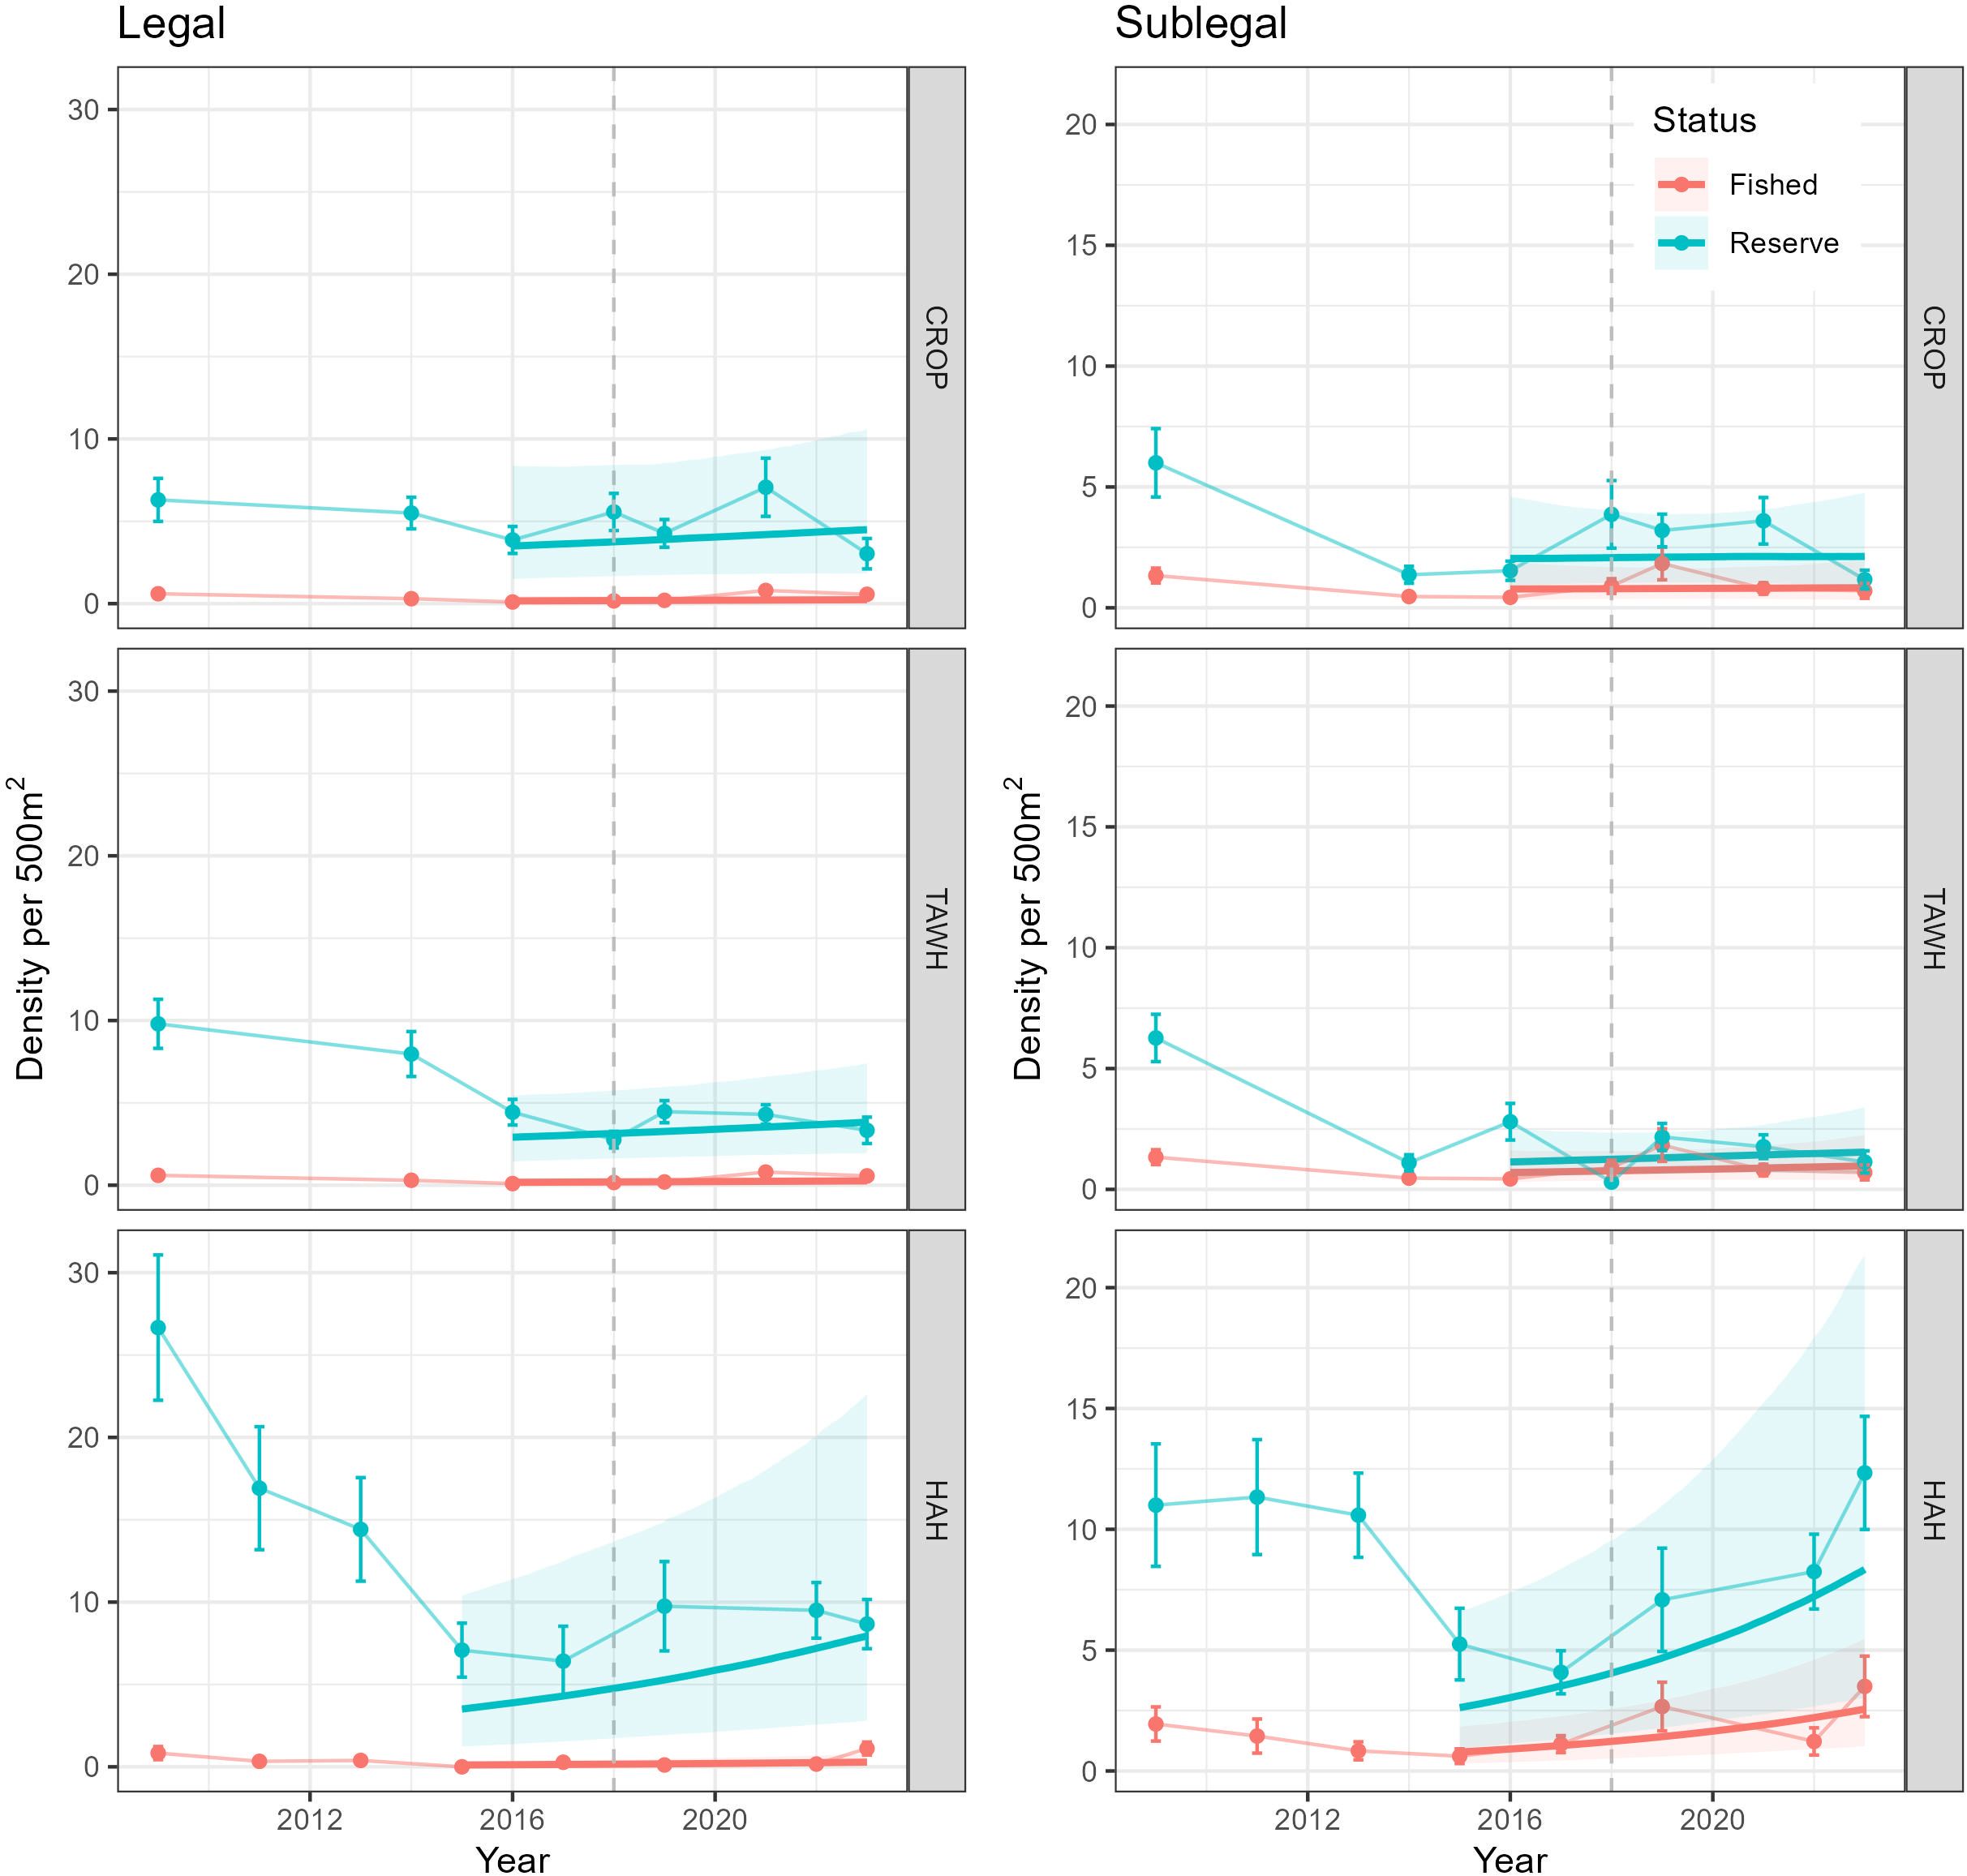
Figure 6. Density of legal (≥ 95 mm carapace length; CL) and sublegal (<95 mm CL) lobster since 2009 in and adjacent to Leigh (CROP), Tāwharanui (TAWH) and Te Whanganui-o-Hei (HAH) marine reserves. The dashed vertical line indicates the 2018 TACC reduction in the CRA 2 lobster fishery, Error bars are ± SE. The bold regression line shows the estimated trends produced by the GLMM (model 3) and the associated 95% credible intervals (shaded area). These analyses modelled patterns from 2016 to 2023 for CROP and TAWH, and 2015 to 2023 for HAH.
This study has demonstrated that J. edwardsii populations on shallow fished rocky reefs in New Zealand’s Hauraki Gulf were characterized by low densities of predominantly sublegal (<95mm CL) individuals, while marine reserve populations were characterised by higher densities and larger-sized individuals. Total, vulnerable, and spawning stock biomass was 12-43 times greater within marine reserves compared to fished locations. Using marine reserve populations as proxy estimates of unfished biomass we estimated that J. edwardsii populations on shallow reefs in the Hauraki Gulf are <10% unfished levels. Based on monitoring of lobster populations inside and outside three marine reserves, we also found little evidence that J. edwardsii populations in the Hauraki Gulf had recovered since large commercial catch reductions in 2018. These results are in stark contrast to the latest J. edwardsii stock assessment (Rudd et al., 2023) that inferred a substantial and rapid increase in lobster abundance and biomass in the wider fishery comprising CRA2. Our fisheries-independent assessment therefore suggests that the recent stock assessment has drastically overestimated the degree of recovery since 2018 and the current state of lobster populations in the Hauraki Gulf. These findings highlight the critical need for fisheries-independent data and the value of marine reserve monitoring data in evaluating population status and recovery following fisheries management actions.
To assess population status of a target species using fishery-independent surveys from fished and protected populations, surveys need to be carried out in multiple fished and reserve areas across the wider fishery. It is also critical that survey locations are representative of the areas being fished and that protected areas are (1) environmentally similar, and (2) have been established long enough (> 10 years) to support populations of the target species at unfished levels (Barrett et al., 2009; Freeman et al., 2012; Kelly et al., 2000). At the time of this study, the MPAs used had been established for 46 years (CROP), 39 years (TAWH) and 29 years (HAH). We found clear and consistent differences in lobster abundance and size structure between the six fished and three reserve areas examined. The density of legal-sized lobster and both vulnerable and spawning stock biomass (SSB) was consistently low across all fished locations, suggesting that multiple areas are at a similar level of depletion. All sites surveyed in this study were located in the outer Hauraki Gulf where commercial fishing is concentrated (see Supplementary Figure S1) and in areas with extensive and complex subtidal reefs affording suitable shelter for lobster. While surveys were focussed on shallow reefs (<20 m) they were predominantly carried out between May-July, as this is when J. edwardsii are concentrated on shallow reefs for mating (Kelly, 2001). The following account of lobster populations at the Mokohinau Islands in 1887 by lighthouse keeper Abraham Sandager highlight this seasonality and the historical prevalence of J. edwardsii on fished reefs: “During the spawning season (from middle May to the end of July) large numbers visit shallow water in rocky sheltered places, and the males (which do not cast their shell at the same time as the females) may be easily caught or speared” (Sandager, 1887). Notably, only one male lobster was recorded across the Mokohinau Islands from 24 transects (1.2 ha of rocky rock reef habitat) surveyed in 2022. Our data therefore highlight the extreme levels of population depletion that have occurred across much of the Hauraki Gulf and that the poor status of populations, previously reported on fished reefs at Leigh and Tāwharanui (Hanns et al., 2022), are representative of shallow reefs in the wider Hauraki Gulf, rather than reflecting areas of local depletion.
The reserve areas examined had consistently more abundant and larger lobster than all fished areas. These reserves are located on open rocky coasts encompassing extensive reef systems that were historically fished for lobster. The surrounding reefs outside the reserves (where control sites are located) are also continually fished, highlighting that these reserve areas are representative of fished areas (Kelly et al., 2002). Furthermore, visual census by SCUBA divers may provide more representative sampling of populations as opposed to the typical fishing method of potting, which can underrepresent females and sublegal individuals (Hanns et al., 2022; Ziegler et al., 2003). While J. edwardsii populations in these reserves are substantially higher than in fished areas, it is important to note that they are unlikely to represent true unfished (B0) levels due to high fishing effort on reserve boundaries and movement of lobster across reserve boundaries (Kelly et al., 2002; Goñi et al., 2010; Hanns and Shears, 2023). In our study, lobster populations within the surveyed marine reserves are known to have declined substantially over the last two decades (Lascala-Gruenewald et al., 2021). The lobster populations within these reserves are therefore below true unfished levels, which means our estimates of relative population status in surrounding fished areas is likely an overestimate, particularly when considering historical accounts (i.e., Maxwell and Macdiarmid, 2014; Sandager, 1887). This highlights a limitation of using sampling from a single time in an MPA to estimate unfished biomass and accurately inform on the status of surrounding fished populations. For example, while densities in surrounding fished areas may remain low, reductions within reserves due to boundary fishing or poaching would lead to an apparent increase in the relative state of the surrounding fished population. It is therefore critical that changes in reserve and fished populations are monitored and trends over time are understood. In some cases, using older reserve reference data [e.g. Lascala-Gruenewald et al. (2021)] will provide more robust estimates of fished population status and mitigate against possible shifting baselines (Schijns and Pauly, 2022).
Our mean estimates from 2021/2022 suggest that all metrics of J. edwardsii biomass in fished areas of the Hauraki Gulf are below 10% of unfished levels. For statistical area 905, SSB is at 5%, suggesting a small improvement from 3% in 2018/2019 (Hanns et al., 2022). These estimates are vastly different to the 2022 CRA2 stock assessment that found the 2018 TACC reduction had resulted in the “rapid restoration of stock abundance to a level above the reference level”, and the fishery was estimated to be at 40% unfished SSB (Rudd et al., 2023). The stock assessment estimate of a large and rapid increase in population status was largely linked to an instantaneous and near-doubling in reported CPUE that occurred following catch reductions in 2018 (Rudd et al., 2023). While this assessment applies to the larger CRA2 stock area, it is unlikely that our contrasting results are due to a mismatch in scale and not representative of the wider fishery as CPUE followed a similar abrupt increase across all statistical areas and approximately half of the commercial catch in this fishery comes from the two statistical areas examined in the present study (Starr, 2022).
Our monitoring of lobster populations inside and outside the marine reserves up until 2023 provided little evidence of region-wide increases in lobster populations following catch reductions. There was evidence of small increases in legal and sublegal lobster density between 2015 and 2023 within and outside of the Te Whanganui-o-Hei marine reserve, but no evidence of an increase in density within and outside of the CROP and Tāwharanui marine reserves. The most recent stock assessment partially attributed stock rebuilding to a period of improved recruitment around 2015 (Rudd et al., 2023). While this was potentially reflected in increases in densities of sublegal lobster at Te Whanganui-o-Hei, this only translated into small increases in legal lobster at both reserve and fished sites. Not surprisingly, these increases were substantially larger at reserve sites compared to fished sites that continue to be fished. The extent of change recorded across the three locations examined in our study between 2015 and 2023 suggests limited and spatially variable recovery of J. edwardsii populations on shallow reefs and are not consistent with large-scale rebuilding of populations and the wider fishery.
The large discrepancy in overall population status and degree of population recovery between our findings and that reported in the fishery (Rudd et al., 2023) is likely due to the stock assessment’s heavy reliance on fisheries-dependent catch per unit effort (CPUE) data. The reduction in TACC in CRA2 from 200 to 80 t pa between 2017/2018 and 2018/2019 resulted in the number of vessels fishing being reduced from 29 to 19 (Starr, 2022). This was evident across all statistical areas, but the greatest relative drop-off occurred in the 905 statistical area with the number of vessels decreasing from 9 to 6, and down to 4 in 2020/2021. The greatly reduced fleet size and reduced available catch likely allowed fishers to target their effort in high productivity areas (i.e., areas where greatest recovery occurred), while also exercising greater self-organisation in terms of dividing and optimising their effort both spatially and temporally rather than competing for resources in the same area. We therefore suggest that the abrupt increase in CPUE reported following catch reductions is most likely reflective of a change in fisher behaviour associated with greatly reduced allowable catch and fewer vessels fishing focussing on high productivity areas, rather than representing a rapid recovery or rebuilding of the wider fished population following catch reductions (e.g., Robinson et al., 2015). Although CPUE has increased and the remaining fishers are able to catch their reduced allowable catch with less relative effort, our fishery-independent surveys on shallow reefs demonstrate that fished populations remain at generally low levels across the Hauraki Gulf.
An increase in CPUE is generally a good outcome from fishery management decisions and CPUE would be expected to increase gradually as populations rebuild. However, the limitations of linking CPUE to abundance have long been well known (i.e., Maunder et al., 2006) and our results cast major doubt over the results of the recent CRA2 stock assessment and estimates that lobster populations are at 40% of unfished levels. If fishery-dependent catch data are not representative of the wider population being managed, and instead only reflect localized dynamics, estimates of wider stock status can become severely biased (Wiedenmann et al., 2017). Statistical standardizations are employed to lessen the impact of external factors on fishery-dependent data, thereby enhancing the accuracy of trends in fished populations (Maunder and Punt, 2004). While these standardizations improve data fidelity, uncertainties remain due to heavy reliance on complex assumptions arising from limited empirical data on these external processes, such as fisher behaviour, catchability, technological improvement and the high grading of catch in quota management systems (Chen and Rajakaruna, 2003; Mora et al., 2009). Ultimately, the accuracy of fishery-dependent data, even post standardization, is unlikely to be equitable to that collected through well-designed scientific surveys (Chen and Rajakaruna, 2003). The discrepancy between our study’s findings and the stock assessment highlights the limitations of solely relying on fisheries-dependent catch data in stock assessment models. In their evaluation of the efficacy of fisheries assessment practices, Edgar et al. (2019) suggest more scrutiny and precaution is needed when applying models known to have high levels of uncertainty for management decisions. Greater incorporation of long-term monitoring data using a scientific survey approach, from within and outside long-established and well-managed marine protected areas, within fisheries stock assessments can reduce uncertainty and provide a means to scrutinise the accuracy of fisheries dependent data.
The low population abundance and small sizes of J. edwardsii reported in this study has consequences beyond the sustainability and resilience of lobster populations and the associated fishery. In northeastern New Zealand, J. edwardsii are one of the primary predators of the sea urchin Evechinus chloroticus, and overfishing of J. edwardsii and predatory fish has triggered a trophic cascade that leads to the loss of kelp forests and expansion of urchin barrens (Shears and Babcock, 2002). Consequently, J. edwardsii have been described as being functionally extinct in the Hauraki Gulf and northeastern New Zealand (Macdiarmid et al., 2013), meaning they are no longer large or abundant enough to play an ecological role in controlling sea urchin densities. Under the Fisheries Act 1996, the New Zealand Government is required to manage the ecological and cultural impacts of fishing on the environment, but only recently as a result of court action (NZHC 2969: The Environmental Law Initiative v Minister For Oceans And Fisheries, 2022) has the New Zealand Government began to explore options to manage fisheries of rock lobster in a way that mitigates the ecological effects of fishing these historically important predators. Our results highlight the need for urgent and bold management actions to rebuild lobster populations in the Hauraki Gulf to meaningful levels so they can fulfil their ecological role and support sustainable fisheries for all stakeholders. This is particularly important given recent warming trends reported in the Hauraki Gulf (Shears et al., 2024) and uncertainties in how this may be impacting lobster recruitment (Rudd et al., 2023). Establishing larger protected areas such as those currently proposed in the outer Hauraki Gulf (Hauraki Gulf / Tīkapa Moana Marine Protection Bill, 2023) will provide a key step to effectively rebuild lobster populations in the future and implement ecosystem-based management.
This study demonstrates the value of monitoring data from multiple fished and protected areas as a way of providing a fisheries-independent assessment of target species. Both regional surveys and monitoring inside and outside protected areas show little evidence of population recovery following recent catch reductions in the fishery. Further, the results clearly demonstrate the current poor state of lobster populations in the Hauraki Gulf and are in stark contrast to estimates based on traditional stock assessment models underpinned by fisheries-dependent catch data. This highlights the importance of using fisheries-independent data in evaluating the effectiveness of fisheries management decisions to critique the results of traditional stock assessment approaches. Such data are also key to implementing a broader and robust ecosystem-based approach to fisheries and conservation management of ecologically important species such as rock lobster.
The raw data supporting the conclusions of this article will be made available by the authors, without undue reservation.
The manuscript presents research on animals that do not require ethical approval for their study.
HN: Data curation, Formal Analysis, Investigation, Writing – original draft, Writing – review & editing, Project administration, Visualization. BH: Data curation, Formal Analysis, Writing – review & editing, Methodology, Visualization, Investigation. TH: Data curation, Writing – review & editing, Resources. NS: Data curation, Writing – review & editing, Conceptualization, Funding acquisition, Methodology, Supervision, Resources, Validation.
The author(s) declare that financial support was received for the research, authorship, and/or publication of this article. Funding for this study was provided by the Oceans of Change Initiative and long-term monitoring of marine reserves was funded by the New Zealand Department of Conservation. Funding for publication costs provided by the Environmental Law Initiative.
We are grateful to Dr Beate Schuler and the Oceans of Change initiative for funding this study, the Environmental Law Initiative for providing funding for publication costs, and the Department of Conservation for funding long-term marine reserve monitoring.
The authors declare that the research was conducted in the absence of any commercial or financial relationships that could be construed as a potential conflict of interest.
All claims expressed in this article are solely those of the authors and do not necessarily represent those of their affiliated organizations, or those of the publisher, the editors and the reviewers. Any product that may be evaluated in this article, or claim that may be made by its manufacturer, is not guaranteed or endorsed by the publisher.
The Supplementary Material for this article can be found online at: https://www.frontiersin.org/articles/10.3389/fmars.2024.1440350/full#supplementary-material
Supplementary Figure S2 | Estimated densities of all (total), legal-sized (≥95 mm carapace length; CL), and sublegal-sized (<95 mm CL) lobsters in fished locations of the 905 and 906 statistical areas. Figure displays predicted conditional means and 95% lower and upper credible intervals based on all predictors within the model. Lines and letters above the points indicate pairwise groups based on assessment of posterior highest density intervals (HDI). X indicates no sublegal lobster were observed at MOK, and therefore MOK was excluded from the sublegal model.
Supplementary Figure S3 | Estimated biomass of all (total), vulnerable (legal-sized ≥95 mm carapace length; CL) and spawning stock (SSB; mature females ≥87.5 mm CL) across fished locations in the 905 and 906 statistical areas. Figure displays predicted conditional means and 95% lower and upper credible intervals based on all predictors within the model. Lines and letters above the points indicate pairwise groups based on assessment of posterior highest density intervals (HDI). X indicates no lobster characterised as SSB were observed at MOK, and therefore MOK was excluded from the SSB model.
Supplementary Table S1 | Informative priors used in GLMM specified in Model 3 for legal (≥95 mm carapace length; CL) and sublegal (<95 mm CL) lobster.
Supplementary Table S6 | Models’ parameters for the GLMM model specified in Model 3 for legal-sized (≥95 mm carapace length) lobster.
Supplementary Table S7 | Models’ parameters for the GLMM model specified in Model 3 for sublegal-sized (<95 mm carapace length) lobster.
Supplementary Table S8 | Post-hoc analyses showing the effect of ‘Year’ per ‘Status’ level for legal-sized (≥95 mm carapace length; CL) and sublegal-sized (<95 mm CL) lobster densities. Credible evidence of ‘Year’ effect indicated by the highest posterior density interval not containing zero.
Aguirre J. D., Bollard-Breen B., Cameron M., Constantine R., Duffy C. A. J., Dunphy B., et al. (2016). Loved to pieces: Toward the sustainable management of the Waitematā Harbour and Hauraki Gulf. Regional Stud. Mar. Sci. 8, 220–233. doi: 10.1016/j.rsma.2016.02.009
Arkema K. K., Abramson S. C., Dewsbury B. M. (2006). Marine ecosystem-based management: from characterization to implementation. Front. Ecol. Environ. 4, 525–532. doi: 10.1890/1540-9295(2006)4[525:MEMFCT]2.0.CO;2
Barrett N. S., Buxton C. D., Edgar G. J. (2009). Changes in invertebrate and macroalgal populations in Tasmanian marine reserves in the decade following protection. J. Exp. Mar. Biol. Ecol. 370, 104–119. doi: 10.1016/j.jembe.2008.12.005
Bürkner P.-C. (2017). brms: An R package for Bayesian multilevel models using Stan. J. Stat. Software 80, 1–28. doi: 10.18637/jss.v080.i01
Caddy J. F., Mahon R. (1995). Reference points for fisheries management (Rome: FAO). FAO Fisheries Technical Paper. No. 347.
Carpenter B., Gelman A., Hoffman M. D., Lee D., Goodrich B., Betancourt M., et al. (2017). Stan: A probabilistic programming language. J. Stat. Software 76, 1–32. doi: 10.18637/jss.v076.i01
Chen Y., Chen L., Stergio K. I. (2003). Impacts of data quantity on fisheries stock assessment. Aquat. Sci. 65, 92–98. doi: 10.1007/s000270300008
Chen Y., Rajakaruna H. (2003). “Quality and Quantity of Fisheries Information in Stock Assessment,” in Proceedings of the Third World Fisheries Congress: Feeding the World with Fish in the Next Millennium, the Balance between Production and the Environment. Eds. Phillips B., Megrey B., Yingqi Z. (American Fisheries Society Symposium, Bethesday, Maryland), 411–424.
Costello M. J. (2024). Evidence of economic benefits from marine protected areas. Scientia Marina 88, e080. doi: 10.3989/scimar.2024.88n1
Curtin R., Prellezo R. (2010). Understanding marine ecosystem based management: A literature review. Mar. Policy 34, 821–830. doi: 10.1016/j.marpol.2010.01.003
Davidson R. J., Villouta E., Cole R. G., Barrier R. G. F. (2002). Effects of marine reserve protection on spiny lobster (Jasus edwardsii) abundance and size at Tonga Island Marine Reserve, New Zealand. Aquat. Conservation: Mar. Freshw. Ecosyst. 12, 213–227. doi: 10.1002/aqc.505
Davies T. D., Chen Y., Jonsen I. D. (2011). Identifying nonproportionality of fishery-independent survey data to estimate population trends and assess recovery potential for cusk (Brosme brosme). Can. J. Fisheries Aquat. Sci. 68, 413–425. doi: 10.1139/F10-165
Díaz D., Mallol S., Parma A. M., Goñi R. (2016). A 25-year marine reserve as proxy for the unfished condition of an exploited species. Biol. Conserv. 203, 97–107. doi: 10.1016/j.biocon.2016.09.002
Eddy T. D., Pitcher T. J., Macdiarmid A. B., Byfield T. T., Tam J. C., Jones T. T., et al. (2014). Lobsters as keystone: Only in unfished ecosystems? Ecol. Model. 275, 48–72. doi: 10.1016/j.ecolmodel.2013.12.006
Edgar G. J., Barrett N. S. (1999). Effects of the declaration of marine reserves on Tasmanian reef fishes, invertebrates and plants. J. Exp. Mar. Biol. Ecol. 242, 107–144. doi: 10.1016/S0022-0981(99)00098-2
Edgar G. J., Ward T. J., Stuart-Smith R. D. (2019). Weaknesses in stock assessment modelling and management practices affect fisheries sustainability. Aquat. Conservation: Mar. Freshw. Ecosyst. 29, 2010–2016. doi: 10.1002/aqc.3161
Fisheries New Zealand (2022). Fisheries Assessment Plenary, November 2022: stock assessments and stock status (Wellington, New Zealand: Fisheries New Zealand: Compiled by the Fisheries Science Team). 684 p.
Freeman D. J., Macdiarmid A. B., Taylor R. B., Davidson R. J., Grace R. V., Haggitt T. R., et al. (2012). Trajectories of spiny lobster Jasus edwardsii recovery in New Zealand marine reserves: is settlement a driver? Environ. Conserv. 39, 295–304. doi: 10.1017/S037689291200015X
Goñi R., Hilborn R., Díaz D., Mallol S., Adlerstein S. (2010). Net contribution of spillover from a marine reserve to fishery catches. Mar. Ecol. Prog. Ser. 400, 233–243. doi: 10.3354/meps08419
Goulding M., Venticinque E., Ribeiro M. L. D. B., Barthem R. B., Leite R. G., Forsberg B., et al. (2018). Ecosystem-based management of Amazon fisheries and wetlands. Fish Fisheries 20, 138–158. doi: 10.1111/faf.12328
Hanns B. J., Haggitt T., Shears N. T. (2022). Marine protected areas provide unfished reference information to empirically assess fishery status. Biol. Conserv. 276. doi: 10.1016/j.biocon.2022.109775
Hanns B. J., Shears N. T. (2023). Modelling spatial variation in an exploited species across marine reserve boundaries. J. Appl. Ecol. 60 (8), 1708–1719. doi: 10.1111/1365-2664.14450
Hauraki Gulf / Tīkapa Moana Marine Protection Bill (2023). (New Zealand Government Bill). Available online at: https://legislation.govt.nz/bill/government/2023/0282/latest/whole.html (Accessed 27 May, 2024). (282-1).
Hilborn R. A. Y., Amoroso R. O., Anderson C. M., Baum J. K., Branch T. A., Costello C., et al. (2020). Effective fisheries management instrumental in improving fish stock status. Proc. Natl. Acad. Sci. 117, 2218–2224. doi: 10.1073/pnas.1909726116
Holsman K. K., Haynie A. C., Hollowed A. B., Reum J. C. P., Aydin K., Hermann A. J., et al. (2020). Ecosystem-based fisheries management forestalls climate-driven collapse. Nat. Commun. 11, 4579. doi: 10.1038/s41467-020-18300-3
Jack L., Wing S. R. (2010). Maintenance of old-growth size structure and fecundity of the red rock lobster Jasus edwardsii among marine protected areas in Fiordland, New Zealand. Mar. Ecol. Prog. Ser. 404, 161–172. doi: 10.3354/meps08499
Kelly S. (2001). Temporal variation in the movement of the spiny lobster Jasus edwardsii. Mar. Freshw. Res. 52, 323–331. doi: 10.1071/MF00028
Kelly S., Macdiarmid A. B. (2003). Movement patterns of mature spiny lobsters, Jasus edwardsii, from a marine reserve. New Z. J. Mar. Freshw. Res. 37, 149–158. doi: 10.1080/00288330.2003.9517153
Kelly S., Scott D., Macdiarmid A. B. (2002). The Value of a Spillover Fishery for Spiny Lobsters Around a Marine Reserve in Northern New Zealand. Coast. Manage. 30, 153–166. doi: 10.1080/089207502753504689
Kelly S., Scott D., Macdiarmid A. B., Babcock R. C. (2000). Spiny lobster, Jasus edwardsii, recovery in New Zealand marine reserves. Biol. Conserv. 92, 359–369. doi: 10.1016/S0006-3207(99)00109-3
Kleiven A. R., Espeland S. H., Stiansen S., Ono K., Zimmermann F., Olsen E. M. (2022). Technological creep masks continued decline in a lobster (Homarus gammarus) fishery over a century. Sci. Rep. 12, 3318. doi: 10.1038/s41598-022-07293-2
Kritzer J. P., Delucia M.-B., Greene E., Shumway C., Topolski M. F., Thomas-Blate J., et al. (2016). The Importance of Benthic Habitats for Coastal Fisheries. BioScience 66, 274–284. doi: 10.1093/biosci/biw014
Lascala-Gruenewald D. E., Grace R. V., Haggitt T. R., Hanns B. J., Kelly S., Macdiarmid A. B., et al. (2021). Small marine reserves do not provide a safeguard against overfishing. Conserv. Sci. Pract. 3, e362. doi: 10.1111/csp2.362
Latour R. J., Brush M. J., Bonzek C. F. (2003). Toward Ecosystem-Based Fisheries Management. Fisheries 28, 10–22. doi: 10.1577/1548-8446(2003)28[10:TEFM]2.0.CO;2
Macdiarmid A. B. (1989). Size at onset of maturity and size-dependent reproductive output of female and male spiny lobsters Jasus edwardsii (Hutton) (Decapoda, Palinuridae) in northern New Zealand. J. Exp. Mar. Biol. Ecol. 127, 229–243. doi: 10.1016/0022-0981(89)90076-2
Macdiarmid A. B. (1991). Seasonal changes in depth distribution, sex ratio and size frequency of spiny lobster Jasus edwardsii on a coastal reef in northern New Zealand. Mar. Ecol. Prog. Ser. 70, 129–141. doi: 10.3354/meps070129
Macdiarmid A. B., Freeman D., Kelly S. (2013). Rock lobster biology and ecology: contributions to understanding through the Leigh Marine Laboratory 1962-2012. New Z. J. Mar. Freshw. Res. 47, 313–333. doi: 10.1080/00288330.2013.810651
Marzloff M. P., Melbourne-Thomas J., Hamon K. G., Hoshino E., Jennings S., Van Putten I. E., et al. (2016). Modelling marine community responses to climate-driven species redistribution to guide monitoring and adaptive ecosystem-based management. Global Change Biol. 22, 2462–2474. doi: 10.1111/gcb.13285
Maunder M. N., Piner K. R. (2015). Contemporary fisheries stock assessment: many issues still remain. ICES J. Mar. Sci. 72, 7–18. doi: 10.1093/icesjms/fsu015
Maunder M. N., Punt A. E. (2004). Standardizing catch and effort data: a review of recent approaches. Fisheries Res. 70, 141–159. doi: 10.1016/j.fishres.2004.08.002
Maunder M. N., Punt A. E. (2013). A review of integrated analysis in fisheries stock assessment. Fisheries Res. 142, 61–74. doi: 10.1016/j.fishres.2012.07.025
Maunder M. N., Sibert J. R., Fonteneau A., Hampton J., Kleiber P., Harley S. J. (2006). Interpreting catch per unit effort data to assess the status of individual stocks and communities. ICES J. Mar. Sci. 63, 1373–1385. doi: 10.1016/j.icesjms.2006.05.008
Maxwell K., Macdiarmid A. B. (2014). “Oral histories of marine fish and shellfish state and use in the Hauraki Gulf and along the Otago-Catlins coast 1940–2008,” in New Zealand Aquatic Environment and Biodiversity Report. No. 173. (Ministry for Primary Industries, Wellington, New Zealand).
Ministry For Primary Industries. Available online at: https://fs.fish.govt.nz/Page.aspx?pk=8&stock=CRA2 (Accessed May 23, 2024).
Ministry For Primary Industries (2008). Harvest Strategy Standard for New Zealand Fisheries (Wellington, New Zealand: Ministry for Primary Industries). Available online at: https://www.mpi.govt.nz/dmsdocument/728-Harvest-Strategy-Standard-for-New-Zealand-Fisheries (Accessed May 23, 2024).
Mora C., Myers R. A., Coll M., Libralato S., Pitcher T. J., Sumaila R. U., et al. (2009). Management effectiveness of the world's marine fisheries. PLoS Biol. 7, e1000131. doi: 10.1371/journal.pbio.1000131
NZHC 2969: The Environmental Law Initiative v Minister For Oceans And Fisheries (2022). High Court judgment decision for Northland rock lobster (New Zealand High Court). Available online at: https://www.mpi.govt.nz/dmsdocument/55012-2022-High-Court-judgment-decision-for-Northland-rock-lobster (Accessed May 23, 2024).
R Core Team (2022). R: A Language and Environment for Statistical Computing (Vienna, Austria: R Foundation for Statistical Computing).
Robinson J., Graham N. A. J., Cinner J. E., Almany G. R., Waldie P. (2015). Fish and fisher behaviour influence the vulnerability of groups (Epinephelidae) to fishing at a multispecies spawning aggregation site. Coral Reefs 34, 371–382. doi: 10.1007/s00338-014-1243-1
Rose G. A., Kulka D. W. (1999). Hyperaggregation of fish and fisheries: how catch-per-unit-effort increased as the northern cod (Gadus morhua) declined. Can. J. Fisheries Aquat. Sci. 56, 118–127. doi: 10.1139/f99-207
Rudd M. B., Pons M., Webber D. M., Starr P. J., Roberts J., Goeden Z. D. (2023). The 2022 stock assessment of red rock lobsters (Jasus edwardsii) in CRA 2. (Wellington, New Zealand: Ministry for Primary Industries).
Rudd M. B., Webber D. N., Starr P. J. (2021). Model-based reference levels for New Zealand red rock lobster (Jasus edwardsii). New Zealand Fisheries Assessment Report 2021/81. (Wellington, New Zealand: Ministry for Primary Industries).2023
Sandager F. (1887). List of fishes found around Mokohinau Islands; their spawning time and observations regarding some of the species. Trans. Proc. New Z. Institute 1887, 127–133.
Saul S., Brooks E. N., Die D. (2020). How fisher behavior can bias stock assessment: insights from an agent-based modeling approach. Can. J. Fisheries Aquat. Sci. 77, 1794–1809. doi: 10.1139/cjfas-2019-0025
Schijns R., Pauly D. (2022). Management implications of shifting baselines in fish stock assessments. Fisheries Manage. Ecol. 29, 183–195. doi: 10.1111/fme.12511
Shears N. T., Babcock R. C. (2002). Marine reserves demonstrate top-down control of community structure on temperate reefs. Oecologia 132, 131–142. doi: 10.1007/s00442-002-0920-x
Shears N. T., Bowen M. M., Thoral F. (2024). Long-term warming and record-breaking marine heatwaves in the Hauraki Gulf, northern New Zealand. New Z. J. Mar. Freshw. Res., 1–12. doi: 10.1080/00288330.2024.2319100
Skern-Mauritzen M., Ottersen G., Handegard N. O., Huse G., Dingsør G. E., Stenseth N. C., et al. (2016). Ecosystem processes are rarely included in tactical fisheries management. Fish Fisheries 17, 165–175. doi: 10.1111/faf.12111
Starr P. J. (2022). “Rock lobster catch and effort data 1979–80 to 2021–22,” in New Zealand Fisheries Assessment Report 2022/42 (Ministry for Primary Industries, Wellington, New Zealand). 151 p.
Townsend H., Harvey C. J., Dereynier Y., Davis D., Zador S. G., Gaichas S., et al. (2019). Progress on Implementing Ecosystem-Based Fisheries Management in the United States Through the Use of Ecosystem Models and Analysis. Front. Mar. Sci. 6. doi: 10.3389/fmars.2019.00641
Webber D. N., Starr P. J. (2020). “Operational management procedures for New Zealand rock lobster (Jasus edwardsii) stocks in 2019-20,” in New Zealand Fisheries Assessment Report 2020/46 (Ministry for Primary Industries, Wellington, New Zealand). 29 p.
Webber D. N., Starr P. J., Haist V., Rudd M. B., Edwards C. T. T. (2018). “The 2017 stock assessment and management procedure evaluation for rock lobsters (Jasus edwardsii) in CRA 2,” in New Zealand Fisheries Assessment Report 2018/17 (Ministry for Primary Industries, Wellington, New Zealand). 87 p.
Wiedenmann J., Wilberg M., Sylvia A., Miller T. (2017). An evaluation of acceptable biological catch (ABC) harvest control rules designed to limit overfishing. Can. J. Fisheries Aquat. Sci. 74, 1028–1040. doi: 10.1139/cjfas-2016-0381
Wilson J. R., Bradley D., Phipps K., Gleason M. G. (2020). Beyond protection: Fisheries co-benefits of no-take marine reserves. Mar. Policy 122, 104224. doi: 10.1016/j.marpol.2020.104224
Winker H., Kerwath S. E., Attwood C. G. (2013). Comparison of two approaches to standardize catch-per-unit-effort for targeting behaviour in a multispecies hand-line fishery. Fisheries Res. 139, 118–131. doi: 10.1016/j.fishres.2012.10.014
Young M. A., Ierodiaconou D., Edmunds M., Hulands L., Schimel A. C. G. (2016). Accounting for habitat and seafloor structure characteristics on southern rock lobster (Jasus edwardsii) assessment in a small marine reserve. Mar. Biol. 163. doi: 10.1007/s00227-016-2914-y
Keywords: marine protected areas, marine reserves, Jasus edwardsii, spiny lobster, fisheries, fisheries-independent data, stock assessment
Citation: Nessia HR, Hanns BJ, Haggitt TR and Shears NT (2024) Using marine protected areas to assess the status and recovery of the spiny lobster Jasus edwardsii fishery in the Hauraki Gulf, Aotearoa New Zealand. Front. Mar. Sci. 11:1440350. doi: 10.3389/fmars.2024.1440350
Received: 29 May 2024; Accepted: 16 August 2024;
Published: 16 September 2024.
Edited by:
Rebecca G. Asch, East Carolina University, United StatesReviewed by:
Fabrice Stephenson, Newcastle University, United KingdomCopyright © 2024 Nessia, Hanns, Haggitt and Shears. This is an open-access article distributed under the terms of the Creative Commons Attribution License (CC BY). The use, distribution or reproduction in other forums is permitted, provided the original author(s) and the copyright owner(s) are credited and that the original publication in this journal is cited, in accordance with accepted academic practice. No use, distribution or reproduction is permitted which does not comply with these terms.
*Correspondence: Hayley R. Nessia, aGF5bGV5Lm5lc3NpYUBhdWNrbGFuZC5hYy5ueg==
†These authors have contributed equally to this work and share first authorship
Disclaimer: All claims expressed in this article are solely those of the authors and do not necessarily represent those of their affiliated organizations, or those of the publisher, the editors and the reviewers. Any product that may be evaluated in this article or claim that may be made by its manufacturer is not guaranteed or endorsed by the publisher.
Research integrity at Frontiers
Learn more about the work of our research integrity team to safeguard the quality of each article we publish.