 Yan Li
 Cunfen Deng1
 Peng Jiang
 Ke Wang
95% of researchers rate our articles as excellent or good
Learn more about the work of our research integrity team to safeguard the quality of each article we publish.
Find out more
ORIGINAL RESEARCH article
Front. Mar. Sci. , 16 July 2024
Sec. Marine Affairs and Policy
Volume 11 - 2024 | https://doi.org/10.3389/fmars.2024.1438096
This article is part of the Research Topic Challenges and Solutions in Forecasting and Decision-Making in Marine Economy and Management View all 22 articles
The ocean is the largest carbon sink on Earth and an important pathway to China achieving carbon neutrality. From a consumption perspective, studying the capacity of marine carbon sink in each of China’s provinces and its inter-regional transfer is of great significance in harnessing the increase in ocean carbon sink driven by final demand. This article first calculates the production-side carbon sink in coastal provinces. Then, based on the 2007, 2012, 2015, and 2017 Chinese inter-regional input-output tables, each province’s consumption-side marine carbon sink is calculated. The article further examines the influencing factors and key transfer paths for the growth of marine carbon sink through Structural Decomposition Analysis (SDA) and Structural Path Analysis (SPA) methods. The results show that each province’s total consumption-side carbon sink continues to rise, with significant regional disparities, demonstrating a trend of higher carbon sink in coastal provinces than inland provinces. Among the nine coastal provinces, Hainan and Guangdong are in a net input state regarding carbon sink transfer, while the other seven are in a net output state. SDA results indicate that the carbon sink intensity effect and the consumption demand effect are important factors inhibiting and promoting carbon sink growth, respectively, while the influence of the input-output technical effect is weak and variable. SPA analysis reveals that carbon sink outputs are primarily transferred to the food and tobacco sector, the agricultural and forestry products and services sector, and the wood processing and furniture industry. The key transfer paths mostly occur within a province, with a relatively small proportion of interprovincial transfer paths. Based on the research findings, this article suggests steadily increasing the proportion of marine product consumption, actively expanding the value chain of shellfish and seaweed industries, continuously strengthening coordination between land and marine industries, and further promoting the domestic circulation of marine carbon sinks.
Climate change has become a significant challenge facing humanity. As the world’s largest emitter of greenhouse gases, China has actively responded to the Paris Agreement, setting the ‘dual carbon goals’ of peaking carbon dioxide emissions by 2030 and achieving carbon neutrality by 2060. Increasing the absorption of atmospheric carbon dioxide is an important pathway to achieving carbon neutrality, in addition to reducing greenhouse gas emissions such as CO2 (Gao et al., 2021).
Carbon sequestration refers to the processes, activities, and mechanisms through which carbon dioxide is absorbed from the atmosphere, thereby reducing greenhouse gas concentrations. By enhancing ecosystem carbon sinks, more carbon emission space can be allocated to national development, contributing to achieving carbon neutrality goals and promoting sustainable economic development. Currently, carbon sequestration is primarily categorized into ‘green carbon’ and ‘blue carbon’. ‘Green carbon’ typically refers to land-based carbon sinks, where green plants absorb atmospheric carbon dioxide through photosynthesis. Forest, grassland, and cropland carbon sinks are all examples of this (Watson et al., 2000). In contrast, ‘blue carbon’ mainly refers to marine carbon sinks. The concept originated from the ‘Blue Carbon Report’ published by the United Nations Environment Programme in 2009, which defines ‘blue carbon’ as the methods by which ocean activities and marine organisms absorb atmospheric CO2 and fix it in the ocean.
Oceans possess a substantial carbon sequestration capacity and provide stable carbon storage capabilities compared to land carbon sequestration. Covering approximately 70% of the Earth’s surface, oceans constitute the largest active carbon reservoir on the planet. About one-fourth of the CO2 emitted by humans is absorbed by oceans (Doney et al., 2014), and their carbon storage capacity is 20 times that of land carbon reservoirs (Amon, 2016). Moreover, the storage period of ocean carbon sinks can extend for thousands of years (Gruber et al., 2019; Gregor and Gruber, 2020), making them an effective pathway for achieving carbon neutrality through increased sequestration.
China boasts significant potential in marine carbon sequestration, stemming not only from its vast territory of nearly 3 million square kilometers and favorable natural conditions but also from a series of internationally recognized marine carbon sink ecosystems such as seagrass beds, mangroves, and salt marshes, whose roles in marine carbon sequestration cannot be overstated. Among them, shellfish and seaweed have garnered considerable attention in scientific research in recent years as major contributors to marine carbon sequestration (Lai et al., 2022a; Feng et al., 2023).
Shellfish, with their unique filter-feeding mechanism, effectively extract particulate organic carbon from seawater and convert it into their own biomass, significantly promoting carbon fixation and storage (Feng et al., 2023). Additionally, during their growth, shellfish form shells rich in calcium carbonate, which further solidifies carbon in the ocean through the process of biomineralization, contributing to a long-term stable carbon storage reservoir for marine carbon sinks (Tamburini et al., 2022). On the other hand, algae convert inorganic carbon (primarily carbon dioxide and dissolved inorganic carbon) in seawater into organic carbon through photosynthesis, an efficient process that not only provides energy for algae but also serves as a crucial carbon source for the entire marine ecosystem, promoting carbon cycling and energy flow (Sun et al., 2020). The distinct carbon sequestration mechanisms of shellfish and algae collectively constitute a significant component of marine carbon sequestration (Zhang et al., 2017), vital for maintaining the health and stability of marine ecosystems and mitigating the challenges posed by global climate change.
China’s marine carbon sinks hold enormous potential. On the one hand, China’s marine territory covers nearly 3 million square kilometers, with exceptional natural endowments. It is one of the few countries in the world that possesses multiple internationally recognized marine carbon sink ecosystems, including seagrass beds, mangroves, and salt marshes. Additionally, as the main contributor to the marine fishery carbon sink, China’s shellfish and seaweed aquaculture industry has developed rapidly, ranking first in terms of cultivation area and production for several years (World Health Organization, 2023). With the maturation of algae processing technology and changes in residents’ dietary structure, China’s demand for shellfish and seaweed consumption has continued to rise. In 2022, the demand for algae exceeded 7.2 million tons, with shellfish becoming the leading species in marine aquaculture in China. However, research on China’s carbon sinks has long focused only on green carbon sinks such as forests and grasslands (Jiang et al., 2022; Lai et al., 2022b), while studies on blue carbon sinks, especially from the perspective of consumption-driven dynamics, are scarce.
This gap in research is concerning, as consumption patterns play a pivotal role in determining carbon emissions and, subsequently, the efficacy of blue carbon sinks. By examining blue carbon sinks through the lens of consumption, we can gain deeper insights into the complex interplay between human activities and the marine carbon cycle. This understanding is vital for crafting holistic strategies aimed at climate change mitigation and the promotion of environmentally sustainable practices.
This paper examines the impact of consumption on China’s ocean carbon sinks and emissions and explores the impact mechanism and design improvement measures to help the country achieve its ‘dual carbon’ goal. This paper uses data from China’s inter-regional input-output tables for 2007, 2012, 2015, and 2017 to analyze the number of marine carbon sinks on the consumption side of each province by constructing an EE-MRIO model. It explores the differences between provinces, the impact of the type of final consumption, and the transfer of marine carbon sinks. In addition, the paper uses the structural decomposition analysis (SDA) method and structural pathway analysis (SPA) method to investigate the factors influencing the growth of marine carbon sinks and the key transfer pathways. The main findings of this paper are as follows. First, the total capacity of carbon sinks on the consumption side is increasing in all provinces and is significantly higher in coastal areas than inland areas. Second, the carbon sink intensity effect and the consumption demand effect are important factors inhibiting and promoting the growth of carbon sinks, respectively. Finally, carbon sinks are mainly transferred to the food and tobacco sectors, agriculture, forestry, and fishery products and services, and the wood processing products and furniture industry, primarily within provinces.
The contributions of this study are as follows. First, in terms of research perspectives, the issue of consumption side resources and environmental accounting has become a research hotspot in recent years. Many scholars (Wang et al., 2019; Hou et al., 2020) have pointed out that in the post-Kyoto-Protocol era of global climate governance, the current carbon accounting system based on production-side emissions should be reformed and shifted to a more effective system based on consumption-side emissions. In other words, this means moving the focus from product manufacturing product emissions to product consumption emissions. This paper innovatively examines the transfer of marine carbon sinks in China’s provinces and the influencing factors and key pathways from a consumption-side perspective. It is conducive to a deeper understanding of the relationship between consumption and ocean carbon sinks, thus supporting the formulation of more effective policies to increase sinks and help achieve the dual carbon goal.
Second, from the perspective of research content, previous research on ocean carbon sinks has remained at the level of ‘discussing the sea in relation to the sea’ without considering the current needs for the integrated development of sea and land. This paper uses an EE-MRIO model and structural pathway analysis to analyze the linkage effects of ocean carbon sinks between land and sea industries. This research helps formulate more scientific and precise environmental protection policies, thus contributing to the achievement of sustainable development goals.
Third, in terms of research methodology, this paper adopts an environmentally extended MRIO model (EE-MRIO), combining China’s marine sector carbon sink data as a satellite account with an MRIO model to achieve a multi-regional linked analysis of marine carbon sink transfer. This allows a more accurate assessment of inter-industry carbon sink transfers and a better understanding of inter-regional ocean carbon sinks by considering the transfers and impacts of these sinks between individual regions.
In the face of the worsening situation of global warming and environmental damage, the development of energy conservation and emission reduction has become a global imperative (Zhang et al., 2024). Current research on carbon emission reduction in the marine industry mainly focuses on the marine fishing industry (Greer et al., 2019), mariculture (Shi et al., 2023), marine shipping (Chen et al., 2024; Xiao et al., 2024) and so on. At the same time, the carbon sink attributes of the marine industry have also received widespread attention. Research on the “carbon sinks” of the marine industry has focused mainly on the formation mechanism and sources of marine carbon sinks. With regard to the mechanism for the formation of the ocean carbon sink, research has focused on the processes of ocean carbon sink generation, including the solubility pump (Aldama-Campino et al., 2020; Watson et al., 2020), the biological pump (Aldama-Campino et al., 2020), the microbial carbon pump (Jiao et al., 2010; Jiao et al., 2011; Polimene et al., 2017) and carbon sink fisheries (He and Zhang, 2023; Li et al., 2023; Tang and Liu, 2016). Together, these processes form the basis of the ocean carbon cycle, with carbon uptake, transfer and storage occurring through photosynthesis, respiration and physico-chemical reactions in marine organisms. In studies focusing on marine carbon sinks, the marine ecosystem is often viewed as a unified entity, with an emphasis on the ecological perspective to assess the role of these sinks in climate change. Specific ecosystems like salt marshes (Chmura, 2013), mangroves (Kandasamy et al., 2021), and seagrass beds (Ramírez-Zuñiga et al., 2024) have received attention for their unique ecological functions and ability to sequester carbon. Additionally, the idea of shellfish and algal carbon sinks in marine fisheries is gaining recognition, as these organisms absorb carbon dioxide through photosynthesis and convert it into organic matter (Jia et al., 2023; Li et al., 2024). This organic matter is either sequestered or forms stable carbon pools on the seabed. Not only do shellfish and algae in aquaculture have economic value, but they also enhance marine carbon sinks, playing a crucial role in mitigating climate change (Alleway et al., 2019).
The most common methods for estimating carbon sink capacity include atmospheric inversion (Piao et al., 2022), remote sensing estimation (Wang et al., 2020; Tu et al., 2021), and ecosystem modeling and material quality assessment (Ren, 2021). The atmospheric inversion method estimates the carbon sink of terrestrial ecosystems by inverting the atmospheric CO2 concentration changes based on atmospheric CO2 molar fraction measurements and atmospheric transport models combined with anthropogenic CO2 emission inventories (Piao et al., 2022). It has the advantage of assessing carbon sinks and their responses to climate change on a global scale in near real-time. The limitations of atmospheric inversion are that its accuracy is affected by several factors, such as the number and distribution of atmospheric CO2 observation sites, uncertainties in atmospheric transport models, and limitations in CO2 emission inventories. Remote sensing estimation is a method that uses remote sensing to monitor and assess ecosystem carbon sinks, providing data with a wide spatial extent, large coverage area, and a high temporal resolution. However, this method also requires precise calibration and validation to ensure the accuracy of the estimates. Ecosystem modeling refers to providing gridded carbon sink estimates by simulating the processes and mechanisms of the ecosystem carbon cycle. However, ecosystem modeling requires accurate input data and parameters to ensure precise simulation results. Physical quality assessment methods provide a comprehensive and holistic evaluation of the services provided by ecosystems from the perspective of their physical quality through an in-depth understanding of the mechanisms by which their services are generated. Of these methods, atmospheric inversion, remote sensing estimation, and ecosystem modeling are computationally complex and unsuitable for national-level studies (Ren, 2021). In contrast, physical assessment methods do not require direct measurement and can be used to assess the provision and value of ecosystem services by collecting and integrating data from multiple sources. Therefore, it is widely used to measure marine fisheries’ carbon sink capacity. This paper draws on fishery production data from the China Fisheries Statistical Yearbook, using shellfish production data to make the corresponding measurements.
The factors influencing ocean carbon sinks have mainly been explored from the production side. For example, Ren (2021) studied the role of mariculture in mitigating climate change and constructed a preliminary accounting system to assess the removable carbon sinks of mariculture shellfish and algae. The study found that shellfish and algae in Chinese mariculture can absorb and store an average of 927,000 tons of carbon dioxide per year, demonstrating an overall upward trend. Guan et al. (2022b) used the two-stage LMDI approach to comprehensively explore the net carbon sink capacity mechanism of mariculture in China, using aquaculture structure, aquaculture efficiency, culture scale, the competitiveness of shellfish and algae, and culture mode as analysis factors. Guan et al. (2022a) analyzed the carbon emissions and carbon sinks of pelagic fisheries in China’s coastal provinces and decomposed the drivers of net carbon emissions. The results showed that the main positive driver is industrial development, and the main negative driver is population size, while the net carbon coefficient and energy intensity also influence net carbon emissions to some extent.
Although previous research results have referenced research objects, content, and methods, the following shortcomings remain. (1) In terms of research objects, there is a lack of research on ocean carbon sinks, especially fishery carbon sinks, which does not match China’s status as a major ocean carbon sink country. (2) In terms of research content, most existing studies have focused on the formation mechanism of marine carbon sinks, but less research has been conducted on sinks caused by final demand, which is not conducive to fully understanding the value of marine carbon sinks driven by final consumption. (3) In terms of time span, there is still no research on the changes in ocean carbon sinks over a longer period of time and the factors influencing the changes.
In view of this, this paper constructs input-output tables of extended environmental marine industries based on carbon sink accounting in the marine sector of China’s coastal provinces. It uses input-output analysis, SDA, and SPA to (1) sort out the change characteristics in the amount of ocean carbon sinks on the consumption side of each province in China and its relationship with final demand, (2) analyze the factors influencing the changes in consumption-side ocean carbon sinks, and (3) identify the key pathways for transferring ocean carbon sinks between regions and industries.
Input-output tables reflect the intrinsic correlation between inputs and outputs across products (or sectors) at a given time. In a non-competitive input-output model, the input-output relationship for a single region is
where is the direct consumption coefficient of sector to sector i, meaning that one unit of output in sector j requires the consumption of direct input from sector . is the final demand of sector and is the total output of sector i. The direct consumption coefficients of the different sectors are formed into a matrix, creating the direct consumption coefficient matrix . Equation 1 can be expressed in matrix form as
Deforming Equation 2, it can be expressed as Equation 3
where is the total output column vector, is the final demand column vector, is the unit matrix, and is the Leontief inverse matrix.
The single-region non-competitive input-output model can be extended to the multi-region case, forming a multi-region input-output model. The MRIO model reflects the input-output relationship between sectors in a region and the input-output relationship between different sectors in different regions. Assuming that there are m regions, the MRIO model can be expressed as
where is the total output of each sector in region , . is the matrix of direct consumption coefficients from region to region , and is the matrix of final demand from region to region .
The matrix form of Equation 4 is
Deforming Equation 5 by shifting the terms, it can be expressed as Equation 6
The paper uses the EE-MRIO model, which combines China’s marine sector carbon sink data as a satellite account with the MRIO model, to study marine carbon sinks from a consumer-side perspective. To this end, the row vector E (i.e., the carbon sink intensity) of carbon sink emissions due to the total output per unit of each production sector is introduced, which is calculated as follows:
The EE-MRIO model is represented as Equation 8:
Where S denotes carbon sink emissions of each sector, Q denotes the carbon sink on the consumption side due to final demand for each sector in each region, and L denotes the Leontief inverse matrix.
Structural decomposition analysis (SDA) can be used to analyse the impact of various final demand factors and regional sectoral interlinkages on the increase in carbon emissions (Su and Ang, 2023), and with the continuous improvement of input-output data, SDA has become the mainstream methodology for analyzing changes in regional carbon emissions. SDA models typically use four types of decomposition. The first includes the retention of cross-sectional terms. The second does not retain the cross terms but assigns them to their respective variables. The third type uses a weighted average approach to decomposition. The fourth type is bipolar decomposition. This paper adopts the two-level decomposition method (Chen et al., 2022; Zhao et al., 2024), as it can obtain a better approximation. In this paper, the total effects of changes in ocean carbon sinks are decomposed into the effect of changes in carbon sink intensity, changes in technological structure, and changes in final demand. The basic principle of SDA is as Equation 9:
The subscripts ‘0’ and ‘1’ refer to the starting and ending years, respectively. The four time points of 2007, 2012, 2015, and 2017 are selected. The decomposition results include , which is the effect of changes in carbon intensity, denoted as ; , which is the effect of changes in input-output technology, denoted as ; and , which is the effect of changes in consumption demand, denoted as .
Structural path analysis (SPA) dissects an economy’s total emissions into various pathways within its production system, prioritizing each pathway based on its direct emissions to pinpoint the main contributors to gas emissions (Nagashima, 2018). This methodology enhances comprehension of the intricate interconnections and interdependencies among industries, shedding light on how these relationships impact the functioning of the broader economic system. It has been widely used in pathway analyses of supply chains for energy (Hong et al., 2016), pollutants (Song et al., 2020), and greenhouse gases (Liu et al., 2022). In this paper, the Leontief inverse matrix in Equation 7 is expanded using a power series approximation as Equation 10:
where represents the production sector’s environmental impact at level n. The carbon sink at the ‘node’ is the sum of the direct carbon sink of the sector at the node to meet the final demand and the carbon sink of all the sub-paths that unfold from the node. In this paper, the top ten most influential pathways are chosen to analyze key transmission pathways using SPA.
Marine carbon sinks generally consist of coastal zone and marine water carbon sinks. The coastal zone comprises the carbon sinks of mangroves, seagrass beds, and salt marshes. Marine fishery carbon sinks dominate marine water carbon sinks. As this paper focuses on consumption-pulled carbon sinks, the role of demand-pull from outside the region must be clarified. Because coastal zone carbon sinks mainly serve local environmental protection, therefore, this study mainly examines carbon sinks from water bodies, i.e., marine fisheries, focusing on carbon sinks generated by shellfish farming. The methodology is based as much as possible on the marine carbon sink methodology developed by Chinese scholars (see Table 1), considering that the relevant emission and carbon sequestration factors are more relevant to the Chinese reality (see Table 2). Data on shellfish production were mainly obtained from the China Marine Statistical Yearbook and the China Fishery Statistical Yearbook, among other yearbooks.
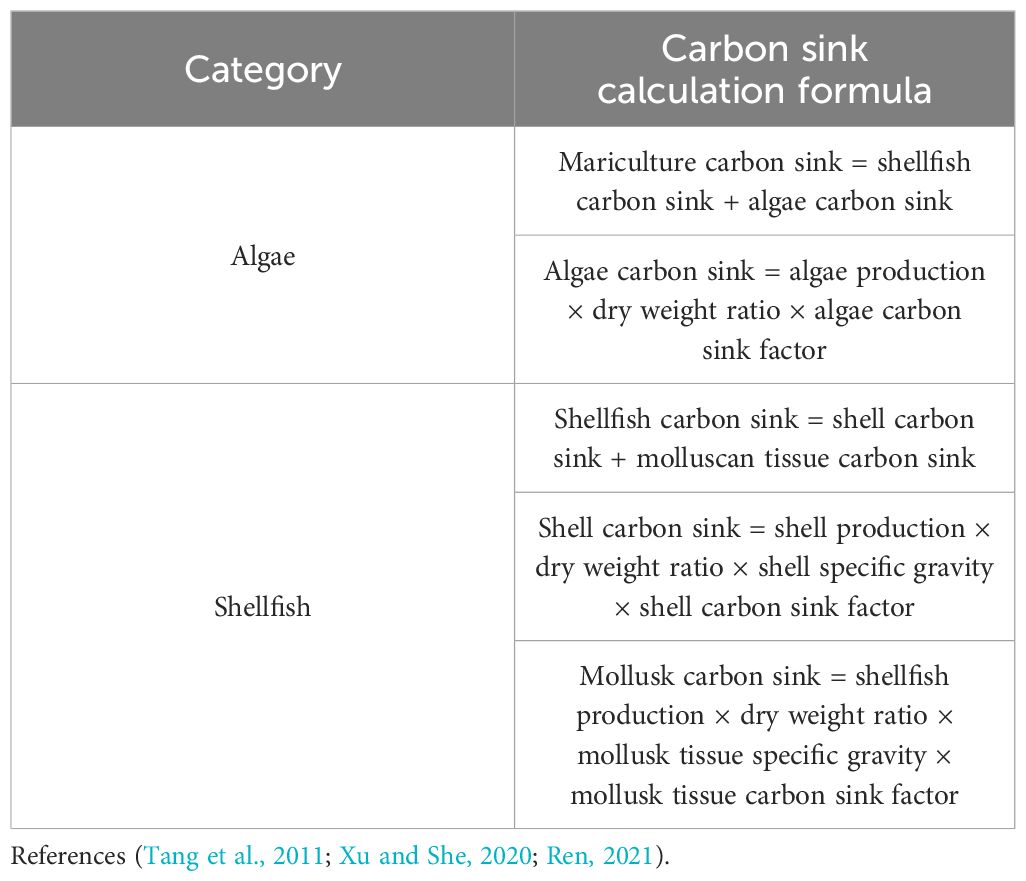
Table 1 The carbon sink calculation formula.
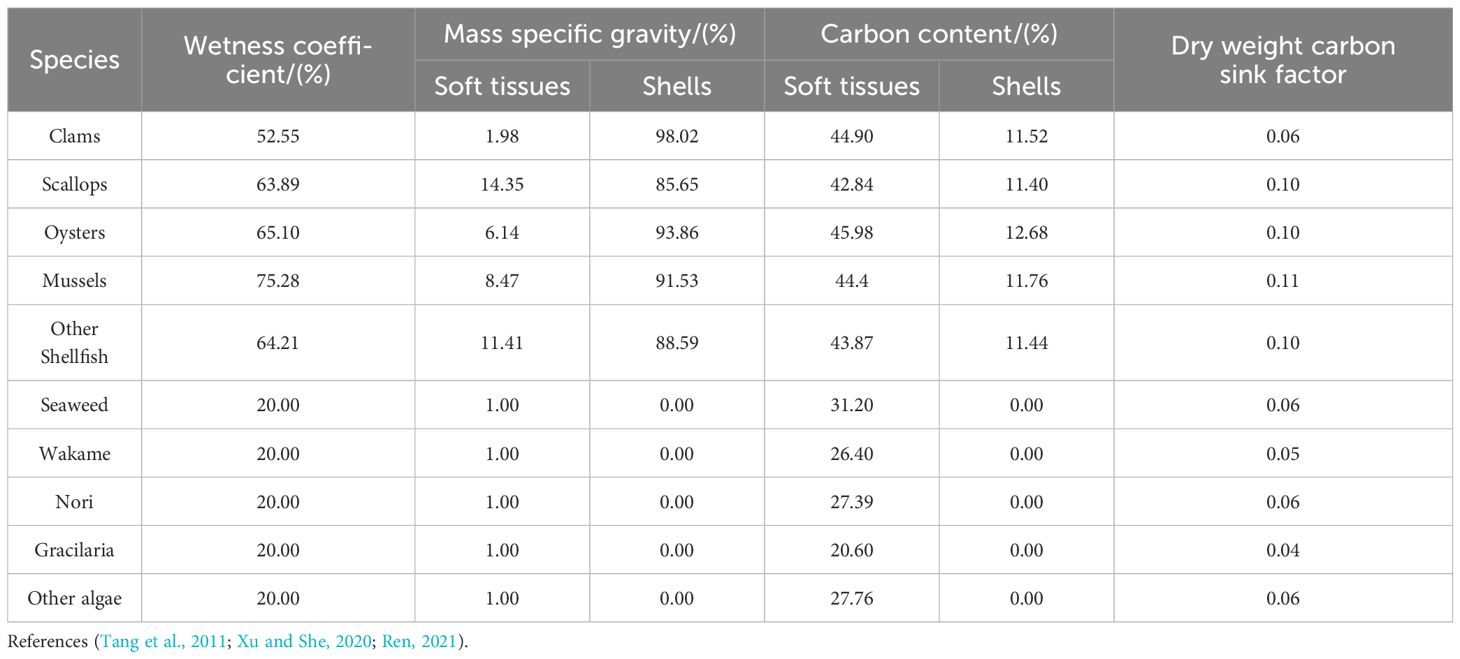
Table 2 The carbon sink factors for marine aquaculture in China.
In constructing the marine MRIO table, as a traditional multi-regional input-output table only contains land-based industries, this paper uses content analysis and synthesizes information from papers and government literature to construct a cross-reference table between the Classification of Marine Related Industries and the National Economic Classification of Industries (see Table 3). This is followed by splitting and merging the primary industries in the sector to which they correspond. The ‘value-added rate’ method (Avelino, 2017) was then used to separate twelve marine sub-sectors from the MRIO table: marine fisheries, marine oil and gas, marine mining, marine salt, marine chemical industry, marine biomedical industry, marine power, marine water utilization industry, marine shipbuilding, marine engineering construction, marine transportation, and coastal tourism. Specifically, the total value of production is broken down into components by calculating the value-added rates of these sub-sectors. From the data availability perspective, this paper transforms the traditional MRIO table of 42 sectors into 54 sectors in 31 provinces for four nodes, 2007, 2012, 2015, and 2017.
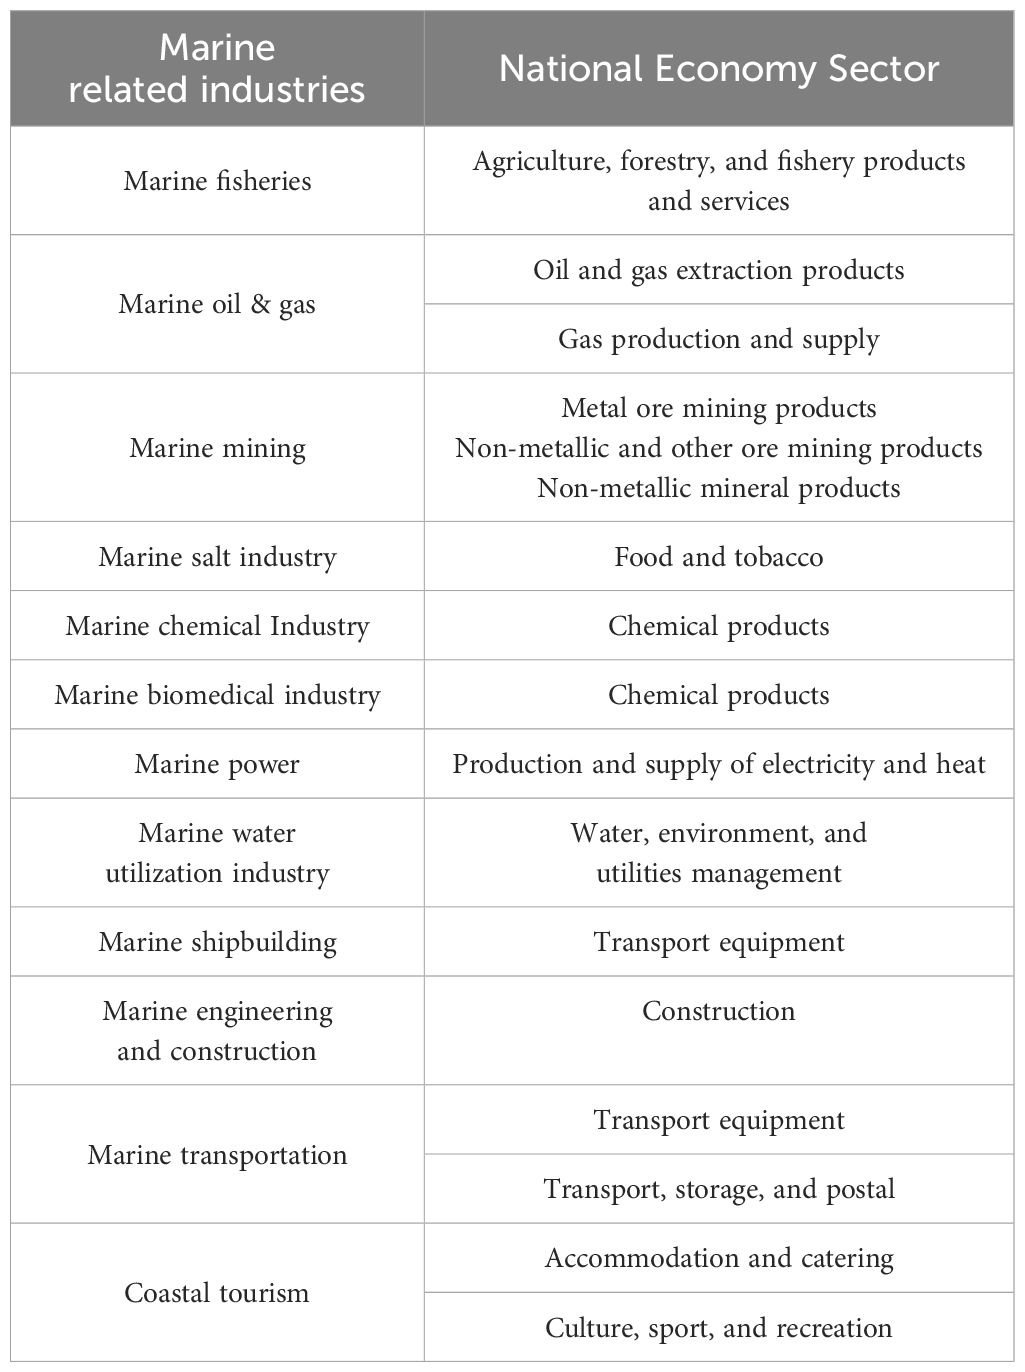
Table 3 A comparison of the classifications of marine-related industries with the national economic classification of industries.
Finally, the ocean carbon sink data is added to the ocean MRIO table as satellite data to obtain the Environmentally Extended Ocean MRIO table (EE-MRIO).
Figure 1 shows the changes in the national total ocean carbon sink from 2007-2017. Overall, China’s consumption-side ocean carbon sink capacity grew rapidly from 2007-2017, mainly due to the increase in demand for shellfish and algae and their production driven by population growth, reflecting the increased use of and reliance on marine resources for China’s economic and social development. At the same time, this growth indirectly reflects China’s efforts in rational management and conservation of marine resources and their effectiveness.
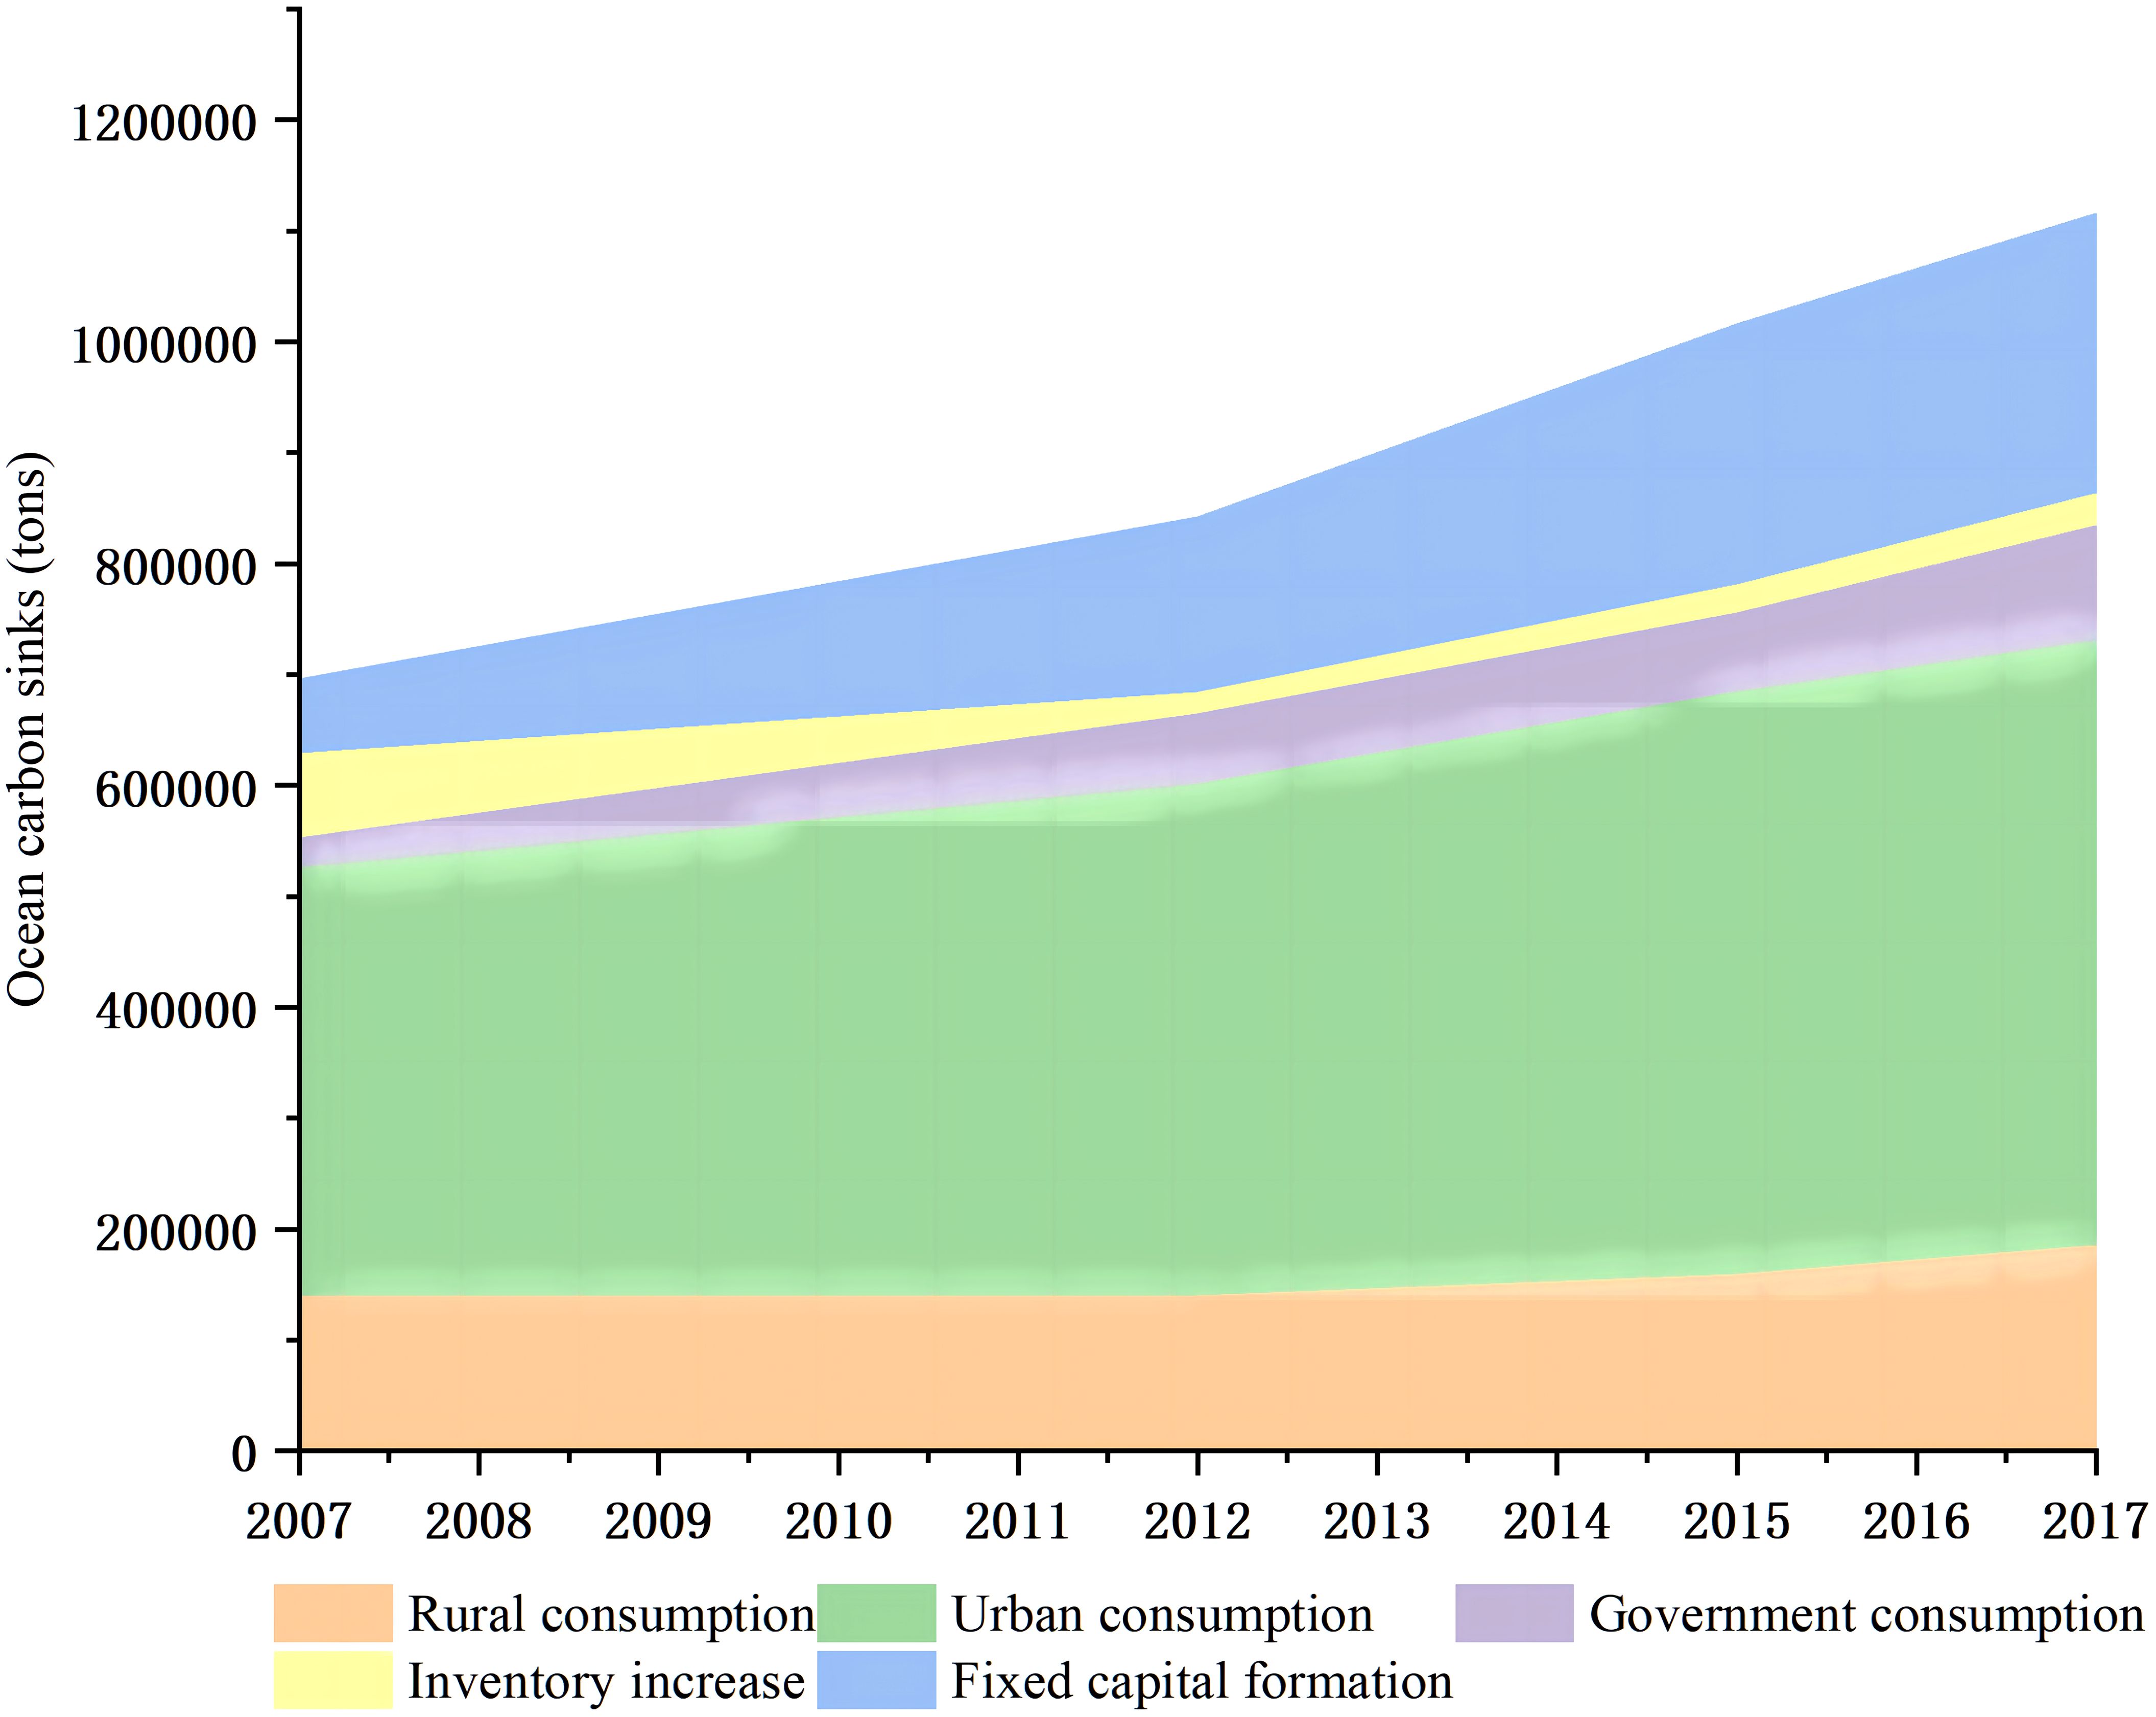
Figure 1 Total national marine carbon sinks, 2007-2017.
From a vertical perspective, China’s consumption-side marine carbon sinks capacity also grew rapidly from 2007 to 2017, increasing by 60.4%, from 695,900 tons to 1,116,000 tons. Among them, the growth in marine carbon sinks due to rural residents’ consumption demand, urban residents’ consumption demand, government consumption demand, and fixed capital formation were 32.9%, 41.0%, 294.6%, and 276.1%, respectively. This increase is mainly due to the stimulating influence of government consumption demand and fixed capital formation, which may be related to more government investment in public services and infrastructure development. In addition, ocean carbon sinks due to increased inventories have experienced a slow upward trend after plummeting by 74.9% in 2012. However, this increase was not significant, and overall, it still fell by 61.1%. This suggests that the impact of increased inventories on marine carbon sinks is unstable and may be related to factors such as market supply and demand and inventory reconciliation.
From the horizontal perspective, the average share of ocean carbon sinks capacity due to rural residents’ consumption demand, urban residents’ consumption demand, government consumption demand, inventory increase, and fixed capital formation are 16.9%, 52.3%, 7.1%, 4.1%, and 19.5%, respectively, over the four-year period. Urban consumer demand accounts for more than half of the marine carbon sinks, followed by fixed capital formation and rural consumer demand, with inventory increase resulting in the lowest capacity of marine carbon sinks. This leads to the following conclusions. (1) Urban residents’ consumption demand is the main pulling force for marine carbon sinks, potentially because urban residents consume more marine resources, such as seafood and marine tourism. (2) Fixed capital formation is the second major pulling force for marine carbon sinks, which may be related to infrastructure construction and investment in marine engineering in coastal areas. (3) Consumption demand from rural residents is the third major pulling force, which may be related to rural residents’ reliance on and protection of marine resources, such as fisheries and aquaculture. (4) Inventory increase is the weakest pulling force, likely because its impact on marine carbon sinks depends on the type and source of inventory and generally does not directly affect marine ecosystems.
Figure 2 compares ocean carbon sinks by province in 2007 and 2017. The x-axis shows the ocean carbon sinks in 2007, and the y-axis shows the ocean carbon sinks in 2017. In terms of volume, the top five provinces with the largest ocean carbon sinks due to final demand are Shandong, Fujian, Guangdong, Liaoning, and Zhejiang. Due to final demand. Coastal provinces, apart from Hainan Province, contribute relatively more to marine carbon sinks than inland provinces, with Ningxia, Qinghai, and Tibet in the inland areas contributing the least to marine carbon sinks. The final demand-driven ocean carbon sinks show a gradual decrease from coastal to inland. There are three possible reasons for this. One is that coastal areas have a higher level of economic development, and residents have more disposable income, which means they have a higher level of consumption and consume more seafood. Second, coastal residents prefer seafood, while inland residents (especially in areas such as Ningxia, Qinghai, and Tibet) prefer beef and mutton. Thirdly, the marine industry is important in coastal provinces, and transporting seafood inland is difficult and costly. Thus, compared to inland residents, residents in coastal areas consume greater quantities of seafood more economically and conveniently.
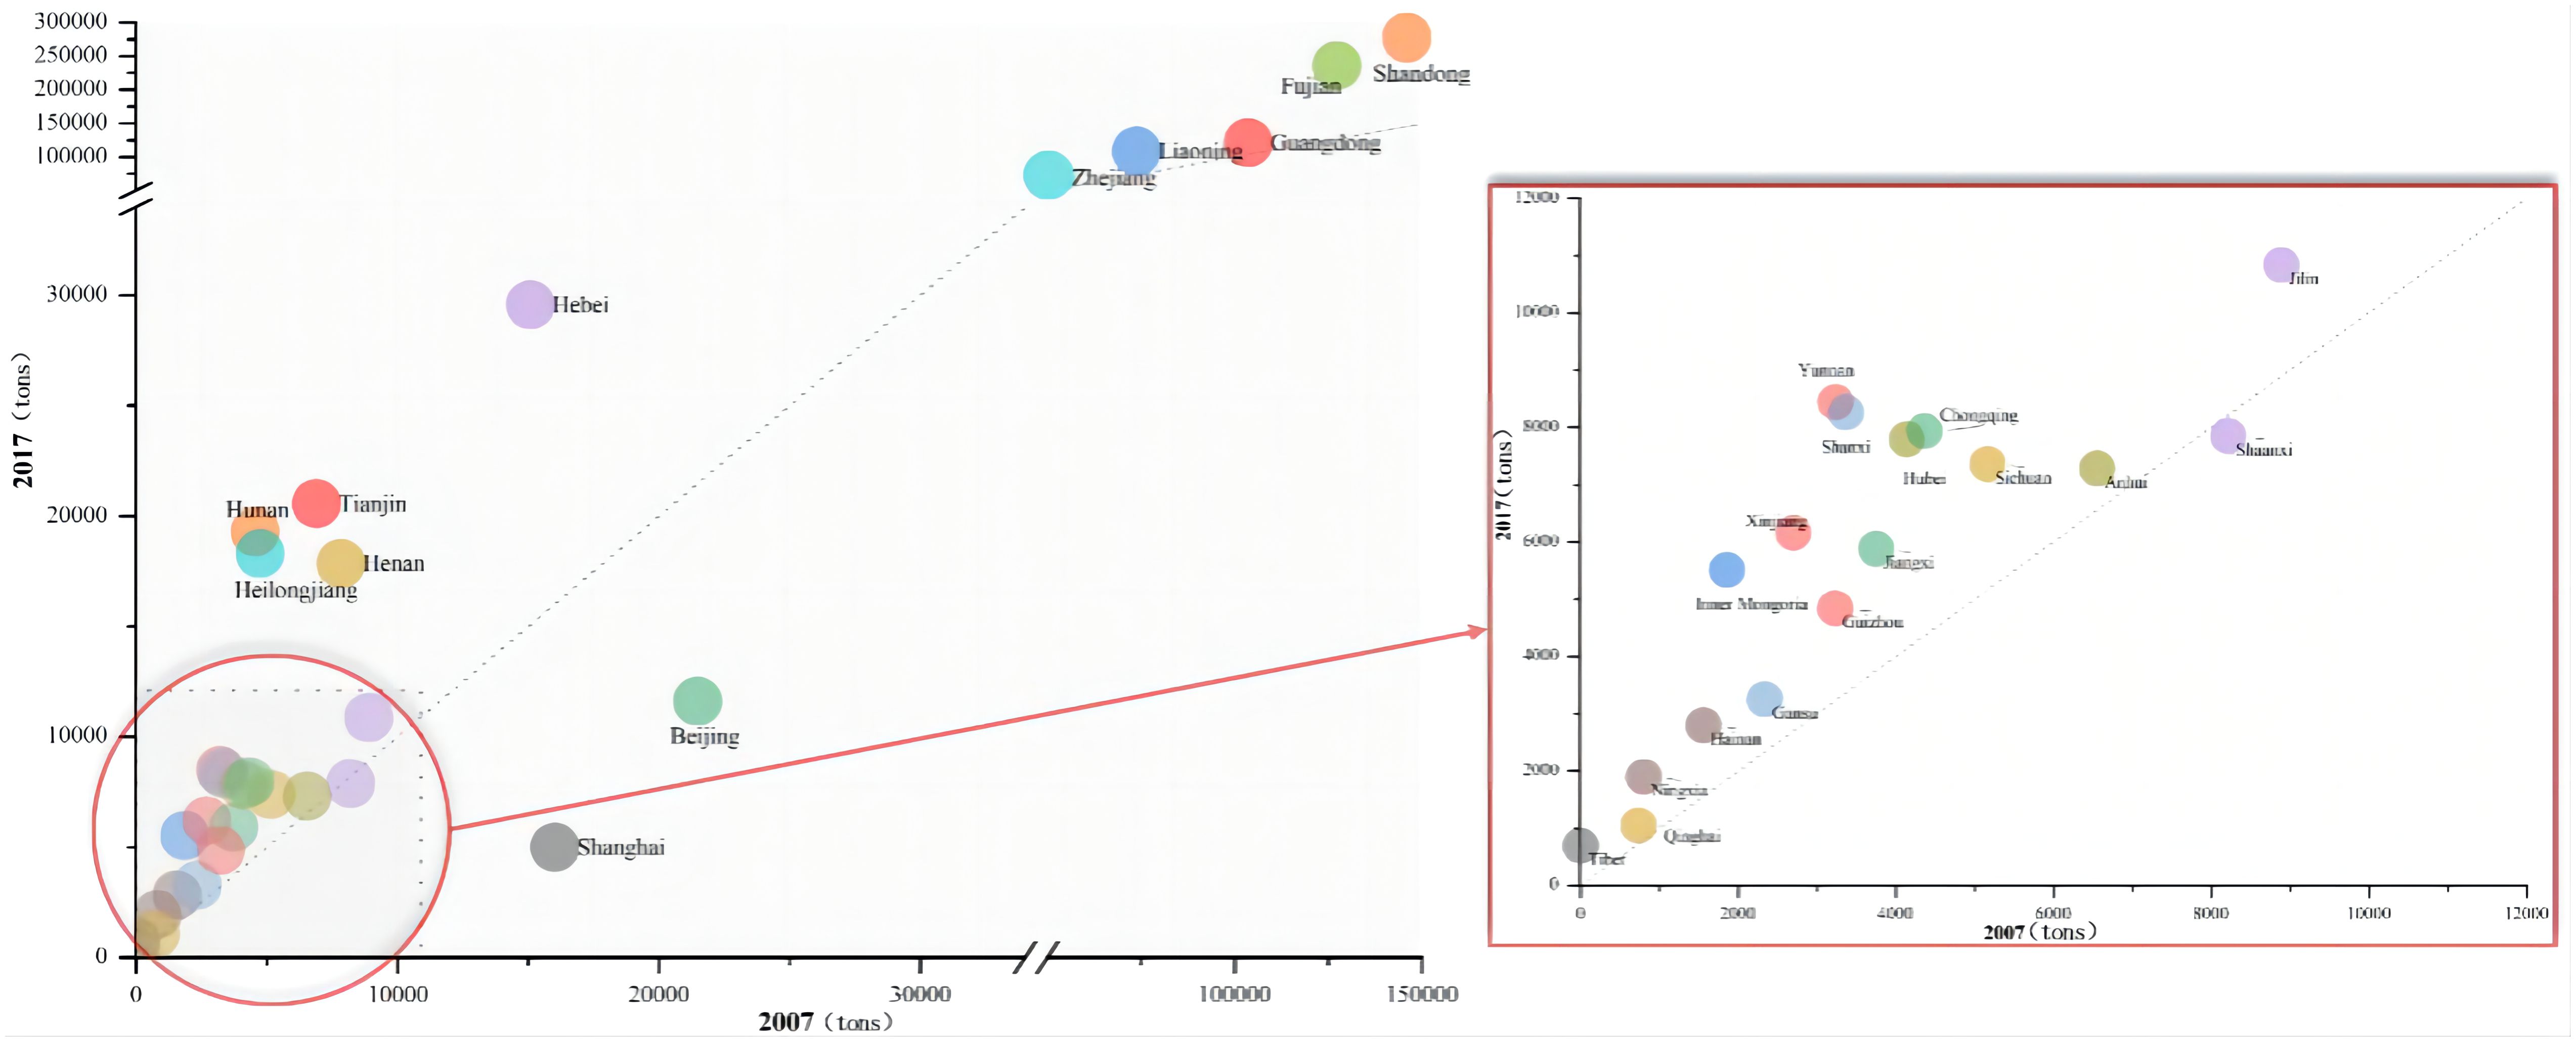
Figure 2 A comparison of demand-pulled ocean carbon sinks by province in 2007 and 2017.
In terms of the magnitude of change in carbon sinks, the vast majority of provinces saw an increase due to demand. However, three provinces, Shanghai, Beijing, and Shaanxi, experienced less demand-driven marine carbon sinks compared to 2007, with decreases of 69.02%, 46.11%, and 4.61%, respectively. A possible reason for this is that marine carbon sinks mainly comprise shellfish and algae carbon sinks. However, as the economy continues to grow, people may consume more high-end seafood, such as fish, shrimp, and sea cucumbers, which are not considered carbon sinks like shellfish; thus, this consumption pattern may reduce the contribution of marine carbon sinks. In addition, there are several other provinces where the increase in marine carbon sinks due to demand is more than 1-fold, namely Hunan (322.44%), Heilongjiang (284.66%), Tianjin (197.06%), Inner Mongolia (195.78%), Yunnan (160.76%), Shanxi (145.45%), Ningxia (134.94%), Xinjiang (127.66%), and Henan (126.74%).
Figure 3 presents the average ocean carbon sinks on the consumption side and the average proportion driven by the five types of consumption for the 31 provinces over four years. A comparison of the five types of final demand shows that three types of consumption demand (rural, urban, and government) result in a larger share of ocean carbon sinks. Guangdong Province accounts for the largest share, at 87.9%, followed by Shanghai (85.7%), Beijing (84.2%), Jiangsu (78.3%), Shandong (77.5%), Fujian (77.1%), and Liaoning (76.5%). Tibet and Jilin have the smallest proportions, accounting for 49.4% and 45.3%, respectively. This shows that coastal provinces have a larger proportion than inland provinces, mainly due to economic development levels and carbon sequestration sources. On the one hand, coastal cities tend to have relatively developed economies and high consumption demands, which drive a larger share of marine carbon sinks. In contrast, Tibet, which is inland, has a less developed economy and a sparse population, resulting in relatively low consumption demand and, therefore, a smaller proportion of ocean carbon sink driven by consumption. On the other hand, due to their geographical location, coastal cities are closer to the ocean and have a stronger culture of consumption of marine products than inland provinces. However, despite being coastal, Jilin Province has the lowest share of marine carbon sinks due to the three types of consumption demand. This is not because of low consumption demand but is rather caused by excessive fixed capital formation, such as investment in building large infrastructure such as ports, docks, and marine engineering. Thus, the three types of consumption demand have caused an increase in fixed capital investment, resulting in a lower share of marine carbon sinks.
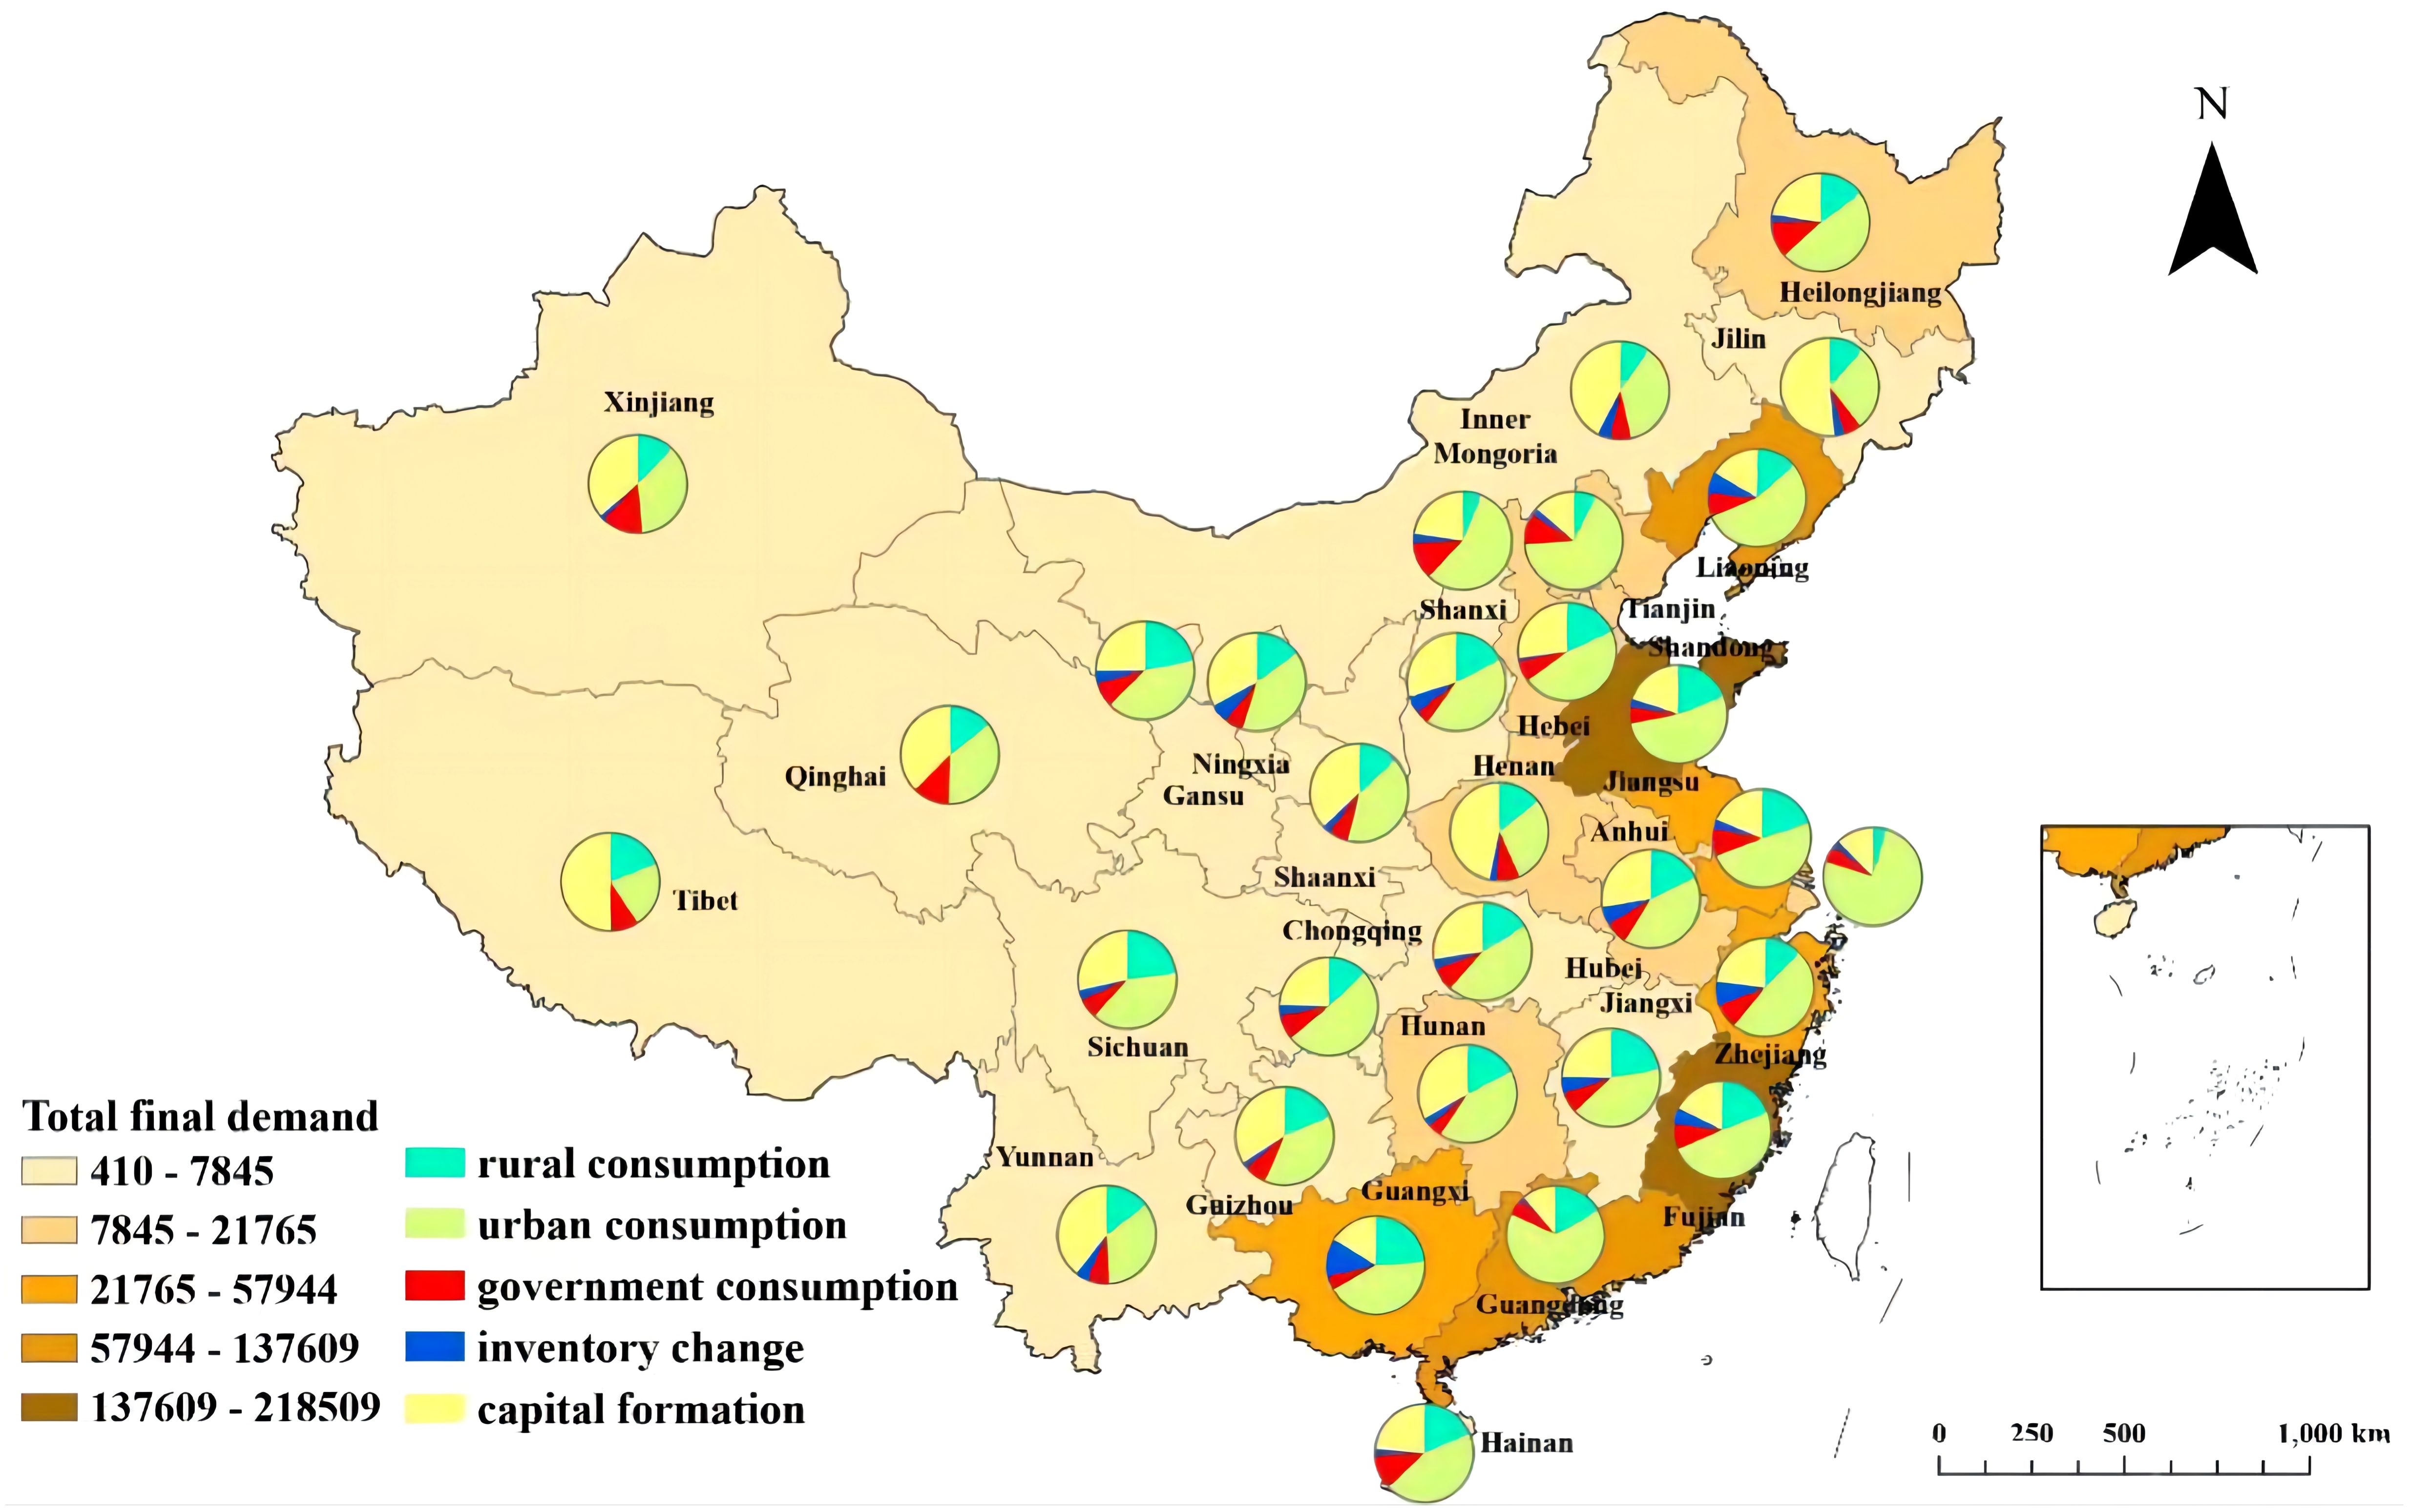
Figure 3 Marine carbon sinks by province driven by different demand types.
An internal comparison of the three types of final consumption shows that the amount of marine carbon sinks driven by urban residents’ consumption is much larger than that of rural residents. Shanghai, Tianjin, and Beijing have the largest gaps, with ratios of 17.5, 9.5, and 9.4, respectively. The ratios of most other urban and rural areas are around 2-4, and even the smallest gap in the Tibet Autonomous Region reaches 1.13 times. This difference is consistent with the actual development situation and is related to the local urbanization rate and the income gap between urban and rural areas.
Figure 4 shows the transfer of ocean carbon sinks due to total final demand and the five sub-divisions of final demand. From the perspective of an outward transfer, Figure 4A shows that the main coastal provinces from which China’s marine carbon sinks are transferred out are Liaoning (29,000 tons, accounting for 23.14%), Fujian (22,600 tons, accounting for 18.05%), and Shandong (19,300 tons, accounting for 15.42%). By exporting marine carbon sinks, net-exporting provinces are in effect providing ecological services to other provinces, but this may also put pressure on local marine ecosystems. These provinces need to find a balance between economic development and ecological protection to ensure the sustainable use of marine resources. As shown in Figure 4B, Liaoning’s urban residents’ consumption demand and government consumption demand are the main reasons for its carbon sink transfer. For Fujian, urban residents’ consumption demand and fixed capital formation are the main reasons for its carbon sink diversion. For Shandong, the increase in inventories causes the transfer of carbon sinks.
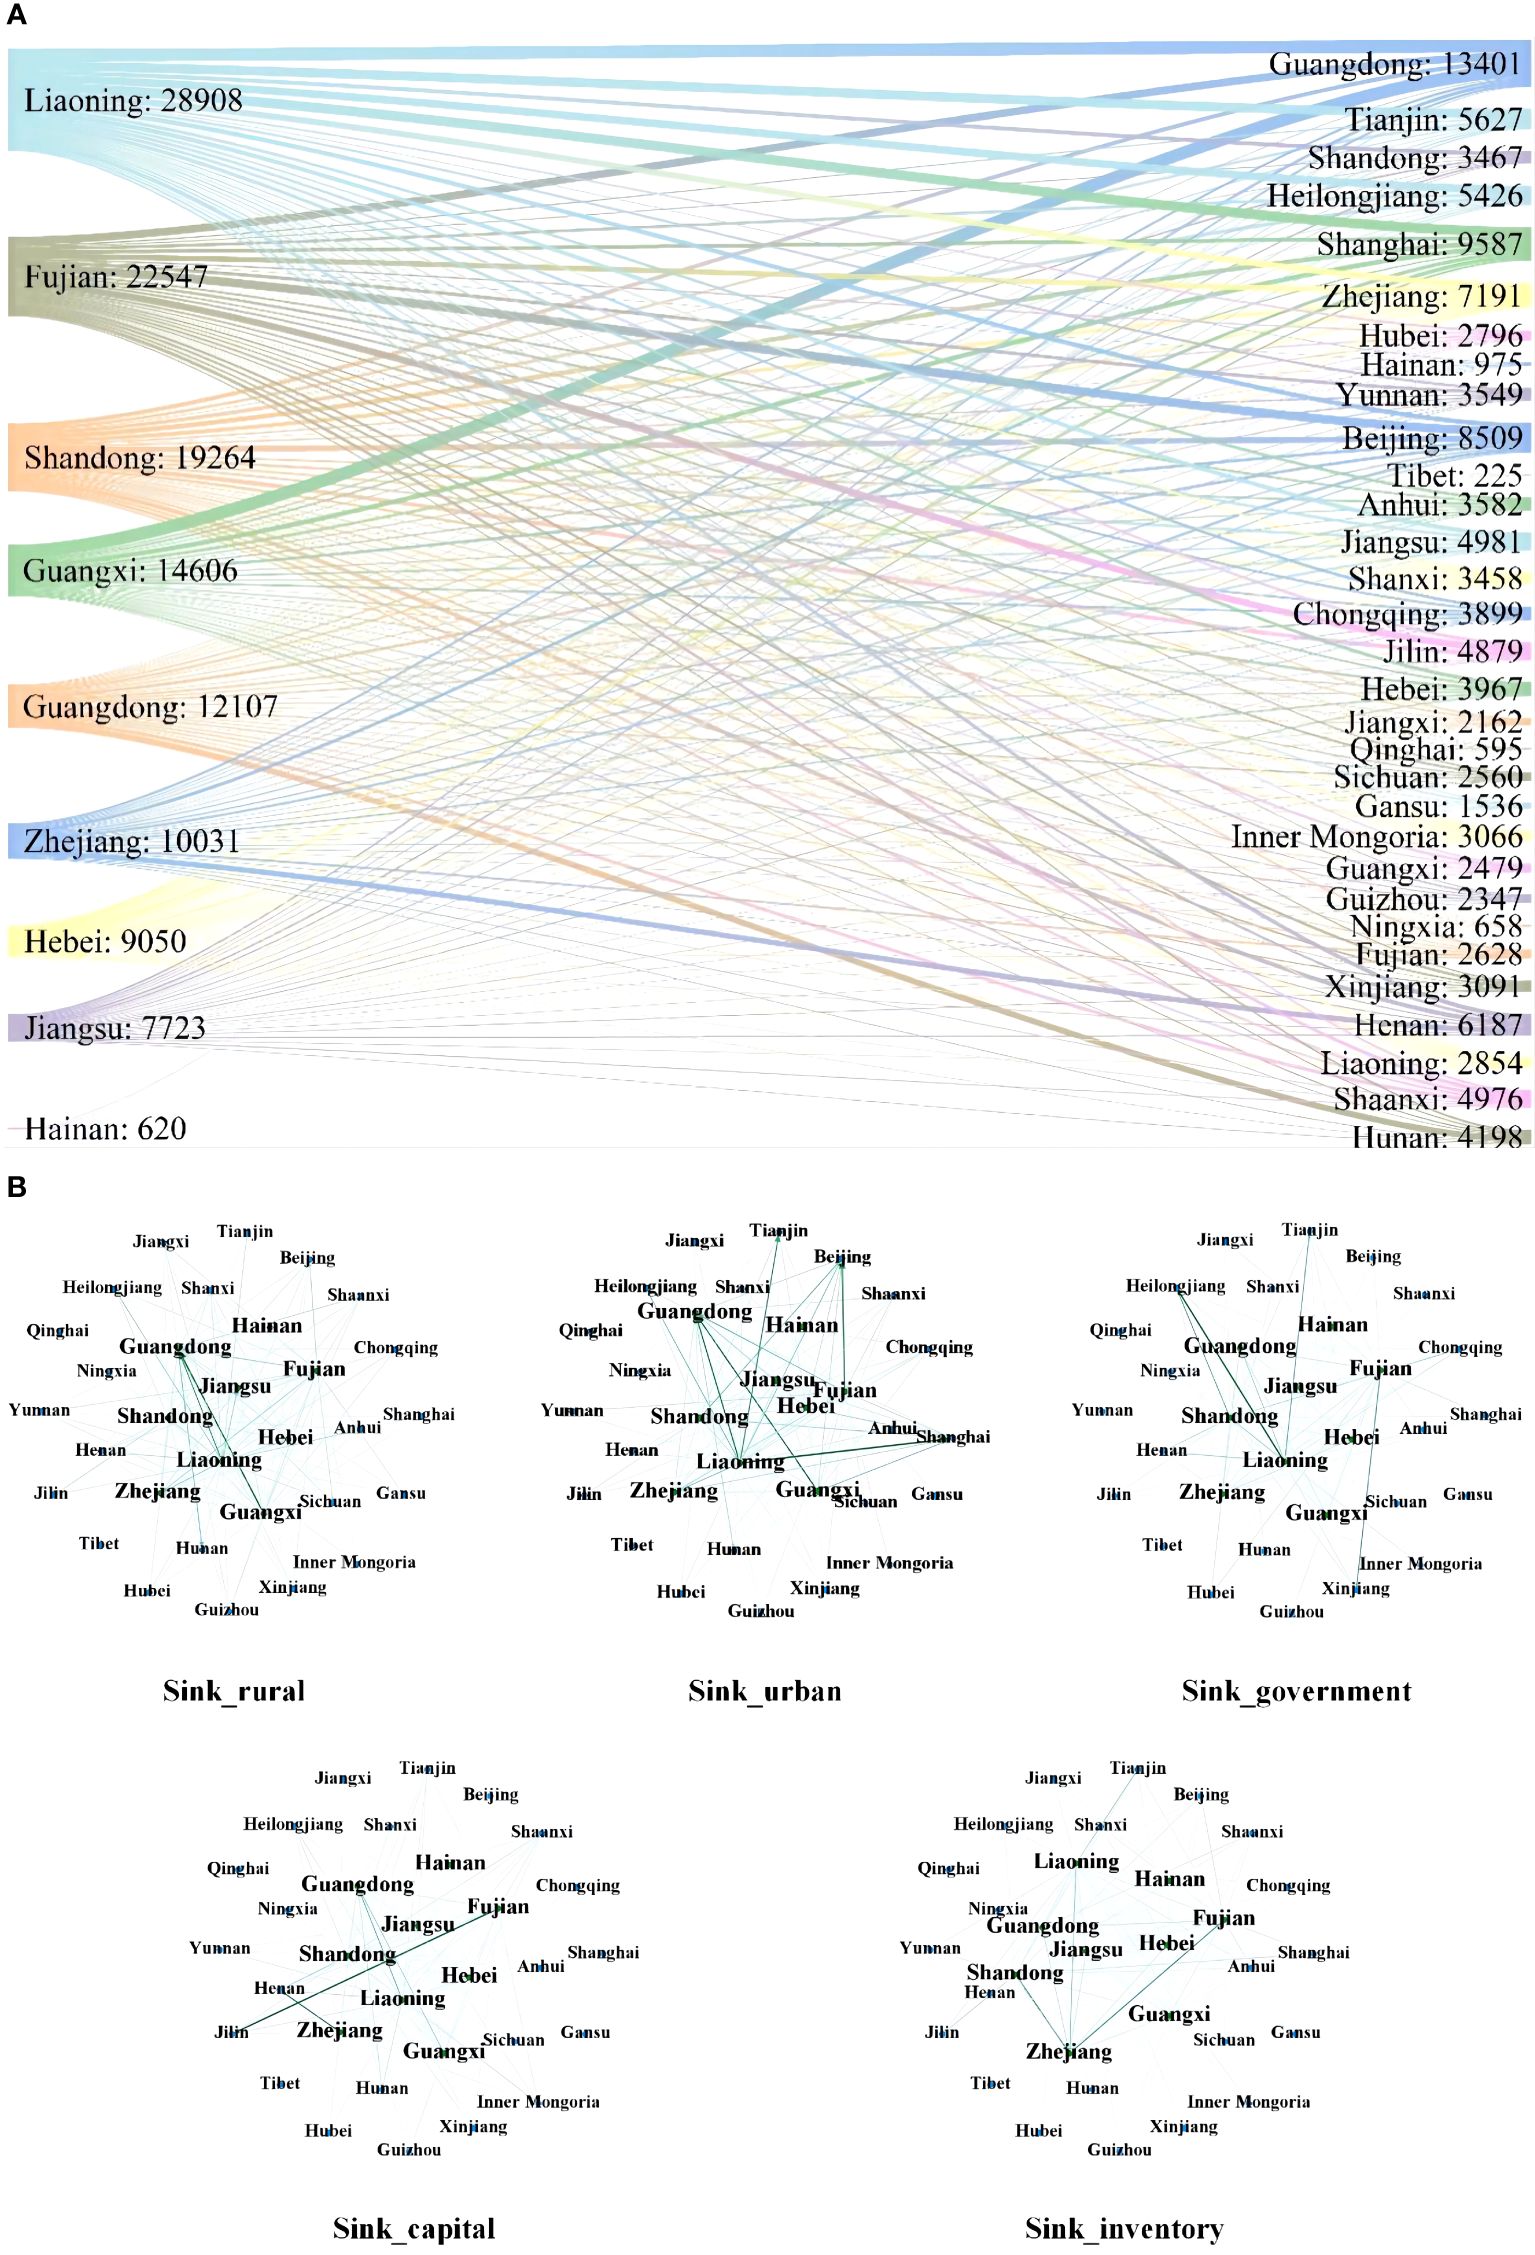
Figure 4 Transfer of marine carbon sinks in China. (A): The transfer of ocean carbon sinks due to total final demand (four-year average across regions)in tons. (B): Carbon sink transfer due to the five final demands.
From the perspective of an inward transfer, Figure 4A shows that the main provinces to which China’s marine carbon sinks are transferred are Guangdong (13,400 tons, accounting for 10.72%), Shanghai (9,600 tons, accounting for 7.67%), Beijing (8,500 tons, accounting for 6.81%), Zhejiang (7,200 tons, accounting for 5.76%), Henan (6,200 tons, accounting for 4.95%), Tianjin (5,600 tons, accounting for 4.5%), and Heilongjiang (5,400 thousand tons, accounting for 4.34%). By transferring marine carbon sinks from other provinces, net-importing provinces are able to alleviate the pressure on local marine ecosystems to a certain extent, which is conducive to the protection and restoration of the marine ecosystem. Figure 4B shows that Guangdong’s carbon sink sources are mainly caused by rural and urban residents’ consumption demands. Zhejiang’s main carbon sink source is inventory accumulation. For Shanghai, Beijing, and Tianjin, the main source of their carbon sinks is urban residents’ consumption demands. For Henan, carbon sinks are primarily from fixed capital formation. Heilongjiang’s carbon sinks result from government consumption demands.
Overall, among the nine coastal provinces, Hainan and Guangdong are in net import positions in terms of carbon sink transfer. Of these, 47.8% of Hainan’s carbon sink transfer is due to the increased consumption demand of urban residents. The remaining seven coastal provinces are in a net export position. This pattern reflects the differences in the use of marine resources and ecological protection among China’s provinces, and reveals the need to strengthen interregional cooperation and coordination to jointly promote the sustainable use of marine resources.
Figure 5 shows the SDA decomposition of the change in ocean carbon sinks from 2007-2017. Overall, the increase in consumption level (F) is the primary driving force behind the growth of ocean carbon sinks, leading to an increase of 67.9%(year 2007-2012), 14.9%(year 2012-2015), and 14.5%(year 2015-2017), respectively. This is mainly because as the Chinese economy has rapidly developed, consumption of marine products has gradually increased, leading to a continuous expansion of consumption-side ocean carbon sinks.
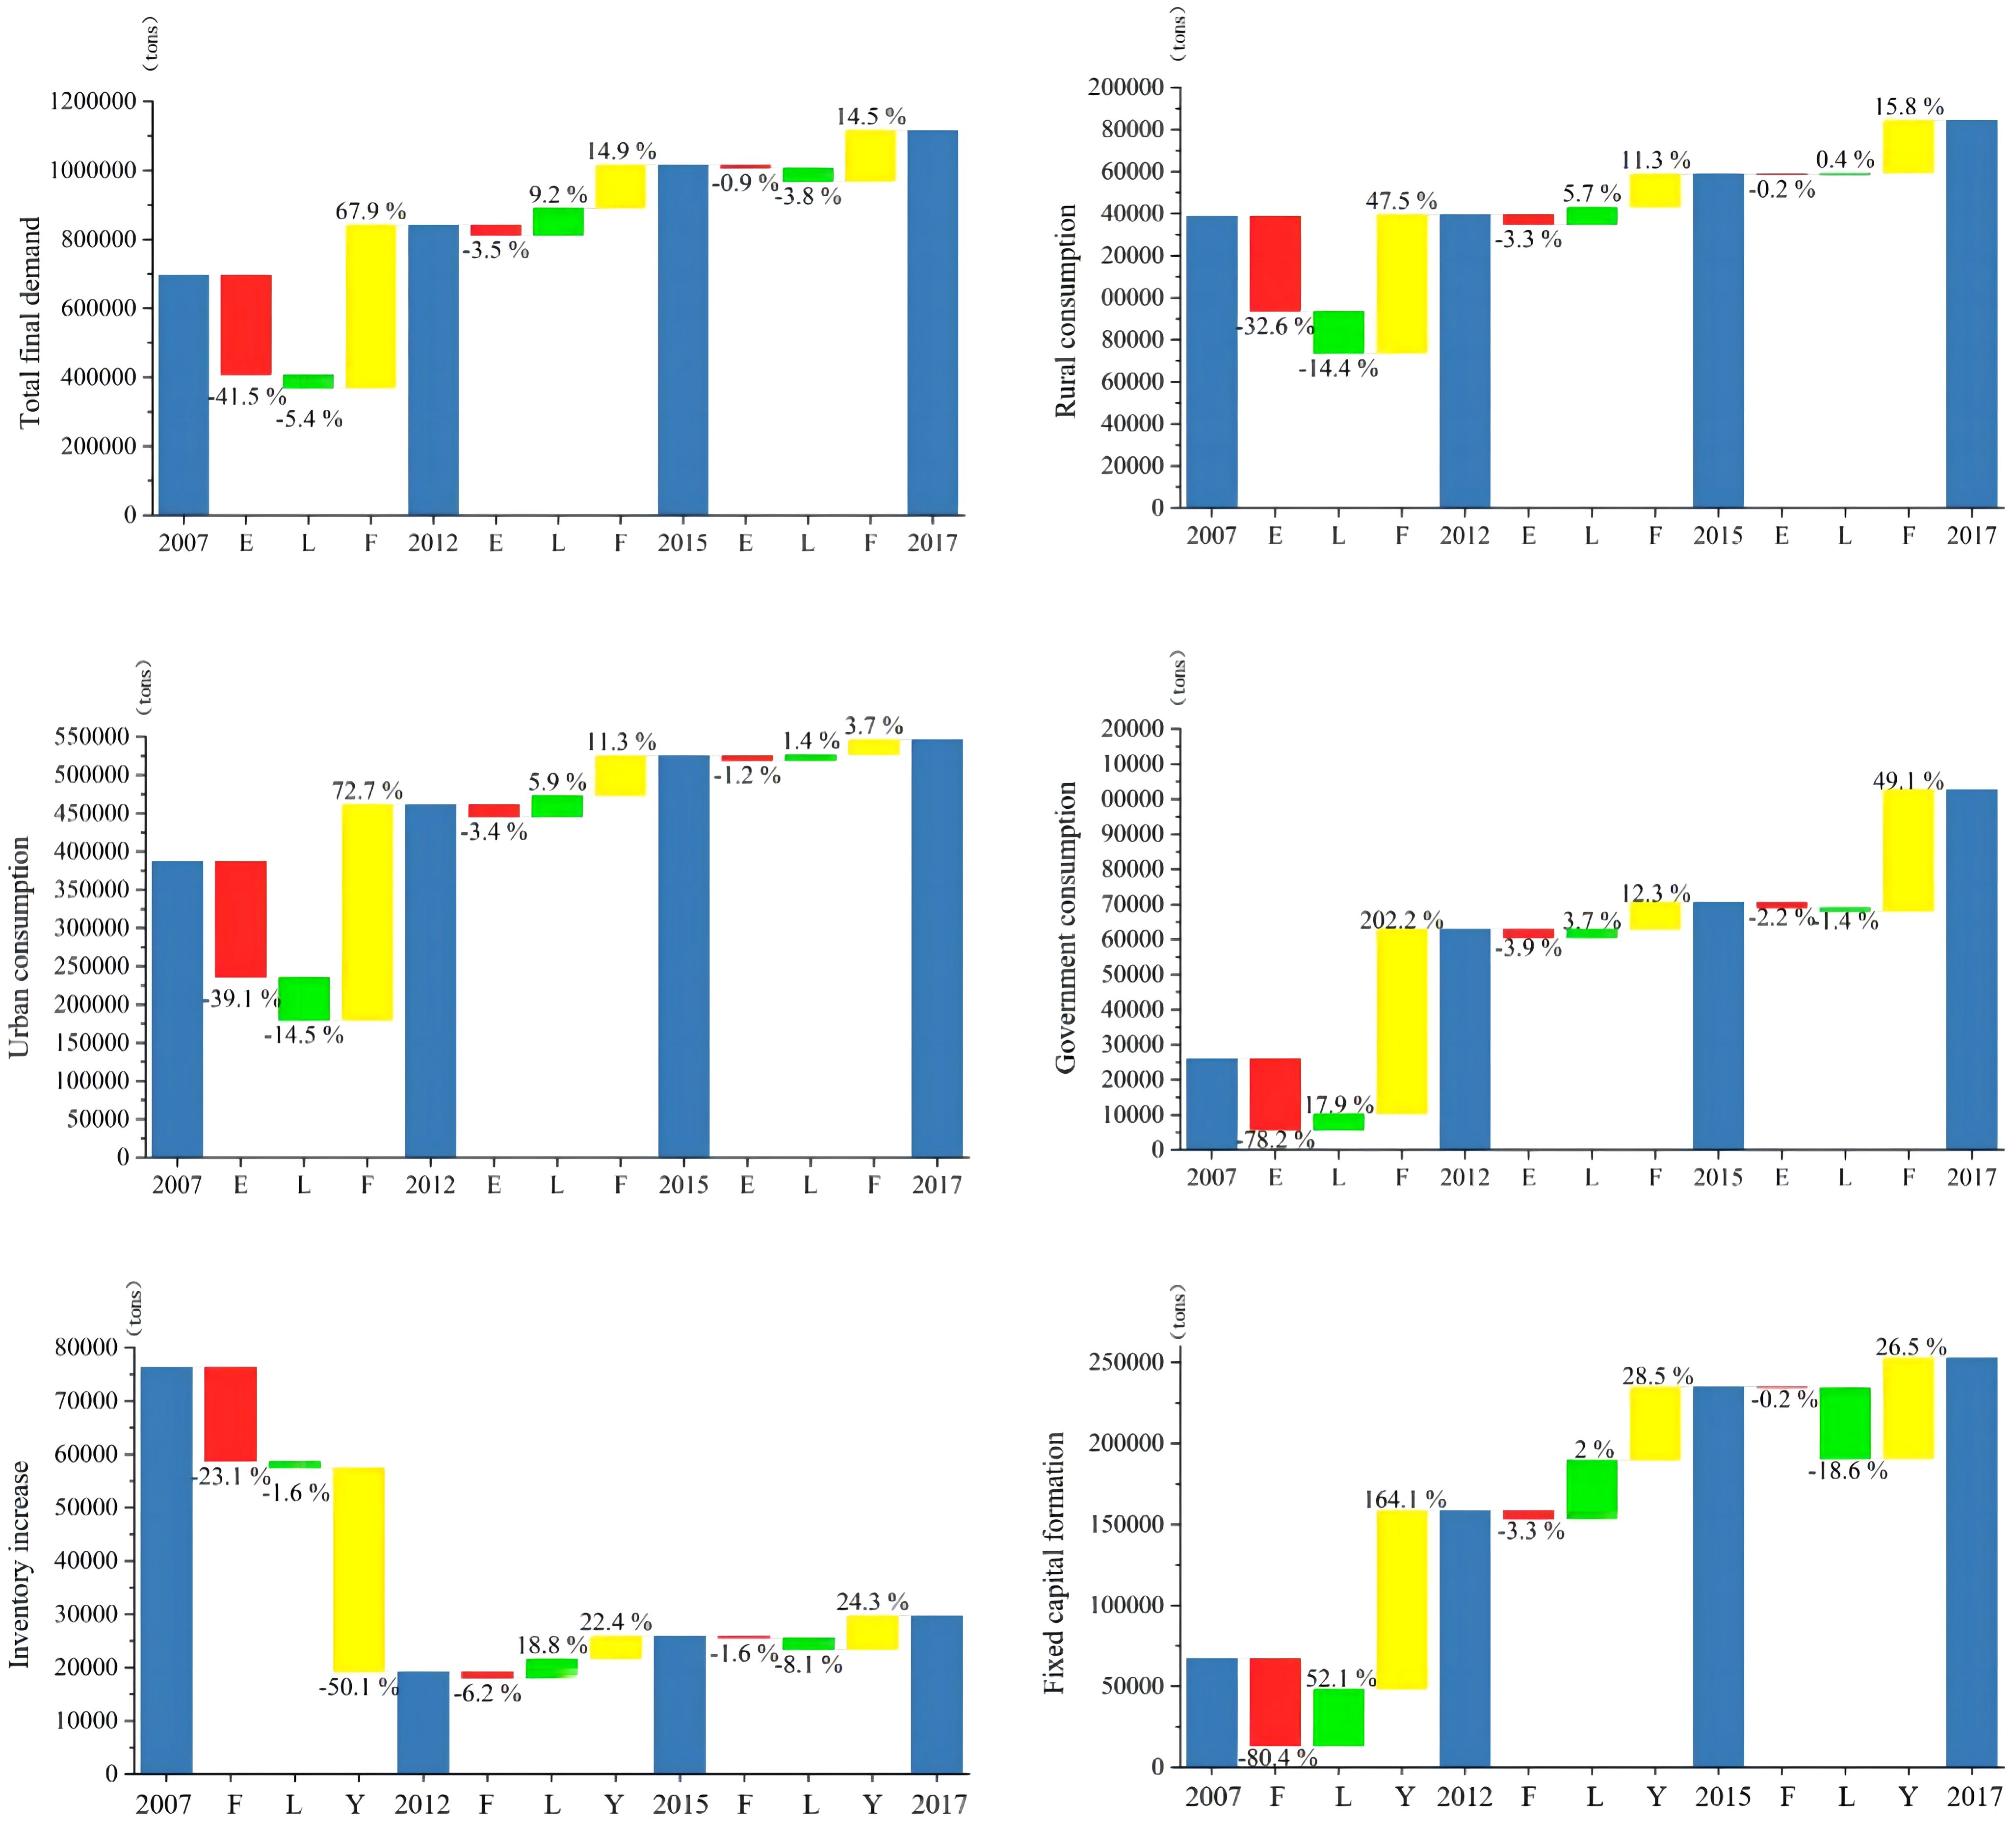
Figure 5 SDA decomposition of changes in ocean carbon sinks, 2007-2017.
The input-output effect (L) reflects the interdependence of different sectors within the economic system and the circulation and consumption of intermediate products in the production process. It has resulted in changes of -5.4%(year 2007-2012), 9.2%(year 2012-2015), and -3.8%(year 2015-2017), respectively, in ocean sinks. Its impact on marine carbon sinks is weak and irregular. This is mainly because China’s marine carbon sink construction is still in the exploratory stage. It has only been since 2012 that China has gradually called attention to the function of blue carbon sinks in the ocean. After 2015, requirements for the construction of ocean carbon sinks began to appear in the national-level policy system. This has led to insufficient investment in technological improvements and innovation in marine carbon sink products across industries and a lack of strong technological linkages.
The carbon sink intensity effect (E) is the main factor inhibiting the growth of ocean carbon sinks from the consumption side. It offsets most of the increase in these sinks due to higher levels of final demand, resulting in a decrease of 41.5%(year 2007-2012), 3.5%(year 2012-2015), and 0.9%(year 2015-2017) in ocean carbon sinks, respectively. This is mainly because the sinks in this context refer to shellfish consumption. However, as consumption continues to escalate, the structure of Chinese consumers’ demand for marine products is changing. More consumers are turning to higher-end marine products such as salmon, shrimp, and crab, which cannot generate ocean carbon sinks. The proportion of shellfish and algae consumption, which can produce marine carbon sinks, is declining. In addition, the dampening effect of carbon sink intensity is decreasing, as the Chinese government has focused on guiding consumers towards consuming eco-friendly seafood products such as shellfish and algae in recent years.
The transfer pathways of marine carbon sinks in fact depict how carbon sinks generated by marine industries “flow” or “transfer” to other industries in response to various types of consumer demand. Such transfers reveal not only the economic ties between the fisheries industry and other industries, but also their interdependence. Table 4 presents the top ten key pathways for the transfer of marine carbon sinks between regional industries in terms of the different final demands. Combining urban and rural consumption demand, the key pathways for carbon sink transfer are mainly to the food and tobacco industries. For government consumption demand, carbon sinks are primarily transferred to water conservancy, environment and public facilities management, and coastal tourism. For inventory-raising demand, the key transfer pathway is mostly to the food and tobacco industries, i.e., marine fisheries meet the stock-raising demand of the food and tobacco sectors, either directly or indirectly, which in turn meets the regional inventory-raising demand. For capital formation demand, the key transfer pathways are mainly in the processed wood products and furniture sectors, as capital investments in fisheries to increase production capacity, such as the purchase of new equipment and the construction of infrastructure, lead to the development of the wood-processing and furniture sectors, which provide the necessary tools and materials for production.
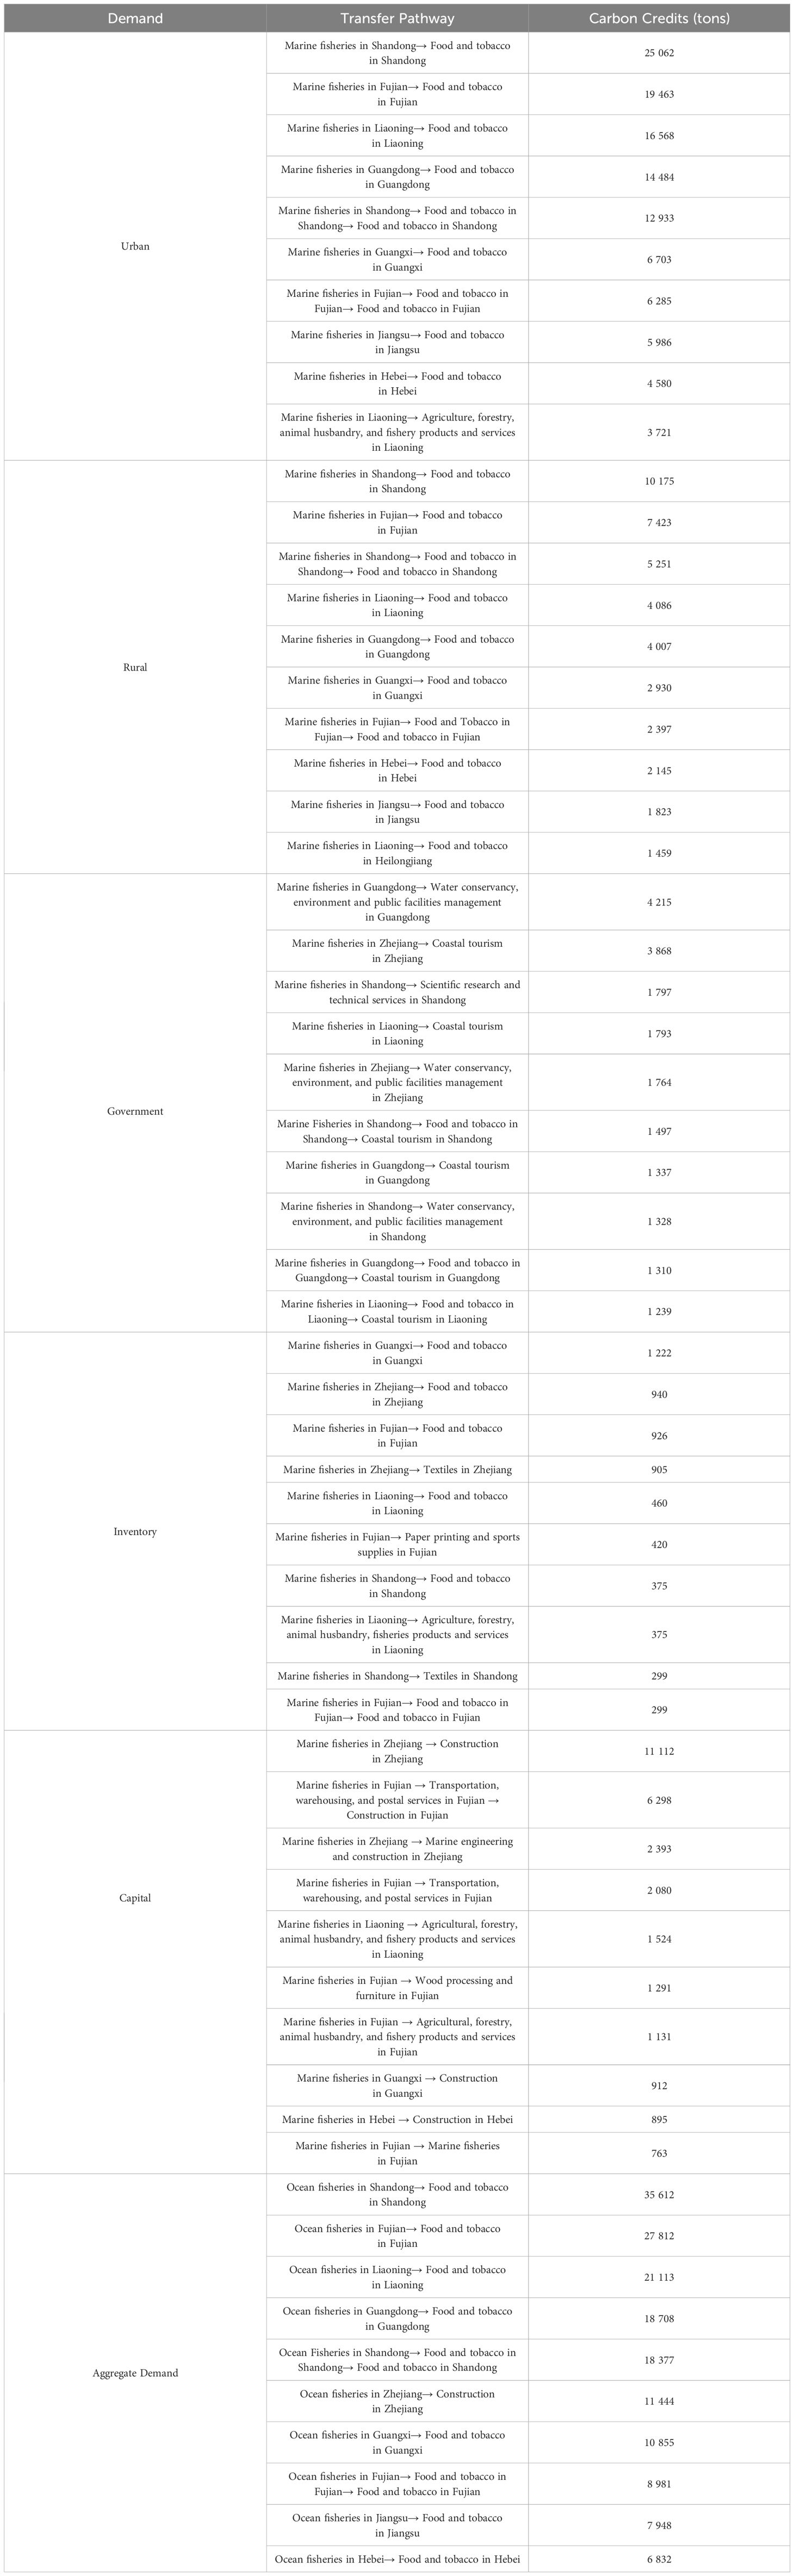
Table 4 Top ten important pathways.
A comparison of the top 450 key pathways for total final demand for carbon sinks shows that the food and tobacco sectors appear most frequently and have the largest values in the primary pathway for carbon sinks from marine fisheries, totaling 104 times and a massive 212,800 tons. This indicates that the provinces have the highest amount of carbon sinks from marine fisheries to meet demand from the food and tobacco sectors. The agriculture, forestry, and fishery products and services sector and the wood processing products and furniture sector are the next highest. This also holds true for the secondary transfer pathways.
Finally, the carbon sequestration within marine fisheries in the province is considerably greater than the carbon sequestration outside of it, in order to meet the final demand, largely attributed to their distinct mix of marine resources, economic development, consumption habits, industrial setups, and geographical location. These factors together affect the development path of marine fisheries and the direction of carbon transfer. In order to achieve the goal of sustainable development, we need to take these factors into account and formulate reasonable policies and measures to promote the green and low-carbon development of marine fisheries. Through the development of a domestic macro-cycle and the establishment of stronger industries and supply chains, we can make better use of marine resources and promote a win-win situation for both economic growth and environmental protection.
Based on the above research, this paper calculates China’s ocean carbon sinks from the consumption side by constructing an EE-MRIO model, analyzing the transfer of carbon sinks caused by various demands, and decomposing the influencing factors and structural paths. The main conclusions are as follows:
(1) From 2007 to 2017, China’s ocean carbon sink from the consumption side showed a rapid growth trend, increasing by 60.4%, from 695.9 thousand tons to 1.116 million tons.
(2) Among the five types of final demand, urban residents’ consumption demand is an important driving force for the growth of ocean carbon sinks, accounting for 52.3% of total demand. Moreover, compared to inland provinces, economically developed coastal provinces have a larger share of ocean carbon sinks driven by consumption.
(3) Of the coastal provinces, Hainan and Guangdong are in a net input state in terms of carbon transfer, and the remaining seven coastal provinces are in a net output state, which reflects the differences in the use of marine resources and ecological protection, and highlights the need for cross-regional cooperation to promote the sustainable use of marine resources.
(4) Among the factors affecting the changes in ocean carbon sinks, the growth of consumption demand is the main promoting factor, and its impact is far greater than the sum of the carbon intensity effect and the input-output technology effect.
(5) From the perspective of the structural pathway of carbon sink transmission, ocean fisheries have the highest carbon sink amount to meet the demands of the food and tobacco sector, the agricultural and forestry products and service industry, and the wood processing and furniture industry. The ocean fishery also has a significantly higher carbon sink amount to meet the final demand within the province than outside the province.
Based on the above results, we propose the following policy suggestions:
(1) China should increase the proportion of seafood consumption and vigorously develop marine aquaculture. At present, the increase in consumption demand is the main reason for the growth of ocean carbon sinks, but inland provinces’ consumption is significantly lower than that of coastal provinces. Compared with land-based food, most marine products have higher nutritional density and can reduce greenhouse gas emissions. To achieve a green and low-carbon economy, reduce carbon emissions, and tap the potential of blue carbon sinks, China should actively optimize its logistics network and upgrade cold-chain logistics technology to ensure the freshness and quality of seafood during long-distance transport. At the same time, it should establish stable supply chain partnerships between inland regions and major seafood production areas, and develop new types of marine products to meet diversified consumer demand. Against the background of the “all-encompassing approach to food”, the government should encourage farmers to invest in carbon sinks fisheries through multiple channels and actively develop offshore fisheries to ensure a stable supply of seafood.
(2) China should strengthen the coordination of land-sea industries and promote the circulation of marine carbon sinks. Currently, the transfer of marine carbon sinks in China mainly satisfies the final demand within a province, and there is little effect from inter-regional consumption. Meanwhile, technological factors among industries have weakly influenced the promotion of carbon sink increases over the past decade. Efforts should be made to accelerate establishing a marine fishery carbon sink trading platform, explore constructing carbon sink fishery demonstration bases and carbon trading pilots, and facilitate in-depth linkage and technological innovation between the marine and terrestrial industries through policy guidance and market mechanisms. By relying on the coupling and interaction between marine and land-based industries, the transfer of marine carbon sinks can be promoted across the country, and the domestic circulation of marine carbon sinks can be advanced.
(3) China should expand the seaweed industry chain and implement full-chain carbon sink management. Currently, the downstream industries of marine carbon sinks mainly include food and tobacco, agriculture, forestry, animal husbandry, and fishery products and services, as well as wood processing and furniture. The overall industry chain is short, and its high-end development is weak. Therefore, there should be increased investment and research in high-end areas of the seaweed industry. By directing capital and technology towards deep processing of seaweeds and developing high value-added products, not only can the industrial chain be extended, but the overall competitiveness of the industry can also be enhanced. As consumption continues to shift to higher value-added industries such as fish, shrimp, and sea cucumber, which cannot produce carbon sinks, marine carbon sinks will likely decline if the breadth of the seaweed industry chain cannot be further improved. It is recommended that the Government introduce relevant policies to encourage and support the diversification of the seaweed industry, particularly in enhancing carbon sinks. For instance, a special fund could be established to support research, development, and innovation in seaweed farming technology to enhance the carbon sequestration capacity of seaweeds. Furthermore, ‘carbon credits’, ‘blue carbon trading’, and other green financial behaviors should be further promoted. This will support enterprises’ low-carbon transformation and encourage the high-quality development of China’s entire industrial system.
The original contributions presented in the study are included in the article/supplementary material. Further inquiries can be directed to the corresponding author/s.
YL: Conceptualization, Writing – original draft. CD: Data curation, Writing – original draft. PJ: Software, Validation, Writing – original draft. YW: Writing – review & editing. KW: Project administration, Software, Writing – review & editing.
The author(s) declare financial support was received for the research, authorship, and/or publication of this article. The research is supported by the grants from National Social Science Fund of China project “Research on net carbon emission accounting, impact mechanism and policy simulation of China’s marine industry under the new development pattern” (NO. 22BGL200).
The authors declare that the research was conducted in the absence of any commercial or financial relationships that could be construed as a potential conflict of interest.
All claims expressed in this article are solely those of the authors and do not necessarily represent those of their affiliated organizations, or those of the publisher, the editors and the reviewers. Any product that may be evaluated in this article, or claim that may be made by its manufacturer, is not guaranteed or endorsed by the publisher.
Aldama-Campino A., Fransner F., Ödalen M., Groeskamp S., Yool A., Döös K., et al. (2020). Meridional ocean carbon transport. Global Biogeochem. Cycles 34, e2019GB006336. doi: 10.1029/2019GB006336
Alleway H. K., Gillies C. L., Bishop M. J., Gentry R. R., Theuerkauf S. J., Jones R. (2019). The ecosystem services of marine aquaculture: valuing benefits to people and nature. BioScience 69, 59–68. doi: 10.1093/biosci/biy137
Avelino A. F. T. (2017). Disaggregating input–output tables in time: The temporal input–output framework. Econ. Syst. Res. 29, 313–334. doi: 10.1080/09535314.2017.1290587
Chen J., Lin Y., Wang X., Mao B., Peng L. (2022). Direct and indirect carbon emission from household consumption based on LMDI and SDA model: A decomposition and comparison analysis. Energies 15, 5002. doi: 10.3390/en15145002
Chen X., Lv S., Shang W. L., Wu H., Xian J., Song C. (2024). Ship energy consumption analysis and carbon emission exploitation via spatial-temporal maritime data. Appl. Energy 360, 122886. doi: 10.1016/j.apenergy.2024.122886
Chmura G. L. (2013). What do we need to assess the sustainability of the tidal salt marsh carbon sink? Ocean Coast. Manage. 83, 25–31. doi: 10.1016/j.ocecoaman.2011.09.006
Doney S. C., Bopp L., Long M. C. (2014). Historical and future trends in ocean climate and biogeochemistry. Oceanography 27, 108–119. doi: 10.5670/oceanog
Feng J. C., Sun L., Yan J. (2023). Carbon sequestration via shellfish farming: A potential negative emissions technology. Renewable Sustain. Energy Rev. 171, 113018.
Gao L., Zheng Y., Yang D., Zhu L., Li S., Jin H. (2021). Criterial equation of carbon neutrality for power systems. Kexue Tongbao/Chinese Sci. Bull. 66, 3932–3936. doi: 10.1360/TB-2021-0509
Greer K., Zeller D., Woroniak J., Coulter A., Winchester M., Palomares M. D., et al. (2019). Global trends in carbon dioxide (CO2) emissions from fuel combustion in marine fisheries from 1950 to 2016. Mar. Policy 107, 103382. doi: 10.1016/j.marpol.2018.12.001
Gregor L., Gruber N. (2020). Global carbon budget 2020. Earth Sys. Sci. Data 12, 3269–3340. doi: 10.5194/essd-12-3269-2020
Gruber N., Clement D., Carter B. R., Feely R. A., Van Heuven S., Hoppema M., et al. (2019). The oceanic sink for anthropogenic CO2 from 1994 to 2007. Science 363, 1193–1199. doi: 10.1126/science.aau5153
Guan H., Chen Y., Zhao A. (2022a). Carbon neutrality assessment and driving factor analysis of China’s offshore fishing industry. Water 14, 4112. doi: 10.3390/w14244112
Guan H., Sun Z., Zhao A. (2022b). Spatio-temporal evolution and influencing factors of net carbon sink in marine aquaculture in China. Front. Environ. Sci. 10, 978073. doi: 10.3389/fenvs.2022.978073
He Y., Zhang F. (2023). A game study on the implementation of marine carbon sink fisheries in the context of carbon neutrality– Analysis of the tripartite behavior of fishery practitioners, research institutions, and the government. Mar. Policy 147, 105365. doi: 10.1016/j.marpol.2022.105365
Hong J., Shen Q., Xue F. (2016). A multi-regional structural path analysis of the energy supply chain in China’s construction industry. Energy Policy 92, 56–68. doi: 10.1016/j.enpol.2016.01.017
Hou J., Deng X., Springer C. H., Teng F. (2020). A global analysis of CO2 and non-CO2 GHG emissions embodied in trade with Belt and Road Initiative countries. Ecosys. Health Sustain. 6, 1761888. doi: 10.1080/20964129.2020.1761888
Jia R., Li P., Chen C., Liu L., Li Z. H. (2023). Shellfish-algal systems as important components of fisheries carbon sinks: Their contribution and response to climate change. Environ. Res. 224, 115511. doi: 10.1016/j.envres.2023.115511
Jiang L., Yang T., Yu J. (2022). Global trends and prospects of blue carbon sinks: a bibliometric analysis. Environ. Sci. pollut. Res. 29, 65924–65939. doi: 10.1007/s11356-022-22216-4
Jiao N., Herndl G. J., Hansell D. A., Benner R., Kattner G., Wilhelm S. W., et al. (2011). The microbial carbon pump and the oceanic recalcitrant dissolved organic matter pool. Nat. Rev. Microbiol. 9 (7), 555–555.
Jiao N., Herndl G. J., Hansell D. A., Benner R., Kattner G., Wilhelm S. W., et al. (2010). Microbial production of recalcitrant dissolved organic matter: long-term carbon storage in the global ocean. Nat. Rev. Microbiol. 8, 593–599. doi: 10.1038/nrmicro2386
Kandasamy K., Rajendran N., Balakrishnan B., Thiruganasambandam R., Narayanasamy R. (2021). Carbon sequestration and storage in planted mangrove stands of Avicennia marina. Reg. Stud. Mar. Sci. 43, 101701. doi: 10.1016/j.rsma.2021.101701
Lai Q., Ma J., He F., Zhang A., Pei D., Wei G., et al. (2022a). Research development, current hotspots, and future directions of blue carbon: A bibliometric analysis. Water 14, 1193. doi: 10.3390/w14081193
Lai Q., Ma J., He F., Zhang A., Pei D., Yu M. (2022b). Current and future potential of shellfish and algae mariculture carbon sinks in China. Int. J. Environ. Res. Public Health 19, 8873. doi: 10.3390/ijerph19148873
Li Z., Chen Y., Wang G., Mu J., Sun Y., Yu H., et al. (2023). Ecological carrying capacity and carbon sequestration potential of bivalve shellfish in marine ranching: A case study in Bohai Bay, China. Front. Mar. Sci. 10, 1174235. doi: 10.3389/fmars.2023.1174235
Li X., Yang J., Zhao Y., Zhou S., Wu Y. (2024). Prediction and assessment of marine fisheries carbon sink in China based on a novel nonlinear grey Bernoulli model with multiple optimizations. Sci. Total Environ. 914, 169769. doi: 10.1016/j.scitotenv.2023.169769
Liu Y., Yan C., Gao J., Wu X., Zhang B. (2022). Mapping the changes of CH4 emissions in global supply chains. Sci. Total Environ. 832, 155019. doi: 10.1016/j.scitotenv.2022.155019
Nagashima F. (2018). Critical structural paths of residential PM2. 5 emissions within the Chinese provinces. Energy Econ. 70, 465–471. doi: 10.1016/j.eneco.2018.01.033
Piao S., He Y., Wang X., Chen F. (2022). Estimation of China’s terrestrial ecosystem carbon sink: Methods, progress and prospects. Sci. China Earth Sci. 65, 641–651. doi: 10.1007/s11430-021-9892-6
Polimene L., Sailley S., Clark D., Mitra A., Allen J. I. (2017). Biological or microbial carbon pump? role phytoplankton stoichiometry ocean carbon sequestration. J. Plankton Res. 39 (2), 180–186.
Ramírez-Zuñiga M. A., Pérez-Estrada C. J., Lopez-Calderon J. M., Cannon A., Vanderplank S., Favoretto F. (2024). Updating and validating seagrass ecosystem knowledge in the Gulf of California: A comprehensive review. Front. Mar. Sci. 11, 1402044. doi: 10.3389/fmars.2024.1402044
Ren W. (2021). Study on the removable carbon sink estimation and decomposition of influencing factors of mariculture shellfish and algae in China—a two-dimensional perspective based on scale and structure. Environ. Sci. pollut. Res. 28, 21528–21539. doi: 10.1007/s11356-020-11997-1
Shi X., Xu Y., Dong B., Nishino N. (2023). Mariculture carbon sequestration efficiency in China: Its measurement and socio-economic factor analysis. Sustain. Prod. Consump. 40, 101–121. doi: 10.1016/j.spc.2023.06.003
Song J., Wang B., Yang W., Duan H., Liu X. (2020). Extracting critical supply chains driving air pollution in China. J. cleaner product. 276, 124282. doi: 10.1016/j.jclepro.2020.124282
Su B., Ang B. W. (2023). Structural decomposition analysis applied to energy and emissions: Frameworks for monthly data. Energy Econ. 126, 106977. doi: 10.1016/j.eneco.2023.106977
Sun H., Li X., Ren Y., Zhang H., Mao X., Lao Y., et al. (2020). Boost carbon availability and value in algal cell for economic deployment of biomass. Biores. Technol. 300, 122640. doi: 10.1016/j.biortech.2019.122640
Tamburini E., Turolla E., Lanzoni M., Moore D., Castaldelli G. (2022). Manila clam and Mediterranean mussel aquaculture is sustainable and a net carbon sink. Sci. Total Environ. 848, 157508. doi: 10.1016/j.scitotenv.2022.157508
Tang Q. S., Liu H. (2016). Carbon sinks of marine fisheries and their expansion strategies. Chin. Eng. Sci. 18 (3), 68–73.
Tang Q., Zhang J., Fang J. (2011). Shellfish and seaweed mariculture increase atmospheric CO2 absorption by coastal ecosystems. Mar. Ecol. Prog. Ser. 424, 97–104. doi: 10.3354/meps08979
Tu Z., Le C., Bai Y., Jiang Z., Wu Y., Ouyang Z., et al. (2021). Increase in CO2 uptake capacity in the Arctic Chukchi Sea during summer revealed by satellite-based estimation. Geophys. Res. Lett. 48, e2021GL093844. doi: 10.1029/2021GL093844
Wang J., Feng L., Palmer P. I., Liu Y., Fang S., Bösch H., et al. (2020). Large Chinese land carbon sink estimated from atmospheric carbon dioxide data. Nature 586, 720–723. doi: 10.1038/s41586-020-2849-9
Wang X., Zheng H., Wang Z., Shan Y., Meng J., Liang X., et al. (2019). Kazakhstan's CO2 emissions in the post-Kyoto Protocol era: Production-and consumption-based analysis. J. Environ. Manage. 249, 109393.
Watson R. T., Noble I. R., Bolin B., Ravindranath N. H., Verardo D. J., Dokken D. J. (2000). Land use, land-use change and forestry: a special report of the Intergovernmental Panel on Climate Change (The Edinburgh Building Shaftesbury Road, Cambridge CB2 2RU ENGLAND: Cambridge University Press).
Watson A. J., Schuster U., Shutler J. D., Holding T., Ashton I. G., Landschützer P., et al. (2020). Revised estimates of ocean-atmosphere CO2 flux are consistent with ocean carbon inventory. Nat. Commun. 11, 4422. doi: 10.1038/s41467-020-18203-3
World Health Organization (2023). Report 2022: pesticide residues in food: Joint FAO (No. CC4115/EN/1/03.23) (Food and Agriculture Organization of the United Nations).
Xiao G., Wang T., Shang W., Shu Y., Biancardo S. A., Jiang Z. (2024). Exploring the factors affecting the performance of shipping companies based on a panel data model: A perspective of antitrust exemption and shipping alliances. Ocean Coast. Manage. 253, 107162. doi: 10.1016/j.ocecoaman.2024.107162
Xu J. Z., She C. (2020). Evaluation of spatial spillover effect of green development of marine carbon sink fisheries. China Popul. Resour. Environ. 30, 99–110. doi: 10.12062/cpre.20191016
Zhang C., Xiao G., Xu L. (2024). Manufacturers’ emission-reduction investments in competing supply chains with Prisoner’s Dilemma: The economic and environmental impacts of Retailer (s) capital Constraint (s). Transport. Res. Part E: Logist. Transport. Rev. 187, 103602.
Zhang Y., Zhang J., Liang Y., Li H., Li G., Chen X., et al. (2017). Carbon sequestration processes and mechanisms in coastal mariculture environments in China. Sci. China Earth Sci. 60, 2097–2107. doi: 10.1016/j.tre.2024.103602
Keywords: consumption-side, ocean carbon sinks, I-O analysis, SDA, SPA
Citation: Li Y, Deng C, Jiang P, Wei Y and Wang K (2024) Provincial marine carbon sink transfer in China: structural drivers and key consumption pathways. Front. Mar. Sci. 11:1438096. doi: 10.3389/fmars.2024.1438096
Received: 25 May 2024; Accepted: 01 July 2024;
Published: 16 July 2024.
Edited by:
Xuemei Li, Ocean University of China, ChinaReviewed by:
Geng Wu, Ningbo University of Technology, ChinaCopyright © 2024 Li, Deng, Jiang, Wei and Wang. This is an open-access article distributed under the terms of the Creative Commons Attribution License (CC BY). The use, distribution or reproduction in other forums is permitted, provided the original author(s) and the copyright owner(s) are credited and that the original publication in this journal is cited, in accordance with accepted academic practice. No use, distribution or reproduction is permitted which does not comply with these terms.
*Correspondence: Ke Wang, d2FuZ2tlYml0QGJpdC5lZHUuY24=
Disclaimer: All claims expressed in this article are solely those of the authors and do not necessarily represent those of their affiliated organizations, or those of the publisher, the editors and the reviewers. Any product that may be evaluated in this article or claim that may be made by its manufacturer is not guaranteed or endorsed by the publisher.
Research integrity at Frontiers
Learn more about the work of our research integrity team to safeguard the quality of each article we publish.