 Shujie Cai1†
 Linjian Ou
 Wupeng Xiao
 Bangqin Huang
- 1State Key Laboratory of Marine Environmental Science/Key Laboratory of Coastal and Wetland Ecosystems, Ministry of Education, College of the Environment and Ecology, Xiamen University, Xiamen, China
- 2System Research Institute of ECO-ETCH & ECO-EL, Ltd.MCC Group, Beijing, China
- 3Research Center of Harmful Algae and Marine Biology, and Key Laboratory of Eutrophication and Red Tide Prevention of Guangdong Higher Education Institutes, Jinan University, Guangzhou, China
River-derived nutrient imbalances can induce phosphorus (P) limitation in coastal plankton, but the salinity thresholds that govern this phenomenon have received little attention. Here, we provide a first insight into threshold responses in P-limitation along the salinity gradient in coastal ecosystems. Our seasonal sampling in the northern South China Sea showed a clear nonlinear decrease in alkaline phosphatase activity (APA) with increasing salinity. A pivotal finding was the identification of a salinity threshold at 32.83, presenting an early-warning indicator for P-limitation detection. Using a mixed-effects model, we further revealed that the robust positive correlation between phytoplankton biomass and APA gradually weakened as salinity increased toward this threshold. This implies a shift in phytoplankton’s P-limitation at this salinity threshold and the contribution of heterotrophic bacteria in APA within high-salinity seawater. These insights highlight the importance of refining monitoring strategies with salinity and APA dynamics as early-warning indicators for nutrient limitation in coastal ecosystems.
1 Introduction
Phosphorus (P), an essential element for all organisms, exerts significant control over marine primary production, which forms the base of most marine food webs (Dyhrman et al., 2007). Typically, the bioavailability of P in marine surface waters is limited, not only because of its high demand but also because a significant proportion is bound in dissolved organic complexes (Duhamel et al., 2021). Under conditions of P-stress or P-limitation, phytoplankton and bacterioplankton often use alkaline phosphatase (AP) to hydrolyze organic P compounds and thereby render P available for uptake (Dyhrman and Ruttenberg, 2006; Duhamel et al., 2021). Because alkaline phosphatase activity (APA) serves as a pivotal and sensitive indicator of P-limitation for aquatic microorganisms, understanding its dynamics and controlling factors is crucial for unraveling the intricacies of marine nutrient dynamics and their broader implications for marine ecosystems.
The coastal ocean serves as a crucial interface connecting terrestrial and marine ecosystems and remains profoundly shaped by anthropogenic impacts (Barbier et al., 2011). Fluvial discharges contribute to natural variability creating gradients of coastal-eutrophic and open-oligotrophic attributes within these zones (Terhaar et al., 2021). A typical ecological effect of river discharges is the conveyance of nutrient-rich waters. The ratios of dissolved inorganic nitrogen to phosphorus (DIN/DIP) are often high within these coastal ecosystems because of high DIN and low DIP concentrations, where there is hence a shift towards P-limitation (Jickells, 1998; Yin and Harrison, 2008). For instance, Sylvan et al. (2006) have noted that excessive DIN entry into the Mississippi River watershed periodically intensifies P-limitation on the Louisiana shelf. A revealing pattern emerges in the southern North Sea, where the decreasing DIN/DIP gradient from nearshore to offshore creates a range of nutrient limitation conditions for phytoplankton (Burson et al., 2016). The combination of P and silicon (Si) limitations near the coast transitions to combined nitrogen (N) and P limitations in intermediary zones and to exclusively N-limitation further offshore (Burson et al., 2016). Similarly, Mo et al. (2020) have found that phytoplankton in the Yangtze River plume exhibit higher APA than those in the Kuroshio surface waters, and there is a strong, positive correlation between the DIN/DIP ratio and APA. Nonetheless, because of the dynamic nature of the coastal environment, the current understanding of P-limitation and P status in these regions is still incomplete.
The challenge of discerning trends in P-limitation within coastal regions arises from the interrelated variations of planktonic growth and changing conditions of nutrient limitation along the environmental gradient. The relationship between P-limitation and riverine transport is nonlinear because the status of nutrient limitation and microbial biomass undergo simultaneous, dynamic changes (Turner and Rabalais, 2013; Tseng et al., 2014). This complexity is amplified in non-equilibrium systems like plumes that are constantly mixing with seawater. For instance, under these conditions, nutrient limitation and phytoplankton growth are interlinked in complex ways. The nutrient uptake efficiency of phytoplankton varies as a function of cellular nutrient levels, while extracellular nutrient concentrations change in response to phytoplankton uptake, excretion, and mortality (Turner and Rabalais, 2013). On the one hand, nutrient concentrations, including DIN and DIP, influence the rate of nutrient uptake by phytoplankton cells. The nutrient concentrations change dynamically as a result of uptake, transformation, and excretion along the gradient from a river to the ocean (Turner and Rabalais, 2013). On the other hand, the intense biological activity within river plumes accelerates DIP consumption. This uptake of DIP results in an exceptionally high DIN/DIP ratio. At the edges of the plume, the stratification of the water column suppresses vertical mixing, and simultaneous biological uptake depletes available P and further intensifies P-limitation (Tseng et al., 2014). However, as phytoplankton encounter offshore seawater with low concentrations of DIN and a lower ratio of DIN/DIP (Liu et al., 2010, 2013), they gradually transition to N limitation or simultaneous limitation by N and P (Burson et al., 2016). These interactions, which are evident in the gradient from a river to the ocean, underscore the importance of a nuanced approach when determining the environmental threshold and mechanisms that regulate P-limitation.
For coastal P-limitation of microbial growth, the environmental threshold can be identified by the salinity where the dynamic equilibrium between riverine and marine influences shifts. When the ecosystem is not close to this threshold, it is likely to be more resilient to disturbances. However, it could approach a regime shift if it were nudged toward the threshold (Hughes et al., 2013). Identifying such thresholds not only offers valuable insights into the present-day dynamics but also forecasts potential ecosystem responses to ongoing anthropogenic pressures and global climate change (Doney et al., 2012; Xiao et al., 2018; Zhang et al., 2023). For instance, nutrient inputs that exceed those associated with a threshold can lead to eutrophication (Conley et al., 2009), hypoxia (Breitburg et al., 2018), or even harmful algal blooms (Glibert and Burford, 2017)—phenomena that severely endanger marine biodiversity and ecosystem services (Halpern et al., 2015). Furthermore, because of the close relationship between the dynamics of microorganisms and the structure/function of marine food webs, the ramifications of these shifts can cascade through the entire ecosystem (Chassot et al., 2010).
Based on these considerations, we propose that the relationship between coastal P-limitation and various environmental factors could shift along salinity gradients because of the transition from seawater diluted by water from river plumes to the offshore ocean. Specifically, we anticipate a distinct shift in plankton P-limitation at a certain salinity within this salinity gradient. At salinities lower than this threshold, where the environment is predominantly influenced by river plumes, P-limitation is likely intensified by high DIN/DIP ratios as a result of high DIN and low DIP concentrations. In contrast, at salinities higher than this threshold, where offshore seawater exerts more influence, DIN and DIP may be supplied in a ratio more closely resembling the nutritional requirements of microorganisms, especially phytoplankton.
To test our hypothesis, we analyzed data collected during the summer and winter cruises in 2008 in the northern South China Sea (NSCS). The study region was strongly influenced by the Pearl River, the third-largest river in China. With an average annual discharge of about 10,000 m3 s−1 along the northern coast of the South China Sea, the water from the Pearl River, carrying elevated terrestrial nutrient concentrations, extends across the expansive continental shelf of the NSCS (Gan et al., 2009). Notably, during summer months, the southwest monsoon can drive the Pearl River plume eastward, where it could potentially reach the Taiwan Strait several hundred kilometers distant (Han et al., 2012). We defined water masses based on insights from studies of physical oceanography and marine chemistry in this region (Gan et al., 2009; Wu et al., 2017). In addition, we used APA as a metric of the degree of plankton P-limitation (Accoroni et al., 2017; Mo et al., 2020). Ultimately, by combining various model-fitting approaches, we characterized and quantified the threshold for the transition of plankton P-limitation along the gradient from the coast to offshore. Specific goals of this project were to: i) identify the salinity thresholds for nutrient concentrations, chlorophyll-a (Chl-a) concentrations, and P-limitation along the salinity gradient from the Pearl River plume to offshore water, and ii) understand the shifting dynamics between environmental determinants and P-limitation across this gradient, emphasizing the contrast between conditions at salinities greater than and less than the threshold.
2 Materials and methods
2.1 Cruise background
Field cruises were undertaken in the NSCS during the summer (29 June−15 July 2008) aboard the R/V Shiyan III and during the winter (23 December 2008−10 January 2009) aboard the R/V Dongfanghong II (Figure 1). The summer cruise consisted of two phases: the first phase (30 June−8 July, Leg 1) involved a detailed survey on seven transects across the continental shelf and focused on the primary plume-upwelling area (Figure 1A). During the second phase (9−12 July, Leg 2), four of these sections were revisited for a comparative assessment (Figure 1A). For the winter cruise, our stations were strategically located along the western side of the Pearl River Estuary to account for the influence of the northeast monsoon on the trajectory of the plume (Figure 1B).
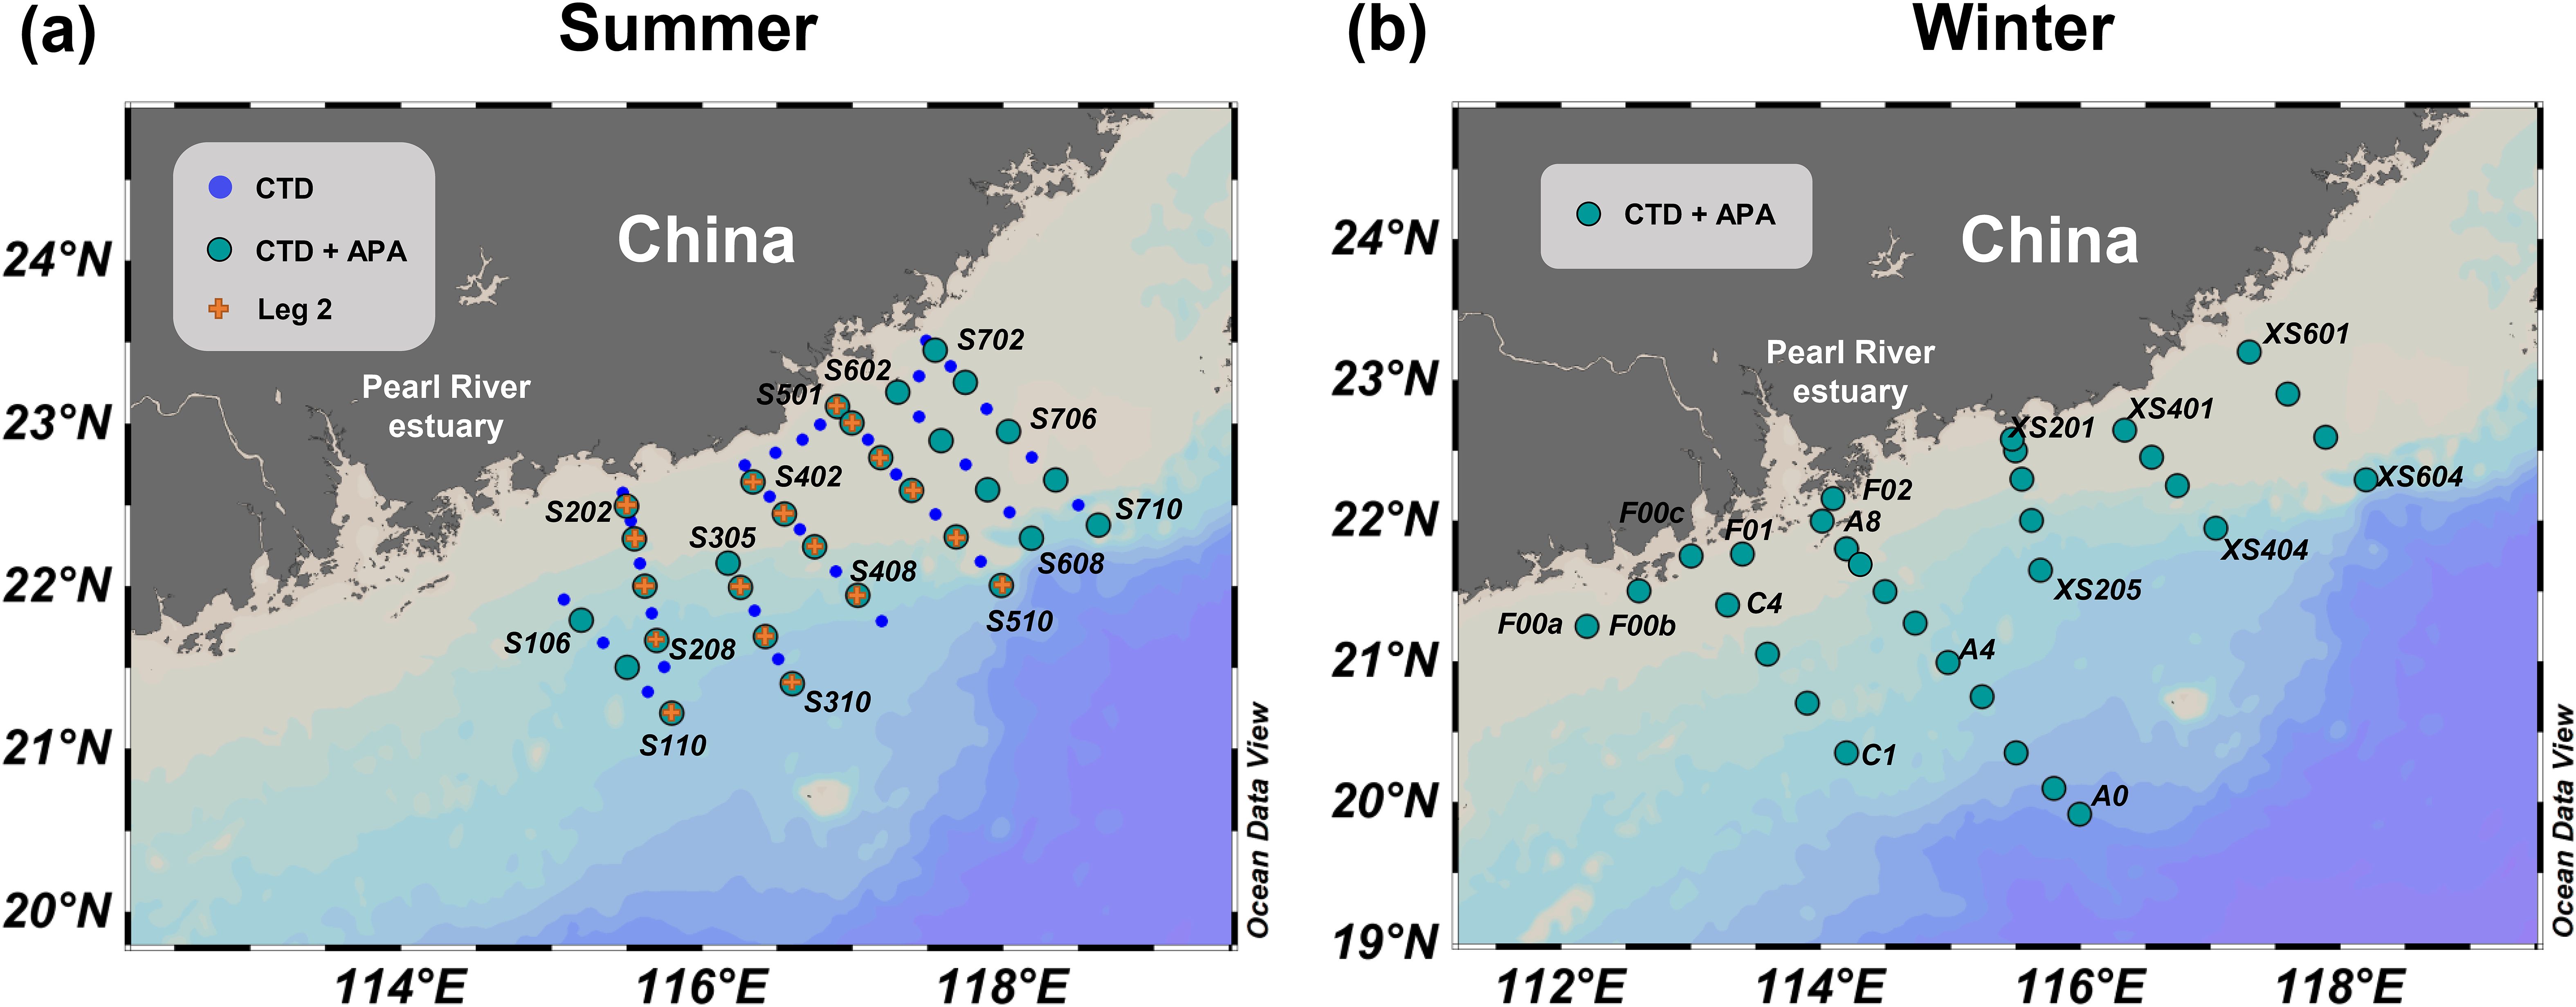
Figure 1. Sampling distribution in the northern South China Sea during summer (A) and winter (B). Blue dots denote stations where conductivity-temperature-depth (CTD), nutrient, and Chl-a sampling took place. Green dots indicate stations for alkaline phosphatase activity (APA) assays, in addition to the aforementioned samplings. Orange crosses indicate stations repeated during Leg 2.
2.2 Sampling and environmental parameters
The seawater samples were obtained using Niskin bottles attached to a CTD rosette system. During the cruises, seawater samples were collected from different depths at each station. The number of sampling layers ranged from 2 to 8 layers. In the summer cruise, the sampling depths ranged from 2 to 135 m, while in the winter cruise, the sampling depths ranged from 3 to 117 m. Concurrently, the SeaBird model SBE9/11 CTD recorder measured and recorded the salinity and temperature profiles during each cast. In accord with the study of Gan et al. (2009); Gan et al. (2010), and Wu et al. (2017), we defined the plume water and SCS water as water with a salinity below 33 and above 33.75, respectively. We categorized the water samples with salinities between these limits as mixing water.
Dissolved inorganic nutrient concentrations, including nitrogen (nitrate and nitrite, DIN, μmol L−1), phosphorus (DIP, μmol L−1), and silicate (DSi, μmol L−1), were analyzed by a Technicon AA3 AutoAnalyzer. The detection limits for DIN, DIP, and DSi were 0.03 μmol L−1, 0.03 μmol L−1, and 0.05 μmol L−1, respectively. The seawater samples collected for chlorophyll a (Chl-a) analysis were processed by filtration using 25-mm Whatman GF/F fiber filters. The filtered samples were then promptly frozen and stored in liquid nitrogen until laboratory analysis. The Chl-a analysis was conducted using a Turner fluorometer equipped with a red-sensitive photomultiplier, following the method described by Welschmeyer (1994).
2.3 Bulk alkaline phosphatase activity assay
The bulk APA was measured following the method described by Hoppe (1983) and Huang et al. (2007). Before the APA assay, the seawater samples were initially filtered through a 200-μm filter to remove larger grazers. 4-Methylumbelliferyl phosphate (MUP, Sigma) was used as the fluorogenic substrate for APA determination. To initiate the reaction, the substrate was added to seawater subsamples in triplicate at a final concentration of 150 μmol L−1 in a 3 mL incubation volume. The assay was incubated for 3 hours at in situ temperature, which ranged from 18.5 to 31.5°C. The reaction was stopped by adding HgCl2, and the samples were then stored at −20°C for preservation. The fluorescence of the reaction product was measured using a spectrofluorometer (Varian Cary Eclipse) with excitation and emission wavelengths set at 365 nm and 450 nm, respectively, and at a pH of 10.3. Calibration was carried out using standard solutions of 4-Methylumbelliferyl fluorescence (MUF, Sigma) at concentrations of 0.01 to 1 µM. The APA was expressed as nmol of MUP released per liter per hour (nmol h−1 L−1).
2.4 Statistical analyses
Differences in environmental parameters (salinity, temperature, DIN, DIP, DSi, DIN/DIP, and Chl-a) and APA among different water masses were evaluated using the nonparametric Wilcoxon test, with significance determined at P < 0.05. Environmental parameters and APA underwent a log10 transformation to improve homoscedasticity and normality before model fitting. Multiple regression models, including linear regression, quadratic models, and generalized additive models (GAMs), were used to analyze how environmental factors and APA respond to increasing salinity levels. Also, informed by the methodologies of Berdugo et al. (2020) and Hu et al. (2021), we employed the R package “chngpt” for further analysis. Specifically, we applied step regression, which modifies only the intercept at a given salinity, and segmented regression, which alters both the intercept and slope at a certain salinity, to pinpoint the discontinuity threshold. Additionally, stegmented regression, which exclusively adjusts the slope at a specified salinity level, was used to ascertain the continuity threshold. Model preference was dictated by the Akaike information criterion (AIC). We selected the model with the lowest AIC value as the optimal model.
We then used the R package “lme4” to construct a multiple linear mixed-effects model to investigate the relationship between environmental factors and APA. Before fitting the model, we initially included all environmental factors from the study (salinity, temperature, DIN, DIP, DSi, DIN/DIP ratio, and Chl-a). We then evaluated the presence of multicollinearity by examining the variance inflation factors (VIF). Variable with VIF exceeding 10 was excluded from the analysis. Taking into account the influence of water masses on these relationships, we incorporated “water mass” as a random variable in our analysis. The model was formatted as follows:
In this formulation, α is the fixed intercept, and β is the slope of the associated environmental factor. The term ai served as the random intercept and was presumed to follow a normal distribution with a mean of 0 and a variance of . This accounted for random fluctuations around the intercept and captured variability between water masses. A total of 500 independent simulations of bootstrapped resampling were conducted to obtain standardized coefficients for fixed terms from the linear mixed-effects model.
To explore the relationship between nutrient conditions, Chl-a, and APA along the salinity gradient in the NSCS, we adopted a moving-window analysis technique as detailed in Hu et al. (2021). Briefly, we arranged all the survey sites based on salinity and applied Equation (1) from a linear, mixed-effects model to a subset window of 100 sites with the lowest salinity readings. This subset was selected to guarantee robust statistical validity for our analysis. We then repeated this analysis for the subsequent sites in order of their salinities. For each subset window, we carried out bootstrapped resampling on the standardized coefficients of each fixed term to match the average salinity across the 100 sites. We assessed the significance of these bootstrapped standardized coefficients for the interplay between environmental factors and APA by examining their 95% confidence intervals.
Finally, structural equation modeling (SEM) was fitted to illustrate the direct and indirect effects of nutrient conditions and Chl-a on APAs below and above the salinity shift threshold. The goodness of fit of the SEM was assessed using the χ2 test (with P > 0.05 indicating a good fit), the Comparative Fit Index (CFI; a value near 1 suggests a favorable fit), and the root mean squared error of approximation (RMSEA; values below 0.05 indicate a good fit) (Schermelleh-Engel et al., 2003). The SEM analysis was conducted using the “lavaan” package in R (Rosseel, 2012).
3 Results
3.1 Hydrography background
Previous studies by Cao et al. (2011); Han et al. (2012), and Wu et al. (2017) have provided a comprehensive overview of the environmental characteristics in the NSCS during the summer cruise (Legs 1 and 2). Briefly, during Leg 1, the eastward extension of the low-salinity plume into the NSCS resulted in the formation of two low-salinity centers (typically < 29) (Supplementary Figure S1A). One was between transects 1 and 2 inland, and the other was in the middle of transect 5 (Supplementary Figure S1A). Concurrently, high-salinity, low-temperature upwelling occurred in the inner shelf (Supplementary Figures S1A, D). During Leg 2, the weakening of river discharge resulted in the dispersal of the plume centers (Supplementary Figure S1B). During the winter cruise, the plume was influenced by the northeast monsoon and located near the east side of the Pearl River Estuary, with a significantly reduced influence on the NSCS compared to the summer cruise (Supplementary Figure S1C). This resulted in a more pronounced salinity gradient in summer than in winter (Supplementary Figures S1AC).
3.2 Environmental differences between water masses
We investigated the variations in temperature, nutrient concentrations, and Chl-a among different water masses (Figure 2). The temperature of the summer plume significantly exceeded that of the mixing water (Wilcoxon test, P < 0.01) and the SCS water (Wilcoxon test, P < 0.001). Conversely, the temperature of the winter plume was significantly lower than that of the mixing water (Wilcoxon test, P < 0.01) and the SCS water (Wilcoxon test, P < 0.001) (Figure 2A). The summer and winter plumes exhibited distinct patterns of nutrient concentrations (Figures 2B−D). Specifically, the DIN, DIP, and DSi concentrations in the winter plume were significantly higher than those in the winter mixing water and the SCS water (Wilcoxon test, P < 0.01). By contrast, the concentrations of these three nutrients in the summer plume were significantly lower than those in the summer SCS water (Wilcoxon test, P < 0.001). Additionally, the DIN, DIP, and DSi concentrations in the winter plume were significantly higher than those in the summer plume (Wilcoxon test, P < 0.01). Furthermore, the DIN/DIP ratios in the summer and winter plumes were significantly higher at 34 ± 36 and 22.4 ± 5.9, respectively, than other water masses in their respective seasons (Wilcoxon test, P < 0.05), although there was no significant variation between seasons (Wilcoxon test, P > 0.05) (Figure 2E). Likewise, the Chl-a concentrations in both summer and winter plumes (1.5 ± 1.3 μg L−1 and 1.3 ± 0.3 μg L−1, respectively) were notably higher than those in other water masses during the corresponding seasons (Wilcoxon test, P < 0.001) (Figure 2F).
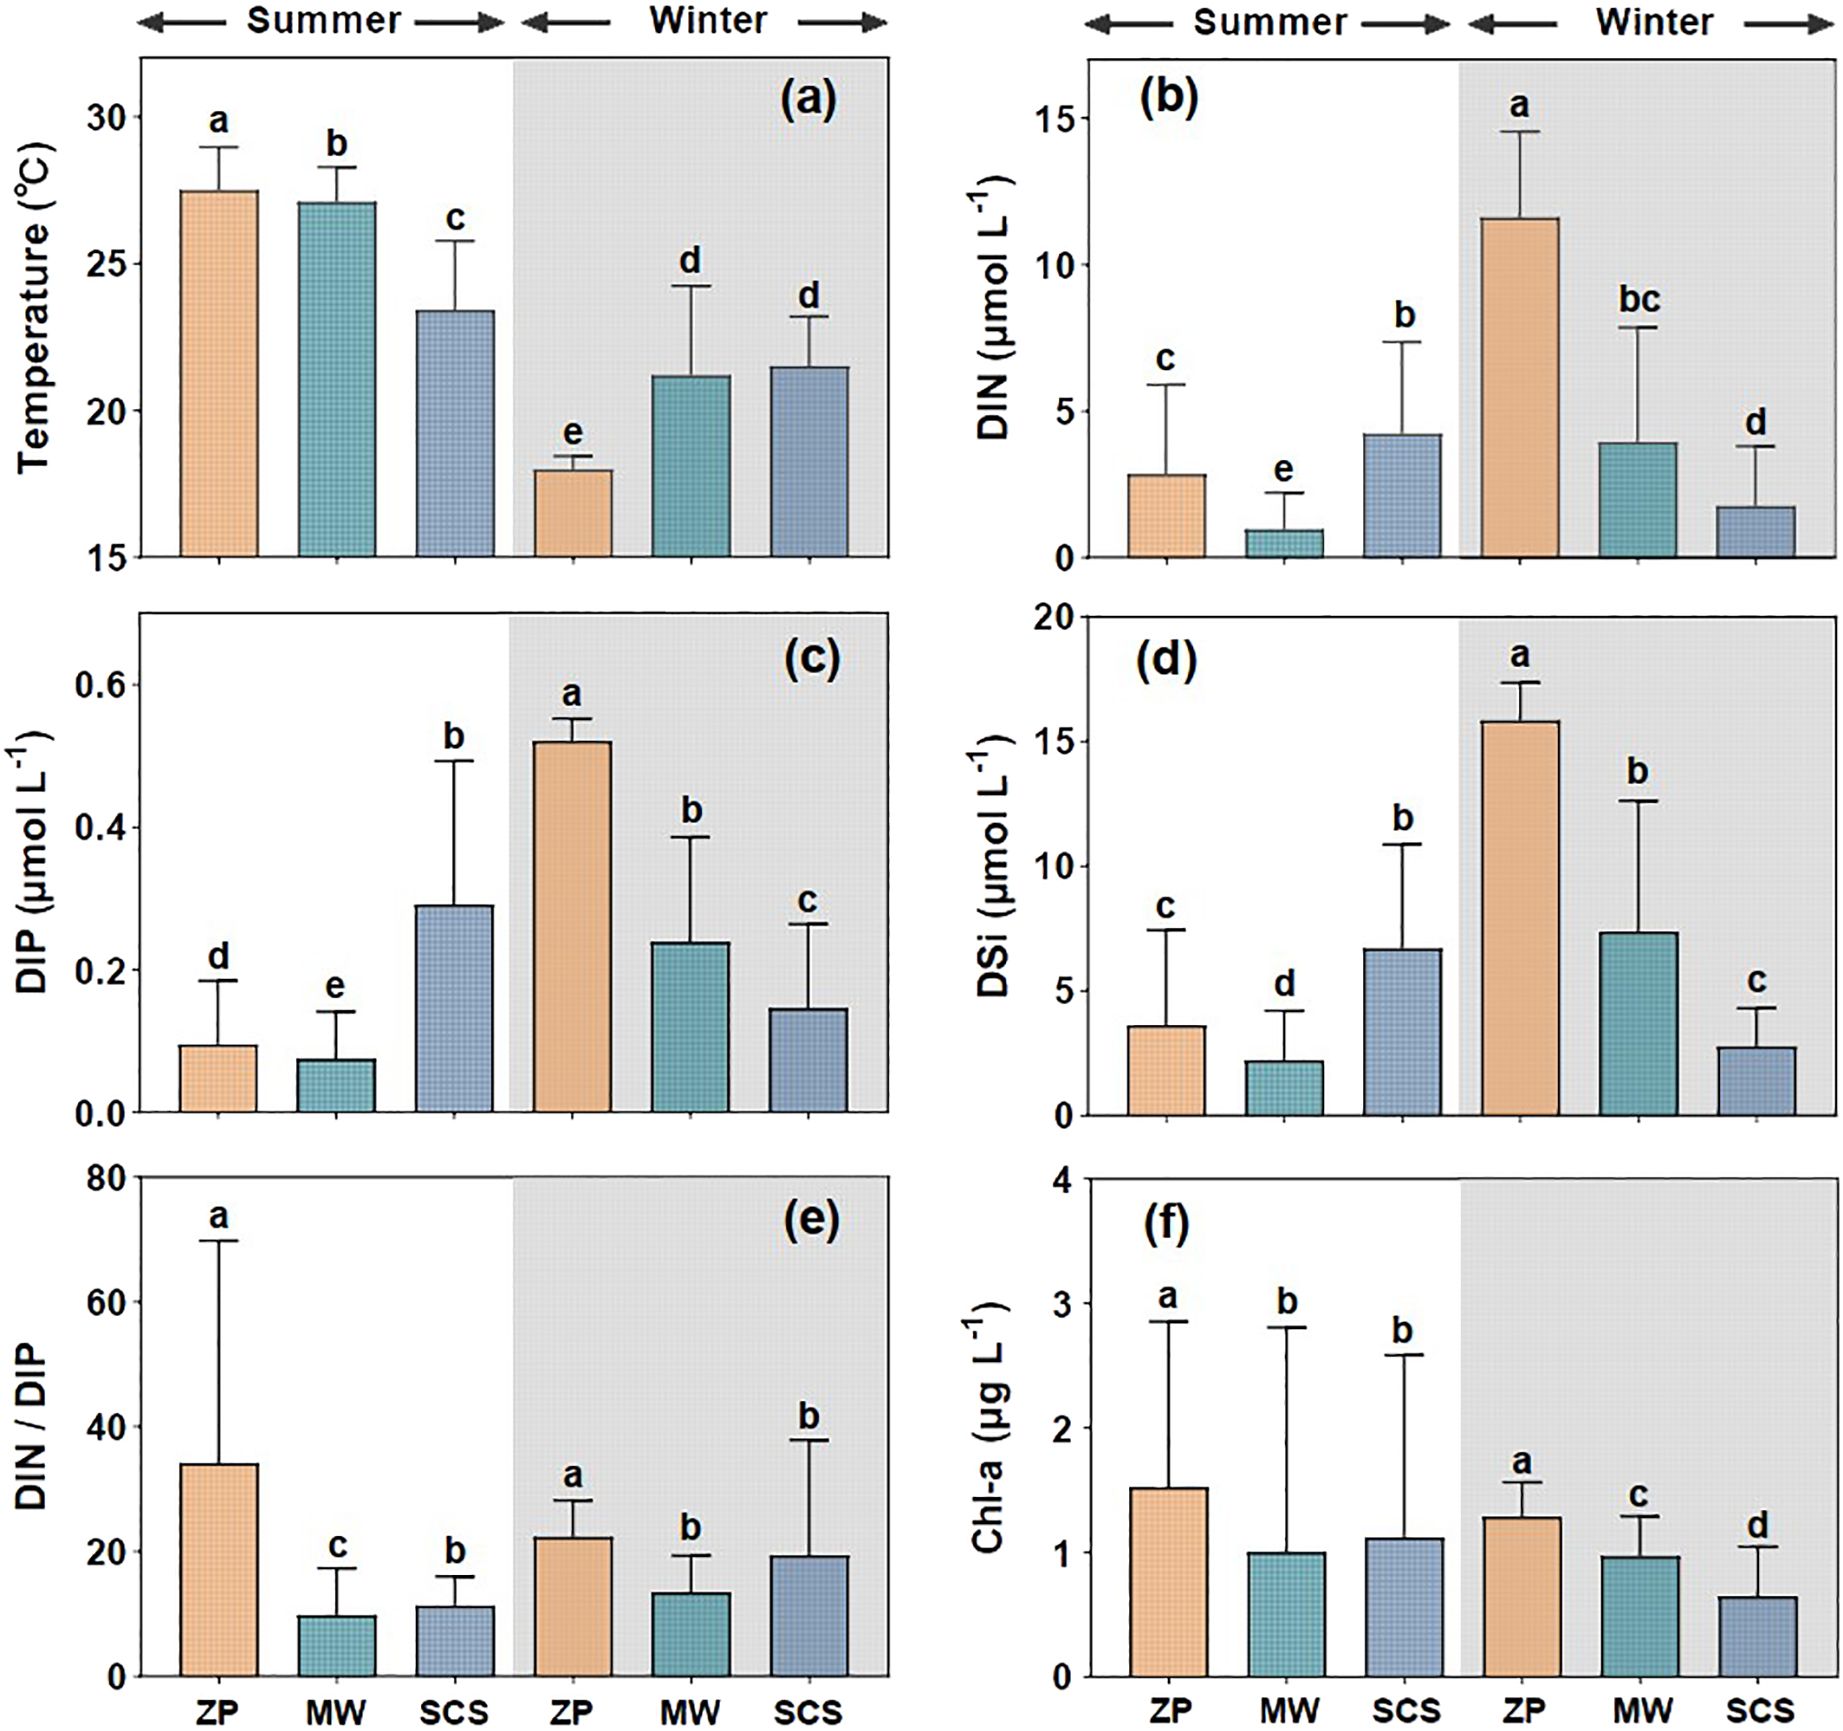
Figure 2. Variations in temperature (A), DIN (B), DIP (C), DSi (D), DIN/DIP ratio (E), and Chl-a (F) among different water masses during summer and winter. ZP represents the Pearl River plume; SCS denotes the South China Sea water; MW refers to the mixed water of the Pearl River plume and the South China Sea water. Columns with the same letters demonstrate (e.g. a, ab) no significant difference among groups determined by the nonparametric Wilcoxon test, and those with different letters (e.g. a, b) indicate significant differences among groups.
3.3 Distributions of APA
The distribution of APA values in the NSCS was influenced by the plume in both summer and winter. As shown in Figures 3A−C and Supplementary Figure S2, APA values were the highest within the plume; the values were lower in offshore surface and subsurface waters. During the summer Leg 1 cruise, station S506, which was strongly affected by the plume (with surface salinity of 26.71, Supplementary Figure S1A), showed a very high surface APA value of 973 nmol h−1 L−1 (Figure 3A). However, as the intensity of the plume diminished during the summer Leg 2, the surface APA at station S506 reduced to 470 nmol h−1 L−1 (Figure 3B), at a surface salinity of 30.25 (Supplementary Figure S1B). Similarly, in winter, the peak surface APA value was recorded at station F00c, where it reached 387 nmol h−1 L−1 (Figure 3C). This station is located near the western shore of the Pearl River Estuary and is influenced by the plume, as evidenced by its surface salinity of 31.00 (Supplementary Figure S1C).
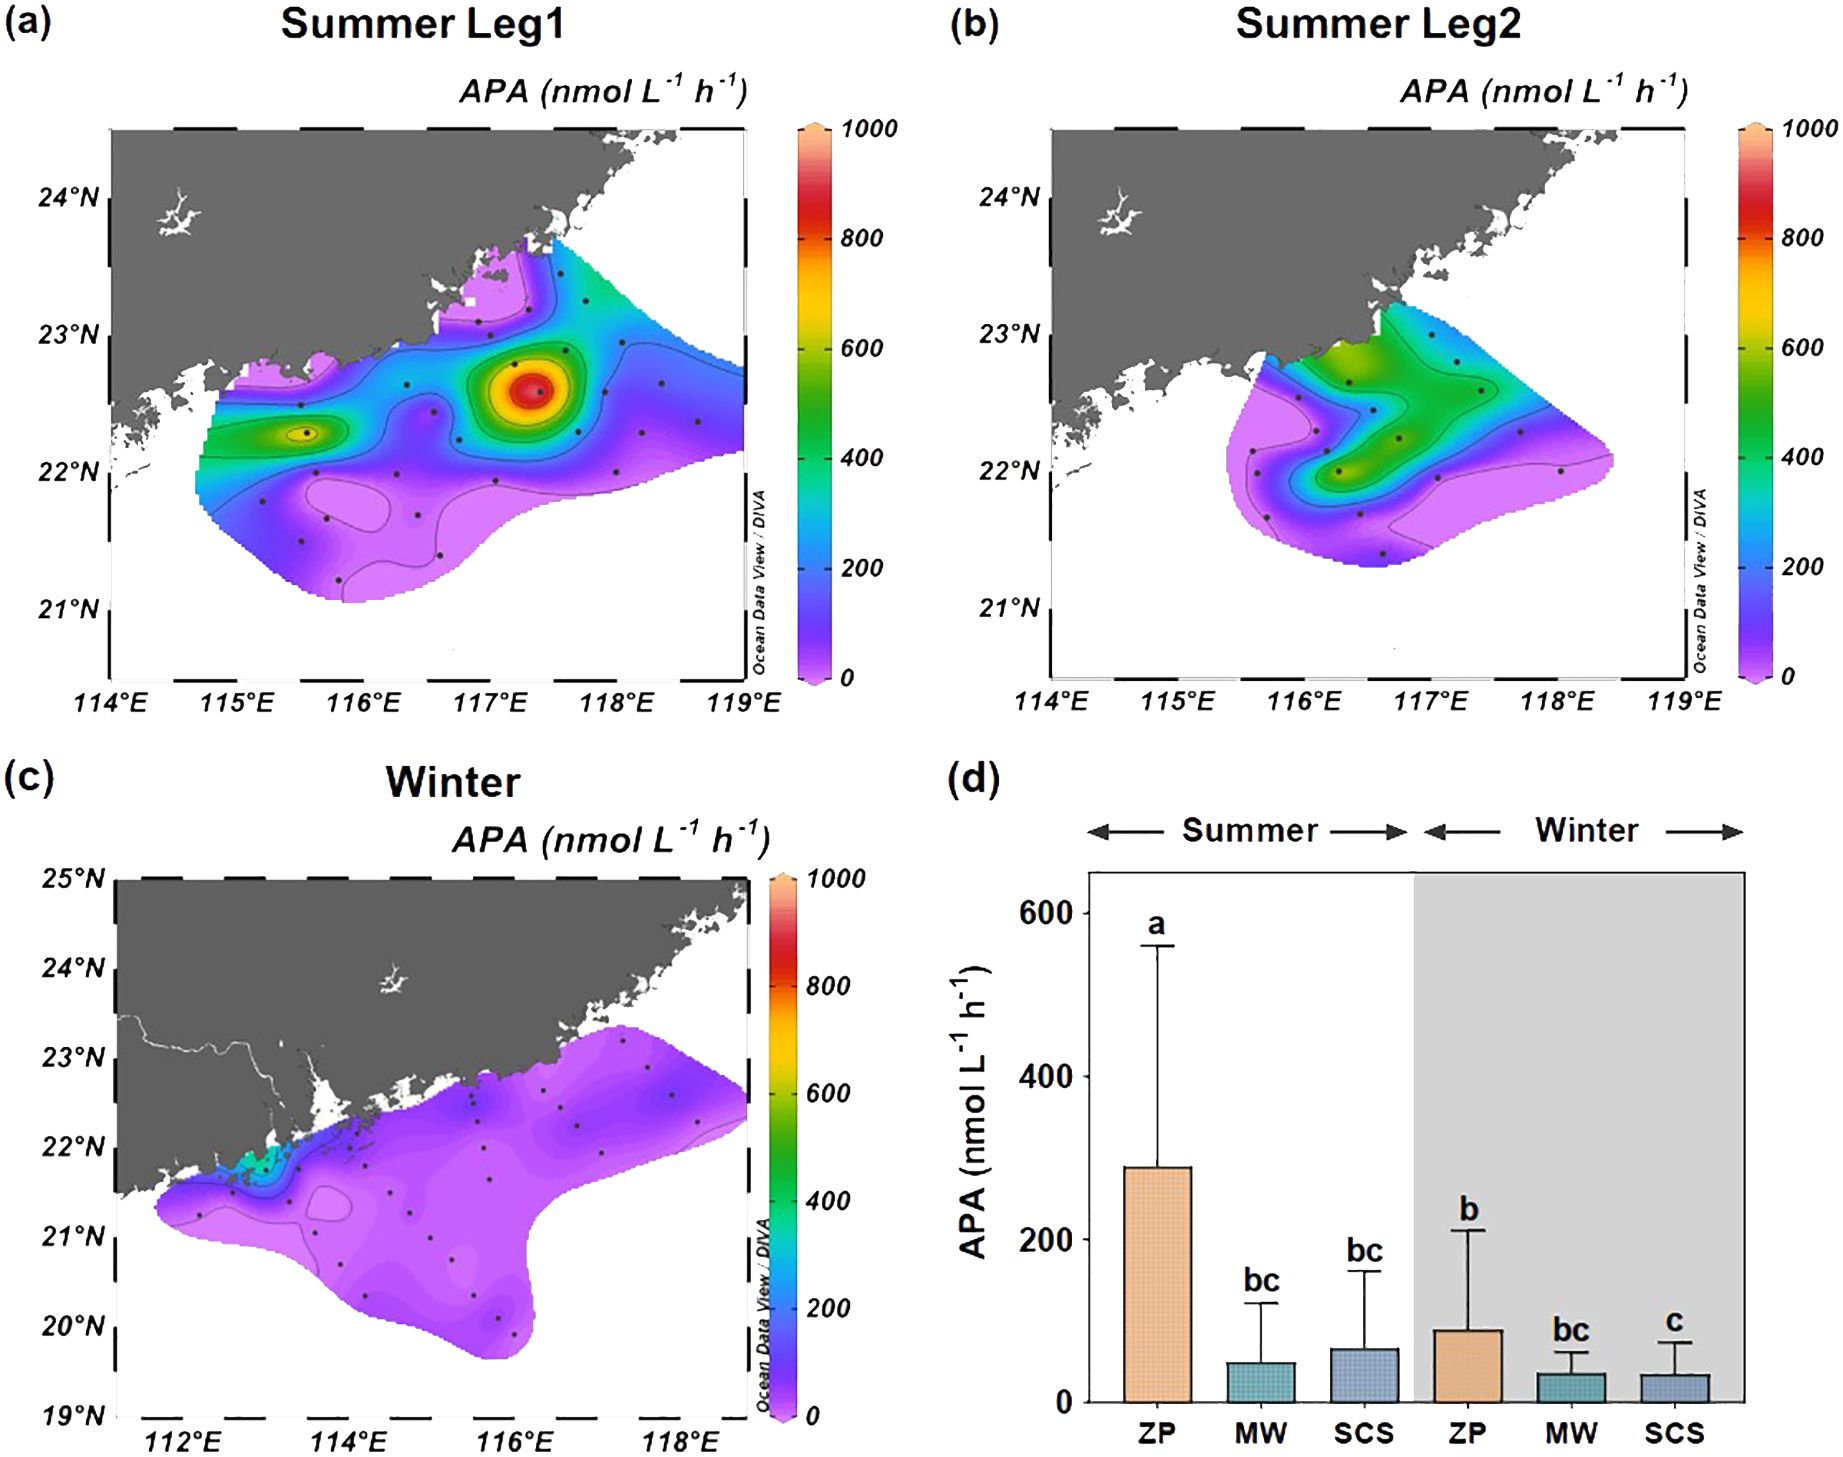
Figure 3. Surface distribution pattern of alkaline phosphatase activity (APA) on the northern South China Sea (NSCS) during summer Leg 1 cruise (A), summer Leg 2 cruise (B), winter cruise (C), and comparison among different water masses (D). ZP denotes the Pearl River plume; SCS refers to the South China Sea water; MW indicates the mixed water of the Pearl River plume and the South China Sea water. Columns with the same letters demonstrate (e.g. a, ab) no significant difference among groups determined by the nonparametric Wilcoxon test, and those with different letters (e.g. a, b) indicate significant differences among groups.
We then compared the APA values among different water masses (Figure 3D). In the summer plume, the APA values averaged of 289 ± 271 nmol h−1 L−1, which was significantly greater than that of other water masses. Although the APA value in the winter plume (89 ± 121 nmol h−1 L−1) was substantially lower than in the summer plume (Wilcoxon test, P < 0.001), it remained significantly higher than the APA value of the SCS water during the winter season (Wilcoxon test, P < 0.05).
3.4 Environmental factors and APA tipping points along the salinity gradient
We evaluated the responses of each environmental factor and APA to salinity with multiple regression model fits and identified the salinities at which these responses changed abruptly. The AIC values fitted using either the GAMs or threshold models were significantly lower than the AIC of the linear fitted model. The indication was that all environmental factors and APA responded to increased salinity in a nonlinear manner (Table 1). The salinity thresholds for the responses of all environmental factors ranged between 33.8 and 34.3 (Figures 4A–E). In contrast, a sharp reduction of APA was detected at a salinity of 32.83 (Figure 4F), with higher APA below this salinity and lower APA above it. This salinity was the boundary of the plume. These findings imply that plankton’s APA underwent a significant shift at the edge of the plume and was more sensitive to changes in water mass than both nutrients and phytoplankton biomass.
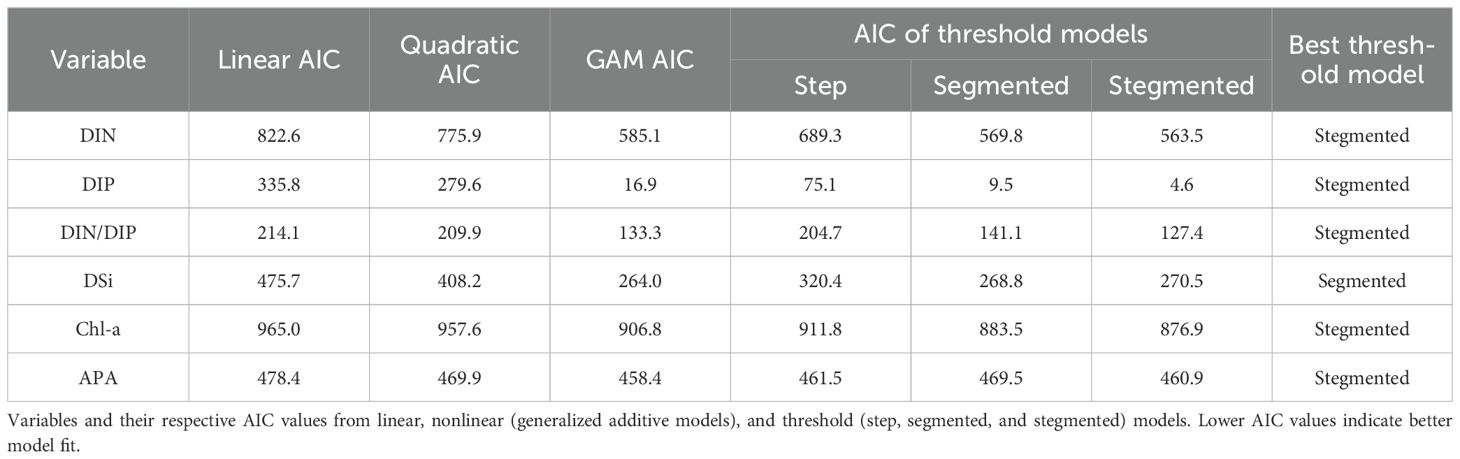
Table 1. Best-fit models for environmental factors and alkaline phosphatase activity (APA).
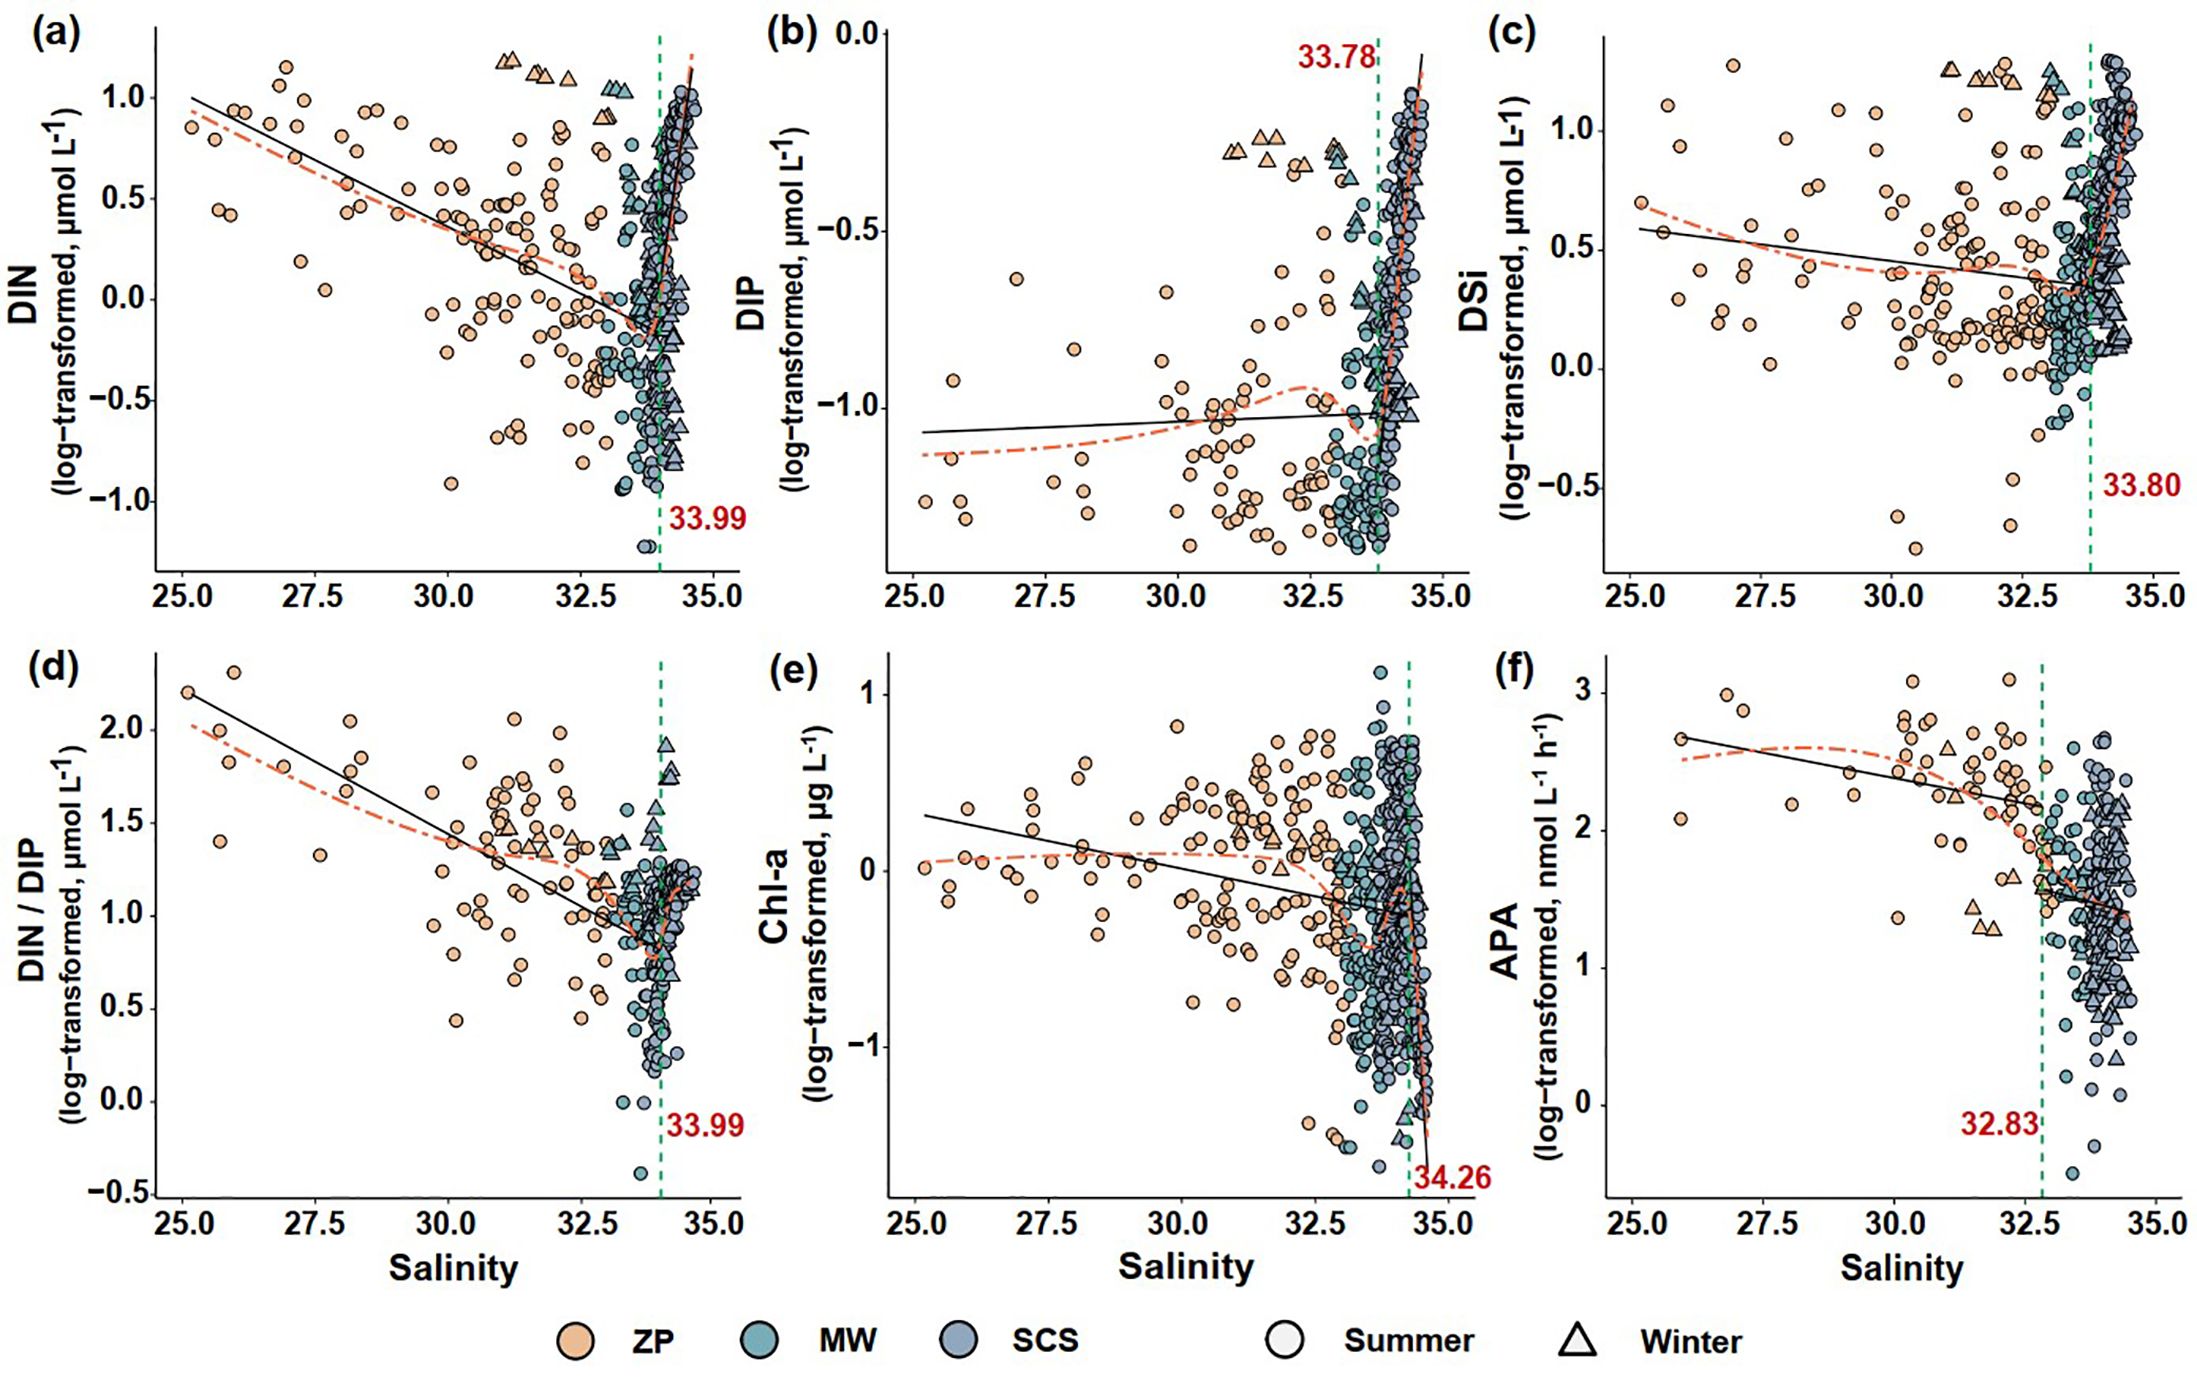
Figure 4. Responses of DIN (A), DIP (B), DSi (C), DIN/DIP ratio (D), Chl-a (E), and alkaline phosphatase activity (APA) (F) to salinity and their respective salinity thresholds. The orange dashed lines represent the nonlinear trends fitted by generalized additive models (GAMs). The vertical green dashed lines and red inset numbers indicate the salinity tipping points identified. The black solid lines denote the linear fit at both sides of each salinity threshold. ZP denotes the Pearl River plume; SCS refers to the South China Sea water; MW indicates the mixed water of the Pearl River plume and the South China Sea water.
3.5 Relationships between environmental factors and APA
We fitted a linear mixed-effects model to evaluate the relationship between environmental factors and APA (Supplementary Table S1; Figure 5). Across the salinity gradient, salinity was significantly and negatively correlated with APA (P < 0.01), whereas Chl-a concentrations were significantly and positively correlated with APA (P < 0.001). Subsequently, we used the moving-window approach to explore how relationships between environmental factors (nutrient concentrations and Chl-a) and APA varied along the salinity gradient (Figure 6; Supplementary Figures S3, S4). Significant negative associations between DIP concentrations and APA were observed throughout almost the entire salinity gradient. DSi concentrations were significantly and positively correlated with APA in the salinity interval 33.4−33.9. Meanwhile, the strong positive correlations between Chl-a concentrations and APA decreased until a salinity of approximately 32.6. Above this salinity level, the correlation remained weakly positive. At a salinity of 32.8, the correlation between the DIN/DIP ratio and APA abruptly changed from positive to negative and was significant and negative at higher salinity intervals. This salinity of 32.8 was almost identical to the salinity at which there was a sharp reduction of APA. These results suggested that elevated DIN/DIP ratios contributed to plankton P-limitation within the plume but exerted inhibitory effects on APA in both the mixing water and the SCS water.
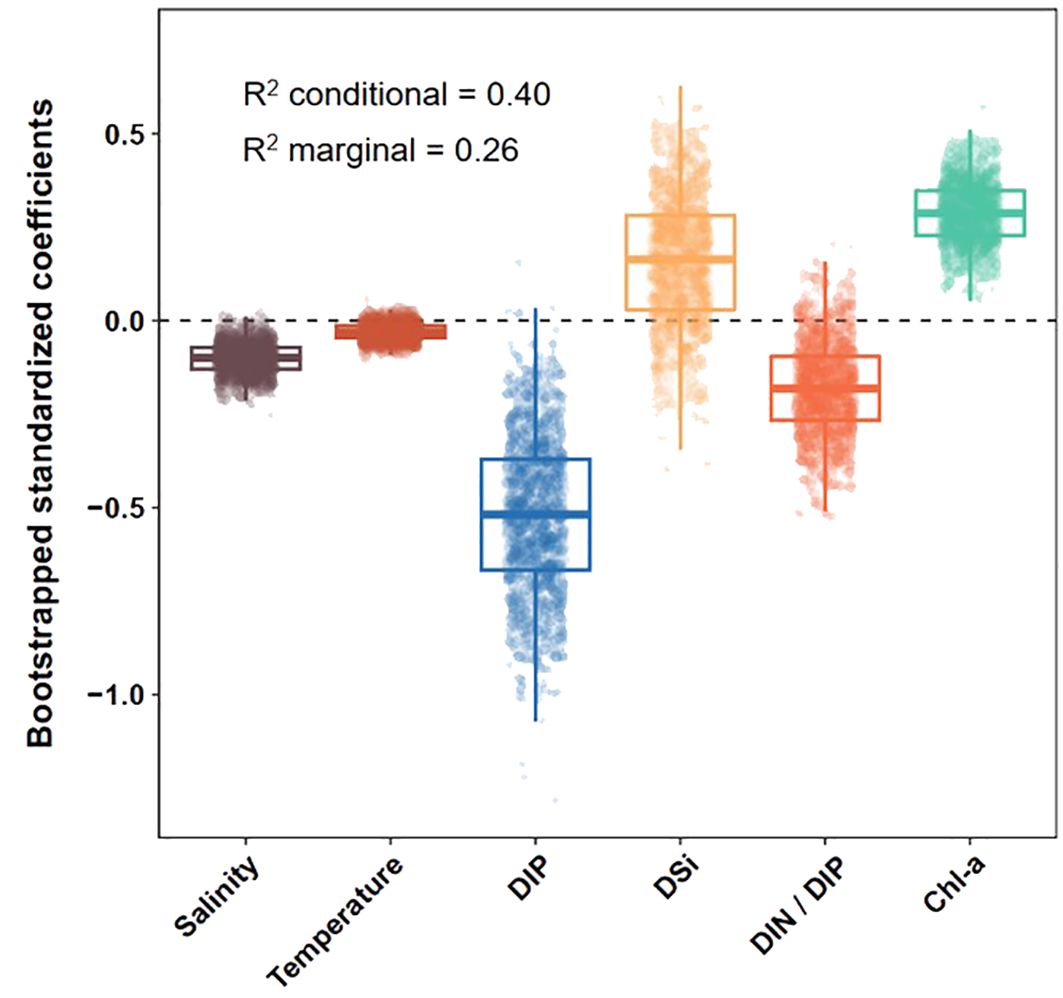
Figure 5. Bootstrapped standardized coefficients of the fixed terms obtained from a linear mixed-effects model. Marginal R2 (variance explained by fixed terms) and conditional R2 (variance explained by fixed and random terms) values are provided.
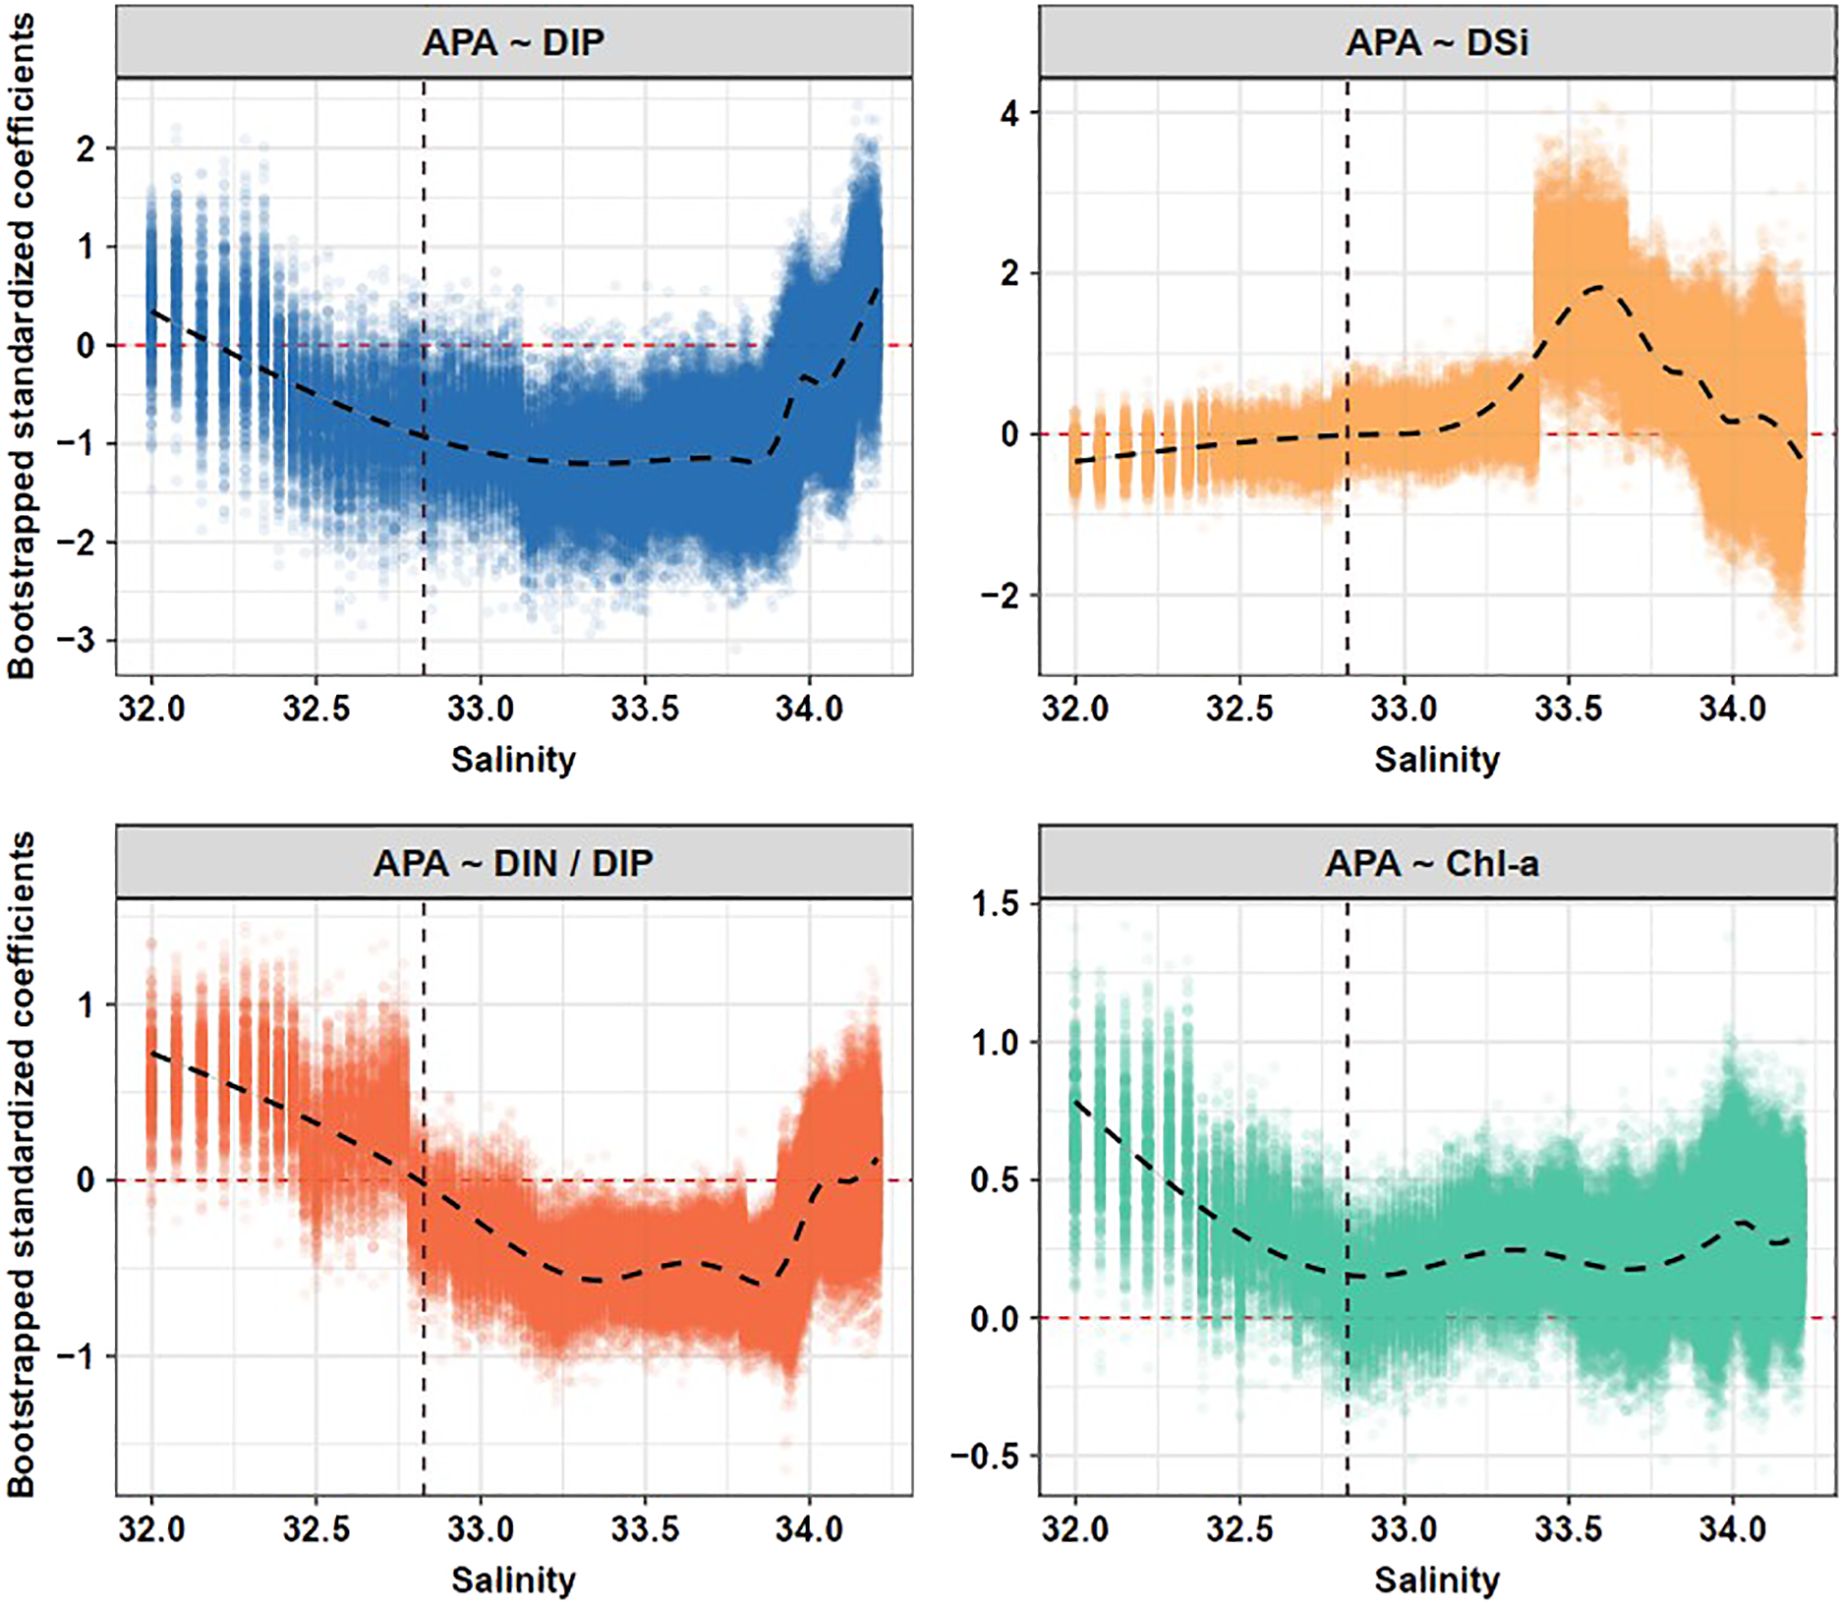
Figure 6. Variations of standardized coefficients between environmental factors (DIP, DSi, DIN/DIP, and Chl-a) and alkaline phosphatase activity (APA) along salinity gradients using a moving-window approach. The dots indicate the bootstrapped coefficients of the fixed terms shown for each subset window. The curved dashed lines denote the nonlinear trend fitted by GAMs. The vertical dashed lines indicate the salinity threshold (32.83) identified from threshold models.
We used SEM to test for the direct and indirect hypothesized relationships between environmental factors and APA. The results showed that the regulatory pathways of APA were significantly different below and above the salinity threshold (32.83) (Figure 7; Supplementary Figure S5). At salinities below the threshold, the DIN/DIP ratio was significantly and positively correlated with APA (P < 0.001) (Figure 7A). Conversely, above the salinity threshold, the DIN/DIP ratio was negatively correlated with APA (P < 0.001) (Figure 7A). Simultaneously, the DSi concentrations not only directly exerted a positive influence on APA (P < 0.01) but also indirectly modulated APA by virtue of its positive impact on Chl-a (Figure 7B).
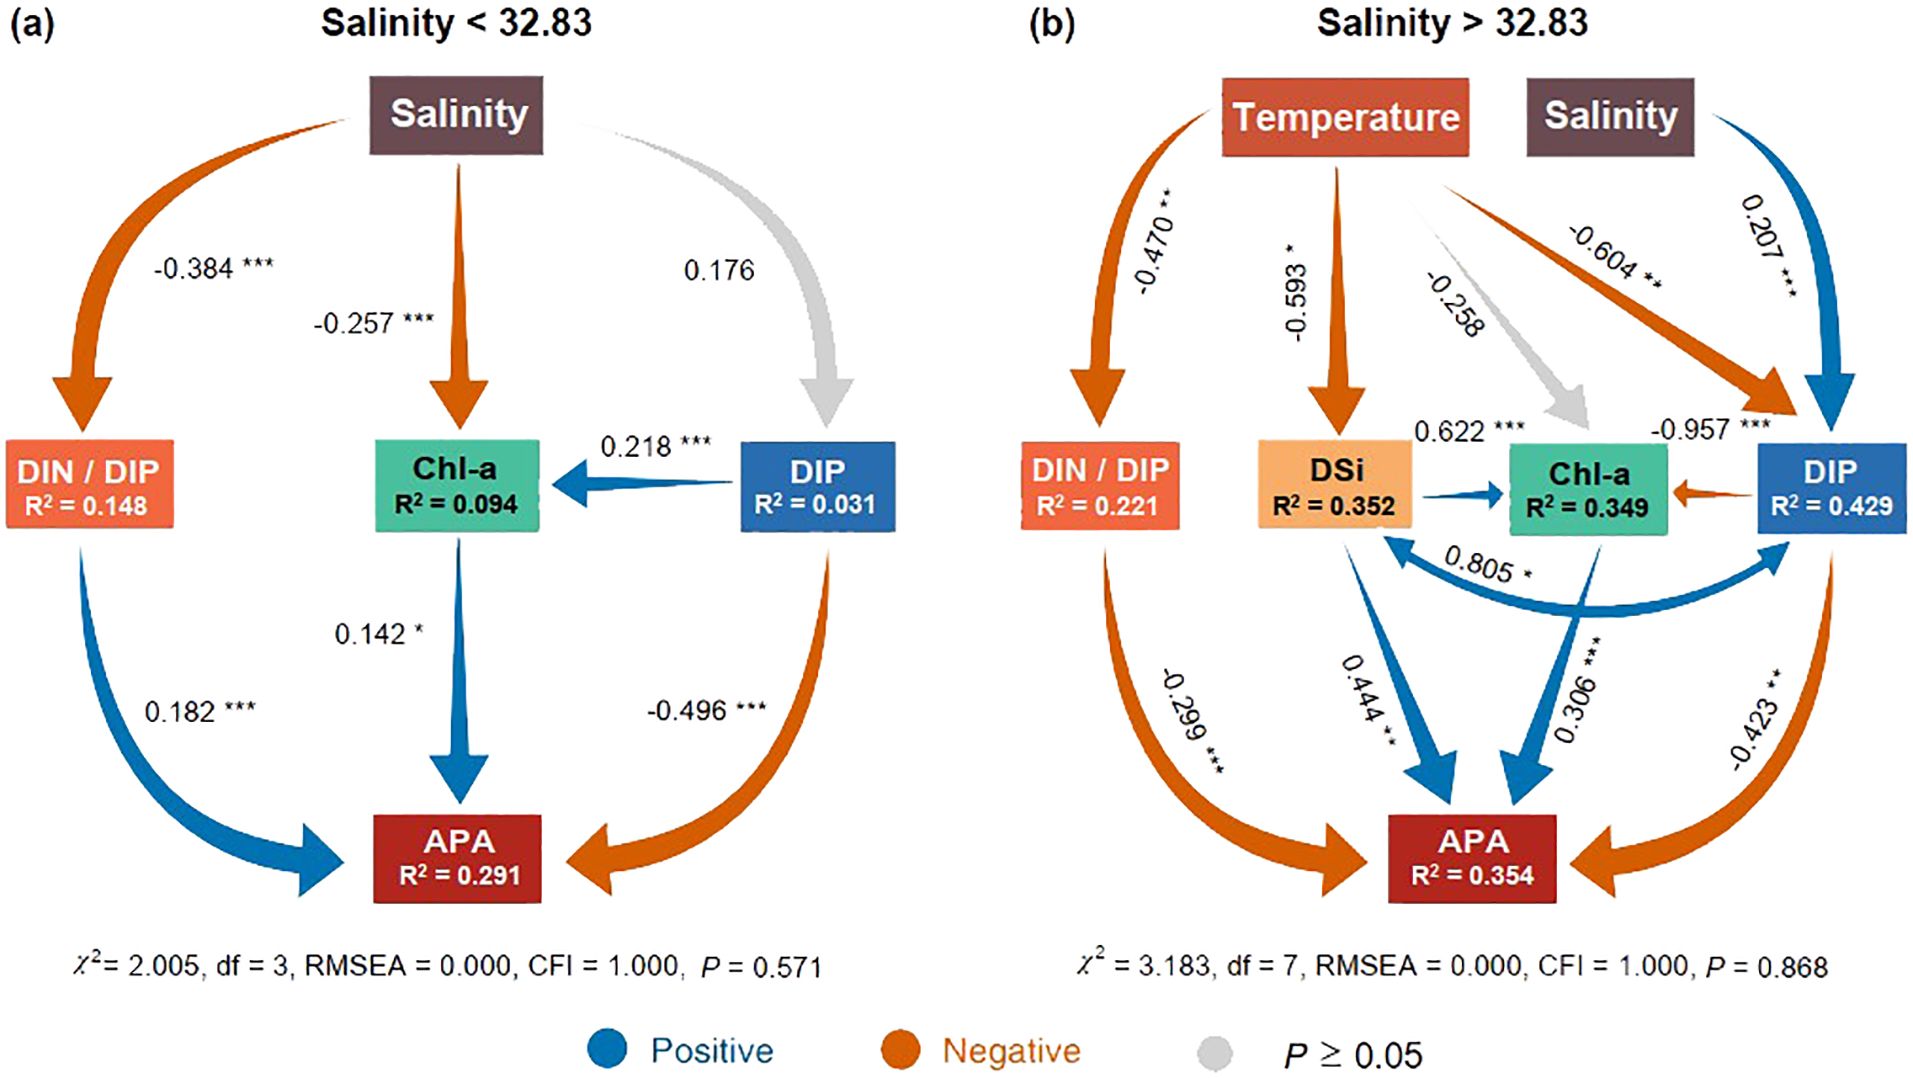
Figure 7. Effects of environmental factors on alkaline phosphatase activity (APA). Structural Equation Models (SEMs) depict the hypothesized direct and indirect relationships among salinity, temperature, DIN, DIP, DSi, DIN/DIP, Chl-a, and APA when salinity is below 32.83 (A) and above this threshold (B). R2 denotes the proportion of variance explained. Blue and orange arrows indicate significant positive and negative relationships, respectively. Significance levels are represented as follows: *P < 0.05, ** P < 0.01, and *** P < 0.001. Goodness-of-fit statistics for the SEMs include the RMSEA (root mean squared error of approximation) and CFI (comparative fit index).
4 Discussion
4.1 Amplified APA values and P-limitation driven by river plume dynamics
Our research provides compelling evidence that river plumes create P-limited conditions in coastal regions, a conclusion supported by meticulous sampling and APA analyses in both summer and winter periods within the NSCS. Importantly, during the summer months, APA values within the Pearl River plume increased to ~4.3 times those measured in the NSCS (Figure 3D). Such patterns of APA distributions correspond with those observed across environmental gradients extending from the Yangtze River Estuary to the East China Sea (Mo et al., 2020), as well as from Sagami Bay, Japan, to the western North Pacific Ocean (Suzumura et al., 2012).
A prevailing hypothesis in the literature suggests that the concentration of DIP is the primary determinant of APA (Labry et al., 2005; Mahaffey et al., 2014). As noted by Ou et al. (2020), heightened AP expression by phytoplankton is evident under conditions of P-stress, especially when DIP concentrations in the coastal waters of the East China Sea fall below the threshold of 0.10 μmol L−1. Similarly, Kang et al. (2019) have delineated a threshold of 0.20 μmol L−1 for the bays of the NSCS. In our observations, the mean DIP concentrations in the summer plume and mixing water were 0.095 ± 0.090 and 0.075 ± 0.066 μmol L−1 (Figure 2C), respectively. These concentrations showed a consistent uptrend across the salinity gradient up to a level of 33.8 (Figure 4B).
An additional point of interest is the imbalanced ratios of DIN/DIP resulting from riverine influx (Tseng et al., 2014; Burson et al., 2016). The concentrations of various nutrients (DIN, DIP, and DSi) in the summer plume were significantly lower than in the winter plume (P < 0.01) (Figures 2B–D). This disparity can be attributed to different seasonal processes. During winter, the reduced biological activity due to lower temperatures results in decreased uptake of nutrients by phytoplankton (Winder and Sommer, 2012), leading to higher concentrations of these nutrients in the water column. Additionally, winter conditions typically involve stronger mixing and less stratification in the water column, which can bring nutrient-rich deep water to the surface (Han et al., 2013), further increasing the concentrations of DIN, DIP, and DSi. Conversely, in summer, enhanced biological activity, driven by higher temperatures and increased light availability, results in higher nutrient uptake by phytoplankton, thereby reducing the concentrations of DIN, DIP, and DSi in the plume water (Han et al., 2013; Tong et al., 2023).
The SCS summer water (salinity > 33.75) primarily included coastal upwelling and the nutrient-rich bottom water (Supplementary Figure S2). Coastal upwelling brings nutrient-rich deep water to the surface, enriching the SCS water (Han et al., 2012). Additionally, the bottom water itself contains high nutrient concentrations (Han et al., 2012), contributing to the overall nutrient levels in the SCS summer water. This combination of coastal upwelling and nutrient-rich bottom water explains the higher nutrient concentrations observed in the SCS summer water compared to the summer plume water (Figures 2B–D).
However, despite these seasonal differences, the DIN/DIP ratio in the plume showed no significant variation between summer (34 ± 36) and winter (22.4 ± 5.7) (P > 0.05). The implication is that within the plume, DIP consumption outpaced DIN consumption if DIN and DIP are taken up by phytoplankton in the standard Redfield ratio of 16 on a molar basis (Redfield et al., 1963). Han et al. (2012) have evaluated the biological assimilation of inorganic nutrients within the NSCS during summer. Their findings revealed a markedly elevated DIN/DIP uptake ratio of 61 ± 9 in the plume. However, these high DIN/DIP ratios can largely be attributed to high DIN concentrations and low DIP concentrations in the river plume. Essentially, these imbalanced nutrient ratios lead to DIN surpluses and DIP limitation, with the ultimate determinant for APA being relatively lower DIP concentrations.
Remarkably, the observed transition in DIP concentration corresponds with the salinity range of 32.6 to 33.9, wherein a pronounced negative correlation between DIP concentration and APA was discerned, as indicated by our mixed-effect model combined with the moving window analysis (Figure 6; Supplementary Figures S3, S4). This congruence highlights the direct regulatory role of DIP concentrations on APA.
4.2 Identification and implications of the salinity threshold in APA dynamics
Plankton dynamics in coastal environments involve a complex interplay of multiple factors, and salinity stands out as one of the principal determinants (Gasiūnaitė et al., 2005; Marshall et al., 2006; O’Boyle and Silke, 2010). Its implications, however, are not just limited to direct effects but span across various ecological interactions, particularly for APA (Labry et al., 2016). Building on this premise, our detailed investigation sought to reveal the role of salinity in shaping APA dynamics, especially identifying any thresholds that could demarcate significant shifts in behavior.
Our study offers clear evidence for a nonlinear APA response to environmental gradients extending from the river plume to offshore seawater, with a notable decline observed at a critical salinity threshold of 32.83 (Figure 4F). Remarkably, this salinity threshold aligns closely with established physical oceanographic benchmarks used to categorize plume masses in this area, specifically a salinity value below 33 (Gan et al., 2009). This suggests that the interplay between coastal water masses exerts a substantial influence on P-limitation. During summer, the water column is strongly stratified by salinity and temperature gradients that prevent offshore waters—characterized by more equilibrated nutrient conditions—from blending with the plume. This stratification leads to a distinct spatial manifestation of plankton P-limitation (Han et al., 2012; Liu et al., 2013).
In addition, the salinity threshold for APA is markedly lower than that for nutrients and Chl-a concentrations. This suggests that P-limitation is more responsive to water mass transitions due to the rapid response of phytoplankton and bacteria to low P availability. APA is quickly produced when P is scarce, making it an immediate indicator (Hoppe, 1983; Ou et al., 2006). Therefore, APA’s lower salinity threshold underscores its sensitivity to subtle environmental changes, particularly in dynamic estuarine and coastal ecosystems (Huang et al., 2007; Mo et al., 2020).
The identification of this salinity threshold is consistent with the findings of various studies that have explored the impact of salinity on phytoplankton dynamics. For example, studies by Kovalenko et al. (2017) have identified critical change-points for pelagic phytoplankton communities across nutrient gradients, highlighting the sensitivity of phytoplankton to environmental thresholds. Additionally, Li et al. (2011) demonstrated the influence of nutrient availability on the seasonal dynamics of Prorocentrum populations in the East China Sea, aligning with our observations of nutrient-driven APA variations.
It is worth considering the broader implications of our identified salinity threshold. The identification of this threshold suggests that there are underlying mechanisms or controls in the environment that drive these abrupt changes in APA response. Natural boundaries or thresholds such as these often signify a change in the dominance of certain biological, physical, or chemical processes (Hu et al., 2021; Zhang et al., 2023). For example, the salinity threshold could demarcate regions of varied microbial community compositions (Kim et al., 2019), each adapted to its respective salinity range and hence exhibiting differential APA expressions (Labry et al., 2016; Ou et al., 2020). Furthermore, the implications of this threshold may extend to the broader ecosystem dynamics. Regions below the threshold might witness different trophic interactions, nutrient cycling patterns, and overall ecosystem productivity compared to those above it (Deppeler et al., 2018; Houk et al., 2020). Such transitions can have profound impacts on the local fisheries, carbon cycling, and biogeochemical processes (Oczkowski and Nixon, 2008; Deppeler et al., 2018). Understanding this threshold in detail might also provide insights into how climate change and anthropogenic activities, which influence riverine freshwater discharges and subsequently coastal salinities, could impact these critical coastal ecosystems in the future (Carpenter and Bennett, 2011; Cloern et al., 2016). Building on the foundational understanding of the salinity threshold, it is pertinent to delve deeper into how various APA responses vary across this gradient and interact with other environmental parameters.
4.3 Varied APA responses to regulatory factors on either side of the salinity threshold
In line with our hypothesis, the relationship between environmental factors and APA demonstrated variability across the salinity gradient (Figure 6; Supplementary Figures S3, S4). Among the environmental variables assessed, the association between DIN/DIP ratios and APA showed the most pronounced shifts on either side of the salinity threshold (Figures 6, 7; Supplementary Figures S3–S5). Previous researches have indicated that DIN/DIP ratios or nutrient reserves alone might not be entirely reliable as markers of nutrient limitation or availability (Dodds, 2006; Turner and Rabalais, 2013). This unreliability arises from the significant affinity many phytoplankton species exhibit towards DIN and DIP. When these nutrients become scarce, their measurable levels can be lower than what conventional analytical techniques can detect (Turner and Rabalais, 2013). Moreover, phytoplankton can adapt by adjusting their internal nutrient quotas and enhancing short-term uptake rates in response to external nutrient concentration shifts (Turner and Rabalais, 2013). More importantly, according to Klausmeier et al. (2004), the standard Redfield DIN/DIP ratio of 16 does not represent a universal biochemical optimum but rather reflects an average species-specific DIN/DIP ratio. Optimal DIN/DIP ratios for different phytoplankton are determined by either competitive equilibrium or exponential growth phase (Klausmeier et al., 2004).
Hence, a combined assessment of biological responses and nutrient conditions is vital to understanding the regulatory dynamics of nutrient limitation and availability. The correlation between DIN/DIP ratio and APA shifted from a positive to a negative near the salinity threshold for APA (Figures 6, 7; Supplementary Figures S3–S5). The implication might be a direct influence of DIN/DIP ratios on the abrupt shift in P-limitation status. Additionally, below the salinity threshold for APA, this relationship displayed a steady linear decrease (Figure 6 and Supplementary Figure S3). This trend can likely be attributed to the plume—a dynamically changing non-equilibrium system—where DIN/DIP ratios inch towards a relative equilibrium as they merge with seawater, diminishing the direct influence on plankton P-limitation. Conversely, the DIN/DIP ratio maintained a consistently negative relationship with APA beyond most of the salinity values (Figure 6 and Supplementary Figure S4). This trend suggests that balanced DIN/DIP ratios in offshore marine environments alleviated P-limitation and thereby lowered expression of APA. Given that the DIN/DIP ratio serves as only a potential determinant of plankton P-limitation, our study highlights the importance of integrating bioassays when evaluating the status of P-limitation.
Relative to other environmental factors, the association between DSi concentrations and APA across the entire salinity gradient appeared to be less pronounced (Figure 6; Supplementary Figures S3, S4). Yet, within the salinity range of 33.41 to 33.87, the positive correlation between APA and DSi concentrations remained significant (Supplementary Figure S4). This might be due to the increased contribution of diatoms to community-level APA within this salinity range. APA production is recognized as a trait that is specific to certain species or cells rather than a generalized reaction to P shortage (Rengefors et al., 2003). Hence, this trait is influenced by the specific physiological needs and regulatory mechanisms of different species. Variations exist in the occurrence and regulation of APA among different phytoplankton species or populations (Huang et al., 2007). Within various phytoplankton groups, the P-mediated thresholds for APA regulation differ (Ou et al., 2006; Meseck et al., 2009). Using cell-associated APA and enzyme-labeled fluorescence (ELF) assays, Dyhrman and Ruttenberg (2006) observe that diatom populations on the Oregon coast display less frequent APA expression than dinoflagellates, since diatoms exhibit more rigorous DIP regulatory activity than dinoflagellates. Building on these results, it seems likely that within plumes, where DIP was deficient, diatoms experienced less severe P-limitation relative to other phytoplankton groups. However, when the salinity exceeded the threshold and DIP levels increased, the contribution of diatoms to overall APA increased.
4.4 Dynamics of phytoplankton and bacteria in APA production relative to the salinity threshold
We found that APA consistently exhibited a positive correlation with Chl-a concentrations across both the mixed-effects model and SEM (Figures 6, 7; Supplementary Figures S3–S5), underscoring the role of phytoplankton biomass in influencing APA (Mo et al., 2020). A noteworthy point, however, is that the strength of the positive correlation between APA and Chl-a concentrations weakened linearly below the salinity threshold for APA of 32.83 (Figure 6; Supplementary Figures S3, S4). Above this salinity threshold, the relationship exhibited lower and stable coefficients (Figure 6; Supplementary Figures S3, S4). The suggestion is that in waters with salinity above this threshold, there was a reduced influence of DIP on phytoplankton growth limitation.
Concurrently, while we have not directly measured the contribution of heterotrophic bacteria to APA, the diminishing correlation between APA and Chl-a concentrations hints at the potential involvement of other APA-producing entities, like bacteria. Such speculation is in line with existing literature, as several studies have highlighted the significant role of heterotrophic bacteria in APA production, particularly in diverse marine environments (Sebastián et al., 2004; Dyhrman and Ruttenberg, 2006; Labry et al., 2016). While both phytoplankton and bacteria possess the capability to secrete APA, the regulatory mechanisms for bacterial APA production are more multifaceted. Typically, phytoplankton produce AP as a response to P-limitation, causing APA suppression in environments with abundant DIP concentrations (Rose and Axler, 1997; Ghyoot et al., 2015). Conversely, in DIP-rich conditions, bacterial AP production can be stimulated not only for organic P recycling but also for mineralizing dissolved organic carbon (DOC) sources (Wambeke et al., 2002; Hoppe, 2003). Therefore, in deeper water samples marked by gradients exceeding the salinity threshold, it is plausible that APA is influenced to some extent by bacteria utilizing DOC from descending surface particles. It is essential, however, to note that the aforementioned bacterial involvement is speculative in our context, and a more comprehensive study would be necessary to delineate the exact contributions of bacteria in APA dynamics, especially across varying salinity gradients.
5 Conclusion
Our study highlights the existence of a significant environmental transition concerning plankton P-limitation at a salinity threshold of 32.83, typically found at the edge of river plumes. The alignment of this salinity threshold with known physical oceanographic benchmarks hints at a profound influence of water mass dynamics on plankton nutrient dynamics. Notably, the observed shift in DIN/DIP ratios around this salinity threshold illustrates the vital role of salinity in modulating plankton P-limitation. Additionally, the weakening positive correlation between Chl-a concentrations and APA as salinity nears this threshold suggests a shift in phytoplankton growth strategies, where they are alleviated from P-limitation. This observed trend hints at the potential involvement of other APA-producing entities. Specifically, the presence of APA in higher salinity waters, with more balanced DIN/DIP ratios, may be explained by bacterial production. Furthermore, our results indicate that DSi, in these offshore zones, could be an additional factor impacting phytoplankton P-limitation.
In conclusion, our study provides valuable insights into the interplay between salinity, nutrient dynamics, and plankton behavior in coastal ecosystems. By identifying the salinity threshold and its broader implications, we have contributed to the foundational understanding of how plankton respond to the shifting nutrient landscapes of complex coastal environments.
Data availability statement
The original contributions presented in the study are included in the article/Supplementary Material. Further inquiries can be directed to the corresponding authors.
Author contributions
SC: Data curation, Investigation, Visualization, Writing – original draft, Writing – review & editing. WL: Data curation, Investigation, Writing – original draft, Writing – review & editing. ZT: Data curation, Methodology, Writing – original draft. LL: Data curation, Methodology, Writing – original draft. LO: Conceptualization, Writing – review & editing. WX: Conceptualization, Funding acquisition, Investigation, Methodology, Writing – review & editing. BH: Conceptualization, Funding acquisition, Investigation, Methodology, Writing – review & editing.
Funding
The author(s) declare financial support was received for the research, authorship, and/or publication of this article. This work was funded by the National Key R&D Program of China (No. 2022YFC3105302) and the National Natural Science Foundation of China (No. 42130401, 42141002, and 42276209).
Acknowledgments
We truly appreciate Aiqin Han for the nutrient data. We also thank the captains and crew of R/V Shiyan III and Dongfanghong II for their cooperation during the field cruises.
Conflict of interest
Author WL was employed by Ltd. MCC Group.
The remaining authors declare that the research was conducted in the absence of any commercial or financial relationships that could be construed as a potential conflict of interest.
Publisher’s note
All claims expressed in this article are solely those of the authors and do not necessarily represent those of their affiliated organizations, or those of the publisher, the editors and the reviewers. Any product that may be evaluated in this article, or claim that may be made by its manufacturer, is not guaranteed or endorsed by the publisher.
Supplementary material
The Supplementary Material for this article can be found online at: https://www.frontiersin.org/articles/10.3389/fmars.2024.1437405/full#supplementary-material
References
Accoroni S., Totti C., Razza E., Congestri R., Campanelli A., Marini M., et al. (2017). Phosphatase activities of a microepiphytic community during a bloom of Ostreopsis cf. ovata in the northern Adriatic Sea. Water Res. 120, 272–279. doi: 10.1016/j.watres.2017.05.004
Barbier E. B., Hacker S. D., Kennedy C., Koch E. W., Stier A. C., Silliman B. R. (2011). The value of estuarine and coastal ecosystem services. Ecol. Monogr. 81, 169–193. doi: 10.1890/10-1510.1
Berdugo M., Delgado-Baquerizo M., Soliveres S., Hernández-Clemente R., Zhao Y., Gaitán J. J., et al. (2020). Global ecosystem thresholds driven by aridity. Science 367, 787–790. doi: 10.1126/science.aay5958
Breitburg D., Levin L. A., Oschlies A., Grégoire M., Chavez F. P., Conley D. J., et al. (2018). Declining oxygen in the global ocean and coastal waters. Science. 359, eaam7240. doi: 10.1126/science.aam7240
Burson A., Stomp M., Akil L., Brussaard C. P. D., Huisman J. (2016). Unbalanced reduction of nutrient loads has created an offshore gradient from phosphorus to nitrogen limitation in the North Sea. Limnol. Oceanogr. 61, 869–888. doi: 10.1002/lno.10257
Cao Z., Dai M., Zheng N., Wang D., Li Q., Zhai W., et al. (2011). Dynamics of the carbonate system in a large continental shelf system under the influence of both a river plume and coastal upwelling. J. Geophys. Res. Biogeo. 116, G02010. doi: 10.1029/2010JG001596
Carpenter S. R., Bennett E. M. (2011). Reconsideration of the planetary boundary for phosphorus. Environ. Res. Lett. 6, 14009. doi: 10.1088/1748-9326/6/1/014009
Chassot E., Bonhommeau S., Dulvy N. K., Mélin F., Watson R., Gascuel D., et al. (2010). Global marine primary production constrains fisheries catches. Ecol. Lett. 13, 495–505. doi: 10.1111/j.1461-0248.2010.01443.x
Cloern J. E., Abreu P. C., Carstensen J., Chauvaud L., Elmgren R., Grall J., et al. (2016). Human activities and climate variability drive fast-paced change across the world’s estuarine–coastal ecosystems. Global Change Biol. 22, 513–529. doi: 10.1111/gcb.13059
Conley D. J., Paerl H. W., Howarth R. W., Boesch D. F., Seitzinger S. P., Havens K. E., et al. (2009). Controlling eutrophication: Nitrogen and phosphorus. Science 323, 1014–1015. doi: 10.1126/science.1167755
Deppeler S., Petrou K., Schulz K. G., Westwood K., Pearce I., McKinlay J., et al. (2018). Ocean acidification of a coastal Antarctic marine microbial community reveals a critical threshold for CO2 tolerance in phytoplankton productivity. Biogeosciences 15, 209–231. doi: 10.5194/bg-15-209-2018
Dodds W. K. (2006). Nutrients and the “dead zone”: the link between nutrient ratios and dissolved oxygen in the northern Gulf of Mexico. Front. Ecol. Environ. 4, 211–217. doi: 10.1890/1540-9295(2006)004[0211:NATDZT]2.0.CO;2
Doney S. C., Ruckelshaus M., Emmett Duffy J., Barry J. P., Chan F., English C. A., et al. (2012). Climate change impacts on marine ecosystems. Annu. Rev. Mar. Sci. 4, 11–37. doi: 10.1146/annurev-marine-041911-111611
Duhamel S., Diaz J. M., Adams J. C., Djaoudi K., Steck V., Waggoner E. M. (2021). Phosphorus as an integral component of global marine biogeochemistry. Nat. Geosci. 14, 359–368. doi: 10.1038/s41561-021-00755-8
Dyhrman S. T., Ammerman J. W., Van Mooy B. A. S. (2007). Microbes and the marine phosphorus cycle. Oceanography 20, 110–116. doi: 10.5670/oceanog.2007.54
Dyhrman S. T., Ruttenberg K. C. (2006). Presence and regulation of alkaline phosphatase activity in eukaryotic phytoplankton from the coastal ocean: Implications for dissolved organic phosphorus remineralization. Limnol. Oceanogr. 51, 1381–1390. doi: 10.4319/lo.2006.51.3.1381
Gan J., Li L., Wang D., Guo X. (2009). Interaction of a river plume with coastal upwelling in the northeastern South China Sea. Cont. Shelf Res. 29, 728–740. doi: 10.1016/j.csr.2008.12.002
Gan J., Lu Z., Dai M., Anson Y., Liu H., Harrison P. (2010). Biological response to intensified upwelling and to a river plume in the northeastern South China Sea: A modeling study. J. Geophys. Res. Oceans 115, C09001. doi: 10.1029/2009JC005569
Gasiūnaitė Z. R., Cardoso A. C., Heiskanen A.-S., Henriksen P., Kauppila P., Olenina I., et al. (2005). Seasonality of coastal phytoplankton in the Baltic Sea: Influence of salinity and eutrophication. Estuar. Coast. Shelf Sci. 65, 239–252. doi: 10.1016/j.ecss.2005.05.018
Ghyoot C., Gypens N., Flynn K. J., Lancelot C. (2015). Modelling alkaline phosphatase activity in microalgae under orthophosphate limitation: the case of Phaeocystis globosa. J. Plankton Res. 37, 869–885. doi: 10.1093/plankt/fbv062
Glibert P. M., Burford M. A. (2017). Globally changing nutrient loads and harmful algal blooms: Recent advances, new paradigms, and continuing challenges. Oceanography 30, 58–69. doi: 10.5670/oceanog.2017.110
Halpern B. S., Frazier M., Potapenko J., Casey K. S., Koenig K., Longo C., et al. (2015). Spatial and temporal changes in cumulative human impacts on the world’s ocean. Nat. Commun. 6, 7615. doi: 10.1038/ncomms8615
Han A., Dai M., Gan J., Kao S.-J., Zhao X., Jan S., et al. (2013). Inter-shelf nutrient transport from the East China Sea as a major nutrient source supporting winter primary production on the northeast South China Sea shelf. Biogeosciences 10, 8159–8170. doi: 10.5194/bg-10-8159-2013
Han A., Dai M., Kao S.-J., Gan J., Li Q., Wang L., et al. (2012). Nutrient dynamics and biological consumption in a large continental shelf system under the influence of both a river plume and coastal upwelling. Limnol. Oceanogr. 57, 486–502. doi: 10.4319/lo.2012.57.2.0486
Hoppe H.-G. (1983). Significance of exoenzymatic activities in the ecology of brackish water: measurements by means of methylumbelliferyl-substrates. Mar. Ecol. Prog. Ser. 11, 299–308. doi: 10.3354/meps011299
Hoppe H.-G. (2003). Phosphatase activity in the sea. Hydrobiologia 493, 187–200. doi: 10.1023/A:1025453918247
Houk P., Comeros-Raynal M., Lawrence A., Sudek M., Vaeoso M., McGuire K., et al. (2020). Nutrient thresholds to protect water quality and coral reefs. Mar. pollut. Bull. 159, 111451. doi: 10.1016/j.marpolbul.2020.111451
Hu W., Ran J., Dong L., Du Q., Ji M., Yao S., et al. (2021). Aridity-driven shift in biodiversity–soil multifunctionality relationships. Nat. Commun. 12, 5350. doi: 10.1038/s41467-021-25641-0
Huang B., Ou L., Wang X., Huo W., Li R., Hong H., et al. (2007). Alkaline phosphatase activity of phytoplankton in East China Sea coastal waters with frequent harmful algal bloom occurrences. Aquat. Microb. Ecol. 49, 195–206. doi: 10.3354/ame01135
Hughes T. P., Linares C., Dakos V., van de Leemput I. A., van Nes E. H. (2013). Living dangerously on borrowed time during slow, unrecognized regime shifts. Trends Ecol. Evol. 28, 149–155. doi: 10.1016/j.tree.2012.08.022
Jickells T. D. (1998). Nutrient biogeochemistry of the coastal zone. Science 281, 217–222. doi: 10.1126/science.281.5374.217
Kang W., Wang Z.-H., Liu L., Guo X. (2019). Alkaline phosphatase activity in the phosphorus-limited southern Chinese coastal waters. J. Environ. Sci. 86, 38–49. doi: 10.1016/j.jes.2019.04.026
Kim K., Samaddar S., Chatterjee P., Krishnamoorthy R., Jeon S., Sa T. (2019). Structural and functional responses of microbial community with respect to salinity levels in a coastal reclamation land. Appl. Soil Ecol. 137, 96–105. doi: 10.1016/j.apsoil.2019.02.011
Klausmeier C. A., Litchman E., Daufresne T., Levin S. A. (2004). Optimal nitrogen-to-phosphorus stoichiometry of phytoplankton. Nature 429, 171–174. doi: 10.1038/nature02454
Kovalenko K. E., Reavie E. D., Allan J. D., Cai M., Smith S. D. P., Johnson L. B. (2017). Pelagic phytoplankton community change-points across nutrient gradients and in response to invasive mussels. Freshw. Biol. 62, 366–381. doi: 10.1111/fwb.12873
Labry C., Delmas D., Herbland A. (2005). Phytoplankton and bacterial alkaline phosphatase activities in relation to phosphate and DOP availability within the Gironde plume waters (Bay of Biscay). J. Exp. Mar. Biol. Ecol. 318, 213–225. doi: 10.1016/j.jembe.2004.12.017
Labry C., Delmas D., Youenou A., Quere J., Leynaert A., Fraisse S., et al. (2016). High alkaline phosphatase activity in phosphate replete waters: The case of two macrotidal estuaries. Limnol. Oceanogr. 61, 1513–1529. doi: 10.1002/lno.10315
Li Y., Lue S., Jiang T., Xiao Y., You S. (2011). Environmental factors and seasonal dynamics of Prorocentrum populations in Nanji Islands National Nature Reserve, East China Sea. Harmful Algae 10, 426–432. doi: 10.1016/j.hal.2010.08.002
Liu H.-C., Gong G.-C., Chang J. (2010). Lateral water exchange between shelf-margin upwelling and Kuroshio waters influences phosphorus stress in microphytoplankton. Mar. Ecol. Prog. Ser. 409, 121–130. doi: 10.3354/meps08603
Liu H.-C., Shih C.-Y., Gong G.-C., Ho T.-Y., Shiah F.-K., Hsieh C., et al. (2013). Discrimination between the influences of river discharge and coastal upwelling on summer microphytoplankton phosphorus stress in the East China Sea. Cont. Shelf Res. 60, 104–112. doi: 10.1016/j.csr.2013.04.017
Mahaffey C., Reynolds S., Davis C. E., Lohan M. C. (2014). Alkaline phosphatase activity in the subtropical ocean: insights from nutrient, dust and trace metal addition experiments. Front. Mar. Sci. 1. doi: 10.3389/fmars.2014.00073
Marshall H. G., Lacouture R. V., Buchanan C., Johnson J. M. (2006). Phytoplankton assemblages associated with water quality and salinity regions in Chesapeake Bay, USA. Estuar. Coast. Shelf Sci. 69, 10–18. doi: 10.1016/j.ecss.2006.03.019
Meseck S. L., Alix J. H., Wikfors G. H., Evan Ward J. (2009). Differences in the soluble, residual phosphate concentrations at which coastal phytoplankton species up-regulate alkaline-phosphatase expression, as measured by flow-cytometric detection of ELF-97® Fluorescence. Estuar. Coast. 32, 1195–1204. doi: 10.1007/s12237-009-9211-7
Mo Y., Ou L., Lin L., Huang B. (2020). Temporal and spatial variations of alkaline phosphatase activity related to phosphorus status of phytoplankton in the East China Sea. Sci. Total Environ. 731, 139192. doi: 10.1016/j.scitotenv.2020.139192
O’Boyle S., Silke J. (2010). A review of phytoplankton ecology in estuarine and coastal waters around Ireland. J. Plankton Res. 32, 99–118. doi: 10.1093/plankt/fbp097
Oczkowski A., Nixon S. (2008). Increasing nutrient concentrations and the rise and fall of a coastal fishery; a review of data from the Nile Delta, Egypt. Estuar. Coast. Shelf Sci. 77, 309–319. doi: 10.1016/j.ecss.2007.11.028
Ou L., Huang B., Lin L., Hong H., Zhang F., Chen Z. (2006). Phosphorus stress of phytoplankton in the Taiwan Strait determined by bulk and single-cell alkaline phosphatase activity assays. Mar. Ecol. Prog. Ser. 327, 95–106. doi: 10.3354/meps327095
Ou L., Qin X., Shi X., Feng Q., Zhang S., Lu S., et al. (2020). Alkaline phosphatase activities and regulation in three harmful Prorocentrum species from the coastal waters of the East China Sea. Microb. Ecol. 79, 459–471. doi: 10.1007/s00248-019-01399-3
Redfield A. C., Ketchum B. H., Richards F. A. (1963). “The influence of organisms on the composition of seawater,” in The composition of seawater. Comparative and descriptive oceanography. The sea, volume 2: Ideas and observations on progress in the study of the seas. Ed. Hill M. N. (New York: Interscience Publishers), 26–77.
Rengefors K., Ruttenberg K. C., Haupert C. L., Taylor C., Howes B. L., Anderson D. M. (2003). Experimental investigation of taxon-specific response of alkaline phosphatase activity in natural freshwater phytoplankton. Limnol. Oceanogr. 48, 1167–1175. doi: 10.4319/lo.2003.48.3.1167
Rose C., Axler R. P. (1997). Uses of alkaline phosphatase activity in evaluating phytoplankton community phosphorus deficiency. Hydrobiologia 361, 145–156. doi: 10.1023/A:1003178502883
Rosseel Y. (2012). lavaan: An R package for structural equation modeling. J. Stat. Software 48, 1–36. doi: 10.18637/jss.v048.i02
Schermelleh-Engel K., Moosbrugger H., Müller H. (2003). Evaluating the fit of structural equation models: tests of significance and descriptive goodness-of -fit measures. Methods Psychol. Res. Online 8, 23–74. doi: 10.13287/j.1001-9332.202201.010
Sebastián M., Arístegui J., Montero M. F., Escanez J., Xavier Niell F. (2004). Alkaline phosphatase activity and its relationship to inorganic phosphorus in the transition zone of the North-western African upwelling system. Prog. Oceanogr. 62, 131–150. doi: 10.1016/j.pocean.2004.07.007
Suzumura M., Hashihama F., Yamada N., Kinouchi S. (2012). Dissolved phosphorus pools and alkaline phosphatase activity in the euphotic zone of the western North Pacific Ocean. Front. Microbiol. 3. doi: 10.3389/fmicb.2012.00099
Sylvan J. B., Dortch Q., Nelson D. M., Maier Brown A. F., Morrison W., Ammerman J. W. (2006). Phosphorus limits phytoplankton growth on the Louisiana shelf during the period of hypoxia formation. Environ. Sci. Technol. 40, 7548–7553. doi: 10.1021/es061417t
Terhaar J., Lauerwald R., Regnier P., Gruber N., Bopp L. (2021). Around one third of current Arctic Ocean primary production sustained by rivers and coastal erosion. Nat. Commun. 12, 169. doi: 10.1038/s41467-020-20470-z
Tong Z., Ma L., Cai S., Wang L., Xiao W., Huang B., et al. (2023). Responses of phytoplankton communities to the effect of both river plume and coastal upwelling. J. Geophys. Res. Biogeo. 128, e2023JG007486. doi: 10.1029/2023JG007486
Tseng Y.-F., Lin J., Dai M., Kao S.-J. (2014). Joint effect of freshwater plume and coastal upwelling on phytoplankton growth off the Changjiang River. Biogeosciences 11, 409–423. doi: 10.5194/bg-11-409-2014
Turner R., Rabalais N. (2013). Nitrogen and phosphorus phytoplankton growth limitation in the northern Gulf of Mexico. Aquat. Microb. Ecol. 68, 159–169. doi: 10.3354/ame01607
Wambeke F. V., Christaki U., Giannakourou A., Moutin T., Souvemerzoglou K. (2002). Longitudinal and vertical trends of bacterial limitation by phosphorus and carbon in the Mediterranean Sea. Microb. Ecol. 43, 119–133. doi: 10.1007/s00248-001-0038-4
Welschmeyer N. A. (1994). Fluorometric analysis of chlorophyll a in the presence of chlorophyll b and pheopigments. Limnol. Oceanogr. 39, 1985–1992. doi: 10.4319/lo.1994.39.8.1985
Winder M., Sommer U. (2012). Phytoplankton response to a changing climate. Hydrobiologia 698, 5–16. doi: 10.1007/s10750-012-1149-2
Wu K., Dai M., Li X., Meng F., Chen J., Lin J. (2017). Dynamics and production of dissolved organic carbon in a large continental shelf system under the influence of both river plume and coastal upwelling: Dynamics and production of dissolved organic carbon. Limnol. Oceanogr. 62, 973–988. doi: 10.1002/lno.10479
Xiao W., Liu X., Irwin A. J., Laws E. A., Wang L., Chen B., et al. (2018). Warming and eutrophication combine to restructure diatoms and dinoflagellates. Water Res. 128, 206–216. doi: 10.1016/j.watres.2017.10.051
Yin K., Harrison P. J. (2008). Nitrogen over enrichment in subtropical Pearl River estuarine coastal waters: Possible causes and consequences. Cont. Shelf Res. 28, 1435–1442. doi: 10.1016/j.csr.2007.07.010
Keywords: Pearl River plume, phytoplankton, phosphorus limitation, coastal ecosystem, threshold model
Citation: Cai S, Liu W, Tong Z, Lin L, Ou L, Xiao W and Huang B (2024) Salinity threshold for phosphorus limitation in an estuary-coast continuum. Front. Mar. Sci. 11:1437405. doi: 10.3389/fmars.2024.1437405
Received: 23 May 2024; Accepted: 12 August 2024;
Published: 26 August 2024.
Edited by:
Travis Blake Meador, Academy of Sciences of the Czech Republic (ASCR), CzechiaReviewed by:
Xuemei Liu, Chinese Academy of Sciences (CAS), ChinaRuifeng Zhang, Shanghai Jiao Tong University, China
Copyright © 2024 Cai, Liu, Tong, Lin, Ou, Xiao and Huang. This is an open-access article distributed under the terms of the Creative Commons Attribution License (CC BY). The use, distribution or reproduction in other forums is permitted, provided the original author(s) and the copyright owner(s) are credited and that the original publication in this journal is cited, in accordance with accepted academic practice. No use, distribution or reproduction is permitted which does not comply with these terms.
*Correspondence: Wupeng Xiao, d3B4aWFvQHhtdS5lZHUuY24=; Bangqin Huang, YnFodWFuZ0B4bXUuZWR1LmNu
†These authors have contributed equally to this work