 Shijing Liu
 Shengnan Liu3
 Huang Liu
- 1Fishery Machinery and Instrument Research Institute, Chinese Academy of Fishery Sciences, Shanghai, China
- 2Sanya Oceanographic Institution, Ocean University of China, Sanya, China
- 3School of Navigation and Naval Architecture, Dalian Ocean University, Dalian, China
Introduction: The eating sounds of largemouth black bass (Micropterus salmoides) are primarily categorized into swallowing and chewing sounds, both intensities of which are closely correlated with fish density and feeding desire. Therefore, accurate recognition of these two sounds is of significant importance for studying fish feeding behavior.
Methods: In this study, we propose a method based on low-dimensional acoustic features for the recognition of swallowing and chewing sounds in fish. Initially, utilizing synchronous audio-visual means, we collect feeding sound signals and image signals of largemouth black bass. By analyzing the time-frequency domain features of the sound signals, we identify 15 key acoustic features across four categories including short-time average energy, average Mel-frequency cepstral coefficients, power spectral peak, and center frequency. Subsequently, employing nine dimensionality reduction algorithms, we select the Top-6 features from the 15-dimensional acoustic features and compare their precision in recognizing swallowing and chewing sounds using four machine learning models.
Results: Experimental results indicate that supervised feature pre-screening positively enhances the accuracy of largemouth black bass feeding feature recognition. Extracted acoustic features demonstrate global correlation and linear characteristics. When considering feature dimensionality and classification performance, the combination of feature dimensionality reduction and recognition model based on the random forest model exhibits the best performance, achieving an identification accuracy of 98.63%.
Discussion: The proposed method offers higher assessment accuracy of swallowing and chewing sounds with lower computational complexity, thus providing effective technical support for the research on precise feeding technology in fish farming.
1 Introduction
Precision feeding technology has long been a focal point in aquaculture research, directly impacting the profitability of aquaculture operations (Bank, 2013). Currently, feeding decisions in aquaculture primarily rely on manual intervention, typically employing timed or quantified feeding methods (Li et al., 2020). However, these methods lack the ability to automatically adjust feed quantities based on the actual dietary requirements of fish, often resulting in overfeeding or underfeeding (Melo et al., 2021). Consequently, the analysis and quantification of fish feeding behavior have emerged as paramount tasks in precision feeding research within aquaculture.
Vocalization represents a crucial behavior in fish, accompanying various activities such as reproduction, territorial behavior, foraging, and swimming (Rountree et al., 2006; Mok and Gilmore, 1983; Chen et al., 2020). Thus, analyzing and quantifying the feeding acoustic signals of aquaculture organisms to determine the feeding sound characteristics could offer theoretical guidance for intelligent feeding systems in aquaculture (Pěnka et al., 2023). Sound signals produced by the giant tiger prawn (Penaeus monodon) during feeding exhibit a linear correlation with feed consumption and have been utilized to identify feeding activities (Smith and Simon, 2013). The shrimp (Litopenaeus vannamei) demonstrates characteristic differences in chewing sounds, enabling the determination of the onset and duration of feeding processes. Additionally, feed consumption levels can be assessed based on the frequency and peak values of the generated acoustic signals (Hamilton et al., 2023; Lagardère et al., 2004). While research progress in crustaceans has been notable, studies focusing on precise feeding technology based on passive acoustic techniques in fish are still in their infancy. Silva et al. discovered that during feeding, both the turbot (Scophthalmus maximus) (Lagardère and Mallekh, 2000) and trout (Oncorhynchus mykiss) (Lagardère et al., 2004) predominantly concentrate their feeding sounds within the 2-5 kHz range, with variations in sound pressure levels ranging from 15 to 20 dB, reflecting changes in feeding sound intensity (Silva et al., 2019). Such variations hold promise for the development of fish feeding sound detectors. Cao et al. discovered that the sound produced by largemouth bass during feeding is primarily concentrated in the frequency range of 4.2 to 7.4 kHz (Cao et al., 2021). Additionally, there are significant differences in the resonance peaks and Mel-frequency cepstral coefficients of the feeding sound signals across different feeding stages. This finding suggests that these two parameters have the potential to serve as candidate features for identifying feeding sounds.
In terms of automatic sound recognition research, there is limited research on fish feeding sounds, but relevant studies have been conducted in other agricultural fields (Nunes et al., 2021). In the direction of livestock and poultry sound recognition, extensive research has been conducted on the classification of pig cough sounds, and machine learning techniques have gradually been applied to the field of pig cough sound recognition. By optimizing feature selection and classifiers, the recognition accuracy has significantly increased, with pig cough classification rates increasing to 94.0%-95.4% (Ji et al., 2022; Yin et al., 2023). Automatic recognition technology is also employed in the study of grazing behavior among pasture animals. These researches utilize integrated audio and video analysis techniques to accurately pinpoint the temporal sequence characteristics of sounds such as chewing, biting, and rumination produced by animals like horses (Nunes et al., 2021) and cattle (Deniz et al., 2017) during feeding. And then utilizing recursive networks with time-series analysis capabilities, these sounds are identified, achieving an average recognition accuracy exceeding 80%. In the domain of bird sound recognition, intelligent recognition techniques based on Support Vector Machines (SVMs), Artificial Neural Networks (ANNs), and Deep Learning algorithms have been gradually implemented (Kumar et al., 2022; Lauha et al., 2022). The adoption of multi-feature fusion recognition methods has exhibited higher recognition accuracy in this field, with an average recognition accuracy ranging between 93% and 96%. Furthermore, there is minimal variance in performance among different recognition algorithms. This further substantiates the significance of sound feature selection in bird sound recognition (Yang et al., 2022).
In conclusion, in order to improve the classification performance of fish feeding sounds and reduce the complexity of sound recognition, this study focuses on largemouth black bass and proposes a recognition algorithm for fish swallowing and chewing sounds. The proposed method utilizes a combined analysis of audio and video, enabling accurate temporal segmentation of the sound. Subsequently, key sound features that exhibit significant differentiation are selected through feature analysis, and a low-dimensional acoustic feature dataset is constructed using different feature selection algorithms. Finally, by comparing the accuracy of different recognition algorithms and the extent of feature dimension reduction, the most suitable feature selection and recognition algorithm are determined.
The novelty of this work lies in:
1. We first apply machine learning method to the recognition of fish swallowing and chewing sounds.
2. The present study find that the features used to identify the feeding sounds of largemouth black bass exhibit linearity and global characteristics, which provide valuable clues for further research.
3. By utilizing low-dimensional features, it has achieved the competitive results in swallowing and chewing sound recognition, providing an important foundation for acoustic-based research on fish feeding behavior.
2 Materials and methods
2.1 Experimental subject
This experiment utilized largemouth black bass as the experimental material, with fingerlings purchased from Acoman (Shanghai) Agriculture Co. We selected four fish for the experiment, labeled as A1, A2, A3, and A4. These fish had an average body length of 26.5 ± 3.5 cm and an average body weight of 255 ± 53 g. The water temperature is maintained at 30.1 ± 2.6°C, dissolved oxygen at 7.0 ± 2 mg/L, and pH at 7.8 ± 0.3. Hard pellet extruded feed (produced by Huzhou Yishen Aquatic Feed Co., Ltd.) is used to feed the experimental fish.
2.2 Acoustic signal acquisition
The acoustic signal acquisition system for largemouth bass is shown in Figure 1. The main equipment for this experiment includes a test tank with a filtration pool and a small recirculating water system (dimensions: 1.5 m × 1 m × 1.5 m), a pressure-sensitive detector (model: AQH-020; frequency range: 20 Hz-20 kHz), a preamplifier (model: Aquafinger IV; gain control: 20-70 dB), an external sound card (model: UA-55), and a recording device - SPORTS CAMERA 4K high-definition image stabilization digital camera (model: QOER V70). In this study, video and audio are recorded simultaneously, with a sampling frequency set at 9.6 kHz, a sampling precision of 24 bits, a single-channel sampling, and a signal-to-noise ratio of 50 dB. The recording periods are 7:00-8:00 and 19:00-20:00, and each feeding is conducted at 3% of the fish’s body weight.
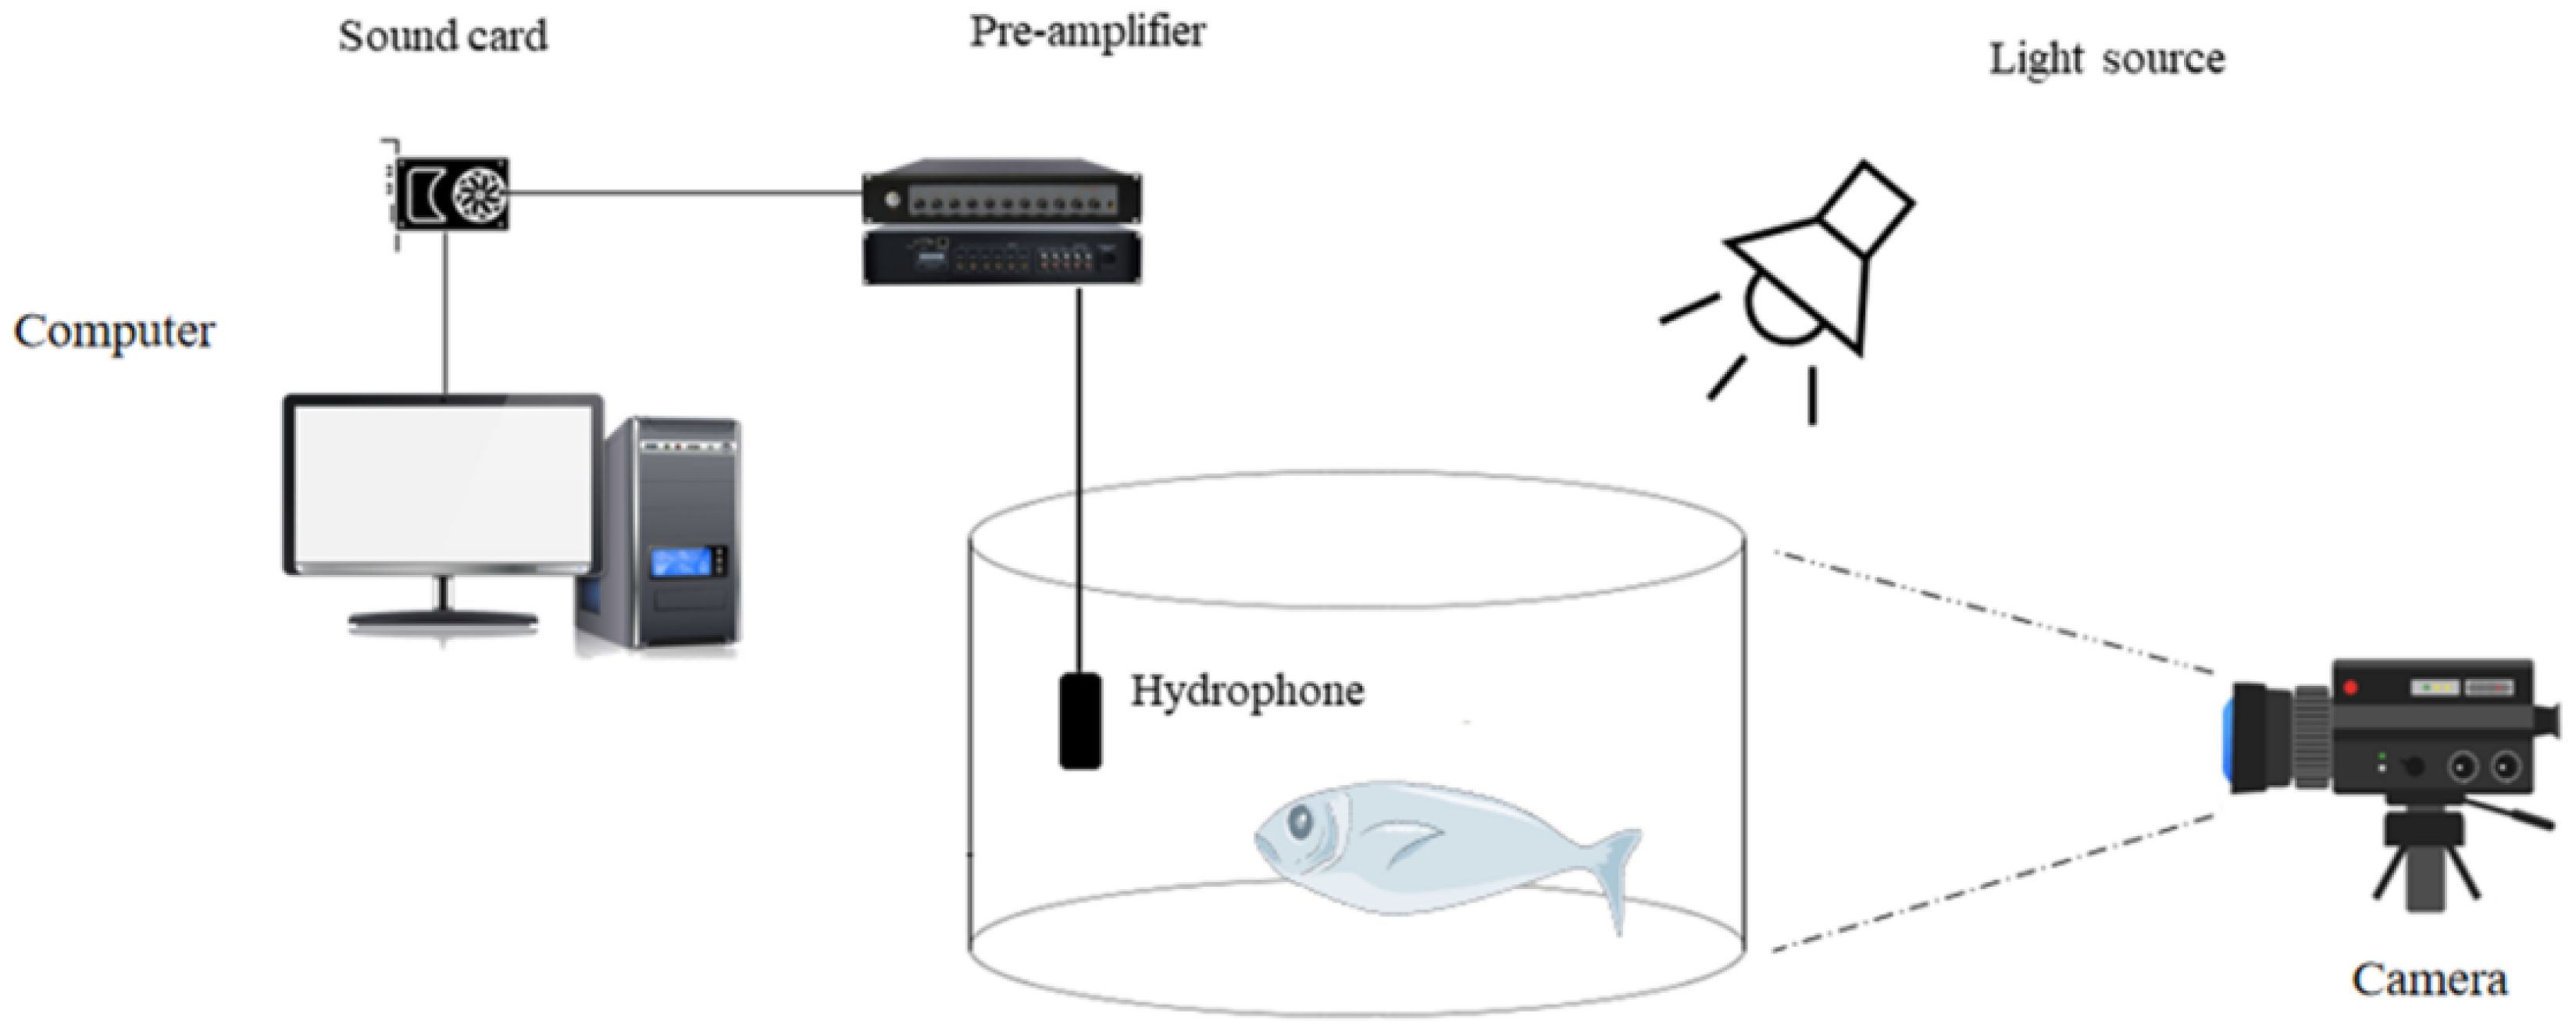
Figure 1. Schematic diagram of signal acquisition system.
2.3 Acoustic signal pre-processing
The feeding sound signals of large mouth black bass encompass noises such as background noise. To effectively extract feeding acoustic signals, the following operations are performed as Cao et al. (2021):
Pre-emphasis: In the feeding sounds of largemouth black bass, high-frequency components are usually more susceptible to noise interference. Pre-emphasis can effectively reduce the relative impact of low-frequency noise, thereby improving the clarity of the feeding sounds. The calculation formula is as follows.
where x(n) is the input audio signal, x[n] is the pre-emphasized signal, and α is the pre-emphasis coefficient (set to 0.97 in this study).
Feeding frame splitting: Since Feeding sounds are often brief and transient. By splitting the audio into frames, small segments can be focused on and these short-duration sounds can be captured more effectively. Specifically, the length of the frame is set to 100 ms and the frame shift (overlap) is set to 50 ms. Further, to correlate feeding sound signals with feeding behaviors, it is necessary to further segment the feeding sound into key segments corresponding to the feeding behaviors. In this work, Adobe Audition 2020 is used to precisely isolate the feeding frames by referencing the corresponding feeding videos.
Applying window function: When the audio frames is spitted, the edges of the truncated signal can cause frequency representation distortions, making it challenging to accurately analyze and identify feeding sounds. By applying a window function, the edges of the signal segments can be smoothed, reducing discontinuities. In this work, the Hamming window is used because it effectively reduces spectral leakage while maintaining a relatively narrow main lobe (Zheng et al., 2007). The formula is as follows:
where n represents the sample index within the window and ranges from 0 to N, N is the total number of samples in the window, also known as the window length. is the weight or value of the Hamming window at the n-th sample. is the input audio signal, is the processed signal.
Audio Subspace Spatial Acoustic Source Enhancement (ASSASE) (Ephraim and Van Trees, 1995): The ASSASE method decomposes the signal space into two subspaces: the noise subspace and the noisy sound signal subspace. The noise subspace is then removed. When the signal is affected by noise, the characteristic vectors in the pure sound signal subspace are disturbed, forming a signal space that overlaps with the noise subspace. The remaining part of the originally pure signal space becomes the pure noise space. Therefore, by appropriately eliminating the pure noise subspace and using the most effective algorithm to estimate the signal in the noisy sound signal subspace, the original pure signal subspace can be recovered as much as possible, thereby improving the signal-to-noise ratio (SNR).
2.4 Feature selection
For machine learning, a large amount of input data can lead to the curse of dimensionality, which affects learning efficiency and can result in overfitting. This study selected several typical acoustic analysis features (Barroso et al., 2023; Abdul and Al-Talabani, 2022), such as short-time average energy, mean Mel-frequency cepstral coefficients, and power spectrum, for analysis. Subsequently, nine dimensionality reduction algorithms suitable for different data types are used to further reduce the dimensionality of the preselected data, aiming to discover low-dimensional features that can effectively represent the eating sound.
2.4.1 Short-time average energy
Short-time average energy is an essential parameter in time-domain analysis of sound signals, capable of reflecting the characteristics of energy fluctuations (Cao et al., 2021). As illustrated in Figure 2, fluctuations in the spectrum occur after largemouth black bass ingest feed, and the amplitudes can be effectively captured. Furthermore, there exists a positive correlation between amplitude and energy, which to some extent, reflects the strength of the energy. Figure 3 (Qi, 2023) illustrates the probability distribution and significance analysis of the short-time average energy for four largemouth black bass. From Figure 3, it can be observed that there is no significant difference in the swallowing and chewing sounds among different largemouth black bass. However, there is a significant difference between the swallowing and chewing sounds. Hence, the short-time average energy can be utilized as an acoustic classification feature for largemouth black bass, as expressed by the formula:
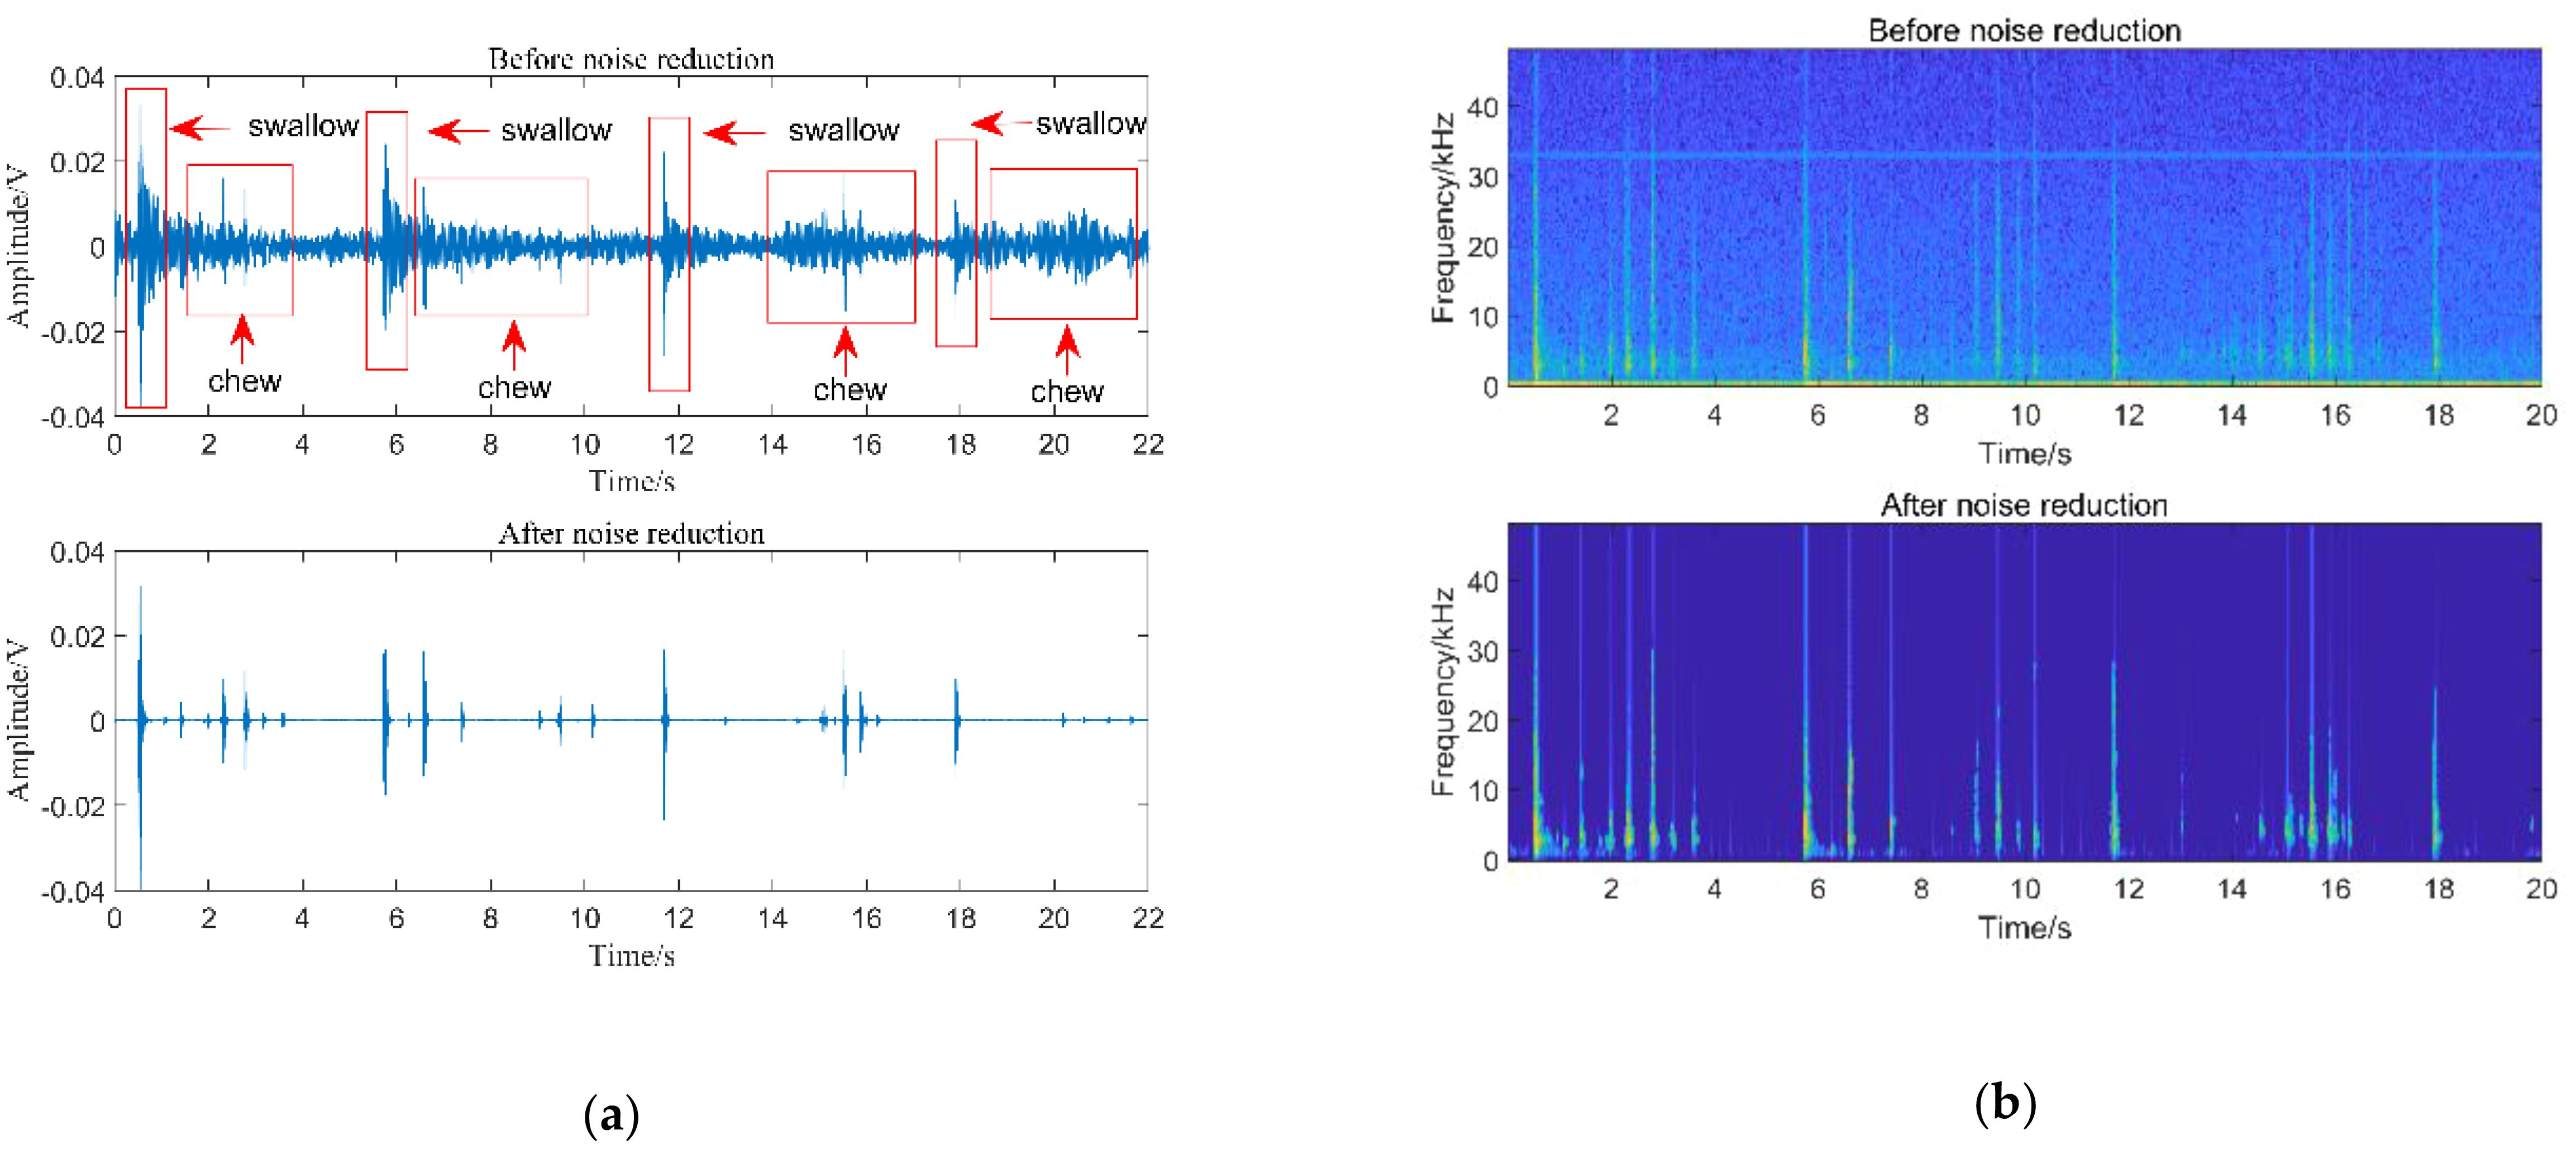
Figure 2. Noise reduction of feeding sound: (A) Waveform diagram of 4 feeding processes; (B) Speech spectrum diagram of 4 feeding processes.
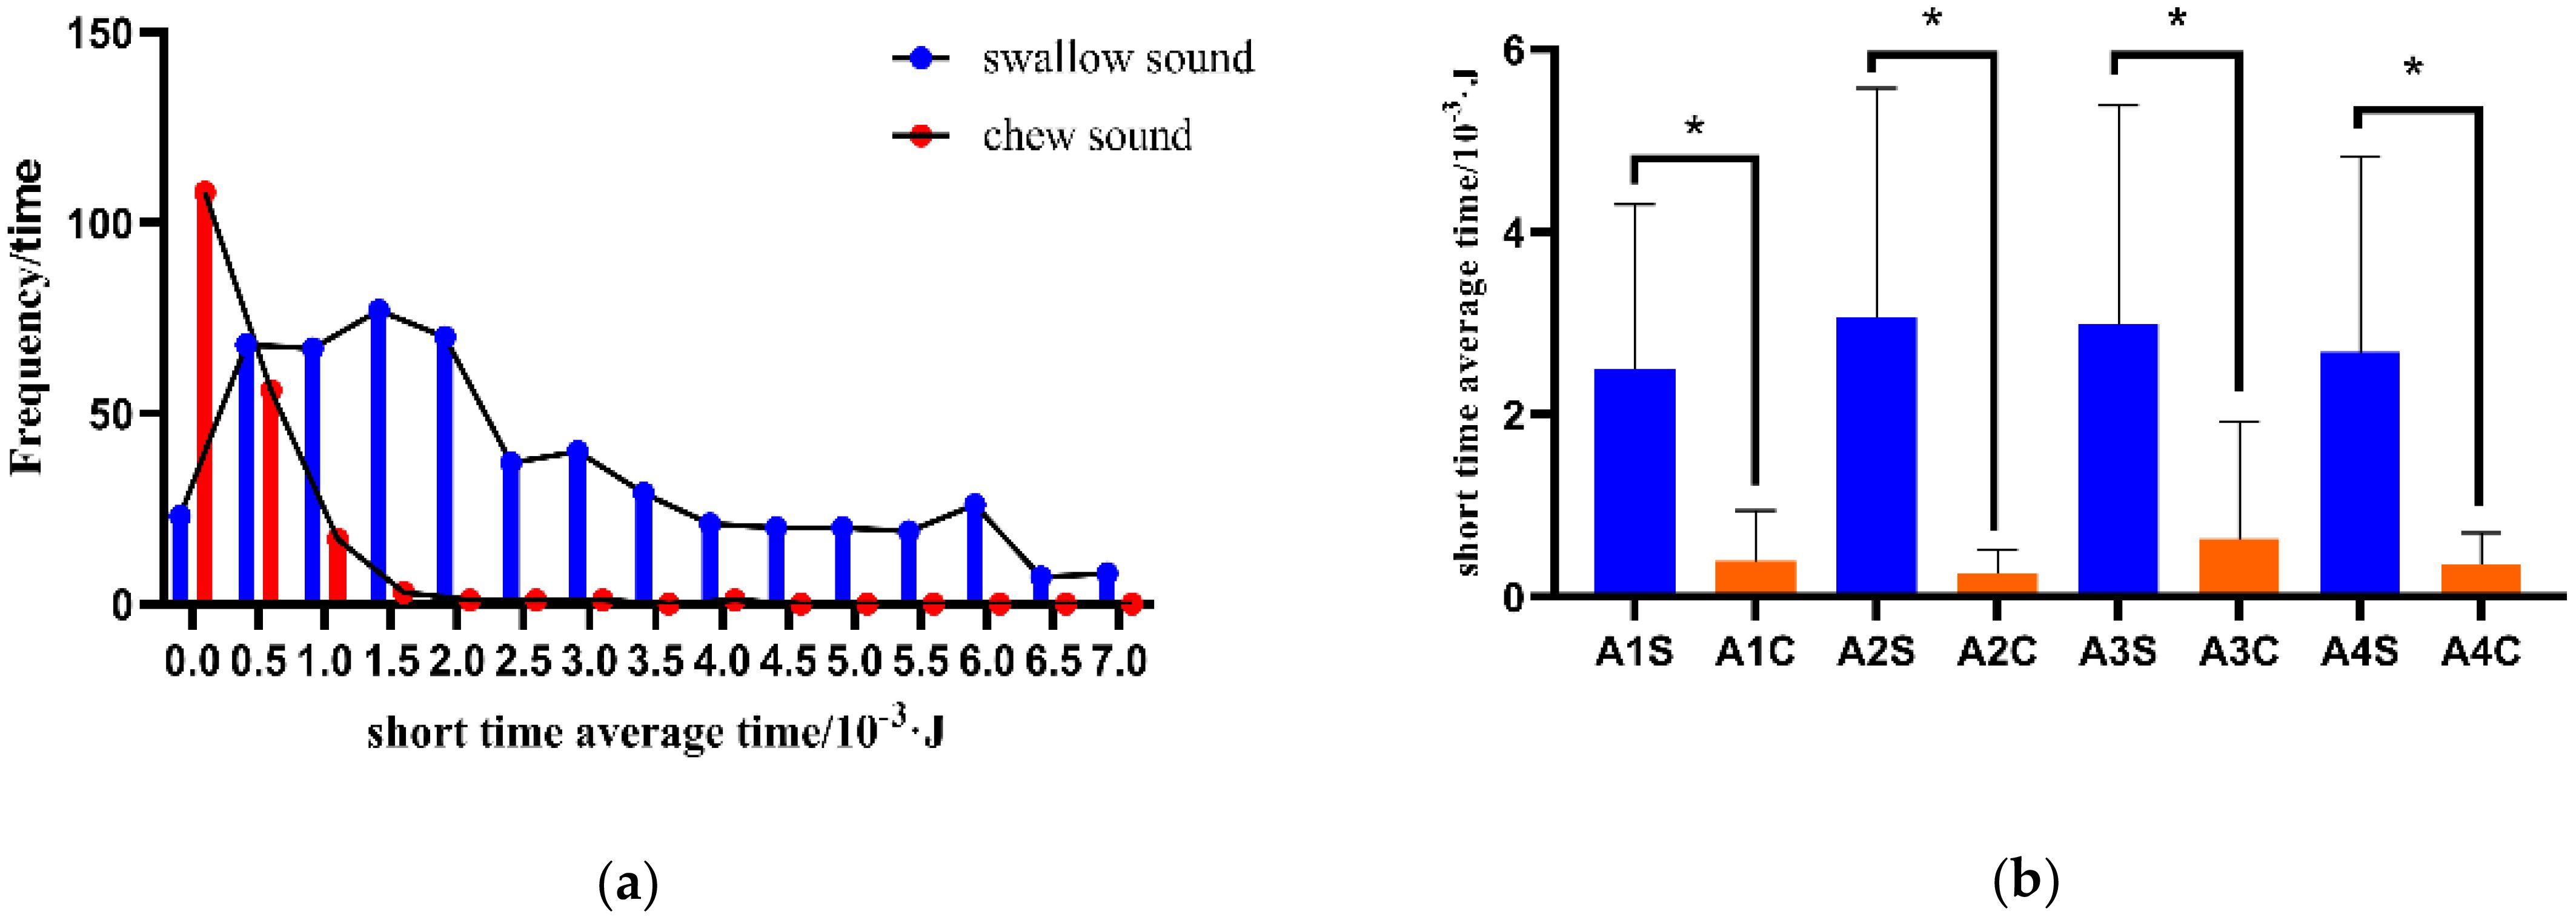
Figure 3. Short-time mean energy analysis of largemouth black bass feeding sounds. (A) Probability distribution of short-time average energy of largemouth black bass feeding sound. (B) Significance analysis of swallowing and chewing sounds in largemouth black bass. S represents the swallowing sound and C represents the chewing sound in the picture.
where represents the m-th sample point of the n-th frame of the sound signal.
2.4.2 Average Mel-frequency Cepstral Coefficients
Average Mel-frequency Cepstral Coefficients (AMFCCs) is a commonly used acoustic feature extraction method that has been widely applied in the field of speech analysis due to its resemblance to human auditory perception and its good information compression capability.
To highlight the universality of the experimental samples, this paper randomly selects 15 instances of swallowing and chewing sounds from four fish to construct the AMFCCs variation curves. As shown in Figure 4, both swallowing and chewing sounds of the four fish exhibit a pronounced peak at the 2nd coefficient. However, for the chewing sounds, there is a distinct peak at the 5th coefficient in the AMFCCs, and the 6th and 7th coefficients show similar changing trends, which are significant features differentiating chewing sounds from swallowing sounds. Additionally, there are overall differences in the trend of the AMFCCs between swallowing and chewing sounds. These differences can be used to distinguish and recognize different sound characteristics. Therefore, in order to fully utilize the diversity among the data, this paper selects all 12 dimensions of the AMFCCs as the acoustic features for the classification of feeding sounds. The formula for calculating the AMFCCs is as follows:
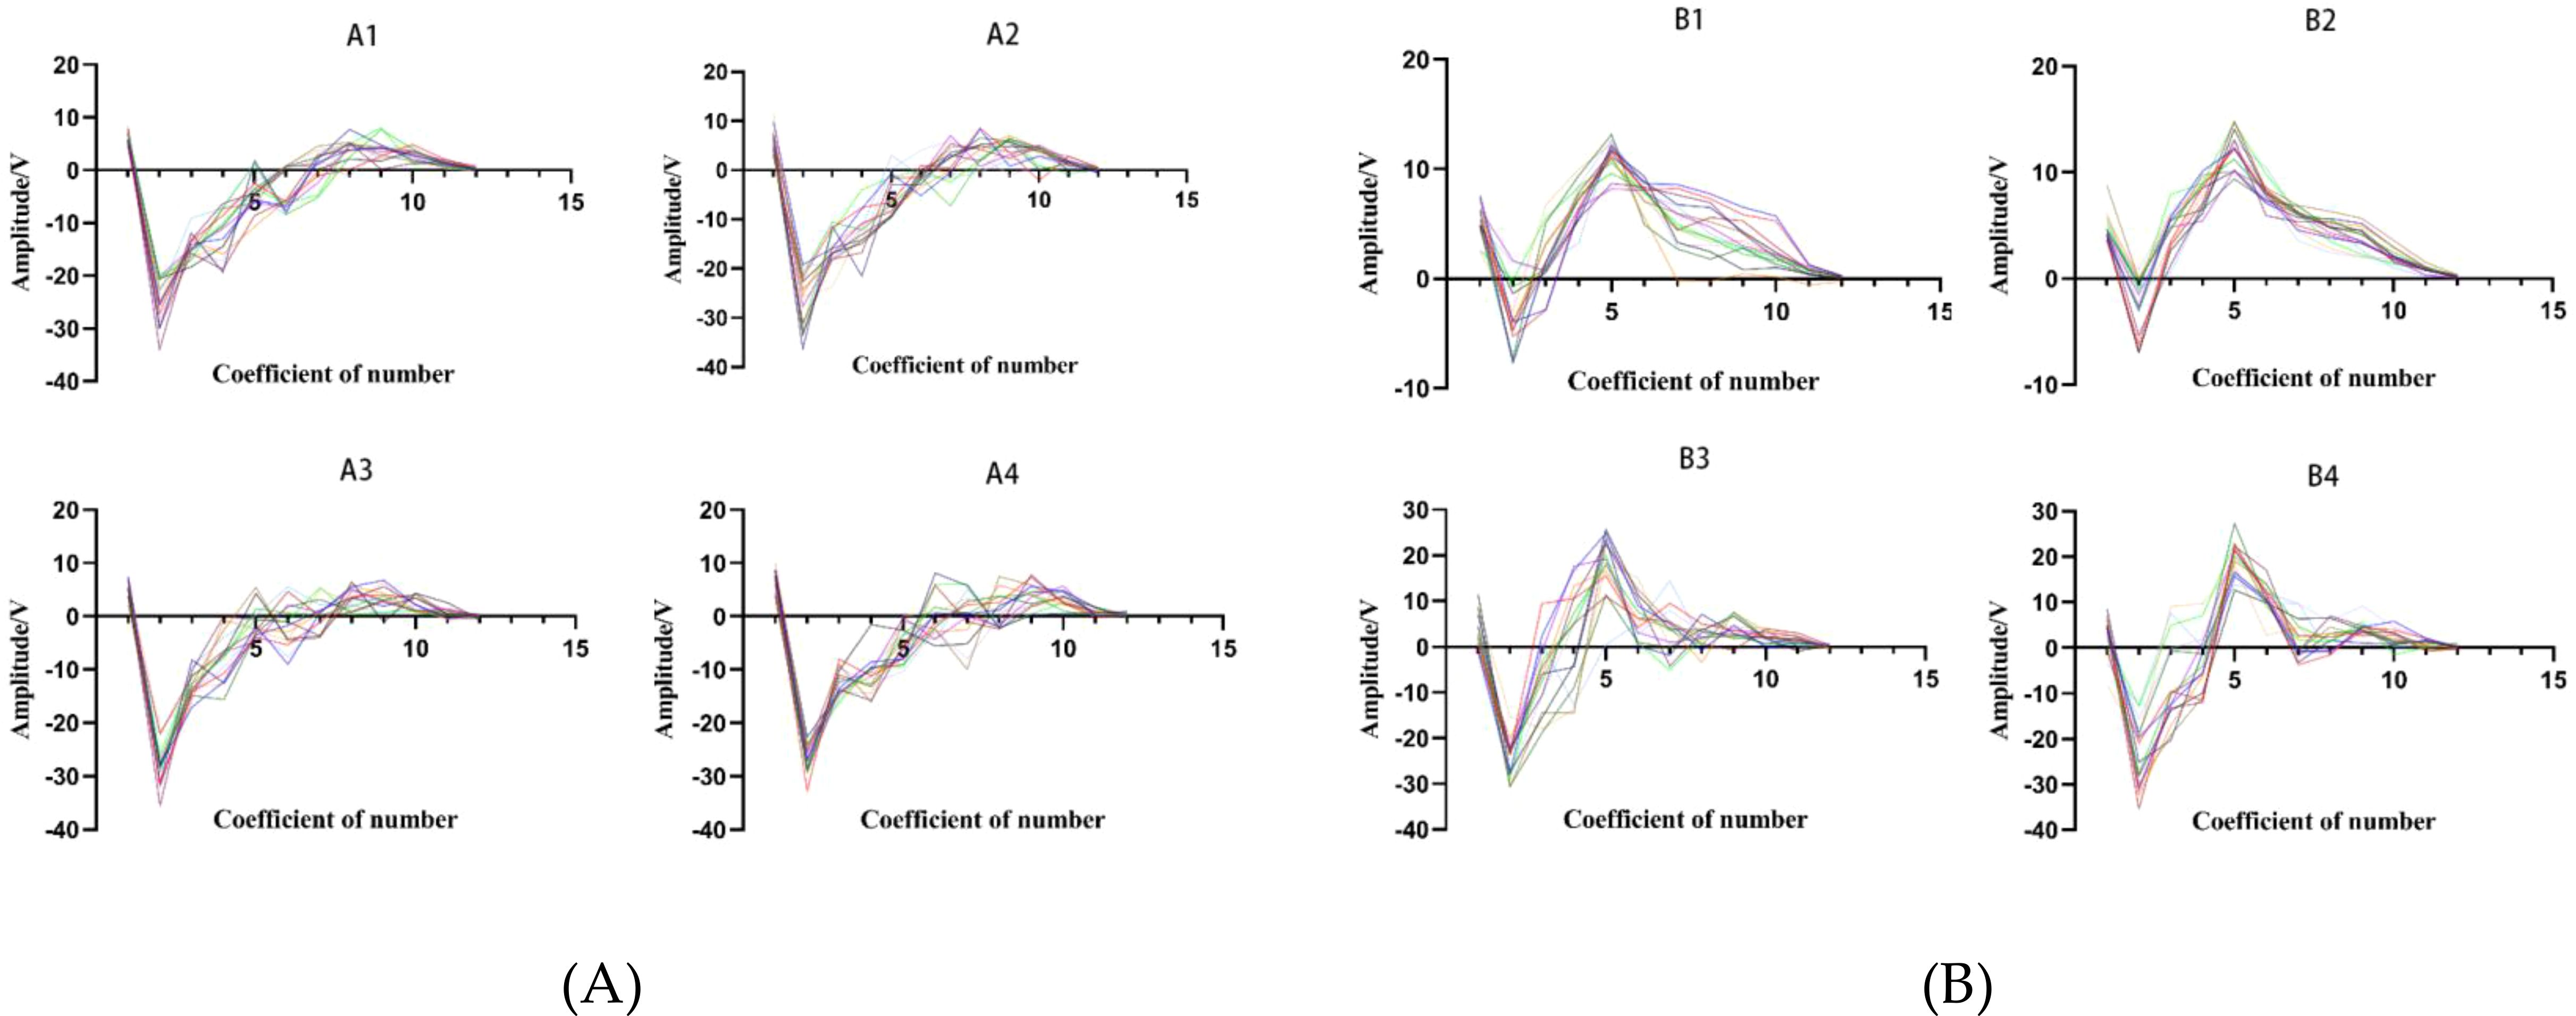
Figure 4. AMFCCs largemouth black bass sounds. A1-A4 swallowing sound of AMFCCs (A); B1-B4 chewing sound of AMFCCs (B). The different colored curves in the figure represent the characteristic parameters of one swallow.
where i = 1, 2,…, 12, is the first reception coefficient of frame, and T is the number of ingestion signal frames.
2.4.3 Power spectrum
The power spectral response refers to the variation of signal power with frequency. The feeding sounds of largemouth bass are considered stochastic signals, whose power spectra can describe swallowing sounds and exhibit the power distribution of different frequency components (Parhi and Ayinala, 2014).
In this study, the periodogram method is first used to estimate the power spectral density of the largemouth black bass swallowing sounds. Subsequently, the parabolic interpolation technique (Xuan et al., 2015) is employed to extract the peak values and peak frequencies of the power spectra of feeding sounds. Specifically, each windowed frame is first subjected to a Fast Fourier Transform (FFT) to convert the time-domain signal into a frequency-domain signal. The squared magnitude of the FFT coefficients is then calculated to obtain the periodogram of the current frame, thereby estimating the power spectral density. For a frame of length N, the periodogram is represented as follows:
Then, the index of the maximum value in the periodogram is identified. The values of the periodogram at , , are then determined. Parabolic interpolation is performed based on the points , , and . The interpolation calculation formula is as follows:
where is the number of FFT points, and is the sampling frequency.
From Figure 5 (Qi, 2023), it can be observed that the primary peaks of the power spectra of swallowing sounds in largemouth bass occur with the highest probability within the range of -60 to -70 dB, while the primary peaks of chewing sounds occur with the highest probability within the range of -70 to -80 dB. Although there is some overlap between the two, they still possess certain differences. Furthermore, the primary peak frequencies of swallowing and chewing sounds in largemouth bass are notably distinct at around 4 kHz, as shown in Figure 6. Therefore, the peak values and peak frequencies of the power spectra of feeding sounds are chosen as the acoustic features for the classification of feeding sounds in this study.
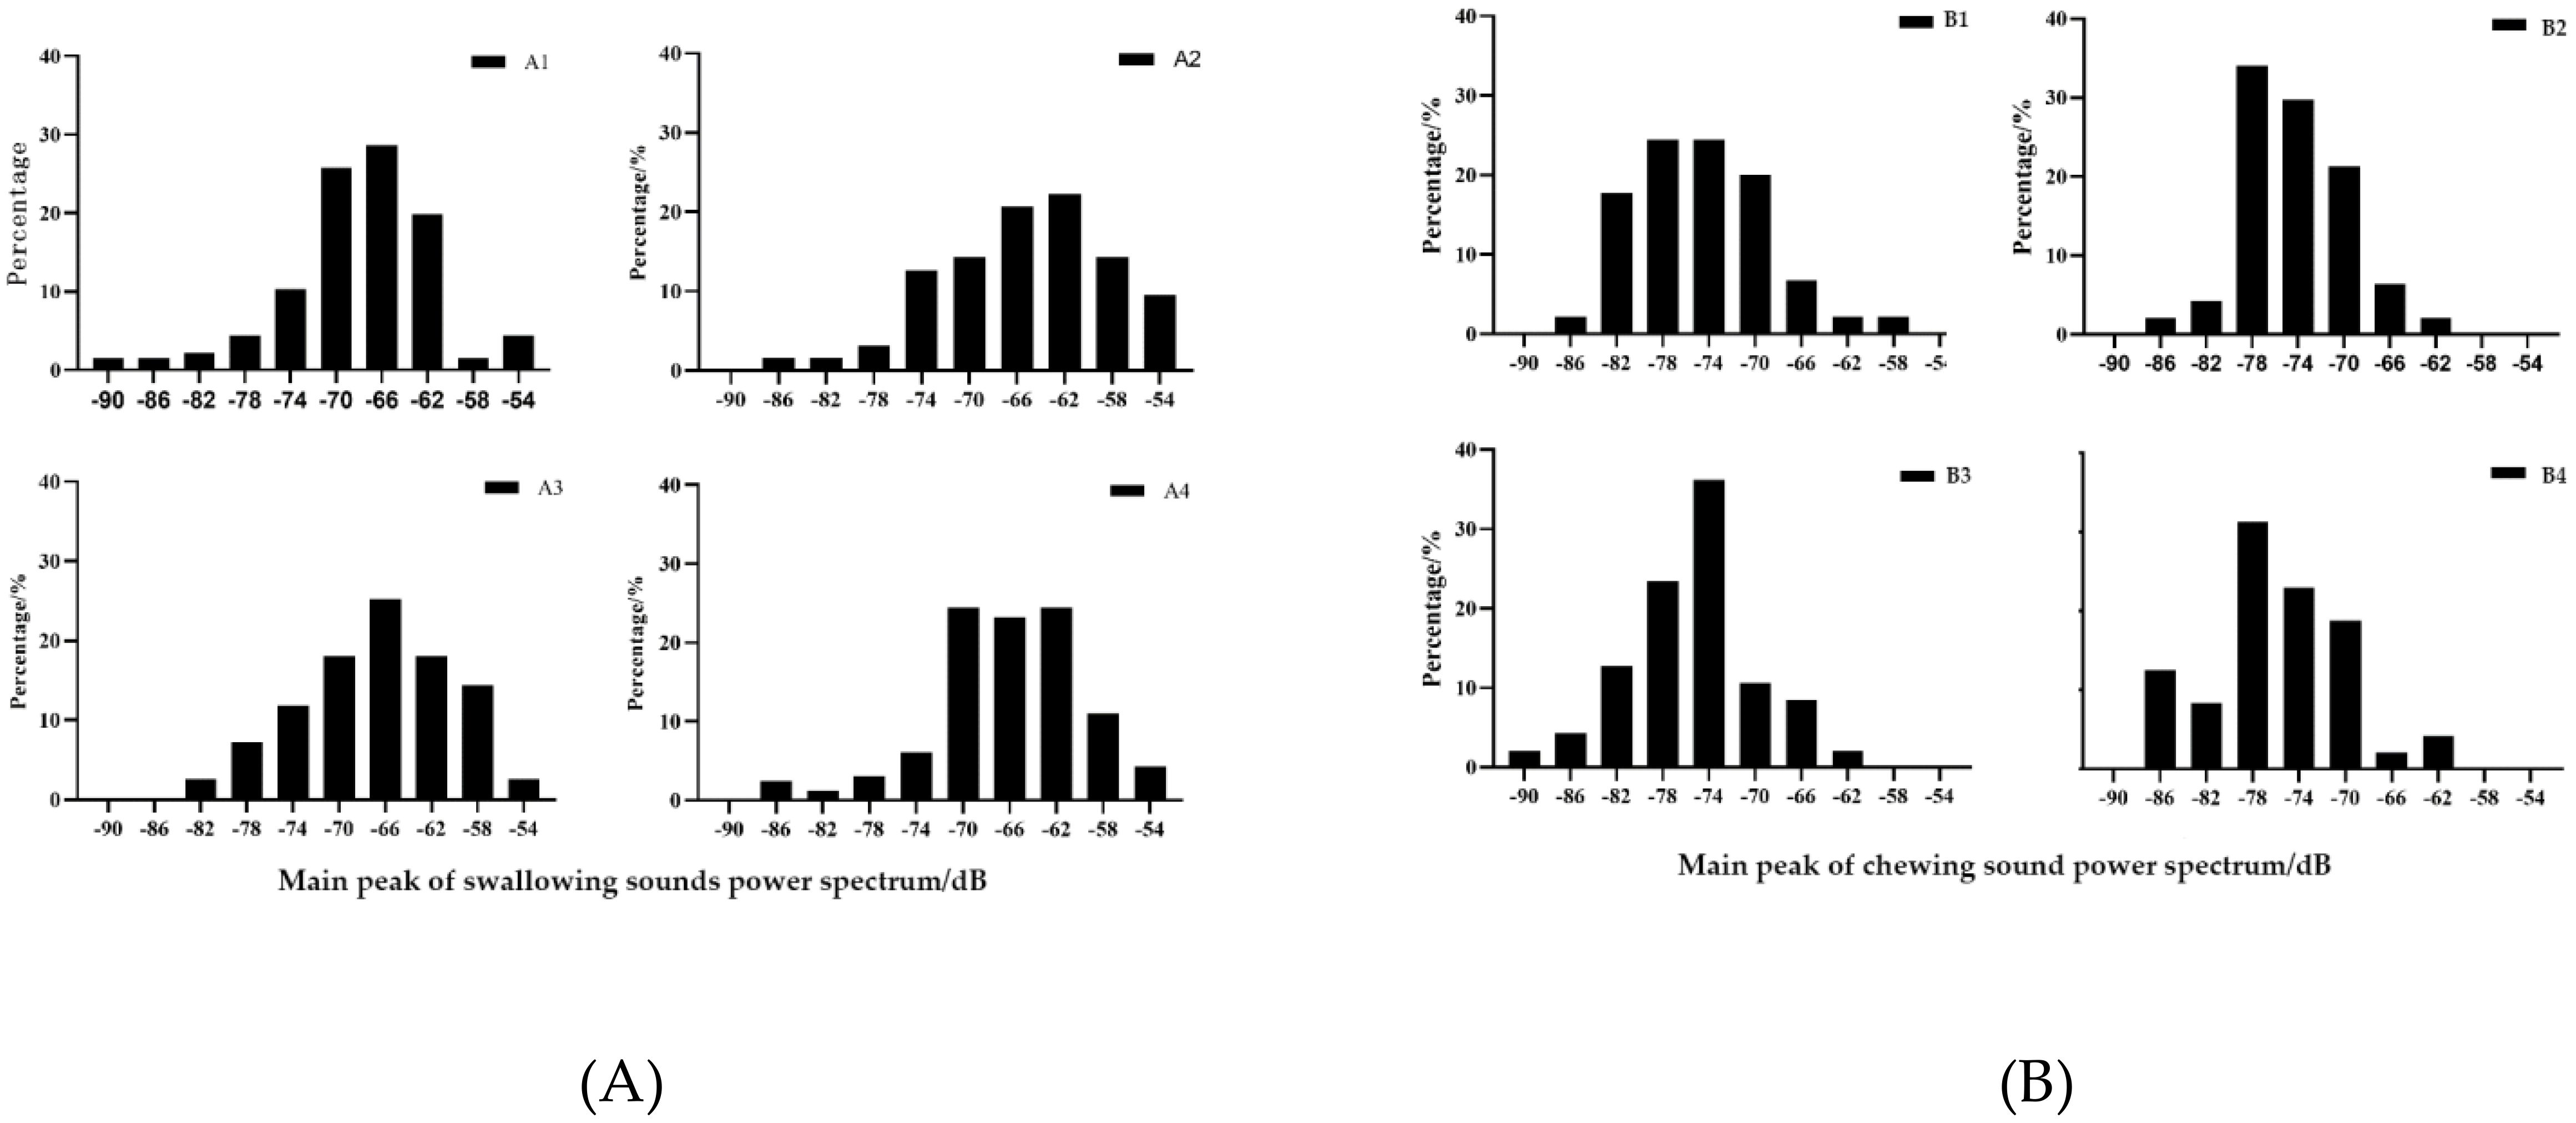
Figure 5. Power spectrum analysis chart of swallowing sound (A) and chewing sound (B). The main peak value distribution of the power spectrum of swallowing sound and chewing sound.
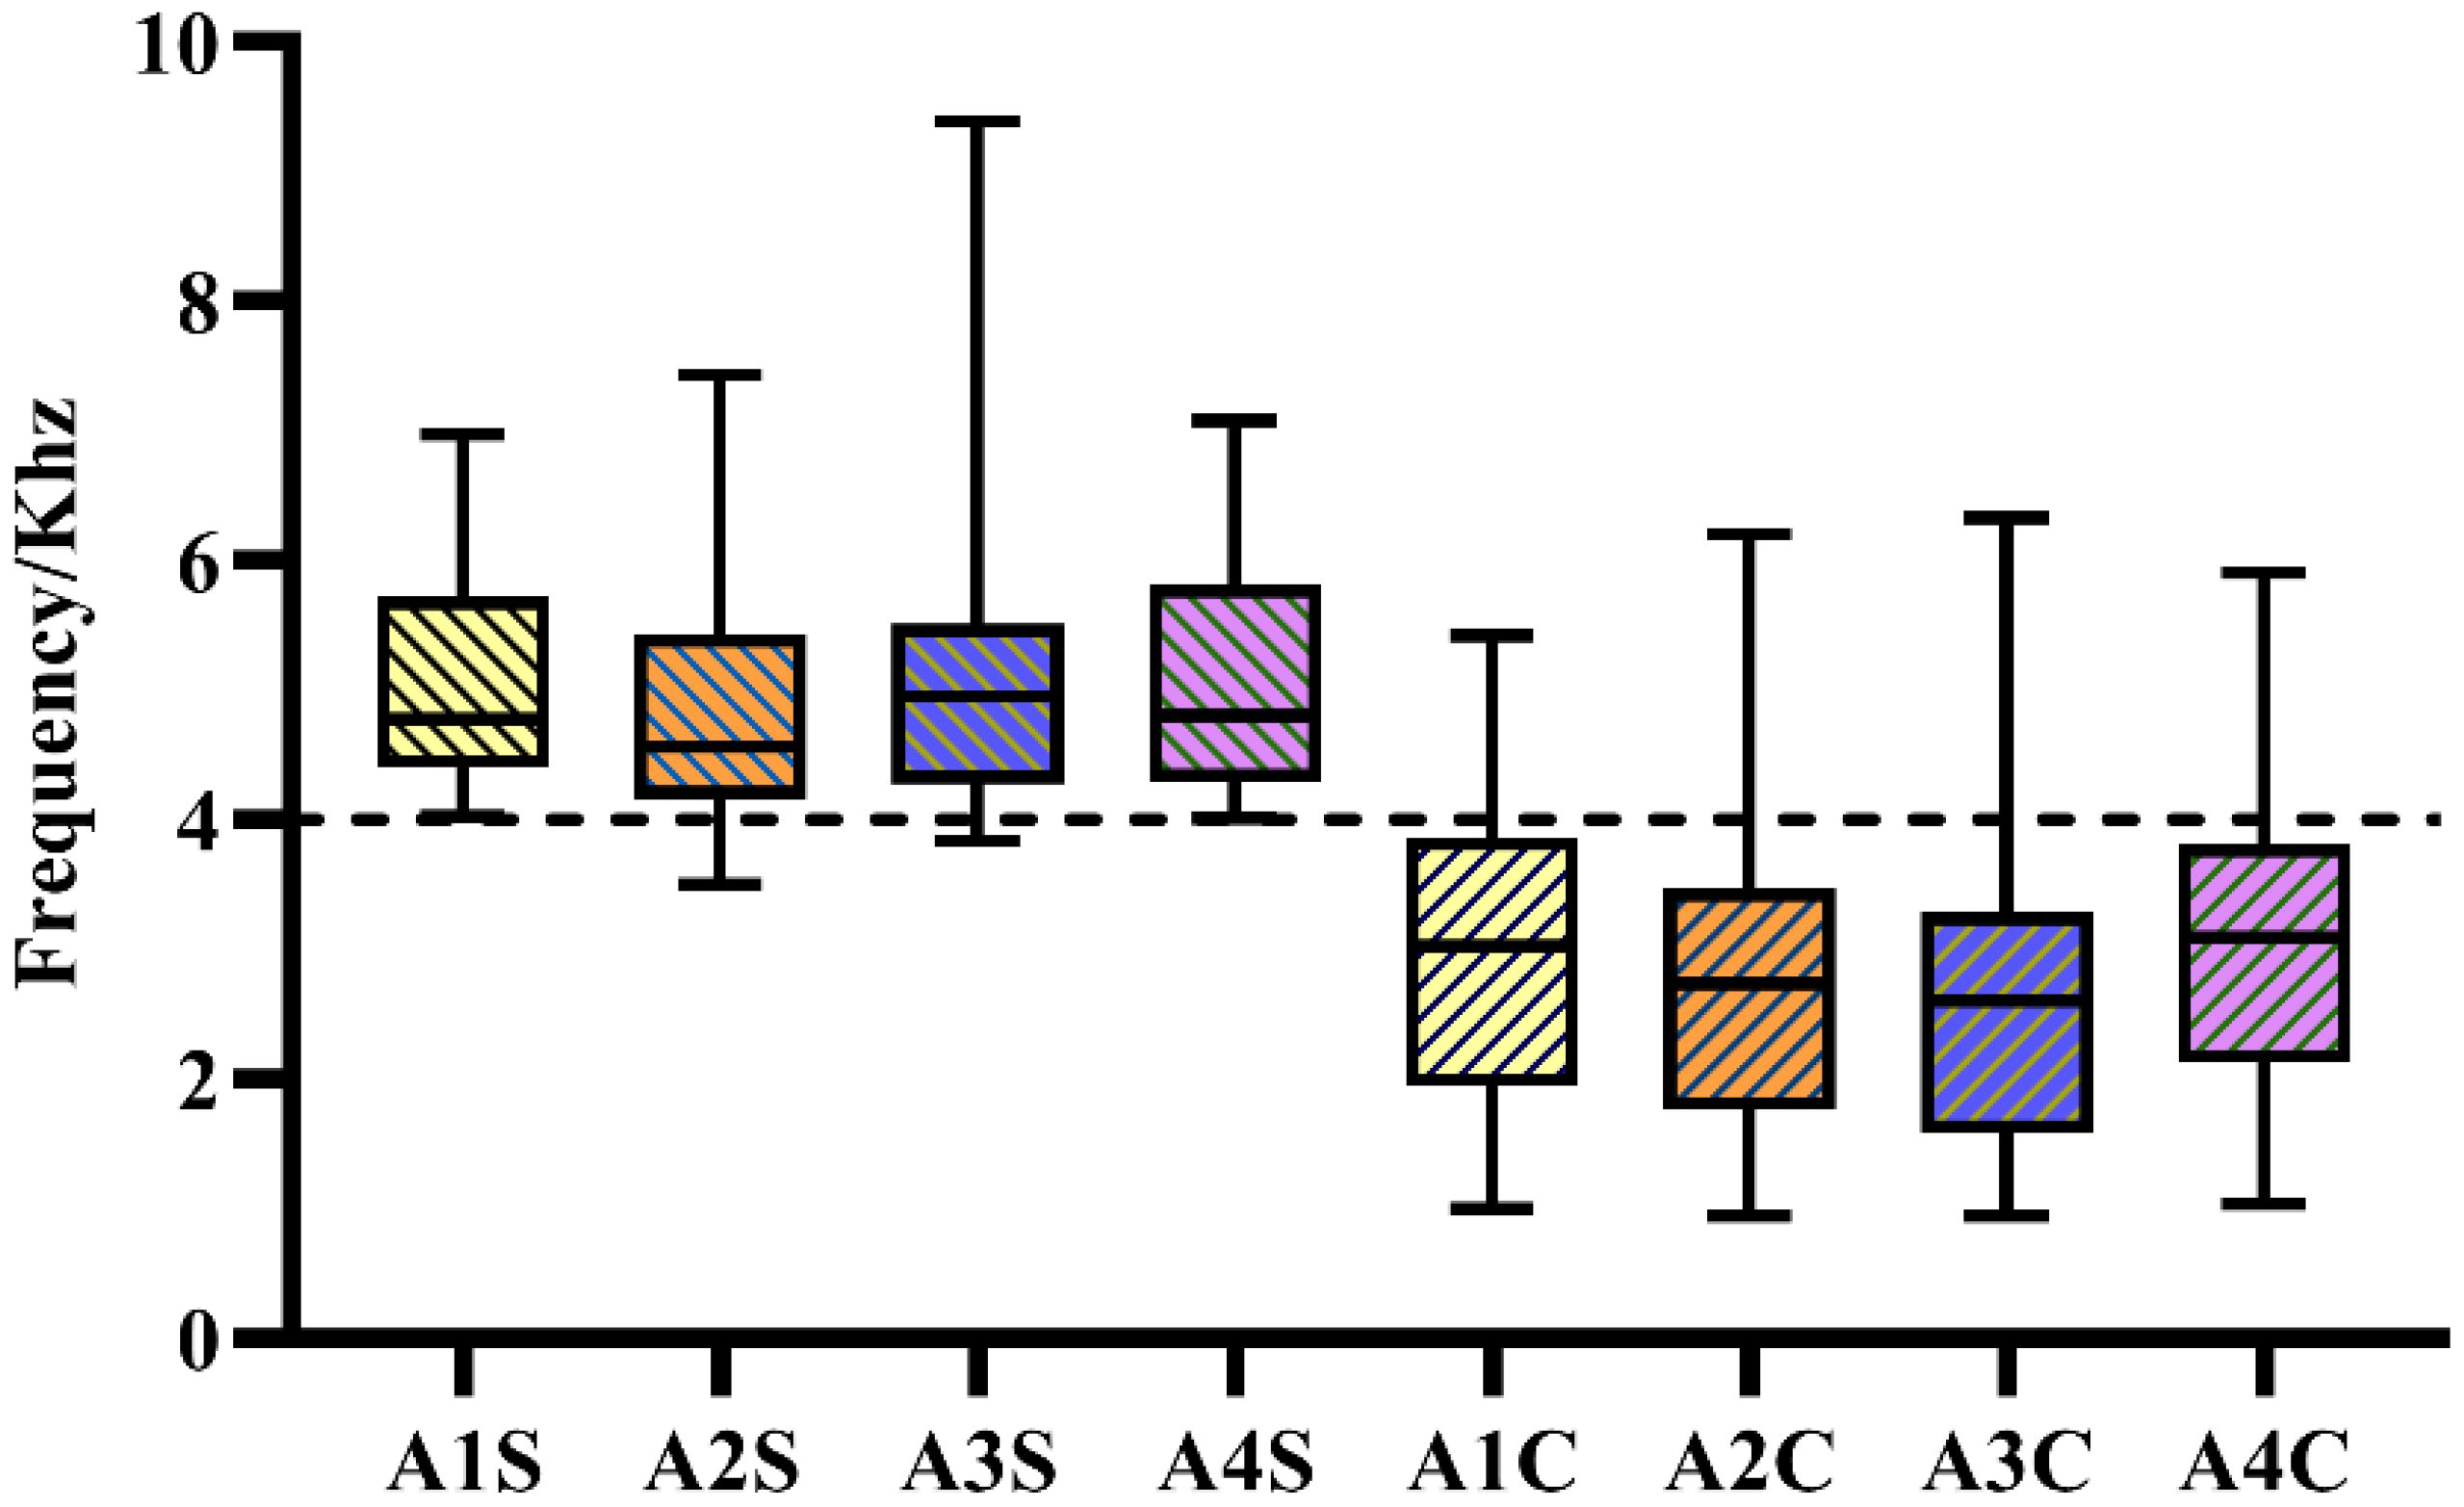
Figure 6. The primary peak frequency distribution of the power spectrum of swallowing sound and chewing sound. S represents the swallowing sound and C represents the chewing sound in the picture.
2.4.4 Feature dimensionality reduction
Dimensionality reduction techniques aim to map high-dimensional data into lower-dimensional spaces while preserving the main structure and information of the data and reducing the feature dimensions. Due to the diversity in data structures and types, it is challenging in visual analysis to determine a dimensionality reduction method that fits without any adjustments. The common practice is to adapt standard dimensionality reduction methods to specific application scenarios interactively. Currently, data dimensionality reduction methods are mainly divided into three categories. Based on the characteristics of the data, they can be classified into linear and nonlinear dimensionality reduction. Depending on whether they consider and utilize the supervised information of the data, they can be divided into unsupervised, supervised, and semi-supervised dimensionality reduction. According to the preservation of data structure, they can be categorized into global preservation, local preservation, and global-local consistent preservation, etc.
This study selected a series of sound features with distinct characteristic differences, including short-time average energy, 12-dimensional average Mel-frequency cepstral coefficients, power spectrum peak value, and peak frequency. These features encompass both complex data differentiations in the time-frequency domain and data with relatively good linear relationships. Although these features exhibit strong correlations with the feeding sounds of largemouth black bass, the feature dimensions are still relatively high, potentially harboring implicit correlations. Therefore, to further improve algorithmic computational efficiency, it is necessary to reselect the selected features and identify the key features suitable for this task. To achieve this goal, the study employed nine different types of representative feature reduction methods. Table 1 lists the nine dimensionality reduction methods and their parameter configurations, among which PCA, LPP and SVD (Imani, 2023) are linear dimensionality reduction methods, RF (Arashi et al., 2022) is a supervised dimensionality reduction method, LE and LPP are local preserving dimensionality reduction methods, and PCA, KPCA, LLE, ISOMAP, and MDS are global preserving dimensionality reduction methods (Anowar et al., 2021).
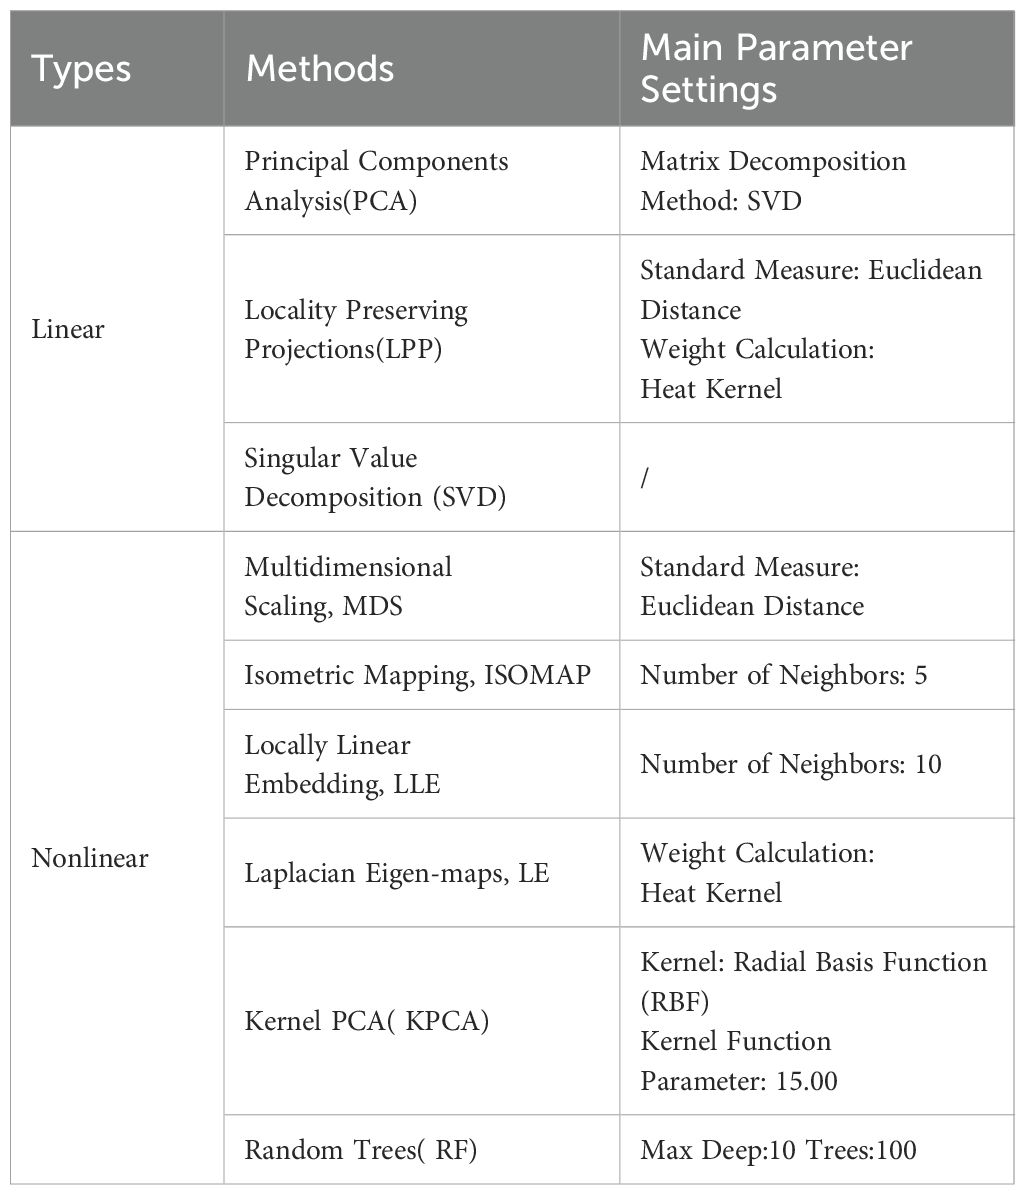
Table 1. Feature dimensionality reduction methods and their main parameter settings.
2.5 The evaluation of acoustic features and classifiers
Five classifiers including Error Minimized Extreme Learning Machine (EM-ELM), Genetic Algorithm Support Vector Machine (GA-SVM), Particle Swarm Optimization Multi-Layer Perceptron (PSO-MLP), and Random Trees (RF) are used to verify the performance of the features (Balasundaram, 2011; Huang et al., 2021; Moradi et al., 2023; Macaulay et al., 2021). Table 2 lists the main parameter settings of each classifier. In order to mitigate the impact of random errors on the classification results, the average of 10 predictions is utilized as the model’s classification outcome. Additionally, the classification performance of the model is assessed using four metrics: Precision, Recall, F1 score, and Accuracy (Jiang et al., 2021).
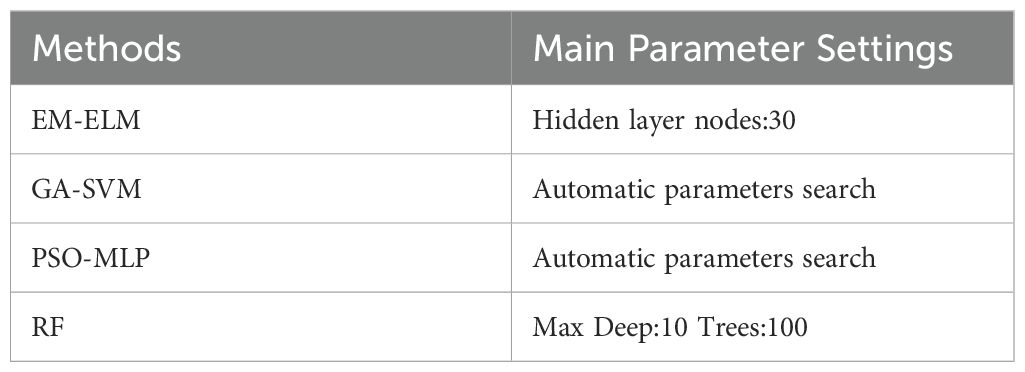
Table 2. Main parameter settings of classifier.
3 Results
3.1 Results for acoustic signal pre-processing
Figure 2 (Qi, 2023) illustrates the waveforms and spectrograms of four types of largemouth black bass swallowing sounds after sub-audio segment cutting and processing with the subspace speech enhancement algorithm. It is evident that the subspace speech enhancement algorithm can effectively reduce noise interference. Using the aforementioned methods, a total of 753 valid sound signal segments are obtained, including 564 swallowing sound samples and 189 chewing sound samples.
3.2 Results for feature selection
This paper employs nine feature dimensionality reduction algorithms to reselect the original features and showcases the retained dimensions and cumulative variance contribution rates for each algorithm in Figure 5. The results demonstrate that RF, MDS, PCA, and SVD excel in extracting key features. Their first and second principal components contribute to approximately 40% and 20% of the total variance, with MDS, PCA, and SVD exhibiting closely similar cumulative contribution rates. In contrast, other methods show relatively minor discrepancies in feature contribution rates. Methods such as KPCA, LPP, and LE fail to reach 90% of the total variance with their Top-10 features, indicating less prominent feature extraction effects. Considering the objectives of feature dimensionality reduction and the performance of feature selection, it is found that when selecting six features, RF, MDS, PCA, and SVD all achieve cumulative contribution rates exceeding 80%, with RF even surpassing 90%. Since the remaining methods have similar feature contribution rates, their advantage in feature contribution rate is minimal, and the dimensionality reduction effect is not significant. Adhering to the principles of simplifying the model, improving computational efficiency, and maintaining feature representativeness, this study selects the Top-6 features ranked by feature contribution rate for subsequent machine learning tasks.
3.3 Results for different classifiers
3.3.1 Top-6 classification results
To validate the effectiveness of the extracted Top-6 features, this study conducted experiments using four classifiers. The classification results of different classifiers are shown in Table 3. From Table 3, it can be observed that there are significant differences among the classification results of different classifiers, with the EM-ELM method performing the worst, while the results of the other three methods are relatively close. Apart from the EM-ELM classification method, the classification results of the Top-6 features extracted by different dimensionality reduction methods are similar, and the accuracies all exceed 90%. The RF dimensionality reduction method achieves the highest accuracy in classifying the Top-6 features, with an average classification accuracy exceeding 98%. Although the contribution rates of the ISOMAP, KPCA, LE, LEE, and LPP dimensionality reduction methods are relatively low, the recognition accuracy of the extracted Top-6 features is comparable to that of MDS and PCA. The classification accuracies based on GA-SVM, PSO-MLP, and RF methods are all above 94%.
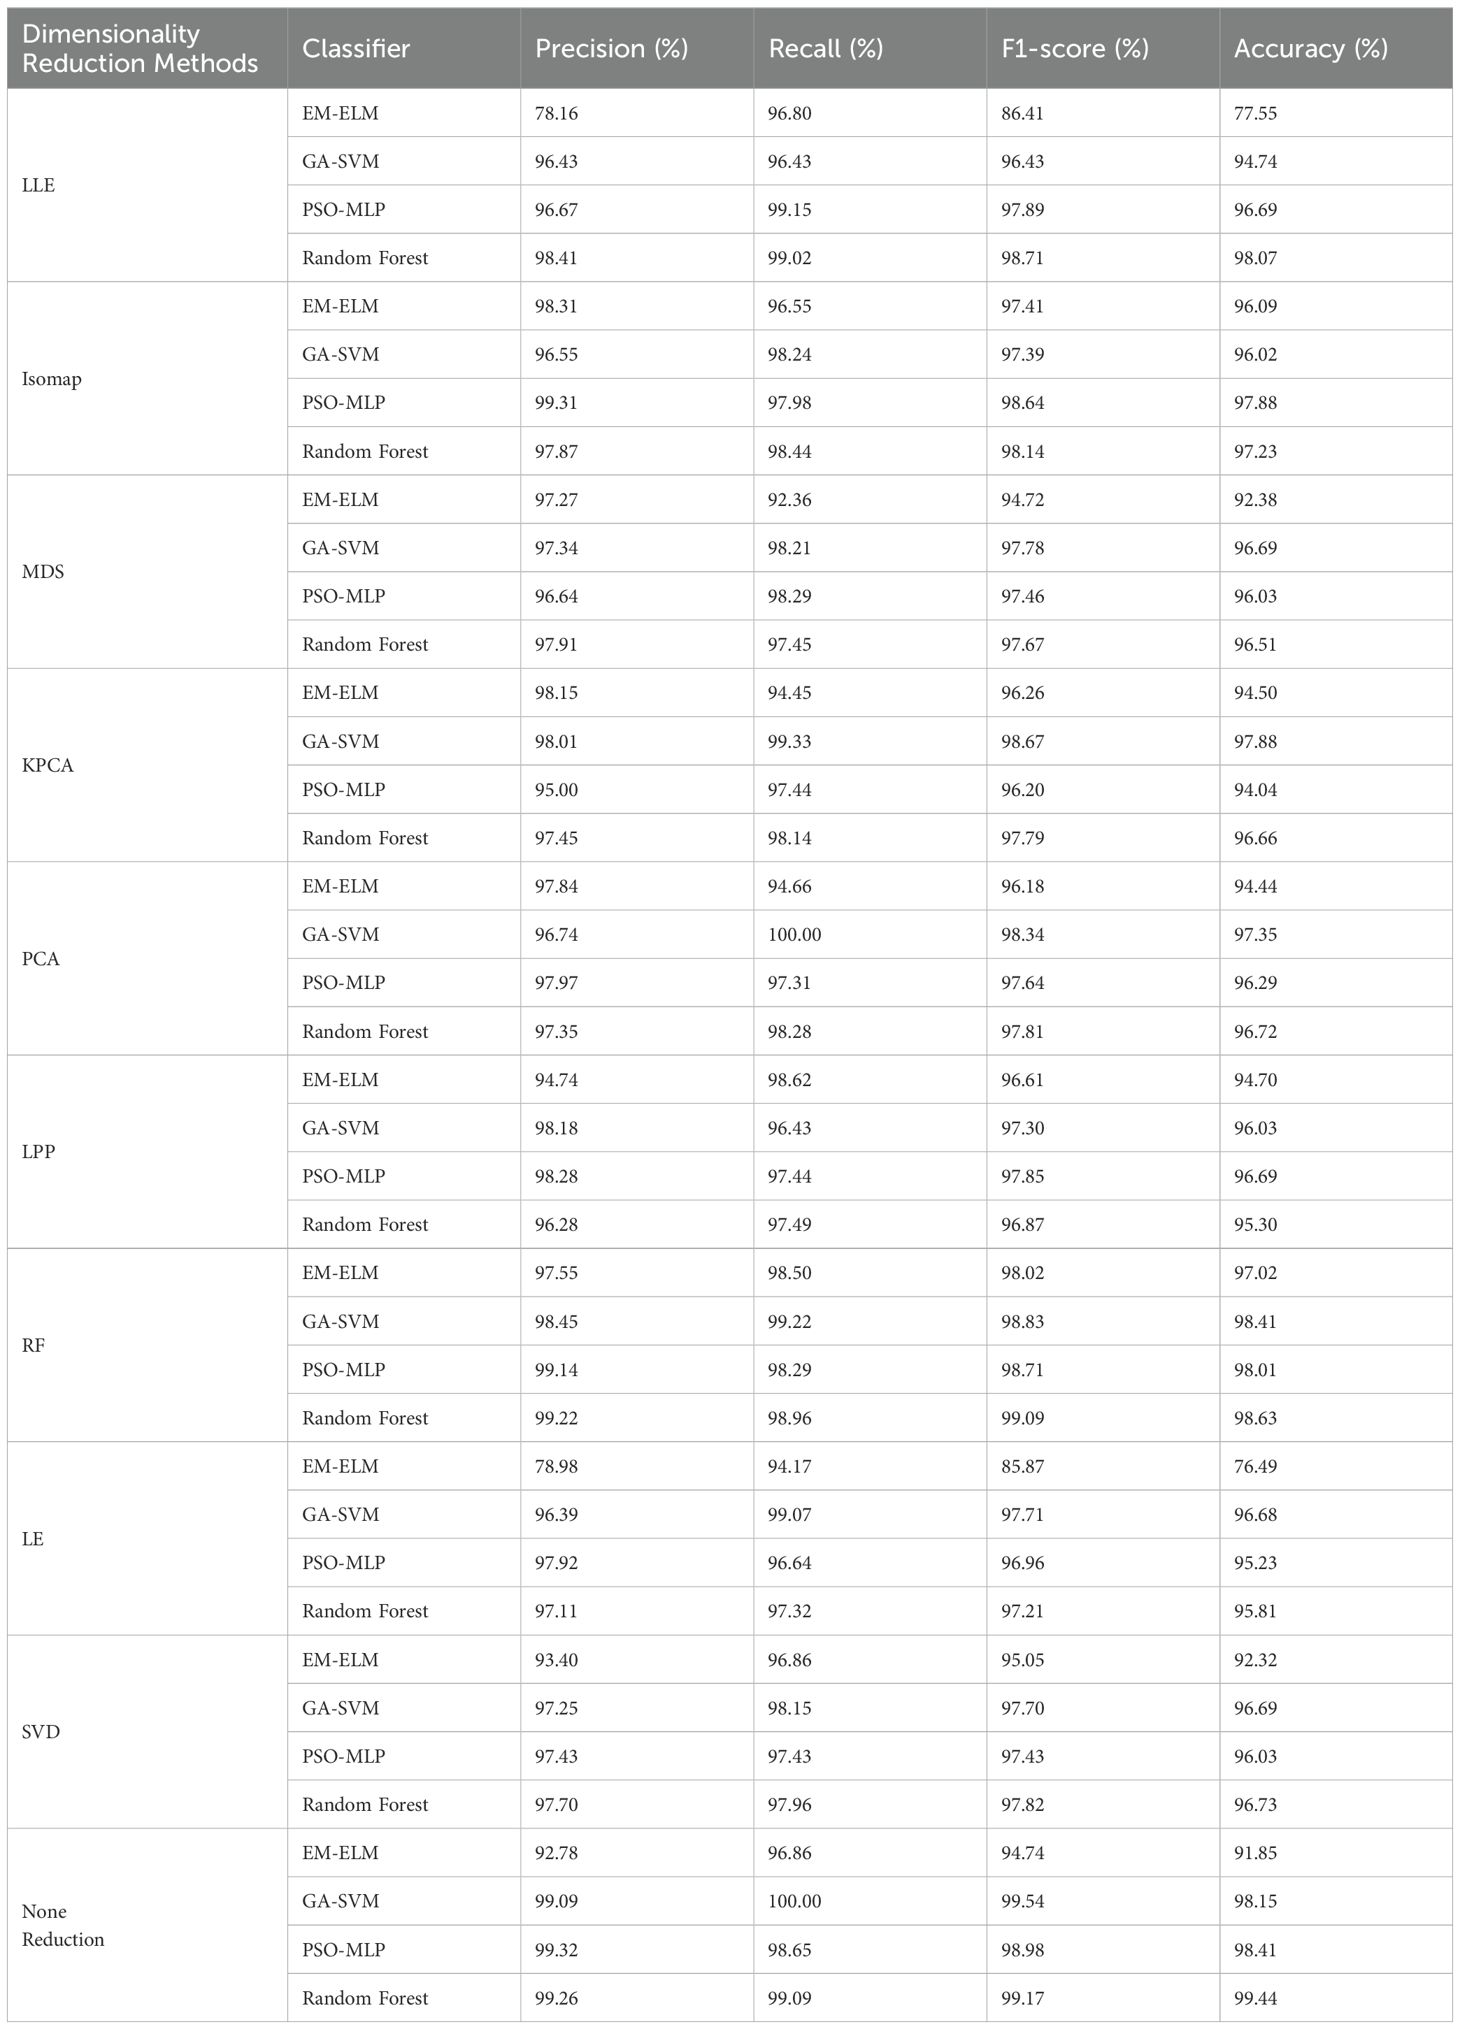
Table 3. Classification accuracy of Top-6 features with different dimensionality reduction classification methods.
3.3.2 Optimal classification results
To compare the capability of each dimensionality reduction method in embedding discriminative features, we noted the classifier and feature dimensions used to achieve the highest classification accuracy values. As depicted in Table 4, the highest recognition accuracy of all dimensionality reduction methods exceeded 90%. The classification accuracy for eating sounds achieved its peak with random forest feature extraction and random forest classifiers, reaching 99.44%. Similarly, the classification accuracy based on KPCA and SVD dimensionality reduction methods surpassed 99%, standing at 99.07% and 99.14%, respectively. ISOMAP, LPP, and MDS dimensionality reduction methods attained their best classification accuracy at dimensions 8, 11, and 12, respectively, all below 99%, indicating their relatively poor ability to embed discriminative features for distinguishing large-mouthed black bass eating sounds.
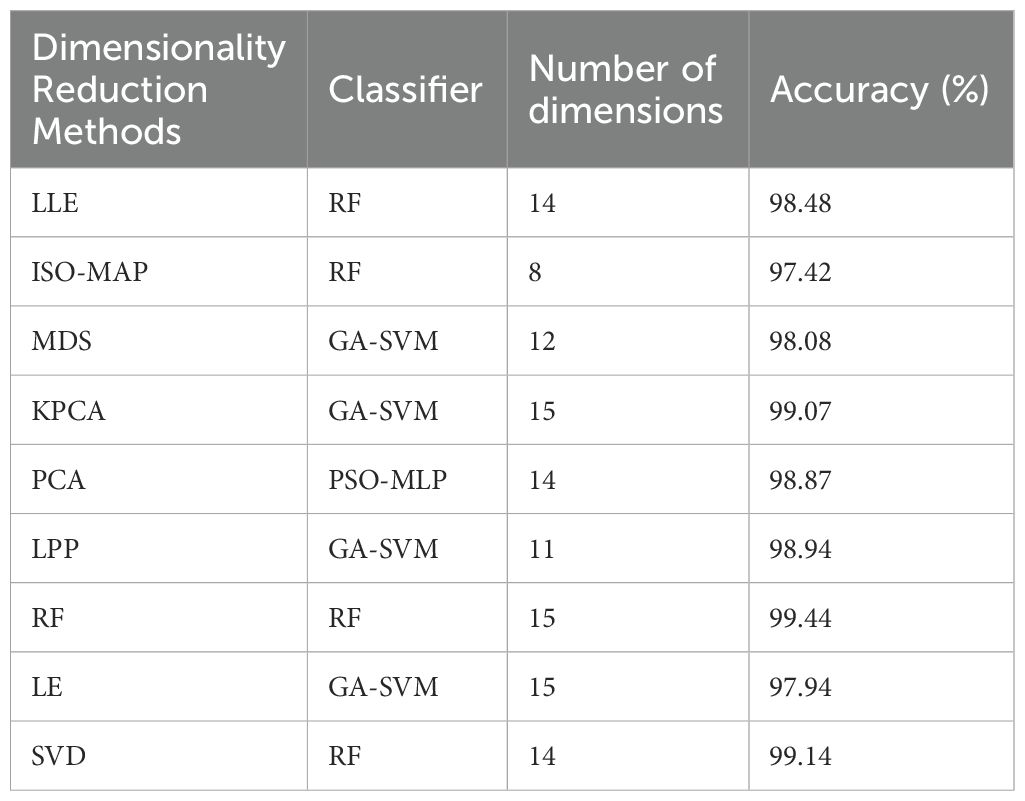
Table 4. Optimal classification results of different dimensionality reduction methods.
4 Discussion
4.1 Effectiveness of feature selection method based on artificial prior
The article employs an empirically-based feature selection method, identifying short-time average energy, AMFCC, peak power spectrum value, and peak frequency as acoustic features with significant characteristic differences for the identification of largemouth bass. As can be seen from Table 3, except for the ELM method, the other three classification methods achieve high accuracy using original features, with accuracy of 98.15%, 98.41%, and 99.44% respectively. Since the RF-based feature reduction method is a feature selection method that does not alter the original features, and both the Top-6 features extracted using the RF method and the global feature classification accuracy are the highest, it demonstrates that empirical preliminary feature screening plays a positive role in enhancing feature recognition capability. This is consistent with the approach taken by Cheng et al., who improved the accuracy of ground subsidence prediction using a feature selection-based scheme (Cheng et al., 2022), and Ali et al., who achieved multi-stage classification of Gyrodactylus species using a multi-stage feature selection scheme (Ali et al., 2011). This indicates that in new research areas with limited data, an experience-based feature selection approach can effectively improve model prediction accuracy.
4.2 Adaptability of dimensionality reduction method
Similar to other data analysis techniques aimed at practical applications, acoustic-based studies of fish behavior also face the challenge of processing large volumes of high-dimensional data. Therefore, a systematic comparison of existing analysis methods can help provide appropriate dimensionality reduction techniques for specific applications. As shown in Figure 7, there is a significant difference in the cumulative contribution rate of features extracted by the selected nine dimensionality reduction methods. Methods such as RF, MDS, PCA, and SVD, which focus on global feature reduction, have higher feature contribution rates, demonstrating that dimensionality reduction methods based on local feature similarity contribute less to the extraction of feeding characteristics. MDS is a nonlinear learning method, but when the feature data is predominantly linear, MDS can be equivalent to the PCA method (Anowar et al., 2021), which is consistent with the feature contribution curves of MDS, PCA, and SVD in Figure 7, proving that the extracted largemouth bass feeding sound features have distinct linear characteristics. Oksanen et al. conducted a systematic analysis of methods such as MDS and PCA, revealing a potential consistency between MDS and PCA dimensionality reduction techniques, which aligns with the findings of this study (Oksanen, 1983). Furthermore, from Figure 7, it can be seen that methods suitable for high-dimensional manifold data such as ISO-MAP, LLE, and LE do not perform well in dimensionality reduction; however, compared to the global approaches like ISO-MAP and KPCA, local methods like LLE and LE show relatively better feature extraction results. The LPP method, suitable for linear local features, outperforms LLE and LE in feature extraction, further proving the linear correlation of the extracted largemouth black bass feeding sound features. In fact, the linear correlation of features is a common issue associated with the acoustic signals discussed in this study (Darch et al., 2007). Similar to the conclusions of Kaya et al. and Koizumi et al., when the initial features have a high degree of matching with the classification results, it is preferable to use feature selection for dimensionality reduction (Kaya et al., 2014; Koizumi et al., 2017). As seen in Table 3, although the dimensionality reduction effects of different algorithms vary significantly, the differences in classification accuracy between methods are minor. The combination of RF-based dimensionality reduction and classification methods achieves the highest classification accuracy.
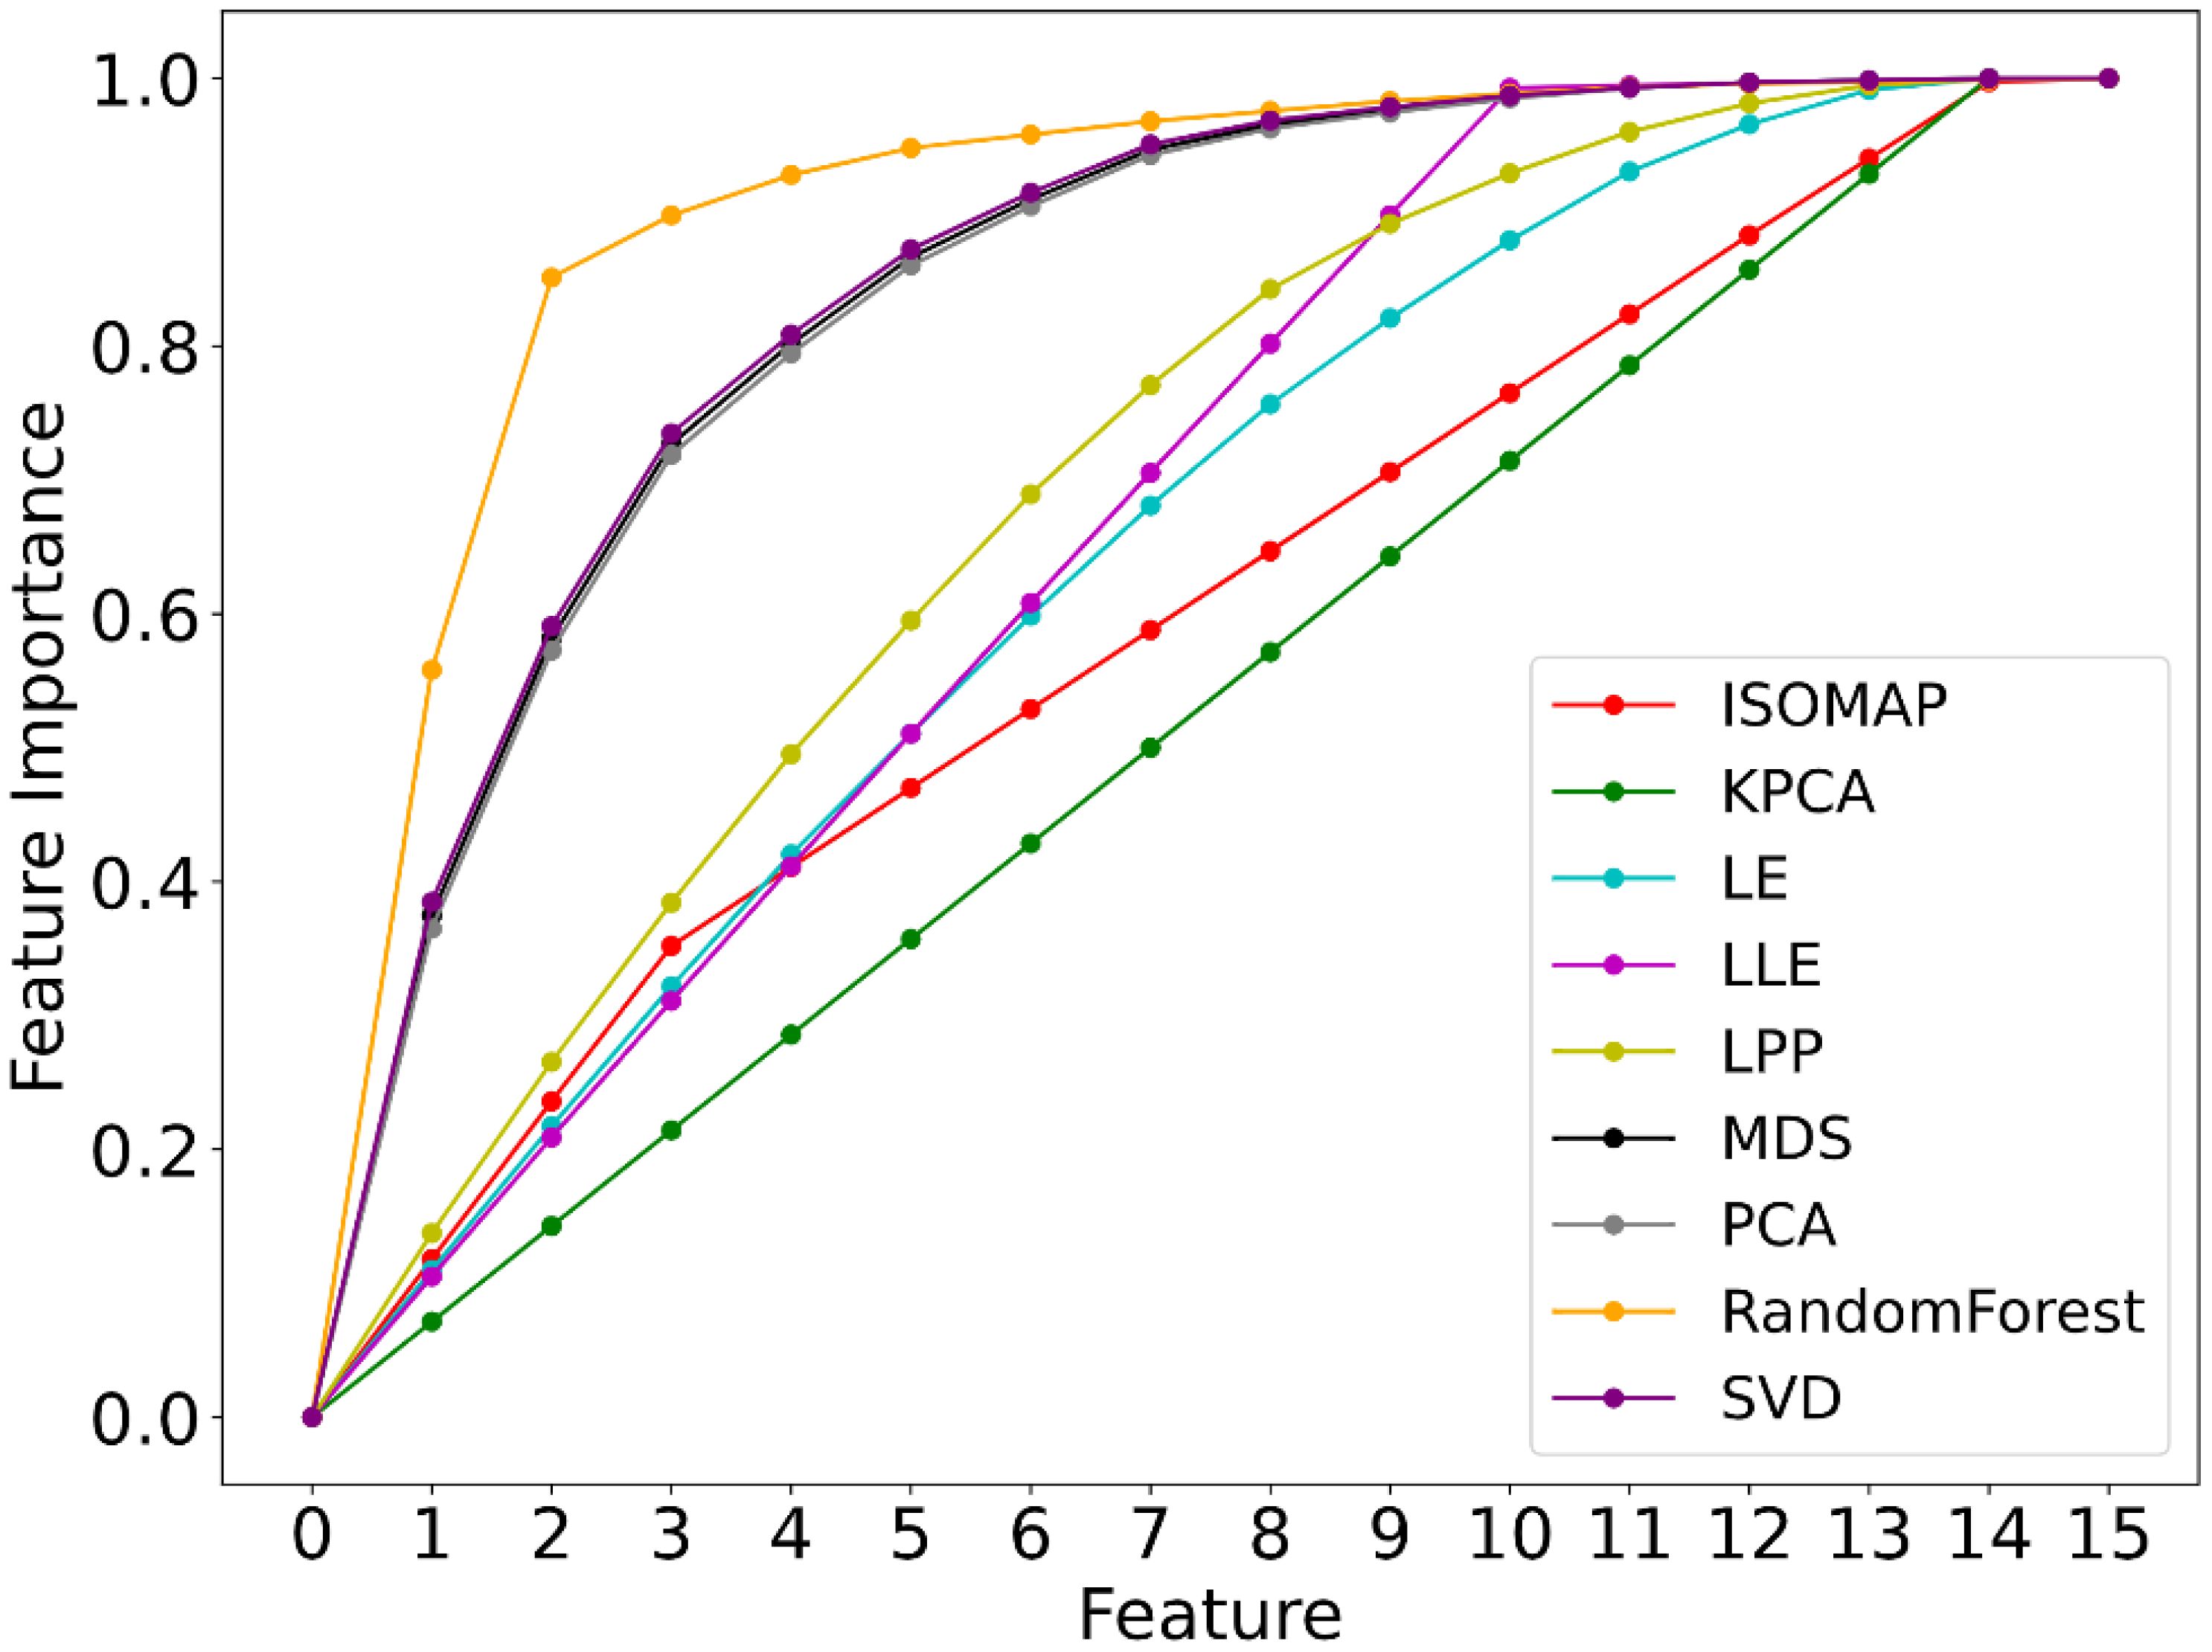
Figure 7. Cumulative contribution rate of features of different dimensionality reduction methods.
4.3 Compatibility of classification methods
Compared to standard large datasets, the largemouth bass swallowing and chewing sound dataset constructed in this paper is unevenly distributed (swallowing sounds account for 75% of the total data, while chewing sounds make up 25%), requiring classification algorithms to adaptively balance the classification. Compared to three other classification algorithms under the same conditions, the EM-ELM algorithm shows little difference in Precision but has lower Accuracy. The confusion matrix from Figure 8 indicates a significant overfitting issue with EM-ELM when predicting swallowing sounds, with a disproportionately high number of chewing sounds predicted as swallowing sounds. This demonstrates the limited capability of the EM-ELM model in adaptively balancing classification In previous research, Yu et al. thoroughly discussed this characteristic of the ELM classifier, which is consistent with the findings of this study (Yu et al., 2018). Therefore, EM-ELM does not meet the requirements for classifying fish feeding sounds with uneven data characteristics. GA-SVM, PSO-MLP, and RF classification models demonstrate a strong ability to adapt to uneven data, with the RF method showing high recognition accuracy in both Top-6 features and global features. However, a comprehensive comparison of the results in Tables 3 and 4 reveals that, despite the introduction of model parameter optimization algorithms such as EM, GA, and PSO, there are still differences in the recognition accuracy of largemouth bass swallowing and chewing sounds among different dimensionality reduction methods and classification method combinations. Therefore, to achieve better classification results, it is necessary to consider the characteristics of the data for preliminary model selection, while also fully considering the optimal compatibility of the model to ensure the best solution for specific application scenarios.
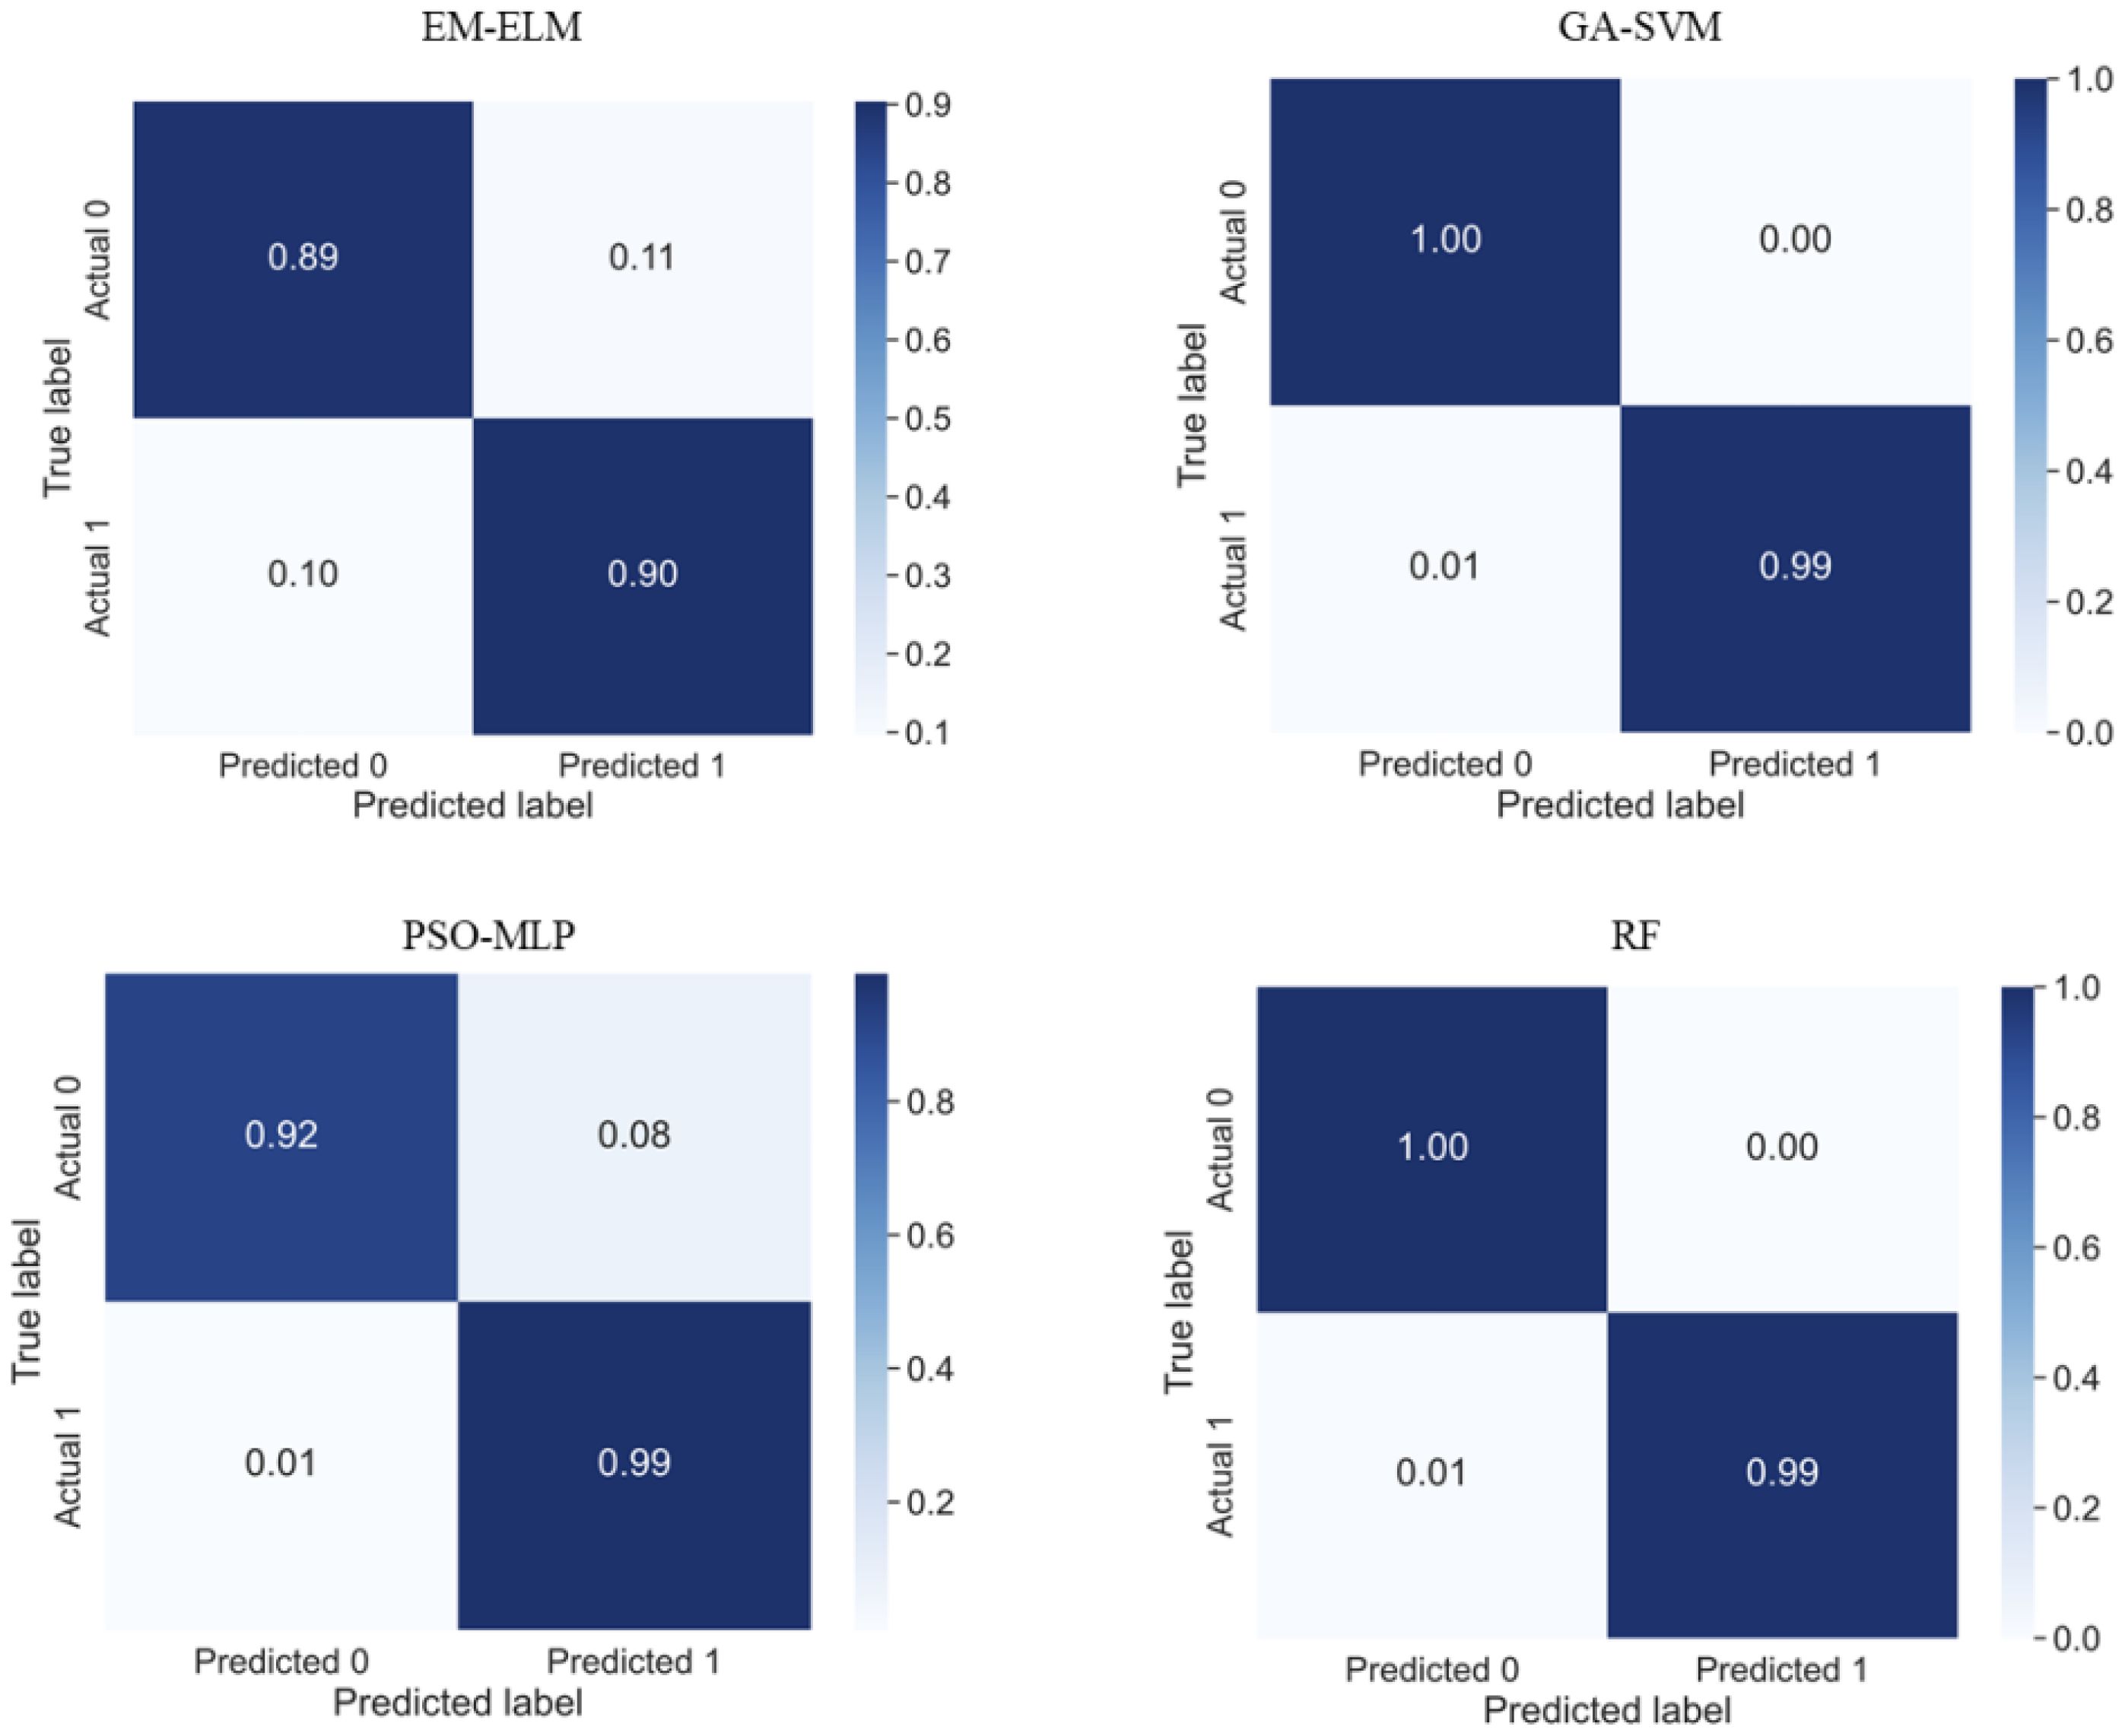
Figure 8. Confusion matrix of different classification methods of Top-6 features extracted by RF. 0. represents swallowing sound, 1. represents chewing sound.
4.4 Analysis of the correlation of acoustic features
Data quality is an important factor affecting machine learning. This paper utilizes a supervised method based on artificial priors to extract acoustic features with distinct differences between swallowing and chewing sounds. Experimental results indicate that data selection methods based on experience positively influence classification accuracy. However, it is important to note that the hidden attributes of differentiated data are difficult to discern through subjective observation. Therefore, to further analyze and extract data characteristics, we employed the RF method to rank the importance of data. As seen in Figure 9, there is a significant variance in the contribution rates of the extracted 12-dimensional AMFCC parameters, with the 5th, 7th, and 3rd coefficient features having higher contribution rates, consistent with the findings in Figure 4. However, the power spectrum peak frequency and short-term average energy, which also exhibit noticeable differentiation, show substantial differences in their feature contribution rates, where the power spectrum peak frequency has a contribution rate exceeding 55%, while the short-term average energy contributes only about 4%. Given the Random Forest algorithm’s effective handling of feature correlation and non-linearity, it is plausible that the power spectrum peak frequency and short-term average energy of largemouth bass swallowing and chewing sounds have potential correlations, with the power spectrum peak frequency playing a more pronounced role in distinguishing between swallowing and chewing sounds. Similarly, it is reasonable to assume that there is a data correlation between the notably distinct AMFCC 6th coefficient and the 5th and 7th coefficients. Additionally, the feature contribution rates calculated using the RF method for the power spectrum peak values, which have distinct and overlapping characteristics, are very low. An analysis combined with Figure 5 indicates that features with overlapping characteristics have an unclear impact on classification tasks and may even introduce noise errors. The findings of Li et al. and Urbanowicz et al. in previous research are consistent with the conclusions of this study, demonstrating the necessity of removing overlapping features during the feature selection process (Li et al., 2017; Urbanowicz et al., 2018).
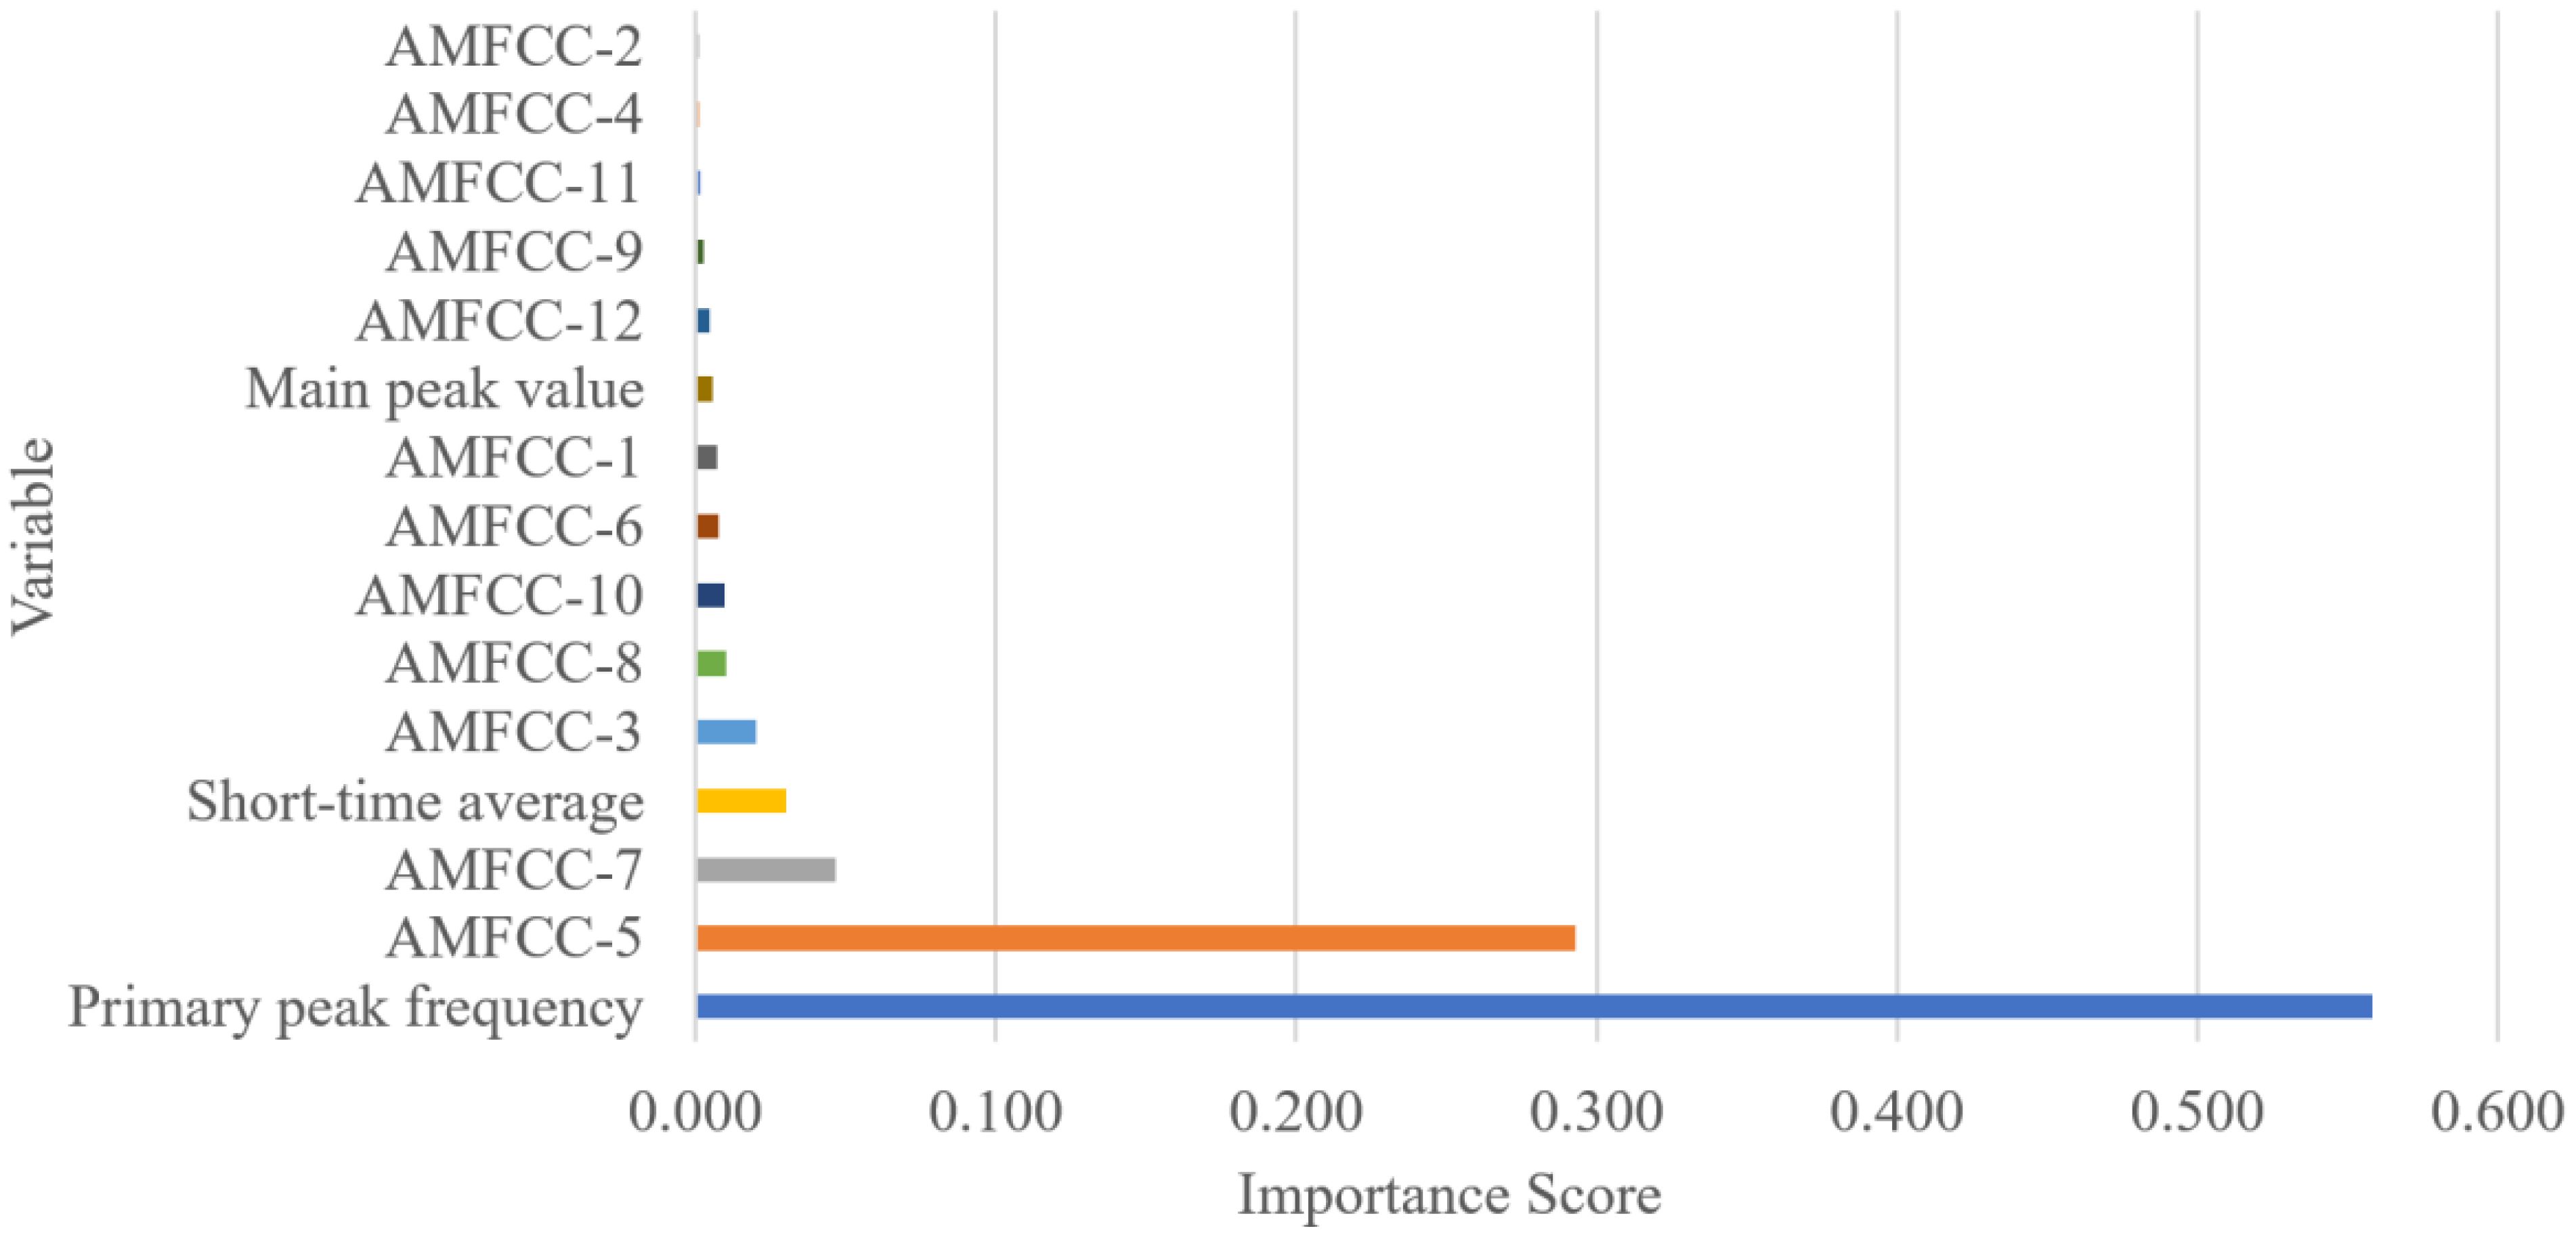
Figure 9. Characteristics contribution rate based on RF method.
5 Conclusions
This paper proposes a method for recognizing fish swallowing and chewing sounds based on low-dimensional acoustic features. This method involves an initial supervised feature selection based on artificial experience combined with secondary feature dimension reduction, identifying the Top-6 features that characterize the feeding sounds of largemouth bass. Four classification methods are used to validate the effectiveness of the selected features. The experimental results show that supervised preliminary feature selection positively impacts the accuracy of identifying largemouth bass feeding characteristics. When considering feature dimensions and classification performance, the combination of feature reduction and recognition models based on the Random Forest model performed the best, achieving a recognition accuracy of 98.63%. Additionally, this study found that the features of the largemouth bass feeding sound extracted exhibit linearity and globality. The linearity of the sound features suggests they may be related to specific dynamics of the feeding behavior, while their global nature indicates that they can function across different times and spaces. These findings provide a basis for further understanding the acoustic characteristics of fish feeding behavior. Future research could explore the correlation between these features and feeding behaviors further and validate them across different species and environmental conditions, thereby deepening the understanding of fish sound classification and behavior.
Data availability statement
The raw data supporting the conclusions of this article will be made available by the authors, without undue reservation.
Author contributions
SJL: Writing – review & editing, Writing – original draft, Visualization, Validation, Supervision, Resources, Project administration, Methodology, Investigation, Funding acquisition, Formal analysis, Conceptualization. SGL: Writing – review & editing, Writing – original draft, Software, Formal analysis, Data curation. RQ: Writing – review & editing, Data curation. HZ: Software, Writing – review & editing. JZ: Writing – review & editing, Software, Data curation. CQ: Writing – review & editing, Visualization, Formal analysis. HL: Writing – review & editing.
Funding
The author(s) declare financial support was received for the research, authorship, and/or publication of this article. This study was supported by Central Public-interest Scientific Institution Basal Research Fund, CAFS (NO. 2024XT09) and supported by Hainan Seed Industry Laboratory (No. B23H10004).
Acknowledgments
The authors would like to thank RQ for his contribution to the data foundation of this article.
Conflict of interest
The authors declare that the research was conducted in the absence of any commercial or financial relationships that could be construed as a potential conflict of interest.
Publisher’s note
All claims expressed in this article are solely those of the authors and do not necessarily represent those of their affiliated organizations, or those of the publisher, the editors and the reviewers. Any product that may be evaluated in this article, or claim that may be made by its manufacturer, is not guaranteed or endorsed by the publisher.
References
Abdul Z. K., Al-Talabani A. K. (2022). Mel frequency cepstral coefficient and its applications: A review. IEEE Access 10, 122136–122158. doi: 10.1109/ACCESS.2022.3223444
Ali R., Hussain A., Bron J. E., Shinn A. P. (2011). “Multi-stage classification of Gyrodactylus species using machine learning and feature selection techniques,” in 2011 11th International Conference on Intelligent Systems Design and Applications. 457–462, Cordoba, Spain: IEEE. doi: 10.1109/ISDA.2011.6121698
Anowar F., Sadaoui S., Selim B. (2021). Conceptual and empirical comparison of dimensionality reduction algorithms (PCA, KPCA, LDA, MDS, SVD, LLE, ISOMAP, LE, ICA, t-SNE). Comput. Sci. Rev. 40, 100378. doi: 10.1016/j.cosrev.2021.100378
Arashi M., Lukman A. F., Algamal Z. Y. (2022). Liu regression after random forest for prediction and modeling in high dimension. J. Chemometrics 36, e3393. doi: 10.1002/cem.3393
Balasundaram S. (2011). Application of error minimized extreme learning machine for simultaneous learning of a function and its derivatives. Neurocomputing 74, 2511–2519. doi: 10.1016/j.neucom.2010.12.033
Bank W. (2013). Fish to 2030: Prospects for fisheries and aquaculture (The World Bank, Report). No, 83177-GLB. Available at: https://documents.worldbank.org/en/publication/documents-reports/documentdetail/458631468152376668/fish-to-2030-prospects-for-fisheries-and-aquaculture
Barroso V. R., Xavier F. C., Ferreira C. E. L. (2023). Applications of machine learning to identify and characterize the sounds produced by fish. ICES J. Mar. Sci. 80, 1854–1867. doi: 10.1093/icesjms/fsad126
Cao X. H., Liu H., Qi R. Y., Liu S. J. (2021). Acoustic characteristics of the feeding pellets for Micropterus salmoides in circulating aquaculture. Trans. Chin. Soc. Agric. Eng. 37, 219–225. doi: 10.11975/j.issn.1002-6819.2021.20.025
Chen G., Lei C., Lv Z., Wang Y. (2020). Survey of marine organisms based on passive acoustic technology. Int. J. Design Nat. Ecodynamics 15, 729–737. doi: 10.18280/ijdne.150515
Cheng Y., Zhou W. H., Xu T. (2022). Tunneling-induced settlement prediction using the hybrid feature selection method for feature optimization. Transportation Geotechnics 36, 100808. doi: 10.1016/j.trgeo.2022.100808
Darch J., Milner B., Almajai I., Vaseghi S. (2007). “An investigation into the correlation and prediction of acoustic speech features from MFCC vectors,” in 2007 IEEE International Conference on Acoustics, Speech and Signal Processing-ICASSP’07, Vol. 4. IV–465, Honolulu, HI, USA: IEEE. doi: 10.1109/ICASSP.2007.366950
Deniz N. N., Chelotti J. O., Galli J. R., Planisich A. M., Larripa M. J., Rufiner H. L., et al. (2017). Embedded system for real-time monitoring of foraging behavior of grazing cattle using acoustic signals. Comput. Electron. Agric. 138, 167–174. doi: 10.1016/j.compag.2017.04.024
Ephraim Y., Van Trees H. L. (1995). A signal subspace approach for speech enhancement. IEEE Trans. speech audio Process. 3, 251–266. doi: 10.1109/89.861364
Hamilton S., Costa Filho F., Silva J. F., Duarte-Neto P. J., Soares R., Peixoto S. (2023). The loud crowd: Interactions between stocking density and acoustic feeding activity of different size classes of Litopenaeus vannamei. Aquaculture 563, 738904. doi: 10.1016/j.aquaculture.2022.738904
Huang W., Liu H., Zhang Y., Mi R., Tong C., Xiao W., et al. (2021). Railway dangerous goods transportation system risk identification: Comparisons among SVM, PSO-SVM, GA-SVM and GS-SVM. Appl. Soft Computing 109, 107541. doi: 10.1016/j.asoc.2021.107541
Imani M. (2023). Modified PCA, LDA and LPP feature extraction methods for PolSAR image classification. Multimedia Tools Appl. 83, 41171–41192. doi: 10.1007/s11042-023-17269-7
Ji N., Shen W., Yin Y., Bao J., Dai B., Hou H., et al. (2022). Investigation of acoustic and visual features for pig cough classification. Biosyst. Eng. 219, 281–293. doi: 10.1016/j.biosystemseng.2022.05.010
Jiang Y., Peng J., Song L. (2021). An OSAHS evaluation method based on multi-features acoustic analysis of snoring sounds. Sleep Med. 84, 317–323. doi: 10.1016/j.sleep.2021.06.012
Kaya H., Eyben F., Salah A. A., Schuller B. (2014). “CCA based feature selection with application to continuous depression recognition from acoustic speech features,” in 2014 IEEE International Conference on Acoustics, Speech and Signal Processing (ICASSP). 3729–3733, Florence, Italy: IEEE. doi: 10.1109/ICASSP.2014.6854298
Koizumi Y., Niwa K., Hioka Y., Kobayashi K., Ohmuro H. (2017). Informative acoustic feature selection to maximize mutual information for collecting target sources. IEEE/ACM Trans. Audio Speech Lang. Process. 25, 768–779. doi: 10.1109/ICASSP.2014.6854298
Kumar Y., Gupta S., Singh W. (2022). A novel deep transfer learning models for recognition of birds sounds in different environment. Soft Computing 26, 1003–1023. doi: 10.1007/s00500-021-06640-1
Lagardère J. P., Mallekh R. (2000). Feeding sounds of turbot (Scophthalmus maximus) and their potential use in the control of food supply in aquaculture: I. Spectrum analysis of the feeding sounds. Aquaculture 189, 251–258. doi: 10.1016/S0044-8486(00)00375-6
Lagardère J. P., Mallekh R., Mariani A. (2004). Acoustic characteristics of two feeding modes used by brown trout (Salmo trutta), rainbow trout (Oncorhynchus mykiss) and turbot (Scophthalmus maximus). Aquaculture 240, 607–616. doi: 10.1016/j.aquaculture.2004.01.033
Lauha P., Somervuo P., Lehikoinen P., Geres L., Richter T., Seibold S., et al. (2022). Domain-specific neural networks improve automated bird sound recognition already with small amount of local data. Methods Ecol. Evol. 13, 2799–2810. doi: 10.1111/2041-210X.14003
Li D., Wang Z., Wu S., Miao Z., Du L., Duan Y. (2020). Automatic recognition methods of fish feeding behavior in aquaculture: A review. Aquaculture 528, 735508. doi: 10.1016/j.aquaculture.2020.735508
Li J., Cheng K., Wang S., Morstatter F., Trevino R. P., Tang J., et al. (2017). Feature selection: A data perspective. ACM computing surveys (CSUR) 50, 1–45. doi: 10.1145/3136625
Macaulay B. O., Aribisala B. S., Akande S. A., Akinnuwesi B. A., Olabanjo O. A. (2021). Breast cancer risk prediction in African women using random forest classifier. Cancer Treat Res. Commun. 28, 100396. doi: 10.1016/j.ctarc.2021.100396
Melo I., Llusia D., Bastos R. P. (2021). Active or passive acoustic monitoring? Assessing methods to track anuran communities in tropical savanna wetlands. Ecol. Indic. 132, 108305. doi: 10.1016/j.ecolind.2021.108305
Mok H. K., Gilmore R. G. (1983). Analysis of sound production in estuarine aggregations of Pogonias cromis, Bairdiella chrysoura, and Cynoscion nebulosus (Sciaenidae). Academia Sin. 22, 157–186.
Moradi S., Gerdooei M., Varedi-Koulaei S. M., Nosrati H. G. (2023). MLP neural network with an optimal architecture for modeling the ECAP-C process. Neural Computing Appl. 35, 2701–2715. doi: 10.1007/s00521-022-07685-5
Nunes L., Ampatzidis Y., Costa L., Wallau M. (2021). Horse foraging behavior detection using sound recognition techniques and artificial intelligence. Comput. Electron. Agric. 183, 106080. doi: 10.1016/j.compag.2021.106080
Oksanen J. (1983). Ordination of boreal heath-like vegetation with principal component analysis, correspondence analysis and multidimensional scaling. Vegetatio 52, 181–189. doi: 10.1007/BF00044995
Parhi K. K., Ayinala M. (2014). Low-complexity welch power spectral density computation. IEEE Trans. Circuits Syst. I: Regular Papers 61, 172–182. doi: 10.1109/TCSI.2013.2264711
Pěnka T., Malinovskyi O., Imentai A. (2023). Evaluation of different feeding frequencies in RAS-based juvenile pikeperch (Sander lucioperca) aquaculture. Aquaculture 562, 1–8. doi: 10.1016/j.aquaculture.2022.738815
Qi R. (2023). Analysis of acoustic characteristics of feeding sounds in circulating water cultivation of large-mouthed black bass. Shanghai, China: Shanghai Ocean University. Master dissertation.
Rountree R. A., Gilmore R. G., Goudey C. A. (2006). Listening to fish: applications of passive acoustics to fisheries science. Fisheries 31, 433–446. doi: 10.1577/1548-8446(2006)31[433:LTF]2.0.CO;2
Silva J. F., Santiago H., João V. R. (2019). Acoustic characterization of feeding activity of Litopenaeus vannamei in captivity. Aquaculture 501, 76–81. doi: 10.1016/j.aquaculture.2018.11.013
Smith D. V., Simon T. (2013). The use of passive acoustics to measure feed consumption by Penaeus monodon (giant tiger prawn) in cultured systems. Aquacultural Eng. 57, 38–47. doi: 10.1016/j.aquaeng.2013.06.003
Urbanowicz R. J., Meeker M., La Cava W., Olson R. S., Moore J. H. (2018). Relief-based feature selection: Introduction and review. J. Biomed. Inf. 85, 189–203. doi: 10.1016/j.jbi.2018.07.014
Xuan C., Wu P., Ma Y., Zhang L., Han D., Liu Y. (2015). Vocal signal recognition of ewes based on power spectrum and formant analysis method. Trans. Chin. Soc. Agric. Eng. 31, 219–224. doi: 10.11975/j.issn.1002-6819.2015.24.033
Yang F., Jiang Y., Xu Y. (2022). Design of bird sound recognition model based on lightweight. IEEE Access 10, 85189–85198. doi: 10.1109/ACCESS.2022.3198104
Yin Y., Ji N., Wang X., Shen W., Dai B., Kou S., et al. (2023). An investigation of fusion strategies for boosting pig cough sound recognition. Comput. Electron. Agric. 205, 107645.10. doi: 10.1016/j.compag.2023.107645
Yu H., Yang X., Zheng S., Sun C. (2018). Active learning from imbalanced data: A solution of online weighted extreme learning machine. IEEE Trans. Neural Networks Learn. Syst. 30, 1088–1103. doi: 10.1109/TNNLS.2018.2855446
Keywords: largemouth black bass, feature selection, feature dimensionality reduction, recognition, machine learning models
Citation: Liu S, Liu S, Qi R, Zheng H, Zhang J, Qian C and Liu H (2024) Recognition of feeding sounds of large-mouth black bass based on low-dimensional acoustic features. Front. Mar. Sci. 11:1437173. doi: 10.3389/fmars.2024.1437173
Received: 23 May 2024; Accepted: 13 August 2024;
Published: 05 September 2024.
Edited by:
Jian Zhao, Zhejiang University, ChinaReviewed by:
Kewei Cai, Dalian Nationalities University, ChinaZhitao Huang, Norwegian Institute for Water Research (NIVA), Norway
Copyright © 2024 Liu, Liu, Qi, Zheng, Zhang, Qian and Liu. This is an open-access article distributed under the terms of the Creative Commons Attribution License (CC BY). The use, distribution or reproduction in other forums is permitted, provided the original author(s) and the copyright owner(s) are credited and that the original publication in this journal is cited, in accordance with accepted academic practice. No use, distribution or reproduction is permitted which does not comply with these terms.
*Correspondence: Shijing Liu, bGl1c2hpamluZ0BmbWlyaS5hYy5jbg==; Huang Liu, bGl1aHVhbmdAZm1pcmkuYWMuY24=