 Zhenglin Tian
 Hui Yang
 Hongjie Wen
94% of researchers rate our articles as excellent or good
Learn more about the work of our research integrity team to safeguard the quality of each article we publish.
Find out more
ORIGINAL RESEARCH article
Front. Mar. Sci., 24 July 2024
Sec. Marine Fisheries, Aquaculture and Living Resources
Volume 11 - 2024 | https://doi.org/10.3389/fmars.2024.1436992
The integrated development of offshore platform and net cage is a significant concern in ocean engineering. To optimize cost-effectiveness and maximize the utilization of limited ocean space resources, a composite structure is proposed, which integrates a submersible net cage onto the steel pipe piles of offshore platform. Based on the OpenFOAM software package, a numerical model is developed to assess the hydrodynamic performance of this composite structure. In this model, the net cage is simplified as a closed box structure comprising six planar nets, with each planar net further represented as a porous structure based on equivalent resistance. The model is validated by comparing the predicted results with the relevant experimental and numerical data. Subsequently, the model is employed to comprehensively investigate the hydrodynamic performance of the submersible net cage integrated with an offshore platform. Velocity variations inside and outside the net cage are analyzed under various wave-current conditions. Additionally, the forces exerted on the steel pipe piles by the net cage at different submerged depths are also examined.
Offshore aquaculture emerges as a crucial solution to the global food scarcity crisis. Statistical projections anticipate a surge in demand for aquatic food products by thirty million tons by 2050 (Ferreira et al., 2014). However, escalating population growth and overfishing have led to the gradual depletion of offshore aquaculture resources. To optimize the utilization of limited offshore space, engineers and scholars have proposed installing net cage on offshore platform, such as offshore booster station. While the potential impact of net cage on ocean platform remains unclear (Wahlberg and Westerberg, 2005; Dan et al., 2006), recent studies have shown that integrating offshore aquaculture with ocean platform can reduce aquaculture maintenance costs by 10% and increase farming income by 44% (He, 2015).
The traditional floating net cage typically consists of a frame structure, netting, and anchorage system (Liang et al., 2021). Maintaining the stability of the net cage under diverse sea conditions presents a significant challenge. To mitigate the risk of capsizing in extreme sea conditions, the lifting net cage has been proposed and successfully implemented in offshore areas. This design primarily utilizes a ballast water compensation device to enable the net cage to dive to a specific depth, thus preventing overturning in extreme sea conditions (Cardia and Lovatelli, 2016). Huang et al. (2013) have researched anti-overturning technology for the lifting net cage, while Kim et al. (2011) have analyzed the influence of submerged depth.
The flow field characteristics and wake pattern behind the net cage significantly influence water exchange, which determines the suitability of fish species for aquaculture and the health of enclosed fish (Gowen, 1990; Beveridge, 2004; Zhao et al., 2011; Kapetsky et al., 2013; Johansson et al., 2014). Consequently, attention has been directed towards understanding the flow field characteristics around the net cage (Lee et al., 2008; DeCew et al., 2010; Patursson et al., 2010; Zhao et al., 2013; Shi et al., 2021; Xu et al., 2022). Wu et al. (2007) experimentally demonstrated that currents predominantly affected the netting system, while waves had a notable impact on the overall cage structure. The adverse currents notably affect the wave field, Chen et al. (2024) investigated the changes of instantaneous field in wave propagation and wave breaking due to spatial varying opposing currents. Cha et al. (2013) provided experimental clarity that flow characteristics particularly depended on the structural shape of copper nets. Klebert and Su (2020) experimentally highlighted that the magnitudes and distributions of fluid velocities inside a commercial salmon sea cage were influenced by the net cage.
The porous model has been widely used in numerical simulations to study the hydrodynamic characteristics of net cage. Chen and Christensen (2016) conducted a comparative simulation of the flow field characteristics between square and circular cages. Zhao et al. (2013a); Zhao et al. 2013b) utilized a porous model to simulate flow through the fishing mesh. Additionally, Shim et al. (2009); Cornejo et al. (2014); Chen and Christensen (2015), and Kim et al. (2014) used the porous model to simulate the interaction between waves and net cages. They systematically analyzed the influence of relevant parameters on the flow field.
The steel pipe pile foundation, crucial for offshore platform, is suitable for water depths ranging from 20 m to 50 m. This foundation type offers several advantages, including structural integrity, significant stiffness, and resilience against wind, waves, and currents (Hao and Liu, 2017). Consequently, installing net cage on steel pipe pile represents a bold initiative aimed at maximizing the utilization of limited offshore space resources. Compared to the traditional net cage, installing a lifting net cage on the steel pipe pile of an offshore platform reduces overturning accidents and minimizes deformation, thanks to the sturdy steel construction of both the steel pipe pile and the net cage. However, there is a lack of relevant research findings and practical applications. The hydrodynamic performance of a submersible net cage integrated with an offshore platform largely depends on the parameters of the steel pipe pile, the net cage, and its lifting height, requiring further systematic investigation.
This study proposes an integrated structure that combines an offshore foundation with a net cage. As shown in Figure 1, the integrated structure includes the steel pipe pile, the net cage, the four-pile cap, and the ballast water compensation device. The steel pipe piles facilitate the transfer of the superstructure load to the subsea foundation. The net cage provides a suitable living space and environment for fish, preventing escape and protecting against external threats. Figure 2 illustrates the detailed structure of the net cage. The foundation platform serves as operational space for staff living quarters, net cage handling, and fish feeding activities. The ballast water compensation device ensures a balanced lifting motion for the net cage. The lifting net cage connects to the steel pipe pile foundation via a sleeve piece, enabling stable lifting facilitated by the lifting device and ballast water compensation device.

Figure 1 Integrated structure of the offshore foundation and the net cage.
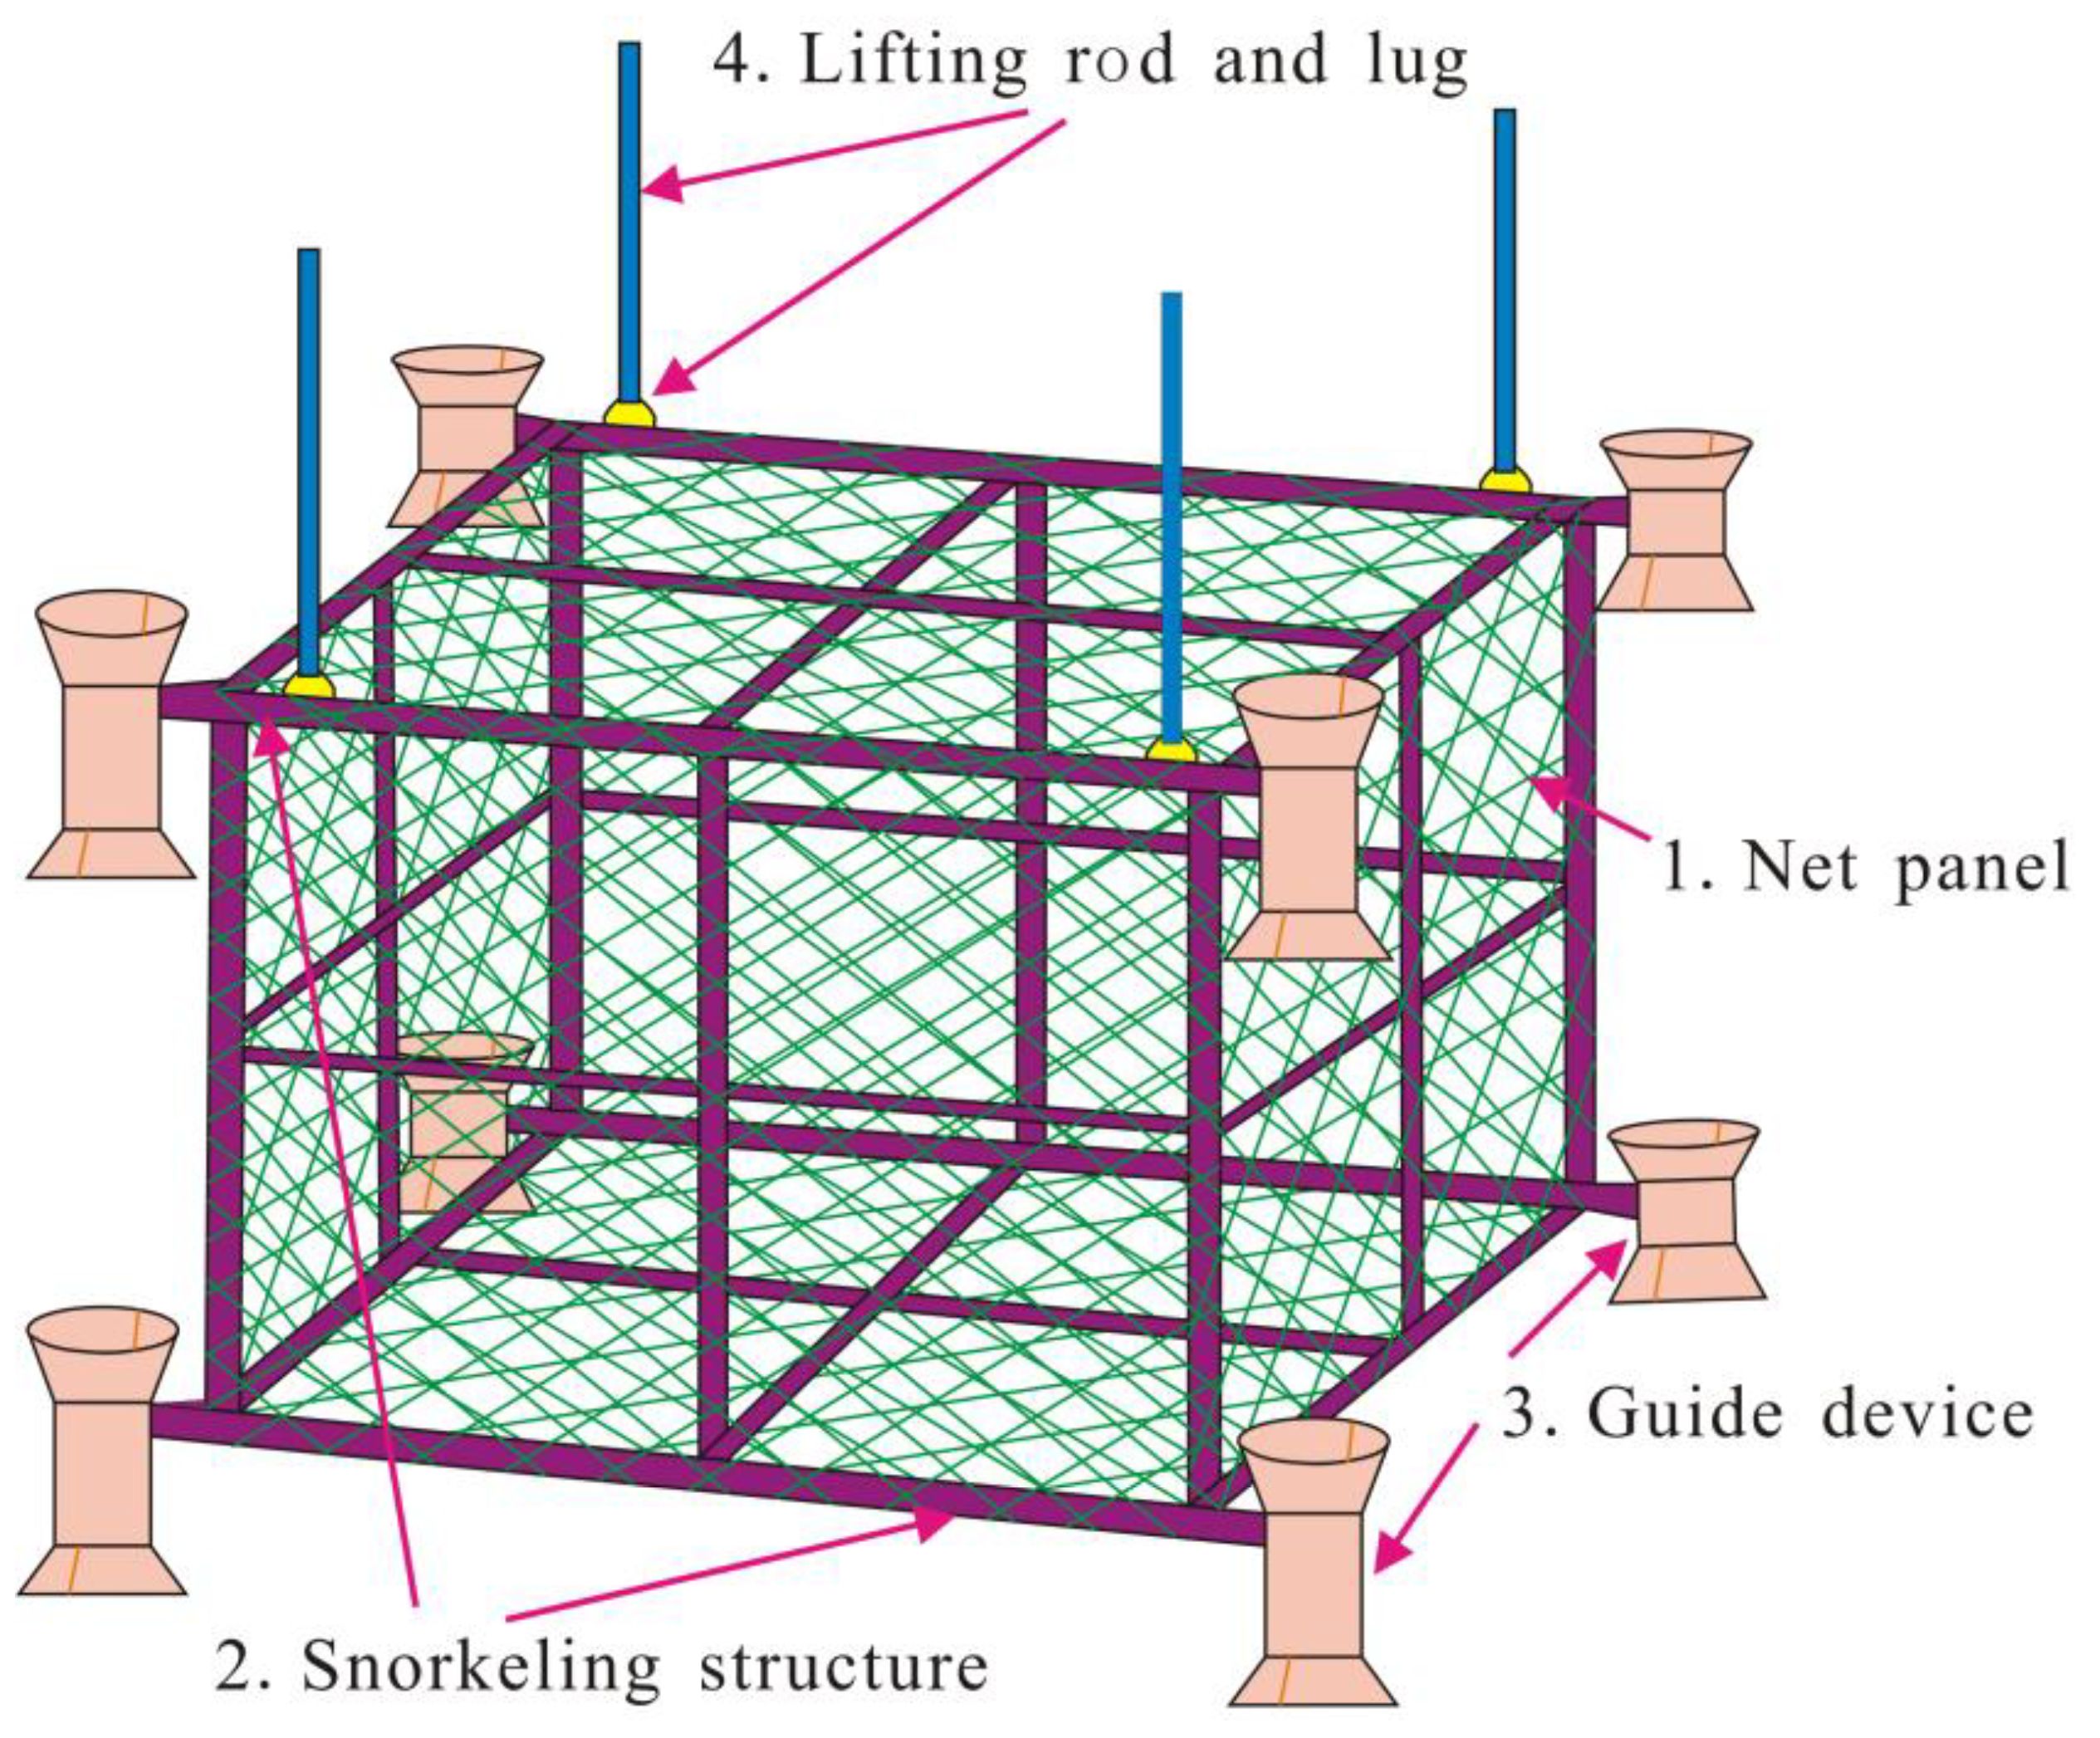
Figure 2 Sketch of the lifting net cage.
The paper is structured as follows: after the introduction, the numerical model is outlined, including the governing equations and the primary boundary conditions. Section 3 validates the developed model using experimental data on wave and current interaction with a single net cage. Section 4 presents the results of combined wave-current interaction with a lifting net cage integrated into an offshore platform. Finally, the main conclusions are drawn.
The net cage can be analyzed at microscopic or macroscopic scales. The microscopic scale method considers the net cage as a flexible structure, offering a comprehensive analysis of its geometric attributes. Consequently, the computational demands associated with the microscopic method are significant. In contrast, the macroscopic scale approach treats the net cage as a permeable structure, utilizing a porous model to simulate its drag resistance to water flow. By eliminating the necessity for precise computation of individual net structure deformations, this method substantially alleviates the computational load in numerical simulations, establishing itself as the predominant approach for simulating the interaction between wave-current and net cage. In this study, we introduce the macroscopic method by disregarding the deformation of the net cage.
Fluid flow through porous media is governed by the volume-averaged Reynolds-averaged Navier-Stokes equations (VARANS). According to Jensen et al. (2014), the VARANS equations can be written as Equations 1, 2
where represents the averaged velocity; denotes the equivalent porosity of the net cage; represents the total fluid pressure; ρ is the fluid density; t is time; g is gravity acceleration; represents the efficient dynamic viscosity; and are the kinematic and turbulence viscosity, respectively. The turbulence viscosity is determined by the - model. is the added mass coefficient, accounting for the inertial effect due to the presence of the net cage. is a dimensionless empirical coefficient, set as 0.34 throughout this study based on recommendations and previous experience (Van Gent, 1995).
The drag resistance force Ri is typically described by Darcy-Forchheimer equation as Equation 3:
where and present the linear and nonlinear drag resistance coefficient matrices, respectively. The significance of these two terms depends on the pore Reynolds number, which is defined as and d is the twine diameter of the fishing nets. Previous studies have indicated that the pore Reynolds number generally ranges from 100 to 1000 for flow through a net cage. In this predominantly turbulent flow regime, the linear term is negligible compared to the dominant nonlinear term. Therefore, is set as 0 in the present study, and the drag resistance force is solely calculated based on the nonlinear term. Following Chen and Christensen (2016), the nonlinear coefficient matrix is written as Equation 4:
where and represent the total projected areas for the in-plane and out-of-plane twines, respectively. N and M denote the number of the in-plane and out-of-plane twines. is the drag force coefficient of the net twines, which depends on the physical parameters of the net, incoming velocity, attack angles, Reynolds number, and other factors. The introduced k1 and k2 in the expressions for the normal and tangential quadratic drag resistance coefficients are used to mitigate the side effects of neglecting the interaction between the fishing twines in the Morison-type force model. The values of k1 and k2 are determined by Equations 5, 6:
where represents the solidity ratio of the net cage, defined as complement of porosity.
The volume of fluid approach is employed to capture the free water surface. The local water volume fraction is obtained by solving the following advection equation:
The final term on the left-hand side of Equation 7 acts as an artificial compression term to inhibit excessive diffusion of the interface, where represents the compression velocity. The above equations are discretized by the finite volume method implemented on the OpenFOAM platform.
Since the geometry of the net cage is unresolved, obtaining the instantaneous force on the net cage by integrating the pressure over the fishing twine is not feasible. Based on the linear momentum conservation in a control volume that enclose a porous structure, the force acting on the fluid from the porous structure is equal to the momentum loss in the control volume. Therefore, following Patursson (2008), the expression for the instantaneous force anting on the net cage can be written as Equation 8:
where is the viscous stress tensor, CV is the control volume and CS is the control surface.
In this section, the performance of the numerical model is verified by comparing with Bi et al.’s (2013) experimental results for current interaction with a rectangular net cage. As displayed in Figure 3, the dimensions of the numerical basin are 1.2 m×0.45 m×0.8 m (Length×Width×Height). The left and right boundaries are set as the inflow and outflow boundary conditions. The front and rear as well as the bottom boundaries are set as the wall boundary conditions. Following the experimental setup, the net cage dimensions are 0.3 m×0.3 m×0.05 m (Length×Width×Thickness), positioned 0.3 m from the end of the numerical flume, as displayed in Figure 3. The plane net is oriented perpendicular to the bottom and the side wall of the flume, and it aligns with the incoming flow direction. The water depth D is 0.4 m and the incoming flow velocity is 0.17 m/s. The net cage is modeled as a porous media, with the porosity and the average grain diameter set to 0.32 and 0.016 m, respectively. Following Zhu et al.’s (2021), the drag force coefficient of the net twines is set as =1.54. The computational domain is discretized using the structured hexahedral mesh with a dimensions of =0.02 m in x-direction, =0.02 m in y-direction and =D/(20~40) in z-direction. The mesh is refined near the free water surface and the net cage to capture the flow characteristics. It is worth mentioning that prior to the formal numerical simulations, all cases discussed in this paper underwent grid convergence verification. The grid sizes provided here reflect a careful balance between computational accuracy and efficiency.
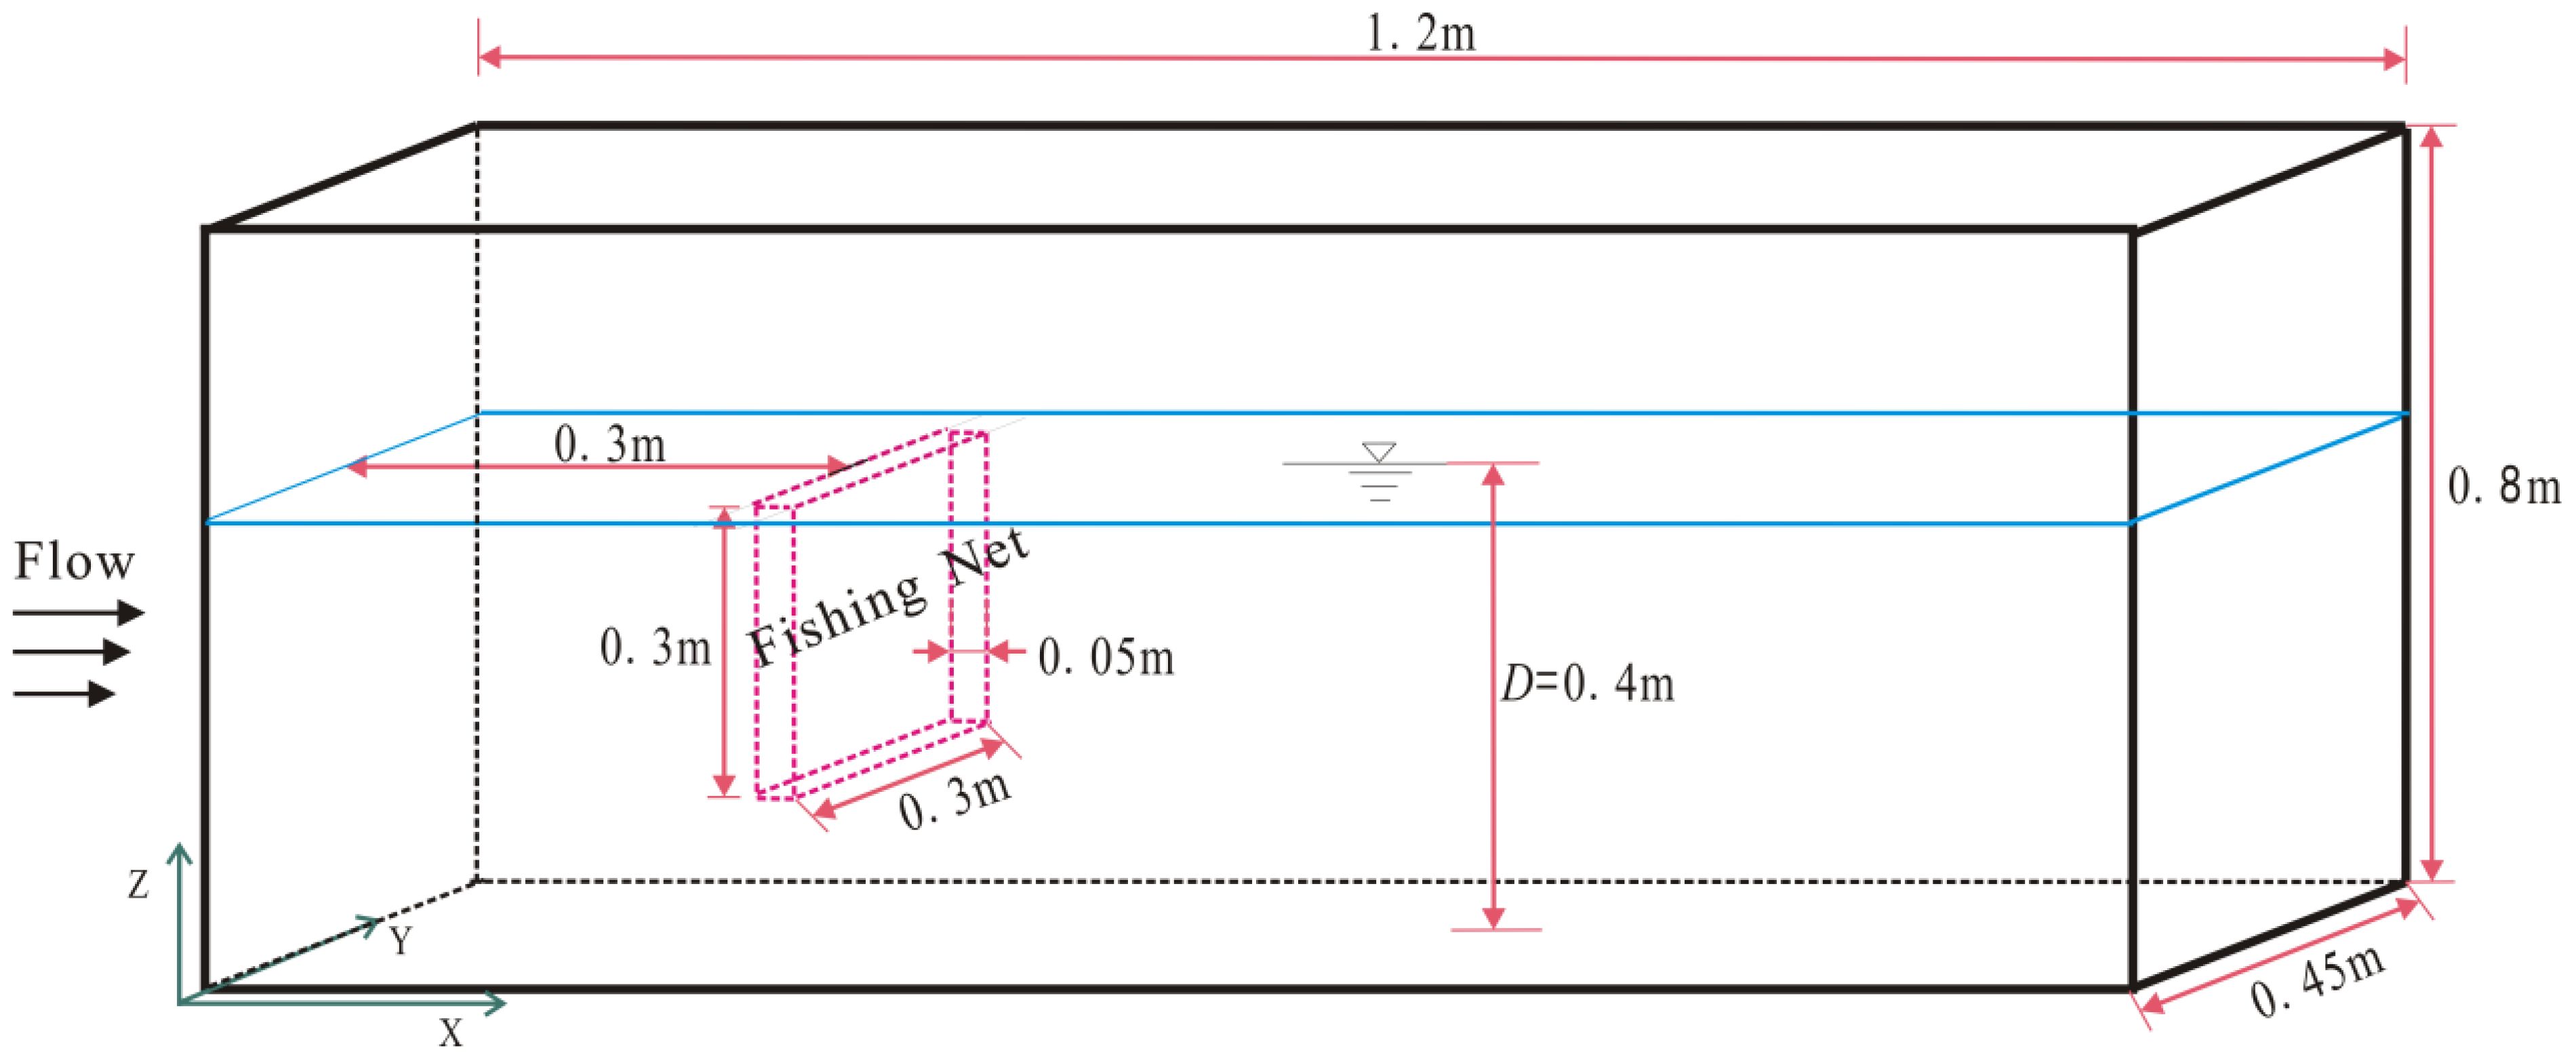
Figure 3 Numerical setup of current interaction with a net cage.
Figure 4 shows the horizontal velocity distribution along a vertical section located 0.15 m downstream from the net cage. Additionally, Zhu et al.’s (2021) numerical results are provided for further validation of the numerical model. As shown in Figure 4, the velocity noticeably decreases in the downstream area due to the drag effect of the net cage, while there is an obvious increase below the net cage models. The numerical results are in good agreements with the experimental data of Bi et al. (2013) and the numerical results of Zhu et al. (2021), with the velocity relative errors of less than 10%, indicating that the numerical model can effectively simulate the interaction between the flow and the net cage. It is worth noting that there is an obvious deviation between the numerical results and the experimental data at z=-300 mm. The deviation is presumed to result by the discrepancies of the numerical and physical models. In Bi et al.’s (2013) test, a round steel frame structure with a diameter of 6 mm is installed at z=-300 mm to fixed the net cage, and the additional resistance caused by the steel frame results in a more pronounced velocity attenuation. However, the numerical model does not include the steel frame.
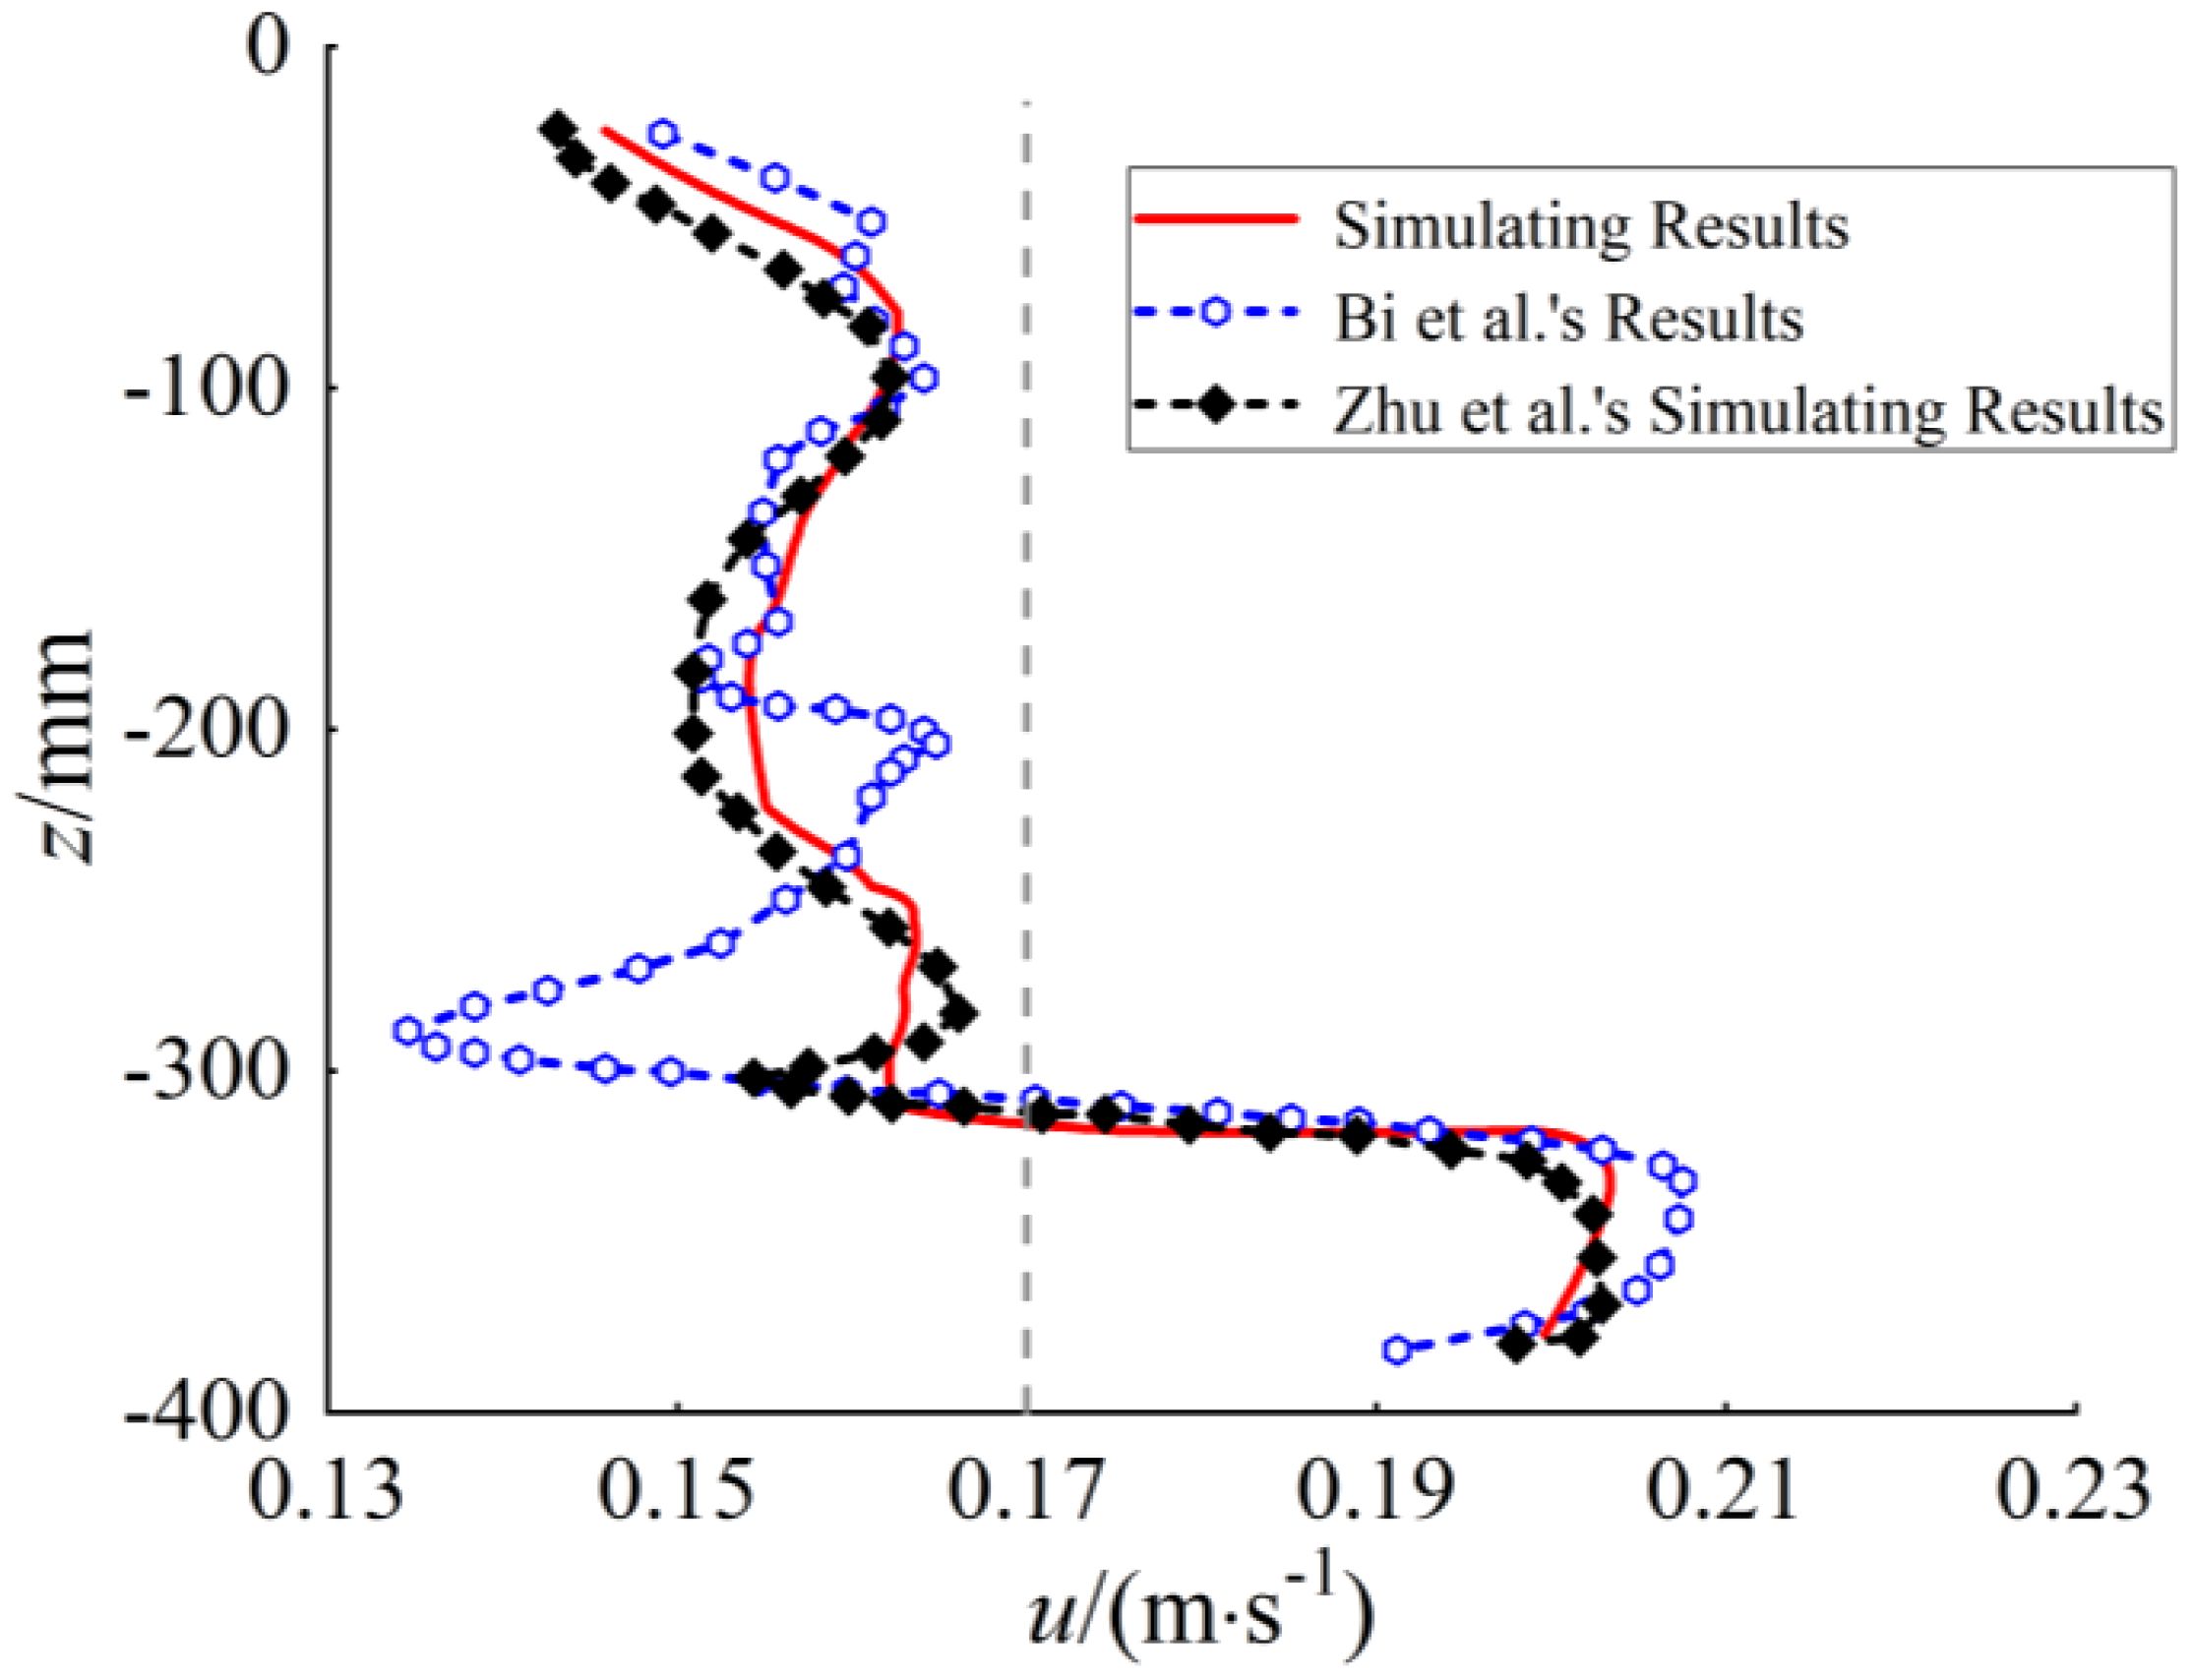
Figure 4 Horizontal velocity distribution along a vertical section located 0.15 m downstream from the net cage.
This section further examines the performance of the numerical model in predicting wave loads acting on a net cage panel by comparing it with Lader et al. (2007a, b) experimental data. Table 1 gives the principal parameters of the net cage tested in the physical model. Following the experiment setup, a 2D wave flume is developed and shown in Figure 5. The dimensions of the numerical flume are 7.2 m×1.0 m (Length×Height). The bottom boundary is set as the wall boundary condition. The left and right boundaries are set as the wave generation and absorption boundary conditions following Pablo et al. (2013). The computational domain is discretized using the rectangular mesh with a dimensions of =L/60 in x-direction and =H/40 in y-direction. In the numerical model, the net cage panel is represented by a sheet of porous media with a thickness of 50 mm and a height of 1.0 m. The drag force coefficient of the net twines is set as =1.56. The still water depth is set to 0.62 m, the regular wave period is T=0.7 s, the wave height is H=0.084 m. Figure 6 shows the comparison of the time series of wave force acting on the net cage panel between the present numerical results and Lader et al. (2007a, b) experimental data. As can be seen in Figure 6, the numerical results have a good agreement with the corresponding experimental data, which indicates the present model can accurately predict the wave loads acting on a net cage panel.

Table 1 Parameters of the net cage used in Lader et al. (2007a, b) physical test.
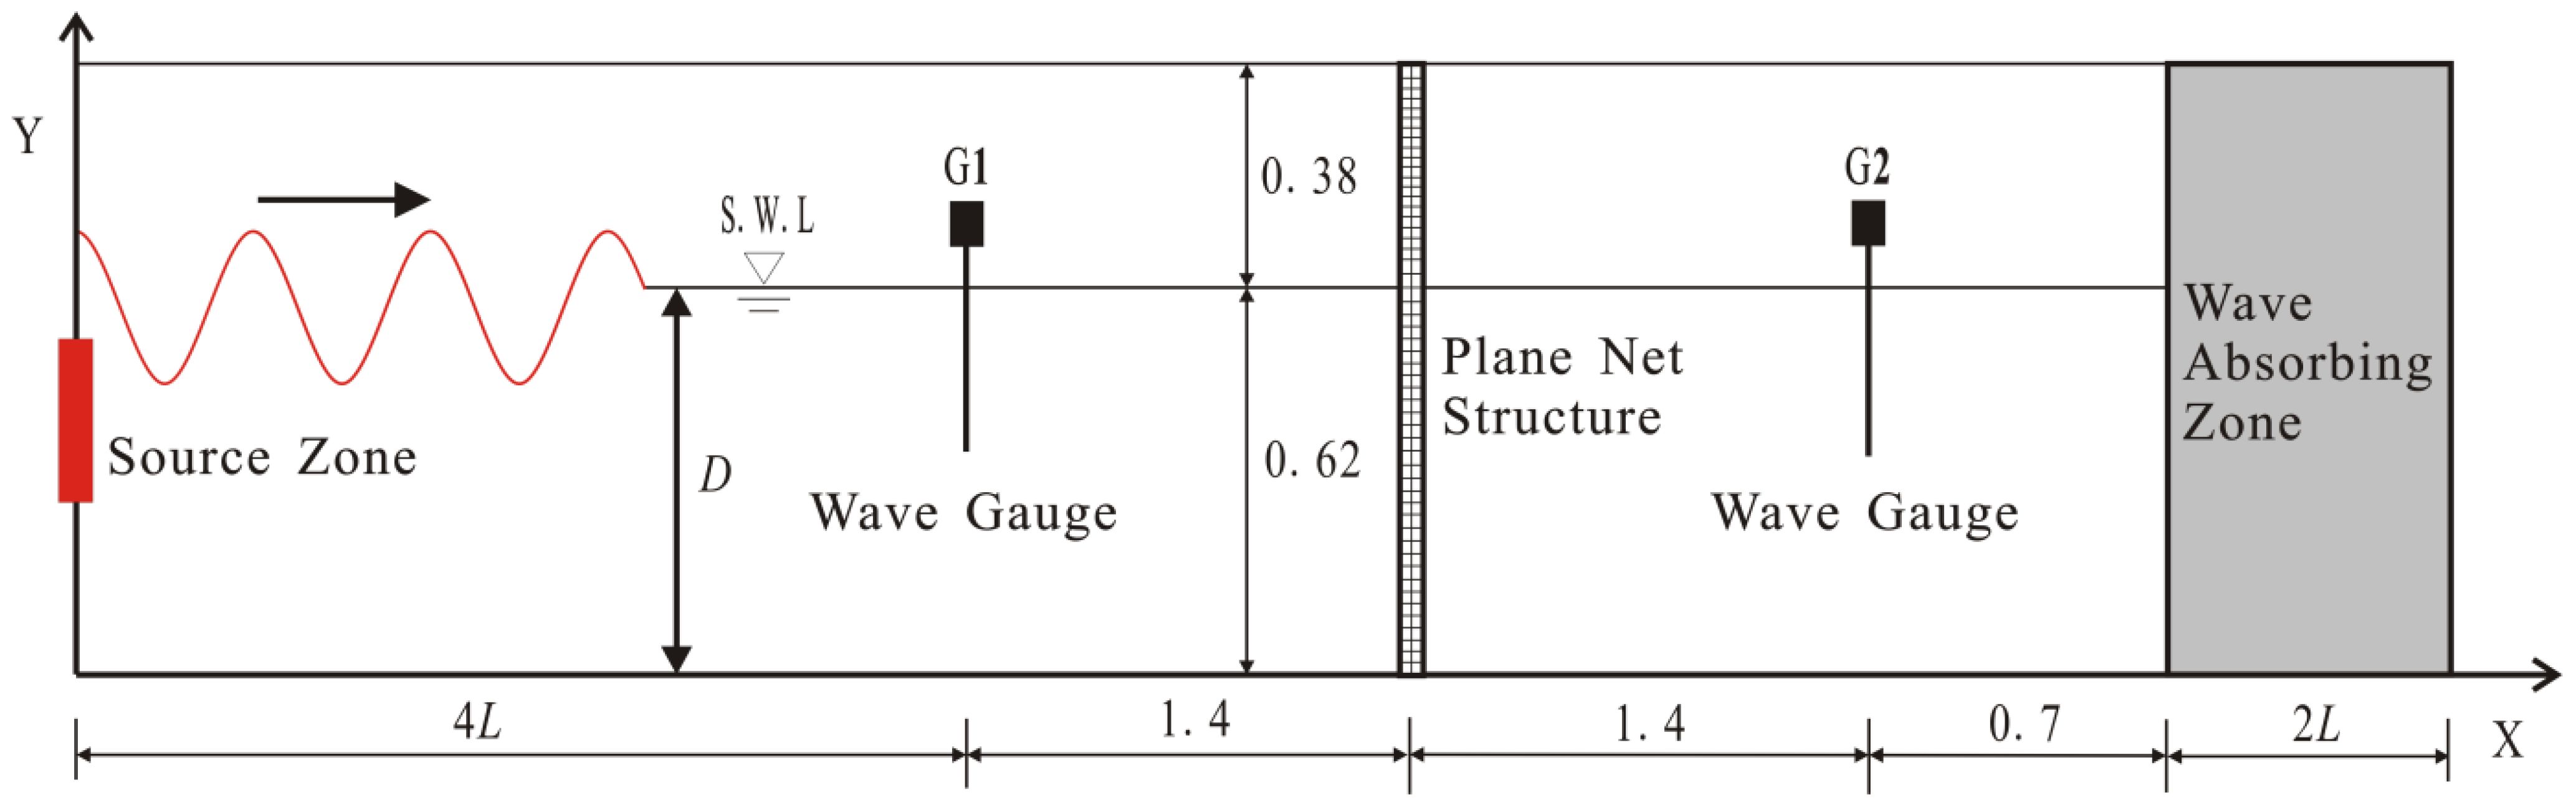
Figure 5 Sketch of the computational domain for wave interaction with a net cage panel (Unit: m).
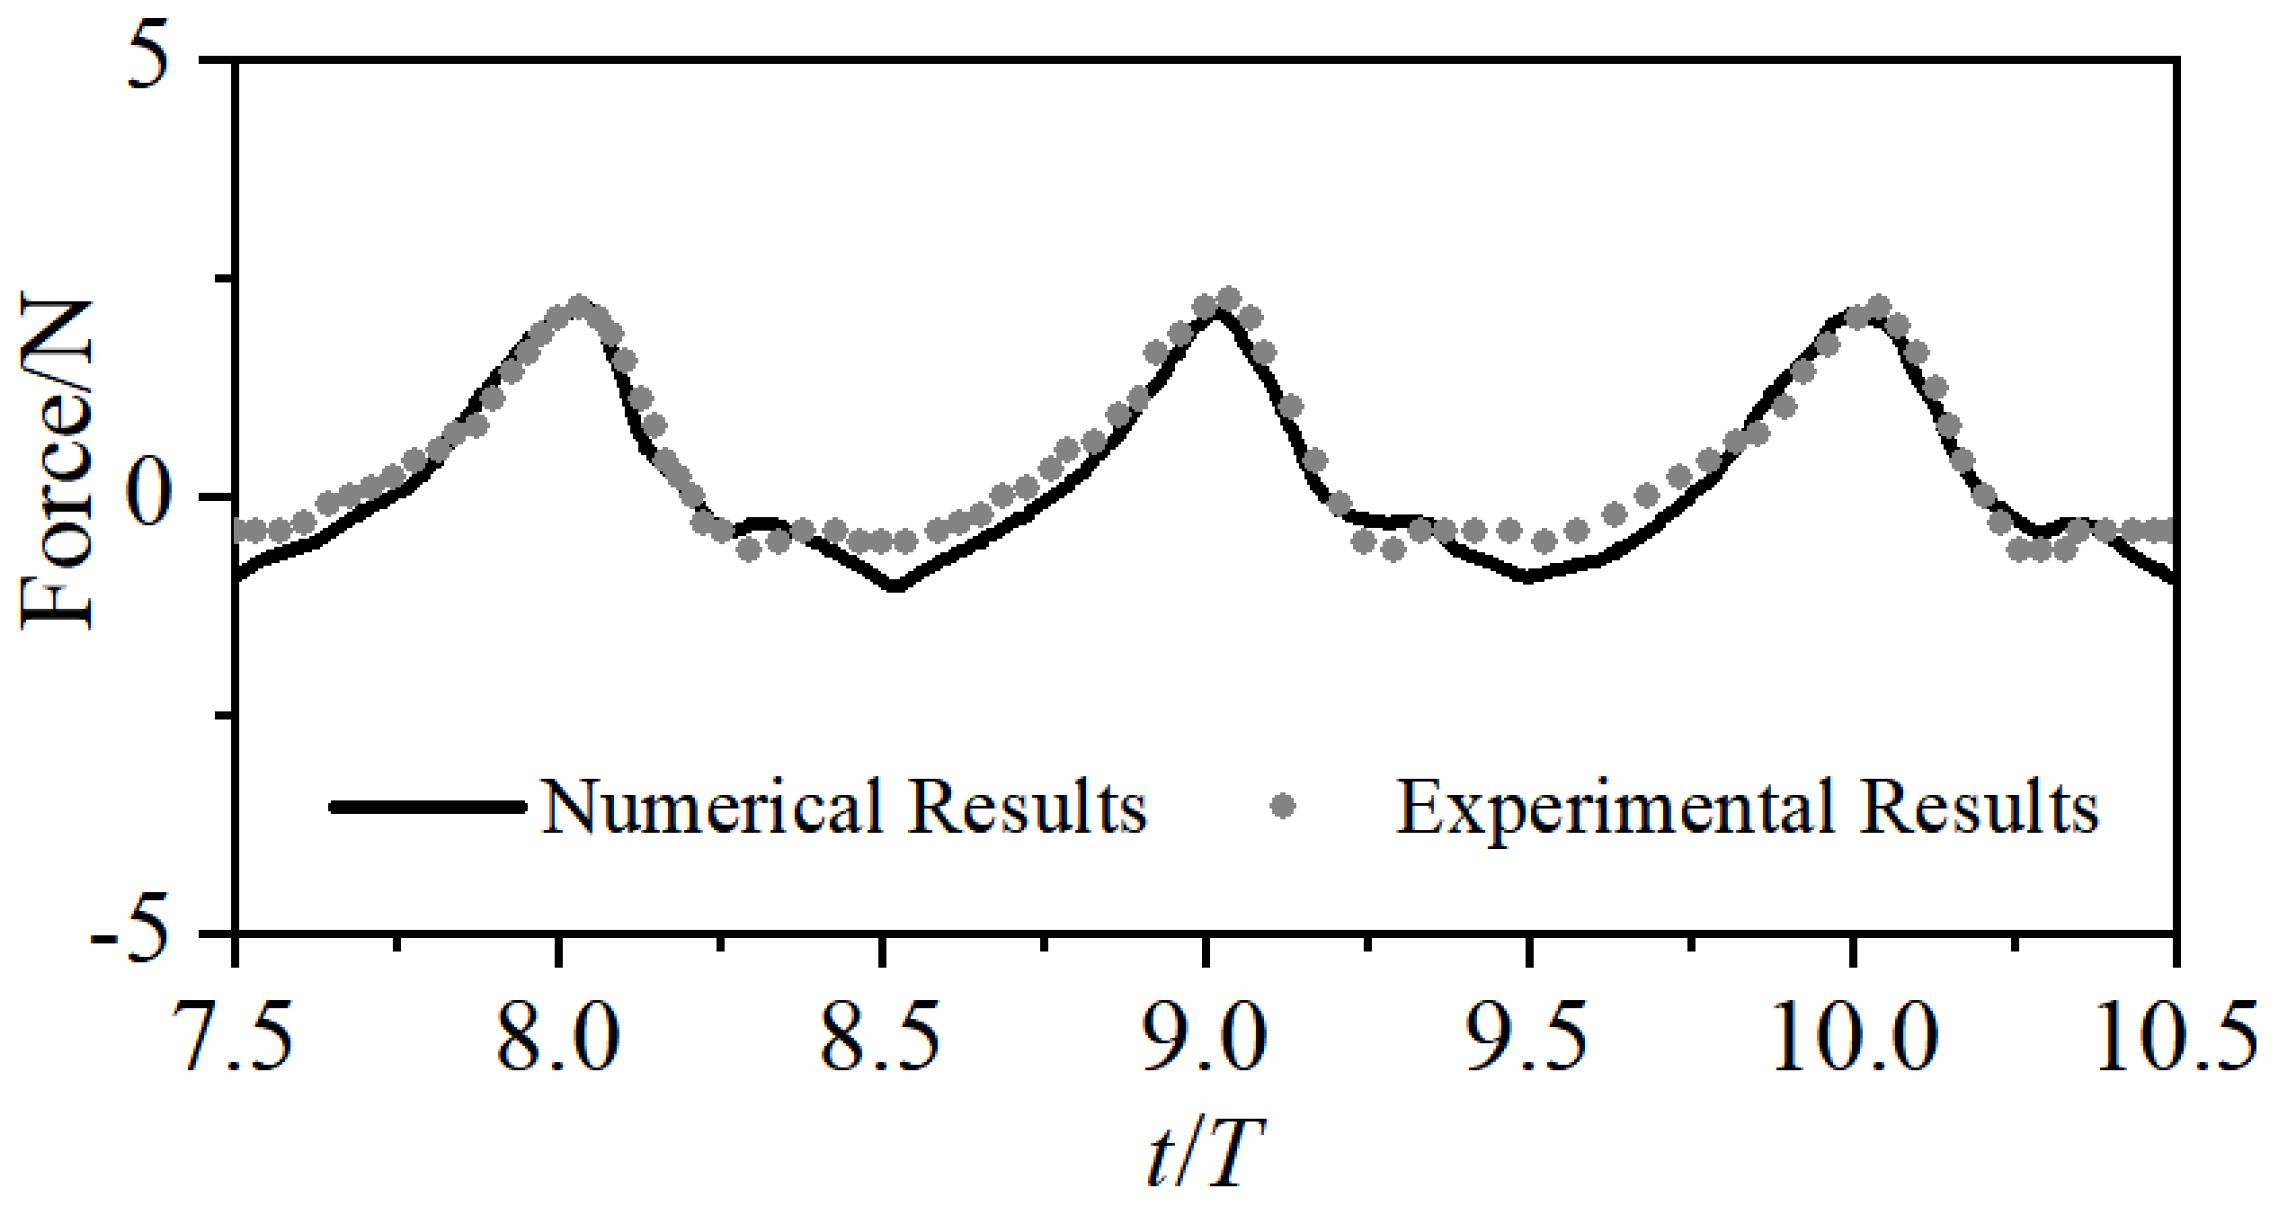
Figure 6 Comparison of the time series of wave force acting on the net cage panel.
The offshore foundation is represented by four steel pipes with a diameter of 2.0 m, spaced 15.0 m apart. The net cage dimensions are 15m × 15m × 12m (Length × Width × Height). In the numerical simulation, a scale of 1/25 is used, resulting in the net cage dimensions of 0.6m × 0.6m × 0.48m (Length × Width × Height). The diameter of the steel pipe pile is reduced to 0.08 m. Additionally, the mean nominal diameter of the material and the porosity of the porous model are set to 0.016 m and 0.32, respectively.
As indicated in Table 2, this study examines two wave conditions. Case 1 represents the annual operational condition, while Case 2 depicts the extreme condition occurring once every 50 years. The average velocity in the depth direction is 0.216 m/s for Case 1 and 0.364 m/s for Case 2, with a water depth (D) of 1.6m.
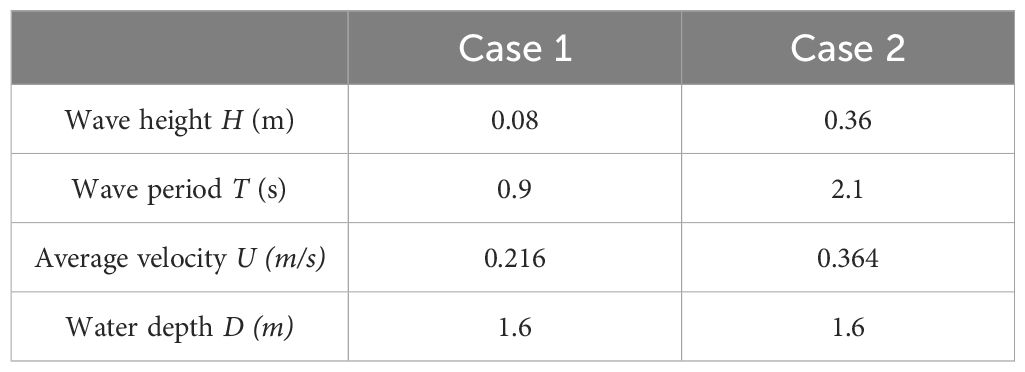
Table 2 Wave and current parameters in numerical simulation.
The net cage is simplified as a three-dimensional enclosed space composed of six plane nets. Figure 7 depicts the location of the net cage and the distribution of testing points for each operating condition. In the numerical calculations, the horizontal position of the net cage remains constant, considering only vertical movement. This approach enables the examination of how changes in the submerged depth of the net cage affect the variation patterns of flow field characteristics.
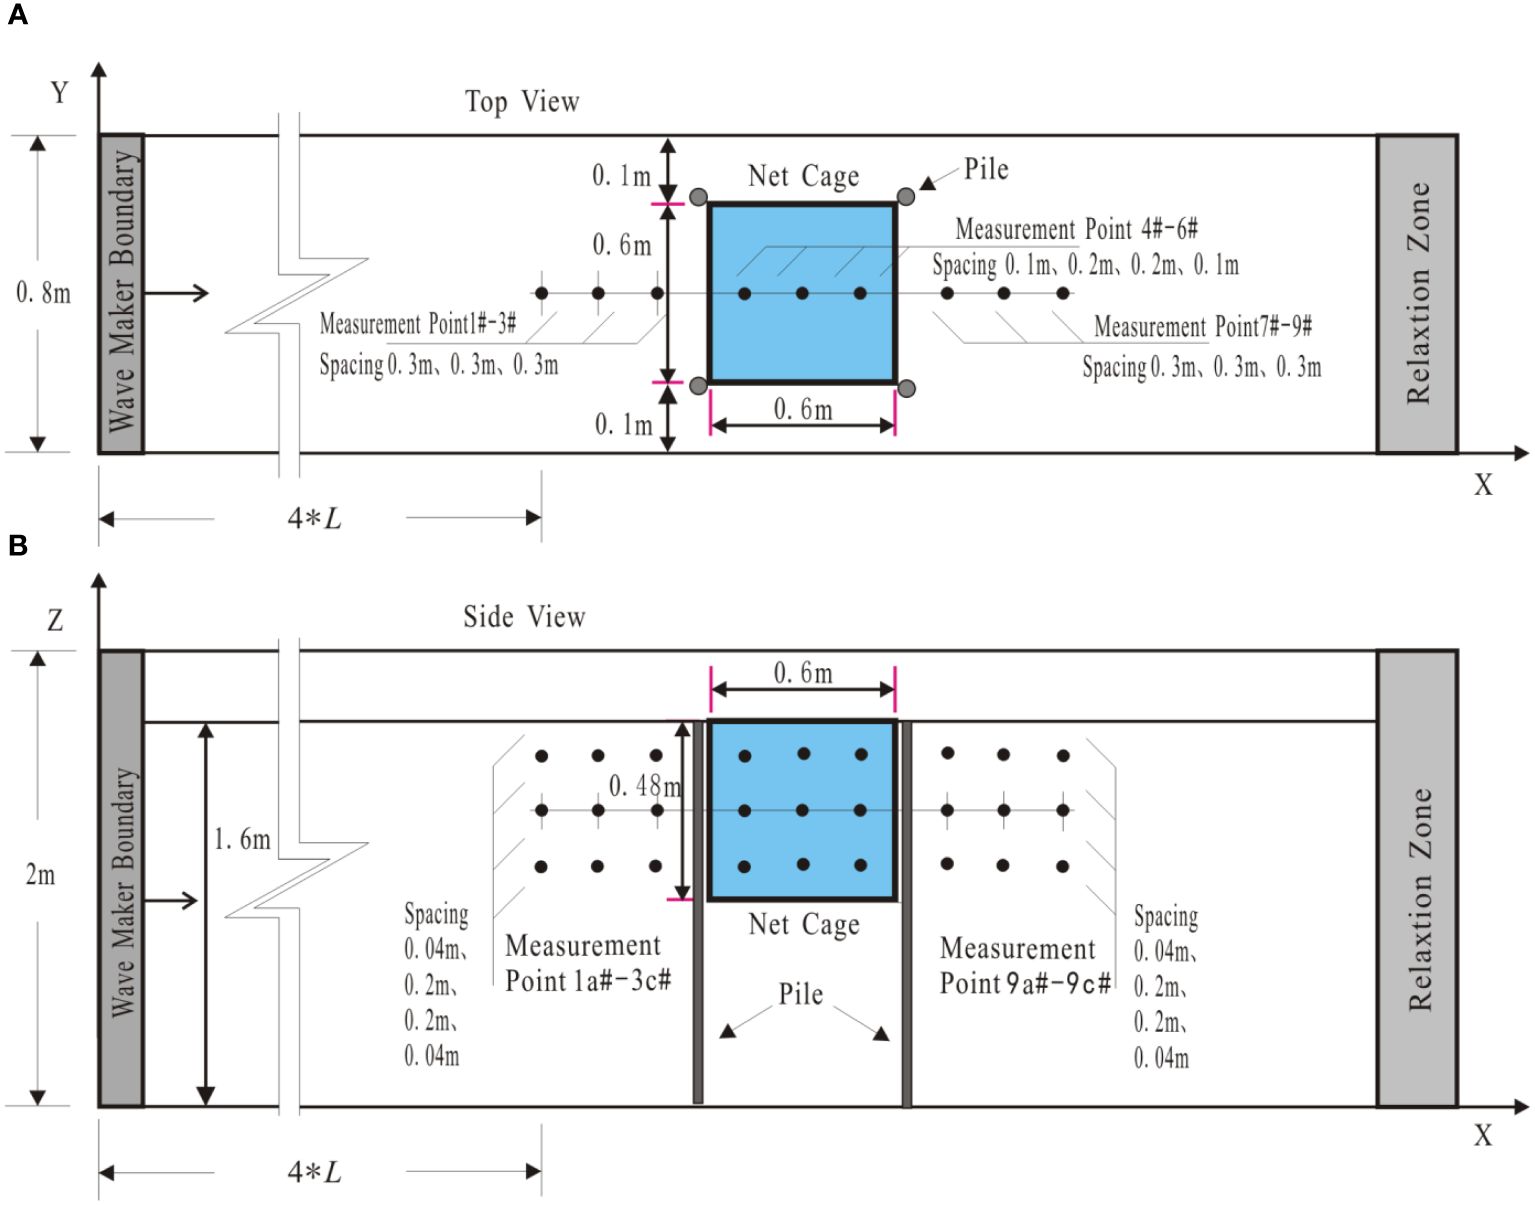
Figure 7 Location of the net cage and distribution of testing points.
Figure 8 illustrates the flow field characteristics throughout a wave cycle under operational conditions. The water depth (D) is 1.6 m, with a wave period (T) of 0.9 s, a wave height (H) of 0.08 m, an average flow velocity along the depth direction of 0.216 m/s, and a submerged depth (d) of 0.0 m. As depicted in Figure 8, the net cage exhibits a resistance to flow during the interaction between waves-currents and the structure, leading to a reduction of velocity inside the net cage. Downstream from the net cage, there is a noticeable decrease in flow velocity, accompanied by the formation of vortices on the downstream side. The flow velocity beneath the net cage increase due to the obstruction caused by net cage. This phenomenon is consistent with the results of Bi et al.’s physical model experiment, where the flow velocity beneath the net cage increased under the influence of currents.
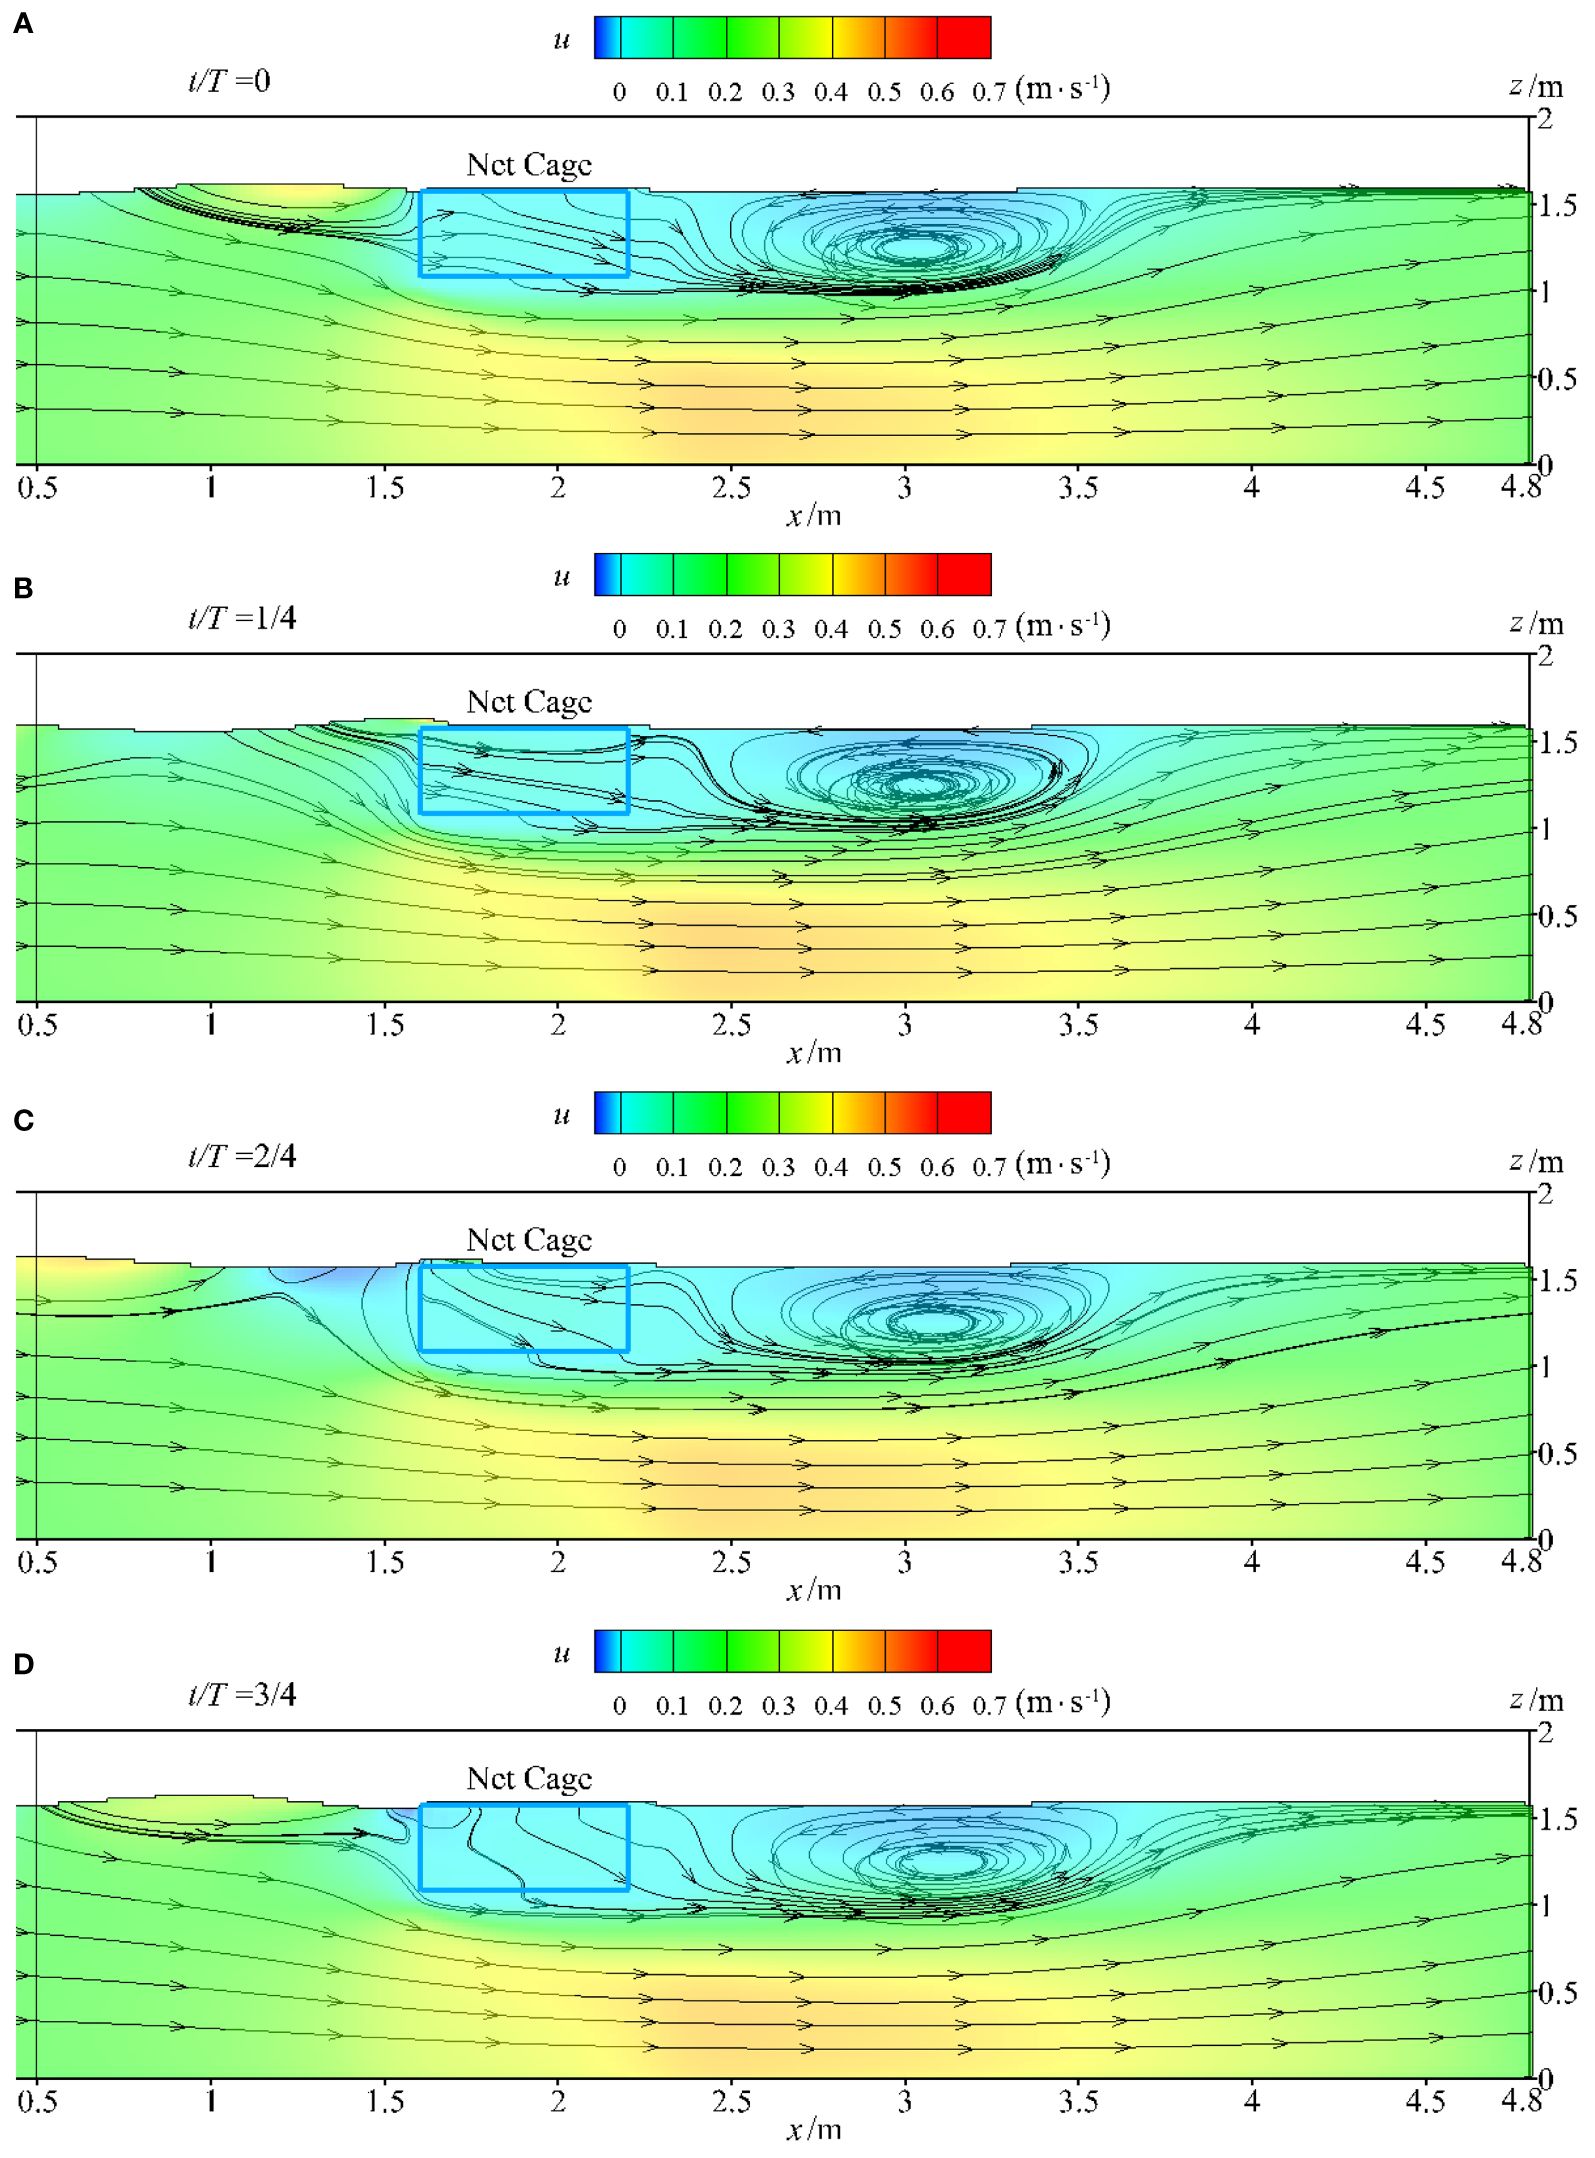
Figure 8 (A-D) Flow field characteristics throughout a wave cycle under operational conditions.
Figure 9 displays the velocity variation curves of nine measurement points labeled 4a-4c#, 5a-5c#, and 6a-6c#. From Figure 9, it is evident that the flow velocity gradually decreases as the testing points move farther from the leading edge of the net cage (points 4, 5, and 6). Moreover, the flow velocity decreases with increasing submerged depth (points a, b, and c). Notably, the flow velocity near the water surface inside the net cage exceeds that of the middle and lower parts, while the velocity is lowest at the bottom and back half of the net cage.
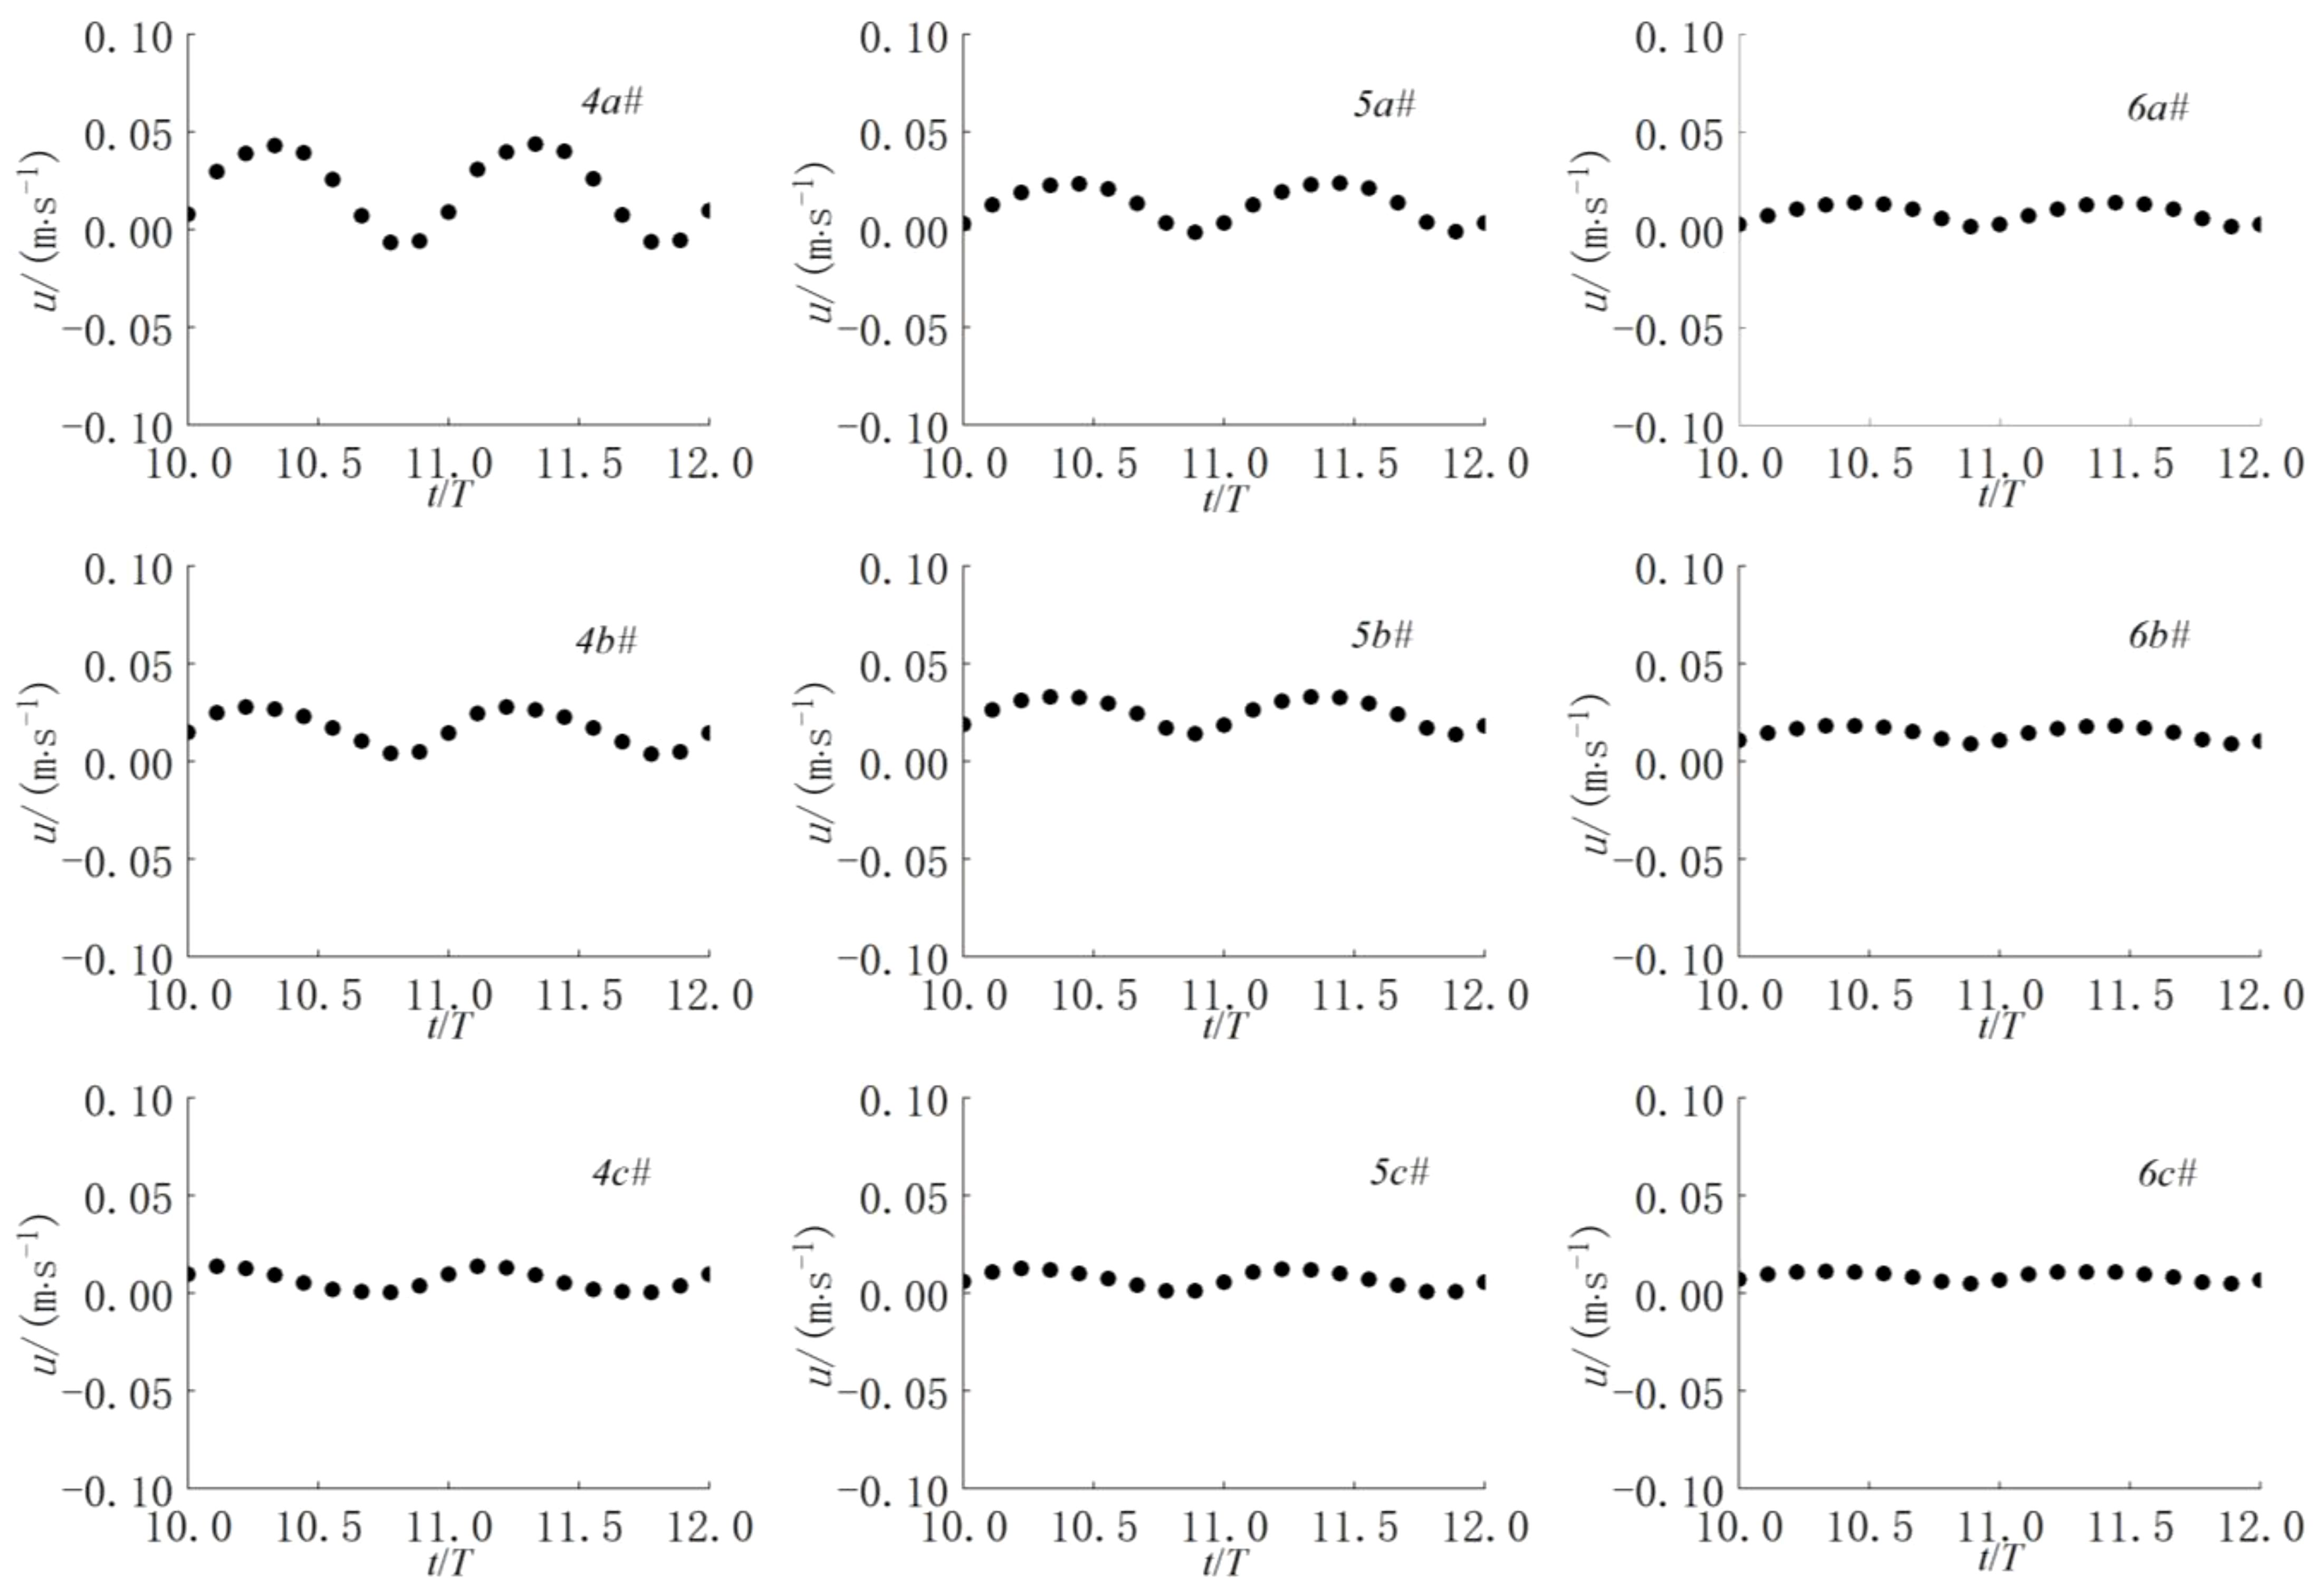
Figure 9 Velocity variation curve of the measuring points under operational condition when d=0.0 m.
Figure 10 illustrates the flow field characteristics when the wave crest reaches the top of the net cage under extreme conditions. The water depth (D) is 1.6 m, with a wave period (T) of 2.1 s and a wave height (H) of 0.36 m. The average flow velocity along the depth direction (U) is 0.364 m/s, and the submerged depths are d=0.0 m, d=0.2 m, d=0.4 m, d=0.6 m, and d=0.8 m. From Figure 10, it is evident that the net cage exhibits a damping effect on fluid velocity under the combined action of waves and currents, resulting in a reduction of the flow velocity inside the net cage. However, as a result of this damping effect, the fluid velocity under the net cage experiences a slight increase.
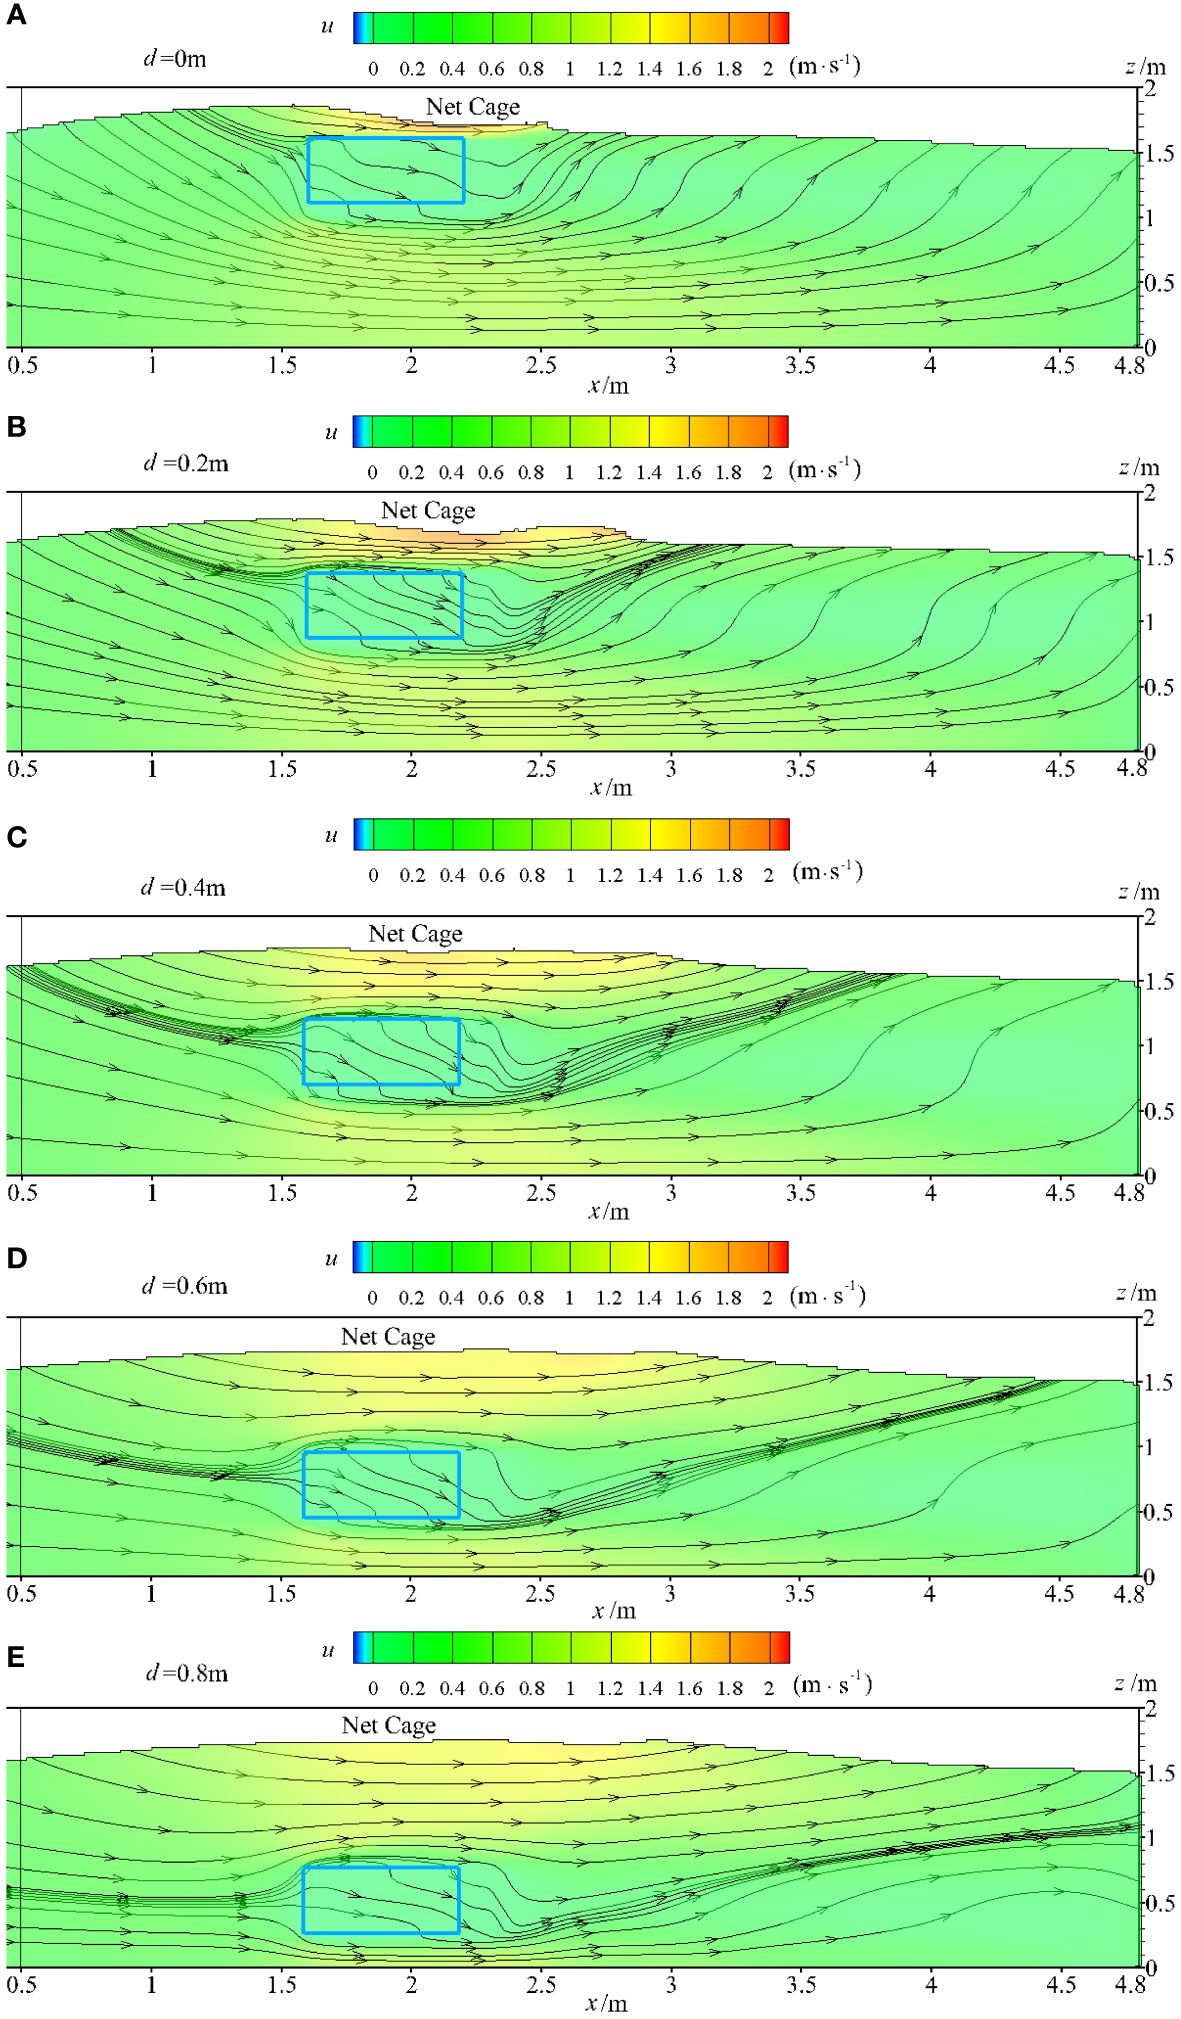
Figure 10 (A-E) Flow field characteristics when the wave crest reaches the top of the net cage under extreme conditions.
Figures 11–13 depict the time history variations of flow velocity for 27 measuring points under the combined action of waves and currents. Points (1a-1c#, 2a-2c#, 3a-3c#) are situated in front of the net cage, points (4a-4c#, 5a-5c#, 6a-6c#) are inside the net cage, and points (7a-7c#, 8a-8c#, 9a-9c#) are located at the rear of the net cage. Submerged depths of d=0.0 m, 0.2 m, 0.4 m, 0.6 m, and 0.8 m are examined. From Figure 11, it is evident that the flow velocity in front of the net cage decreases to some extent, the velocity curve experiences disturbance, and the velocity at the upper measuring point exhibits a secondary peak change. As depicted in Figure 12, at a submerged depth of d=0.0 m, the velocity fluctuation at each measuring point within the net cage is the most pronounced. Notably, the velocity peaks at the vertical midpoint of the net cage, with the greatest velocity variation observed in the first half of the net cage, while the velocity in the second half remains relatively stable. Conversely, at a submerged depth of d=0.8 m, the velocity fluctuation at each measuring point inside the net cage is minimal, and velocity changes across the structure are modest. Analysis of the velocity time history at each measuring point under various submerged depths reveals that velocity duration curves align most closely when the submerged depth is 0.4m, 0.6m, and 0.8m, indicating a consistent flow field distribution within the net cage. Figure 13 illustrates that the flow velocity diminishes to some extent behind the net cage, attributed to the flow-blocking effect of the structure. While the submerged depth of the net cage influences the velocity consistency at deep-water measuring points, those closer to the water surface exhibit significant nonlinearity, each demonstrating distinct characteristics.
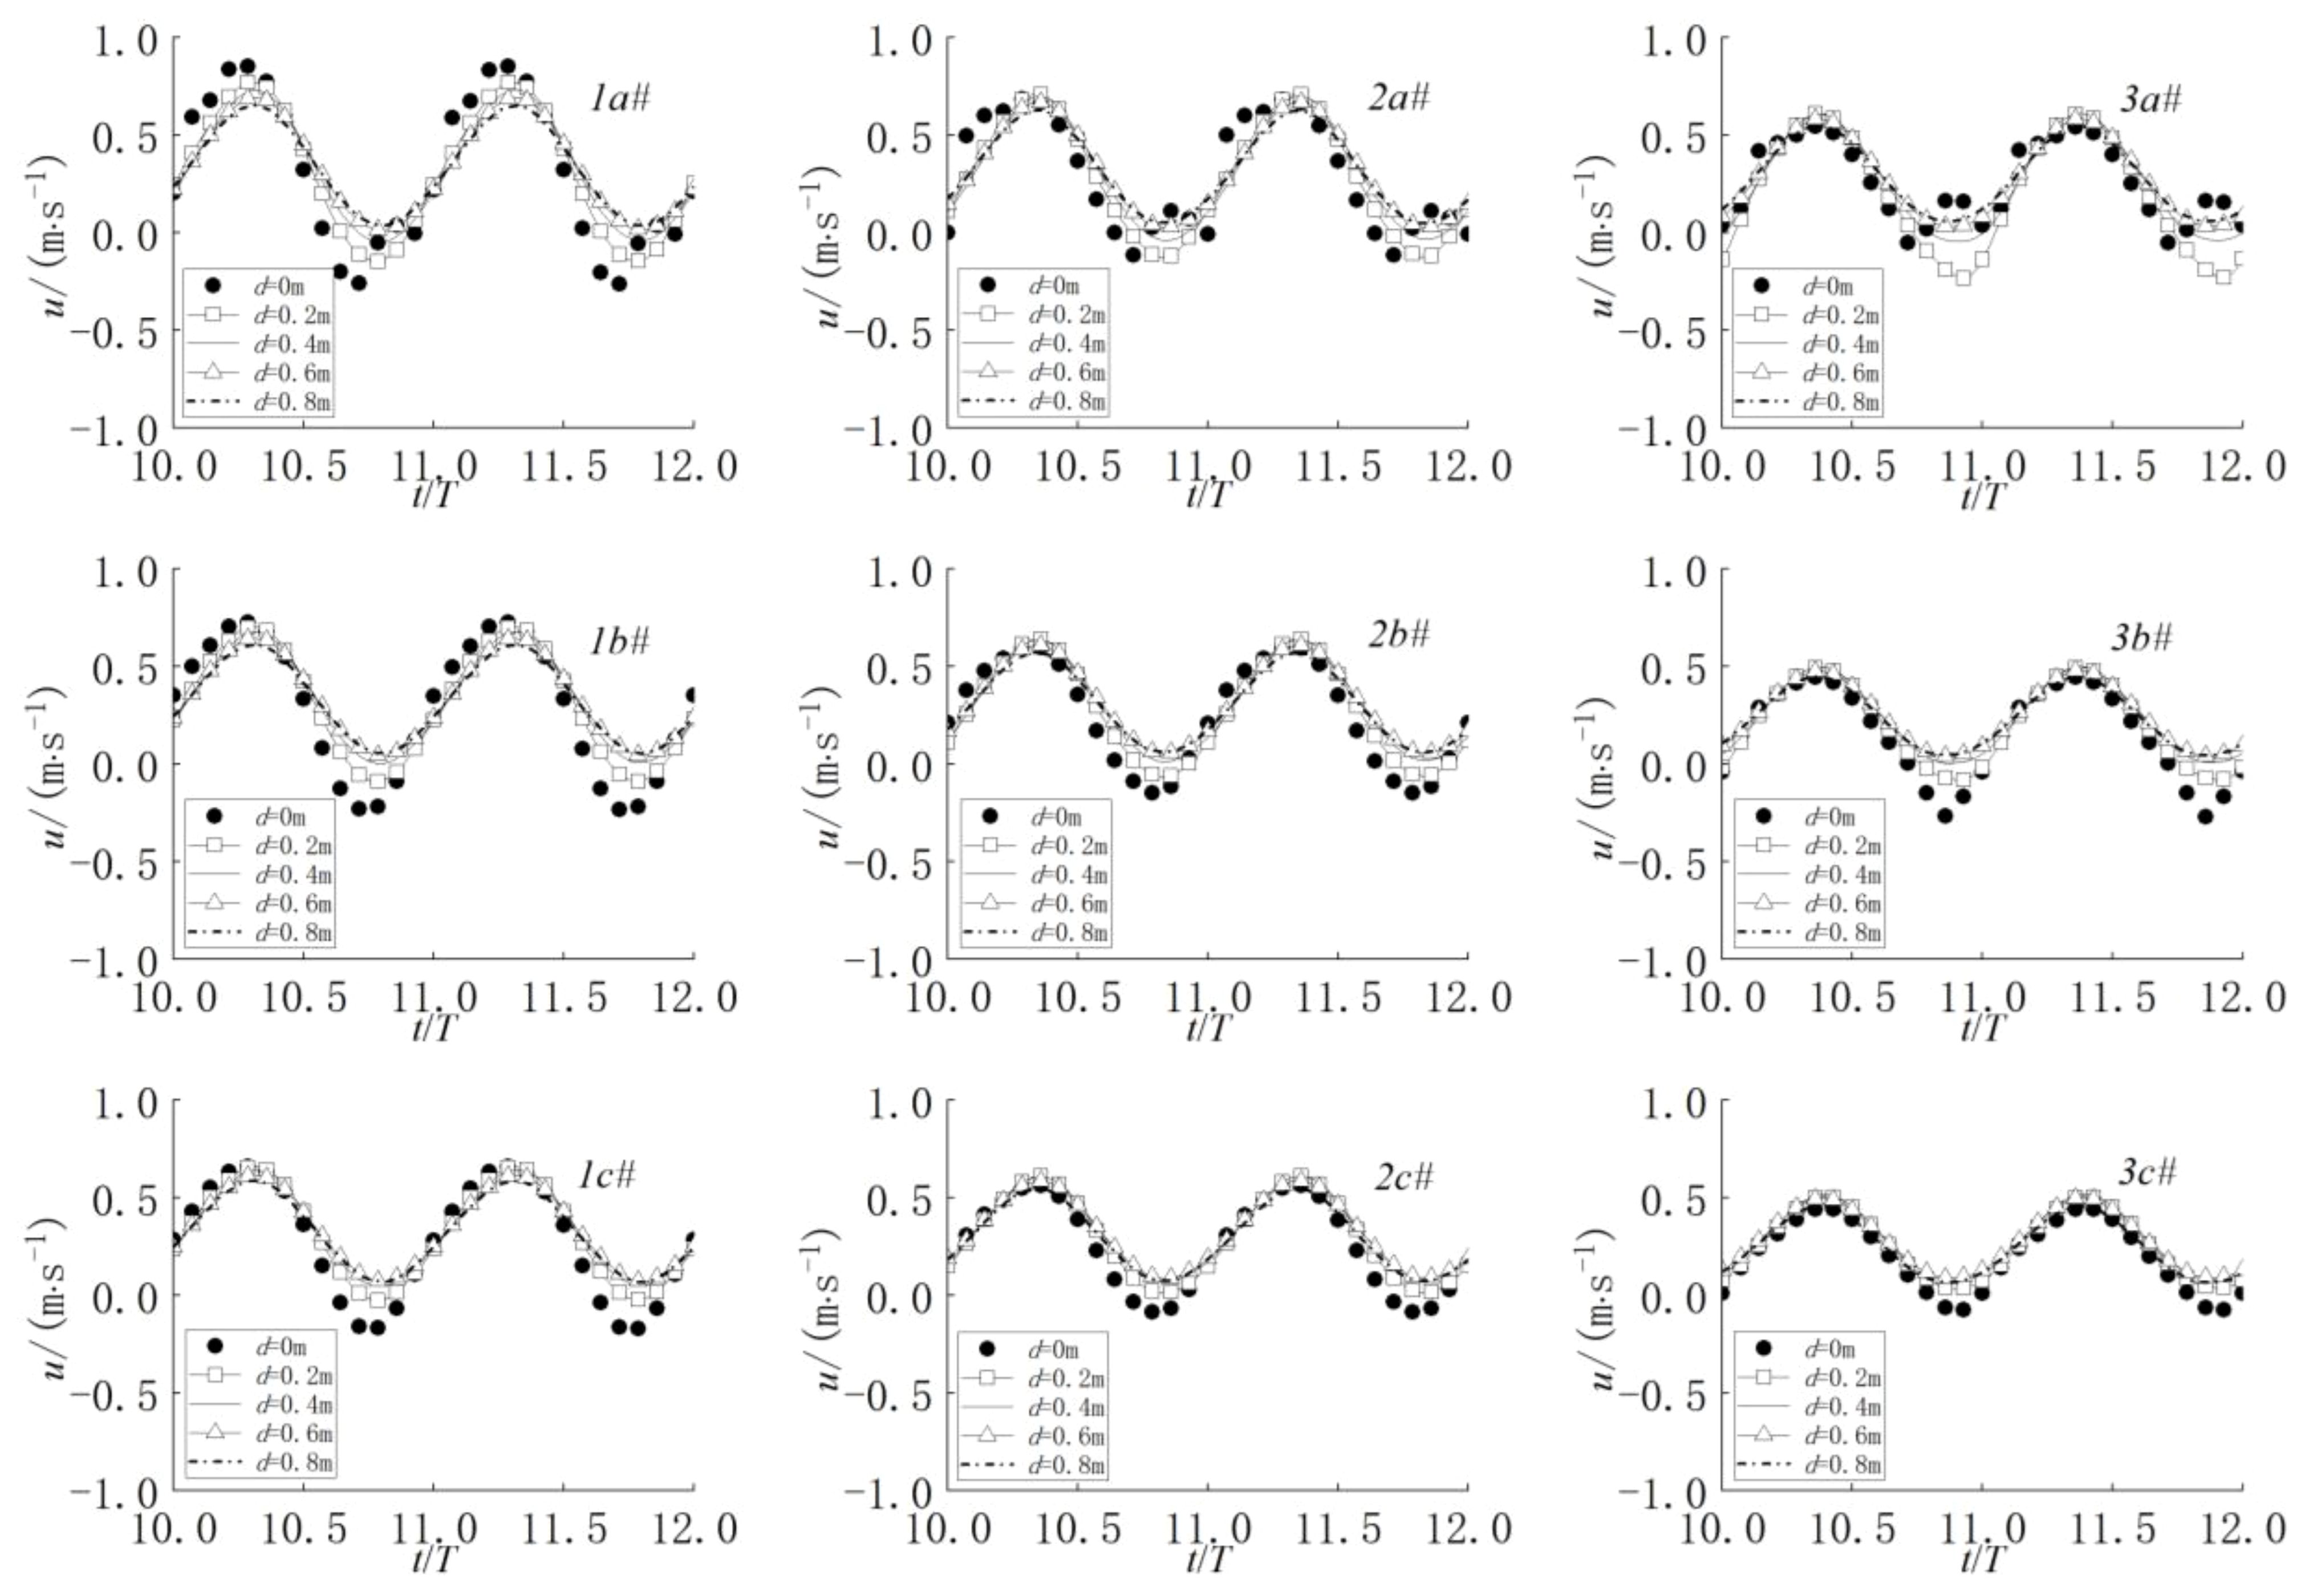
Figure 11 Time history variations of flow velocity for measuring points in front of the net cage.
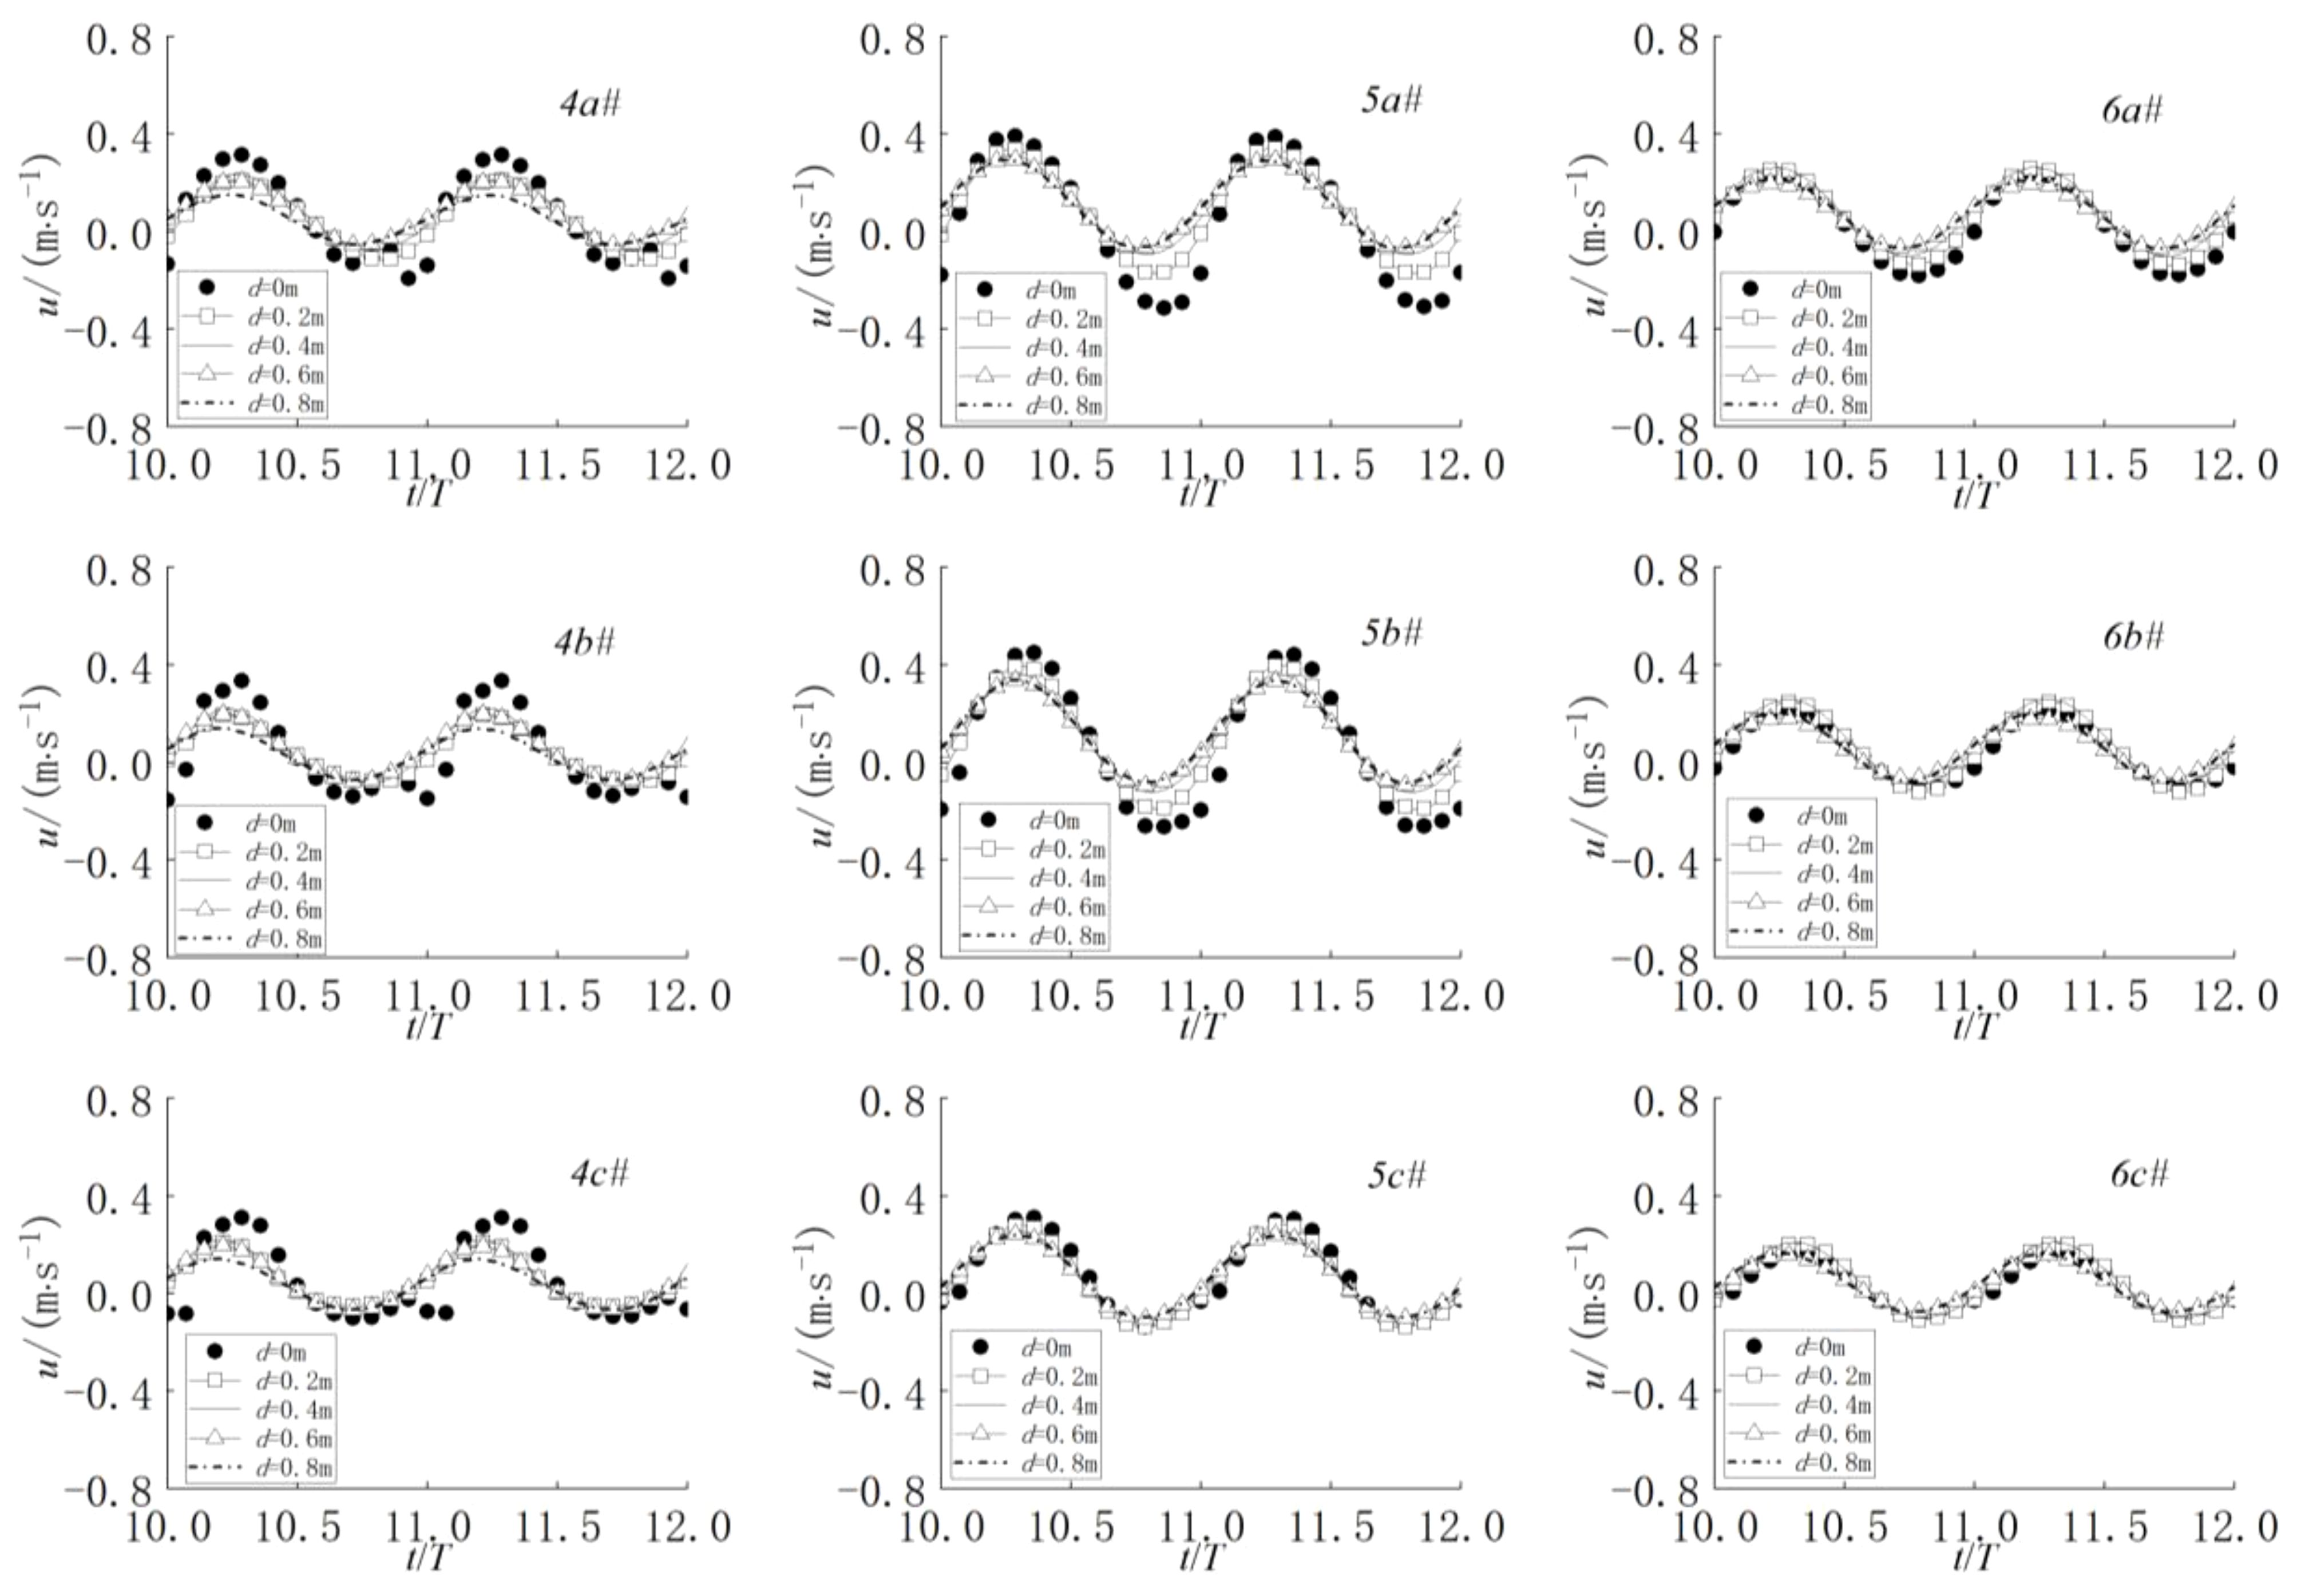
Figure 12 Time history variations of flow velocity for measuring points inside the net cage.
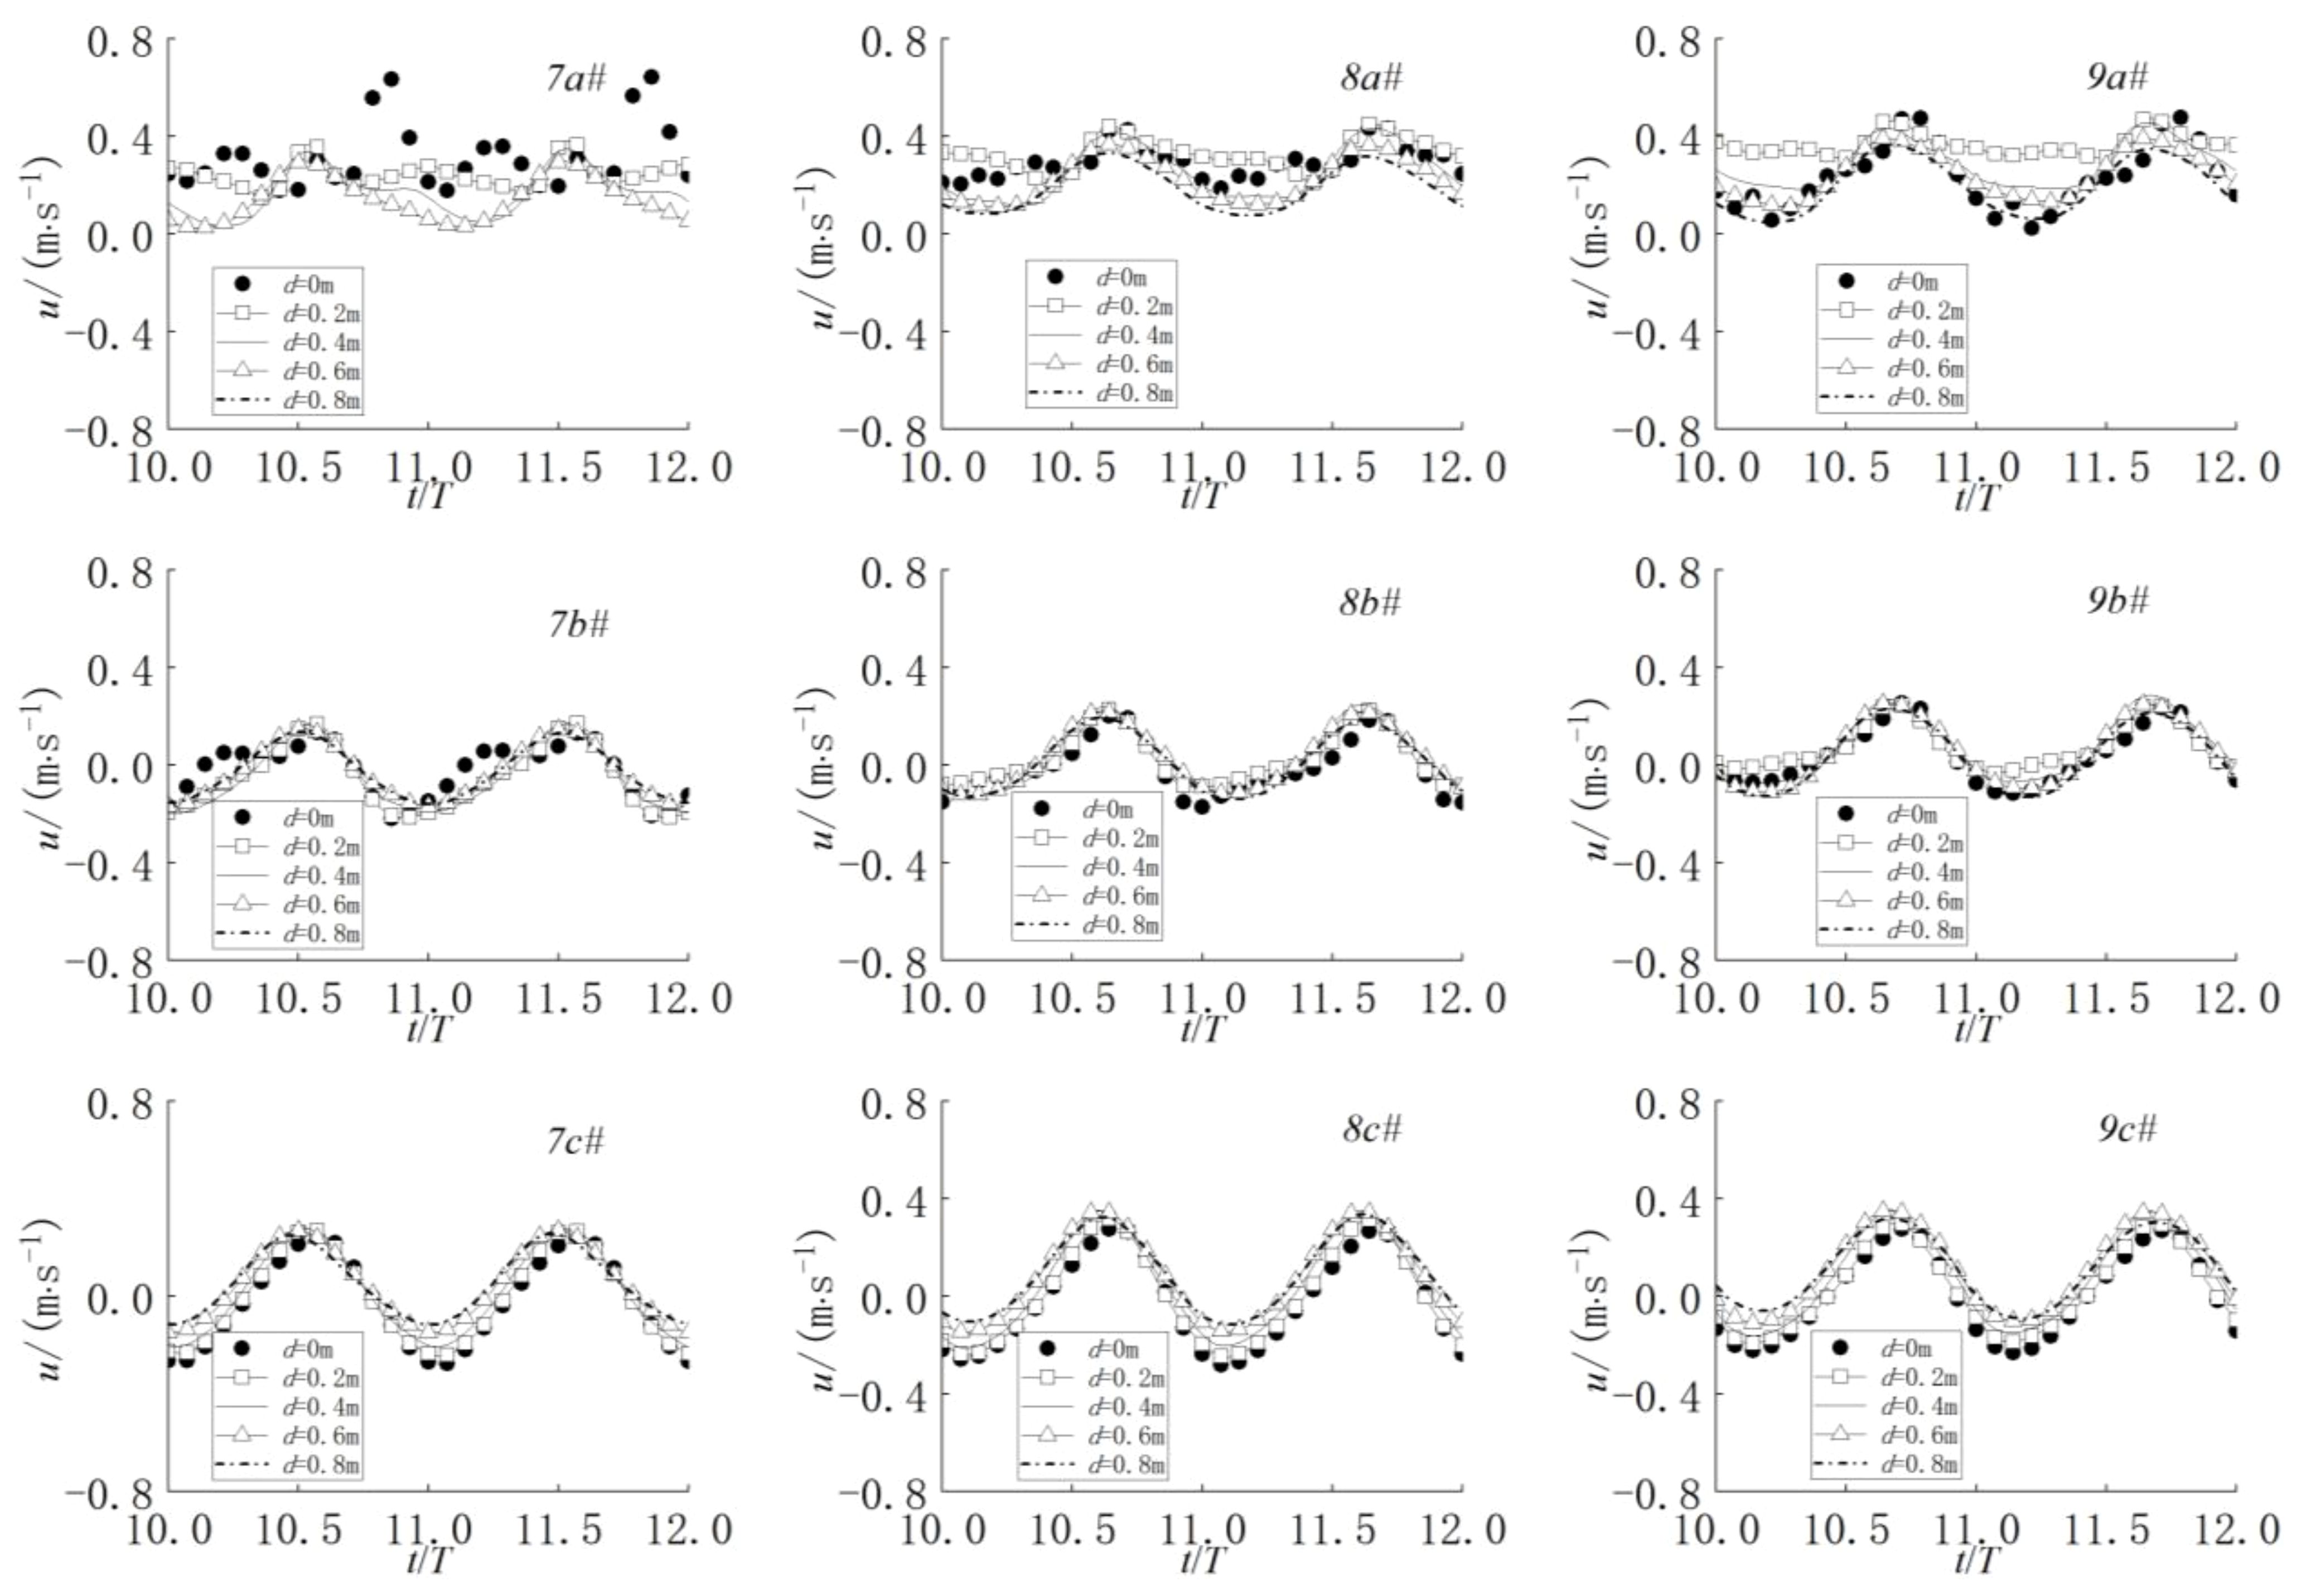
Figure 13 Time history variations of flow velocity for measuring points at the rear of the net cage.
In order to quantify the velocity fluctuation inside the net cage, a quantitative index is introduced to assess the flow field’s fluctuation within the net cage. It is defined as Equation 9:
Here, represents the maximum velocity of the front and back measuring points inside the net cage, while denotes the maximum velocity of the measuring point in the center of the net cage. Figure 14 displays the velocity fluctuation inside the net cage under varying submerged depths. From Figure 14, it is evident that the relative velocity of each measuring point inside the net cage reaches its minimum value when the submerged depth is d=0.4 m, indicating a relatively uniform flow field distribution within the net cage.
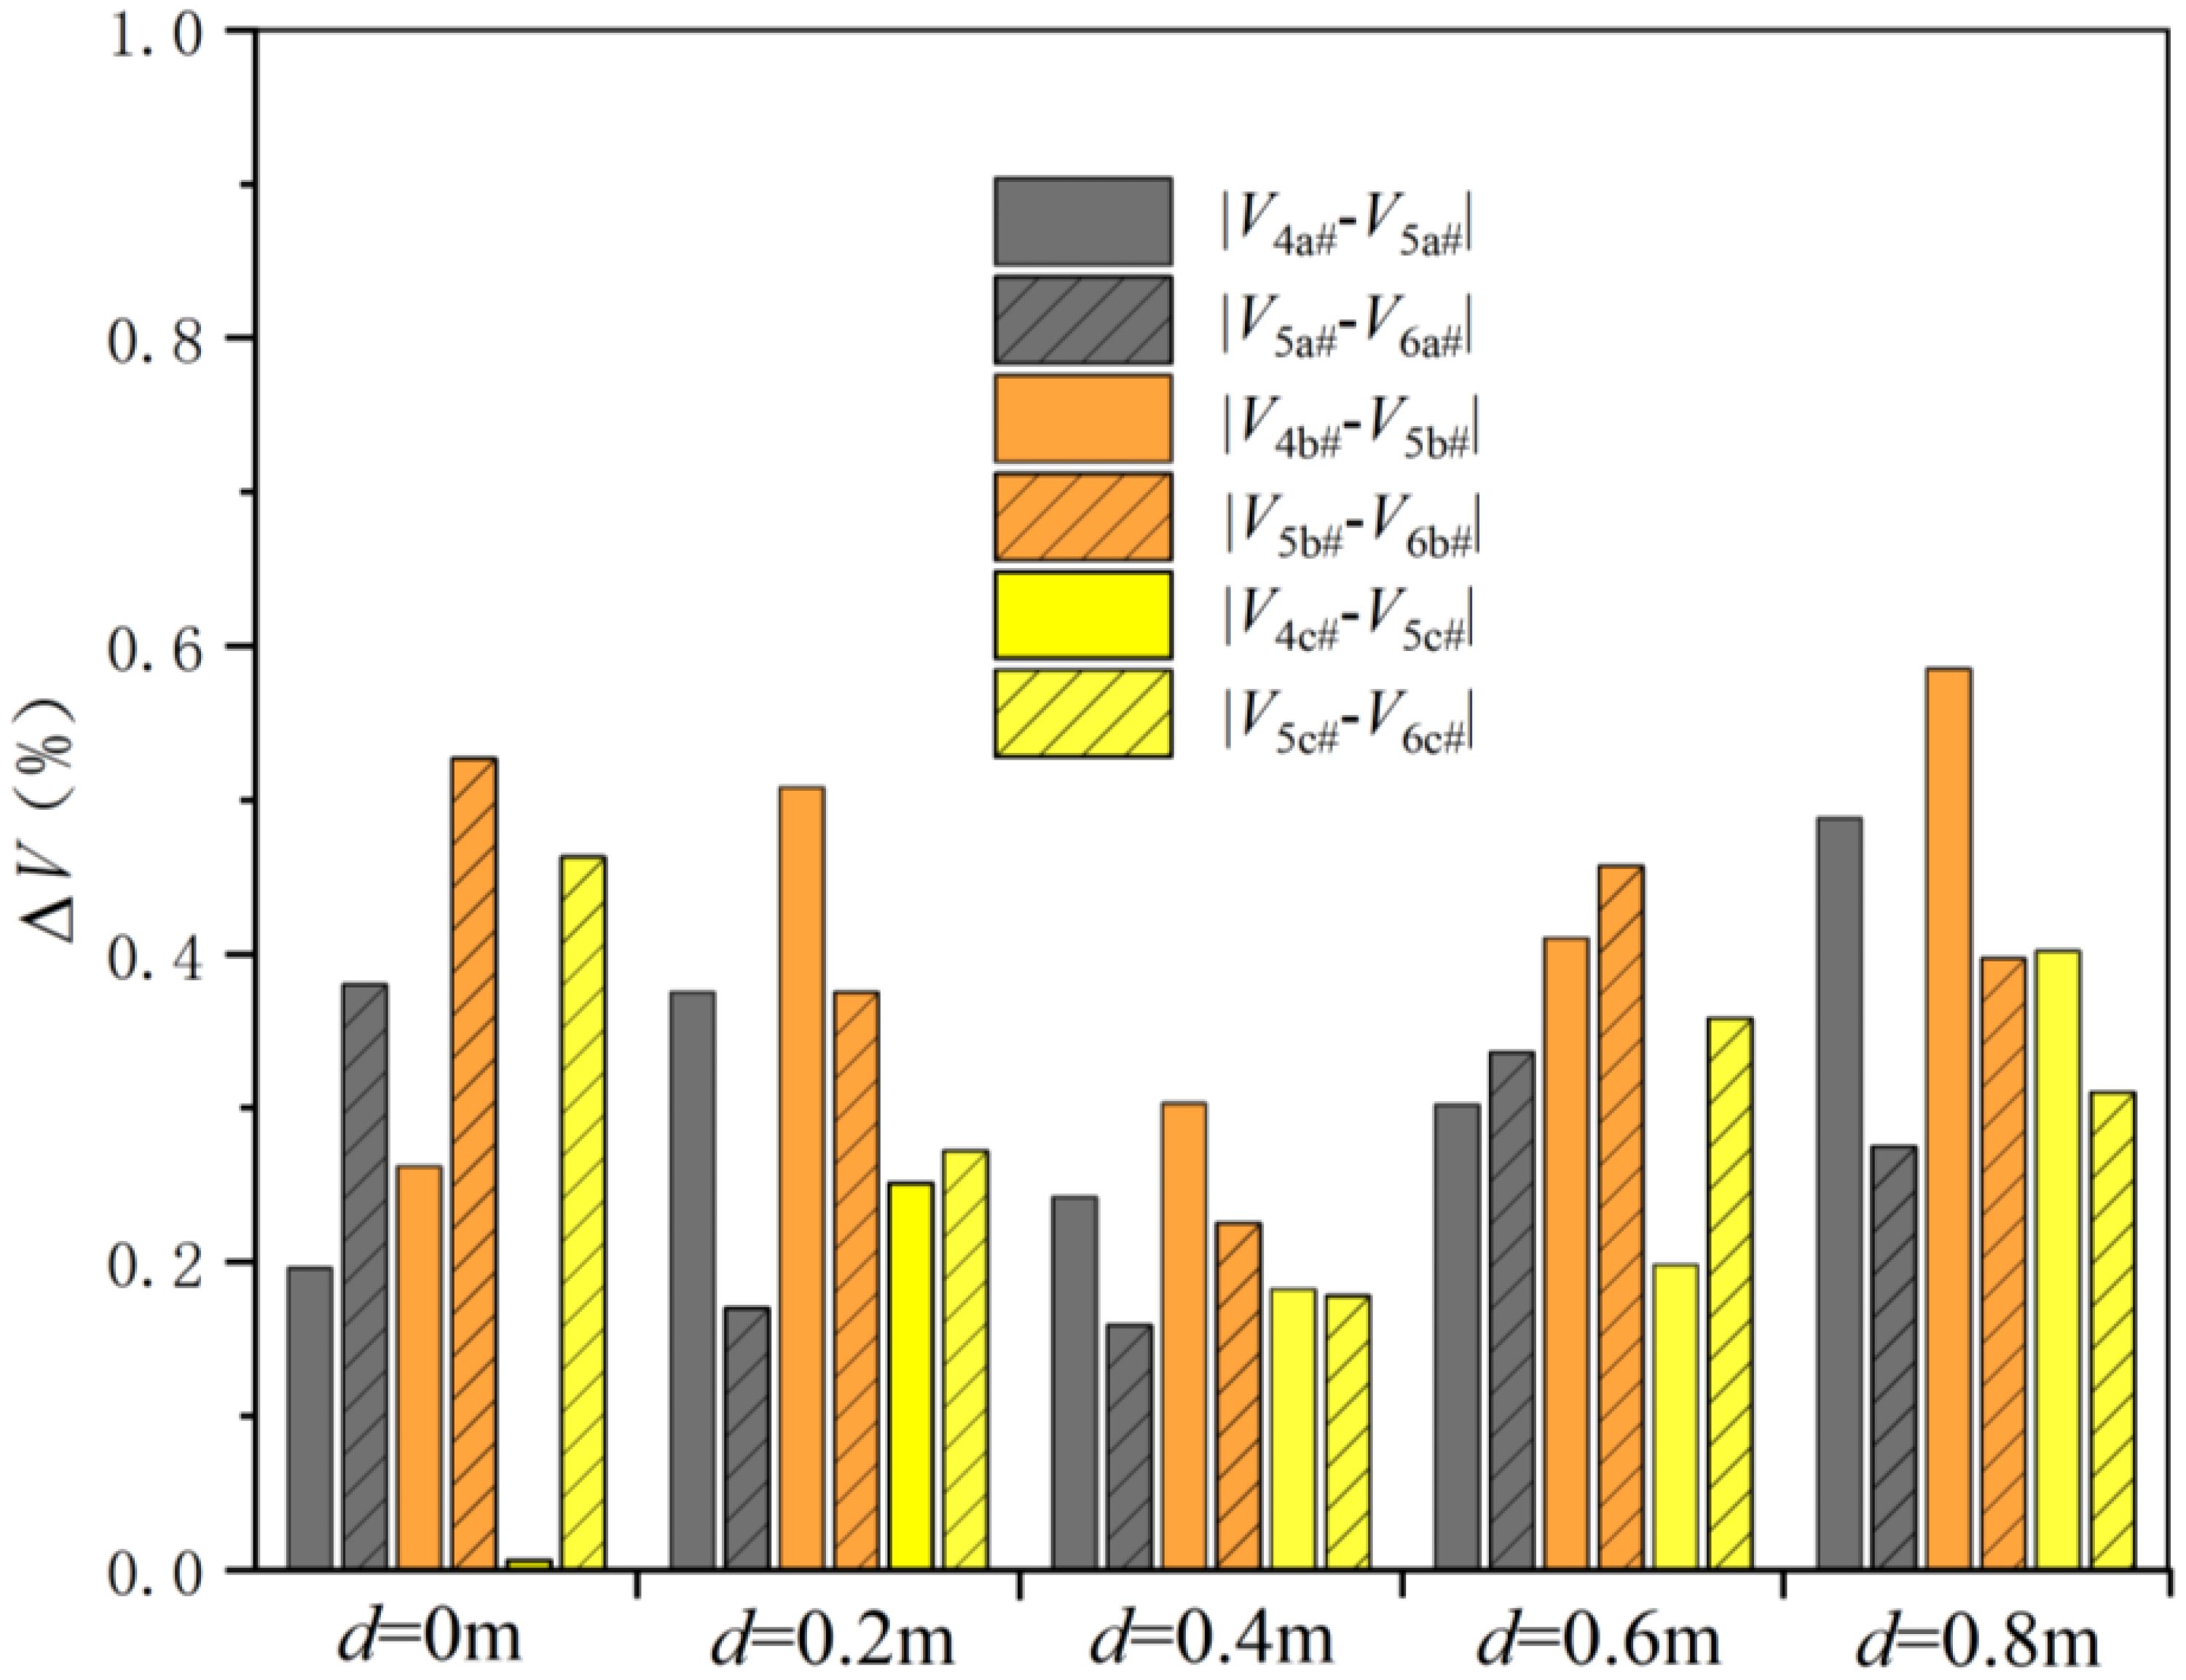
Figure 14 Velocity fluctuation inside the net cage under varying submerged depths.
During normal aquaculture cage operations, it is recommended to position the net cage near the water surface. However, during extreme conditions, adjusting the net cage’s depth becomes necessary to maintain the internal flow field characteristics similar to those under regular operating conditions, ensuring structural safety and an optimal fish habitat. Nevertheless, the submerged depth must also account for bottom contact and economic factors. Analysis of the calculation results reveals that successive reductions in the net cage’s submerged depth from 0m to 0.8m, under extreme working conditions, result in increasingly stable changes in the flow field inside the net cage. Notably, the velocity time series of measuring points are most closely aligned at submerged depths of 0.4m, 0.6m, and 0.8m. These findings indicate minimal influence on the flow field within the net cage within the range of 0.4m to 0.8m of submerged depth, resulting in overall stability. Specifically, the relative velocity between the front, middle, and back of the flow within the net cage reaches its minimum value at d=0.4m.
Figure 15 displays the time series of forces at the support location between the net cage and steel pipe piles under extreme conditions. Piles 1a and 1b denote the front piles, while Piles 2a and 2b denote the rear piles. As illustrated in Figure 15, the force exerted on the front pile of the net cage consistently exceeds that on the rear pile, with greater force exerted on the lower part of the pile compared to the upper part. Moreover, as the submerged depth of the net cage decreases, the force on the pile escalates, indicating a progressively significant contribution of the current to the force acting on the net cage.
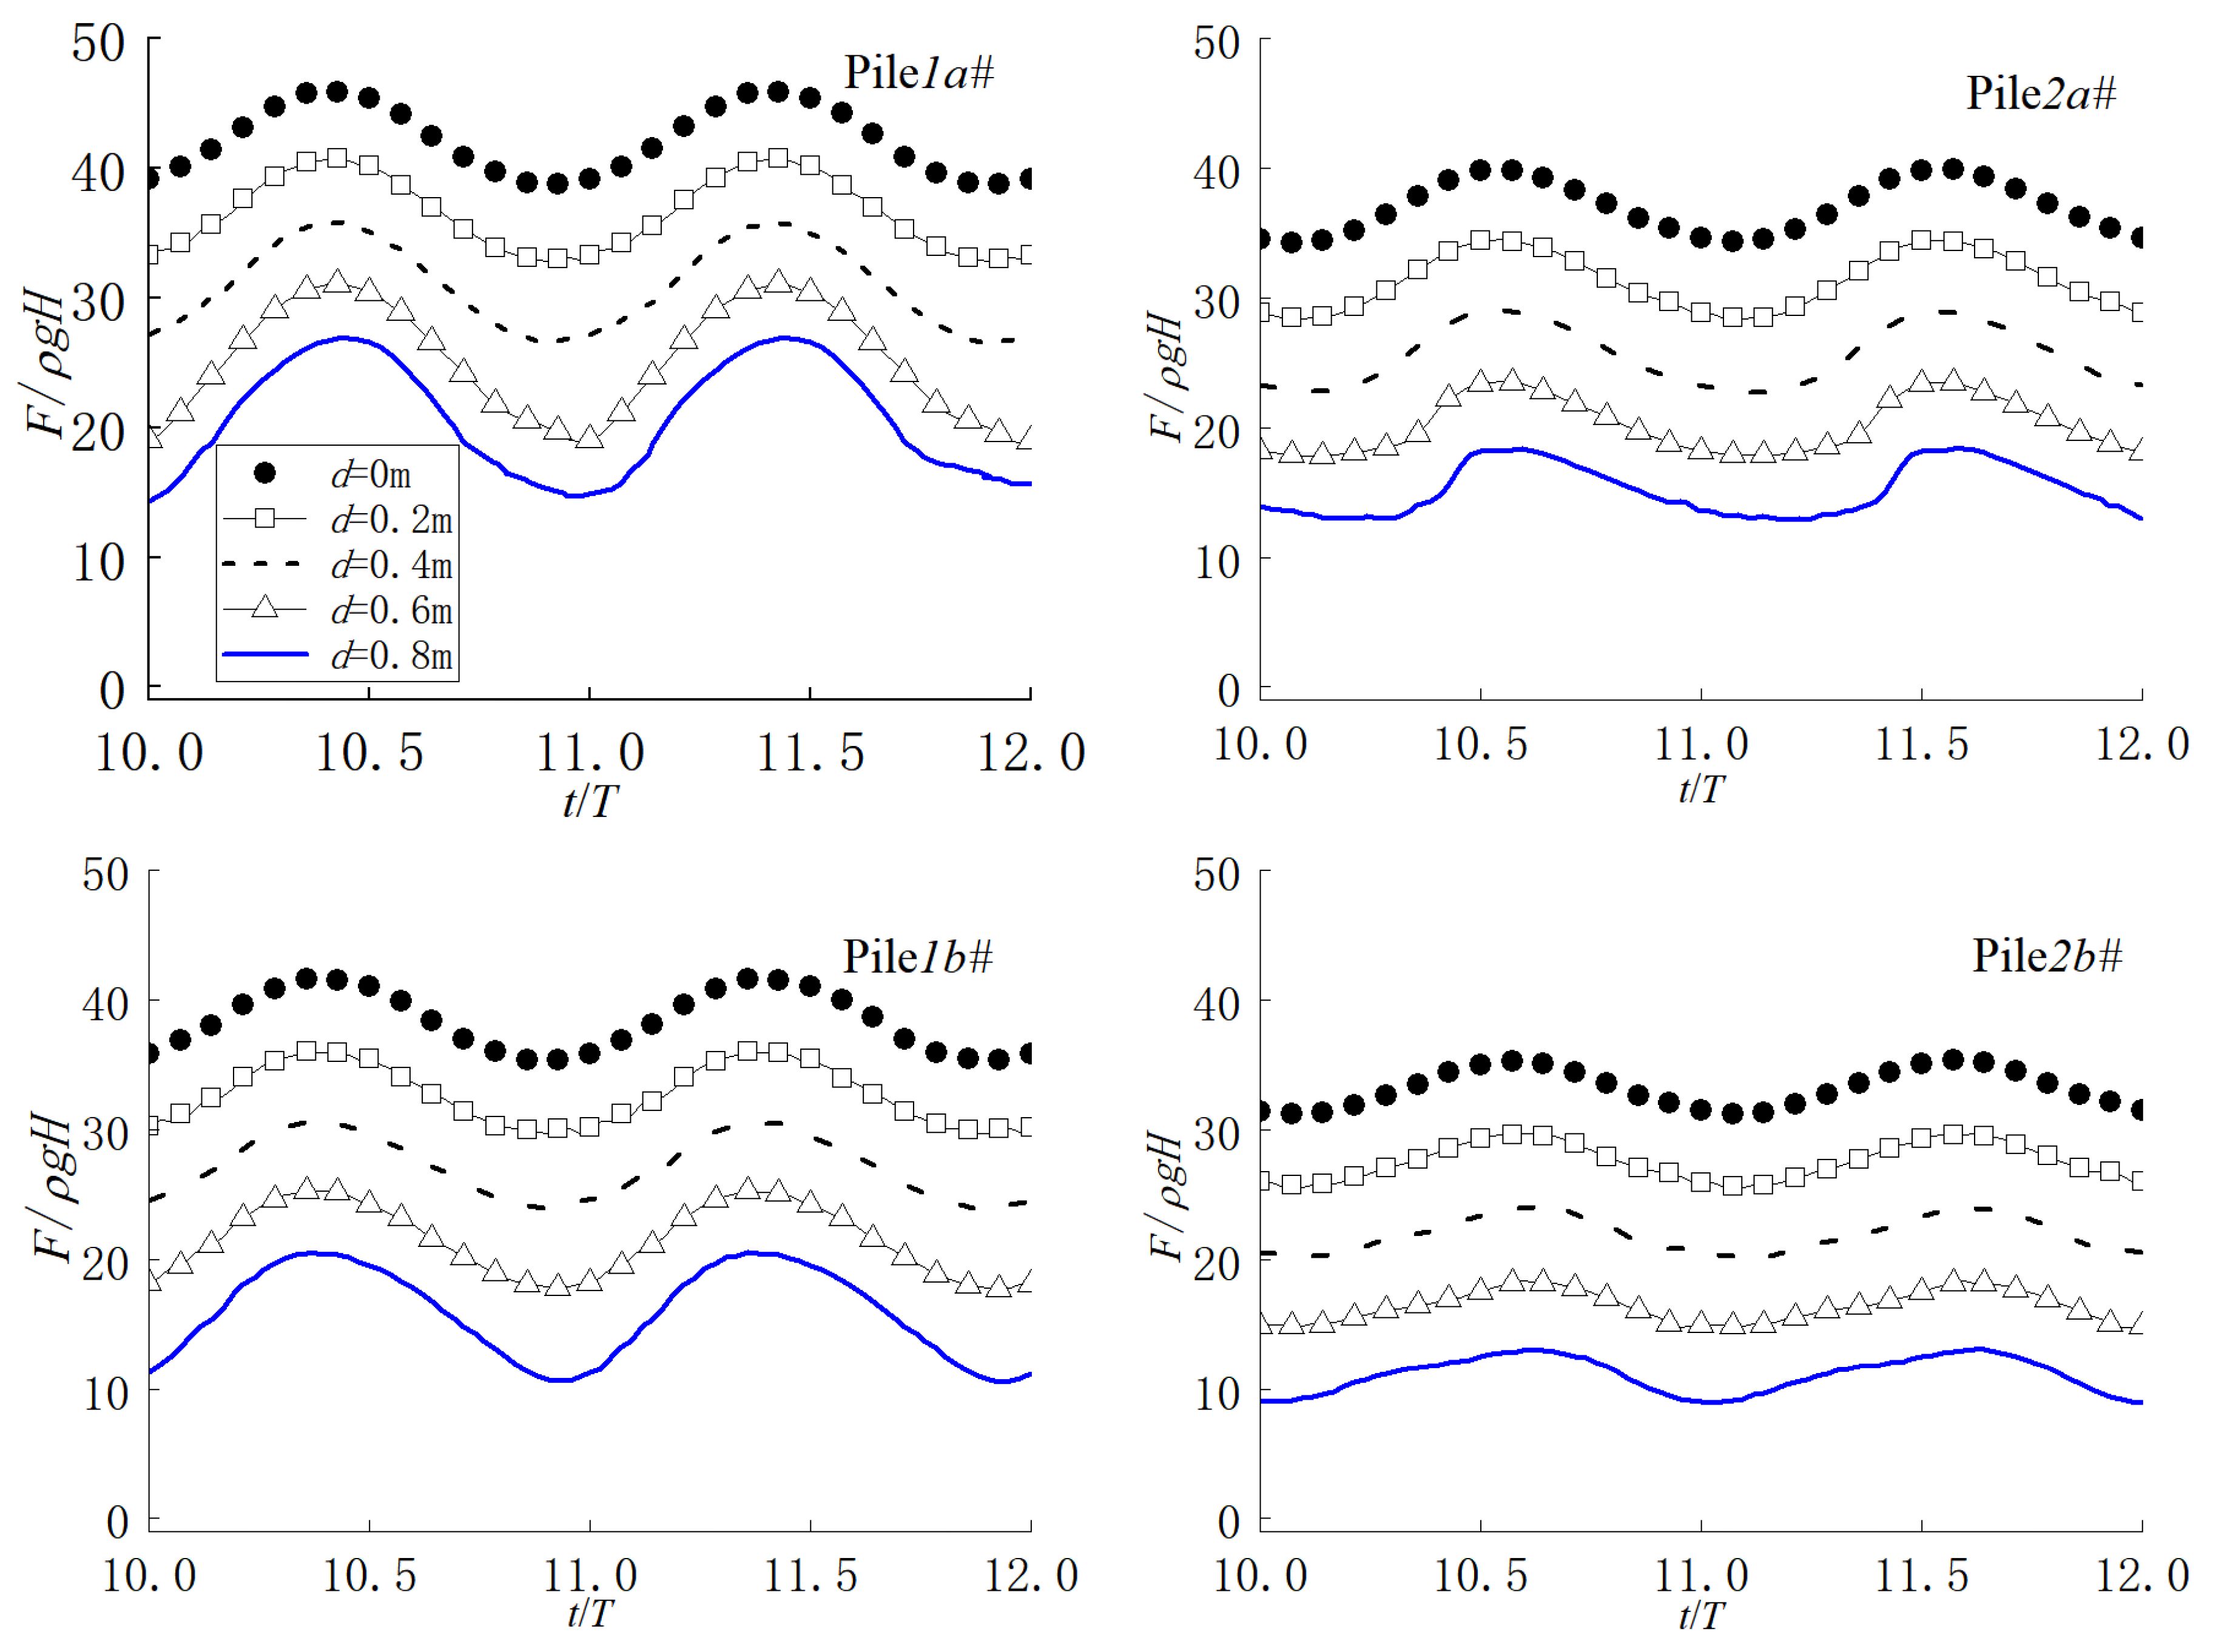
Figure 15 Time series of forces at the support location between the net cage and steel pipe piles under extreme conditions.
An integrated structure comprising an offshore steel pipe pile foundation and a submersible net cage is proposed in this study. The hydrodynamic performance of this composite structure under the combined action of waves and currents is evaluated using a three-dimensional numerical model implemented on the OpenFOAM platform. The research results indicate that the optimal submerged depth of the net cage, considering flow field stability, ranges from 1/4 to 1/2 of the water depth under extreme conditions. Within this range, the flow field distribution inside the net cage becomes more uniform, and the velocity variation remains relatively stable. Furthermore, the force exerted on the steel pipe piles decreases with the net cage’s submerged depth, with the maximum force occurring on the windward side steel pipe pile. These findings provide valuable insights for the design of net cages installed on steel pipe pile foundations.
The current study aims to numerically investigate the hydrodynamic characteristics of a lifting net cage installed on steel pipe piles. In our model, the net cage is represented by a porous structure. Consequently, the model does not account for the flexible deformation or the solidity ratio variations of the net cage. These limitations will be addressed in future research.
The raw data supporting the conclusions of this article will be made available by the authors, without undue reservation.
ZT: Conceptualization, Data curation, Funding acquisition, Investigation, Methodology, Software, Validation, Visualization, Writing – original draft. HY: Data curation, Software, Validation, Writing – original draft. HW: Funding acquisition, Supervision, Writing – review & editing, Formal analysis.
The author(s) declare financial support was received for the research, authorship, and/or publication of this article. This work received funding from the National Natural Science Foundation of China (No. 52101312), the Guangdong Basic and Applied Basic Research Foundation (No. 2023A1515012183, 2023A1515011000, 2022A1515240014), the Zhanjiang Ocean Youth Talent Project (No. 2021E05006), Guangdong Provincial Key Laboratory of Intelligent Equipment for South China Sea Marine Ranching(Grant NO. 2023B1212030003), the Zhanjiang Non-funded Science and Technology Project (No. 2023B01009), and the Program for Scientific Research Start-up Funds of Guangdong Ocean University (No. 060302072003).
The authors express gratitude to the reviewers for their valuable comments and suggestions.
The authors declare that the research was conducted in the absence of any commercial or financial relationships that could be construed as a potential conflict of interest.
All claims expressed in this article are solely those of the authors and do not necessarily represent those of their affiliated organizations, or those of the publisher, the editors and the reviewers. Any product that may be evaluated in this article, or claim that may be made by its manufacturer, is not guaranteed or endorsed by the publisher.
Beveridge M. C. M. (2004). Cage Aquaculture. 3rd edition (Oxford: Blackwell Publishing). doi: 10.1002/9780470995761
Bi C. W., Zhao Y. P., Dong G. H., Xu T. J., Gui F. K. (2013). Experimental investigation of the reduction in flow velocity downstream from a fishing net. Aquacultural Engineering. 57, 71–81. doi: 10.1016/j.aquaeng.2013.08.002
Cardia F., Lovatelli A. (2016). Aquaculture operations in floating HDPE cages: a field handbook. FAO Aquaculture Newslett. 54, 51.
Cha B. J., Kim H. Y., Bae J. H., Yang Y. S., Kim D. H. (2013). Analysis of the hydrodynamic characteristics of chain-link woven copper alloy nets for fish cages. Aquac. Eng. 56, 79–85. doi: 10.1016/j.aquaeng.2013.05.002
Chen H., Christensen E. (2015). “Numerical Simulation of wave interaction with moving net structures,” in ASME 2015 34th International Conference on Ocean, Offshore and Arctic Engineering (Newfoundland, Canada: Proceedings of the International Conference on Offshore Mechanics and Arctic Engineering). doi: 10.1115/OMAE2015-41598
Chen H., Christensen E. D. (2016). Investigations on the porous resistance coefficients for fishing net structures. J. Fluids Structures. 65, 76–107. doi: 10.1016/j.jfluidstructs.2016.05.005
Chen H. Z., Zhao Y. S., Mei L. L., Gui F. K. (2024). Laboratory observation of nonlinear wave shapes due to spatial varying opposing currents. Coast. Eng. 190, 104500. doi: 10.1016/j.coastaleng.2024.104500
Cornejo P., Sepúlveda H. H., Gutiérrez M. H., Olivares G. (2014). Numerical studies on the hydrodynamic effects of a salmon farm in an idealized environment. Aquaculture 430, 195–206. doi: 10.1016/j.aquaculture.2014.04.015
Dan W., Malm T., Hman M. C. (2006). The influence of offshore windpower on demersal fish. ICES J. Mar. Science. 63, 775–784. doi: 10.1016/j.icesjms.2006.02.001
DeCew J., Tsukrov I., Risso A., Swift M. R., Celikkol B. (2010). Modeling of dynamic behavior of a single-point moored submersible fish cage under currents. Aquacultural Eng. 43, 38–45. doi: 10.1016/j.aquaeng.2010.05.002
Ferreira J. G., Saurel C., Lencart E., Nunes J. P., Vazquez F. (2014). Modelling of interactions between inshore and offshore aquaculture. Aquaculture 426-427, 154–164. doi: 10.1016/j.aquaculture.2014.01.030
Gowen R. J. (1990). The interaction between physical and biological processes in coastal and offshore fish farming: an overview (Telford, London: Engineering for Offshore Fish Farming, Institution of Civil Engineering), 37–47.
Hao E., Liu C. (2017). Evaluation and comparison of anti-impact performance to offshore wind turbine foundations: monopile, tripod, and jacket. Ocean Eng. 130, 218–227. doi: 10.1016/j.oceaneng.2016.12.008
He W. (2015). Jacket-cage: dual-use the jacket foundation of offshore wind turbine for aquaculture farming. Wind Eng. 39, 311–320. doi: 10.1260/0309-524X.39.3.311
Huang B., Guan C. T., Cui Y., Zhou Y. (2013). Study on anti-overturn device and technology of square submersible cages sinking process. Eng. Mechanics. 30, 313–320. doi: 10.6052/j.issn.1000-4750.2012.02.0069
Jensen B., Jacobsen N. G., Christensen E. D. (2014). Investigations on the porous media equations and resistance coefficients for coastal structures. Coast. Eng. 84, 56–72. doi: 10.1016/j.coastaleng.2013.11.004
Johansson D., Laursen F., Fernö A., Fosseidengen J. E., Klebert P., Stien L. H., et al. (2014). The interaction between water currents and salmon swimming behaviour in sea cages. PLoS One 9, e97635. doi: 10.1371/journal.pone.0097635
Kapetsky J., Aguilar-Manjarrez J., Jenness J. (2013). “A global assessment of offshore mariculture potential from a spatial perspective,” in FAO Fisheries and Aquaculture Technical Paper No. 549 (Rome: 34th Asian Conference on Remote Sensing 2013, ACRS 2013) v 4, p 3388-3395.
Kim T., Lee J., Fredriksson D. W., Decew J., Drach A., Moon K. (2014). Engineering analysis of a submersible abalone aquaculture cage system for deployment in exposed marine environments. Aquacultural Engineering. 63, 72–88. doi: 10.1016/j.aquaeng.2014.10.006
Kim T. H., Yang K. U., Hwang K. S., Jang D. J., Hur G. J. (2011). Automatic submerging and surfacing performances of model submersible fish cage system operated by air control. Aquacultural Eng. 45, 74–86. doi: 10.1016/j.aquaeng.2011.07.003
Klebert P., Su B. (2020). Turbulence and flow field alterations inside a fish sea cage and its wake. Appl. Ocean Res. 98, 102113. doi: 10.1016/j.apor.2020.102113
Lader P. l., Jensen A., Sveen J. K., Fredheim A., Enerhaug B., Fredriksson D. (2007a). Experimental investigation of wave forces on net structures. Appl. Ocean Res. 29, 112–127. doi: 10.1016/j.apor.2007.10.003
Lader P. L. F., Olsen A., Jensen A., Sveen J. K., Fredheim A., Enerhaug B. (2007b). Experimental investigation of the interaction between waves and net structures-damping mechanism. Aquacult. Eng. 37, 100–114. doi: 10.1016/j.aquaeng.2007.03.001
Lee C. W., Kim Y. B., Lee G. H., Choe M. Y., Koo K. Y. (2008). Dynamic simulation of a fish cage system subjected to currents and waves. Ocean Eng. 35, 1521–1532. doi: 10.1016/j.oceaneng.2008.06.009
Liang J. M., Pang L., Dong S. (2021). Research on hydrodynamic analysis and mooring method of a new net cage floating collar system. Periodical Ocean Univ. China. 51, 119–126. doi: 10.16441/j.cnki.hdxb.20180271
Pablo H., Javier L. L., Inigo J. L. (2013). Realistic wave generation and active wave absorption for Navier-Stokes models Application to OpenFOAM®. Coast. Eng. 71, 102–118. doi: 10.1016/j.coastaleng.2012.07.002
Patursson O. (2008). Flow through and around fish farming nets (Ph. D. thesis) (New Hampshire: University of New Hampshire).
Patursson Ø., Swift M. R., Tsukrov I., Simonsen K., Baldwin K., Fredriksson D. W., et al. (2010). Development of a porous media model with application to flow through and around a plane net. Ocean Eng. 37, 314–324. doi: 10.1016/j.oceaneng.2009.10.001
Shi X. H., Zhou Y., Qian J. Q., Yu Z. Q. (2021). Research on numerical simulation method of mesh group of cage net based on hydrodynamic performance. Fishery modernization. 48, 74–79. doi: 10.3969/j.issn.1007-9580.2021.03.010
Shim K., Klebert P., Fredheim A. (2009). “Numerical investigation of the flow through and around a net cage,” in ASME 2009 28th International Conference on Ocean, Offshore and Arctic Engineering. (Honolulu, Hawaii, USA: Proceedings of the ASME 2009 28th International Conference on Ocean, Offshore and Arctic Engineering). doi: 10.1115/OMAE2009-79960
Van Gent M. R. A. (1995). Wave Interaction with Permeable Coastal Structures (Delft, the Netherlands: Delft University).
Wahlberg M., Westerberg H. (2005). Hearing in fish and their reactions to sounds from offshore wind farms. Mar. Ecol. Progress. 288, 295–309. doi: 10.3354/meps288295
Wu C. W., Zhu A. Y., Shen J. L. (2007). Experiment on validating the capability of HDPE offshore cage to go against wind, wave and current in the sea. Ocean Engineering. 25, 84–90.
Xu Z. M., Lin Z. H., Xie B. (2022). Research on uni-directional coupling method for flexible nets and flow field based on truss model and porous media model. ocean engineering. 40, 51–61. doi: 10.16483/j.issn.1005-9865.2022.06.006
Zhao Y. P., Bi C. W., Dong G. H., Gui F. K., Cui Y., Guan C. T., et al. (2013a). Numerical simulation of the flow around fishing plane nets using the porous media model. Ocean Eng. 62, 25–37. doi: 10.1016/j.oceaneng.2013.01.009
Zhao Y. P., Bi C. W., Dong G. H., Gui F. K., Cui Y., Xu T. J. (2013b). Numerical simulation of the flow field inside and around gravity cages. Aquacult. Eng. 52, 1–13. doi: 10.1016/j.aquaeng.2012.06.001
Zhao Y. P., Bi C. W., Dong G. H., Li Y. C. (2011). Three dimensional numerical simulation of the now field around fishing net panel. Chin. J. hydrodynamics. 26, 606–613. doi: 10.3969/j.issn1000-4874.2011.05.012
Zhao Y. P., Gui F. K., Xu T. J., Chen X. F., Cui Y. (2013). Numerical analysis of dynamic behavior of a box-shaped net cage in pure waves and current. Appl. Ocean Res. 39, 158–167. doi: 10.1016/j.apor.2012.12.002
Keywords: offshore platform, submersible net cage, submerged depth, OpenFOAM, porous structure
Citation: Tian Z, Yang H and Wen H (2024) Hydrodynamic performance of a submersible net cage integrated with an offshore platform. Front. Mar. Sci. 11:1436992. doi: 10.3389/fmars.2024.1436992
Received: 23 May 2024; Accepted: 08 July 2024;
Published: 24 July 2024.
Edited by:
Fukun Gui, Zhejiang Ocean University, ChinaReviewed by:
Gancheng Zhu, Ningbo University, ChinaCopyright © 2024 Tian, Yang and Wen. This is an open-access article distributed under the terms of the Creative Commons Attribution License (CC BY). The use, distribution or reproduction in other forums is permitted, provided the original author(s) and the copyright owner(s) are credited and that the original publication in this journal is cited, in accordance with accepted academic practice. No use, distribution or reproduction is permitted which does not comply with these terms.
*Correspondence: Hongjie Wen, d2VuaG9uZ2ppZUBzY3V0LmVkdS5jbg==
Disclaimer: All claims expressed in this article are solely those of the authors and do not necessarily represent those of their affiliated organizations, or those of the publisher, the editors and the reviewers. Any product that may be evaluated in this article or claim that may be made by its manufacturer is not guaranteed or endorsed by the publisher.
Research integrity at Frontiers
Learn more about the work of our research integrity team to safeguard the quality of each article we publish.