 Yan Peng
 Debin Du1,2*
- 1Institute for Global Innovation and Development, East China Normal University, Shanghai, China
- 2School of Geographic Sciences, East China Normal University, Shanghai, China
The white paper on China’s Arctic Policy, which proposed the joint construction of the Polar Silk Road (PSR), was officially published in January 2018. As a short and economically feasible sea route, the PSR will inevitably affect the carrier’s market choice behaviour, thereby affecting the foreland network structure and foreland pattern of China’s coastal container ports (CCCP). Grasping the evolution trend of CCCP foreland under the PSR will help predict the development trend of the port and shipping market in advance and enable measures to be taken to adapt to the changing market environment. This paper constructs the port foreland network evolution (PFNE) model and presents a complex network delineation method of port foreland to simulate the effects of PSR on CCCP foreland evolution in different scenarios. Results show that the PSR’s addition to the CCCP foreland network will improve shipping connectivity, increase the connection between long-distance ports, reshape the clustering groups, promote the orderliness of the network and help the development of small and medium-sized ports. China’s global maritime transport pattern will change, which is mainly reflected in the enhanced shipping links between CCCP and Asia, Europe and Africa, while the importance of the Americas for CCCP weaken. PSR has a more obvious role in promoting the establishment of maritime links between China’s northern ports and the world ports. In the discussion, we propose the development policy of CCCP under the PSR.
1 Introduction
The foreland can be regarded as the mirror of the hinterland, that is, the area (port and overseas market) where the port is connected by shipping (Weigend, 1958; Zohil and Prijon, 1999; Rodrigue, 2010; Jafari and Khosheghbal, 2013) (Figure 1). According to the connotation, foreland is related to the foreland network, in which the number of sea routes connected with the port node or the freight volume on each sea route will affect the vastness of the port foreland (Wang and Zhang, 2014). It can be considered that the evolution of port foreland is directly related to the foreland network. Containerisation in maritime transportation has promoted the strong and direct integration of port supply chains; increasing attention has been paid to the maritime spatial connection beyond the port back to the inland. The importance of the port foreland has become increasingly prominent. Foreland-based regionalisation can support export-oriented strategies with better connectivity of more marginal (or in their early stage of growth) ports to global shipping networks (Rodrigue and Notteboom, 2010). Improved foreland port connectivity helps reduce maritime transport costs, enable the integration of regional economies into the international transport network and facilitate bilateral trade (Martínez-Moya and Feo-Valero, 2020).
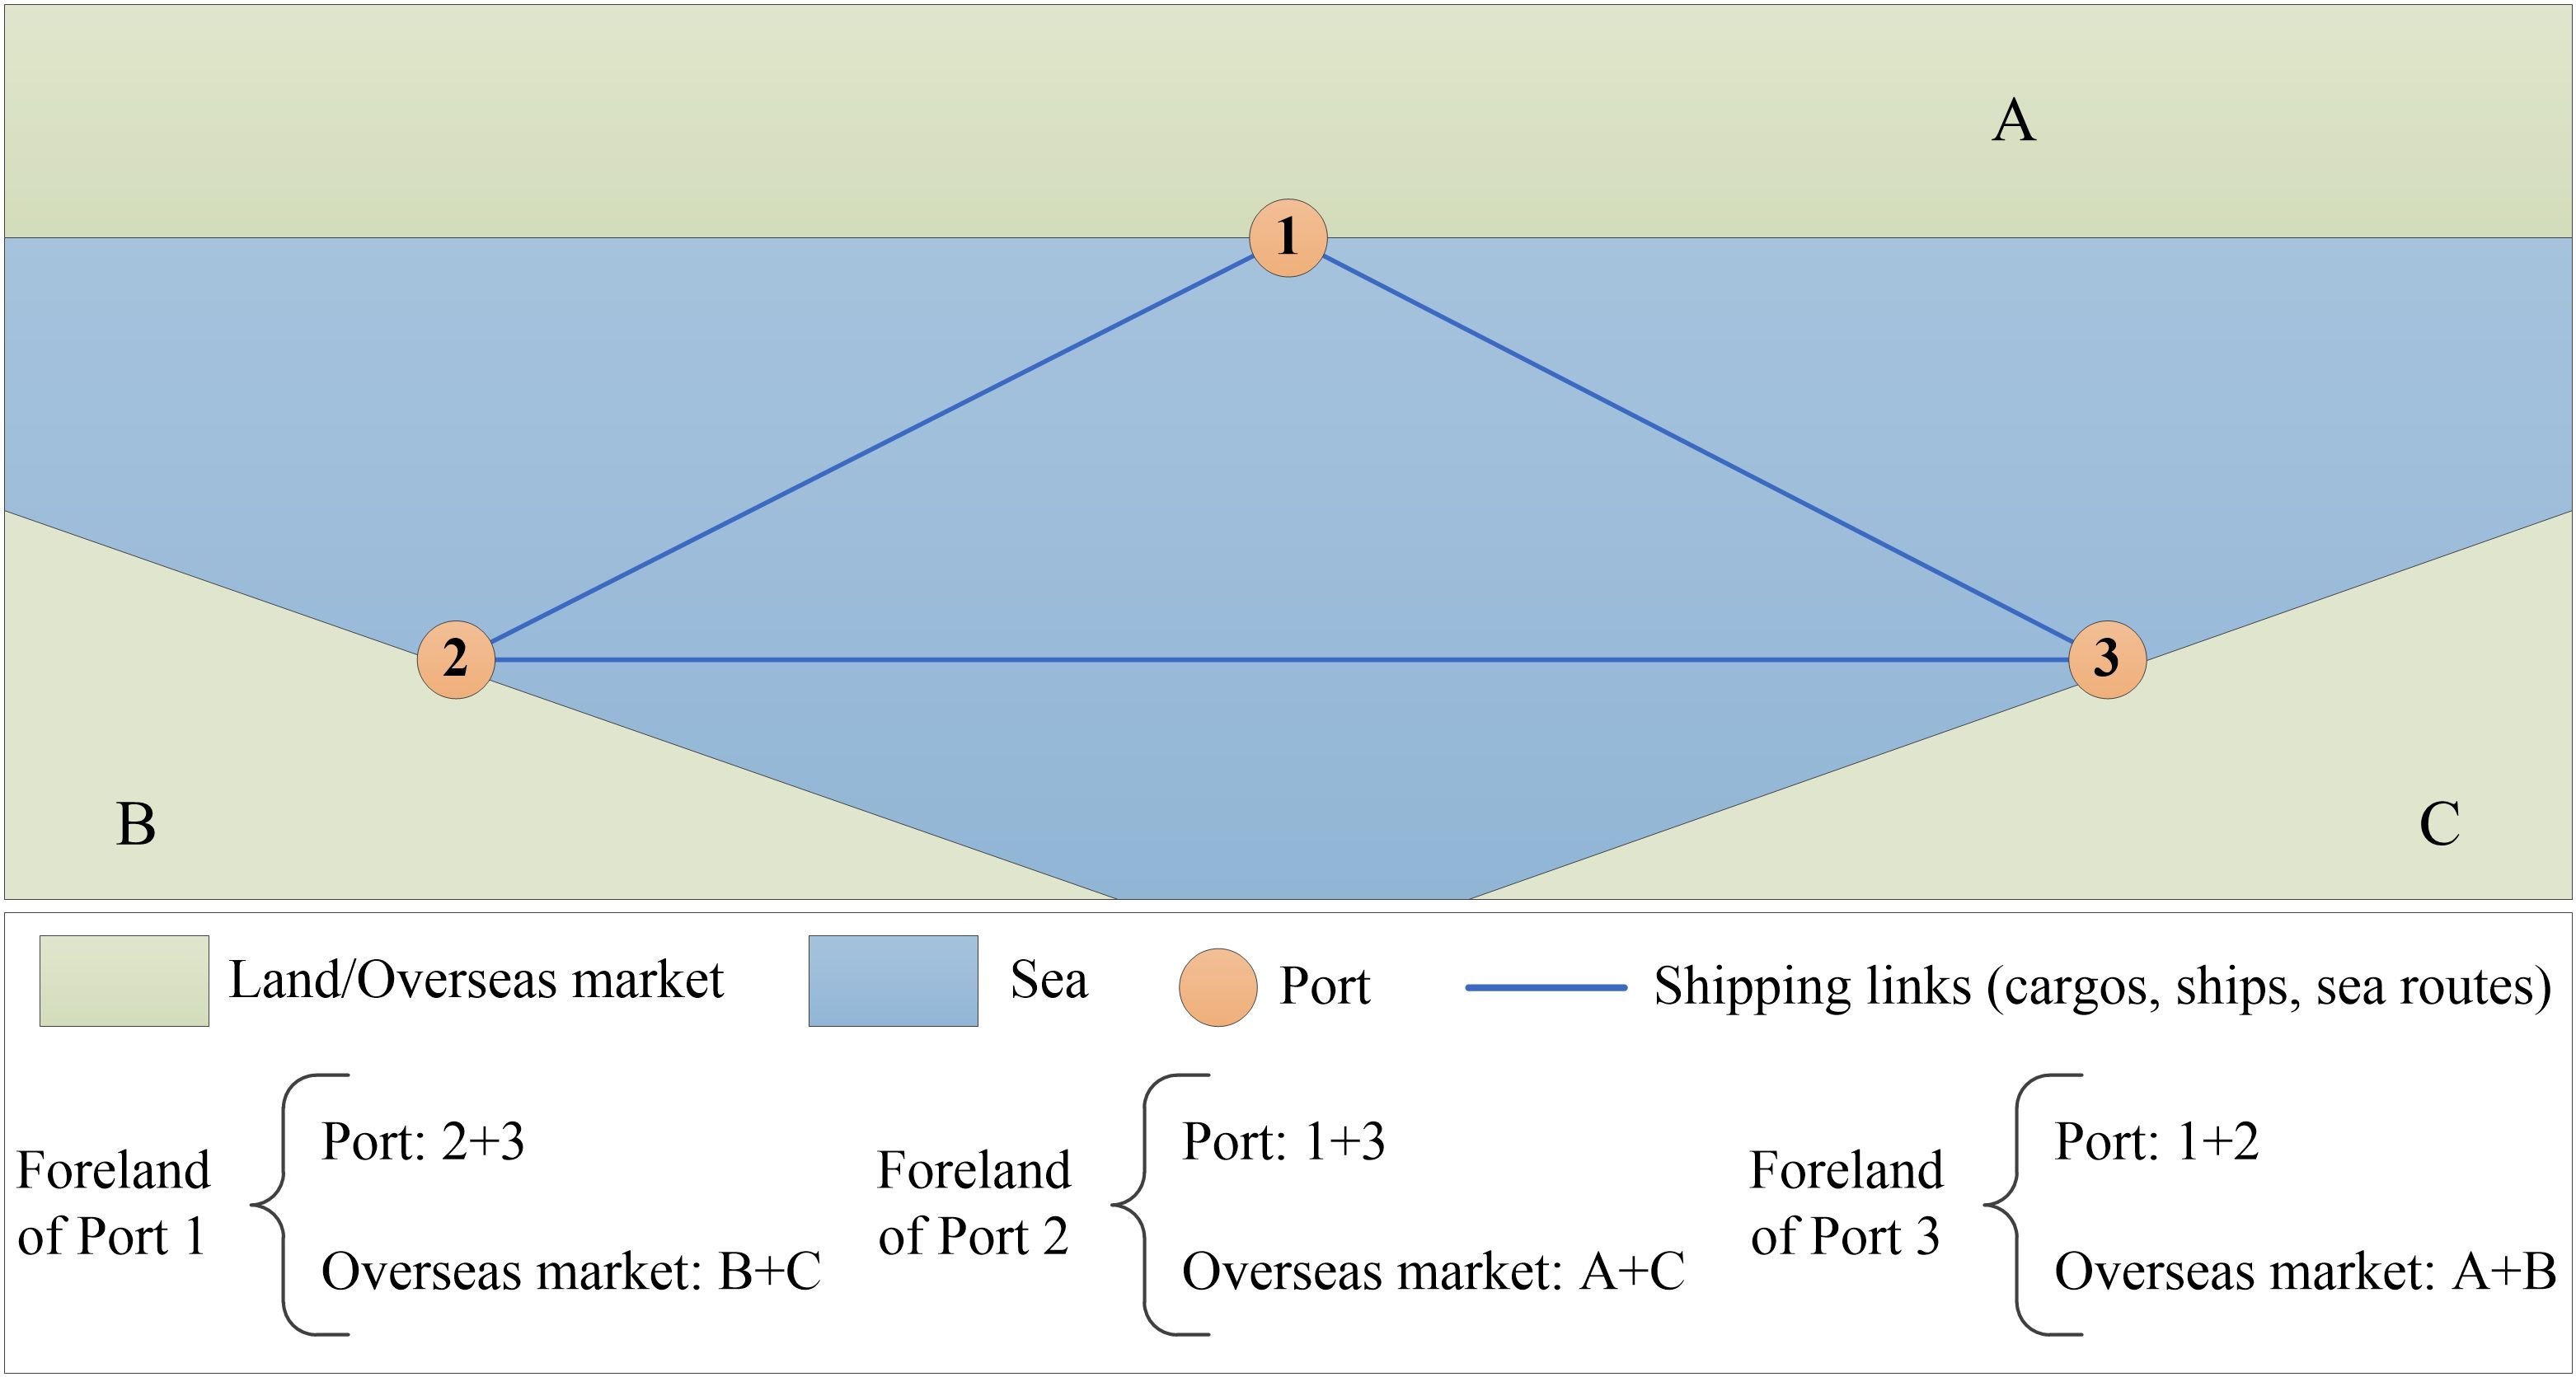
Figure 1. Schematic representation of port foreland.
As a major maritime trading country, the port foreland is crucial for the development of China’s international container shipping industry. A related study (Wang and Zhu, 2017) has shown that the foreland distribution of China’s coastal container ports (CCCP) shows a concentration trend and distance attenuation characteristics, and the network hierarchical structure is remarkable, developing from a dual centre (Hong Kong, Shanghai) with one main and one auxiliary to four centres (Shanghai, Ningbo, Shenzhen, Hong Kong). The average value of the Liner Shipping Connectivity Index increased from 103.1 in 2006 to 174.32 in 2022 (UNCTAD, 2023), indicating that the number of navigable ports is increasing and the scope of port forelands is expanding. Although China has numerous container shipping connections with ports/regions worldwide, the sea freight flow of CCCP mainly relies on a few core ports in various shipping regions (Xu, 2016). The foreland network of CCCP is highly sensitive to the smoothness of the three main shipping channels, with the Strait of Malacca having the greatest impact, followed by the Suez Canal and the Panama Canal. When the three shipping channels are attacked, the network distance between CCCP and other international ports increases to varying degrees, and the network efficiency considerably decreases (Wu et al., 2017). Opening up new shipping channels and reducing the constraints of major waterways on China’s maritime transportation is an important challenge faced by the development of CCCP’s foreland network and foreland. A potential sea route is currently taking shape, which may affect CCCP’s foreland network and drive the foreland evolution of CCCP.
The acceleration of global warming has rapidly melted the Arctic Ocean ice. Opening the Arctic shipping routes (ASR) and changing the shipping and trade routes are thus possible. The ASR include the Northern Sea Route (NSR), Northwest Passage (NWP) and Middle Passage (Figure 2), of which the NSR is the widely recognised route that has the best navigation environment and the highest transportation value. Russia, as the country with the longest Arctic coastline, has promulgated a series of policies and guidelines that aim for the development of the Arctic region and the revitalisation of the NSR. In July 2017, Russia formally invited China to build the Polar Silk Road (PSR) together. The white paper on China’s Arctic Policy was officially published in January 2018, which proposed the joint construction of the PSR to promote sustainable economic and social development in the Arctic region. Three main viewpoints emerged to explain the PSR. Firstly, the PSR is equivalent to the NSR (Wang and Chen, 2018). Secondly, it covers the entire Arctic waterway (Yang, 2018). Thirdly, the PSR involves comprehensive development and utilisation of waterways and resources, as well as infrastructure construction, tourism, scientific research, and a series of collaborations to jointly build a blue economic corridor connecting China and western Russia via the Arctic Ocean (Li and Liu, 2018). In summary, the PSR and ASR have differences in concept and application. The concept of PSR emphasises an economic and trade route, covering the possibility of maritime trade and cooperation through the Arctic Ocean. The construction of PSR has potential impacts on the global economy, politics, society, culture and ecology. The ASR focuses more on specific navigation routes. The opening of ASR theoretically can considerably shorten the voyage, save shipping costs and provide a relatively safe sea passage. In this work, we first consider the PSR as a sea route that connects Asia and Europe via the Arctic (Figure 2). The “Literature review” section provides a detailed review on the PSR and port foreland evolution. Despite their valuable contributions, previous literatures have three gaps.
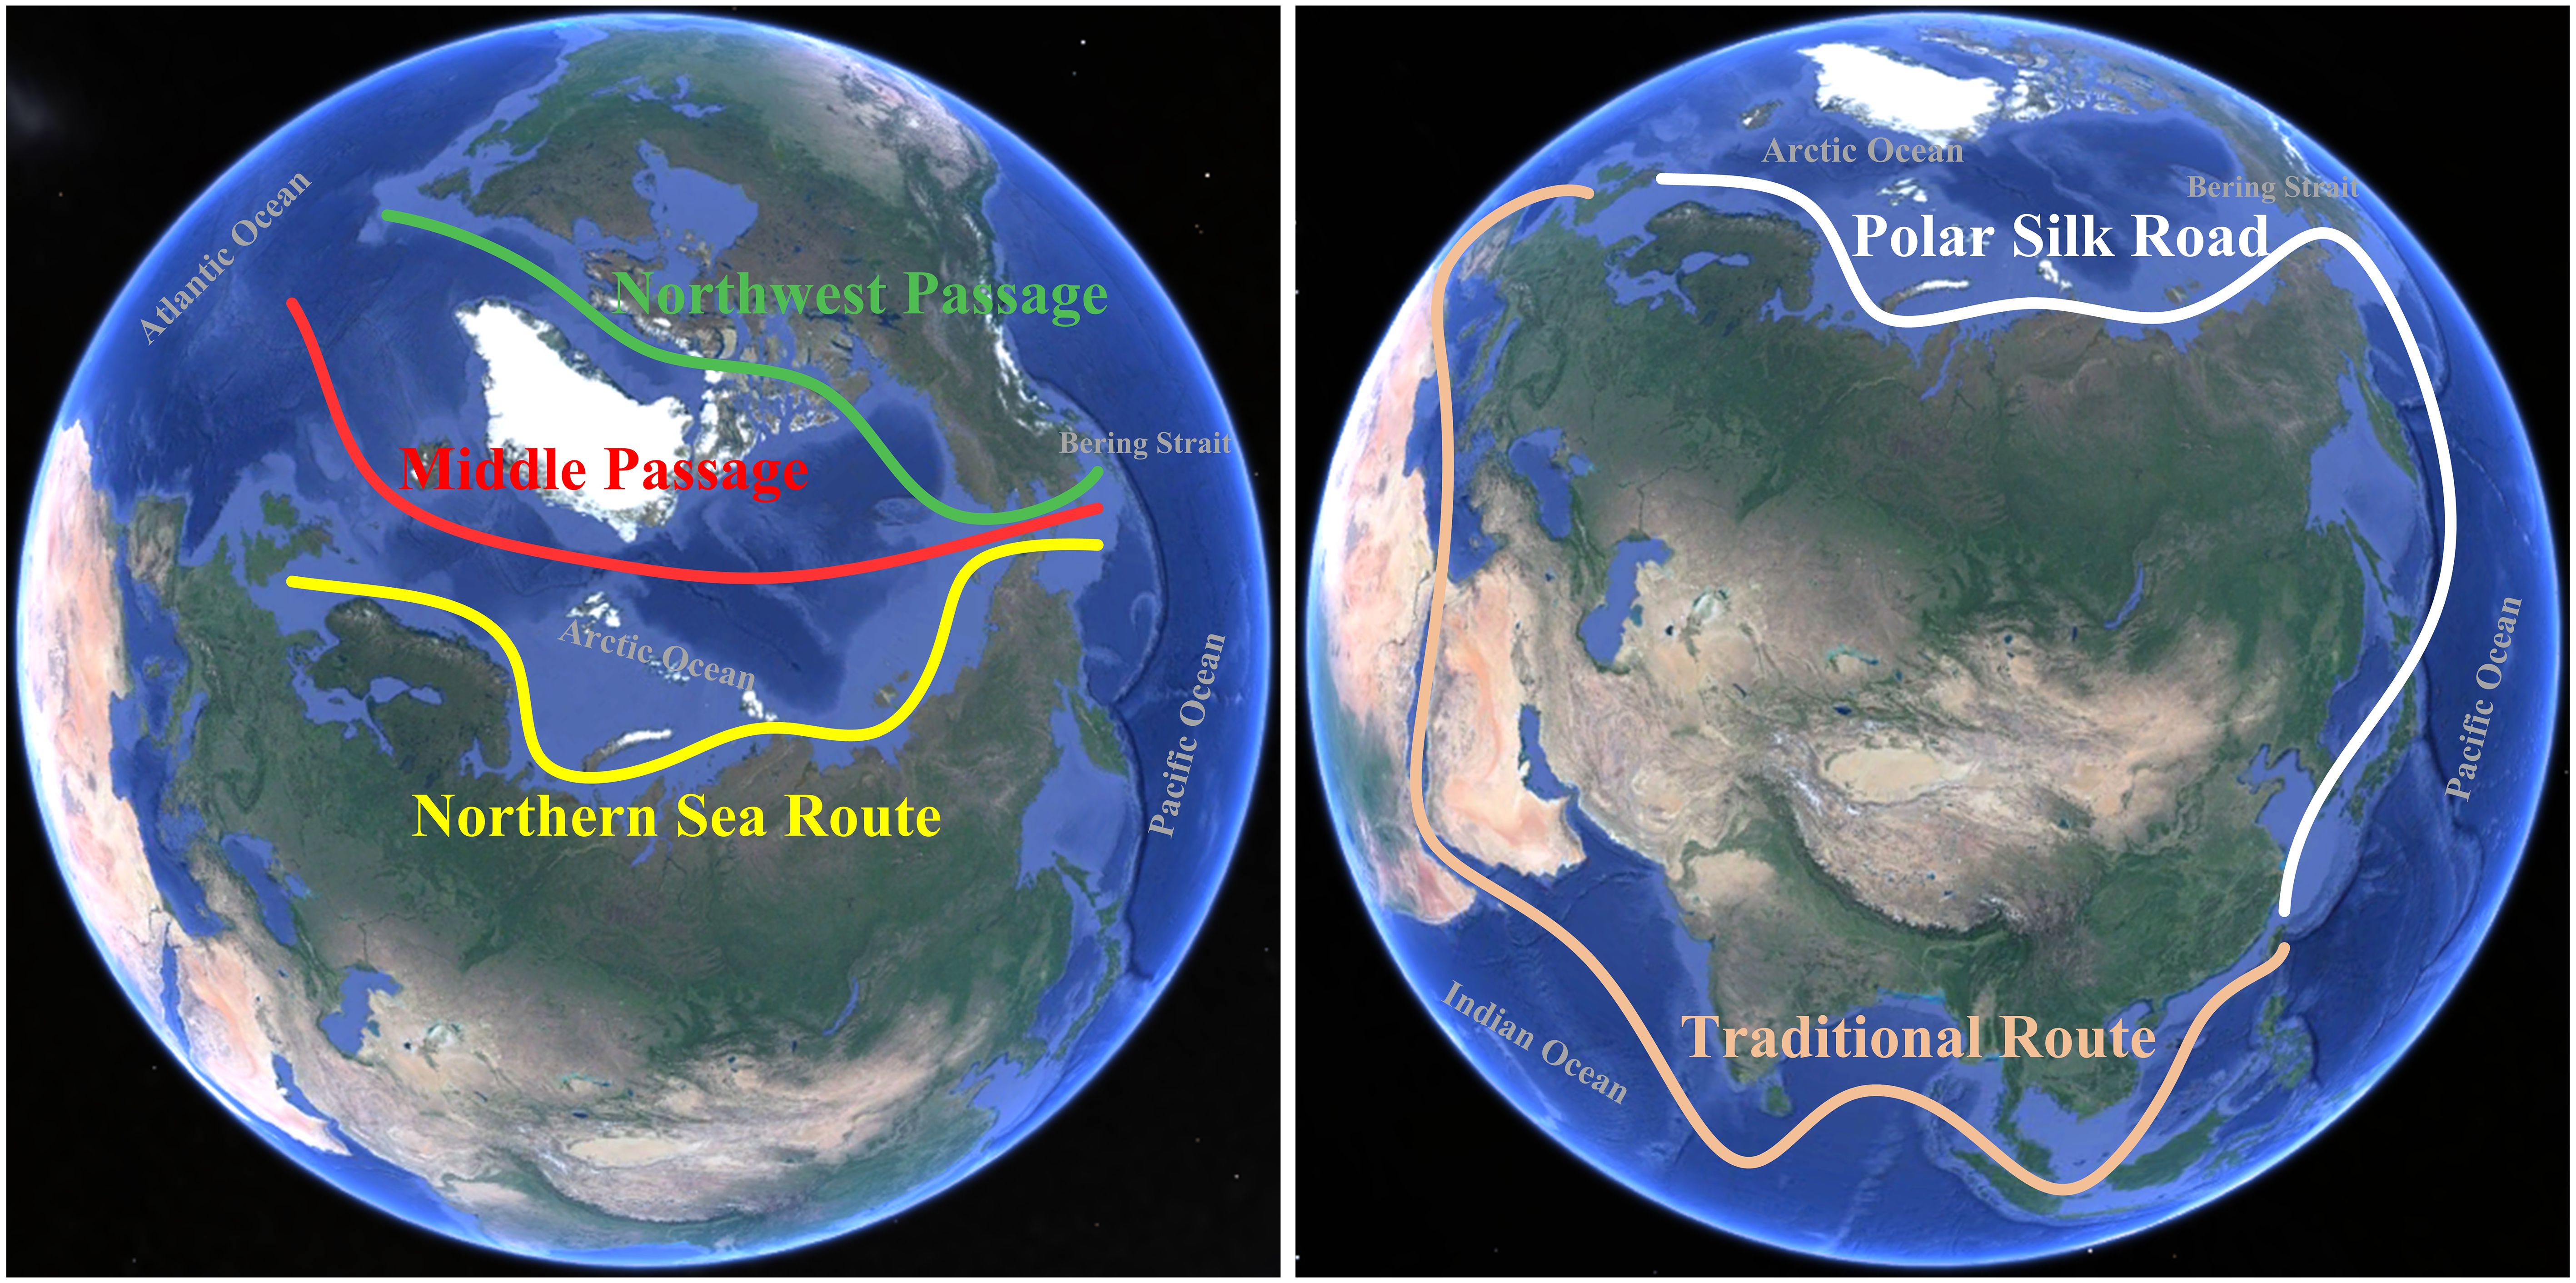
Figure 2. ASR and PSR.
Firstly, as a short and economically feasible sea route compared with the traditional route, the ASR/PSR inevitably affects the carrier’s market choice behaviour (Zhang et al., 2016; Wang et al., 2018; Peng et al., 2021, 2022a), and their effects on the core and cluster status of port foreland networks have been elucidated in some research (Ding and Li, 2020; Ding et al., 2022; Guo et al., 2022b). However, most studies are limited to qualitative elaboration, and quantitative argumentation has a considerable research gap. More importantly, no specific research on port foreland has been conducted. In particular, how the PSR can reshape the foreland of CCCP for China with cost and time advantages has yet to be explored.
Secondly, the topology statistics and temporal trend evolution of foreland networks based on shipping networks have dominated the research on port foreland (Ducruet and Wang, 2018; Mou et al., 2022; Guo et al., 2022a). Although changes in a foreland network are the foundation for promoting foreland development, current research has overlooked an important issue: the foreland is a group of discontinuous land areas (Guerrero, 2014) rather than a network. The quantitative division of foreland’s land space requires specialised exploration.
Finally, most analyses about port foreland networks focus on the changes in the current status of the networks compared with the past, lacking predictive analysis of the future evolution. At present, the generation mechanism considered in the construction of port foreland network evolution (PFNE) model is relatively simple and cannot better describe the evolution of the real network.
Thus, this study bridges the research gaps mentioned above. Firstly, we simulate the potential effects of PSR on the foreland evolution of CCCP. This study is a preliminary attempt to consider the effects of PSR on port foreland, and it helps predict the development trend of the port and shipping market in advance and enable measures to be taken to adapt to the changing market environment. Secondly, given that the port foreland network is the foundation of foreland delineation, a complex network delineation method of port foreland, which expands the quantitative methods in the foreland and facilitates the discovery of different overseas markets’ importance. is proposed. Finally, we construct the PFNE model, which is closer to the generation law and evolution of the real foreland network compared with other models.
The relevant literature on this topic is reviewed in the following section. The methodologies and data are provided in Section 3. The simulation results are presented in Section 4. The discussion and conclusion are given in Sections 5 and 6, respectively.
2 Literature review
2.1 Effects of PSR on port evolution
PSR is a proposed trade route based on the NSR, with a focus on economic and trade activities and international cooperation projects based on the development and utilisation of ASR (Li et al., 2021). The changes in Arctic sea ice provide opportunities for the ASR to become a world-class strategic channel and a new corridor for international energy transportation (Zhu et al., 2015; Ding and Li, 2020). The new shipping routes help to shorten transportation time, reduce fuel consumption and costs, improve maritime network connectivity and reduce greenhouse gas emissions (Melia et al., 2016; Theocharis et al., 2018), reshaping the global shipping networks and maritime transportation geography (Theocharis et al., 2018). Related studies have shown that the opening of ASR will increase the number of global shipping routes and local route density; cause changes in port status, core and cluster status of port networks; and promote the formation of a new global port foreland network (Ding and Li, 2020; Ding et al., 2022; Guo et al., 2022b). East Asia, Europe and North America will become the regions that benefit the most (Ha and Seo, 2014; Bekkers et al., 2018). The open Arctic Ocean has brought special opportunities for China’s maritime trade (Hong, 2012). Given that China’s coastal ports are mostly located on the extension line of ASR, they will disperse the cargo volume of traditional routes, and the focus of China’s maritime layout may shift northward (Wang et al., 2014). The use of ASR will change the status of China’s coastal ports in the main and branch lines of port foreland networks, expanding the radiation range and cargo volume of port foreland (Wang and Zhang, 2014). In particular, ASR are more beneficial for the development of port industries in the northern and central coastal areas (Li et al., 2014; Li and Hu, 2015).
Current studies on the PSR are mainly qualitative research that focuses on the construction issue. Chen (2018) analysed the feasibility of PSR’s construction through a discussion of the internal and external environments. Zhu and Zhang (2018) believed that the construction of the PSR is feasible based on good development opportunities and geographical conditions. More scholars have provided relevant countermeasures and suggestions for the formulation of a scientific and reasonable development layout of the PSR (Xue, 2018; Li and Peng, 2019). The potential of the PSR to accelerate the shipping trade is gaining importance (Wu et al., 2021). PSR will promote economic growth in countries and regions along the route (Guan et al., 2020; Wang et al., 2021) and drive the evolution of transportation and logistics systems in the Northern Hemisphere (Cai, 2019). For China, PSR triggers a new round of adjustment in the division of labour and layout of coastal industries (Hao and Chu, 2021), forming a reshaping effect on the geographical pattern of China’s ports. Based on theories and methods such as spatial interaction and random utility, Peng et al. (2021; 2022a; 2022b) simulated the evolution of the hinterland, functional structure and spatial pattern of China’s coastal ports facing the PSR. The overall results showed significant differences in the evolution trends of ports in the northern, central and southern coastal regions of China.
As mentioned, the driving role of ASR and PSR in the evolution of global ports has been widely demonstrated. However, the effects of ASR and PSR on the evolution of China’s coastal ports remain limited to qualitative evidence and lack a basis for quantitative analysis. And no specific research has been conducted on port foreland. Based on complex network methods, this paper simulates the global foreland evolution of CCCP under the PSR to provide more accurate judgments for effectively identifying the potential effects of PSR on port development.
2.2 Delineation and evolution of port foreland
In the process of continuous evolution and development, the hinterland has been subdivided into hinterland and foreland. Hinterland is the narrative mainstream of the so-called ‘hinterland’ or ‘port hinterland’ in the traditional research context. By contrast, research on the foreland remains scarce. The foreland was first mentioned by Weigend (1956). For port research, emphasising only the hinterland and the maritime service system where the port is located is far from sufficient. We should pay more attention to the importance of the foreland, opening up a new dimension of port research. Weigend (1958) explained the foreland as the land areas that lie on the seaward side of a port, beyond maritime space, and with which the port is connected by an ocean carrier. The later interpretation of the foreland’s concept also focuses on this basic idea (Barke, 1986; Zohil and Prijon, 1999; Rodrigue, 2010; Jafari and Khosheghbal, 2013), but some studies more clearly point out that foreland refers to ports and overseas markets connected through port shipping services (Zohil and Prijon, 1999; Rodrigue, 2010). This provides a basis for using port foreland networks to study the foreland and also indicates that changes in the port foreland network will lead to the foreland’s evolution.
The development of containerisation and multimodal transportation has brought significant changes to the hinterland network, and the concept of the hinterland–foreland continuum has been introduced (Elliott, 1969; Robinson, 1970). In this context, a main trend of later research is to bring the foreland into the analysis category and qualitatively explore the spatial evolution law of the port system (Rimmer, 1977; Hayuth, 1981; Notteboom and Rodrigue, 2005; Rodrigue and Notteboom, 2010; Wang and Ducruet, 2011). In terms of quantitative analysis, some scholars have identified the trade relationship of some areas to the foreland space by constructing geographical connectivity indicators (Ducruet and Roussin, 2007; Wang and Ng, 2011). Seoane et al. (2013) introduced graph theory techniques additionally with statistical techniques to determine the foreland for containership and general cargo ports in Europe. This approach brings useful inspiration to our work, but it lacks the global vision of delimiting the foreland, and some forelands that have weak trade relations but have potential are ignored. Related quantitative analysis remains lacking.
Unlike the of lack research on the delineation of port foreland, the study of port foreland networks based on shipping networks has aroused widespread interest among scholars. Research on port foreland networks often starts from the measurement of its topological and statistical characteristics, and some scholars analyse it from a global perspective (Ducruet, 2013; Xu et al., 2015). These studies confirmed the small-world and scale-free characteristics of the global port foreland networks. Other scholars focused on the topology evolution of large container liner companies’ route service networks (Fremont, 2007) and regional port foreland networks (Ducruet and Wang, 2018; Mou et al., 2022; Guo et al., 2022a).
The evolution of port foreland networks stems from the economic mechanism, capacity adjustment and service expansion of the restructuring of shipping enterprises (Wang, 2008), which are directly reflected in the changes in the selected ports (Ng et al., 2013; Ding and Li, 2018). In the constantly changing shipping market, technology, policies and political environment, some ports have attracted more shipping companies through functional upgrades, thereby triggering evolution in the spatial organisation of shipping routes (Zhao et al., 2014). Port strength (infrastructure, freight volume, efficiency, economic level), hinterland economic (GDP) and port location (cost, time) are the key selection elements (Chang et al., 2008; Lam and Dai, 2012; Ng et al., 2013; Ding and Li, 2018). The competitive behaviour between ports also leads to dynamic strengthening or interruption of shipping connections (Zhao et al., 2014). Exploring the evolutionary rules of the port foreland networks will be of benefit to the delineation of foreland space and the analysis of foreland evolutionary trend. However, research remains lacking on quantitative rules governing port foreland networks. Two types of network evolution models are developed based on the classical BA model (Barabási and Albert, 1999) and BBV model (Barrat et al., 2004): unweighted and weighted network evolution models. These limited models focus on improving the joining mode of new nodes and the connection mechanism between nodes. For example, Wang et al. (2013) improved the BA model by using the attraction model and then simulated the evolution of a container liner transportation network; Ding and Li (2020) proposed a new mechanism for adding new nodes to the shipping network.
In sum, the preference for research on the economic benefits of shipping services makes quantitative methods on the foreland delineation insufficient to date. Given that the port foreland network is the driving force behind the foreland evolution, we propose a complex network delineation method of port foreland to define a clearer type of land space for port foreland. In addition, at present, the generation mechanism considered in the construction of the PFNE model is relatively simple and cannot better describe the evolution process of the real network. Thus, we construct the PFNE model, which is closer to the generation law and evolution process of the real foreland network compared with other models.
3 Materials and methods
This section introduces the analytical framework of the potential effects of PSR on the CCCP’s global foreland evolution (Figure 3). It first illustrates the research logic derived from the literature review and then obtains the evolution results of CCCP foreland under the PSR by constructing the PFNE model, setting evolutionary scenarios and proposing a complex network delineation method. The core idea of the framework is to indirectly obtain the foreland evolution results based on the changes in the foreland network under the PSR.

Figure 3. Analytical framework.
3.1 Complex network indicators
We select the following complex network indicators to characterise the network characteristics of the port foreland network.
3.1.1 Degree and degree distribution
Degree represents the number of ports connected to a port. This value is computed according to Equation 1:
Degree distribution described in Equation 2, where γ denotes the power law index. If the degree distribution of the port foreland network presents a power law distribution, a scale-free network is demonstrated (Barabási and Albert, 1999). The typical feature of scale-free networks is that few nodes have many connections. We estimate the power law exponent of the degree distribution by the least squares method.
3.1.2 Degree strength
In network analysis, degree strength is defined as the relative position of a given port regarding other ports in the foreland network (Ducruet et al., 2010). Degree strength is defined by Equation 3 (Freeman, 1979), where Sidenotes the strength of port i:
3.1.3 Average path length and network diameter
The average path length reflects the average number of steps for each pair of ports that have connectivity. The longest shortcut is the diameter of the foreland network. The average path length is defined by Equation 4, where dij denotes the shortest length between ports i and j. The weighted average path length shows the average distance between the ports in the weighted network. The weighted average path length is defined by Equation 5, where means the weighted shortest length between i and j.
3.1.4 Clustering coefficient
The clustering coefficient reflects the degree of foreland network clustering and collectivisation, which is defined by Equation 6 (Watts and Strogatz, 1998):
where Ci is the clustering coefficient of port i; ki is the degree; Ei is the number of edges between the 1st order neighbourhood ports of port i. The clustering coefficient of a foreland network is defined as the average clustering coefficient of all its ports, i.e.
The weighted clustering coefficient of port i is defined by Equation 8.
where w is the weight of an edge.
3.1.5 The k-core
The k-core can evaluate the core-periphery structure of the foreland network, which is defined as the unique maximal subgraph with a minimum degree of at least k. The max k-core can measure the hierarchy of the network (Pittel, 1996).
3.1.6 Network structure entropy
The network structure entropy can be an average measure of a foreland network’s heterogeneity. It is defined by Equation 9, where N is the total number of ports.
3.1.7 Newman correlation coefficient
The Newman correlation coefficient (Newman, 2002) is used to measure the matching characteristics of the foreland network. In an unweighted network, it is defined as Equation 10:
where M is the total number of connected edges in the network; ki and kj is the degree of two connected ports in M.
In an unweighted network, it is defined as Equation 11 (Leung and Chau, 2007):
where H is the total weight of connections in the foreland network; wij is the weight of the edges connecting port i and j.
3.1.8 Graph density
Graph density depicts the extent of the connection among ports. It equals the ‘‘total number of relationships that actually exist” divided by the ‘‘maximum number of relationships that theoretically exist potentially” (Geng et al., 2014). The definition of graph density is given by Equation 12, where m is the number of actual relationships in the foreland network, and the number of ports is n.
3.2 Construction of CCCP foreland network
We build the CCCP foreland network (Figure 4) based on the container liner routes, commonly used data for building port foreland networks. The significant linear relationship (R2 =0.8344) between port throughput and port degree strength indicates that the number of routes can also represent the cargo connection in foreland. The data of container liner routes are from the world’s top 30 shipping companies’ (accounting for 94.1% of the global transport capacity) official websites in 2019, according to the Alphaliner website. The routes include all routes of CCCP. The starting, destination and connecting ports are included in the route information. A total of 900 non duplicate routes and 244 combined ports (ports belonging to the same port or the same port with different names) were found. These ports are distributed in 19 shipping regions (Xu et al., 2015) and 84 countries. Complex network theory provides two classical network building methods (Sen et al., 2003): L and P space. L space considers the constraints of geographical space, which is more suitable for describing the generation process of the foreland network. The L space method is therefore used to construct the network. The CCCP foreland network is an undirected weighted network, and the edge weight is expressed by the number of routes. We are not limited to selecting container liner routes’ data between China and Europe to build the CCCP foreland network. This is because the maritime connections between ports are close and complex, and the shipping network between China and Europe cannot be completely independent of the maritime network of China’s coastal ports.
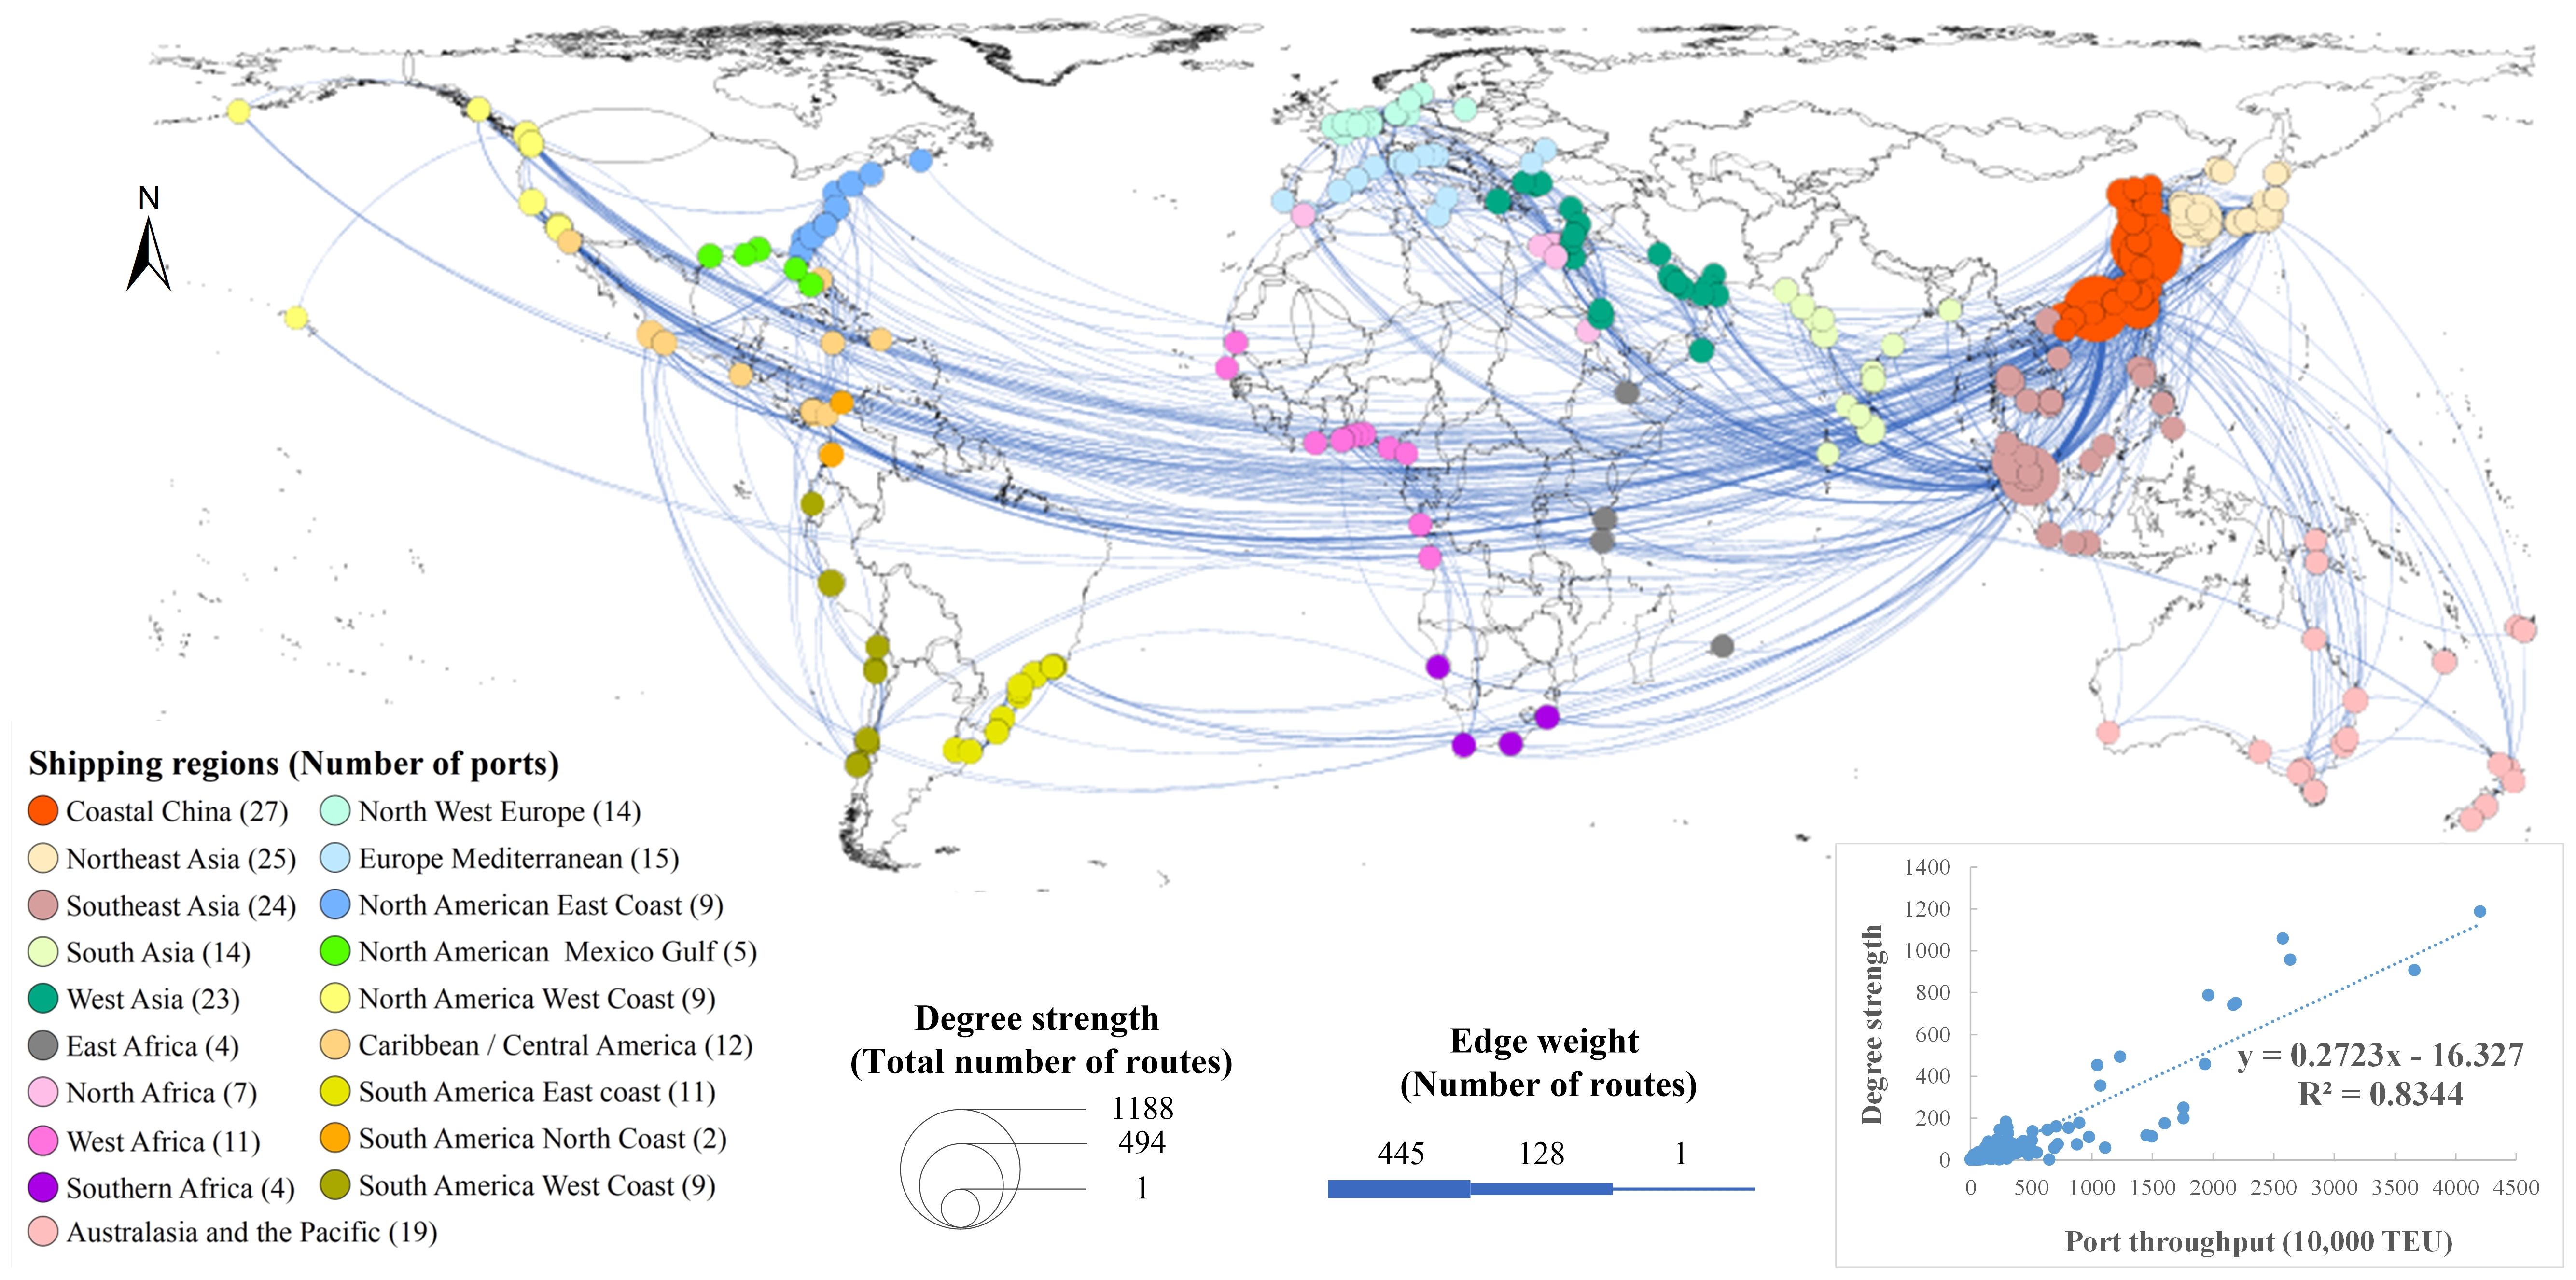
Figure 4. CCCP foreland network.
A random network of the same scale is generated by MATLAB to observe its complex network structure characteristics. The topological structure shows that the average path length of CCCP foreland network is 2.993, which is in line with the ‘six degrees of separation’ phenomenon in the small-world network. Moreover, compared with the random network, the clustering coefficient is higher, indicating that port clusters of different scales are present in the network. These findings reflect the characteristics of a small-world network. The degree distribution and degree strength distribution all show a power-law distribution. Thus, the CCCP foreland network is a small world and scale-free network.
3.3 Construction of PFNE model
Based on the two basic characteristics of growth and preference dependence in scale-free networks, Barrat et al. (2004) proposed an evolutionary model for weighted complex networks: the BBV model. The basic algorithm of this model is to construct the initial network, add new nodes, adjust edge weights and generate the final network. In the real world, the foreland network reflects the spatial organisation of ports and routes, which is a macroscopic manifestation of the micro behaviour of shipping enterprises, with important characteristics of dynamic change and nonlinear growth. Although the BBV model (Barrat et al., 2004) can be used to simulate the foreland network’s basic evolution process, the formation of the foreland network is related to the choice of ports by shipping companies. Shipping companies design their service networks to maximise economies of scale by making decisions to maximise economies of scale (Guy and Urli, 2006; Talley and Ng, 2013). Port strength (infrastructure, freight volume, efficiency, economic level), hinterland economic (GDP) and port location (cost, time) are the important selection elements (Chang et al., 2008; Lam and Dai, 2012; Ng et al., 2013; Ding and Li, 2018). The competitive behaviour between ports also leads to dynamic strengthening or interruption of shipping connections (Zhao et al., 2014). Thus, we improve the BBV model and propose the PFNE model. Although we first consider the PSR as a sea route via the Arctic that connects Asia and Europe in this paper. The potential impact of the PSR on the global economy, policy, society, culture, and ecology cannot be ignored. Therefore, in addition to factors (port strength, hinterland economic, environment and port location) directly related to container shipping, considering the availability of data, we incorporate trade and policy factors into the PFNE model to reflect the economic and political impacts of PSR. The evolution simulation process is detailed below.
Step 1: Initial network. The initial foreland network G is composed of n0(n0≥1) port nodes. The node is represented by i, and the edge weight is set according to the real foreland network.
Step 2: Network growth. Each time step Δt, a new node j is added to G, and the edge connection and edge weight attached to j are set to ej and wj that conform to Poisson distribution.
Step 3: Preferential attachment. Roulette algorithm is used to generate the connecting route between the new node j and ej old nodes i in the initial network. The preferential probability for j to select i is (Yu, 2009)
where Pij is the preferential probability; Si is the node strength of i; rij is the fitness of i selected by j; Tij refers to the trade volume between the countries of i and j, indicating the strength of trade relation; Ri is the international trade agreements (WTO Agreement, Free Trade Agreement, Regional Comprehensive Economic Partnership, China-ASEAN Free Trade Area) that country i has signed, indicating the trade policy; Yi represents the comprehensive evaluation value of port i’s policies, including port development policy (port development index, Maritime Silk Road port development policy, development policy for coastal ports along the ASR), port trade policy (free trade port policy), and port construction policy in the country; Ei is the comprehensive evaluation value of port i’s natural environment (channel depth, anchorage conditions, cargo terminal depth, maximum draft of ships), logistics environment (logistics performance index), safety environment (natural limiting factors such as tides, huge waves, floating ice, and the number of ship piracy accidents), and sustainable development environment (carbon dioxide emissions), used to represent the overall environment of the port; Gi is the GDP of port i’s city, indicating the hinterland economic development; Ii refers to the infrastructure’s quality of the liner shipping connectivity and efficiency of seaport services of port i, indicating the quality of port infrastructure; Ni is total deadweight tonnage of ships docked at port i, indicating the port’s economic level; Oi is the container throughput of port i, which is the most direct manifestation of port’s freight capacity; Dij is the shipping distance between i and j, which is directly related to cost and time, i.e. port location; α, β, κ, μ, δ, γ, ϕ and ψ are parameters that are calculated by maximum likelihood estimation method; θ is the friction coefficient of shipping distance; and ω is an adjustment parameter.
Step 4: Dynamic evolution of edge weight. The addition of j will lead to dynamic change of the node strength in i’s surrounding area. Here, the edge weight’s dynamic evolution mechanism from the BBV model (Barrat et al., 2004) is adopted
Step 5: Edge reconnection. At each time step Δt, an old node i with probability Pl is selected, and the connection with any node i* in the initial network is regenerated. The connection weight conforms to Poisson distribution. This step is repeated a times. The preferential probability of connecting i and i* is
where is the preferential probability; other parameters have the same meaning as in Equation 13.
Step 6: Edge deletion. At each time step Δt, an old node i with probability 1-Pl is selected, and the connection with any node i** in the initial network is deleted. This step is repeated b times. The inverse preferential probability of deleting the connection of i and i* is
where is the inverse preferential probability; other parameters have the same meaning as in Equation 13.
Step 7: End of evolution. n=n+1 is set, and the above process is repeated until the network scale reaches the set scale.
Compared with the BBV model and other derivative port network evolution models (Wang et al., 2013; Zhao et al., 2014; Wang and Li, 2013; Ding and Li, 2020), this model comprehensively considers the fitness of the node to be selected, the attached edge of the node, the Poisson distribution of edge weight and the reconnection and deletion between nodes. It is closer to the generation law and evolution process of the real foreland network.
3.4 Evolutionary scenarios of the CCCP foreland network under the PSR
The emerging sea route is inevitably accompanied by changes in port functions and status, which then affect the choice of shipping companies and ultimately drive the evolution of the foreland network. At present, the PSR’s disturbance effect on the current foreland network has not yet appeared. Therefore, we designed three evolutionary scenarios to predict the possible evolution of the CCCP foreland network under the PSR.
Scenario 1 (S1): The network generated by the PFNE model in Section 3.2 is used as the current CCCP foreland network. Although the PFNE model can simulate the structural characteristics of the CCCP foreland network, the evolutionary network is still different from the real network. However, taking the evolution network rather than the real network as the basic control group, we can better eliminate irrelevant variables and more accurately evaluate the effects of PSR on CCCP foreland.
Scenario 2 (S2): The key to ensuring the smooth and normal operation of PSR lies in the connecting of fulcrum ports (Zhang and Chen, 2018). Comprehensive consideration of the construction foundation and natural conditions of the ports along the Arctic Ocean indicated that nine ports (Zhang and Chen, 2018; Guo et al., 2022b) (Figure 5) have good development prospects. Among them, Sabetta, Murmansk, Tiksi and Uelen have outstanding advantages and are suitable for joining the CCCP foreland network as fulcrum ports. We assume that the PSR is commercially open from July to November, which is the most suitable for Arctic navigation. Compared with the traditional route, its significant maritime distance advantage will attract shipping companies to choose. Thus, the shipping distances between some ports and the countries are set as the distance through the PSR. The trade volume between some countries will also change. The CCCP foreland network will be obtained by taking the changed trade volume and shipping distance into Equation 14.
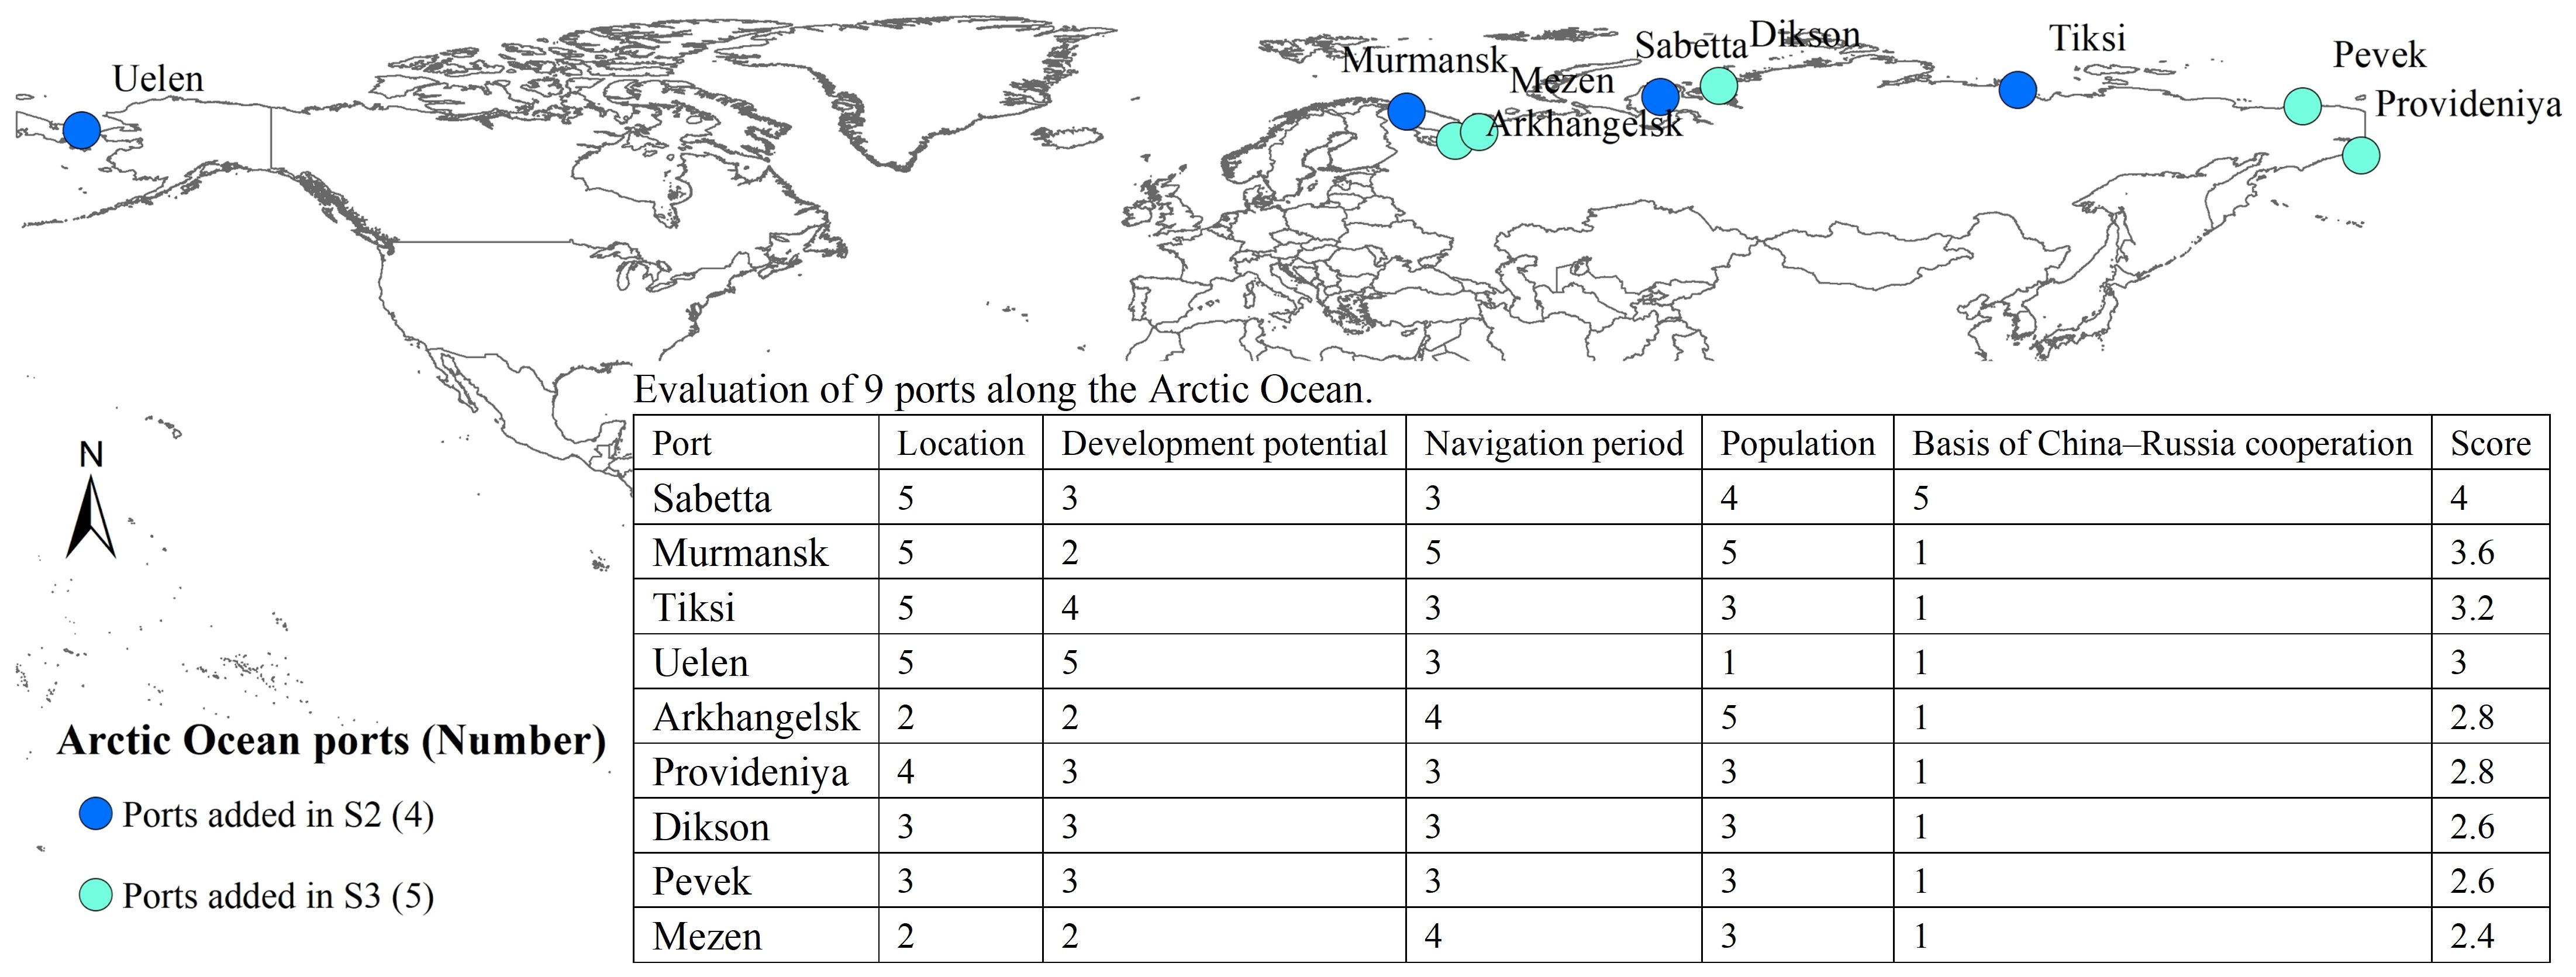
Figure 5. Ports along the Arctic Ocean (Zhang and Chen, 2018; Guo et al., 2022b).
Scenario 3 (S3): Port construction, especially along the Arctic Ocean, is important work in the PSR’s development. With the continuous improvement of the PSR’s navigation capacity, the Arkhangelsk, Provideniya, Dikson, Pevek and Mezen ports in the Arctic Ocean region have good development prospects and will be added to the CCCP foreland network.
The modes of transport between China and Europe include not only sea transportation but also land transportation (such as China–Europe freight trains) and air transportation. The development of these modes will also affect the evolution of CCCP foreland. However, considering that the aim of this paper is to predict an evolutionary trend of CCCP foreland under the PSR, the development and changes of future land and air transportation will not be considered in the evolutionary scenarios. This can better exclude irrelevant variables and more accurately evaluate the PSR’s effects.
3.5 Complex network delineation method of port foreland
Based on complex network theory, we propose a method to delimit the port foreland. The foreland is the area (port and overseas market) where the port is connected by shipping (Weigend, 1958; Zohil and Prijon, 1999; Rodrigue, 2010; Jafari and Khosheghbal, 2013). In addition to pointing out other ports and markets connected with a port, the foreland also represents cargo connectivity. High connectivity corresponds to easy and frequent trade interaction between the country markets where the ports are located. The concept of the shortest path length in complex network theory can be used to express this meaning.
The shortest path length is used to calculate the minimum number of edges that two nodes in the network need to pass through and describes the network’s information transmission efficiency. For nodes i and j in an unweighted network, if they are directly connected, then the shortest path length Lij between them is 1. If an intermediary node exists between them, then Lij=2. In the weighted network, a large weight between nodes corresponds to high contact frequency between two nodes.
The determination of foreland in our paper is based on the shipping network. The node is the port, and the connection is represented by the routes. A high frequency of routes corresponds to a high connectivity between a port and the connected ports and therefore close trade links between the ports’ countries (overseas markets). We divide the foreland of a port into two categories, namely, the port type foreland and the country type foreland, which represent the ports to which a port is connected and its overseas country markets, respectively. The method consists of three steps. 1) The Dijkstra algorithm is used to calculate the shortest path length between a port and other ports. 2) The port type foreland is divided according to the shortest path length’s size to distinguish the importance of different ports to the port. 3) Equation 19 is used to calculate the shortest path length of different countries with a port and then delimit the levels of country type foreland.
where is the shortest country path length between port i and country J, is the average path length between port i and all ports in country J, N is the total ports’ number except the port of the country where port i is located, and nJ is the number of ports in country J.
3.6 Data sources
The data on container liner routes are from the world’s top 30 shipping companies’ (accounting for 94.1% of the global transport capacity) official website in 2019, according to the Alphaliner website. The routes include all routes of CCCP. The starting, destination and connecting ports are included in the route information. In the PFNE model construction, we consider the impact of trade relation, trade policy, port policy, environment, hinterland economic, quality of port infrastructure, economic level, freight capacity and location factors on foreland network evolution. Trade volume is obtained from UN Comtrade database and the estimated trade data between countries under the PSR are obtained from Appendix A. International trade agreements come from World Trade Organization website, China Free Trade Area Service Network and China ASEAN Free Trade Network. Port policies are obtained from Xinhua Baltic International Shipping Center Development Index, Belt and Road Portal, Arctic policies of countries and Maritime Database website. Port environmental data come from National Geospatial-Intelligence Agency, Shipping Guides Ltd, World Bank, International Maritime Organization, Global Competitiveness Report 2017–2018 (World Economic Forum). GDP of port cities come from the official websites of the national statistics bureaus of each country. Quality of port infrastructure are from the Global Competitiveness Report 2017–2018 (World Economic Forum). Total deadweight tonnage of ships docked at the port are from the BLM-shipping software. Port container throughputs are obtained from the Maritime Database website. Shipping distance between ports is calculated by the Searates website and the Free Map Tools website.
4 Results
The optimised BBV model, namely the proposed PFNE model, is used to simulate the evolution of the CCCP foreland network. The parameter values obtained by the maximum likelihood estimation method and repeated testing are n0= 8, α= 0.151, β= 0.034, κ=0.209, μ= 0.069, δ= 0.029, γ= 0.158, ϕ= 0.022, ψ= 0.032, θ=2.5, ω=0.35, Pl=0.65, a=4, b=1. A total of 30 independent simulations are conducted for each evolutionary process, and the complex network characteristic indicators’ average values are calculated. Table 1 shows that the PFNE model is closer than the BBV model to the real network’s indicators. The correlation coefficient R2 reaches 0.694, indicating that the factors selected in the PFNE model affecting foreland network evolution are reasonable and PFNE model has reliability in predicting CCCP foreland network’s evolution under the PSR (Wang and Li, 2019; Ding and Li, 2020; Ding et al., 2022). Then, based on the evolutionary scenarios set in Section 3.4, we simulate the three-stage evolution of the CCCP foreland network. Finally, utilising the proposed complex network delineation method of port foreland, the foreland evolution of CCCP under the PSR is predicted.
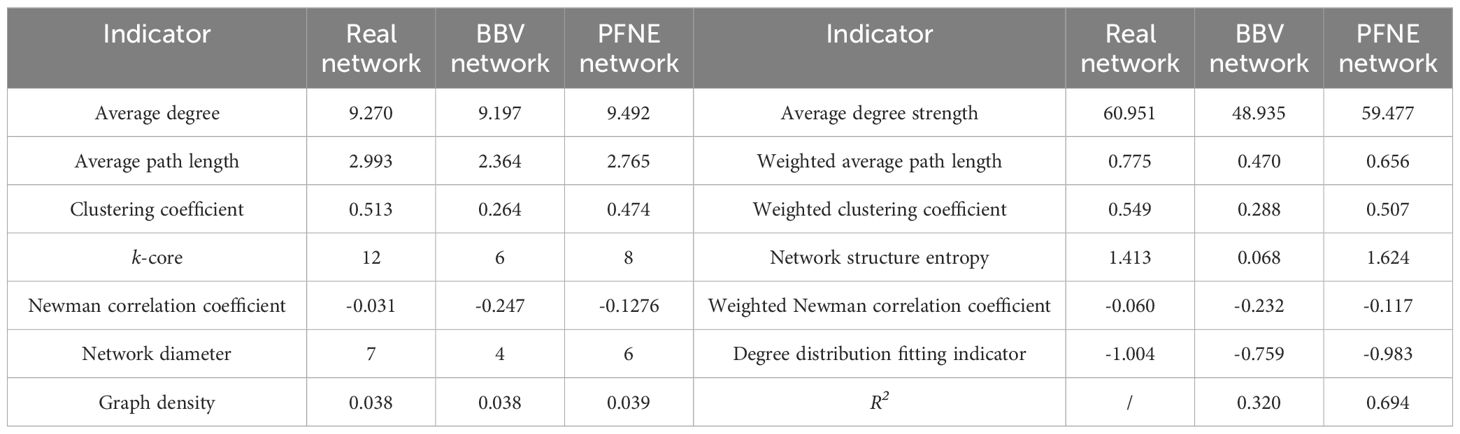
Table 1. Comparison of characteristic indicators among different networks.
4.1 Evolution of CCCP foreland network under the PSR
Given that the foreland is driven by changes in the foreland network, the evolutionary trends of the foreland network must first be examined. Figure 6 shows that compared with S1, S2 and S3 change significantly. Such changes are mainly manifested in the new route connection between the added Arctic Ocean ports and the ports in East Asia, Europe and North America. This shows that the PSR will change the route connection between China, Europe and North America. This also proves the necessity of viewing the PSR’s impact on China from a global perspective rather than just focusing on China and Europe. The foreland network is also expanding northward. This may change the radiation range and cargo volume of CCCP, thereby changing their competitive positions. We further select a set of complex network indicators to describe and explain the evolution of the CCCP foreland network.
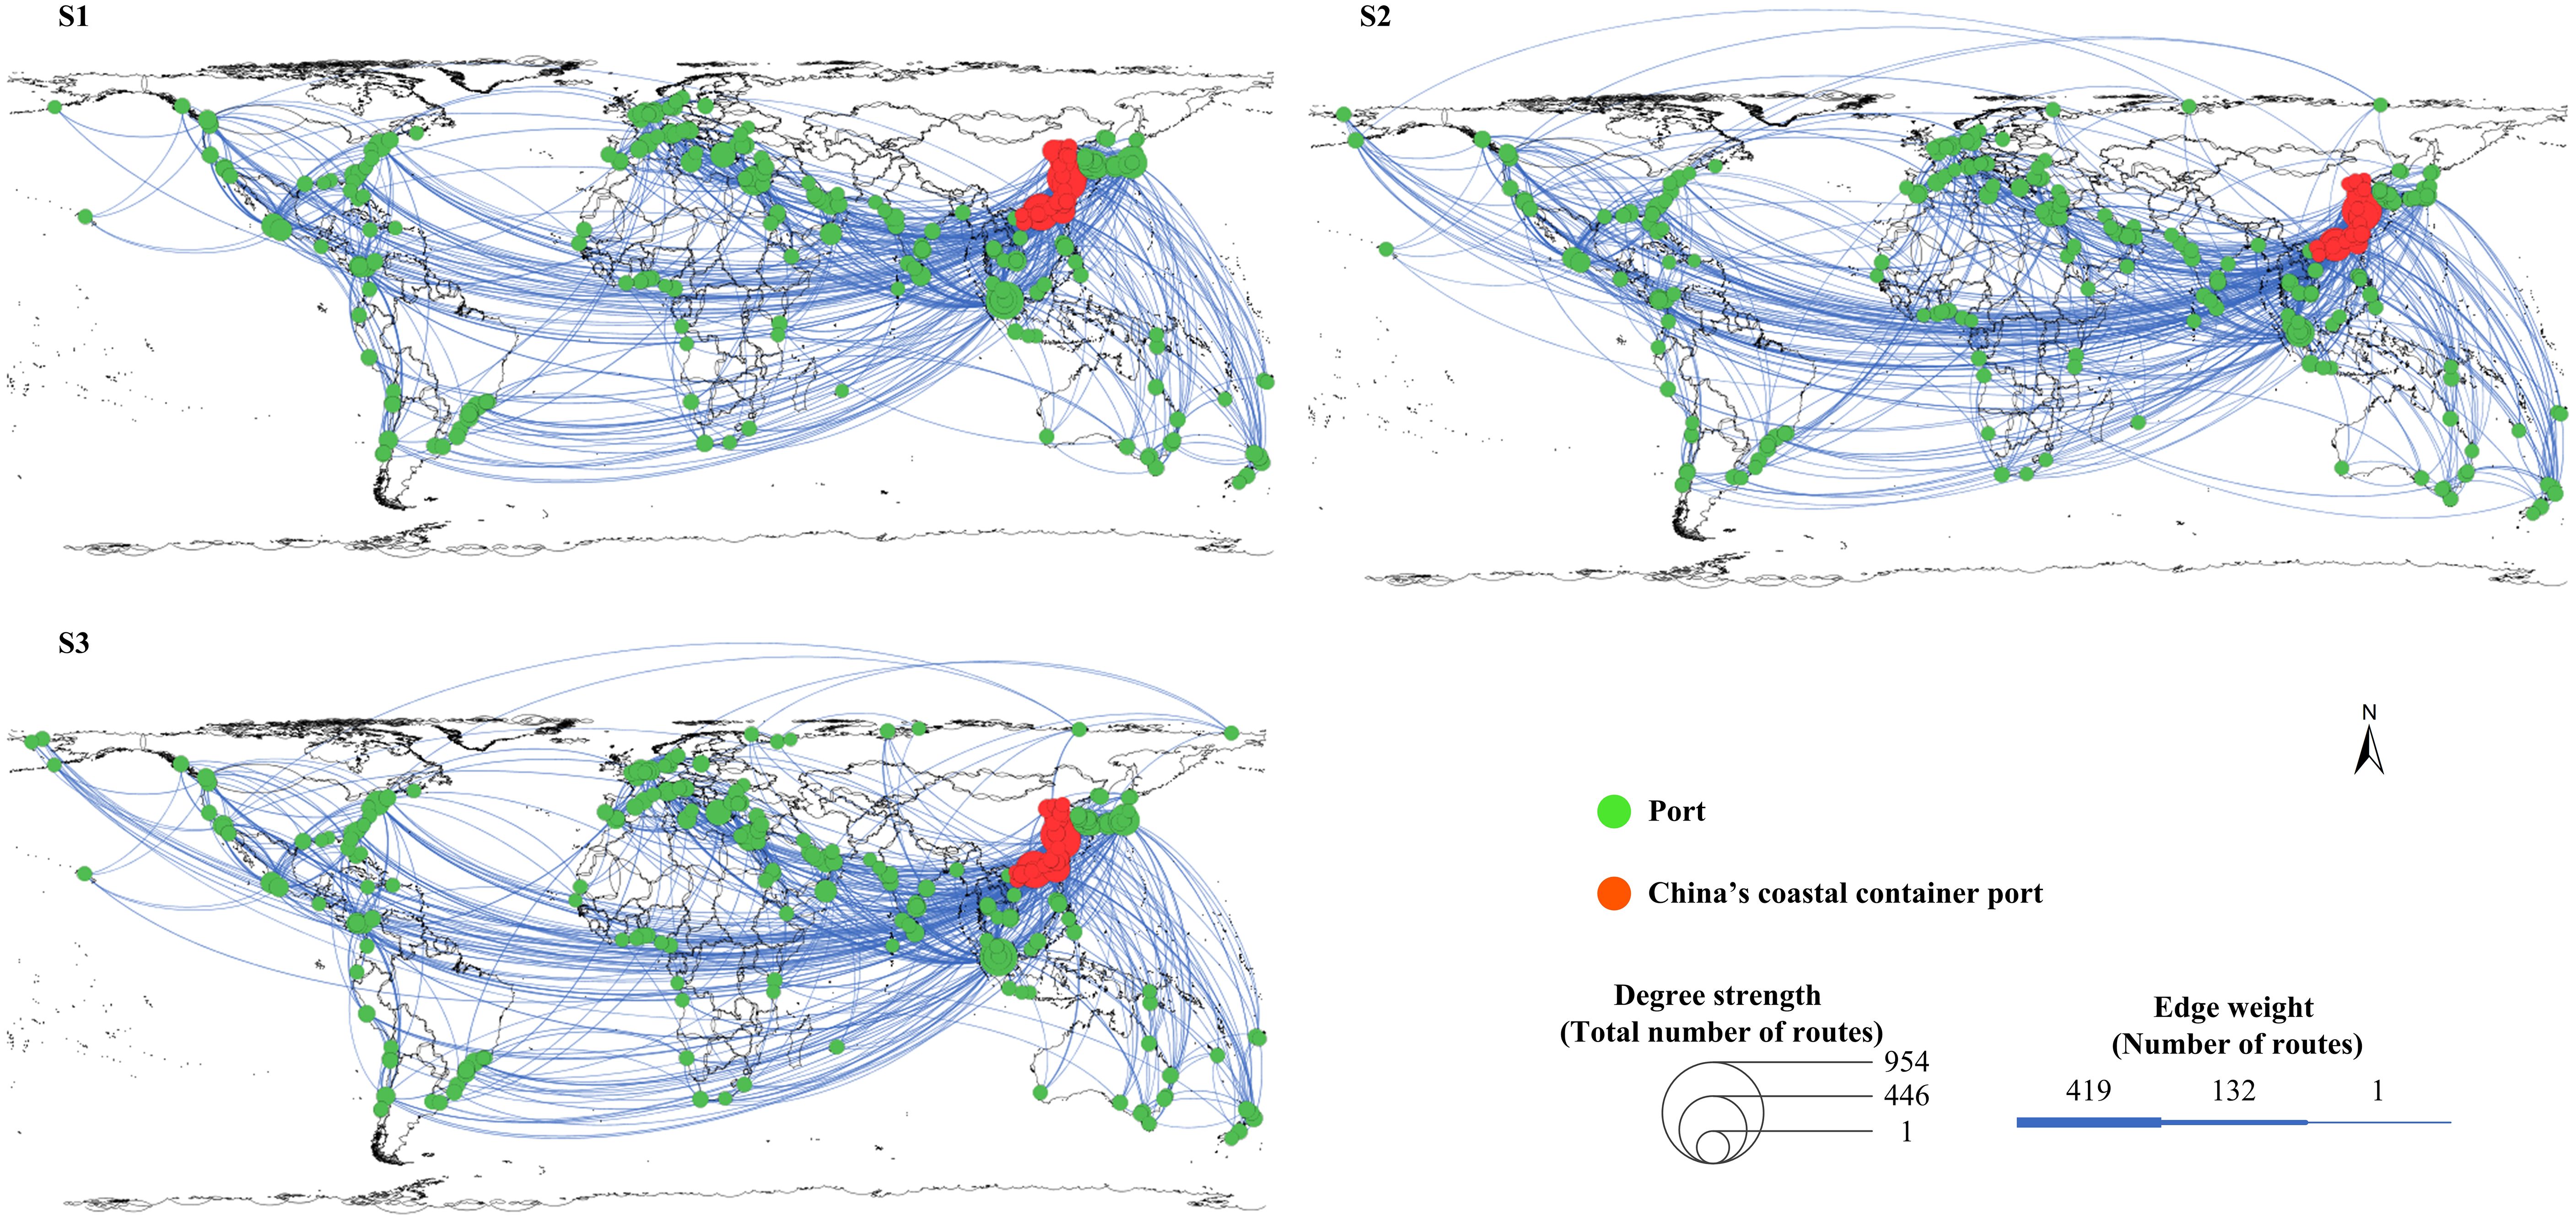
Figure 6. Evolution of CCCP foreland network.
Table 2 shows that the average degree and average degree strength are all increasing in S2. This finding can also explain why the graph density increases in S2. This network evolution trend was also presented in the research of Ding and Li (2020) and Guo et al. (2022b). The shortening of shipping distance brings opportunities for long-distance port connection and increases the attraction between the port and other ports within a larger geographical area, thus increasing the sea route connections. The increase in the number of sea routes enhances the connectivity of cargo circulation between ports and expands the geographical scope of cargo transportation in the foreland network. However, in S3, the newly added Arctic Ocean ports are in the development stage and have less connection with the ports in the original network, thereby lowering the average value of the network node connections. This situation also leads to a decrease in graph density in S3 and is not conducive to the efficiency of cargo transportation between ports and large-scale cargo transportation. Arctic Ocean ports need to enhance their infrastructure and transportation capacity to increase their attractiveness to the cargo sources of other ports and thus increase their sea route connections.
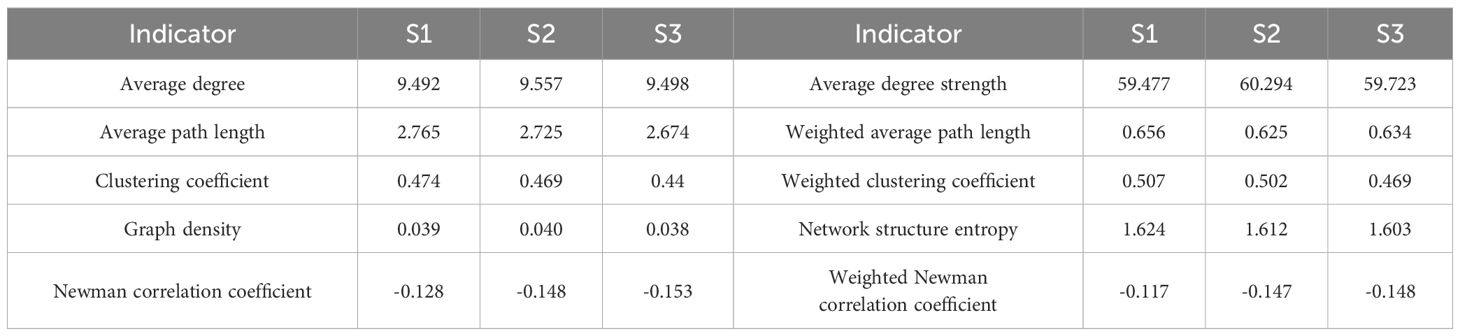
Table 2. Complex network indicators of the CCCP foreland network.
As an important indicator that reflects network connectivity, the average path length and weighted average path length in S2 and S3 are smaller than S1, indicating that the addition of PSR strengthens the broader freight connection between ports and improves maritime transport efficiency. The same results appeared in the research of Li et al. (2015) and Ding and Li (2020). The main reason is that the reduction in long-distance shipping costs is conducive to promoting cross-regional cargo circulation. However, although the average path length continues to decrease, the weighted average path length increases in S3. This increase indicates that the breadth of connections between ports (the number of connected ports) is increased, but the strength of connections (the number of routes) is decreased. The weaker overall strength of Arctic Ocean ports cannot attract more shipping companies to dock ships. Therefore, port connectivity does not improve as expected in S3.
The clustering coefficient and weighted clustering coefficient are decreasing. This result is supported by Li et al. (2015). The emergence of port clusters is one of the driving forces behind port networking and clustering. Given the limitation of shipping costs (shipping distance), the group of foreland networks is generally composed of ports in adjacent areas. After the addition of PSR, the reduction in shipping distance and the addition of Arctic Ocean ports continue to expand port connections within the region, and long-distance trade connections gradually increase. The PSR breaks the clustering of current foreland network, which loosens the structure of foreland network and may promote the formation of a series of new port groups across regions.
The network structure entropy shows a downward trend, indicating that the number of a few core ports with numerous connections is increasing, and the number of many marginal ports with a few connections is decreasing. The network is developing in an orderly direction. The main reason is that after the opening of PSR, the sea routes to Northern Europe will become more diverse and flexible. This opening not only expands the maritime connectivity of some ports but also enhances the connectivity between ports. More marginal ports are being absorbed into the port cluster, making the structural hierarchy of port network clearer.
The Newman correlation coefficient and weighted Newman correlation coefficient are less than 0, indicating that the foreland network is heterophilic. Ports with more routes tend to connect with ports with fewer routes, which is related to the hub-and-spoke structure of container liner transportation. The hub-and-spoke structure of containers has promoted the development of the maritime container transportation network and container hub ports and the transformation of maritime container transportation organisation. The Newman correlation coefficient and weighted Newman correlation coefficient are decreasing because the connections between small- and medium-sized ports and large ports are increasing. The PSR is expected to bring opportunities for the development of some small- and medium-sized ports. As presented in Li and Li (2014) and Guo et al. (2022b), the Arctic route will be beneficial in driving the peripheral ports of the Arctic region, thereby reshaping the shipping pattern in Northeast Asia.
Overall, the PSR’s addition to the CCCP foreland network will improve the shipping connectivity, increase the connection between long-distance ports, reshape the clustering groups, promote the orderliness of the network and help the development of small and medium-sized ports. This evolutionary trend will first enable China to enhance exchanges with other countries in politics, economy, society, culture and other fields through maritime transportation and promote China’s economic globalisation process. Secondly, the restructuring and orderliness of network clusters indicate that PSR may challenge the position of traditional shipping channels and have a decentralised effect on the world maritime trade system, giving rise to new collectivisation groups. Finally, the development of small and medium-sized ports will encourage peripheral regions to join global shipping and promote global economic integration.
4.2 Evolution of CCCP foreland under the PSR
4.2.1 Port type foreland
For detailed analysis, a division of forelands is desirable (Weigend, 1958). Almost no clear classification has been involved in the study of port foreland, which is not conducive to identifying and distinguishing the closeness and importance of the connection between different ports and China’s maritime trade. On the basis of the proposed complex network delineation method of port type foreland and combined with the data layering method, the port type foreland is divided into four new categories: closer, main, potential and marginal. Closer foreland indicates the ports that are most closely connected with CCCP. Main foreland constitutes the backbone of CCCP. Potential foreland has the potential to develop a closer trade relationship. Marginal foreland indicates that the trade connection between the port and CCCP is weak. The port foreland relies on the maritime network. The globalisation and efficient development trend of maritime networks have provided convenient and smooth channels for the global transportation of port cargos. By integrating into the global shipping network, the radiation range of port cargo is no longer limited to directly connected ports and regions, and the globalisation of cargo distribution, transit and warehousing has been achieved. Therefore, the division of the foreland in this study covers global ports to grasping the changes in the importance of CCCP’s different overseas markets under the PSR from a global perspective and developing adjustment strategies.
The basic distinction between hinterland and foreland lies in the type of carrier in which the merchandise arrives or leaves, such as coastal craft or seagoing ships (Weigend, 1958). Thus, in the analysis of port type foreland and country type foreland, we exclude CCCP. Considering the limitations of page space, Table 3 only shows the quantitative changes of different port type foreland types of Qingdao, Shanghai and Shenzhen, which are the representative container ports in the northern, central and southern coastal areas of China. The three ports have been amongst the top of China’s container throughput for many years and have extensive coverage of shipping routes. The results of all CCCP can be found in Appendix B. According to Table 3 and Appendix B, under different scenarios, the closer forelands are mainly concentrated in NEA, SEA, SA and WEA, which are geographically close to CCCP. A closer shipping distance is beneficial for reducing shipping costs and establishing transportation connections between these regions. A few of the closer forelands are distributed in NAEC and CCA, because these regions have international transit hub ports, such as Los Angeles and Manzanillo. The outward expansion of CCCP foreland depends on the close shipping links with these hub ports. The foreland types have changed more considerably in NEA, WEA, AP, NE, EM and CCA. The foreland type of ports in these regions shifts from low grade to high grade, such as transforming from the main foreland type to the closer foreland type. However, some ports in the NAEC, NAMG and NAWC undergo opposite changes, such as transforming from the main foreland type to the potential foreland type. This finding shows that the status of global ports for CCCP will change, and the PSR will break China’s maritime transport pattern. Notably, as the some ports’ main forelands, Murmansk and Provideniya along the Arctic Ocean will play an important role in China’s maritime trade.
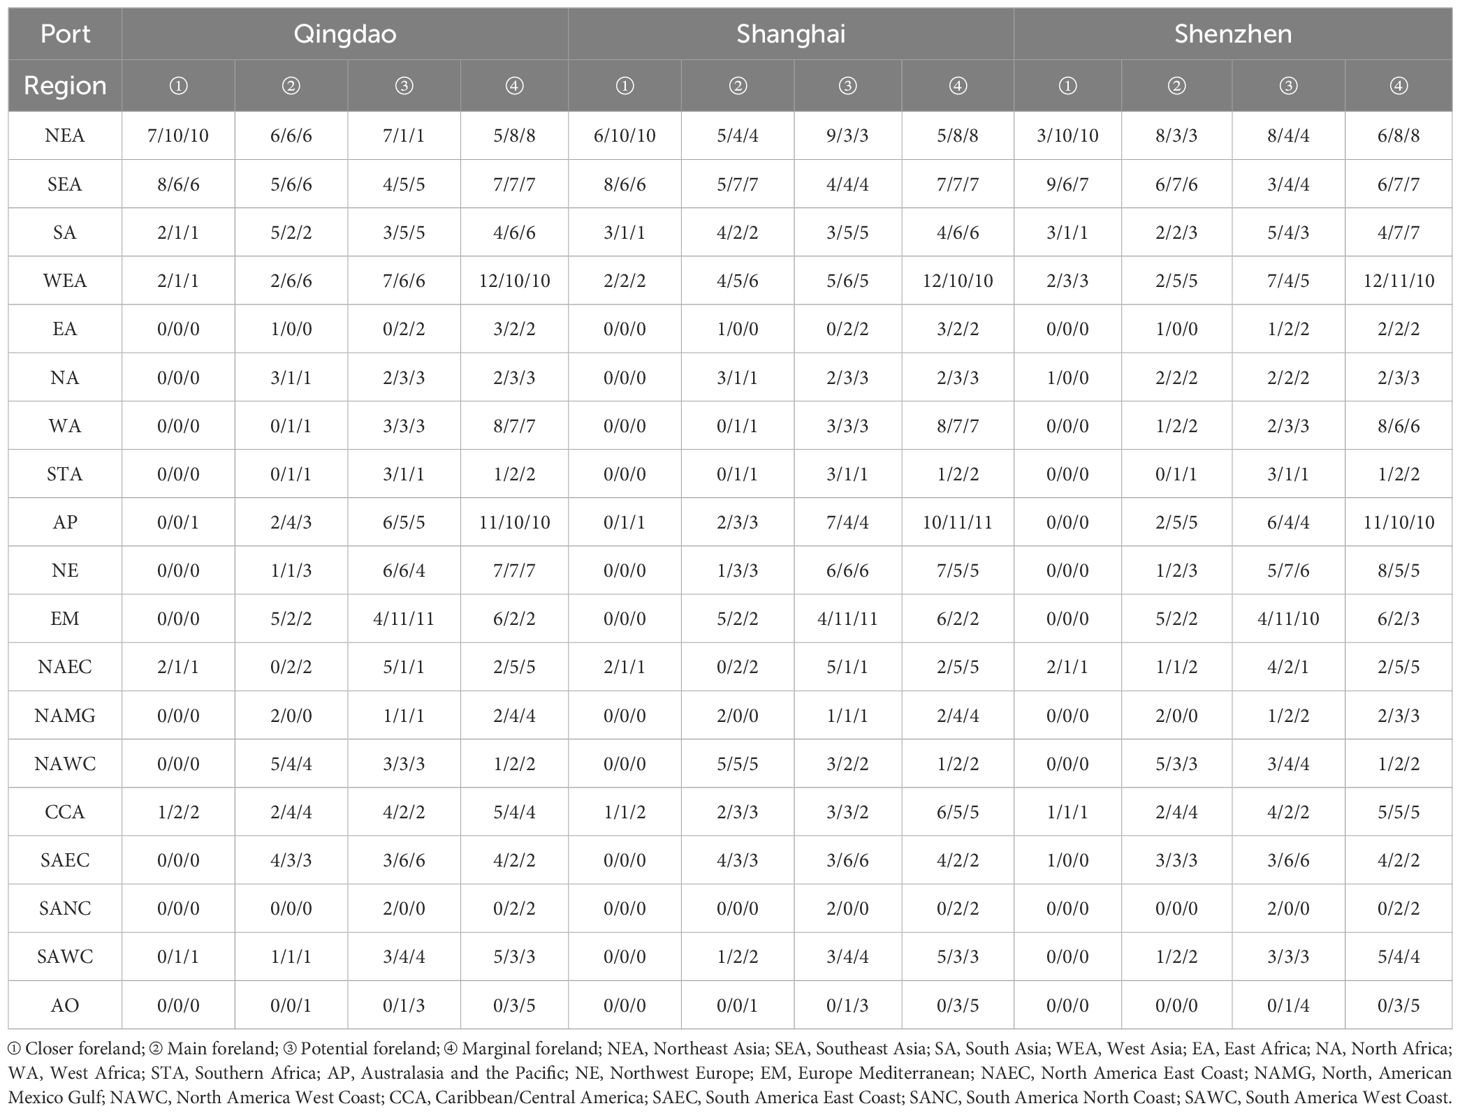
Table 3. Quantity changes of different foreland types in different shipping regions in S1/S2/S3 scenarios.
The driving forces behind the evolution of foreland types can be explored from the PFNE model. In this model, the change in fitness (Equation 14) under different scenarios is the core factor driving changes in the foreland pattern. The PSR’s addition will cause changes in distance, trade and other aspects of ports, which will alter the probability of ports being selected by shipping companies and lead to the reconstruction of foreland networks and changes in foreland types. We find that the changes in fitness values between S2 and S3 can be ignored. This change is also the reason that the pattern of foreland types in S3 does not show differences from that in S2. However, the fitness values of S2 undergo remarkable changes compared with S1 in some shipping regions. The regions with increased fitness values mainly include NE (+27.10%), NEA (+9.53%), SEA (+0.42%), and EM (+0.03%). This is the underlying reason for the shift in foreland types from low grade to high grade in shipping regions, such as Asia and Europe. Moreover, regions with increasing fitness will compete for other regions; hence, even if the fitness of North America and other regions remain almost unchanged, they will still be affected by the competition for maritime resources in Asia and other regions, causing the foreland type to change from high grade to low grade.
Figure 7A shows that the shipping regions with the closest connection with CCCP is the NAWC, and the region with the weakest connection is EA. Under the PSR (Figures 7B, C), the average path length of most ports has decreased. This finding shows that the PSR has a role in promoting the shipping efficiency between the CCCP and the world ports. The colour distribution (Figures 7B, C) representing the north–south geographical location of CCCP indicates that PSR has a more remarkable role in promoting the establishment of maritime connections between northern ports and world ports. From the average of all CCCP, the weighted average path lengths between the CCCP and SEA (-0.03), WEA (-0.04), EM (-0.08), NA (-0.03), NE (-0.12), WA (-0.11) and EA (-0.10) decrease more considerably (Figure 7B), indicating that the PSR will enhance the transportation efficiency and shipping links between CCCP and these regions, whilst the shipping links between CCCP and NAEC (+0.03), SANC (+0.02), and SAEC (+0.04) will be weakened. Tianjin, Lianyungang, and Guangzhou are the ports with the largest reduction in weighted average path length among the northern, central, and southern ports, respectively. In recent years, Tianjin has actively expanded container shipping routes and successfully attracted multiple shipping companies to open new routes at the port. The opening of PSR will further enhance the radiating and driving role of Tianjin’s northern international shipping hub, providing convenience for cargos from North China and Northwest China to directly reach the Europe through Tianjin. Lianyungang is an international hub port. The PSR will further enhance its status as the eastern bridgehead of the New Eurasian Continental Bridge. Guangzhou is the largest comprehensive hub port and container mainline port in southern China. The PSR may increase its radiation capability towards North China. Moreover, the weighted average path length of Arctic Ocean ports (Figure 7C) shows an increase, indicating that the five newly added ports (Arkhangelsk, Provideniya, Dikson, Pevek and Mezen) in S3 do not form a strong route connection. The Arctic Ocean ports need to address the construction of supporting facilities to play a key role in attracting the gathering of shipping routes effectively.
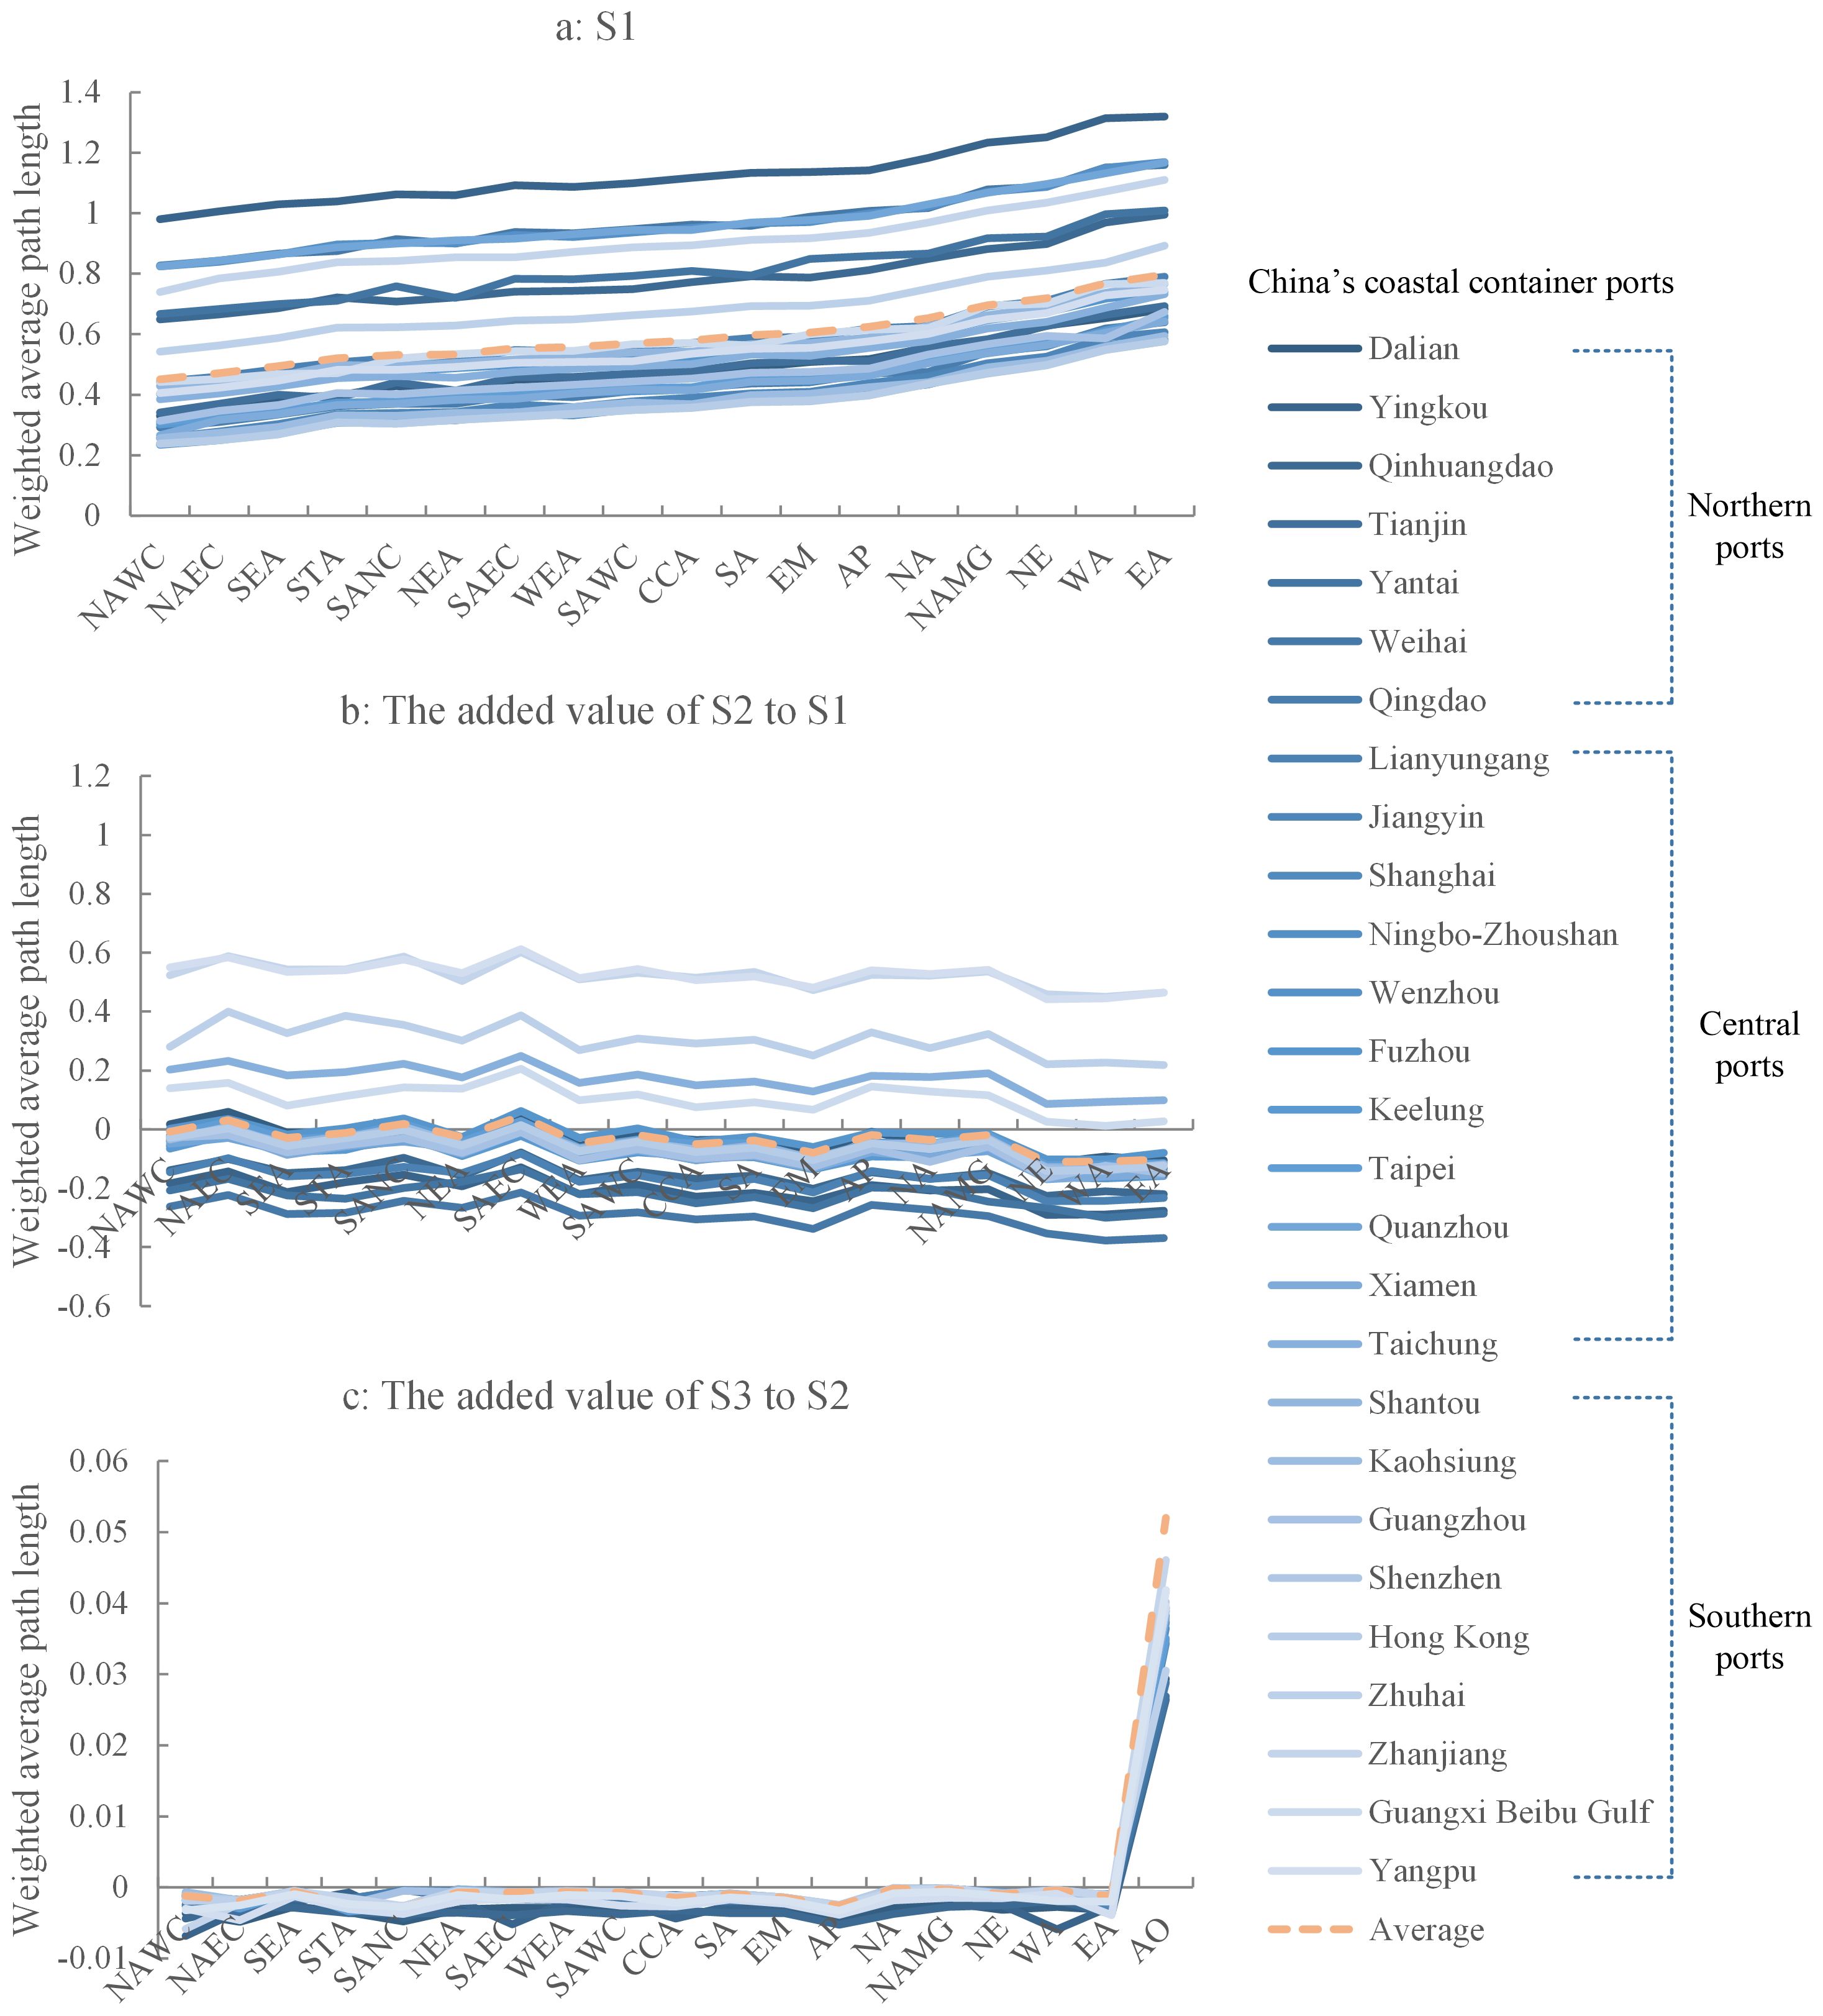
Figure 7. Weighted average path length of CCCP’s port type forelands in different shipping regions. (A) Weighted average path length in S1. (B) The added weighted average path length of S2 to S1. (C) The added weighted average path length of S3 to S2. NAWC, North America West Coast; NAEC, North America East Coast; SEA, Southeast Asia; STA, Southern Africa; SANC, South America North Coast; NEA, Northeast Asia; SAEC, South America East Coast; WEA, West Asia; SAWC, South America West Coast; CCA, Caribbean/Central America; SA, South Asia; EM, Europe Mediterranean; AP, Australasia and the Pacific; NA, North Africa; NAMG, North American Mexico Gulf; NE, Northwest Europe; WA, West Africa; EA, East Africa; AO, Arctic Ocean.
4.2.2 Country type foreland
Based on the classification method of port type foreland, the country type foreland are also divided into the same four categories—closer, main, potential and marginal—to reflect the status of different overseas markets in the marine trade development of CCCP. This is beneficial for positioning the target market and developing corresponding shipping strategies. As with the port type, closer foreland indicates the countries that are most closely connected with CCCP. Main foreland constitutes the backbone of CCCP. Potential foreland has the potential to develop a closer trade relationship. Marginal foreland indicates that the trade connection between the countries and CCCP is weak.
Table 4 still selects Qingdao, Shanghai and Shenzhen as the representative ports for displaying changes in the number of different country type foreland types. The results of all CCCP are shown in Appendix C. According to Table 4 and Appendix C, the closer forelands are distributed in Asia and Americas. Asia has a relatively close geographical advantage. The trade between China and the United States and Latin American countries is becoming increasingly close, involving the transportation of goods, such as household appliances, electronic products and spare parts. Active trade activities have promoted the economic development of both sides and strengthened maritime transportation connections. In S2 and S3, more European countries shift from potential or marginal forelands to closer or main forelands. This finding indicates that the trade links between CCCP and European countries will deepen. The increase in fitness values of European countries (+12.5%) after the PSR’s addition is the main force to driving the foreland type change.
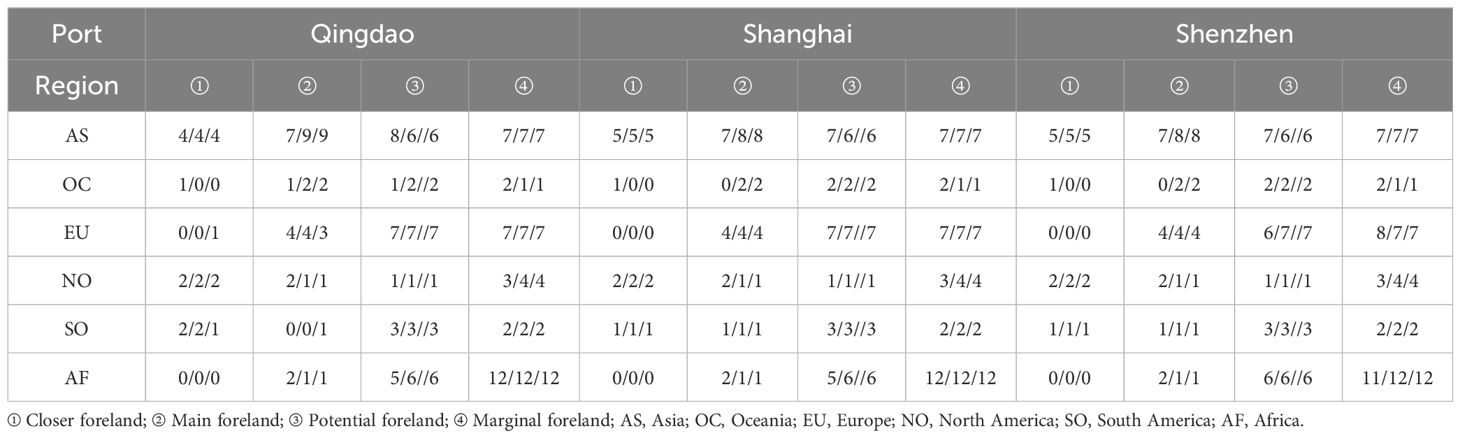
Table 4. Quantity changes of different foreland types in different continents in S1/S2/S3 scenarios.
Figure 8A shows that the shipping links between Asian and Oceanian countries and CCCP are the closest, and those in Africa are the weakest. After the PSR is added in S2 (Figure 8B), the average path length of most ports has decreased. The PSR is conducive to improving the shipping efficiency of CCCP. Amongst them, the weighted average path lengths between the CCCP’s average and Asia, Europe and Africa decrease considerably. Therefore, the importance of maritime transportation of these continents to CCCP will strengthen. The evolution results of port type foreland also reflect this phenomenon. The colour distribution of the line chart (Figures 8B, C) shows that the lengths of northbound ports decrease more. The PSR is more conducive to strengthening the shipping connection between northern ports and the world. However, Figure 8C shows an increase in weighted average path length, indicating that the addition of more Arctic ports with weak strength may not necessarily enhance the maritime connectivity between CCCP and the world.
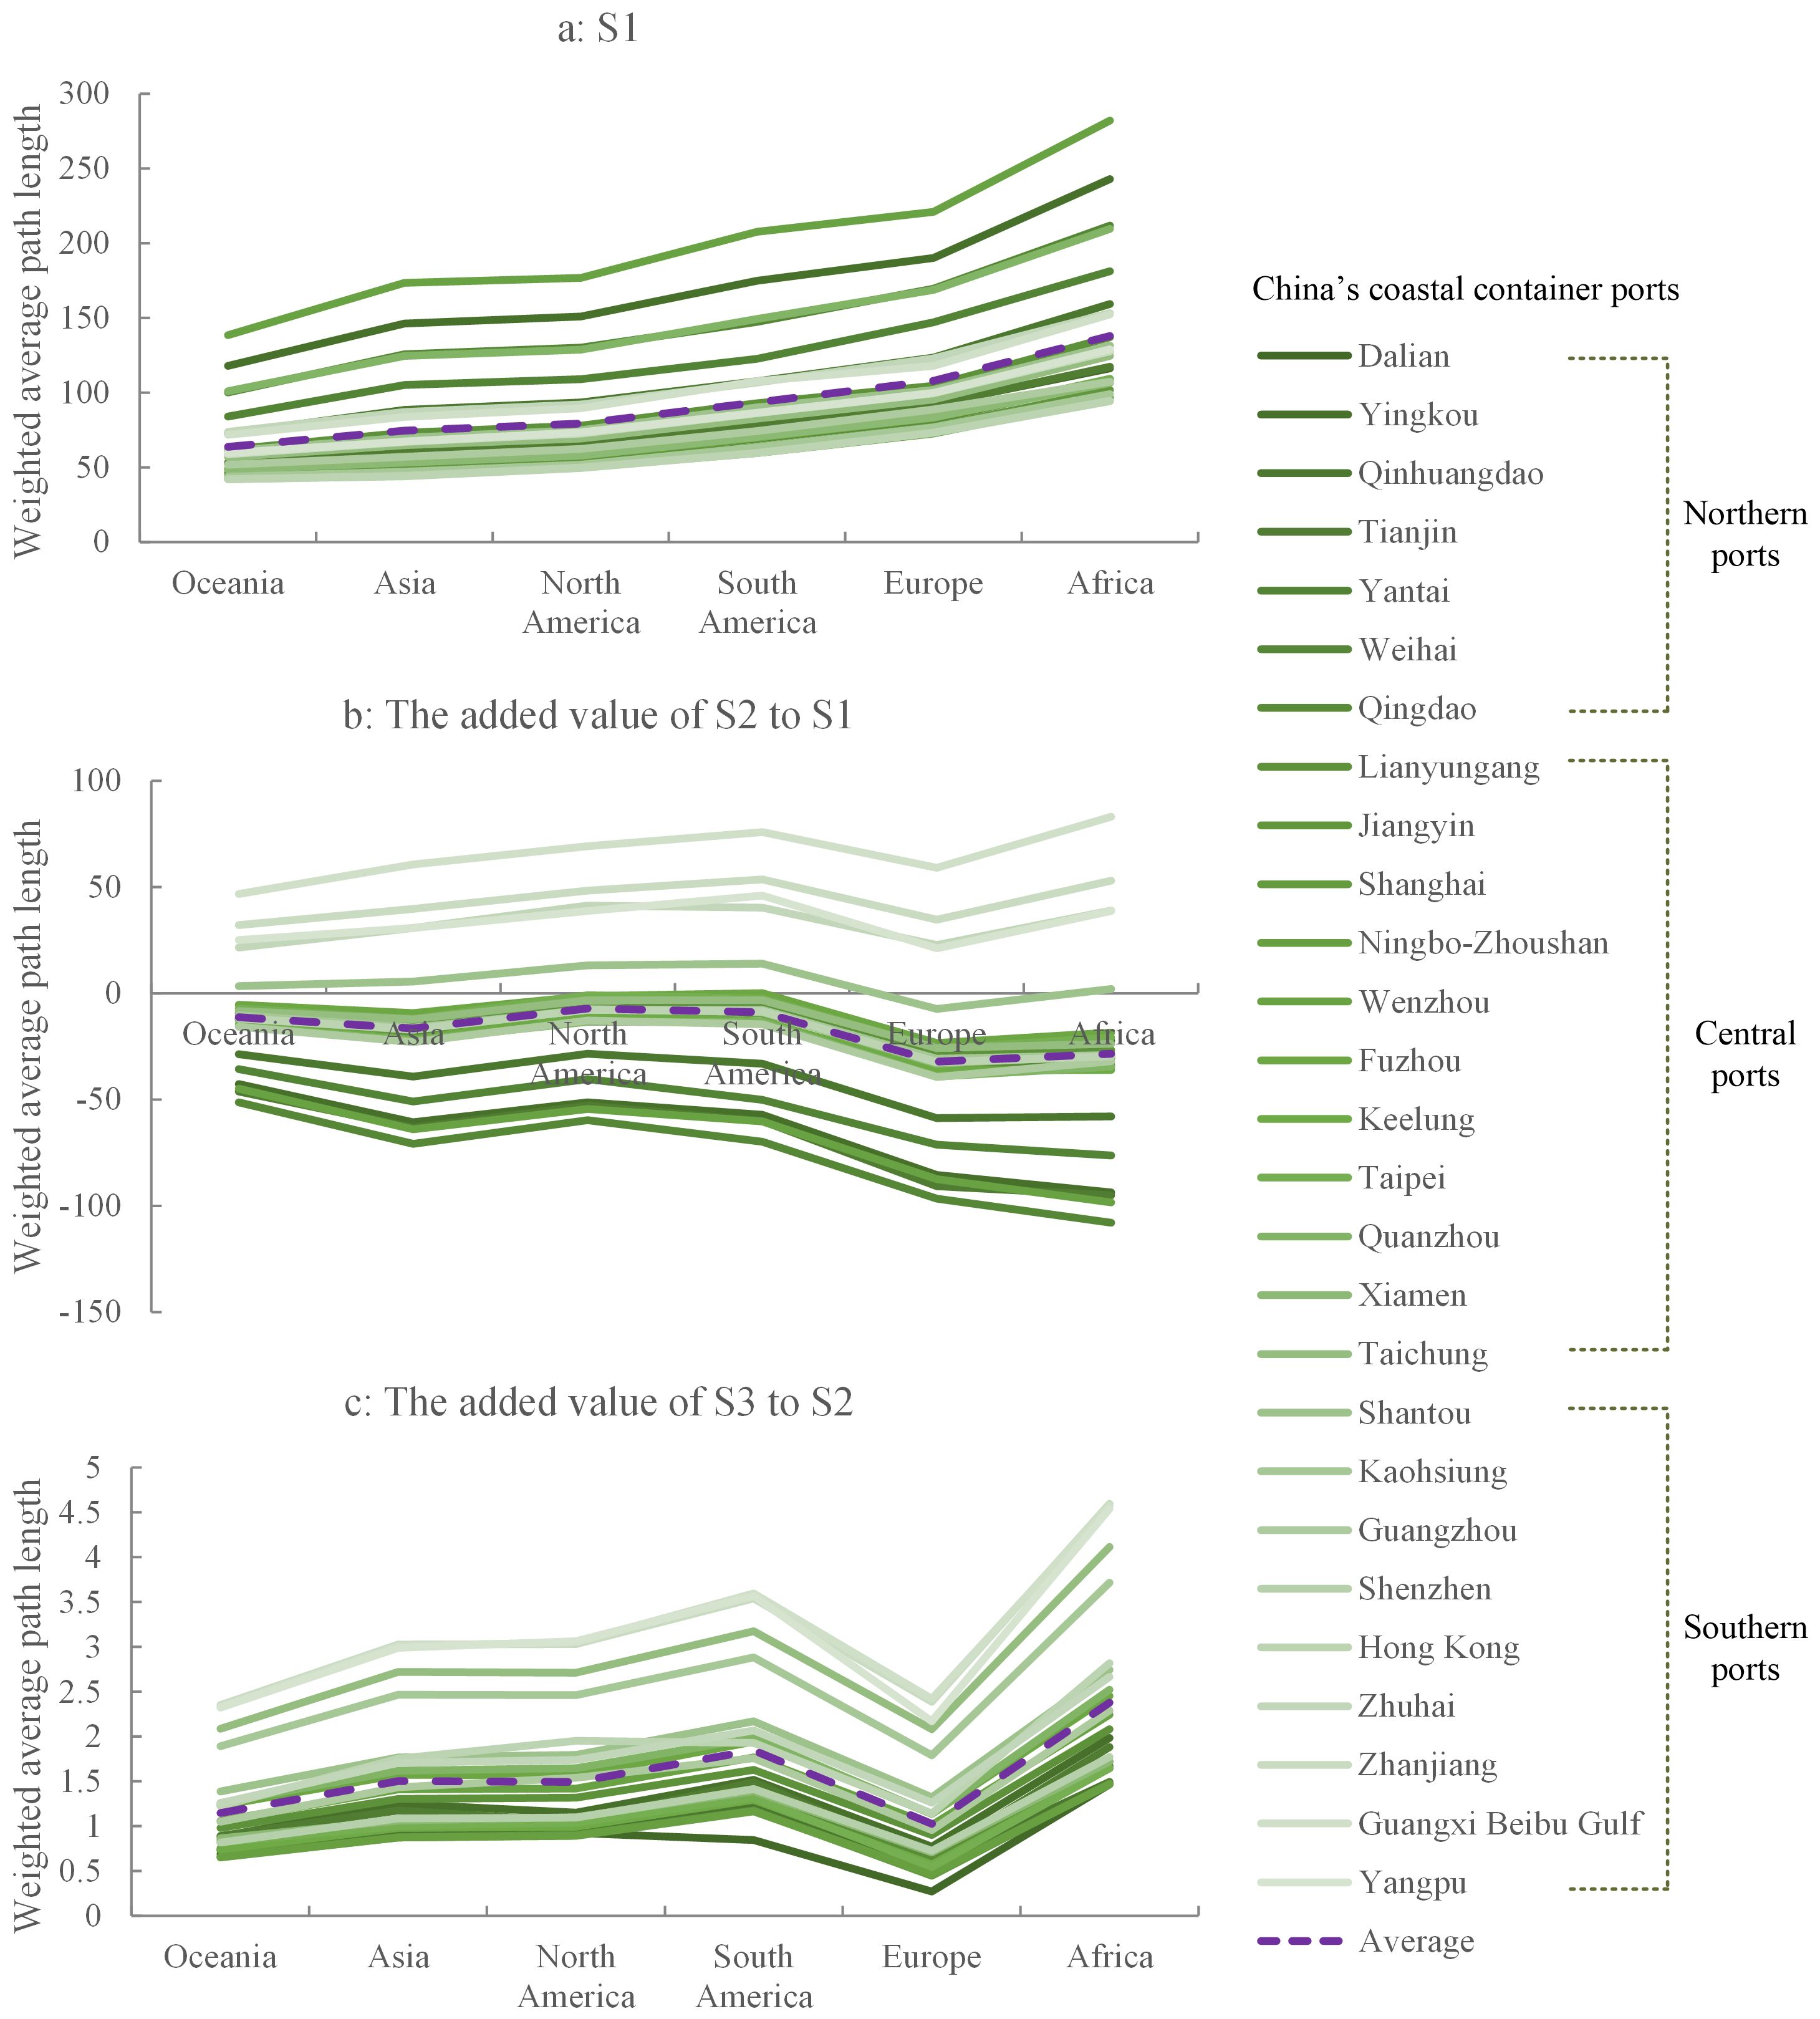
Figure 8. Weighted average path length of the three ports’ country type foreland in different continents. (A) Weighted average path length in S1. (B) The added weighted average path length of S2 to S1. (C) The added weighted average path length of S3 to S2.
A summary of the evolution results of CCCP foreland indicates that the shipping links between CCCP and Asia, Europe and Africa are enhanced, whilst the importance of the Americas for CCCP weakens. At present, no research has been conducted on the impact of PSR on CCCP’s foreland evolution, but relevant studies (Li et al., 2015; Ding and Li, 2020; Guo et al., 2022b) have recognised the role of the ASR in enhancing the status of ports in Asia and Europe. The impact of PSR/ASR on global shipping geography is mainly achieved by affecting the sea routes connecting the Asian and European markets. For Asian ports, if there is no demand for cargo loading and unloading, then the PSR/ASR to Europe is a more economical choice. This will improve the location conditions of ports in Asia and Europe.
Another important result is that China’s northern ports will have more favourable development opportunities. Compared with the transportation distance from ports to Europe on traditional shipping routes, container ships have a shorter and more remarkable advantage in traveling to Europe via the ASR, with a more considerable reduction in distance from ports north of the Yangtze River. Amongst the CCCP, the advantage of shipping from ports north of Shanghai to Europe is higher than that from ports south of Shanghai. Therefore, the opening of ASR(PSR) greatly increases the influence and core position of ports north of Shanghai in the foreland network (Wang and Zhang, 2014; Ding and Li, 2020; Guo et al., 2022b).
As the world’s second-largest economy, China plays an important role in the global shipping value chain, and China’s different coastal areas also undertake different marine transportation functions. The evolution of CCCP foreland will affect China and even global economic development strategy and industrial division in coastal areas. The increasing status of the Arctic region in maritime trade is also likely to change the existing global energy and resource supply pattern. The integration of Arctic affairs into the globalisation process will therefore also accelerate.
5 Discussion
Given that the foreland is regarded as the mirror of the hinterland (Weigend, 1958; Zohil and Prijon, 1999; Rodrigue, 2010; Jafari and Khosheghbal, 2013), the identities of the two can be converted to each other in reality. For example, the hinterland of Shanghai port may be the foreland of Busan port, and the hinterland of Busan port can also become the foreland of Shanghai port. We all recognise the hinterland’s collection and distribution function for cargo, and the foreland also has corresponding functions. Different types of foreland will affect the types of cargo, market share, and transportation efficiency of a port. Therefore, the land space of foreland is crucial for port development. This also reflects the significance of dividing the categories of port type foreland, especially country type foreland (representing a broader overseas market). This study divides the port foreland into specific ports and countries. However, in theory, the foreland can also be divided into cities and even smaller areas, similar to the division of the hinterland. Accurately depicting the port foreland is a worthwhile direction for research.
As a complex topological network, the port foreland network mainly reflects the spatial organisation of ports and shipping routes, and its evolution is a temporal manifestation of the changes in the interaction and combination relationship between ports and shipping routes (Zhao et al., 2014). Given that the formation, development and evolution of the foreland network is a complex process of social, economic and historical integration, we constructed the PFNE model and verified its effectiveness through numerical simulations. This indicates that the fitness of the node to be selected, the attached edge of the node, the Poisson distribution of edge weight and the reconnection and deletion between nodes have played a role in the evolution of the foreland network. Compared with the relatively single network evolution mechanisms, the PFNE model is closer to the generation law and evolution process of a real foreland network. As for PSR, the rise of a new sea route often comes with its economic significance. The effects of PSR on the foreland network are mainly achieved by affecting the maritime routes connecting the East Asian and European markets. Under the dual advantages of cost and time, stakeholders in the shipping industry will consider choosing PSR for transportation, profoundly impacting the port foreland network pattern.
We further apply the PFNE model to the foreland network of ports along the Maritime Silk Road (MSR) to test the external effectiveness of the model. The results (Table 5) show that the PFNE model can still simulate the foreland network in other regions. This result also indicates the universality of the generation law of port foreland network’s evolution. More importantly, the setting of fitness formula in the PFNE model determines that the attribute values of each port are the main factors affecting foreland network connectivity. For this purpose, we analyse the impact of different factor combinations on the network evolution results. As shown in Table 6, the classic factors that affect shipping companies’ port selection are set in model 1. These factors are directly related to container shipping. In models 2-4, we separately incorporate policy and trade factors. The results indicate that the addition of policy and trade will improve the accuracy (R2) of network evolution results. Basic port and shipping factors are no longer sufficient to explain the generation mechanism of shipping connections between ports. The external policy and trade factors need to be taken seriously. Meanwhile, we conduct a correlation analysis between the evolutionary networks of models 1–4 and model 5. The result shows that the correlations (R2) between networks are all above 0.9. This result indicates that the foreland evolution results obtained by using model 5 are robust. The research results are reliable, but the applicability of PFNE model is influenced by different factor combinations, which may interfere with the prediction performance to some extent. In future research, a more comprehensive factor framework must be established to reflect the evolution process of port foreland network to improve the model’s ability to predict and interpret real-world networks.
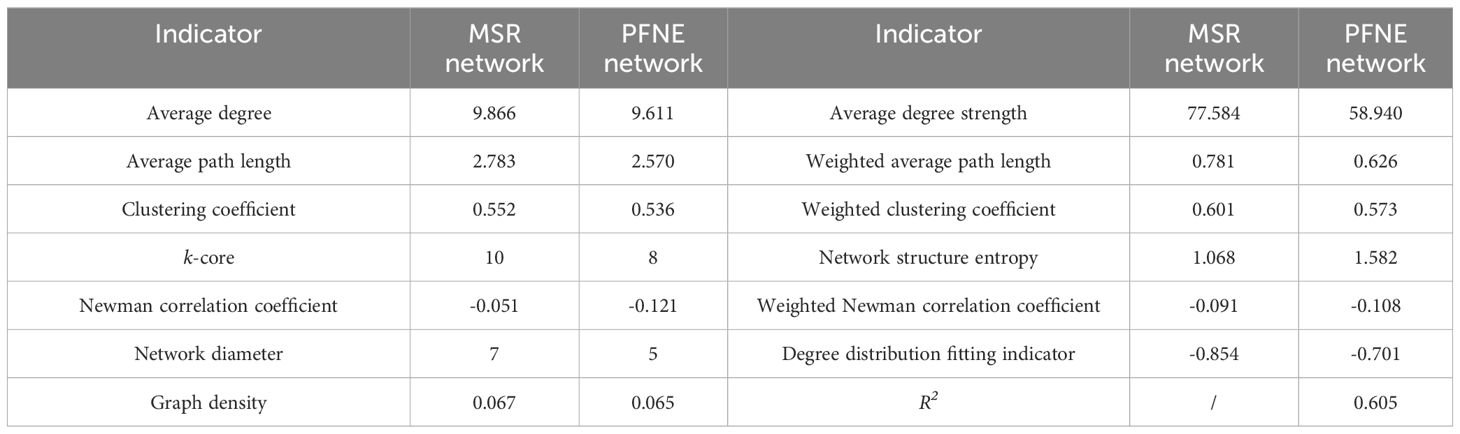
Table 5. Comparison of characteristic indicators among MSR network and PFNE network.
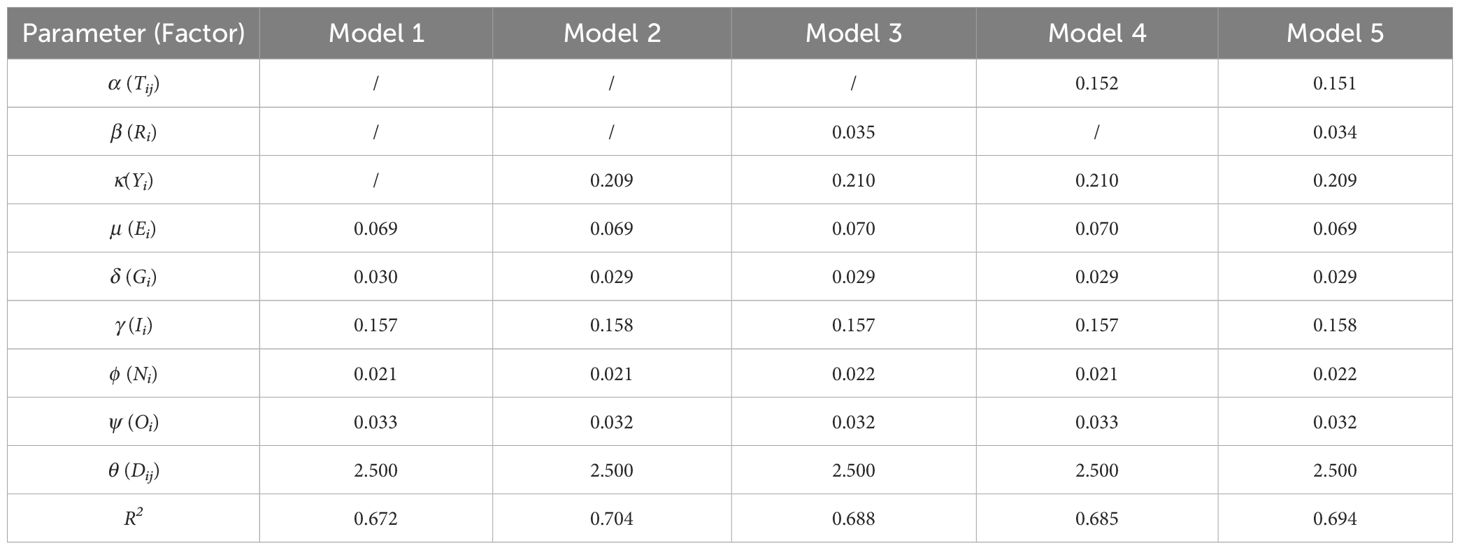
Table 6. The correlation between evolutionary networks and real networks under different factor combinations.
We find that under the PSR, the clustering coefficient and weighted clustering coefficient keep decreasing, and the network is developing in an orderly direction, different from the research results of Ding and Li (2020). This result is mainly attributed to Ding and Li (2020) studying the global foreland network, while the CCCP foreland network—an important sub-network of the global network—is our focus. The CCCP foreland network is centred around important ports in Asia and Europe, different from the global multi-core network structure. Given the differences in economic development, port strength and trade connections among maritime network groups, targeted research is needed on the impact of Arctic routes on different port foreland networks.
Our results show that the PSR may break China’s existing maritime transport pattern and the status of different overseas markets will change, which will be mainly reflected in the enhanced shipping links between CCCP and Asia, Europe and Africa, while the importance of the Americas for CCCP weaken. This situation will affect China’s economic development strategy and industrial division in coastal areas. The government should adjust the economic development strategy in a timely manner and coordinate the development of coastal industrial clusters to cultivate a coastal industrial distribution with accurate positioning, reasonable division of labour, prominent focus and efficient operation. The development and utilisation of PSR have also raised new requirements for China’s land–sea intermodal transport capacity and logistics industry. China should vigorously promote the construction of a modern collection and distribution system and a comprehensive transportation system, continuously enhance the radiation capacity to surrounding areas and use the function of a comprehensive transportation hub to drive the in-depth expansion of container transportation network to the sea. Another result shows that the PSR has a more obvious role in promoting the establishment of maritime links between China’s northern ports and the world ports. Similar conclusions are also drawn in the research of Li et al. (2014); Li and Hu (2015) and Peng et al. (2021; 2022a; 2022b). Therefore, the northern ports need to accelerate research on the Arctic shipping centre, strengthen the construction of infrastructure and collection and distribution capacity and prepare for further improvements in the port layout and for undertaking the outward transportation of cargo from the Arctic and the diversion of cargo from the south. They can also build a strategic alliance with the central ports, rationally allocate port and shipping resources, and form a coordinated development pattern in which each port has complementary advantages and supports each other. Compared with the northern and central ports, the southern ports are at an obvious disadvantage in terms of geographical location and weak development potential. For them, the most important thing is to balance the relationship between the PSR and traditional routes, clarify their positioning in the foreland network and promote the expansion of the foreland through the cost advantage brought by the transport scale effect.
6 Conclusion
This paper constructs and verifies the effectiveness of the PFNE model and presents a complex network delineation method of port foreland. Based on this, combined with three evolutionary scenarios, we explore the potential effects of PSR on the global foreland network, port type foreland and country type foreland’s evolution of CCCP. The following conclusions are drawn.
PSR’s addition to the CCCP foreland network will improve the shipping connectivity, increase the connection between long-distance ports, reshape the clustering groups, promote the orderliness of the network and help the development of small and medium-sized ports.
The results of port type foreland and country type foreland show that the PSR may break China’s global maritime transport pattern and the status of different overseas markets will change, which will be mainly reflected in the shipping links between CCCP and Asia, Europe and Africa being enhanced and importance of the Americas for CCCP weakening. Thus, viewing the PSR’s effects on China from a global perspective rather than just focusing on China and Europe is necessary. And the PSR has a more obvious role in promoting the establishment of maritime links between China’s northern ports and the world ports. Northern ports will also compete for the shipping resources of the central and southern ports, and the southern ports will face greater competitive pressure.
As discussed in Section 5, this study has some limitations and deficiencies. Firstly, this study divides the port foreland into specific ports and countries, but the division remains rough. A more precise delineation of the port foreland is a worthwhile research direction. Secondly, the construction of PSR involves various aspects, such as geopolitical games and the development and utilisation of natural resources. Therefore, the PSR not only promotes the evolution of the global shipping pattern but also brings diverse impacts on international geopolitics, geopolitical security and environmental protection. In the future, a more comprehensive factor framework must be established to reflect the evolution of port foreland network under the influence of the dynamic influence of multiple factors to improve the PFNE model’s ability to predict and interpret real-world networks. Finally, given the differences in economic development, port strength and trade connections amongst port network clusters, specialised research on the evolution of global and different port foreland networks facing the PSR, which is conducive to a more comprehensive analysis of the impact of PSR on global shipping, must be conducted.
Data availability statement
The original contributions presented in the study are included in the article/Supplementary Material. Further inquiries can be directed to the corresponding author.
Author contributions
YP: Conceptualization, Methodology, Writing – original draft. DD: Project administration, Writing – review & editing. XZ: Data curation, Software, Writing – review & editing. XW: Data curation, Writing – review & editing.
Funding
The author(s) declare that financial support was received for the research, authorship, and/or publication of this article. This work was supported by the National Key Research and Development Program of China (grant number 2023YFB3906700); National Natural Science Foundation of China (grant number 42301194, 42301195); China Postdoctoral Science Foundation (grant number 2023M741179); Projects of Soft Science Research of Shanghai (grant number 24692104500).
Conflict of interest
The authors declare that the research was conducted in the absence of any commercial or financial relationships that could be construed as a potential conflict of interest.
Publisher’s note
All claims expressed in this article are solely those of the authors and do not necessarily represent those of their affiliated organizations, or those of the publisher, the editors and the reviewers. Any product that may be evaluated in this article, or claim that may be made by its manufacturer, is not guaranteed or endorsed by the publisher.
Supplementary material
The Supplementary Material for this article can be found online at: https://www.frontiersin.org/articles/10.3389/fmars.2024.1436552/full#supplementary-material
References
Barrat A., Barthélemy M., Vespignani A. (2004). Modeling the evolution of weighted networks. Phys. Rev. E Stat. Nonlinear Soft Matter. Phys. 70, 066149.
Bekkers E., Francois J. F., Rojas-Romagosa H. (2018). Melting ice caps and the economic impact of opening the Northern Sea Route. Econ. J. 128, 1095–1127.
Cai M. (2019). The ‘Ice Silk Road’ opens up a new shipping and logistics system in the Northern Hemisphere. Maritime China 7), 60–61 + 11.
Chang Y., Lee S. Y., Tongzon J. L. (2008). Port selection factors by shipping lines: different perspectives between trunk liners and feeder service providers. Mar. Policy 32, 877–885.
Chen S. (2018). Feasibility analysis of China and Russia jointly building the ‘Ice Silk Road’. Border Econ. Culture 2), 24–25.
Ding C., Li Z. (2018). Research on distribution mechanism of value flow of seaborne cargoes. Int. Econ. Trade Res. 34, 31–44.
Ding C., Li Z. (2020). Research on the shipping network structure under the influence of Arctic routes. GeoJournal 87, 1027–1045.
Ding C., Li Z., Chen X., Shi X. (2022). The evolution and competition patterns of shipping networks under the influence of an Arctic route system. Maritime Policy Manage. 49, 510–527.
Ducruet C., Lee S. W., Ng A. K. Y. (2010). Centrality and vulnerability in liner shipping networks: revisiting the Northeast Asian port hierarchy. Maritime Policy Manage. 37, 17–36.
Ducruet C., Roussin S. (2007). The changing relations between foreland and hinterland at North Korean ports, (1985-2006). 6th Inha & Le Havre International Conference, Inha University, Incheon, Republic of Korea, October 10-11. 10, 349–362.
Ducruet C., Wang L. (2018). China’s global shipping connectivity: internal and external dynamics in the contemporary era, (1890–2016). Chin. Geogr. Sci. 28, 202–216.
Elliott N. R. (1969). Hinterland and foreland as illustrated by the Port of Tyne. Trans. Institute Br. Geographers 47), 153–170.
Freeman L. C. (1979). Centrality in social networks conceptual clarification. Soc. Netw. 1, 215–239.
Geng J., Ji Q., Fan Y. (2014). A dynamic analysis on global natural gas trade network. Appl. Energy 132, 23–33.
Guan X., Li Z., Chen Z., Ding C. (2020). Research on the economic effect of “Polar Silk Road” on China and Arctic countries based on GTAP Model. J. Phys.: Conf. Ser. 1634, 012064.
Guerrero D. (2014). Deep-sea hinterlands: Some empirical evidence of the spatial impact of containerization. J. Transport Geogr. 35, 84–94.
Guo J., Guo S., Lv J. (2022b). Potential spatial effects of opening Arctic shipping routes on the shipping network of ports between China and Europe. Mar. Policy 136, 104885.
Guo J., Wang Z., Yu X. (2022a). Accessibility measurement of China’s coastal ports from a land-sea coordination perspective - An empirical study. J. Transport Geogr. 105, 103479.
Guy E., Urli B. (2006). Port selection and multicriteria analysis: an application to the Montreal-NewYork alternative. Maritime Econ. Logistics 8, 169–186.
Ha Y. S., Seo J. S. (2014). The Northern Sea Routes and Korea’s trade with Europe: Implications for Korea’s shipping industry. Int. J. e-Navigation Maritime Econ. 1, 73–84.
Hao D., Chu T. (2021). The reconstruction of China’s economic geography by the construction of the Polar Silk Road. Soc. Sci. Res. 3), 41–50.
Hong N. (2012). The melting Arctic and its impact on China’s maritime transport. Res. Transport. Econ. 35, 50–57.
Jafari H., Khosheghbal B. (2013). Studying seaport’s hinterland-foreland concepts and the effective factors on their development. Int. Res. J. Appl. Basic Sci. 4, 1039–1046.
Lam J., Dai J. (2012). A decision support system for port selection. Transport. Plann. Technol. 35, 509–524.
Leung C. C., Chau H. F. (2007). Weighted assortative and disassortative networks mode. Physica A 378, 591–602.
Li Z., Han C., Liang S., Chen X. (2021). The academic evolution from the Arctic Shipping Routes to ‘Polar Silk Road’. J. Beijing Jiaotong Univ. (Social Sci. Edition) 20, 78–89.
Li Z., Hu M. (2015). A review: Potential economic strategic value of the ‘Arctic Passage’. Mar. Econ. 5, 12–18.
Li Z., Jiang S., Xu M., Shi Y., Zhang X. (2015). On the shipping network evolution under the arctic route. Complex Syst. Complexity Sci. 12, 55–60.
Li Z., Li Y. (2014). The impact of the arctic route on the global shipping network. World Regional Stud. 23, 1–9.
Li Z., Peng Y. (2019). Research on the of connection power theory and the construction of the supraglacial silk road. J. Northeast Normal Univ. (Philosophy Soc. Sci.) 4), 23–32.
Li J., Zhan L., Ma P. (2014). The strategic vision of China’s developing the Northern Sea Route. J. Dongbei Univ. Finance Econ. 2), 43–51.
Martínez-Moya J., Feo-Valero M. (2020). Measuring foreland container port connectivity disaggregated by destination markets: An index for Short Sea Shipping services in Spanish ports. J. Transport Geogr. 89, 102873.
Melia N., Haines K., Hawkins E. (2016). Sea ice decline and 21st century trans-Arctic shipping routes. Geophys. Res. Lett. 43, 9720–9728.
Mou N., Wang C., Yang T., Ren H., Zhang L., Xu H., et al. (2022). Spatiotemporal patterns of maritime trade between China and Maritime Silk Road: Evidence from a quantitative study using social network analysis. J. Transport Geogr. 102, 103387.
Ng A. S. F., Sun D., Bhattacharjya J. (2013). Port choice of shipping lines and shippers in Australia. Asian Geographer 30, 143–168.
Notteboom T., Rodrigue J.-P. (2005). Port regionalization: towards a new phase in port development. Maritime Policy Manage. 32, 297–313.
Peng Y., Li Z., Duan W., Li X., Bao Q. (2021). Evolution of the hinterlands of eight Chinese ports exporting to europe under the Polar Silk Road: Three hypothetical scenarios. Ocean Coast. Manage. 205, 105549.
Peng Y., Li Z., Zhang X., Qi B., Li X. (2022a). Prediction on freight function structure of China’ s coastal ports under the Polar Silk Road: a cargo attraction potential perspective. Eurasian Geogr. Econ. 63, 147–179.
Peng Y., Zhang X., Li Z., Du D. (2022b). Evolution of freight spatial pattern of China’s coastal ports facing the Polar Silk Road. Res. Transport. Business Manage. 45, 100900.
Pittel B. (1996). Sudden emergence of a giant k-core in a random graph. J. Combinatorial 67, 111–151.
Rimmer P. J. (1977). A conceptual framework for examining urban and regional transport needs in South-East Asia. Pacif. Viewpoint 18, 133–147.
Robinson R. (1970). The hinterland-foreland continuum: concept and methodology. Prof. Geographer XXII, 307–310.
Rodrigue J. P., Notteboom T. E. (2010). Foreland-based regionalization: integrating intermediate hubs with port hinterlands. Res. Transport. Econ. 27, 19–29.
Sen P., Dasgupta S., Chatterjee A., Sreeram P. A., Mukherjee G., Manna S. S. (2003). Small-world properties of the Indian railway network. Phys. Rev. E Stat. Nonlinear Soft Matter. Phys. 67, 036106.
Seoane M. J. F., Laxe F. G., Montes C. P. (2013). Foreland determination for containership and general cargo ports in Europe, (2007–2011). J. Transport Geogr. 30, 56–67.
Talley W. K., Ng M. (2013). Maritime transport chain choice by carriers, ports and shippers. Int. J. Prod. Econ. 142, 311–316.
Theocharis D., Pettit S., Rodrigues V. S., Haider J. (2018). Arctic shipping: A systematic literature review of comparative studies. J. Transport Geogr. 69, 112–128.
United Nations Conference on Trade and Development (2023). Available online at: https://unctadstat.unctad.org/wds/TableViewer/tableView.aspx (Accessed 20 March 2023).
Wang C. (2008). International reorganization of shipping liners and its effect on world network structure. World Regional Stud. 1), 94–104 + 118.
Wang Z., Chen Y. (2018). China and Russia’s collaboration in constructing the Supraglacial Silk Road: opportunities and challenges. Northeast Asia Forum 27, 17–33 + 127.
Wang C., Ducruet C. (2011). Theoretical model of container port system and its empirical research in Yangtze River Delta. Geogr. Res. 30, 397–409.
Wang W., Gong J., Lin Z. (2021). Structural characteristics of trade network in countries along the ‘Polar Silk Road’. Trop. Geogr. 41, 1199–1208.
Wang D., Li B. L. (2013). An evolving port network model with scale-free feature. J. Shenyang Univ. (Natural Sci.) 25, 379–382 + 388.
Wang W., Li Z. (2019). Spatial evolution of coal transportation network of China. J. Traffic Transport. Eng. 19, 166–177.
Wang J., Li X., Wang X. B. (2013). Complex network evolution of different scale shipping based on improved BA model. J. Transport. Syst. Eng. Inf. Technol. 13, 103–110.
Wang D., Li Z., Zhang Y. (2014). Influence of arctic waterway opening on China’s shipping industry. Navigation China 37, 141–145.
Wang J. J., Ng A. K. (2011). The geographical connectedness of Chinese seaports with foreland markets: a new trend. Tijdschrift Voor Economische En Sociale Geografie 102, 188–204.
Wang D., Zhang H. (2014). Impact of the Arctic Passage’s opening on Chinese northern ports and China’s response. China Soft Sci. 3), 16–31.
Wang H., Zhang Y., Meng Q. (2018). How will the opening of the Northern Sea Route influence the Suez Canal Route? An empirical analysis with discrete choice models. Transport. Res. Part A: Policy Pract. 107, 75–89.
Wang L., Zhu Y. (2017). The evolution of China’s international maritime network based on the ‘21st Century Maritime Silk Road’. Acta Geographica Sin. 72, 2265–2280.
Watts D. J., Strogatz S. H. (1998). Collective dynamics of ‘small-world’ networks. Nature 393, 440–442.
Weigend G. G. (1956). The problem of hinterland and foreland as illustrated by the port of Hamburg. Econ. Geogr. 32, 1–16.
Wu K., Tseng M., Ali M. H., Xue B., Chiu A. S. F., Fujii M., et al. (2021). Opportunity or threat in balancing social, economic and environmental impacts: The appearance of the Polar Silk Road. Environ. Impact Assess. Rev. 88, 106570.
Wu D., Wang N., Wu N., Lin W. (2017). The impact of main channel interruption on vulnerability of container shipping network and China container shipping. Geogr. Res. 36, 719–730.
Xu M. (2016). Complexity in the global container shipping network: regions, ports, and flows (Dissertation, Dalian Maritime University: Dalian, China).
Xu M., Li Z., Shi Y., Zhang X., Jiang S. (2015). Evolution of regional inequality in the global shipping network. J. Transport Geogr. 44, 1–12.
Xue G. (2018). The new strategy of ‘Polar Silk Road’ and its implementation path. Frontiers 21), 62–67.
Yang J. (2018). The international environment for building the ‘Polar Silk Road’ and China’s response. Frontiers 11, 13–23.
Yu D. G. (2009). Study of express freight transportation network topology structure based on complex network theory (Dissertation, Beijing Jiaotong University: Beijing, China).
Zhang T., Chen X. (2018). China and Russia to build the ‘Silk Road on Ice’ pivot point port research. Contemp. World 436, 60–65.
Zhang Y., Meng Q., Ng S. H. (2016). Shipping efficiency comparison between Northern Sea Route and the conventional Asia-Europe shipping route via Suez Canal. J. Transport Geogr. 57, 241–249.
Zhao Y. Z., Peng Y. N., Kuang H. B. (2014). Fitness BA model of container shipping network under the ecological vision. Operations Res. Manage. Sci. 23, 266–273.
Zhu M., Ping Y., He S. (2015). Analysis of the strategic value of the Arctic Sea Route from the perspective of the world economic and trade pattern. Ocean Dev. Manage. 32, 1–5.
Zhu L., Zhang J. (2018). Feasibility of the ‘Ice Silk Road’ initiative and its influence on China-Russia relationship. Theory Res. 7), 65–67.
Keywords: Polar Silk Road, port foreland, port foreland network, complex network theory, scenario simulation
Citation: Peng Y, Du D, Zhang X and Wang X (2024) Potential effects of Polar Silk Road on the global foreland evolution of China’s coastal container ports. Front. Mar. Sci. 11:1436552. doi: 10.3389/fmars.2024.1436552
Received: 22 May 2024; Accepted: 29 August 2024;
Published: 20 September 2024.
Edited by:
Yen-Chiang Chang, Dalian Maritime University, ChinaReviewed by:
Zhongzhen Yang, Ningbo University, ChinaHongchu Yu, Wuhan University of Technology, China
Guanqiu Qi, Chung-Ang University, Republic of Korea
Copyright © 2024 Peng, Du, Zhang and Wang. This is an open-access article distributed under the terms of the Creative Commons Attribution License (CC BY). The use, distribution or reproduction in other forums is permitted, provided the original author(s) and the copyright owner(s) are credited and that the original publication in this journal is cited, in accordance with accepted academic practice. No use, distribution or reproduction is permitted which does not comply with these terms.
*Correspondence: Debin Du, ZGJkdUByZS5lY251LmVkdS5jbg==