Abstract
Vibrio harveyi is a major pathogen in yellow drum (Nibea albiflora) aquaculture, causing significant mortality and economic losses. In this study, using the latest assembled reference genome of yellow drum by our laboratory, we conducted genome-wide association study (GWAS) analysis on 345 individuals (197 susceptible and 148 resistant). The analysis revealed 24 significant single nucleotide polymorphisms (SNPs) on chromosome 24 within a 217 Kb region. The estimated heritability for all genome-wide SNPs was 0.3578, while the heritability for the 24 significant SNPs was 0.0710. Four candidate genes were identified within this region: Suppressor of Cytokine Signaling 1 (SOCS1), C-type Lectin Domain Family 16A (CLEC16A), Major Histocompatibility Complex Class II Transactivator (CIITA), and Protein Kinase Cβ (PRKCB). Subsequently, expression quantitative trait loci (eQTL) analysis was performed on transcriptome sequencing data from spleen tissues of 78 individuals from the resistant group. On average, each chromosome harbored 49,396 eQTL loci, with an average of one SNP regulate 1.3 genes. Notably, 22.79% of SNPs showed significant associations with the expression of one or more genes. By integrating GWAS and eQTL data, seven SNPs were identified to have significant associations with regulated genes in the eQTL results. All seven SNPs were found to target the same gene, namely Zinc Finger Protein yd23210 in yellow drum. This study provides genetic markers and candidate genes for molecular breeding of yellow drum against V. harveyi infection, offering insights into the molecular immune mechanisms and potential pathways for genetic improvement of disease resistance traits in this species.
1 Introduction
Vibriosis is one of the earliest recorded diseases of fish, causing enormous economic losses to the marine aquaculture industry (Mohd Yazid et al., 2021). Vibrio harveyi is one of the species related to the disease and it can infect a wide range of fishes, including catfish, grouper, rainbow trout, breams and basses (Triga et al., 2024). The most relevant clinical signs of vibriosis in fish include the presence of hemorrhages, skin lesions, fin erosion, ulceration and gastro-enteritis. It can also cause systemic infection and mortality in fish, leading to septicemia and organ failure (Mohamad et al., 2019). The species is also notable for causing mass mortality in crustacean and mollusks aquaculture with systemic and severe symptoms in shrimps, lobsters, oysters and abalones (Zhang et al., 2020).
The yellow drum (Nibea albiflora) is a sciaenid found from the South China Sea to the coastal waters of Japan and Korea and is one of the most economically important marine fish in China and other East Asian countries (Xu et al., 2021). While the aquaculture of yellow drum is becoming more popular, pathogenic microbial stress continues to pose a significant threat to the species (Peng et al., 2023). When faced with the threat of V. harveyi, the yellow drum exhibits typical “red head” symptoms, characterized by the appearance of red spots on the head and subsequent ulceration and atrophy of internal organs during the later stages of infection. “Red head disease” stands as the most detrimental ailment in the current aquaculture of yellow drum, typically occurring in spring (May to July) and autumn (September to October) when water temperatures hover around 18°C. Particularly alarming is the high infection rate among juveniles weighing less than 50 g, with mortality rates reaching up to 100%, resulting in substantial economic losses. For example, in 2019 alone, outbreaks of vibriosis in aquaculture farms in China resulted in losses exceeding $100 million (Ding et al., 2023). However, effective preventive measures against yellow drum diseases caused by V. harveyi remain elusive.
Presently, detecting genes and single nucleotide polymorphism (SNP) loci affecting complex traits constitutes a pivotal aspect of contemporary biological research. Genome-wide association study (GWAS) has emerged as a prevalent approach for identifying multiple gene loci associated with complex traits (Zhang et al., 2024). However, determining candidate genes directly from the GWAS results poses challenges due to the predominant localization of suspected loci within non-coding regions of the genome. Moreover, the presence of linkage disequilibrium (LD) between SNPs complicates the identification of causal variations (Gallagher and Chen-Plotkin, 2018). Genetic variants mainly influence complex traits by regulating gene expression levels (Võsa et al., 2021). Expression quantitative trait loci (eQTL) analysis is aimed at determining the level of genetic variation at loci associated with gene expression. Many overlapping SNP loci between GWAS summary statistics and eQTLs in specific gene regions also indicate that key genetic variations have a potential role in gene regulation (Pei et al., 2023). Hence, integrating eQTLs into GWAS analysis is the effective means to analyze the mechanism of genetic regulation of complex traits (Võsa et al., 2021).
Previously, to develop a resistance strategy against V. harveyi infection in yellow drum, we performed a GWAS analysis to map loci associated with defense response, resulting in the identification of 23 significant SNPs (Luo et al., 2021). Building upon this groundwork, leveraging our latest high-quality assembly of the yellow drum reference genome (Sun et al., 2023), we analyzed resequencing data obtained from yellow drum post V. harveyi challenge coupled with RNA-seq data to perform genome-wide eQTL analysis, aiming to identify novel candidate loci for disease resistance and to provide valuable insights for breeding and genetic improvement efforts in yellow drum.
2 Materials and methods
2.1 Sample preparation, DNA/RNA extraction and sequencing
The experimental yellow drum, V. harveyi challenge and tissue collection followed protocols established in previous studies (Luo et al., 2021). Specifically, 15 days post-challenge with V. harveyi, we collected 148 surviving individuals as representatives of the resistant group, while 197 individuals succumbed during the peak infection period were selected as representatives of the susceptible group. Fins from individuals in both groups were excised and preserved in anhydrous ethanol at -20°C for genomic DNA extraction using the TIANamp Genomic DNA Kit (TIANGEN, Beijing), a total of 1 μg DNA per sample was used for sequencing library preparation following the TruSeq DNA Sample Preparation Guide (Illumina, 15,026,486 Rev.C). Libraries were then pooled and sequenced on the Illumina HiSeq X ten platform (Illumina, CA, USA) using pair-end model. Additionally, a total of 78 spleen tissue samples from resistant group were utilized for RNA extraction using the TransZol Up Plus RNA Kit (TIANGEN, Beijing), then subjected to sequencing on an Illumina NovaSeq 6000 platform (Beijing Annoroad Science Technology Co., Ltd.).
2.2 SNP discovery and genotyping
The quality of the sequencing reads of the samples were checked using the FastQC software package (http://www.bioinformatics.babraham.ac.uk/projects/fastqc/), and the high-quality reads after filtering were used for subsequent analyses. The clean reads were aligned to the assembled yellow drum genome assembled in our laboratory using the BWA-MEM algorithm with default parameters (Li, 2013). The SNPs and small insertions/deletions (InDels) detection were performed using ‘HaplotypeCaller’ method in GATK v3.8 (McKenna et al., 2010). The remained SNPs in variant call format (VCF) were subjected to quality control using Plink1.9 software (http://zzz.bwh.harvard.edu/plink/), with the filtering parameters as follows: hwe <1e-10, maf >0.05, and geno <0.05. The missing SNPs were imputed using Beagle v4.1, and the accuracy of the imputed SNPs were evaluated by Beagle R2 values (Browning and Browning, 2007). The linkage disequilibrium (LD) level was measured with the correlation coefficient values (r2) between two SNPs using Plink v1.90b6.21.
2.3 Genome-wide association study
For GWAS, the association between the SNPs and phenotypes was performed via EMMAX with the Mixed Linear Model (MLM). A mixed linear model is typically expressed as the following equation: y = Xβ+ Zu + e, where y is a column vector of observed phenotypes (survival status of fish after infection), X is the standardized genotypes, β is the effects of the variant on the phenotype, Z is a matrix of random additive genetic effects, u is the random effect of the mixed model with Var(u) = σ2 gG where G is the kinship matrix, and e is a matrix of residual effect such that Var(e) = σ2 eI, which is assumed to be normally distributed with variance σ2 e, denoted as e ~ N (0, σ2 e).Manhattan plot was generated using R (version 4.0). The adjacent protein-coding genes of the candidate SNP markers with the highest significance were identified to determine their biological functions associated with V. harveyi resistance. Heritability was defined as the proportion of phenotypic variation explainable to genetic variation. The proportion of phenotypic variance explained (PVE) by all genome-wide SNPs for disease resistance traits. The PVE by each SNP was performed via GCTA software with the mixed linear model (Yang et al., 2011).
2.4 Protein-protein interaction networks
The construction of the network diagram depicting interactions among candidate gene proteins utilized the String database (https://cn.string-db.org) and employed the functionality of Multiple proteins to input candidate gene protein IDs along with those of interacting proteins, thereby generating the interaction network diagram.
2.5 Real-time quantitative PCR analysis
For quantitative analysis of the expression of candidate genes, specific primer pairs were designed (detailed in Table 1). The reaction system (20 μL) was prepared according to the instructions provided by the ChamQ™ Universal SYBR® qPCR Master Mix (Vazyme, China). The qPCR protocol involved initial denaturation at 95°C for 30 s, followed by 40 cycles of denaturation at 95°C for 10 s, annealing at 60°C for 30 s. Analysis of relative expression was carried out using the StepOne Plus real-time Detection System (ABI, America) and the comparative Ct method (2-△△Ct). LSD under ONE-WAY ANOVA in IBM SPSS Statistics 24 software was used for significant difference analysis. A significance level of p < 0.05 indicated statistical significance, while p < 0.01 denoted extreme significance.
Table 1
| Primer name | Primer Sequence (5’-3’) |
|---|---|
| CLEC16A_qF | ACCGTGGCCGCAAGAGAACT |
| CLEC16A_qR | CCAGCCCTTTCGTCATCCTCCT |
| CIITA_qF | ATCAAGTGCTTCGTCTGAAGATGGAA |
| CIITA_qR | CGGTGTGGAGGATGGAGGAGTT |
| SOCS1_qF | CGTCCTTGTCCTCATCCTCATCCT |
| SOCS1_qR | TGCTCCGACTCTGTGCGTTGA |
| β-actin_F | TTATGAAGGCTATGCCCTGCC |
| β-actin_R | TGAAGGAGTAGCCACGCTCTGT |
Specific Primers used for this study.
2.6 Expression quantitative trait loci analysis
For eQTL, the association between the SNPs and gene expression was performed via Matrix eQTL with the General linear model (Shabalin, 2012). In this study, cis-eQTL was defined as the expression of a gene associated with SNPs in the range of ±1 Mb. It means that only SNPs within 1Mb before and after the gene was analyzed, and a pair of associated SNP-genes were defined as a cis-eQTL locus. The Benjamini-Hochberg correction was conducted to reduce the error rate. The FDR (false discovery rate) value was used for correction of multiple tests, and eQTL locus with FDR values above the 1e-5 threshold line were considered significant.
2.7 Combined analysis of GWAS and eQTL
To identify candidate immune genes presenting in both GWAS and eQTL analysis datasets, we initially extracted SNP loci that exhibited statistical significance and mutual correlation. All SNP loci reaching genome-wide significance in the GWAS dataset were compiled and mapped onto the genome. Subsequently, based on the genetic distance of SNP loci on the genome, their positions, identifiers, regulated genes, p values, FDR, and other relevant information were determined in the eQTL dataset. Through genetic distance calculation, overlapping SNPs on the genome were identified, which were significantly associated with both resistance traits against V. harveyi infection and with gene expression levels in eQTL analysis. Genetic distance calculation and alignment were performed using scripts written in the R programming language. By co-localizing these SNPs, a connection between resistance traits against V. harveyi infection and gene expression levels was established, thus unveiling candidate genes influencing the level of disease resistance.
2.8 Bioinformatics analysis
Genes whose expression correlated with these SNPs were selected as candidate genes. Candidate gene information was searched in published papers and databases to determine their association with disease resistance. For protein sequence analysis of candidate gene, transmembrane domain was analyzed by the TMHMM (https://services.healthtech.dtu.dk/services/TMHMM-2.0/). The molecular weight, theoretical pI, and amino acid composition were investigated by the online ProtParam tool (www.expasy.org). The protein domains were performed by NCBI (https://www.ncbi.nlm.nih.gov/Structure/cdd/wrpsb.cgi). The tertiary structures were predicted using SWISS-MODEL (http://swissmodel.expasy.org/interactive). Subcellular localization prediction was using the online software PSORTb (https://www.psort.org/psortb/).
3 Results
3.1 SNP calling from resequencing data
Genomic DNAs of 345 yellow drum samples were sequenced on the HiSeq X ten platform (Illumina) and valid sequencing results were obtained from 345 individuals (148 survivals and 197 deaths) to generate a total of 12.37 billion raw reads (150 bp each). After data filtering, 11.95 billion reads (approximately 1.79 Tb) were retained for subsequent SNP calling, with a Q30 value of 93.69%. Utilizing the latest reference genome, the original DNA resequencing data underwent genotype calling, followed by SNP quality control through Hardy-Weinberg equilibrium (HWE), minimum allele frequency (MAF), and genotype missing rate (GENO) assessments, resulting in the identification of 4,485,033 SNPs for further analysis. With the utilization of the updated reference genome, 144,496 SNP loci previously identified in the prior study were corrected when compared to the 4,340,537 SNPs reported previously. Overall, the SNPs exhibited a uniform distribution across the chromosomes (Figure 1).
Figure 1

SNPs distribution across the chromosomes in yellow drum. The color bars represent the number of SNPs within 0.1 Mb window size with reference to the index shown on the right.
3.2 Genome-wide association study
The GWAS analysis revealed a clustering of significant SNPs on chromosome 24, where 24 SNPs reaching genome-wide significance (α < 0.05) (with a genome-wide threshold line at p value < 1.12e-08) and 3 SNPs (α < 0.01, p < 2.23e-09) (Figure 2). Among 24 significantly associated SNPs at the genome level, 14 were located in intronic regions, 6 in exonic regions, and the remaining 4 SNPs were located in intergenic regions. Following alignment to the latest assembled reference genome of yellow drum, it was observed that SNPs exceeding the significance threshold (α < 0.05) were distributed within the genomic region spanning from position 17,258,856 to 17,476,269 on chr24. Consequently, this study defines the genomic region of 217 Kb on chr24 of yellow drum as a significant disease-resistant region. The distribution of the MAF of these variants ranged from 20.03% to 21.85% for significant SNPs on chr24. GCTA software was used to calculate the heritability, the estimated heritability of all genome-wide SNPs was 0.3578, while for the 24 significant SNPs (α < 0.05), it was 0.0710 (Table 2).
Figure 2

Manhattan plot of GWAS analysis. The red line is the Bonferroni test genome-level significance (α=1%) threshold (p < 2.23e-09), while the blue line is significance (α= 5%) threshold (1.12e-08). SNPS that exceed the genome-level threshold line for Bonferroni tests are shown in red highlights.
Table 2
| SNP_ID | BP | Pvalue | Location | A1 | A2 | MAF | Mutation type |
|---|---|---|---|---|---|---|---|
| Chr24:17258856 | 17258856 | 3.25E-09 | Intergenic | C | T | 0.2185 | NA |
| Chr24:17260473 | 17260473 | 3.80E-09 | Intergenic | G | A | 0.2045 | NA |
| Chr24:17267421 | 17267421 | 3.67E-09 | Intergenic | T | G | 0.2143 | NA |
| Chr24:17279412 | 17279412 | 9.54E-09 | Intergenic | A | G | 0.2059 | NA |
| Chr24:17316360 | 17316360 | 2.67E-09 | CIITA_Intronic | A | C | 0.2087 | NA |
| Chr24:17318957 | 17318957 | 9.43E-10 | CIITA_Intronic | G | C | 0.2045 | NA |
| Chr24:17321798 | 17321798 | 9.26E-09 | CIITA_Intronic | A | G | 0.2003 | NA |
| Chr24:17325334 | 17325334 | 8.51E-09 | CIITA_exon | C | T | 0.2115 | synonymous mutation |
| Chr24:17325349 | 17325349 | 8.51E-09 | CIITA_exon | G | A | 0.2115 | synonymous mutation |
| Chr24:17334378 | 17334378 | 6.04E-09 | CLEC16A_exon | G | A | 0.2073 | synonymous mutation |
| Chr24:17337020 | 17337020 | 6.79E-09 | CLEC16A_Intronic | T | A | 0.2073 | NA |
| Chr24:17337029 | 17337029 | 6.79E-09 | CLEC16A_Intronic | C | G | 0.2073 | NA |
| Chr24:17351350 | 17351350 | 7.88E-09 | CLEC16A_Intronic | A | G | 0.2073 | NA |
| Chr24:17358542 | 17358542 | 7.21E-09 | CLEC16A_Intronic | G | A | 0.2045 | NA |
| Chr24:17358547 | 17358547 | 7.21E-09 | CLEC16A_Intronic | G | A | 0.2045 | NA |
| Chr24:17365189 | 17365189 | 8.22E-10 | CLEC16A_Intronic | C | A | 0.2087 | NA |
| Chr24:17365862 | 17365862 | 1.07E-09 | CLEC16A_exon | G | A | 0.2073 | synonymous mutation |
| Chr24:17365932 | 17365932 | 2.48E-09 | CLEC16A_exon | G | A | 0.2059 | nonsynonymous mutations |
| Chr24:17365933 | 17365933 | 2.48E-09 | CLEC16A_exon | A | T | 0.2059 | nonsynonymous mutations |
| Chr24:17379583 | 17379583 | 3.34E-09 | SOCS1_Intronic | A | G | 0.2031 | NA |
| Chr24:17379644 | 17379644 | 2.61E-09 | SOCS1_Intronic | T | A | 0.2059 | NA |
| Chr24:17412921 | 17412921 | 4.46E-09 | PRKCB_Intronic | A | T | 0.2087 | NA |
| Chr24:17451001 | 17451001 | 9.68E-09 | PRKCB_Intronic | G | A | 0.2031 | NA |
| Chr24:17476269 | 17476269 | 5.42E-09 | PRKCB_Intronic | C | A | 0.2017 | NA |
The SNPS associated with V. harveyi resistance on chr24 in yellow drum were above the genome-level significant threshold (pvalue < 1.114818e-08).
NA, Not Available.
Using Haploview, the linkage disequilibrium was assessed using the r² value (correlation coefficient between alleles), which ranges from 0 to 1. A higher r² value indicates lower genetic independence between SNPs, suggesting a higher likelihood of linkage between the two loci during inheritance.
As depicted in Figure 3, compared to randomly selected SNPs with the same density in the upstream and downstream regions of the genome, significant SNPs within disease-resistant regions exhibit stronger linkage disequilibrium.
Figure 3

The LD map of the GWAS significant region and the SNP linkage disequilibrium within 100kb upstream and downstream. The black triangle area in the figure is the significant SNP in the significant area, and the SNPs in the upstream and downstream areas are randomly selected according to the distribution density of the significant SNP. The degree of SNP linkage disequilibrium in the significant region is higher than that in other regions.
3.3 Disease-resistant candidate genes
Four genes, namely suppressor of cytokine signaling 1 (SOCS1), C-type lectin domain containing 16A (CLEC16A), Class II transactivator (CIITA), and protein kinase C beta (PRKCB), were found within significant disease-resistant intervals. Analysis revealed a certain degree of synteny among these three genes across multiple species’ genomes (Figure 4). Synteny describes the distribution pattern of genes on chromosomes, where a group of genes located on the same chromosome in different species are physically co-localized, with their positions on the chromosome being very close. Inter-species synteny implies the relative conservation of these genes during evolution.
Figure 4

The interspecies synteny figure of the three genes: CLEC16A, CIITA, and SOCS1. Blue in the figure indicates that the gene is located on the forward strand, and orange indicates that the gene is located on the reverse strand.
3.4 Protein-protein interaction networks of candidate genes
Using the STRING database, we analyzed proteins that interact with candidate genes (Figure 5). Employing a PPI enrichment p threshold of < 1.0e-16, we constructed a protein-protein interaction network consisting of 44 nodes. Utilizing K-means clustering, proteins were grouped into three sets based on their Count values: Red, Green, and Blue. Within the Red protein set, a majority of proteins were associated with the activation and transcriptional regulation of MHC class II genes, facilitating downstream immune gene activation such as Interferon Regulatory Factor 1 (IRF1) through the combinatorial action of various transcription factors. The Green protein set included not only common proteins like transcription factors and protein kinases but also enzymes like Ubiquitin-Specific Peptidase 8 (USP8), which deubiquitinates proteins to prevent their degradation during the cell cycle, thus playing a role in cell proliferation. In the Blue protein set, proteins with C-type lectin-like domains such as CD302 and CLEC12A regulated various cellular functions, impacting nucleases like DICER1, DROSHA (Ribonuclease 3), PIWIL1 (Piwi-like protein 1), and to some extent influencing DNA replication processes.
Figure 5
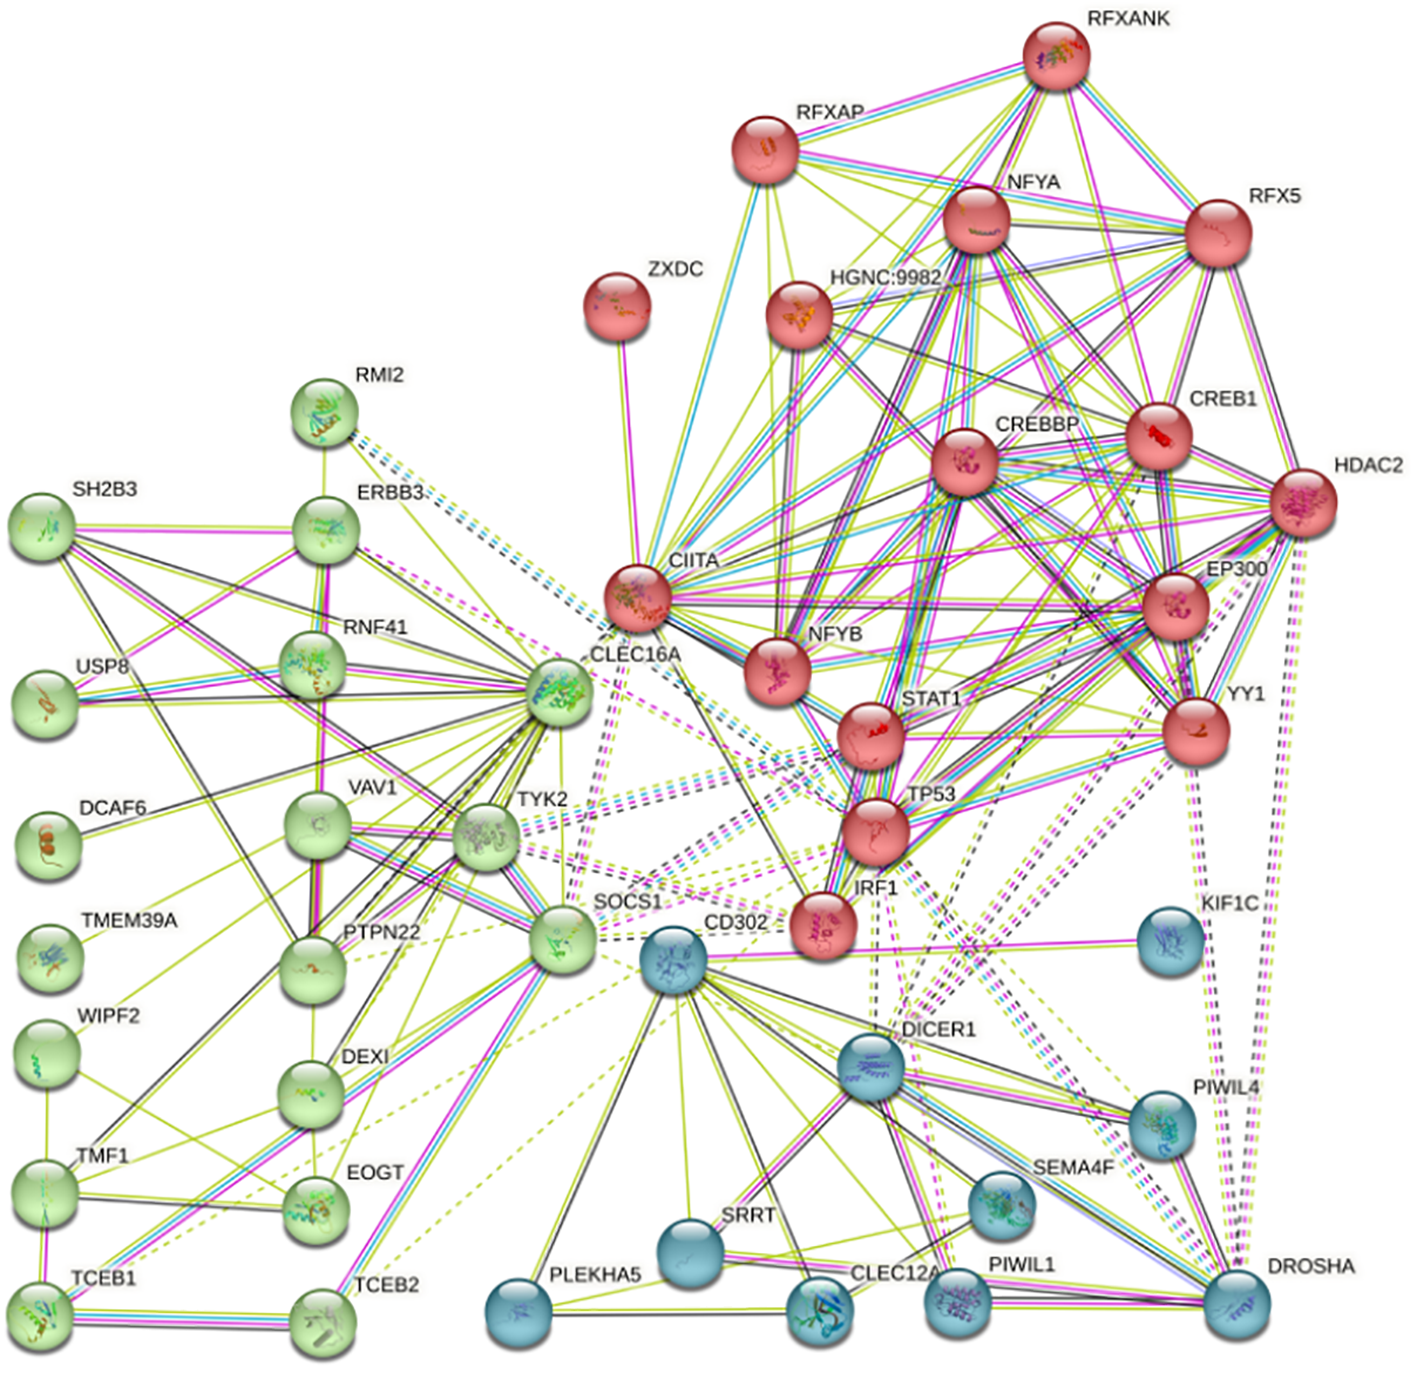
Protein interaction network with candidate genes.
3.5 Expression profile of candidate genes
Using RT-qPCR, we assessed CLEC16A, SOCS1, and CIITA expression across tissues of healthy yellow drum, encompassing muscle, skin, intestine, gills, liver, head kidney, spleen, and brain, which unveil notable disparities in gene expression profiles, with CLEC16A demonstrating heightened expression in brain and spleen tissues, juxtaposed with its comparatively subdued levels in skin and muscle. Similarly, CIITA exhibits pronounced expression in head kidney and spleen, while registering diminished expression in skin and muscle. And SOCS1 showcases elevated expression levels in brain, alongside reduced expression in skin, as illustrated in Figure 6.
Figure 6

Tissue distribute of CLEC16A(A), CIITA(B), and SOCS1(C) in yellow drum. Values are mean ± SE of three biological replicates. Statistical significance is denoted with different letters on the top of each column group (p < 0.05).
Upon exposure to V. harveyi, dynamic changes in gene expression were observed in immune-related tissues of yellow drum (head kidney, liver, and spleen), as depicted in Figure 7. Notably, CLEC16A exhibited a unique expression pattern characterized by an initial increase followed by a subsequent decrease across all tissues. Conversely, SOCS1 and CIITA displayed an opposite trend, initially decreasing in expression levels and subsequently rising across all tissues. These results highlight the complex regulatory mechanisms underlying the immune response in yellow drum and provide insight into the intricate dynamics of gene expression in response to pathogenic stimuli.
Figure 7

Differential Expressions profiles of CLEC16A, CIITA, and SOCS1 in yellow drum post V. harveyi challenge. The symbol ‘*’ indicates p < 0.05, ‘**’ indicates p < 0.05.
3.6 eQTL analysis
In this study, effective RNA sequencing data were obtained from 78 yellow drum individuals. After initial quality control of RNA-seq data, a total of 481.26 Gb of clean data was generated, averaging 5.40 Gb per individual. Clean reads were aligned to the new reference genome, achieving an average unique alignment rate of 88.52% per sample. Using StringTie software, 23641 genes were assembled. Genes not expressed in all samples were filtered out, resulting in the use of 23570 genes’ expression data for eQTL analysis. Principal component analysis (PCA) performed using Plink indicated a uniform population distribution (Figure 8A).
Figure 8

The eQTL analysis. (A) Principal component analysis. (B) Manhattan plot showing the genome-wide distribution of the identified eQTL across the genome. (C) Heatmap showing the clustering of SNPs.
Using the Matrix eQTL linear model, we assessed the correlation between the expression levels of 23,570 genes and 4,485,033 SNPs, resulting in the identification of 1,185,507 significant cis_eQTL loci (FDR above threshold of 1e-5), with an average of 49,396 eQTL loci per chromosome (Figure 8B). Among the 1,185,507 significant cis_eQTL loci, the average of one SNP regulate 1.3 genes. The majority of SNPs are associated with the expression level of only one gene, while 22.79% of SNPs show significant associations with one or more genes’ expression levels, possibly due to a substantial proportion of SNPs being in linkage disequilibrium (Figure 8C).
3.7 Combined analysis of GWAS and eQTL
The result of GWAS analysis revealed 24 significant SNPs within the notably disease-resistant regions. Through our analysis, we identified significant associations between the SNPs and gene expression levels. These SNPs were then compared with eQTL data, identifying 7 SNPs significantly associated with regulatory genes, with statistically significant p-values and FDR values in the eQTL results. Among these, 4 SNPs were located within exonic regions, while 3 were within intronic regions. Particularly, the genomic positions of these 7 SNPs spanned from 17.32 to 17.45 Mb, covering a region of 132 Kb. All of them were associated with a gene, yd23210 (Table 3). In summary, the genotypes of these 7 SNPs are significantly correlated with disease resistance traits (p < 1.12e-08) as well as the expression levels of yd23210 (FDR < 1e-5).
Table 3
| eQTL_SNP_ID | eQTL_Gene_name | eQTL_FDR | GWAS_P_value | SNP_Distance_ to_eQTLgene_TSS (bp) |
location | A1 | A2 | MAF |
|---|---|---|---|---|---|---|---|---|
| Chr24_17365862 | yd_23210 | 3.05E-07 | 1.07E-09 | 398,900 | CLEC16A_exon | G | A | 0.2073 |
| Chr24_17365933 | yd_23210 | 4.73E-07 | 2.48E-09 | 398,829 | CLEC16A_exon | A | T | 0.2059 |
| Chr24_17365932 | yd_23210 | 4.73E-07 | 2.48E-09 | 398,830 | CLEC16A_exon | G | A | 0.2059 |
| Chr24_17337029 | yd_23210 | 4.44E-07 | 6.79E-09 | 427,733 | CLEC16A_Intronic | C | G | 0.2073 |
| Chr24_17337020 | yd_23210 | 4.44E-07 | 6.79E-09 | 427,742 | CLEC16A_Intronic | T | A | 0.2073 |
| Chr24_17451001 | yd_23210 | 7.29E-07 | 9.68E-09 | 313,761 | PRKCB_Intronic | G | A | 0.2031 |
| Chr24_17318957 | yd_23210 | 1.45E-07 | 9.43E-10 | 445,805 | CIITA_Intronic | G | C | 0.2045 |
| Chr24_17365862 | yd_23210 | 3.05E-07 | 1.07E-09 | 398,900 | CLEC16A_exon | G | A | 0.2073 |
The SNP sites and eqtl genes regulated by GWAS and eQTL in joint analysis.
3.8 Sequence characteristics of yd_23210
The encoded protein of Zinc finger protein yd23210 by the coding region of 3207 bp consisted of 1069 amino acids, with two C2H2 zinc finger structures (372-392 aa, 502-522 aa) (Figure 9A). Protein sequence analysis indicated that there was no signal peptide or transmembrane domain in Zinc Finger Protein. The deduced molecular weight was 123.17 kDa, and the calculated isoelectric point was 4.09. The tertiary structure showed the two C2H2 zinc finger structures (Figure 9B). Subcellular localization prediction indicated cytoplasmic localization with a confidence score of 7.50.
Figure 9

Sequence and domain analysis of the zinc finger protein yd23210 in yellow drum. (A) The coding sequence and predicted amino acid sequence. The stop codon is indicated with an asterisk(-), and two C2H2 type zinc fingers domain is highlighted with a yellow shadow. (B) The tertiary structure of yd23210 protein, the red structure is the predicted structure of two C2H2 zinc fingers, and the red sphere is the predicted binding position of zinc ions.
4 Discussion
In previous studies, to identify candidate genes for disease resistance, comparisons were commonly made between transcriptomic data from diseased and healthy groups, supplemented with eQTL analysis, to uncover candidate genes whose expression levels change during the onset of illness. However, it is noteworthy that genetic markers on the genome, such as SNPs, are inherently present and can exert influences on disease-resistance genes even before the onset of illness, leading to variations in individual disease resistance levels (Naranbhai et al., 2015). Additionally, diseased individuals are subject to various influences during illness, resulting in changes in the baseline gene expression levels and significantly reducing the accuracy of gene regulation (GTEx Consortium et al., 2018). Therefore, investigating the effects of genetic markers on the genome through methods like GWAS, coupled with eQTL studies using gene expression data from a cohort of healthy individuals, is more conducive to uncovering the expression and regulation of genes under normal physiological conditions (Pan et al., 2021).
Following alignment with the latest assembled reference genome of yellow drum, GWAS peaks in this study revealed a significantly disease-resistant region located on chr24, spanning from 17,258,856 bp to 17,476,269 bp, totaling 217 Kb. In contrast, previous studies identified GWAS peaks on chr14, within the disease-resistant interval ranging from 6.14 Mb to 6.82 Mb, covering 681 Kb. Through collinearity analysis, it is evident that the peak regions of the two GWAS analyses correspond to each other, chr24 in the latest assembled yellow drum reference genome corresponding to chr14 in the previous assembly, showing mostly conserved chromosomal regions except for a 200 Kb displacement, which is relatively small at the genomic level, encompassing only a few genes, making it practically the same region for trait gene selection studies. Moreover, both this study and the previous research observed GWAS peak SNPs associated with resistance to V. harveyi reaching significant levels. Compared to the disease-resistant regions identified in previous studies, our results have narrowed down the scope of the screened diseaseresistant region to, 464 Kb.
SOCS1, CLEC16A, as well as CIITA, were localized within the peak regions identified through GWAS. CLEC16A, genetically associated with a variety of autoimmune diseases (Pandey et al., 2019), is a key regulator of key regulators of the HLA-II pathway in antigen-presenting cells (APC), and is also involved in the regulation of mitosis, phagocytosis, and autophagy process (Schuster et al., 2015) (Soleimanpour et al., 2014). CIITA is a major histocompatibility complex (MHC) class II trans-activator that recognizes microbial pathogens and triggers immune responses in living organisms (Reith et al., 2005; Handunnetthi et al., 2010; Xia et al., 2015; León Machado and Steimle, 2021). SOCS1, a negative regulator of cytokine signaling (Ueki et al., 2004), has been reported to inhibit the JAK/STATs pathway and to play an important role in Lipopolysaccharide (LPS) - induced antimicrobial immunity (Kinjyo et al., 2002; Li et al., 2013).
The phenomenon of synteny primarily describes the distribution pattern of genes on chromosomes, wherein a group of genes positioned on the same chromosome in various species exhibit physical co-localization, characterized by their close proximity along the chromosome. In this study, a notable disease-resistant interval encompasses three genes: SOCS1, CLEC16A, and CIITA, which can also be termed a genetic locus from a genetic standpoint. Across multiple species genomes, these three genes exhibit a degree of inter-species synteny, revealing their evolutionary conservation. The presence of inter-species synteny may be attributed to the requirement for highly conserved sequences to support a common regulatory model, thereby regulating the expression of several or all genes within this locus. Research indicates an association between the human chromosome 16p13 region and susceptibility to autoimmune diseases, with genes including SOCS1, CLEC16A, and CIITA being located therein, displaying linkage disequilibrium (Leikfoss et al., 2013). The strong linkage disequilibrium of SNPs within the genetic locus at the genomic level implies the significant immunological candidate genes share a conserved relationship. Given that this region represents a relatively small segment of the chromosome, there is reason to hypothesize that the regulatory mechanisms governing the genes within it have undergone co-evolution.
In the tissue expression profiles of the three candidate genes, the brain and spleen exhibit the highest expression levels. In fish, the spleen is a vital immune organ, while the brain regulates the organism’s internal environment. Post-toxin exposure analysis reveals significant downregulation of SOCS1 and CIITA, and upregulation of CLEC16A around 24 h after V. harveyi stimulation. These expression patterns align with the genes’ functions. Decreased expression of SOCS1 and CIITA during immune response enhances resistance to V. harveyi, while their downregulation during bacterial stimulation underscores their importance in defense. Conversely, CLEC16A, an immune gene, shows significant upregulation during bacterial stimulation, indicating its pivotal role. The close temporal alignment of expression changes for these genes, along with the high linkage disequilibrium in the disease-resistant region, suggests common regulatory influences on this genetic locus.
The most significant SNP locus observed lies within the intronic region of the CLEC16A in present study, suggesting it as a potential causal gene underlying variations in disease resistance traits. Although the intronic SNP locus does not result in changes to protein coding, it may contribute to genetic polymorphism and alterations in gene expression levels. Similar findings have been reported in previous studies, such as the identification of SNP rs12927355 in the nineteenth intron region of CLEC16A as a primary effect signal for autoimmune diseases like multiple sclerosis. Furthermore, a highly linked gene cluster exists, comprising CIITA, DEXI, CLEC16A, and SOCS1 (Leikfoss et al., 2013). The genotype of rs12927355 correlates with the gene expression levels of CLEC16A and SOCS1 in peripheral CD4+ T cells. Additionally, co-expression of CIITA, DEXI, CLEC16A, and SOCS1 was observed in peripheral blood CD4+ and CD8+ T cells. Transcriptomic data from human thymic tissues indicate a negative correlation between the highest-effect SNP within CLEC16A and the expression levels of SOCS1 in the samples, although the association with CIITA, DEXI, and CLEC16A expression levels did not reach significance (Zuvich et al., 2011; Berge et al., 2013).
Through GWAS and eQTL analyses, the genetic regulatory mechanisms underlying the immune gene expression response of yellow drum to V. harveyi stimulation were investigated. Seven SNPs were found to exhibit significant genotype associations, all pointing to a single gene: yd23210. This indicates a significant correlation between these SNPs and disease resistance traits (p < 1.12e-08), as well as the expression levels of yd23210 (FDR < 1e-5). Among the SNPs showing disease resistance effects, yd23210 plays a crucial role. Additionally, yd23210 is located within 1 Mb of the GWAS peak region, falling within the category of proximal regulation. Such regulatory effects may be a potential determinant influencing the variation in disease resistance of the SOCS1-CLEC16A-CIITA locus.
Through analysis of the sequence structure of yd23210, it was found to possess a typical zinc finger protein structure, and phylogenetic tree analysis indicated its highest homology with the zinc finger protein in large yellow croaker (Larimichthys crocea). A hallmark of zinc finger proteins is their stable short peptide spatial configuration, capable of self-folding into a “finger” configuration upon binding with Zn2+. This structure is commonly found in transcription factors of eukaryotes. Our studied revealed a significant correlation between the expression level of this zinc finger protein and the genotypes of significantly disease-resistant SNP loci. Therefore, we hypothesize that the zinc finger protein yd23210 in yellow drum may serve as a potential transcription factor, with its expression influenced by regulatory elements within the disease-resistant interval, thereby affecting the transcriptional regulation of immune genes and individual resistance of yellow drum to V. harveyi disease. The majority of zinc finger proteins exist within organisms and function as transcription factors capable of regulating the expression of genes with specific binding domains.
Zinc finger proteins were first discovered in 1983 in the transcription factor TFIIIA in Xenopus laevis oocytes (Berg and Shi, 1996), marking the commencement of extensive research on these proteins in eukaryotes. Among them, C2H2 zinc finger proteins stand out as one of the largest families in mammals, playing pivotal roles in growth, development, and stress tolerance. Structurally, C2H2 zinc finger proteins are characterized by the motif C_X2-4_C_X12_H_X3-5_H (Pi et al., 2002), which governs transcriptional regulation by engaging with DNA, RNA, or protein molecules, or by directly modulating gene expression through zinc finger protein binding. Liu et al. (Liu et al., 2013) conducted targeted knockout of the ZBTB20, encoding a myeloid zinc finger protein, in mice, revealing diminished responsiveness to various TLR ligands and reduced production of inflammatory cytokines by macrophages such as TNF, IFN-β, and IL6. Moreover, ZBTB20 inhibits the transcription of the IκBα in the downstream TLR signaling pathway, thereby attenuating NF-κB expression (Pi et al., 2002). Zinc finger proteins wield significant influence over inflammatory processes in animals, with expression levels of select members correlating significantly with classical inflammatory pathways. For instance, A20, a zinc finger protein housing seven zinc fingers in its carboxyl-terminal domain, serves as a protective factor during cellular inflammatory responses, while also modulating the intensity of the inflammatory reaction. NF-κB, a vital intracellular pathway in inflammation, harbors nuclear factor-kB (NF-kB) as its pivotal nuclear transcription factor. This pathway’s versatility manifests as it engages Toll-like receptors, interleukin receptors, complement C3a receptors, and other molecules, culminating in downstream cytokine release and inflammation propagation (Manna, 2012; Catrysse et al., 2014). Studies focusing on inflammatory responses unveil significant alterations in gene expression levels—such as A20, p53, and p-p65 following TNF-α treatment of rat myeloid cells. Exogenous stimuli elevate zinc finger protein A20 expression in mice, with subsequent assessments revealing altered cytokine levels in tissues such as the liver and blood. Post-stimulation, TNF-α concentrations decrease in serum and liver tissue, while liver tissue NF-κB and p65 protein expression levels increase. Furthermore, expression levels of TNF-α, IL-1β, IL-6 mRNA, as well as p-IκBα and p-NF-κB p65 proteins, are significantly reduced (Mitchell et al., 2016). Consequently, A20 expression levels correlate with inflammatory factor expression levels in the NF-κB signaling pathway. Zinc finger protein A20 expression mitigates downstream cytokine expression in the NF-κB signaling cascade, thereby attenuating inflammatory responses and safeguarding cells against inflammation-induced damage. The observed association between zinc finger protein expression levels and inflammatory responses echoes findings from combined GWAS and eQTL analyses in this study.
Therefore, this study postulates that the yellow drum zinc finger protein yd23210 may regulate gene expression levels within the SOCS1-CLEC16A-CIITA locus through mechanisms similar to those of A20. By binding with its zinc finger domains to this locus, it subsequently influences downstream cytokines, regulating inflammation-related pathways such as the IFN-JAK/STAT pathway, TCR pathway, and NF-κB pathway, thereby controlling the intensity of inflammation response during V. harveyi infection and protecting cells’ normal physiological activities.
5 Conclusions
In this study, we performed a GWAS using DNA resequencing data from the fin tissues of yellow drum. The results revealed a prominent SNP peak on chromosome 24, containing 24 genome-wide significant SNPs (p < 1.12e-08) within a 217 Kb region associated with disease resistance. The estimated heritability of all SNPs across the genome was 0.3578, while the heritability of the 24 significant SNPs was 0.0710. Within this significant disease resistance region, four candidate genes were identified: SOCS1, CLEC16, CIlTA and PRKCB. Additionally, we conducted expression quantitative trait loci (eQTL) analysis using transcriptome sequencing data from the spleen tissues of yellow drum. On average, each chromosome contained 49,396 eQTL loci, with each SNP regulating an average of 1.3 genes. Notably, 22.79% of SNPs were significantly associated with the expression of one or more genes. By integrating the GWAS and eQTL data, we identified seven SNPs that were significantly associated with the regulation of the same gene in the eQTL results, specifically the zine finger protein yd23210 in yellow drum.
This study provides genetic markers and candidate genes for the molecular breeding of yellow drum for resistance to V. harveyi disease, offering valuable insights into the molecular immune mechanisms and genetic improvement of disease resistance traits in this species.
Statements
Data availability statement
The datasets presented in this study can be found in online repositories. The names of the repository/repositories and accession number(s) can be found below: https://www.ncbi.nlm.nih.gov/, PRJNA622389.
Ethics statement
The animal study was approved by Animal Care and Use Committee of Fisheries College of Jimei University. The study was conducted in accordance with the local legislation and institutional requirements.
Author contributions
YH: Conceptualization, Formal analysis, Investigation, Methodology, Software, Writing – original draft. JL: Methodology, Validation, Visualization, Writing – original draft. WL: Methodology, Validation, Visualization, Writing – original draft. FH: Funding acquisition, Supervision, Writing – review & editing.
Funding
The author(s) declare financial support was received for the research, authorship, and/or publication of this article. This research was funded by Natural Science Foundation of Fujian Province, grant number 2022J01325; The Youth Science and Technology Innovation Program of Xiamen Ocean and Fisheries Development Special Funds (Grant No. 23YYZP024QCA01); Open Research Fund Program of Fujian Provincial Key Laboratory of Marine Fishery Resources and Eco-environment, grant number Z822280.
Conflict of interest
The authors declare that the research was conducted in the absence of any commercial or financial relationships that could be construed as a potential conflict of interest.
Publisher’s note
All claims expressed in this article are solely those of the authors and do not necessarily represent those of their affiliated organizations, or those of the publisher, the editors and the reviewers. Any product that may be evaluated in this article, or claim that may be made by its manufacturer, is not guaranteed or endorsed by the publisher.
References
1
Berg J. M. Shi Y. (1996). The galvanization of biology: A growing appreciation for the roles of zinc. Science271, 1081–1085. doi: 10.1126/science.271.5252.1081
2
Berge T. Leikfoss I. Harbo H. (2013). From identification to characterization of the multiple sclerosis susceptibility gene CLEC16A. IJMS14, 4476–4497. doi: 10.3390/ijms14034476
3
Browning S. R. Browning B. L. (2007). Rapid and accurate haplotype phasing and missing-data inference for whole-genome association studies by use of localized haplotype clustering. Am. J. Hum. Genet.81, 1084–1097. doi: 10.1086/521987
4
Catrysse L. Vereecke L. Beyaert R. Van Loo G. (2014). A20 in inflammation and autoimmunity. Trends Immunol.35, 22–31. doi: 10.1016/j.it.2013.10.005
5
Ding X.-Y. Wei C.-Y. Liu Z.-Y. Yang H.-L. Han F. Sun Y.-Z. (2023). Autochthonous Bacillus subtilis and Enterococcus faecalis improved liver health, immune response, mucosal microbiota and red-head disease resistance of yellow drum (Nibea albiflora). Fish Shellfish Immunol.134, 108575. doi: 10.1016/j.fsi.2023.108575
6
Gallagher M. D. Chen-Plotkin A. S. (2018). The post-GWAS era: from association to function. Am. J. Hum. Genet.102, 717–730. doi: 10.1016/j.ajhg.2018.04.002
7
GTEx Consortium Gamazon E. R. Segrè A. V. Van De Bunt M. Wen X. Xi H. S. et al . (2018). Using an atlas of gene regulation across 44 human tissues to inform complex disease- and trait-associated variation. Nat. Genet.50, 956–967. doi: 10.1038/s41588-018-0154-4
8
Handunnetthi L. Ramagopalan S. V. Ebers G. C. Knight J. C. (2010). Regulation of major histocompatibility complex class II gene expression, genetic variation and disease. Genes Immun.11, 99–112. doi: 10.1038/gene.2009.83
9
Kinjyo I. Hanada T. Inagaki-Ohara K. Mori H. Aki D. Ohishi M. et al . (2002). SOCS1/JAB is a negative regulator of LPS-induced macrophage activation. Immunity17, 583–591. doi: 10.1016/S1074-7613(02)00446-6
10
Leikfoss I. S. Mero I.-L. Dahle M. K. Lie B. A. Harbo H. F. Spurkland A. et al . (2013). Multiple sclerosis-associated single-nucleotide polymorphisms in CLEC16A correlate with reduced SOCS1 and DEXI expression in the thymus. Genes Immun.14, 62–66. doi: 10.1038/gene.2012.52
11
León Machado J. A. Steimle V. (2021). The MHC class II transactivator CIITA: not (Quite) the odd-one-out anymore among NLR proteins. IJMS22, 1074. doi: 10.3390/ijms22031074
12
Li H. (2013). Aligning sequence reads, clone sequences and assembly contigs with BWA-MEM. Available online at: http://arxiv.org/abs/1303.3997 (Accessed May 11, 2024).
13
Li X. Tian F. Wang F. (2013). Rheumatoid arthritis-associated microRNA-155 targets SOCS1 and upregulates TNF-α and IL-1β in PBMCs. IJMS14, 23910–23921. doi: 10.3390/ijms141223910
14
Liu X. Zhang P. Bao Y. Han Y. Wang Y. Zhang Q. et al . (2013). Zinc finger protein ZBTB20 promotes toll-like receptor-triggered innate immune responses by repressing IκBα gene transcription. Proc. Natl. Acad. Sci. U.S.A.110, 11097–11102. doi: 10.1073/pnas.1301257110
15
Luo S. Li W. Xie Y. Wu B. Sun Y. Tian Q. et al . (2021). A molecular insight into the resistance of yellow drum to Vibrio harveyi by genome-wide association analysis. Aquaculture543, 736998. doi: 10.1016/j.aquaculture.2021.736998
16
Manna S. K. (2012). Double-edged sword effect of biochanin to inhibit nuclear factor kappaB: Suppression of serine/threonine and tyrosine kinases. Biochem. Pharmacol.83, 1383–1392. doi: 10.1016/j.bcp.2012.02.011
17
McKenna A. Hanna M. Banks E. Sivachenko A. Cibulskis K. Kernytsky A. et al . (2010). The Genome Analysis Toolkit: A MapReduce framework for analyzing next-generation DNA sequencing data. Genome Res.20, 1297–1303. doi: 10.1101/gr.107524.110
18
Mitchell S. Vargas J. Hoffmann A. (2016). Signaling via the NFκB system. WIREs Mech. Dis.8, 227–241. doi: 10.1002/wsbm.1331
19
Mohamad N. Amal M. N. A. Yasin I. S. M. Zamri Saad M. Nasruddin N. S. Al-saari N. et al . (2019). Vibriosis in cultured marine fishes: a review. Aquaculture512, 734289. doi: 10.1016/j.aquaculture.2019.734289
20
Mohd Yazid S. H. Mohd Daud H. Azmai M. N. A. Mohamad N. Mohd Nor N. (2021). Estimating the economic loss due to vibriosis in net-cage cultured Asian seabass (Lates calcarifer): evidence from the east coast of peninsular Malaysia. Front. Vet. Sci.8. doi: 10.3389/fvets.2021.644009
21
Naranbhai V. Fairfax B. P. Makino S. Humburg P. Wong D. Ng E. et al . (2015). Genomic modulators of gene expression in human neutrophils. Nat. Commun.6, 7545. doi: 10.1038/ncomms8545
22
Pan Z. Yao Y. Yin H. Cai Z. Wang Y. Bai L. et al . (2021). Pig genome functional annotation enhances the biological interpretation of complex traits and human disease. Nat. Commun.12(1), 1–15. doi: 10.1038/s41467-021-26153-7
23
Pandey R. Bakay M. Hain H. S. Strenkowski B. Yermakova A. Kushner J. A. et al . (2019). The autoimmune disorder susceptibility gene CLEC16A restrains NK cell function in YTS NK cell line and clec16a knockout mice. Front. Immunol.10. doi: 10.3389/fimmu.2019.00068
24
Pei H. Teng W. Gao L. Gao H. Ren X. Liu Y. et al . (2023). Low-affinity SPL binding sites contribute to subgenome expression divergence in allohexaploid wheat. Sci. China Life Sci.66, 819–834. doi: 10.1007/s11427-022-2202-3
25
Peng J. Li J. Liang J. Li W. Yang Y. Yang Y. et al . (2023). A C-type lectin-like receptor CD302 in yellow drum (Nibea albiflora) functioning in antibacterial activity and innate immune signaling. Int. J. Biol. Macromolecules247, 125734. doi: 10.1016/j.ijbiomac.2023.125734
26
Pi H. Li Y. Zhu C. Zhou L. Luo K. Yuan W. et al . (2002). A novel human SCAN/(Cys)2(His)2 zinc-finger transcription factor ZNF323 in early human embryonic development. Biochem. Biophys. Res. Commun.296, 206–213. doi: 10.1016/S0006-291X(02)00772-6
27
Reith W. LeibundGut-Landmann S. Waldburger J.-M. (2005). Regulation of MHC class II gene expression by the class II transactivator. Nat. Rev. Immunol.5, 793–806. doi: 10.1038/nri1708
28
Schuster C. Gerold K. D. Schober K. Probst L. Boerner K. Kim M.-J. et al . (2015). The autoimmunity-associated gene CLEC16A modulates thymic epithelial cell autophagy and alters T cell selection. Immunity42, 942–952. doi: 10.1016/j.immuni.2015.04.011
29
Shabalin A. A. (2012). Matrix eQTL: ultra fast eQTL analysis via large matrix operations. Bioinformatics28, 1353–1358. doi: 10.1093/bioinformatics/bts163
30
Soleimanpour S. A. Gupta A. Bakay M. Ferrari A. M. Groff D. N. Fadista J. et al . (2014). The diabetes susceptibility gene clec16a regulates mitophagy. Cell157, 1577–1590. doi: 10.1016/j.cell.2014.05.016
31
Sun S. Song C. Han F. He Q. Liu J. Zhang S. et al . (2023). Study on sex-linked region and sex determination candidate gene using a high-quality genome assembly in yellow drum. Aquaculture563, 738987. doi: 10.1016/j.aquaculture.2022.738987
32
Triga A. Issa Z. A. Smyrli M. Fenske L. Katharios P. (2024). Virulence and pangenome analysis of Vibrio harveyi strains from Greek and Red Sea marine aquaculture. Aquaculture587, 740839. doi: 10.1016/j.aquaculture.2024.740839
33
Ueki K. Kondo T. Kahn C. R. (2004). Suppressor of cytokine signaling 1 (SOCS-1) and SOCS-3 cause insulin resistance through inhibition of tyrosine phosphorylation of insulin receptor substrate proteins by discrete mechanisms. Mol. Cell. Biol.24, 5434–5446. doi: 10.1128/MCB.24.12.5434-5446.2004
34
Võsa U. Claringbould A. Westra H.-J. Bonder M. J. Deelen P. Zeng B. et al . (2021). Large-scale cis- and trans-eQTL analyses identify thousands of genetic loci and polygenic scores that regulate blood gene expression. Nat. Genet.53, 1300–1310. doi: 10.1038/s41588-021-00913-z
35
Xia J. Fang M. Wu X. Yang Y. Yu L. Xu H. et al . (2015). A2b adenosine signaling represses CIITA transcription via an epigenetic mechanism in vascular smooth muscle cells. Biochim. Biophys. Acta (BBA) - Gene Regul. Mech.1849, 665–676. doi: 10.1016/j.bbagrm.2015.03.001
36
Xu D. Zhang W. Chen R. Song H. Tian L. Tan P. et al . (2021). Chromosome-scale assembly and high-density genetic map of the yellow drum, Nibea albiflora. Sci. Data8, 268. doi: 10.1038/s41597-021-01045-z
37
Yang J. Lee S. H. Goddard M. E. Visscher P. M. (2011). GCTA: A tool for genome-wide complex trait analysis. Am. J. Hum. Genet.88, 76–82. doi: 10.1016/j.ajhg.2010.11.011
38
Zhang X.-H. He X. Austin B. (2020). Vibrio harveyi: a serious pathogen of fish and invertebrates in mariculture. Mar. Life Sci. Technol.2, 231–245. doi: 10.1007/s42995-020-00037-z
39
Zhang Y. Wang M. Li Z. Yang X. Li K. Xie A. et al . (2024). An overview of detecting gene-trait associations by integrating GWAS summary statistics and eQTLs. Sci. China Life Sci. doi: 10.1007/s11427-023-2522-8
40
Zuvich R. L. Bush W. S. McCauley J. L. Beecham A. H. De Jager P. L. Ivinson A. J. et al . (2011). Interrogating the complex role of chromosome 16p13.13 in multiple sclerosis susceptibility: independent genetic signals in the CIITA–CLEC16A–SOCS1 gene complex. Hum. Mol. Genet.20, 3517–3524. doi: 10.1093/hmg/ddr250
Summary
Keywords
expression quantitative trait locus (eQTL), genome-wide association study (GWAS), Vibrio harveyi , yellow drum (Nibea albiflora), zinc finger protein
Citation
Huang Y, Li J, Li W and Han F (2024) Integrative GWAS and eQTL analysis identifies genes associated with resistance to Vibrio harveyi infection in yellow drum (Nibea albiflora). Front. Mar. Sci. 11:1435469. doi: 10.3389/fmars.2024.1435469
Received
20 May 2024
Accepted
25 June 2024
Published
11 July 2024
Volume
11 - 2024
Edited by
Hongyu Ma, Shantou University, China
Reviewed by
Sofia Priyadarsani Das, National Taiwan Ocean University, Taiwan
Huaping Zhu, Chinese Academy of Fishery Sciences, China
Updates
Copyright
© 2024 Huang, Li, Li and Han.
This is an open-access article distributed under the terms of the Creative Commons Attribution License (CC BY). The use, distribution or reproduction in other forums is permitted, provided the original author(s) and the copyright owner(s) are credited and that the original publication in this journal is cited, in accordance with accepted academic practice. No use, distribution or reproduction is permitted which does not comply with these terms.
*Correspondence: Fang Han, hanfangyc@jmu.edu.cn
Disclaimer
All claims expressed in this article are solely those of the authors and do not necessarily represent those of their affiliated organizations, or those of the publisher, the editors and the reviewers. Any product that may be evaluated in this article or claim that may be made by its manufacturer is not guaranteed or endorsed by the publisher.