
94% of researchers rate our articles as excellent or good
Learn more about the work of our research integrity team to safeguard the quality of each article we publish.
Find out more
ORIGINAL RESEARCH article
Front. Mar. Sci., 04 October 2024
Sec. Physical Oceanography
Volume 11 - 2024 | https://doi.org/10.3389/fmars.2024.1434365
 Zoe Louisa Jacobs1*
 Fatma Jebri2
 Sarah Wakelin3
 James Strong4
 Ekaterina Popova1
 Meric Srokosz2Alexandra Loveridge1
Up to now, the UK has avoided major marine heatwaves (MHWs) that cause severe damage to marine ecosystems and the blue economy. However, an unprecedented in its intensity, though short-lived, MHW occurred in UK waters in June 2023. This event sounded an alarm bell, highlighting gaps in our understanding of MHW characteristics and their potential future impacts in the UK. Here, we use a combination of remote sensing data and model output to characterise MHWs and Marine Cold Spells (MCSs) around the UK and the wider North Atlantic, and to assess the potential for concurrent biogeochemical extreme events. Results indicate that across the wider North Atlantic, the UK is not a hot spot for MHWs or MCSs but, regionally, the southern North Sea experiences the most activity. This is also the location of extreme chlorophyll-a concentrations, here termed blue waves (low chlorophyll-a) and green waves (high chlorophyll-a). However, there is not a very pronounced relationship between temperature and chlorophyll-a extremes, which may be impacted by the exact location, drivers and season of occurrence. In contrast, the southern North Sea and English Channel may experience a MHW and low near-bottom oxygen compound events year-round, which, due to the combination of thermal stress and reduced oxygen availability, may negatively impact benthic marine ecosystems. While MHWs in UK waters do not appear to be as long-lasting or intense as other well-documented events around the world, they are projected to increase. Thus, the UK has a unique opportunity to learn from other nations and so develop robust and comprehensive policies to increase preparedness and response capability for future extreme events.
Marine heatwaves (MHWs) are periods of extremely warm Sea Surface Temperature (SST), SST >90th percentile (Hobday et al., 2016), that occur in regions across the global ocean. By definition, these events must last at least 5 days to be classed as a MHW, but the most impactful events have lasted months or even years (Hobday et al., 2018). For example, “The Blob“, which caused severe ecological and socio-economic impacts in the Northeast Pacific lasted 711 days from 2013-15 (e.g., Cavole et al., 2016) and the 2015 MHW in the Tasman Sea lasted 252 days (Oliver et al., 2017).
In June 2023, the United Kingdom (UK) witnessed an intense but short-lived (16 days) MHW which affected the majority of the Northeast Atlantic and captured the attention of scientific (e.g. McCarthy et al., 2023; Berthou et al., 2024) and media communities alike. Unlike other regions around the world that experience widely documented MHWs, including those in the North Pacific (Amaya et al., 2020), Australia (Pearce and Feng, 2013; Oliver et al., 2017), the Pacific Islands (Holbrook et al., 2022) and the Northwest Atlantic (Perez et al., 2021), the UK has notably avoided any major MHWs that have caused significant damage to marine ecosystems and the regional blue economy. The 2023 MHW exposed the gap in our understanding of the characteristics of MHWs (and their antipodes, cold spells) in this region and their potential impacts on the wider marine ecosystem.
Over the last 40 years, the SST around the UK has been increasing by about 0.3°C per decade, with the greatest increase observed in the southern North Sea (Cornes et al., 2023). In addition to background warming, MHWs have become more frequent in this region (Cornes et al., 2023). Understanding the ecological impact of MHWs is vital, as, compared with background warming, they pose a direct threat of enhanced oxidative stress, or even mortality to many species as there is insufficient time for them to adjust their range distribution or for adaptation to higher temperatures (Borgman et al., 2022).
The negative impacts of MHWs have been widely documented and pose a major threat to marine ecosystems and their services globally (Smale et al., 2019). For example, major damage or complete collapse of seagrass meadows (e.g., Arias-Ortiz et al., 2018; Strydom et al., 2020) and kelp forests (e.g., Wernberg et al., 2016; Thomsen et al., 2019; Filbee-Dexter et al., 2020), widespread coral bleaching (e.g., Moore et al., 2012; Shlesinger and van Woesik, 2023) and mass mortality or major shifts of fisheries (Mills et al., 2013; Cavole et al., 2016; Caputi et al., 2016, 2019) have all been reported. Overall, sessile (permanently attached) taxa are found to be more affected than mobile and planktonic taxa due to the latter’s ability to migrate and adapt (Wernberg et al., 2016). It should also be noted that MHWs are not restricted to surface waters (e.g., Zhang et al., 2023; Sun et al., 2023), with subsurface biodiversity typically exposed to longer, more intense MHWs (Fragkopoulou et al., 2023).
Receiving less global attention are marine cold-spells (MCSs), SST <10th percentile (Schlegel et al., 2017). However, ecological impacts have been reported worldwide, including mass mortalities, habitat loss, species range shifts and changes in phenology (e.g., Wijffels et al., 2018; Schlegel et al., 2021). While MHWs are projected to increase over most regions, MCSs are projected to decline everywhere except from the North Atlantic subpolar gyre (Yao et al., 2022).
Across the UK, both seagrass beds and cold-water corals have been named as Priority Marine Features by Marine Scotland, UK Biodiversity Action Plan habitats by the Joint Nature Conservation Committee and are OSPAR threatened and declining habitats (UK Biodiversity Action Plan, 2008). Although the impacts of MHWs on these potentially sensitive habitats are not well documented, they are prevalent along the coast and at the continental shelf respectively (Figure 1) and could be under threat in future.

Figure 1. Bathymetry and occurrences of seagrass and cold-water corals around the UK, the black line demarcates the UK’s Exclusive Economic Zone (EEZ). Data sourced from the UN Environment World Conservation Monitoring Centre.
While reports of biological impacts of MHWs around the UK are limited, in the English Channel they have been found to increase the abundance of dinoflagellates, initiating harmful algal blooms (Gómez and Souissi, 2008; Brown et al., 2022) and, in 2018, causing the mass mortality of mussels (Seuront et al., 2019). This region also has high connectivity with the warmer waters found in the Bay of Biscay, which is important for larval dispersal and connectivity (Ayata et al., 2010). Hence, during an upstream MHW, warmer-water non-native species might enter this region, which may cause substantial shifts in ecosystem dynamics (Atkinson et al., 2020).
In the North Sea, a high proportion of species are living at the edge of their thermal limits (Smale et al., 2019). Here, MHWs are thought to have caused a decline in the populations of dominant zooplankton species during recent summers (2018-2022), with the physiological thermal limit exceeded for multiple species (Semmouri et al., 2023). However, the impact on North Sea fisheries remains unclear with some species (sole, lobster and sea bass) found to increase in abundance 5 years after a MHW, while others (red mullet) were found to decline over the same timescale (Wakelin et al., 2021). The choice of the 5-year period is based on the time it takes for growth between the egg or larvae stage to reach landing size (Wakelin et al., 2021). Whereas for MCSss significant correlations were found for the same year (increased landings of sole and decreased landings of sea bass), which may indicate behavioral impacts on certain species (Wakelin et al., 2021).
Yet to be explored for this region is the occurrence and impacts of biogeochemical compound events, i.e. when MHWs co-occur with extremes in oxygen, acidity or productivity (e.g. Gruber et al., 2021; Le Grix et al., 2021; Burger et al., 2022), which may be important as they have the potential to amplify the effects on the marine ecosystem. For example, harmful algal blooms have been reported in the English Channel during MHW events (Gómez and Souissi, 2008; Brown et al., 2022) but the impact on oxygen and acidity remains unknown. Overall, the UK’s monitoring and reporting on the impact of MHWs is lagging that of other countries in temperate regions, which may be due to the lack of historical MHWs on a greater scale.
The bathymetry, atmospheric circulation and ocean currents in the Northeast Atlantic, more specifically on the Northwest European Shelf (e.g. Holt et al., 2010), are unique and will affect the physical properties (e.g. timing, duration and intensity) of MHWs that are distinct from those occurring in tropical or other temperate regions, where the majority of MHW research has been focused. One of the key characteristics of the region is its high seasonality, making the timing of MHWs particularly relevant in the context of species phenology. This feature can lead to strong biological impacts (e.g., Anderson et al., 2013). Another potential consequence of strong seasonality is a contrasting response of marine biota to MHWs occurring in summer and in winter. For example, in summer, species’ thermal limits may be exceeded, which can cause widespread damage or mortality, which is commonly reported in tropical regions (Leggat et al., 2019; Garrabou et al., 2022; Smith et al., 2023). However, in winter, they may cause an influx of warm-water species (Oliver et al., 2017; Sanford et al., 2019) or unexpectantly trigger harmful algal blooms (Cavole et al., 2016; Roberts et al., 2019), which may impact trophic dynamics and species’ life cycles.
The southern North Sea has been identified as a region of interest due to its shallow depth (mostly <50m) (Huthnance et al., 2022; Mohamed et al., 2023). In addition to possible impacts on benthic ecosystems due to the shallow depths, this makes it more sensitive than other areas in the Northeast Atlantic to local and regional drivers (Schlegel et al., 2017). For example, MHWs have been found to occur during or just after atmospheric heatwaves (Giménez et al., 2024), highlighting the importance of atmospheric drivers in this region. However, the warm Atlantic inflow through the English Channel may also be a prominent driver (Mohamed et al., 2023).
There is evidence that MHWs have become more frequent and are lasting longer in the English Channel and eastern North Sea over the past four decades (Simon et al., 2023; Giménez et al., 2024). However, trends for the wider Northeast Atlantic reveal that the region north of the UK has experienced the greatest increase in MHW events since 1982 (Cornes et al., 2023). Regardless of regional differences, there is a clear trend for more MHWs and fewer MCSs in UK waters, with recent projections indicating that, by the end of the century, 93% of the year will experience MHW (SST>90th percentile) conditions, based on the 2000-19 climatology (Berthou et al., 2024).
MHWs are evidently on the rise in this region, as exemplified by the unprecedented event in June 2023 (Berthou et al., 2024). While the extensive media attention [e.g., from The Guardian: “An “unheard of” marine heatwave off the coasts of the UK and Ireland poses a serious threat to species” (Horton, 2023) and the Washington Post: “could pose a deadly threat to marine life and impact summer weather in the UK” (Stillman, 2023)] raised awareness of the importance of MHWs and likely stimulated discussions on future climate action, the portrayal of the event may have been misleading. For example, while anomalies reaching 4°C were recorded west of Ireland, the event itself lasted just 16 days (McCarthy et al., 2023; Berthou et al., 2024). This raises questions about the ecological impacts it may have had and underscores the importance of balanced media reporting. While intense at its peak, the event was relatively short, it was located off the UK’s continental shelf in deeper waters and occurred long before peak temperatures are reached at the end of summer. Therefore, it is unlikely that any species’ thermal limits were breached. In contrast, “The Blob”, an intense MHW in the northeast Pacific, lasted for 2 years (Di Lorenzo and Mantua, 2016) and caused diverse biological impacts including low productivity, mass die offs of fisheries and seals, mass whale strandings, reproductive failure of seabirds and major fisheries distribution changes (Cavole et al., 2016; Barbeaux et al., 2020; Piatt et al., 2020; Rogers et al., 2021; Cheung and Frölicher, 2020; Suryan et al., 2021), which, overall, led to substantial economic losses in North America (Cavole et al., 2016; Smith et al., 2021). However, while it is unlikely that the ecological impacts of the June 2023 MHW were as dramatic or as wide ranging as those of “The Blob”, it amplified the terrestrial heatwave occurring at the same time and generally led to increased temperatures and precipitation over western Europe (Berthou et al., 2024).
This paper aims to reduce a crucial gap in our understanding of the occurrence of MHWs and MCSs around the UK and wider Northeast Atlantic. We aim to characterize their past occurrences, i.e., frequency, duration, intensity and spatial distributions, using remotely sensed SST data over the period 1983-2023. Furthermore, we will contextualize these findings within the broader North Atlantic region and assess the potential for compound biogeochemical events using remotely-sensed chlorophyll-a (chl-a) and chl-a, oxygen and pH from a biogeochemical model.
We consider a daily satellite SST reprocessed Level 4 product over the period 1 October 1981 to 11 October 2023 at 5 km spatial resolution. This is the multi-satellite global Operational-Sea-Surface-Temperature-and-Sea-Ice-Analysis (OSTIA) dataset acquired from the Copernicus Marine Service (CMS) (http://marine.copernicus.eu/services-portfolio/access-to-products/).
We use daily reprocessed satellite-derived Chl-a Level 4 data over the period 4 September 1997 to 30 September 2023 at a spatial resolution of 4 km. This is a multi-satellite global ocean colour dataset made available from the GlobColour project (http://globcolour.info) and downloaded from CMS (http://marine.copernicus.eu/services-portfolio/access-to-products/). The satellite-derived ocean colour observations have acknowledged weaknesses, such as the possible overestimation of Chl-a concentrations in coastal or shallow waters (<30m, Zhang et al., 2006). The reason is the influence of suspended material and dissolved organic matter that may cause high water leaving radiance and an overestimation of the correction term in the satellite Chl-a (IOCCG, 2000). However, not all these high Chl-a values are incorrect as they could represent phytoplankton growth due to nutrients from riverine outflow (Seitzinger et al., 2010).
We use daily fields from an ocean reanalysis model covering the northwest European continental shelf and adjacent Atlantic Ocean. The model is the 7-km resolution Atlantic Margin Model (AMM7) configuration of the Nucleus for European Modelling of the Ocean (NEMO, Madec, 2008; O'Dea et al., 2017), coupled to the European Regional Seas Ecosystem Model (ERSEM, Butenschön et al., 2016). In the vertical, data are provided on 24 constant depth levels. Observations of sea surface chl-a concentrations from ocean colour satellite data, surface temperature from satellite data and vertical profiles of in-situ temperature and salinity are assimilated using the NEMOVAR system (Mogensen et al., 2012; Skákala et al., 2018; Waters et al., 2015). Although the reanalysis starts in 1993, chl-a observations are not assimilated until September 1997, so we analyze the period from 1998 only. Data are downloaded from the Copernicus Marine Service portal (up to the last full year available: 2022, accessed 7th December 2023): https://doi.org/10.48670/moi-00059 for near-surface temperature and https://doi.org/10.48670/moi-00058 for chl-a concentrations at 30m depth, and oxygen concentrations and pH at the deepest level available at each model location.
The method used to detect marine extremes follows the widely accepted definition of Hobday et al. (2016). First, the daily SST climatology, 90th and 10th percentiles are calculated over the 30-year period 1983-2012 from the satellite product. A MHW (MCS) is detected if the SST exceeds the 90th (falls below the 10th) percentile for at least 5 days (see Figure 2). SST must be less than the 90th percentile (above the 10th) for at least 2 days for a new MHW (MCS) to be registered. Due to the best coverage provided by satellite data products, only surface events are considered in this analysis. The analysis of model data applies the same method but uses the full timeseries (1998 to 2022) to calculate the climatology and 10th and 90th percentiles.

Figure 2. Daily satellite (OSTIA) SST at 57°N, 10°E during the June 2023 MHW event (black line), selected to illustrate the MHW definition. 30-year climatology, 90th percentile and 10th percentiles are calculated over the period 1983-2012.
The same method is applied to the remotely sensed chl-a product to calculate high and low extremes in phytoplankton biomass, following Le Grix et al. (2021). The current chl-a record extends from September 1997 so the daily climatology and percentiles of chl-a are calculated over the 25-year period 1998-2023 Here, we define low extremes in phytoplankton biomass (chl-a < 10th percentile) as “bluewaves” and high extremes in phytoplankton biomass (chl-a > 10th percentile) as “greenwaves”. As for MHWs and MCSs, the extreme in chl-a must last for at least 5 days to be classified as a bluewave or greenwave. It should be noted that as Hobday et al. (2016) recommend a minimum 30-year period to calculate a baseline climatology, we have selected the earliest 30-year (SST) and 25-year (Chl-a) period available for each dataset.
To characterize the extremes in the Northeast Atlantic the following parameters are averaged for each year (i.e. 1982-2023 for MHWs and MCSs, and 1998-2023 for bluewaves and greenwaves): the frequency (number of events), duration (mean length of the event), total days under extreme conditions and maximum intensity (greatest deviation of SST or chl-a from the climatology during the extreme event). Cumulative intensity (integrated temperature anomaly over the duration of the event) is also calculated for MHWs and MCSs only as it is a measure of prolonged heat stress (Hobday et al., 2016).
To explore the potential for compound events over the North Atlantic, the total number of days experiencing MHWs per year is correlated with that for bluewaves and greenwaves and the total number of days experiencing MCSs per year is correlated with that for bluewaves and greenwaves for the overlapping time period 1998-2023. As these events are calculated separately and saved annual averages, there is no way of knowing whether these events occur at the same time and are referred to as “potential” compound events.
Point occurrence data for seagrass (UNEP-WCMC and Short FT, 2021) and cold-water corals (Freiwald et al., 2021) were downloaded from the UNEP-WCMC Ocean + Data Viewer portal. For visualization, EEZ boundaries were downloaded from Marine Regions (Flanders Marine Institute, 2023).
The sensitivity maps were based on the full coverage habitat map provided by EUSeaMap version 2023 (Vasquez et al., 2023). The sensitivity attribution was provided by the Marine Evidence–based Sensitivity Assessment (MarESA – Tyler-Walters et al., 2023). Habitats within MarESA are classified according to the Marine Habitat Classification for Britain and Ireland Version 22.04 (JNCC, 2022) whereas the habitats delineated in the EUSeaMap are based on the 2019 version of the European Union Nature Information System (EUNIS) habitat classification scheme (EEA, 2019). To align the two sources of information, a ‘cross-walk’ translation matrix (European Environment Agency, 2021) was used to convert the habitat classes in MarESA to their closest EUNIS class. The converted sensitivity estimates were then attributed, in ESRI ArcGIS Pro, to the mapped habitats provided by EUSeaMap.
The extent of the sensitivity of the benthic communities to MHWs (combined with sensitivity to ‘increased temperature’) has been provided to highlight the areas most vulnerable to potential impacts following these events. It was apparent that the evidence for assessing the sensitivity of marine habitats to MHWs (middle emission scenario benchmark: a MHW occurring every three years, with a mean duration of 80 days, with a maximum intensity of 2°C) is poor, which led to large areas being labelled as being either ‘No evidence’ or ‘Not assessed’. To provide a better spatial understanding of thermal sensitivity, the sensitivity to ‘increased temperatures’ (bench mark of: a 5°C increase or decrease in temperature for a one-month period, or 2°C for one year) was combined with the small and highly localised footprint for the MHW sensitivity.
To effectively categorize marine extremes around the UK, they must be put into context of the wider mid-high-latitude North Atlantic (30-65°N), hereby referred to as the North Atlantic, which spans subtropical and subpolar environments and a range of dynamical systems e.g. western boundary currents and upwelling regions. Focusing on the open ocean (excluding enclosed or semi-enclosed seas such as the Mediterranean Sea or Hudson Bay), the Gulf Stream appears as a hot spot for both MHWs and MCSs over the North Atlantic (Figure 3). On average, over a 43-year period, the Gulf Stream and western subtropical gyre experience ~3.5 MHWs per year (Figure 3A) with a maximum intensity of >5°C (Figure 3D) and cumulative intensity (CI) of >80°Cd in the main current (Figure 3E), nearly double that recorded anywhere else. The situation is similar for MCSs with >3 (on average) recorded in the Gulf Stream per year (Figure 3F) with a maximum intensity <-5°C (Figure 3I) and a CI exceeding -60°C/day (Figure 3J). Whilst this region is a hot spot for recurring, intense MHWs and MCSs, they are short-lived (<10 days; Figures 3B, G), with an average of (mostly) <40 days of the year subjected to extreme conditions (Figures 3C, H).
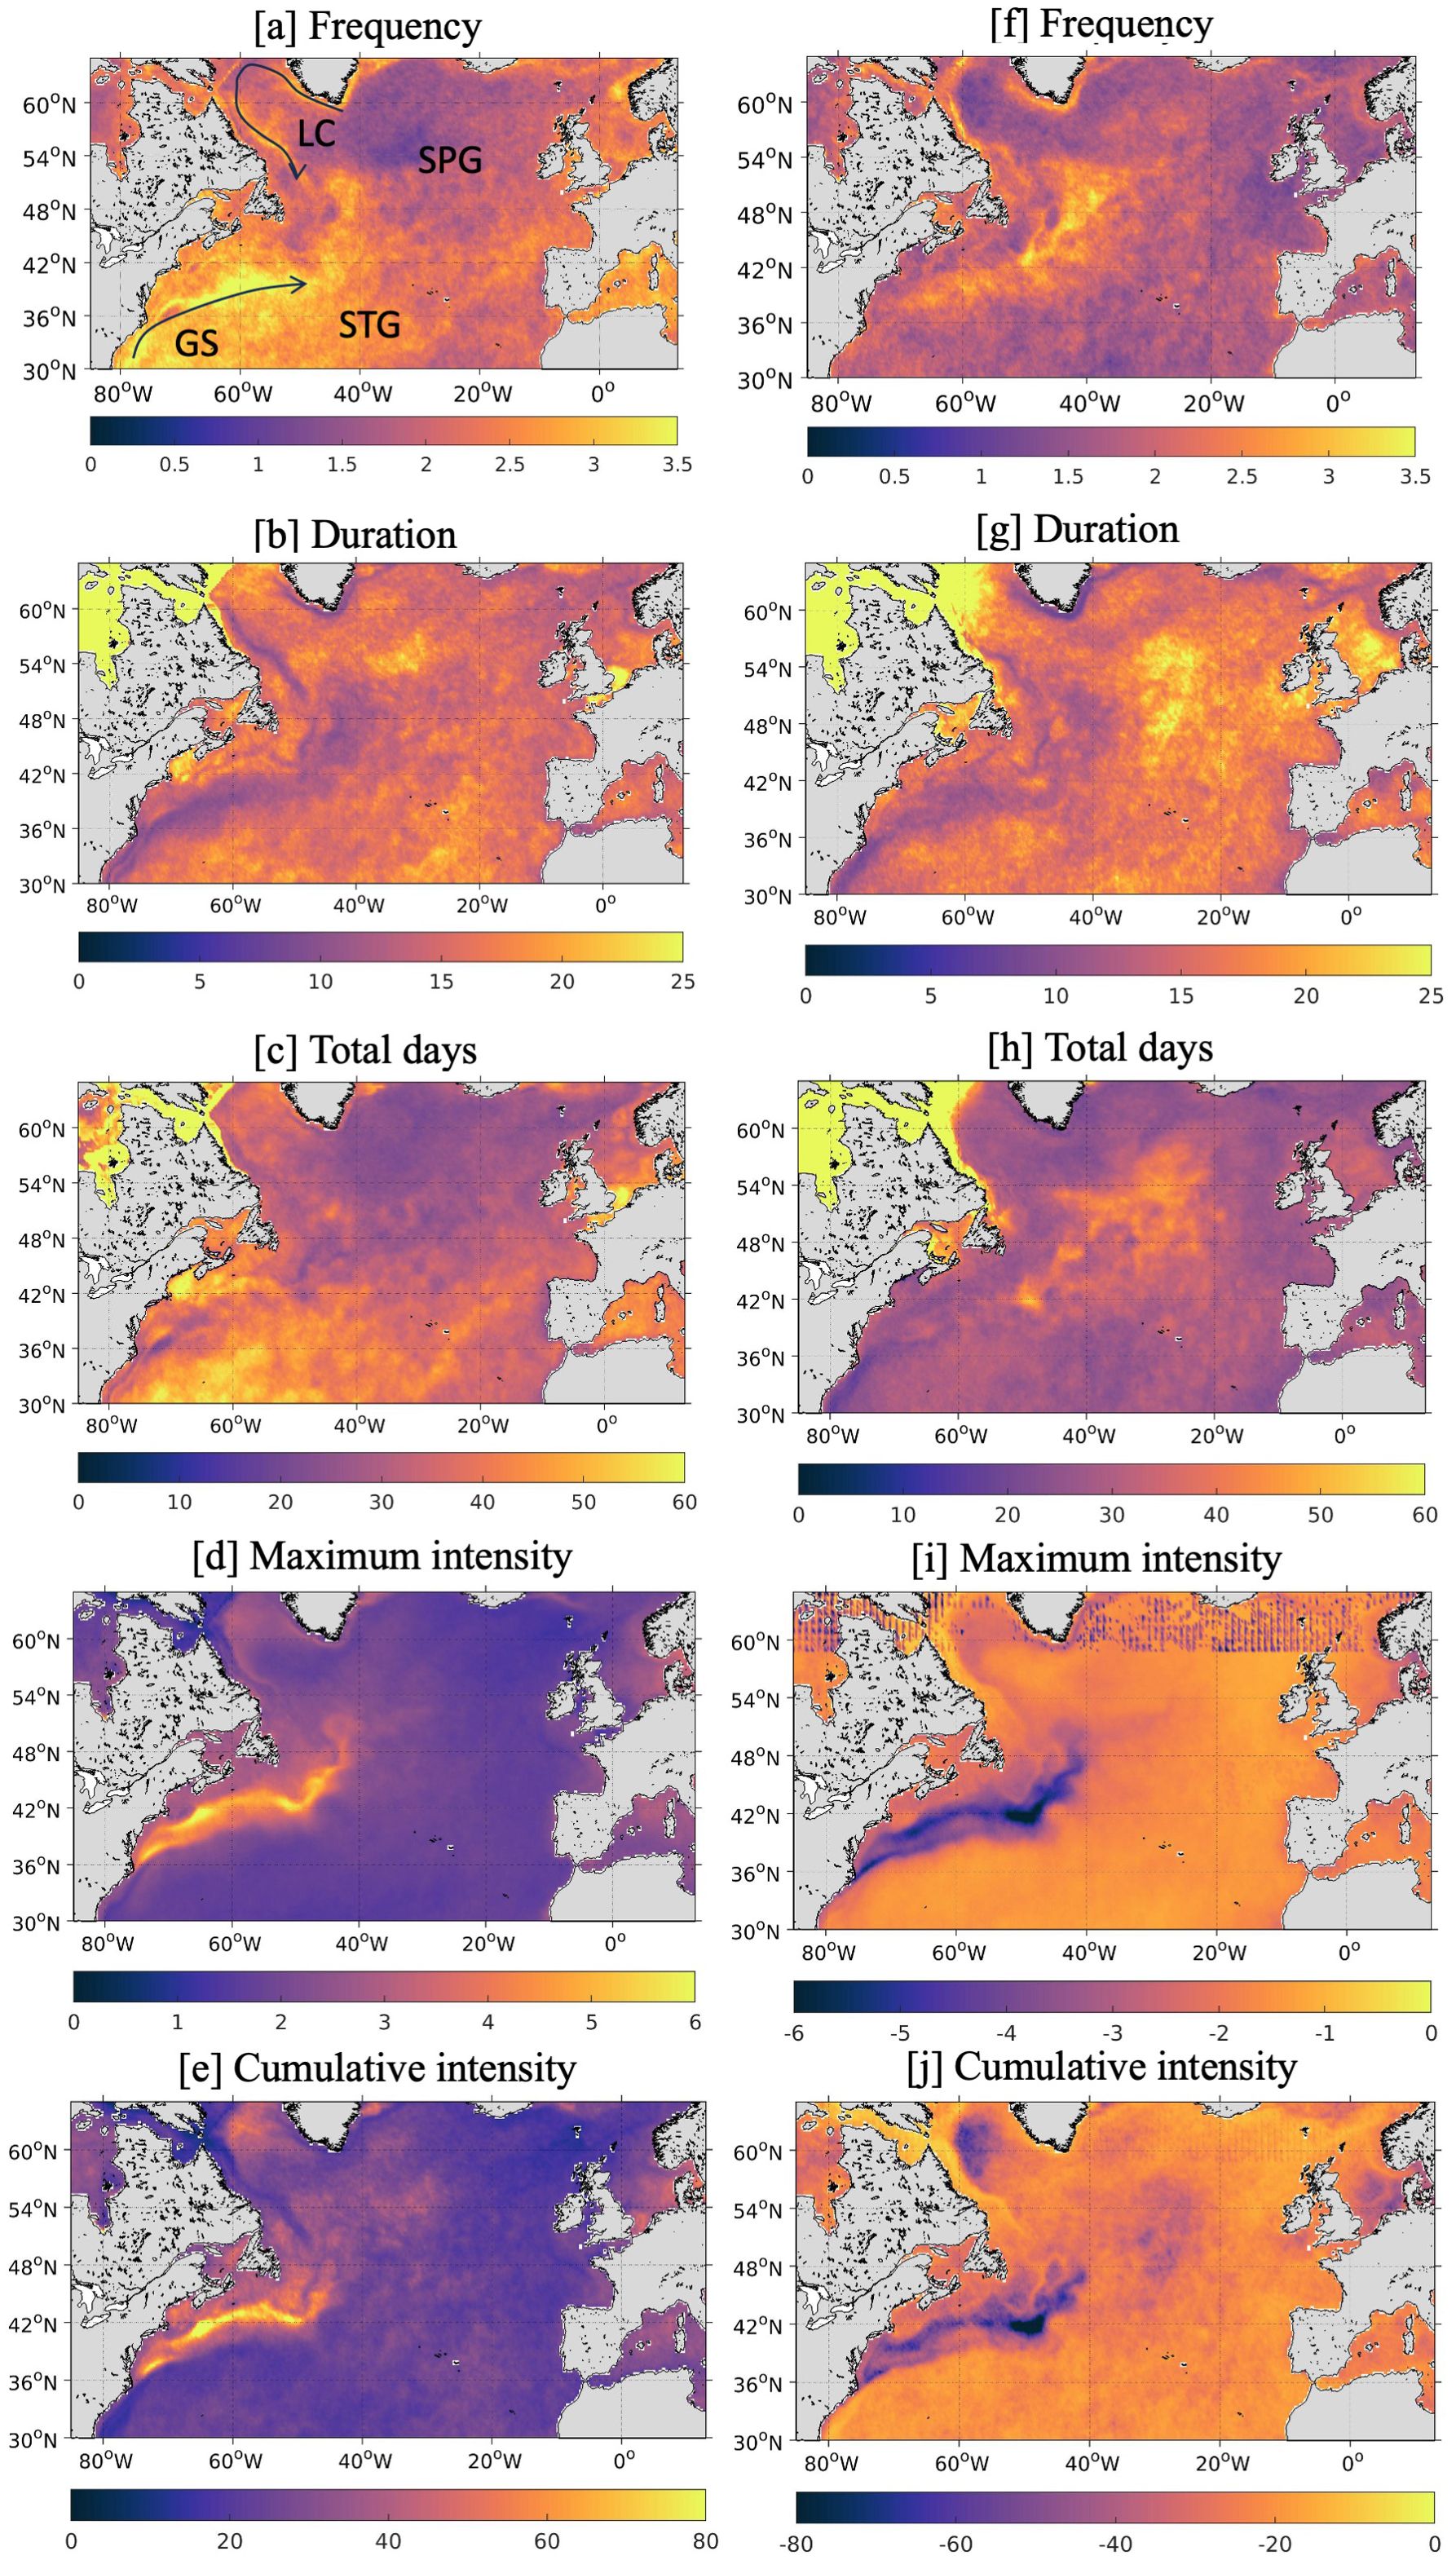
Figure 3. Mean frequency (A, F), duration [days; B, G], total days (C, H), maximum intensity [°C; D, I] and cumulative intensity [°C/day; E, J] of MHWs (left) and MCSs (right) over the mid-high-latitude North Atlantic per year, then averaged over the period 1982-2023 using satellite SST data from OSTIA. The annotations on panel [A] refer to the Gulf Stream (GS), the Labrador Current (LC), subpolar gyre (SPG) and subtropical gyre (STG).
While the subpolar gyre experiences the fewest MHWs, ~1 per year lasting <20 days (Figure 3A, B), this region is a hot spot for MCSs with up to 3 occurring per year, lasting up to 25 days (50-60 total days per year), with a maximum intensity of -2.5°C and a CI of around -40°C/day (Figures 3F–J). This region coincides with the North Atlantic “cold blob” (Josey et al., 2018). Other noteworthy regions include the slope water north of the Gulf Stream and the southern North Sea, east of the UK, that experience MHW conditions for ~2 months of the year (Figure 3C), with the latter and parts of the Labrador Sea reaching a CI of ~-40°Cd (Figure 3E). The Labrador Current (as opposed to the Labrador Sea) and the southern North Sea also emerge as regional hot spots for MCSs.
Regional hotspots are also apparent when focusing on the waters surrounding the UK (Figure 4). As was evident from Figure 3, the southern North Sea experiences ~60 days (Figure 4C) of intense (>3°C and 45°Cd; Figures 4D, E) MHW conditions but from just 2-2.5 (Figure 4A) events per year. The longest events (up to 1 month) occur in the English Channel and off the southeast coast of the UK (Figure 4B) but the most intense (maximum intensity 2.5-3°C; Figure 4D) occur further east. In contrast, the English Channel and the Irish Sea experience an average of >50 days per year but with a weaker maximum intensity of 1.5°C and CI of 20-35°C/d (Figures 4C–E). Around the UK, there are typically just 1-1.5 MCSs per year that last ~25 days and have a maximum intensity exceeding -2°C and a CI exceeding -40°Cd (Figure 4F). It should also be noted that MHWs and MCSs are concentrated on the continental shelf with their occurrence reducing substantially in the deeper waters to the west of the UK.
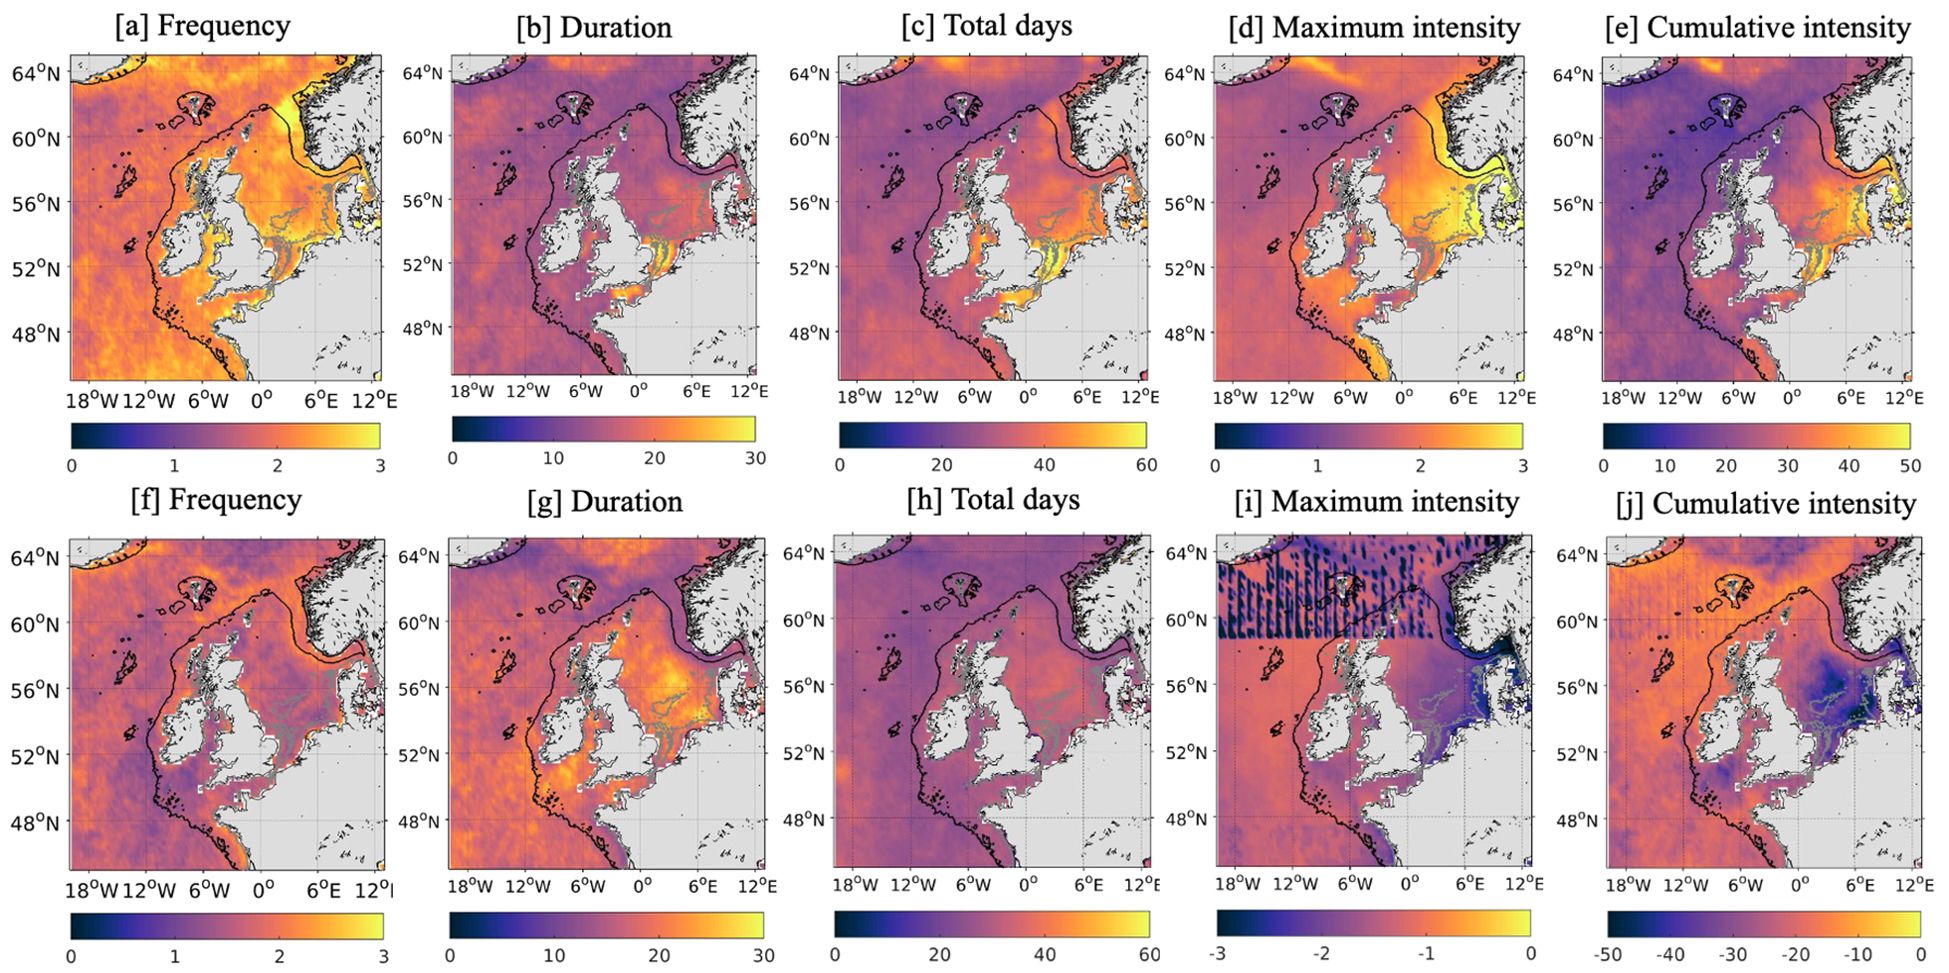
Figure 4. Mean frequency (A, F), duration [days; B, G], total days (C, H), maximum intensity [°C; D, I] and cumulative intensity [°C/day; E, J] of MHWs (top) and MCSs (bottom) around the UK per year, then averaged over the period 1982-2023 using satellite SST data from OSTIA. The 30m and 200m bathymetry are represented by the grey and black line respectively.
To summarize, in the wider North Atlantic the Gulf Stream and its extension emerge as a hot spot for short, but intense, MHWs and MCSs. MCSs are also prevalent in the central subpolar gyre and the Labrador Sea. The waters around the UK do not stand out across the North Atlantic shelves, or even the whole North Atlantic basin, but the region is not completely devoid of temperature extremes and clearly exhibits its own regional variability. The southern North Sea is identified as the main hot spot for both MHWs and MCSs with the greatest CI and total days experienced in the region. However, the Irish Sea and English Channel also experience several MHWs per year but they are relatively weaker than those occurring in the southern North Sea.
Figure 5 quantifies the average frequency and total days of chl-a extremes over the North Atlantic. The greatest number of bluewaves (i.e., low chl-a concentrations) occurs in the western subpolar gyre (up to 3 per year) with an overall greater frequency of up to 2 events per year across the subpolar gyre, Labrador Sea and in the Gulf Stream (Figure 5A). These regions also experience the highest total days (>25 days) under bluewave conditions (Figure 5B). Whilst events in the subtropics can last up to 2 weeks (Figure 5B), they are relatively weak (0-0.2mg/m3; Figure 5D), reflecting the low variability of chl-a in this region. In contrast, maximum intensity is greater in the subpolar North Atlantic (>0.3 mg/m3; Figure 5D) with events lasting 1-2 weeks (Figure 5B). The fewest events (~1 per year) occur in the central subtropical gyre, while the fewest days of bluewaves (<10 days) occur in small, localised areas, e.g. the central subtropical gyre and west of Norway.
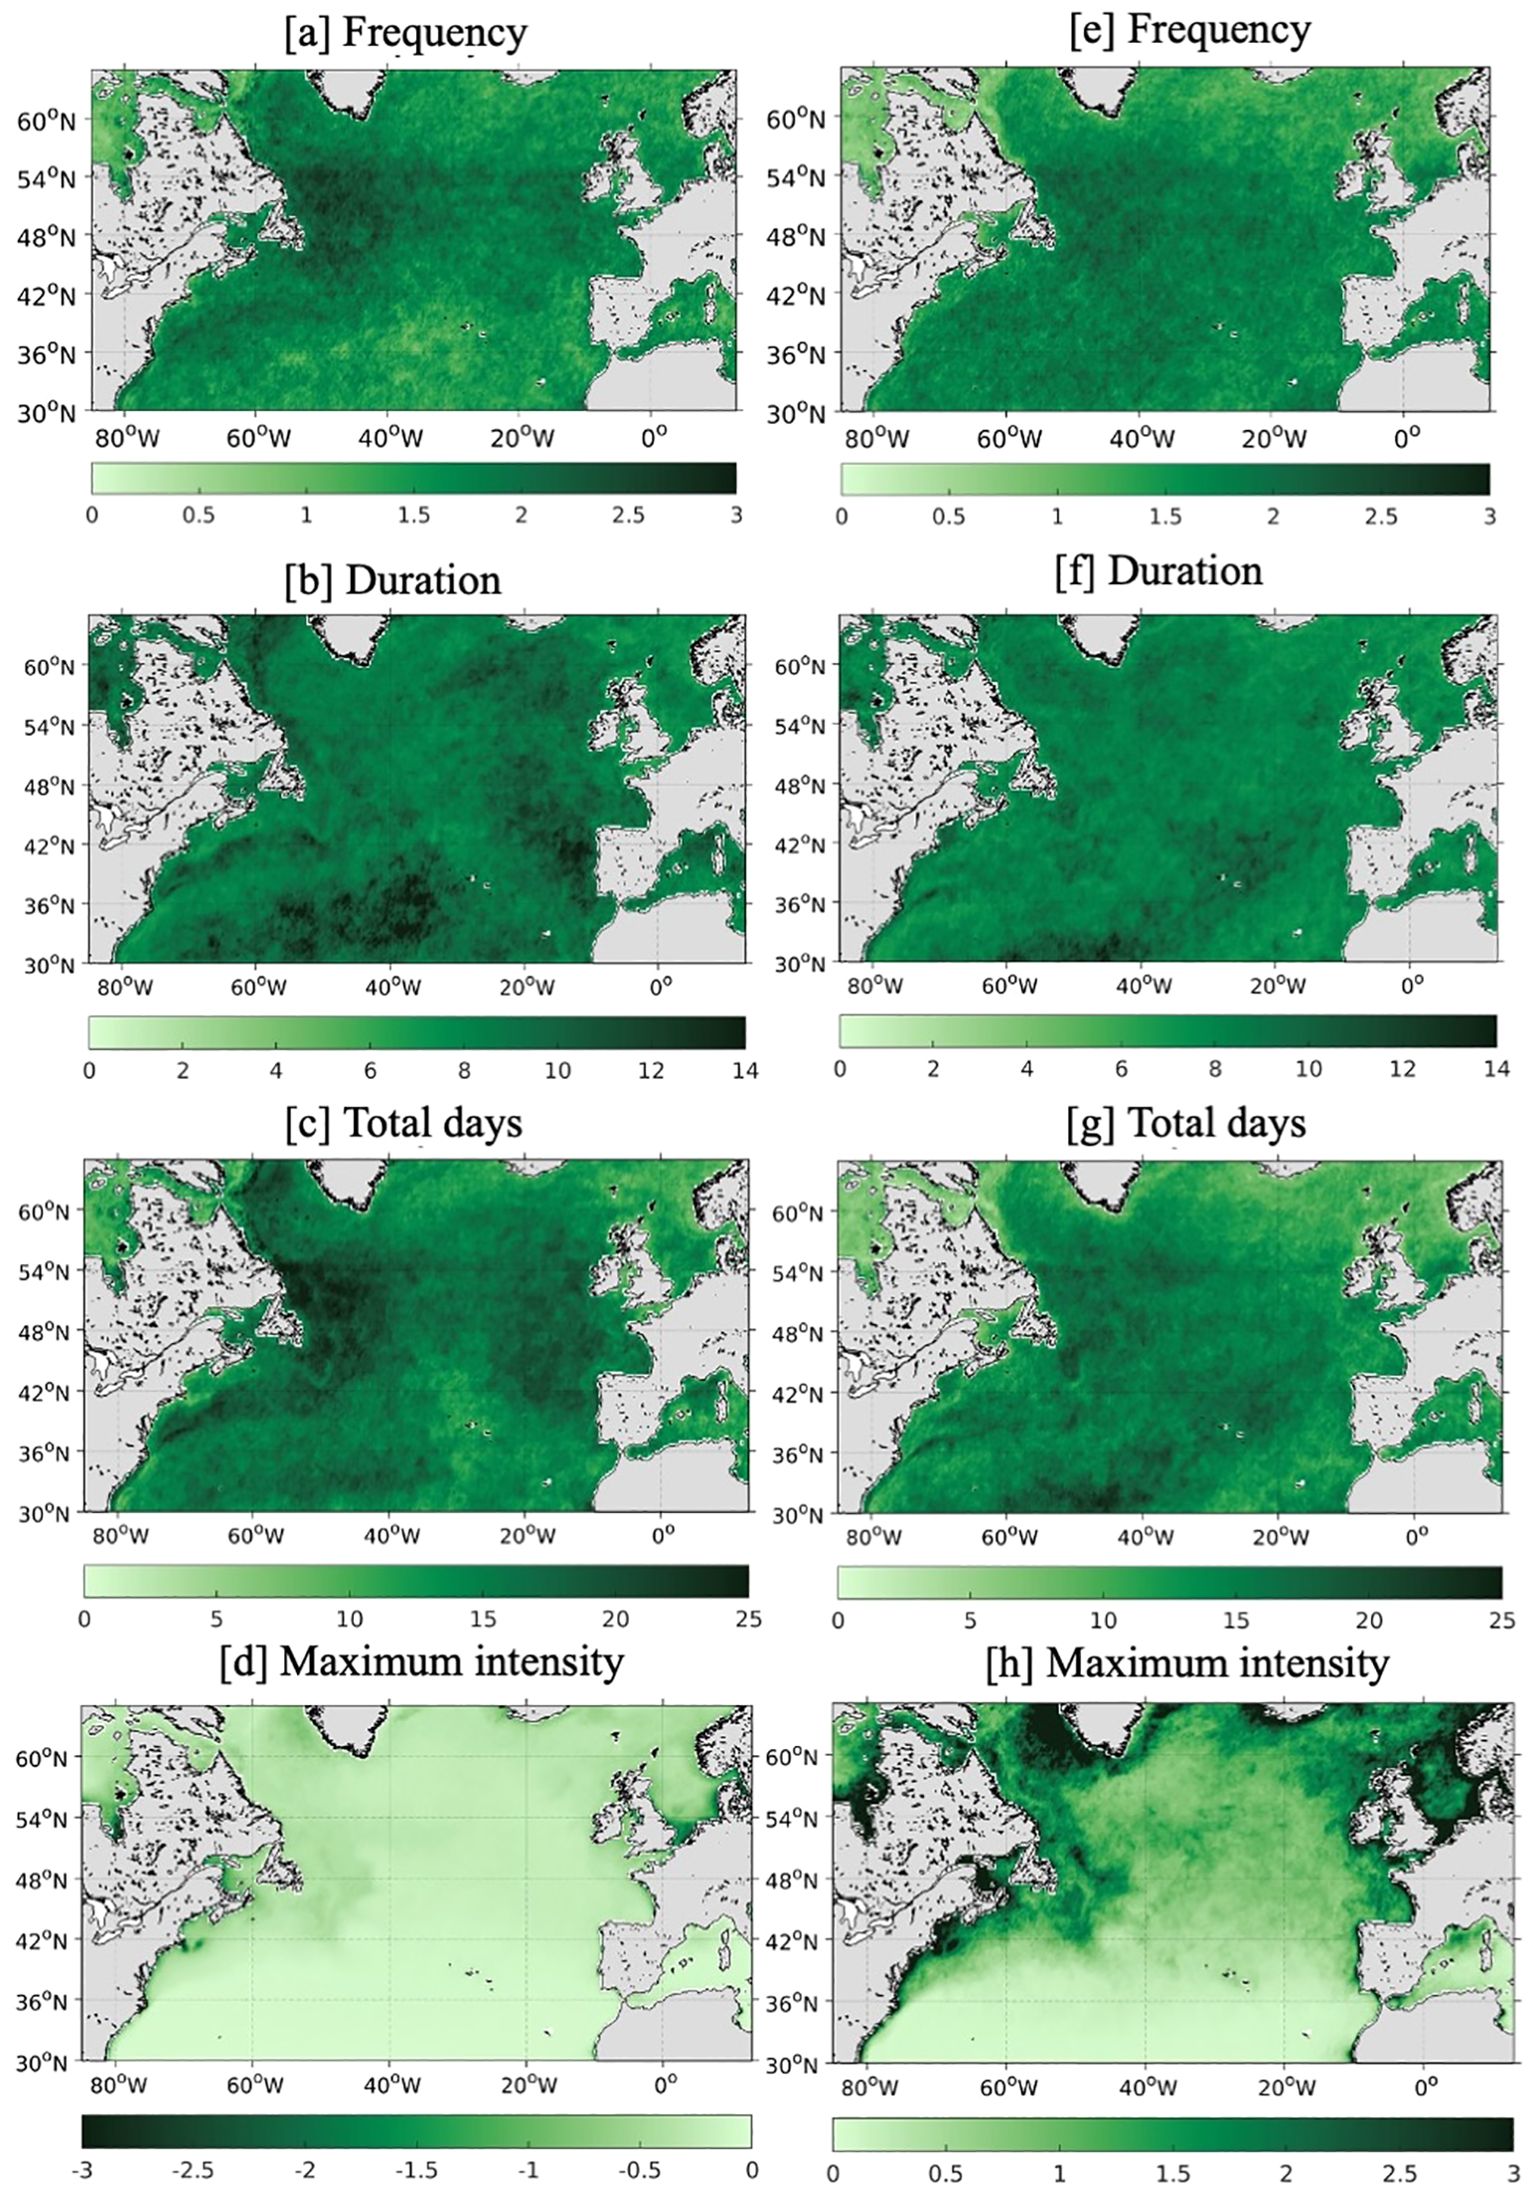
Figure 5. Mean frequency (A, E), duration [days; B, F], total days (C, G) and maximum intensity [mg/m3; D, H] of bluewaves (left) and greenwaves (right) over the mid-high-latitude North Atlantic per year, then averaged over the period 1998-2023 using satellite chlorophyll-a data from GlobColour.
In contrast, the average number of greenwaves (i.e., high chl-a concentrations) is fairly consistent across the North Atlantic with the majority of the region experiencing 1.5-2.5 events per year (Figure 5E). There is more variability in the total days experiencing greenwave conditions with <10 days west of Norway, but >20 days in the central subtropical gyre, along the southern edge of the Gulf Stream and in the western subpolar gyre (Figure 5D). Like for bluewaves, the longest greenwave events occur in the central subtropical gyre (up to 2 weeks) while the more intense events occur in the subpolar North Atlantic. For both, the most intense events occur close to the coasts of all countries (>3mg/m3), with the northwest European shelf being a particular hot spot.
When focusing on the waters surrounding the UK, regional variability becomes apparent. While the average number of bluewaves is 1.5-2.5 per year across the region (Figure 6A), the total days experiencing them peaks at >20 west of the UK in the open ocean, ~15-18 days in the North Sea and <10 days in the English Channel, Irish Sea and more broadly in coastal waters around the UK (Figure 6C). While these events tend to be relatively short-lived (6-10 days; Figure 6B), they are more intense, especially around the UK coast and in the southern North Sea with a maximum intensity of -1mg/m3 (Figure 6D). In contrast, greenwaves are concentrated around the southern half of the UK with ~2 intense (3-6mg/m3), short-lived events occurring per year (Figures 6E, F, H) that are active for 15-20 days of the year (Figure 6G). These extreme phytoplankton bloom hot spots are based in the southern North Sea, Irish Sea and south of Ireland. In northern UK waters (>55°N), this reduces to <10 days per year. However, it should be noted that the maximum intensity of events occurring in shallow, coastal waters (<30 m) may be overestimated (see section 2.1)

Figure 6. Mean frequency (A, E), duration [days; B, F], total days (C, G) and maximum intensity [mg/m3; D, H] of bluewaves (top) and greenwaves (bottom) around the UK per year, then averaged over the period 1998-2023 using satellite chlorophyll-a data from GlobColour. The 30m and 200m bathymetry are represented by the grey and black line respectively.
In summary, the highest frequency of chl-a extremes occurs in the Gulf Stream and western subpolar gyre for the North Atlantic. Excepting these regions, there are no major hot spots across the basin for either bluewaves or greenwaves. This is also apparent for the number of bluewaves around the UK, but a greater number of days is observed in the North Sea and off the continental shelf with the most intense events occurring in the southern North Sea. For greenwaves, there are clear hot spots in the southern North Sea and in the waters south of ~55°N in the English Channel, Irish Sea and south of Ireland with reduced activity in northern UK waters.
To explore the potential for compound events over the North Atlantic, the total number of days experiencing MHWs per year is correlated with that for bluewaves and greenwaves (Figures 7A, B) and the total number of days experiencing MCSs per year is correlated with that for bluewaves and greenwaves (Figures 7C, D). The largest and most significant correlations exist for MHWs and bluewaves (Figure 7A) and MCSs and greenwaves (Figure 7D). For both types of events, the highest significant correlations at the 95% level are positive and found in the subtropics, indicating that in these regions, MHWs are more likely to coincide with bluewaves and MCSs with greenwaves. For MHWs and bluewaves, the correlation coefficient exceeds 0.7 in the eastern subtropical gyre, in parts of the broader gyre and also in the Gulf Stream. High significant correlations are also present in the central subpolar gyre but overall, north of ~50°N no clear pattern emerges. Around the UK, MHWs are negatively correlated with bluewaves, indicating that MHWs may increase chl-a in this region. However, this result is not statistically significant at the 95% level.
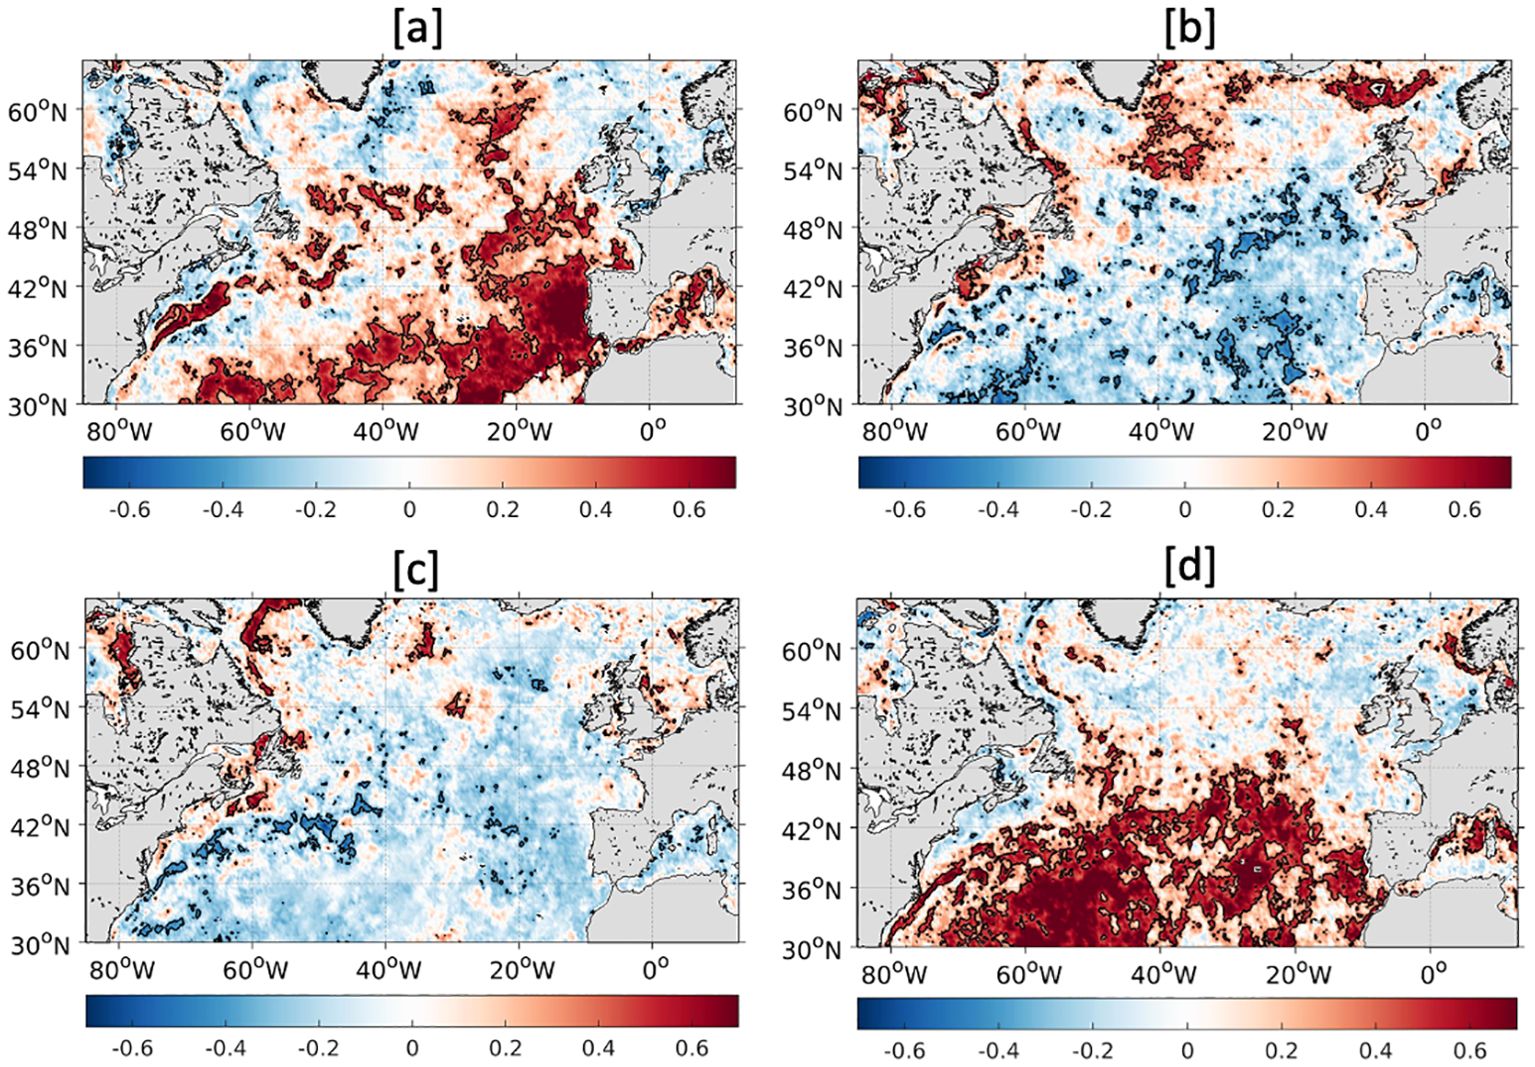
Figure 7. Correlation coefficient for the total days per year for the period 1998-2023 of MHWs and bluewaves (A), MHWs and greenwaves (B), MCSs and bluewaves (C) and MCSs and greenwaves (D) over the mid-high-latitude North Atlantic, calculated using satellite SST (OSTIA) and chlorophyll-a (GlobColour). The black contours indicate correlations significant at the 95% level (i.e., p-value <0.05).
A clearer dipole between the subtropical and subpolar gyre exists for the correlation between MCSs and greenwaves (Figure 7D). Apart from the slope water north of the Gulf Stream, south of 50°N, positive correlations exist across the entire basin, which reach >0.7 from ~50-60°W. In the subpolar regions, including the UK, the correlation coefficient is weaker but mostly negative across the basin, with some exceptions in the Labrador Current and west of Norway.
Conversely, while not significant, negative correlations exist across the subtropics and majority of the subpolar region for the total days of MHWs and greenwaves (Figure 7B) and MCSs and bluewaves (Figure 7C). Despite this, there are a few regions where MHWs are significantly positively correlated with greenwaves, notably a large area around the Faroe Islands to the north of the UK and in the central/western subpolar gyre, indicating that MHWs may initiate phytoplankton blooms in these regions. There is also some indication that MHWs may lead to greenwaves in the southern North Sea and MCSs may lead to bluewaves in the western North Sea but the correlations are not as strong and with limited significance.
In the subtropics, MHWs tend to be associated with bluewaves while MCSs are associated with greenwaves. This is unsurprising in this region as MHWs will likely lead to increased stratification and suppressed entrainment of nutrients into the mixed layer, reducing the amount of primary production and vice versa. Although the most common situation is a negative correlation between MHWs and bluewaves and MCSs and greenwaves for subpolar waters (including the UK), the value is much weaker and is not statistically significant, with some of these regions exhibiting positive correlations between MHWs and greenwaves and MCSs and bluewaves. Overall, the direct link between temperature and chl-a extremes requires more investigation and may have regional and seasonal variability. For example, in convective regions in winter, MHWs may suppress mixing, which improves the light regime and causes the initiation of phytoplankton blooms, while in summer, MHWs may block the nutrient supply and reduce phytoplankton blooms in nutrient-limited regions.
Figure 8 shows examples of five MHW events that have occurred around the UK over the last few decades. Events were selected to demonstrate the variability in intensity, duration, location and time of year as opposed to highlighting particular MHWs. The time series of SST progression for each event is shown at the location where the MHW reaches its peak intensity, highlighting when the event is classed as a MHW (i.e., SST > 90th percentile), along with anomaly maps showing the spatial extent (shown as the monthly mean SST anomaly) and the resultant impact on phytoplankton biomass (shown as the monthly mean chl-a anomaly). It should be noted that the chl-a anomaly maps are selected based on the greatest recorded anomaly, i.e. either the same month as the MHW or the month after, to account for a potential lag in the phytoplankton biomass response.
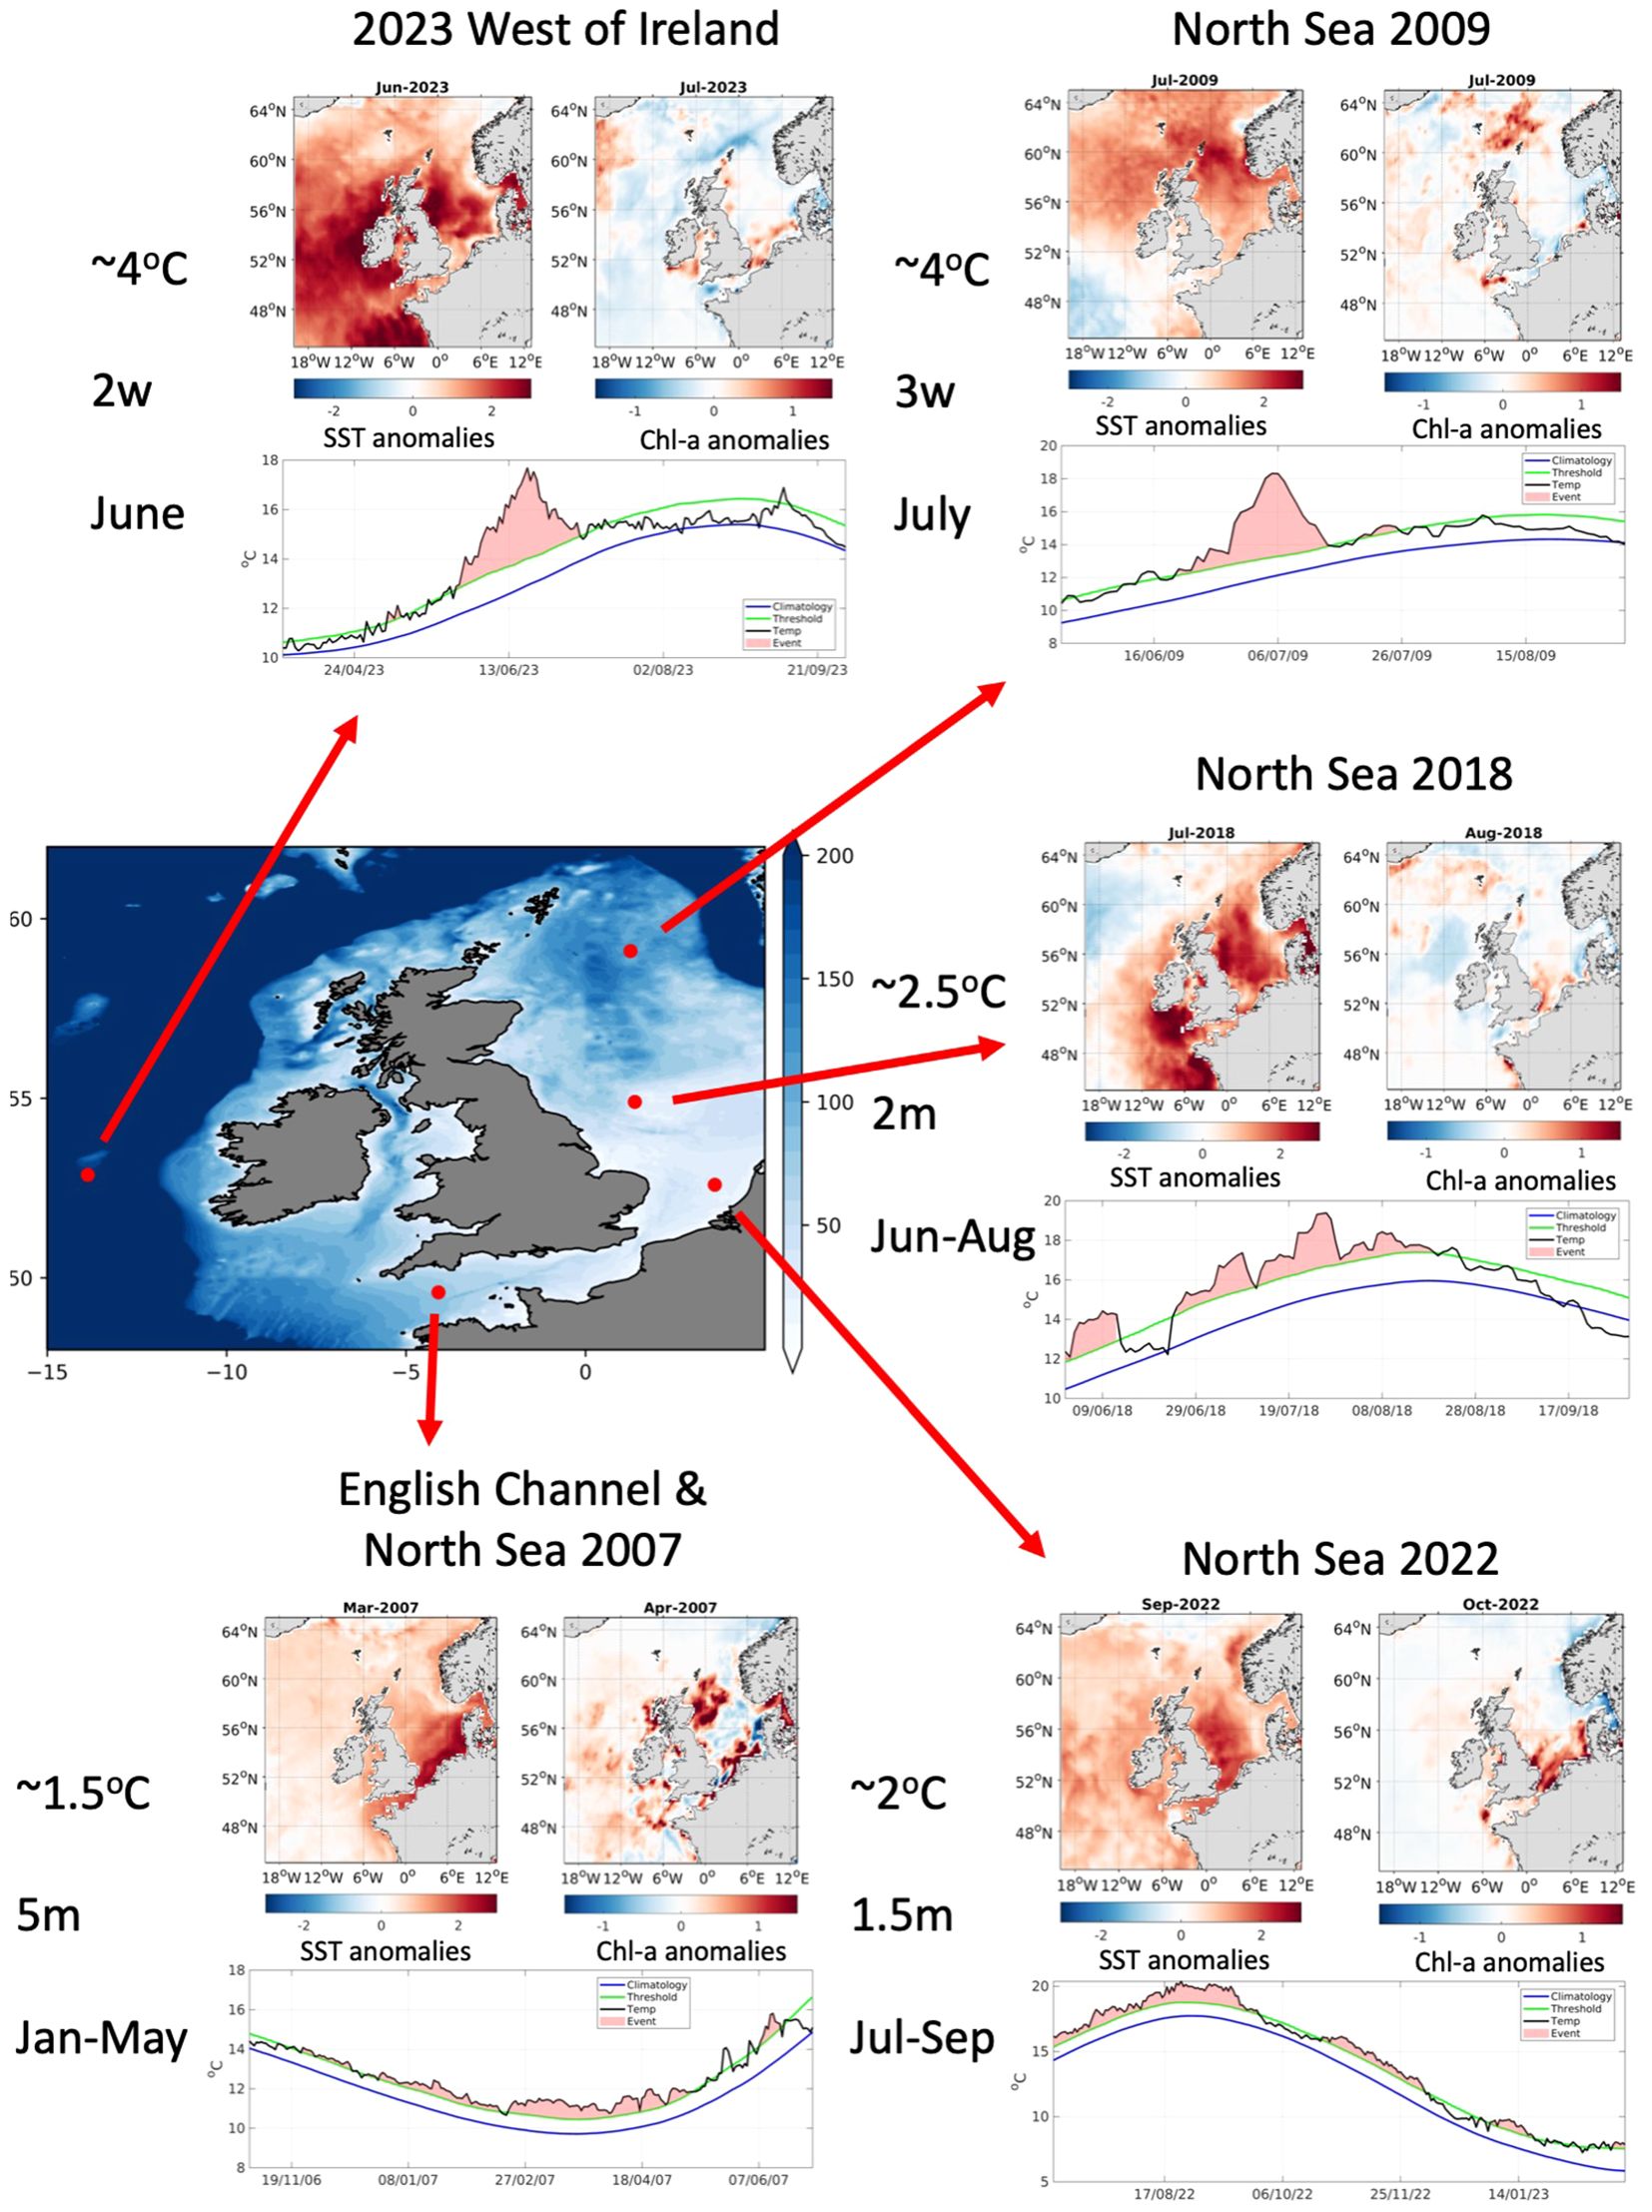
Figure 8. Bathymetry (in m) of the Northeast Atlantic indicating the locations of MHW case studies. For each case study, the time series of daily satellite SST during each MHW event and the corresponding climatology and 90th percentile averaged from 1983-2012 (at the coordinate indicated on the map). The peak monthly averaged satellite SST (left; from OSTIA) and satellite chl-a anomalies (right; from GlobColour) are displayed above the time series. The text to the left of each case study notes the peak SST anomaly at the height of the MHW, the length of the MHW (where “w” and “m” represent weeks and months respectively) and the time of year it took place.
In 2007, a relatively weak (peak 1.5°C) MHW occurred in the southern North Sea and English Channel (Figure 8 bottom-left), which lasted around 5 months from January-May. In March, elevated SST anomalies of up to 1°C are visible across the entire shelf, with peak anomalies of 1.5°C in the southern North Sea and English Channel. While there is some evidence of elevated chl-a (>1mg/m3) in the southern and northern North Sea, the spatial pattern is inconsistent with minor negative anomalies visible in the central North Sea and parts of the English Channel.
A short (~3 weeks) but intense (peak 4°C) MHW occurred in July 2009 in the northern North Sea (top-right). The greatest SST anomaly occurs around Orkney and the Shetland islands although the majority of UK waters experienced elevated temperatures of 1-2°C during July. During the same month, anomalous chl-a concentrations of 0.5-1mg/m3 are apparent to the northeast of the UK, in the vicinity of the MHW. Interestingly, anomalous chl-a is also visible along the southwest coast of the UK which is experiencing slightly cooler waters than usual. The rest of the shelf remains unaffected.
In summer 2018, a moderate MHW occurred around the UK from June-August (centre-right). While SST anomalies of 1-2°C were apparent across most of the continental shelf, the MHW peaked in the North Sea and south of Ireland with anomalous SSTs exceeding 2.5°C. Despite considerable anomalies across the shelf for 2-3 months, the chl-a concentrations did not show a pronounced response with minor anomalies (<0.5mg/m3), of opposing sign, observed around the UK.
During the summer and autumn of 2022, a recurring MHW occurred in the North Sea (bottom right). The event began in August, peaked in September with SST anomalies of around 2°C, before subsiding by October. SST remained high with the, albeit weak, MHW reappearing throughout November and again in January 2023. At the peak of the event in September, the greatest SSTs are observed in the western North Sea, along the entire east coast of the UK. In October, elevated chl-a concentrations of >1.5mg/m3 are seen in the southern North Sea with weaker, but still positive, anomalies visible across the wider western North Sea.
In June 2023 (top-left), an intense MHW appeared across the entire shelf. SST anomalies exceeded 4°C to the west of Ireland at the peak of the event and, while mean SST anomalies exceeded 2°C to the east and west of the UK during June, the MHW lasted for just 2 weeks. The impact on chl-a is not very pronounced with minor negative anomalies seen across most of the shelf but with some evidence of increased phytoplankton biomass in the southern North Sea, Irish Sea and east of Scotland.
Based on the case studies selected for this study, when MHWs occur around the UK they tend to occur alongside elevated SST across the entire shelf. MHWs in this region appear to vary in their duration and intensity with the most intense events (+4°C) occurring for just a few weeks while the longer events (multiple months) experiencing a more moderate peak intensity (<2°C). MHWs are also found to occur throughout the year and in different regions. However, the North Sea appears to be a hotspot for MHWs with anomalous SSTs evident in this region for all events considered. The impact on chl-a isn’t very pronounced, with some evidence of increased chl-a concentrations during MHWs, particularly in the North Sea, but the result is inconsistent in terms of the spatial pattern and across events.
To assess the wider biogeochemical impacts of MHWs and MCSs, we use model output from AMM7 (see Methods for details). This enables analysis at the subsurface and of additional biogeochemical variables that are unavailable from remote sensing datasets. Specifically, we analyze the potential impact of MHWs and MCSs on near-surface chl-a and near-bottom oxygen and pH on the wider continental shelf and assess if any seasonality exists in the biogeochemical response at certain locations.
The correlation between MHW cumulative intensity and near-bottom oxygen concentration for the continental shelf (<200m) is shown in Figure 9A. Negative correlations exist for most of the region with the largest, significant results (at 95% level) found for the English Channel (maximum r=-0.8), the southwestern North Sea (maximum r=-0.8) and to the northeast of Scotland around Orkney and the Shetland Islands (maximum r=-0.6). This indicates that MHWs may reduce the oxygen concentration in these regions, which is unsurprising, as warmer water decreases the solubility of oxygen. The strongest correlations occur in regions that are well-mixed or only weakly stratified in the vertical so that the surface MHW signal is able to impact the entire water column more easily.
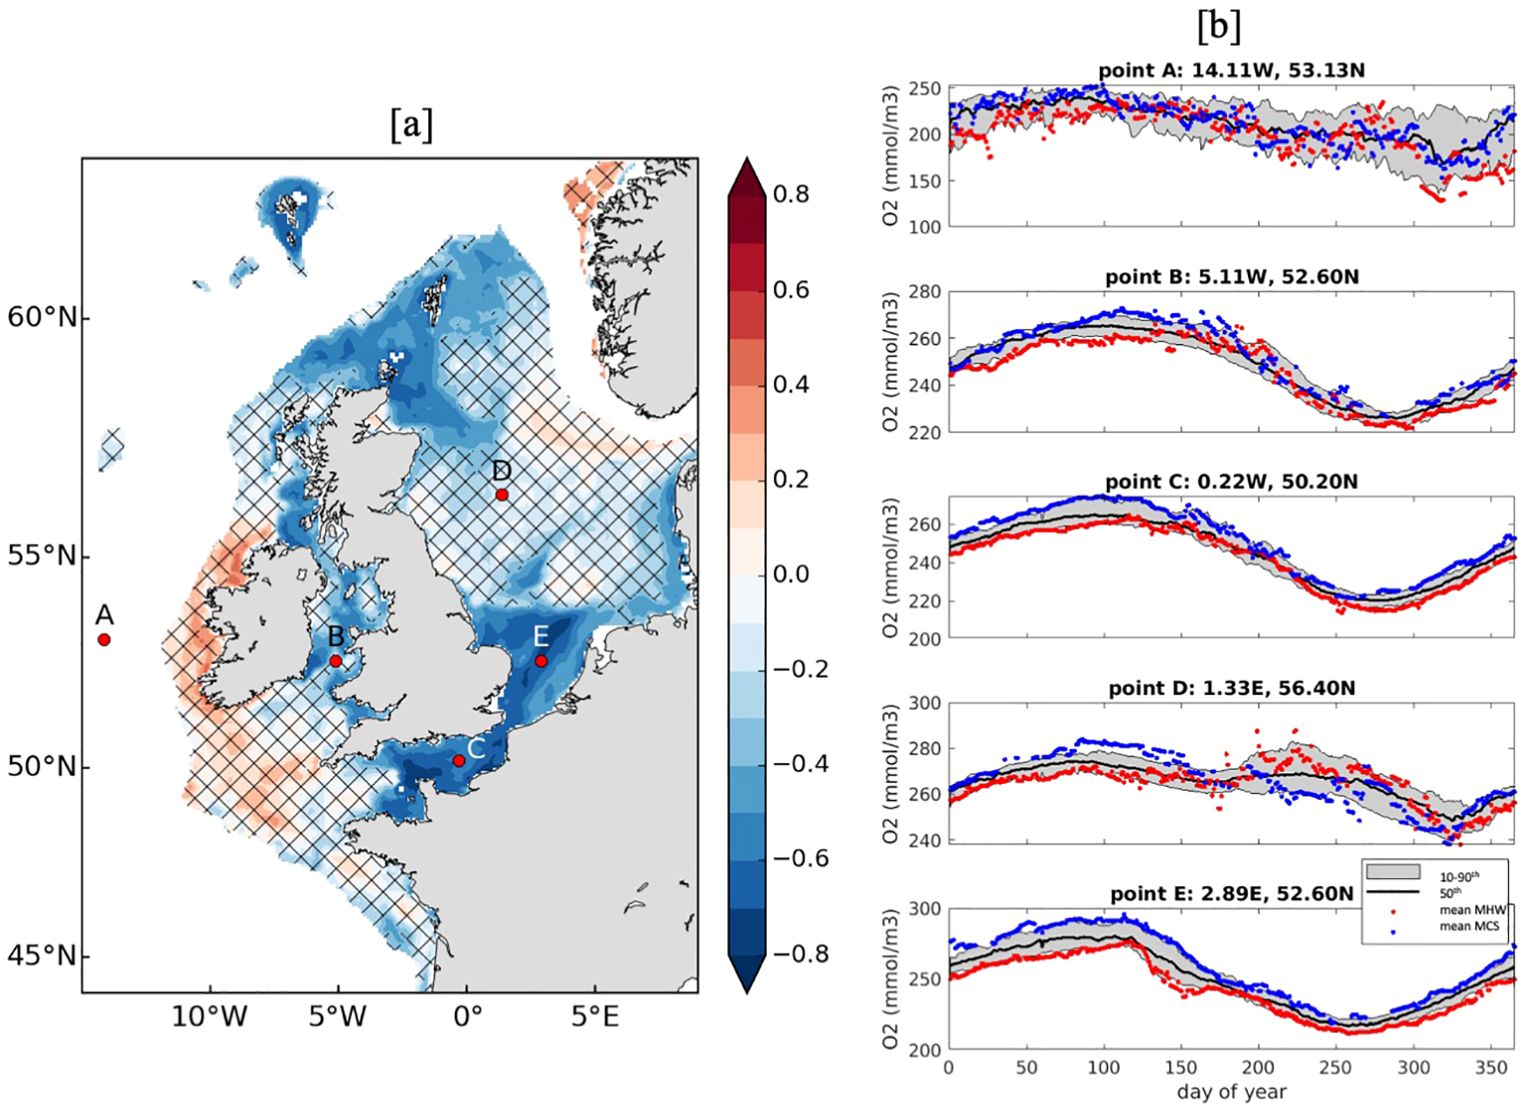
Figure 9. (A) Correlation coefficient for annual mean cumulative intensity of modelled (AMM7) MHWs and near-bottom oxygen concentration (mmol/m3) for regions shallower than 200m. Hashed regions indicate correlations that are not significant at the 95% level. (B) Climatological near-bottom oxygen concentrations (black line; mmol/m3), including the 10-90th percentile range (grey shading), for each day of the year averaged from 1998-2022 for regions marked on (A). Red (blue) markers indicate the near-bottom oxygen concentrations (mmol/m3) during MHW (MCS) conditions at each location.
To determine any potential seasonality and whether MCSs have the opposite effect, Figure 9B reveals the mean year-round near-bottom oxygen concentrations for five locations around the UK, alongside the mean oxygen concentrations during MHW and MCS conditions, averaged from 1998-2022. Point C (English Channel) and E (southern North Sea) reveal the most similar relationships with, near-extreme (<10th percentile), low oxygen concentrations during MHWs and, near-extreme (>90th percentile), high oxygen concentrations during MCSs throughout the year, which is consistent with the map in Figure 9A. However, in the English Channel (point C), this relationship breaks down during the summer (days 200-250), when the water column is likely to be the more stratified than well-mixed. This is also apparent at point B (Irish Sea) and point D (central North Sea) with evidence of low (high) oxygen concentrations during MHWs (MCSs) during winter and spring. The relationship at point A, which is located off the continental shelf (west of Ireland) is the weakest with no consistent relationship found throughout the year.
When examining near-bottom pH, there is some indication that at points B, C and E, more acidic (lower pH) conditions prevail during MHWs (and vice versa for MCSs), mostly during autumn and late-winter. However, the relationship is inconsistent overall (Supplementary Figures 1, 2). Likewise, for chl-a concentrations, at most locations, there are some parts of the year experiencing enhanced phytoplankton blooms under MHW conditions (spring and summer), which is also true for MCSs. Overall, the relationships are not very pronounced at each location, indicating other processes are likely at play.
The low oxygen concentrations near the seabed during MHWs could indicate that certain regions, namely the southern North Sea and English Channel, may experience biogeochemical compound events. Benthic habitats, in particular, may suffer the consequences of combined thermal stress and reduced oxygen availability.
There is currently insufficient evidence to comprehensively determine the sensitivity of marine habitats around the UK to MHWs (Figure 10A). To overcome the sparsity of evidence, the sensitivity of the benthic habitats to chronic increased temperature has been combined with limited information on MHW sensitivity to provide a broader assessment (Figure 10A). However, high habitat sensitivity is suggested around several shallow water, coastal areas including the Shetland and Orkney Islands and at multiple locations around the southwest coast of the UK. The specific habitats considered most at risk from MHWs are infralittoral rock habitats, that are often dominated by mytilids, and equivalent communities in shallow subtidal environments. Benthic habitats assessed as being sensitive to chronic increases of temperature, such as sponge communities on deep circalittoral rock, coldwater coral reefs and large tracks of deepwater seabed, are unlikely to be exposed to acute warming within surface waters, and are unlikely to be vulnerable to MHWs.
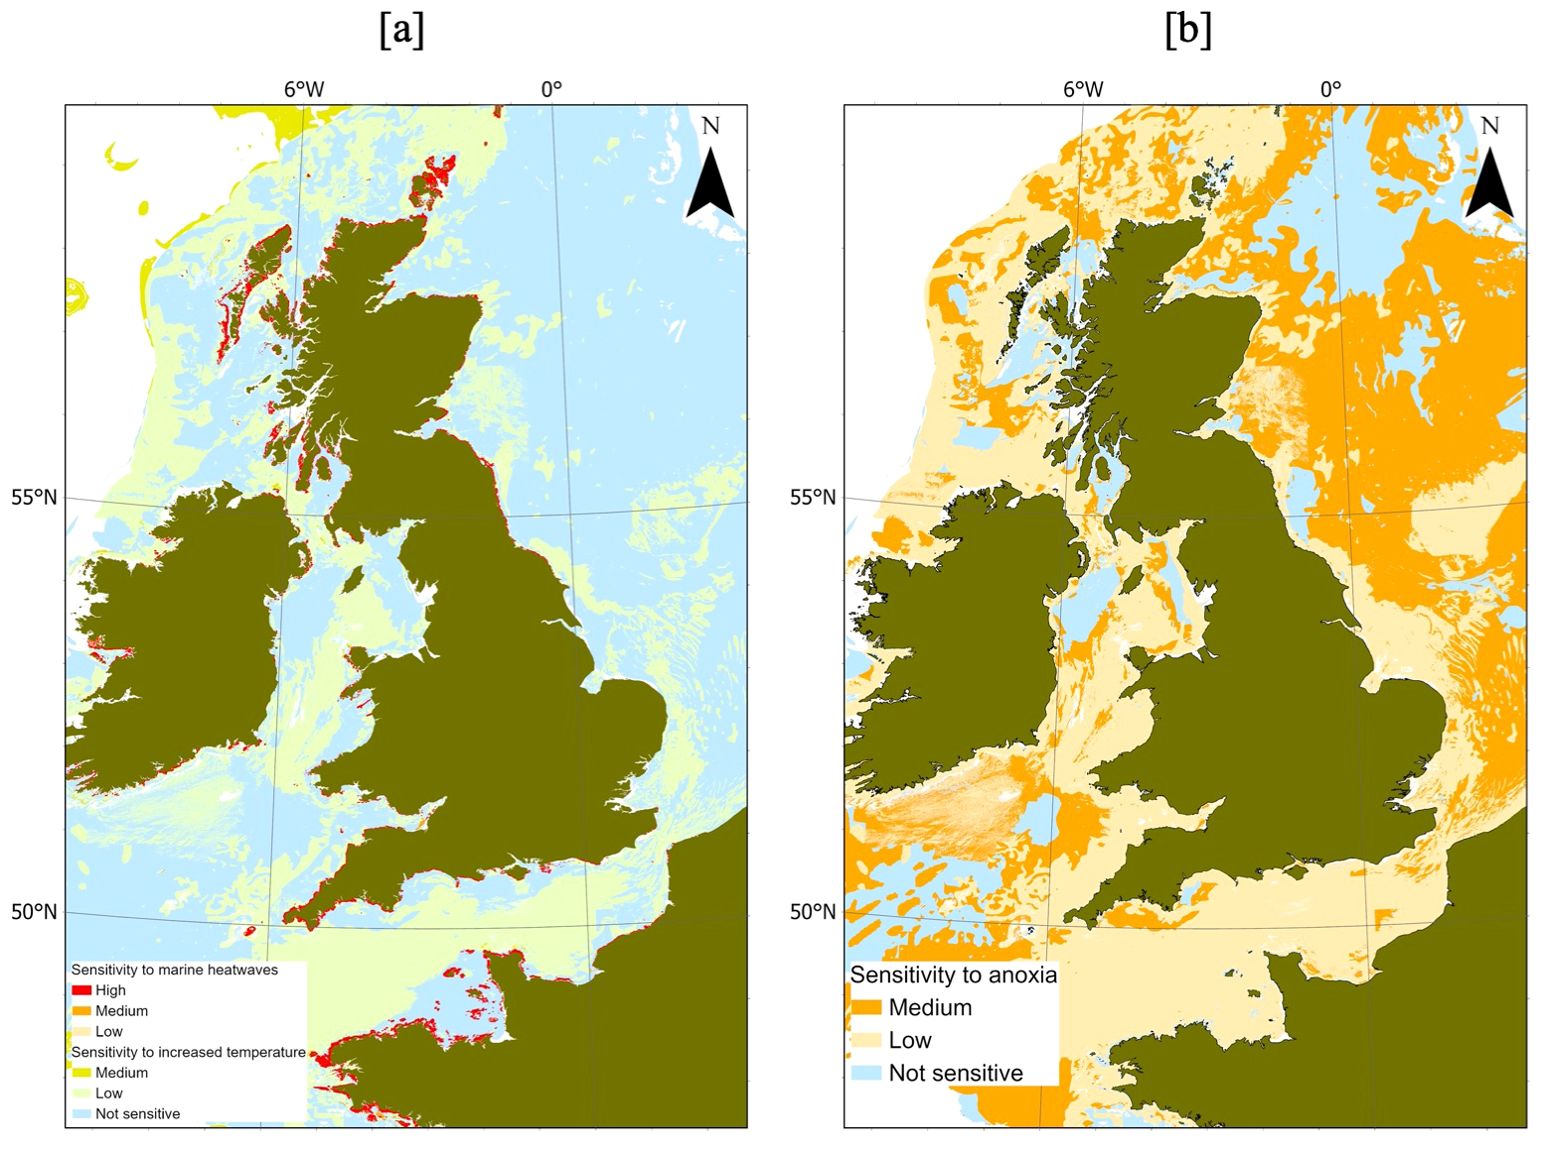
Figure 10. Habitat sensitivity (provided by MarESA) to marine heatwaves (A) and anoxia (B).
The converted MarESA attribution also suggests that much of the wider region has a “low-medium” sensitivity to anoxia (Figure 10B). The area to the southeast of the UK experiences “medium” sensitivity, which is one of the main sites where MHWs may cause extremely low oxygen concentrations, which could indicate an area of cumulative vulnerability and exposure, and the greatest potential for local habitats to be impacted.
The impact of MHWs around the world is becoming of increasing concern for marine ecosystems and regional blue economies. Unlike the well-documented MHWs in regions including Australia and the global tropics, the waters around the UK have notably avoided any major MHWs that may have caused significant damage to marine ecosystems. However, the intense but short in duration MHW that occurred around the UK in June 2023 highlighted that this region may experience more frequent extremes in future. This, combined with the unique exposure of the UK, which is affected by a complex interplay of drivers and dynamics, presented a pressing need to characterize past events and assess the potential for biogeochemical impacts, which is attempted here using a combination of remotely sensed data and biogeochemical model output.
When considering the wider North Atlantic, the UK does not appear as a hot spot for either MHWs or MCSs, with the majority of activity occurring in the Gulf Stream and central subpolar gyre. However, when you zoom in to the northwest European shelf, regional variability is apparent. For example, the southern North Sea experiences the most MHW and MCS activity in the region (in agreement with prior studies e.g., Wakelin et al., 2021; Simon et al., 2023) with the English Channel and Irish Sea also not devoid of extreme events. However, when examining past MHW events, the entire region tends to experience anomalously warm SSTs while the location of the peak anomaly (the MHW) varies, which will likely be dependent on the specific drivers that are unique to each event. It is worth noting that analysis of MHWs and MCSs is highly dependent on which metric is considered. For example, when reporting on the case studies selected in this study, which were highly variable in terms of duration, intensity, spatial extent and season of occurrence, some MHWs were short but intense events, while others were more prolonged, moderate events. The choice of metric will become increasingly important in future with projections indicating that events will reduce in frequency but increase in length, eventually merging into a continuous event (e.g. Oliver et al., 2019). Effective communication with relevant stakeholders will be crucial to understand ongoing changes and potential impacts.
While there is some evidence for extremes in chl-a on the northwest European shelf, with bluewaves and greenwaves apparent in the southern North Sea, around the UK, there is not a very pronounced relationship between temperature and chl-a extremes. This could be due to the UK residing between mid to high latitudes with studies generally finding that MHWs lead to decreased chl-a concentrations at low to mid latitudes with increases found at higher latitudes (e.g., Montie et al., 2020; Sen Gupta et al., 2020; Noh et al., 2022; Chiswell, 2023).
In contrast, during MHWs, near-bottom oxygen concentrations are anomalously low, particularly around the southern North Sea and English Channel, with the opposite found during MCSs. The temperate climate and high seasonality of the UK also means that the relationship between these events and the biogeochemistry on the shelf is variable at different times of year and at different locations as found in the Northeast Pacific (e.g., Wyatt et al., 2022). For example, this relationship is apparent year-round in shallow regions (i.e. southern North Sea and English Channel), while at slightly deeper locations (i.e., the northern North Sea and Irish Sea), the relationship breaks down during the summer months where the water column is more stratified. There is no clear relationship at the site west of Ireland off the continental shelf. When examining near-bottom pH, there is some indication of greater acidity during MHWs and vice versa in the shallowest regions during winter but the relationship is not as pronounced compared with oxygen. Overall, the results found here indicate that the southern North Sea and English Channel may experience MHW and low near-bottom oxygen compound events with other regions also impacted during the winter. The potential for compound events with chl-a and pH is not as apparent and may be dependent on other factors such as time of year and event-specific drivers. MHWs have also been found to contribute to oxygen deficiency in the Baltic Sea (Safonova et al., 2024), cause subsurface hypoxic zone expansion in Chesapeake Bay (Shunk et al., 2024) and trigger anoxia off the coast of Brazil (Brauko et al., 2020). In contrast, in some upwelling zones, e.g. the California Current system, MCSs are found to exacerbate hypoxia and increase acidity in coastal regions (Low et al., 2021; Walter et al., 2022; Hauri et al., 2024; Walter et al., 2024).
The seasonality of events will also likely lead to varied ecological impacts. For example, for MHW events that occur during the height of summer, the thermal limits of certain species (particularly foundation and non-migratory species like seagrass and macroalgae) may be breached and lead to severe damage or mortality (e.g., Arias-Ortiz et al., 2018; Thomsen et al., 2019; Filbee-Dexter et al., 2020; Strydom et al., 2020). In contrast, instead of causing thermal stress, MHWs that occur during winter or spring may affect the magnitude or phenology of phytoplankton blooms, which needs careful exploration in this region. For example, productivity may be substantially reduced, providing a temporary boost, or initiate harmful algal blooms. Additionally, if the timing of a MHW occurs at a critical stage of a species’ life cycle it could affect growth or lead to recruitment failure (e.g., Caputi et al., 2016; Mills et al., 2013). All of which would impact the regional ecosystem, fisheries and the economy in different ways. Despite the potential seasonality of impacts from MHWs, the habitats and benthic communities in the shallowest regions may experience negative impacts year-round due to the combination of thermal stress and reduced oxygen availability.
While MHWs in UK waters at present do not appear to be as long-lasting or intense as other well-documented events around the world, we are presented with a unique opportunity to take advantage of our “headstart” and learn from other nations like Australia (e.g. Caputi et al., 2016) or those in the Northeast Pacific (e.g., Barbeaux et al., 2020). Despite the lack of severe impacts from past UK MHWs, they are projected (under a high-emission scenario) to increase with 93% of the year experiencing MHW conditions by the end of the century (Berthou et al., 2024).
Given the complexity and uniqueness of the region, more targeted research is needed to understand the future biogeochemical, ecological and societal consequences, or potential opportunities, of MHWs in UK waters. This will enable the identification of potentially high-risk regions that may benefit from concentrated monitoring and conservation efforts, which may be important for marine spatial planning. For example, if regions being prioritized for seagrass restoration or aquaculture are in high-risk areas, urgent work needs to be conducted to ascertain whether the species considered are resilient to future MHW activity and to assess the agility of the UK’s marine industry (Hartog et al., 2023). It is also critical to know which species are living on the edge of their thermal limits and may be sensitive to the added threat of anoxia, to enable effective fisheries management. However, the spatial resolution of current climate models is too coarse to resolve ocean dynamics around the UK, highlighting the need for projections at finer scales to be able to provide meaningful adaptation plans.
It is also worth noting that summer terrestrial heatwaves in the UK have recently caused excess deaths, among other adverse health impacts (Yule et al., 2023). Given the link between the June 2023 MHW and the coincident terrestrial heatwave, understanding interactions and feedbacks between marine and terrestrial heatwaves is another important research direction.
While the extensive media reporting on the June 2023 event raised public awareness of MHWs, the timing (early summer), short duration (~2 weeks) and location of the peak intensity (off the continental shelf) raises questions about the severity of ecological impacts. However, the likelihood of increased MHW activity in the coming decades highlights the need for greater understanding of these impacts to enable effective communication, which is particularly important due to the absence of a narrative addressing the UK’s vulnerability to MHWs. The June 2023 MHW should be perceived as an alarm bell, but it also presents an opportunity to learn from other nations that face analogous challenges and so develop robust and comprehensive policies to increase preparedness and response capability.
Using satellite remote sensing, we have characterized extreme temperature (MHWs and MCSs) and chl-a (bluewaves and greenwaves) events around the UK and across the wider North Atlantic. Whilst the UK is not a hotspot within the North Atlantic, the southern North Sea experiences the most activity for all four types of extremes. Despite this, the relationship between temperature and chl-a extremes is not very pronounced. This may be due to the UK’s position between mid and high latitudes, where MHWs are generally associated with decreased chl-a at low- to mid- latitudes and increased levels at high latitudes. In contrast, model outputs indicate that in shallow regions around the UK, such as the southern North Sea and English Channel, reduced oxygen concentrations are typically associated MHWs, while increased oxygen concentrations are associated with MCSs, potentially impacting benthic communities. This relationship is evident only during winter and spring months in other regions, highlighting the need for seasonal analysis of these events. With future projections indicating an increase in MHW activity in this region, urgent research is necessary to understand the potential impacts on marine ecosystems, the blue economy and coastal communities in order to develop robust policies to improve preparedness.
Publicly available datasets were analysed in this study and can be found online. The daily satellite sea surface temperature are available here: http://marine.copernicus.eu/services-portfolio/access-to-products/. The daily chlorophyll-a data are available here: http://marine.copernicus.eu/services-portfolio/access-to-products/. The model outputs are available here: https://data.marine.copernicus.eu/product/NWSHELF_MULTIYEAR_PHY_004_009/description for the physics and here https://data.marine.copernicus.eu/product/NWSHELF_MULTIYEAR_BGC_004_011/description for the biogeochemistry. The seagrass and cold-water corals occurrence data are available here: https://data.unep-wcmc.org/. Habitat sensitivity data are available here https://emodnet.ec.europa.eu/en/seabed-habitats and https://www.marlin.ac.uk/sensitivity/sensitivity_rationale.
ZJ: Conceptualization, Formal analysis, Writing – original draft, Writing – review & editing. FJ: Data curation, Formal analysis, Visualization, Writing – original draft, Writing – review & editing. SW: Data curation, Formal analysis, Writing – original draft, Writing – review & editing. JS: Formal analysis, Visualization, Writing – original draft, Writing – review & editing. EP: Funding acquisition, Writing – original draft, Writing – review & editing. MS: Writing – original draft, Writing – review & editing. AL: Data curation, Visualization, Writing – original draft, Writing – review & editing.
The author(s) declare financial support was received for the research, authorship, and/or publication of this article. This work was funded by the UK National Environmental Research Council (NERC, UK) under the following projects: National Capability Science Multi-Centre funding for Future Impacts, Risks and Mitigation Actions in a changing Earth system project (TerraFIRMA LTSM; NE/W004895/1), 2. National Capability Science Single-Centre funding for the Climate Linked Atlantic Sector Science project (CLASS LTSS; NE/R015953/1) and 3. National Capability Science Single-Centre funding for the Atlantic Climate and Environment Strategic Science project (AtlantiS NE/Y005589/1). This work was also supported by UK Marine and Climate Advisory Service (UKMCAS) and was developed as part of the Joint Marine Modelling Programme, a partnership between the Met Office, National Oceanography Centre, British Antarctic Survey and Centre for Polar Observation and Modelling.
The authors declare that the research was conducted in the absence of any commercial or financial relationships that could be construed as a potential conflict of interest.
All claims expressed in this article are solely those of the authors and do not necessarily represent those of their affiliated organizations, or those of the publisher, the editors and the reviewers. Any product that may be evaluated in this article, or claim that may be made by its manufacturer, is not guaranteed or endorsed by the publisher.
The Supplementary Material for this article can be found online at: https://www.frontiersin.org/articles/10.3389/fmars.2024.1434365/full#supplementary-material
Amaya D. J., Miller A. J., Xie S. P., Kosaka Y. (2020). Physical drivers of the summer 2019 North Pacific marine heatwave. Nat. Commun. 11, 1903. doi: 10.1038/s41467-020-15820-w
Anderson J. J., Gurarie E., Bracis C., Burke B. J., Laidre K. L. (2013). Modeling climate change impacts on phenology and population dynamics of migratory marine species. Ecol. Model. 264, 83–97. doi: 10.1016/j.ecolmodel.2013.03.009
Arias-Ortiz A., Serrano O., Masqué P., Lavery P. S., Mueller U., Kendrick G. A., et al. (2018). A marine heatwave drives massive losses from the world’s largest seagrass carbon stocks. Nat. Climate Change 8, 338–344. doi: 10.1038/s41558-018-0096-y
Atkinson J., King N. G., Wilmes S. B., Moore P. J. (2020). Summer and winter marine heatwaves favor an invasive over native seaweeds. J. Phycology 56, 1591–1600. doi: 10.1111/jpy.13051
Ayata S. D., Lazure P., Thiébaut É. (2010). How does the connectivity between populations mediate range limits of marine invertebrates? A case study of larval dispersal between the Bay of Biscay and the English Channel (North-East Atlantic). Prog. Oceanography 87, 18–36. doi: 10.1016/j.pocean.2010.09.022
Barbeaux S. J., Holsman K., Zador S. (2020). Marine heatwave stress test of ecosystem-based fisheries management in the Gulf of Alaska Pacific cod fishery. Front. Mar. Sci. 7. doi: 10.3389/fmars.2020.00703
Berthou S., Renshaw R., Smyth T., Tinker J., Grist J., Wihsgott J., et al. (2024). Exceptional atmospheric conditions in June 2023 generated a northwest European marine heatwave which contributed to breaking land temperature records. Commun. Earth Environ. 5, 287.
Borgman E., Pedersen M. F., Stæhr P. A. U., Fischer-Bogason R. (2022). Marine heatwaves in Northen Sea areas: Occurrence, effects, and expected frequencies (PlanMiljø). Available at: https://rucforsk.ruc.dk/ws/portalfiles/portal/80636530/Marine_Heatwaves_report.pdf.
Brauko K. M., Cabral A., Costa N. V., Hayden J., Dias C. E., Leite E. S., et al. (2020). Marine heatwaves, sewage and eutrophication combine to trigger deoxygenation and biodiversity loss: A SW Atlantic case study. Front. Mar. Sci. 7, 590258. doi: 10.3389/fmars.2020.590258
Brown A. R., Lilley M. K., Shutler J., Widdicombe C., Rooks P., McEvoy A., et al. (2022). Harmful Algal Blooms and their impacts on shellfish mariculture follow regionally distinct patterns of water circulation in the western English Channel during the 2018 heatwave. Harmful Algae 111, 102166. doi: 10.1016/j.hal.2021.102166
Burger F. A., Terhaar J., Frölicher T. L. (2022). Compound marine heatwaves and ocean acidity extremes. Nat. Commun. 13, 4722. doi: 10.1038/s41467-022-32120-7
Butenschön M., Clark J., Aldridge J. N., Allen J. I., Artioli Y., Blackford J., et al. (2016). ERSEM 15.06: a generic model for marine biogeochemistry and the ecosystem dynamics of the lower trophic levels. Geosci. Model. Dev. 9, 1293–1339. doi: 10.5194/gmd-9-1293-2016
Caputi N., Kangas M., Chandrapavan A., Hart A., Feng M., Marin M., et al. (2019). Factors affecting the recovery of invertebrate stocks from the 2011 Western Australian extreme marine heatwave. Front. Mar. Sci. 6. doi: 10.3389/fmars.2019.00484
Caputi N., Kangas M., Denham A., Feng M., Pearce A., Hetzel Y., et al. (2016). Management adaptation of invertebrate fisheries to an extreme marine heat wave event at a global warming hot spot. Ecol. Evol. 6, 3583–3593. doi: 10.1002/ece3.2137
Cavole L. M., Demko A. M., Diner R. E., Giddings A., Koester I., Pagniello C. M., et al. (2016). Biological impacts of the 2013–2015 warm-water anomaly in the Northeast Pacific: winners, losers, and the future. Oceanography 29, 273–285. Available at: http://www.jstor.org/stable/24862690.
Cheung W. W., Frölicher T. L. (2020). Marine heatwaves exacerbate climate change impacts for fisheries in the northeast Pacific. Sci. Rep. 10, 6678. doi: 10.1038/s41598-020-63650-z
Chiswell S. M. (2023). Tasman Sea high-and low-chlorophyll events, their links to marine heat waves, cool spells, and global teleconnections. New Z. J. Mar. Freshw. Res. 57, 550–567. doi: 10.1080/00288330.2022.2076702
Cornes R. C., Tinker J., Hermanson L., Oltmanns M., Hunter W. R., Lloyd-Hartley H., et al. (2023). Climate change impacts on temperature around the UK and Ireland. MCCIP Sci. Rev. 18:1–18. doi: 10.14465/2022.reu08.tem
Di Lorenzo E., Mantua N. (2016). Multi-year persistence of the 2014/15 North Pacific marine heatwave. Nat. Climate Change 6, 1042–1047. doi: 10.1038/nclimate3082
EEA. (2019). EUNIS marine habitat classification 2019. Available online at: https://eunis.eea.europa.eu/references/2489 (Accessed March 23 2024).
European Environment Agency. (2021). EUNIS marine habitat classification 2019 including crosswalks. Available online at: https://www.eea.europa.eu/data-and-maps/data/eunis-habitat-classification-1/eunis-marine-habitat-classification-review-2019/eunis-marine-habitat-classification-2019/at_download/file (Accessed March 23 2024).
Filbee-Dexter K., Wernberg T., Grace S. P., Thormar J., Fredriksen S., Narvaez C. N., et al. (2020). Marine heatwaves and the collapse of marginal North Atlantic kelp forests. Sci. Rep. 10, 13388. doi: 10.1038/s41598-020-70273-x
Flanders Marine Institute. (2023). Maritime Boundaries Geodatabase: Maritime Boundaries and Exclusive Economic Zones (200NM), version 12. doi: 10.14284/632
Fragkopoulou E., Sen Gupta A., Costello M. J., Wernberg T., Araújo M. B., Serrão E. A., et al. (2023). Marine biodiversity exposed to prolonged and intense subsurface heatwaves. Nat. Climate Change 13, 1114–1121. doi: 10.1038/s41558-023-01790-6
Freiwald A., Rogers A., Hall-Spencer J., Guinotte J. M., Davies A. J., Yesson C., et al. (2021). Global distribution of cold-water corals (version 5.1) (Cambridge (UK: UN Environment Programme World Conservation Monitoring Centre). Fifth update to the dataset in Freiwald et al. (2004) by UNEP-WCMC, in collaboration with Andre Freiwald and John Guinotte. doi: 10.34892/72×9-rt61
Garrabou J., Gómez-Gras D., Medrano A., Cerrano C., Ponti M., Schlegel R., et al. (2022). Marine heatwaves drive recurrent mass mortalities in the Mediterranean Sea. Global Change Biol. 28, 5708–5725. doi: 10.1111/gcb.16301
Giménez L., Boersma M., Wiltshire K. H. (2024). A multiple baseline approach for marine heatwaves. Limnology Oceanography 69, 638–651. doi: 10.1002/lno.12521
Gómez F., Souissi S. (2008). The impact of the 2003 summer heat wave and the 2005 late cold wave on the phytoplankton in the north-eastern English Channel. Comptes rendus. Biologies 331, 678–685. doi: 10.1016/j.crvi.2008.06.005
Gruber N., Boyd P. W., Frölicher T. L., Vogt M. (2021). Biogeochemical extremes and compound events in the ocean. Nature 600, 395–407. doi: 10.1038/s41586-021-03981-7
Hartog J. R., Spillman C. M., Smith G., Hobday A. J. (2023). Forecasts of marine heatwaves for marine industries: Reducing risk, building resilience and enhancing management responses. Deep Sea Res. Part II: Topical Stud. Oceanography 209, 105276. doi: 10.1016/j.dsr2.2023.105276
Hauri C., Pages R., Hedstrom K., Doney S. C., Dupont S., Ferriss B., et al. (2024). More than marine heatwaves: A new regime of heat, acidity, and low oxygen compound extreme events in the Gulf of Alaska. AGU Adv. 5, e2023AV001039. doi: 10.1029/2023AV001039
Hobday A. J., Alexander L. V., Perkins S. E., Smale D. A., Straub S. C., Oliver E. C., et al. (2016). A hierarchical approach to defining marine heatwaves. Prog. Oceanography 141, 227–238. doi: 10.1016/j.pocean.2015.12.014
Hobday A. J., Oliver E. C., Gupta A. S., Benthuysen J. A., Burrows M. T., Donat M. G., et al. (2018). Categorizing and naming marine heatwaves. Oceanography 31, 162–173.
Holbrook N. J., Hernaman V., Koshiba S., Lako J., Kajtar J. B., Amosa P., et al. (2022). Impacts of marine heatwaves on tropical western and central Pacific Island nations and their communities. Global Planetary Change 208, 103680. doi: 10.1016/j.gloplacha.2021.103680
Holt J., Wakelin S., Lowe J., Tinker J. (2010). The potential impacts of climate change on the hydrography of the northwest European continental shelf. Prog. Oceanography 86, 361–379. doi: 10.1016/j.pocean.2010.05.003
Horton H. (2023). Unheard of marine heatwave off UK and Irish coasts poses serious threat (The Guardian). Available online at: https://www.theguardian.com/environment/2023/jun/19/marine-heatwave-uk-irish-coasts-threat-oysters-fish-high-temperatures (Accessed 16th May 2024). 19th May.
Huthnance J., Hopkins J., Berx B., Dale A., Holt J., Hosegood P., et al. (2022). Ocean shelf exchange, NW European shelf seas: Measurements, estimates and comparisons. Prog. Oceanography 202, 102760. doi: 10.1016/j.pocean.2022.102760
IOCCG. (2000). “Remote sensing of ocean colour in coastal and other optically complex waters,” in Reports of the International Ocean Colour Coordinating Group Number 3. Ed. Sathyendrannath (Dartmouth, Canada), 140. Available at: https://www.ioccg.org/reports/report3.pdf.
Josey S. A., Hirschi J. J. M., Sinha B., Duchez A., Grist J. P. (2018). The recent Atlantic cold anomaly: Causes, consequences, and related phenomena. Ann. Rev. Mar. Sci. 10, 475–501.
JNCC. (2022). The Marine Habitat Classification for Britain and IRELAND Version 22.04. Available online at: https://mhc.jncc.gov.uk/ (Accessed March 23 2024).
Leggat W. P., Camp E. F., Suggett D. J., Heron S. F., Fordyce A. J., Gardner S., et al. (2019). Rapid coral decay is associated with marine heatwave mortality events on reefs. Curr. Biol. 29, 2723–2730. doi: 10.1016/j.cub.2019.06.077
Le Grix N., Zscheischler J., Rodgers K. B., Yamaguchi R., Frölicher T. L. (2021). Hotspots and drivers of compound marine heatwaves and low net primary production extremes. Biogeosciences 19, 5807–5835. doi: 10.5194/bg-19-5807-2022
Low N. H., Micheli F., Aguilar J. D., Arce D. R., Boch C. A., Bonilla J. C., et al. (2021). Variable coastal hypoxia exposure and drivers across the southern California Current. Sci. Rep. 11, 10929. doi: 10.1038/s41598-021-89928-4
Madec G. (2008). NEMO ocean engine. Note du Pôle de modélisation (France: Institut Pierre-Simon Laplace (IPSL).
McCarthy G. D., Plecha S., Charria G., Simon A., Poppeschi C., Russo A. (2023). The marine heatwave west of Ireland in June 2023. Weather 78, 321–323. doi: 10.1002/wea.4498
Mills K. E., Pershing A. J., Brown C. J., Chen Y., Chiang F. S., Holland D. S., et al. (2013). Fisheries management in a changing climate: lessons from the 2012 ocean heat wave in the Northwest Atlantic. Oceanography 26, 191–195. Available at: https://www.jstor.org/stable/24862052.
Mogensen K. S., Balmaseda M. A., Weaver A. (2012). The NEMOVAR ocean data assimilation system as implemented in the ECMWF ocean analysis for System 4. ECMWF Tech. Memo. 668, 1–59.
Mohamed B., Barth A., Alvera-Azcarate A. (2023). Extreme marine heatwaves and cold-spells events in the Southern North Sea: classifications, patterns, and trends. Front. Mar. Sci. 10, 1258117. doi: 10.3389/fmars.2023.1258117
Montie S., Thomsen M. S., Rack W., Broady P. A. (2020). Extreme summer marine heatwaves increase chlorophyll a in the Southern Ocean. Antarctic Sci. 32, 508–509. doi: 10.1017/S0954102020000401
Moore J. A., Bellchambers L. M., Depczynski M. R., Evans R. D., Evans S. N., Field S. N., et al. (2012). Unprecedented mass bleaching and loss of coral across 12 of latitude in Western Australia in 2010–11. PloS One 7, e51807. doi: 10.1371/journal.pone.005180
Noh K. M., Lim H. G., Kug J. S. (2022). Global chlorophyll responses to marine heatwaves in Satellite Ocean color. Environ. Res. Lett. 17, 064034. doi: 10.1088/1748-9326/ac70ec
O'Dea E., Furner R., Wakelin S., Siddorn J., While J., Sykes P., et al. (2017). The CO5 configuration of the 7km Atlantic Margin Model: Large scale biases and sensitivity to forcing, physics options and vertical resolution. Geosci. Model. Dev. Discuss. 2017, 1–36. doi: 10.5194/gmd-2017-15
Oliver E. C., Benthuysen J. A., Bindoff N. L., Hobday A. J., Holbrook N. J., Mundy C. N., et al. (2017). The unprecedented 2015/16 Tasman Sea marine heatwave. Nat. Commun. 8, 16101. doi: 10.1038/ncomms16101
Oliver E. C., Burrows M. T., Donat M. G., Sen Gupta A., Alexander L. V., Perkins-Kirkpatrick S. E., et al. (2019). Projected marine heatwaves in the 21st century and the potential for ecological impact. Front. Mar. Sci. 6. doi: 10.3389/fmars.2019.00734
Pearce A. F., Feng M. (2013). The rise and fall of the “marine heat wave” off Western Australia during the summer of 2010/2011. J. Mar. Syst. 111, 139–156. doi: 10.1016/j.jmarsys.2012.10.009
Perez E., Ryan S., Andres M., Gawarkiewicz G., Ummenhofer C. C., Bane J., et al. (2021). Understanding physical drivers of the 2015/16 marine heatwaves in the Northwest Atlantic. Sci. Rep. 11, 17623. doi: 10.1038/s41598-021-97012-0
Piatt J. F., Parrish J. K., Renner H. M., Schoen S. K., Jones T. T., Arimitsu M. L., et al. (2020). Extreme mortality and reproductive failure of common murres resulting from the northeast Pacific marine heatwave of 2014-2016. PloS One 15, e0226087. doi: 10.1371/journal.pone.0226087
Roberts S. D., Van Ruth P. D., Wilkinson C., Bastianello S. S., Bansemer M. S. (2019). Marine heatwave, harmful algae blooms and an extensive fish kill event during 2013 in South Australia. Front. Mar. Sci. 6. doi: 10.3389/fmars.2019.00610
Rogers L. A., Wilson M. T., Duffy-Anderson J. T., Kimmel D. G., Lamb J. F. (2021). Pollock and “the Blob”: Impacts of a marine heatwave on walleye pollock early life stages. Fisheries Oceanography 30, 142–158. doi: 10.1111/fog.12508
Safonova K., Meier H. M., Gröger M. (2024). Summer heatwaves on the Baltic Sea seabed contribute to oxygen deficiency in shallow areas. Commun. Earth Environ. 5, 106. doi: 10.1038/s43247-024-01268-z
Sanford E., Sones J. L., García-Reyes M., Goddard J. H., Largier J. L. (2019). Widespread shifts in the coastal biota of northern California during the 2014–2016 marine heatwaves. Sci. Rep. 9, 4216. doi: 10.1038/s41598-019-40784-3
Schlegel R. W., Darmaraki S., Benthuysen J. A., Filbee-Dexter K., Oliver E. C. (2021). Marine cold-spells. Prog. Oceanography 198, 102684. doi: 10.1016/j.pocean.2021.102684
Schlegel R. W., Oliver E. C., Wernberg T., Smit A. J. (2017). Nearshore and offshore co-occurrence of marine heatwaves and cold-spells. Prog. Oceanography 151, 189–205. doi: 10.1016/j.pocean.2017.01.004
Seitzinger S. P., Mayorga E., Bouwman A. F., Kroeze C., Beusen A. H., Billen G., et al. (2010). Global river nutrient export: A scenario analysis of past and future trends. Global Biogeochem Cycles 24, GB0A08. doi: 10.1029/2009GB003587
Semmouri I., De Schamphelaere K. A., Mortelmans J., Mees J., Asselman J., Janssen C. R. (2023). Decadal decline of dominant copepod species in the North Sea is associated with ocean warming: Importance of marine heatwaves. Mar. Pollut. Bull. 193, 115159. doi: 10.1016/j.marpolbul.2023.115159
Sen Gupta A., Thomsen M., Benthuysen J. A., Hobday A. J., Oliver E., Alexander L. V., et al. (2020). Drivers and impacts of the most extreme marine heatwave events. Sci. Rep. 10, 19359. doi: 10.1038/s41598-020-75445-3
Seuront L., Nicastro K. R., Zardi G. I., Goberville E. (2019). Decreased thermal tolerance under recurrent heat stress conditions explains summer mass mortality of the blue mussel Mytilus edulis. Sci. Rep. 9, 17498. doi: 10.1038/s41598-019-53580-w
Shlesinger T., van Woesik R. (2023). Oceanic differences in coral-bleaching responses to marine heatwaves. Sci. Total Environ. 871, 162113. doi: 10.1016/j.scitotenv.2023.162113
Shunk N. P., Mazzini P. L., Walter R. K. (2024). Impacts of marine heatwaves on subsurface temperatures and dissolved oxygen in the Chesapeake Bay. J. Geophysical Research: Oceans 129, e2023JC020338. doi: 10.1029/2023JC020338
Simon A., Poppeschi C., Plecha S., Charria G., Russo A. (2023). Coastal and regional marine heatwaves and cold spells in the northeastern Atlantic. Ocean Sci. 19, 1339–1355. doi: 10.5194/os-19-1339-2023
Skákala J., Ford D. A., Brewin R. J., McEwan R., Kay S., Taylor B. H., et al. (2018). The assimilation of phytoplankton functional types for operational forecasting in the North-West European Shelf. J. Geophysical Research: Oceans 123, 5230–5247. doi: 10.1029/2018JC014153
Smale D. A., Wernberg T., Oliver E. C., Thomsen M., Harvey B. P., Straub S. C., et al. (2019). Marine heatwaves threaten global biodiversity and the provision of ecosystem services. Nat. Climate Change 9, 306–312. doi: 10.1038/s41558-019-0412-1
Smith K. E., Burrows M. T., Hobday A. J., King N. G., Moore P. J., Sen Gupta A., et al. (2023). Biological impacts of marine heatwaves. Annu. Rev. Mar. Sci. 15, 119–145. doi: 10.1146/annurev-marine-032122-121437
Smith K. E., Burrows M. T., Hobday A. J., Sen Gupta A., Moore P. J., Thomsen M., et al. (2021). Socioeconomic impacts of marine heatwaves: Global issues and opportunities. Science 374, eabj3593. doi: 10.1126/science.abj3593
Stillman D. (2023). Beyond extreme’ ocean heat wave in North Atlantic is worst in 170 years (Washington Post). Available online at: https://www.washingtonpost.com/weather/2023/06/23/ocean-heatwave-northatlantic-uk-climate/ (Accessed 16th May 2024). 23rd June.
Strydom S., Murray K., Wilson S., Huntley B., Rule M., Heithaus M., et al. (2020). Too hot to handle: Unprecedented seagrass death driven by marine heatwave in a World Heritage Area. Global Change Biol. 26, 3525–3538. doi: 10.1111/gcb.15065
Sun D., Li F., Jing Z., Hu S., Zhang B. (2023). Frequent marine heatwaves hidden below the surface of the global ocean. Nat. Geosci. 16, 1099–1104. doi: 10.1038/s41561-023-01325-w
Suryan R. M., Arimitsu M. L., Coletti H. A., Hopcroft R. R., Lindeberg M. R., Barbeaux S. J., et al. (2021). Ecosystem response persists after a prolonged marine heatwave. Sci. Rep. 11, 6235. doi: 10.1038/s41598-021-83818-5
Thomsen M. S., Mondardini L., Alestra T., Gerrity S., Tait L., South P. M., et al. (2019). Local extinction of bull kelp (Durvillaea spp.) due to a marine heatwave. Front. Mar. Sci. 6. doi: 10.3389/fmars.2019.00084
Tyler-Walters H., Tillin H. M., d’Avack E. A. S., Perry F., Stamp T. (2023). Marine Evidencebased Sensitivity Assessment (MarESA) – Guidance Manual (Plymouth: Marine Life Information Network (MarLIN). Marine Biological Association of the UK), 170. Available at: https://www.marlin.ac.uk/publications.
UNEP-WCMC, Short F. T. (2021). “Global distribution of seagrasses (version 7.1),” in Seventh update to the data layer used in Green and Short (2003) (UN Environment World Conservation Monitoring Centre, Cambridge (UK). doi: 10.34892/x6r3-d211
Vasquez M., Ségeat B., Cordingley A., Tilby E., Wikström S., Ehrnsten E., et al. (2023). EUSeaMap 2023, A European Broad-Scale Seabed Habitat Map. Available online at: https://emodnet.ec.europa.eu/en/seabed-habitats (Accessed 01/11/2024).
Wakelin S., Townhill B., Engelhard G., Holt J., Renshaw R. (2021). “Marine heatwaves and cold-spells, and their impact on fisheries in the North Sea.” In: von Schuckmann K., Le Traon P. Y., Smith N., Pascual A., Djavidnia S., Gattuso J. P., et al eds. Copernicus Marine Service Ocean State Report, Issue 5. J. Operat. Oceanogr. 14 (sup1), s91–s96. doi: 10.1080/1755876X.2021.1946240
Walter R. K., Dalsin M., Mazzini P. L., Pianca C. (2024). Compound marine cold spells and hypoxic events in a nearshore upwelling system. Estuarine Coast. Shelf Sci. 300, 108706. doi: 10.1016/j.ecss.2024.108706
Walter R. K., Huie S. A., Abraham J. C. P., Pasulka A., Davis K. A., Connolly T. P., et al. (2022). Seasonal controls on nearshore dissolved oxygen variability and hypoxia in a coastal embayment. Estuarine Coast. Shelf Sci. 278, 108123. doi: 10.1016/j.ecss.2022.108123
Waters J., Lea D. J., Martin M. J., Mirouze I., Weaver A., While J. (2015). Implementing a variational data assimilation system in an operational 1/4 degree global ocean model. Q. J. R. Meteorological Soc. 141, 333–349. doi: 10.1002/qj.2388
Wernberg T., Bennett S., Babcock R. C., De Bettignies T., Cure K., Depczynski M., et al. (2016). Climate-driven regime shift of a temperate marine ecosystem. Science 353, 169–172. doi: 10.1126/science.aad8745
Wijffels S. E., Beggs H., Griffin C., Middleton J. F., Cahill M., King E., et al. (2018). A fine spatial-scale sea surface temperature atlas of the Australian regional seas (SSTAARS): Seasonal variability and trends around Australasia and New Zealand revisited. J. Mar. Syst. 187, 156–196. doi: 10.1016/j.jmarsys.2018.07.005
Wyatt A. M., Resplandy L., Marchetti A. (2022). Ecosystem impacts of marine heatwaves in the Northeast Pacific. Biogeosciences 19, 5689–5705. doi: 10.5194/bg-19-5689-2022
Yao Y., Wang C., Fu Y. (2022). Global marine heatwaves and cold-spells in present climate to future projections. Earth's Future 10, e2022EF002787. doi: 10.1029/2022EF002787
Yule E. L., Hegerl G., Schurer A., Hawkins E. (2023). Using early extremes to place the 2022 UK heatwaves into historical context. Atmospheric Sci. Lett. 24, e1159. doi: 10.1002/asl.1159
Zhang Y., Du Y., Feng M., Hobday A. J. (2023). Vertical structures of marine heatwaves. Nat. Commun. 14, 6483. doi: 10.1038/s41467-023-42219-0
Keywords: marine heatwaves, marine cold spells, North Atlantic, Northwest European shelf, oxygen
Citation: Jacobs ZL, Jebri F, Wakelin S, Strong J, Popova E, Srokosz M and Loveridge A (2024) Marine heatwaves and cold spells in the Northeast Atlantic: what should the UK be prepared for? Front. Mar. Sci. 11:1434365. doi: 10.3389/fmars.2024.1434365
Received: 17 May 2024; Accepted: 15 August 2024;
Published: 04 October 2024.
Edited by:
Xiaohui Xie, Ministry of Natural Resources, ChinaReviewed by:
Solfrid Sætre Hjøllo, Norwegian Institute of Marine Research (IMR), NorwayCopyright © 2024 Jacobs, Jebri, Wakelin, Strong, Popova, Srokosz and Loveridge. This is an open-access article distributed under the terms of the Creative Commons Attribution License (CC BY). The use, distribution or reproduction in other forums is permitted, provided the original author(s) and the copyright owner(s) are credited and that the original publication in this journal is cited, in accordance with accepted academic practice. No use, distribution or reproduction is permitted which does not comply with these terms.
*Correspondence: Zoe Louisa Jacobs, em9lLmphY29ic0Bub2MuYWMudWs=
Disclaimer: All claims expressed in this article are solely those of the authors and do not necessarily represent those of their affiliated organizations, or those of the publisher, the editors and the reviewers. Any product that may be evaluated in this article or claim that may be made by its manufacturer is not guaranteed or endorsed by the publisher.
Research integrity at Frontiers
Learn more about the work of our research integrity team to safeguard the quality of each article we publish.