 Son Nam Vo1Thuy Thi Le Cu2Tao Tai Chau1Long Thanh Nguyen1Tinh Thien Tang1Hoa Van Au1Khoa Nguyen Duy Tran1Quynh Do Nguyen1Viet Van Ho3Tu Quang Trinh4Tran Bao Phan3Wendy Norden2Phuong Thanh Nguyen1*
- 1College of Aquaculture and Fisheries, Can Tho University, Can Tho, Vietnam
- 2Monterey Bay Aquarium, Monterey, CA, United States
- 3Division of Fisheries, Department of Agriculture and Rural Development, Ca Mau, Vietnam
- 4Vietnam Institute of Fisheries Economics and Planning, Ministry of Agriculture and Rural Development, Ha Noi, Vietnam
Introduction: This study aimed to evaluate the status, resource use, and challenges of the capture-based hatchery of black tiger shrimp (Penaeus monodon) (BTS).
Methods: Data was obtained through the investigation of 15 broodstock fishing boats and 60 capture-based BTS broodstock hatcheries. Resource use index (RUI) of the capture-based BTS hatchery, calculated from 1,000 female brooders to produce 15-day-old post-larvae (PL15) (production efficiency of PL15, or PE-PL15), was analysed.
Results: The results indicated that the fishing boats captured an average of 5,900 brooders.boat-1.year-1, 20,856 kg of by catch.boat-1.year-1, and the PE-PL15 production of 937 million for 1,000 female brooders. In the hatchery stage, the use of larger body weight female brooders had benefits in terms of higher survival rate and better efficiency of labour use, Artemia cyst, and probiotic products, but it reduced the efficiency use of chemicals, pellets, and total tank volume of the hatchery.
Discussion: There is increasing use of domesticated brooder sources, but wild-caught brooders still play an important role in producing low-cost PL15 for traditional shrimp farming systems, accounting for most farmed BTS production. Therefore, the certification of good practices should be implemented to capture-based BTS hatcheries for the reasonable use of this brooder resource to sustain BTS farming in Vietnam.
1 Introduction
Black tiger shrimp (Penaeus monodon) (BTS) are distributed from East and Southeast Africa and Pakistan to Japan, the Malay Archipelago, and Northern Australia (Indo-West Pacific region) (Holthuis, 1980). This is an important species of capture fishery and aquaculture due to its large size as well as high market value and demand. Wild BTS is captured in the offshore waters of some countries such as Malaysia and Thailand (Mohamed, 1970). In Vietnam, wild-caught BTS brooders used for hatcheries to produce post-larvae (PL) were started in 1997 (Hai et al., 2003). During the first developmental phase of Vietnam’s BTS hatcheries, the brooder supply was mainly from wild-caught sources as the domestication works of BTS had not yet begun. The wild brooders were mainly caught in Vietnam’s Central region (Khanh Hoa and Ninh Thuan provinces) and Southern region (Ca Mau province). The intensive capture of BTS brooders in Vietnam’s Central region led to overexploitation, after which Ca Mau province became the main BTS brooder fishing ground (Phuong et al., 2006), especially ‘Bai Can’ ground which is located at 7°00’–8°45’ N latitude and 103°00’–105°00’ E longitude (Tao et al., 2008).
The total area of BTS farming in Vietnam reached 630,409 ha in 2022 (Shrimp Farmer Magazine, 2023). Of these, 96.7% operated as extensive, improved extensive, alternative rice shrimp, and integrated mangrove shrimp farming models (known as ‘traditional’ farming models). These farming models have used hatchery-reared PLs produced from wild-caught brooders. The PLs of BTS are characterized by low prices, high survival rates, and good tolerance to the natural water environment. The remaining area (about 3.3% of the total) applied semi-intensive and intensive farming models. These models mostly employed PLs produced from domesticated brooders with fast growth and specific pathogen-free (SPF) characteristics. Thus, the demand for domesticated brooders has increased to an estimated 60,000 individuals in 2022 (Vietnam Fisheries Magazine, 2023) and is expected to reach 150,000–200,000 individuals in 2030 (MARD, 2018). In contrast, as previously mentioned, wild-caught brooders have remained in high demand for PL production to meet the demand of large areas currently used for traditional shrimp farming.
Wild-caught brooder exploitation has benefited fishermen. Notably, PL quality depends greatly on the genetic diversity and population structure of the wild brooders. The quality of brooder varies among water regions; this high genetic diversity indicates a possibility to use wild brooder populations for seed production as well as to improve genetics for growth and economic traits (Kumar et al., 2007; Khedkar et al., 2013). However, this leads to the excessive exploitation of wild brooders and places resources under increased pressure. The over-exploitation of brooder also negatively affects the marine ecosystem as well as the sustainability and biodiversity of fishery resources (Klinbunga et al., 2001; Kumar et al., 2007). On the other hand, there is an increased dependence on PLs produced by domesticated brooders (Klinbunga et al., 2001), which may reduce domesticated brooders’ adaptability to changes in environmental conditions (Dixon et al., 2008; Liu et al., 2013). Therefore, domesticated brooders’ genetic diversity is crucial to maintaining good traits in farmed shrimp (Rezaee et al., 2015). Wong et al. (2021) stated that wild brooders’ genetic diversity is high compared to that of domesticated populations, and that wild brooder sourcing is also essential for genetic improvement and maintaining diversity.
The source of wild-caught brooders in the studied area (Ca Mau fishing ground) is highly important not only for PL production but also for the conservation of genetic resources and fishermen’s incomes. However, there is a lack of data on the exploitation and use of wild-caught brooders captured for shrimp hatcheries. This paper presents the current status, resource consumption, and challenges of capture-based BTS hatcheries in Vietnam.
2 Materials and methods
The study was carried out from March to December 2022 in the brooder fishing ground and hatcheries in Ca Mau province. Secondary data comprised reports from governmental agencies regarding the number of brooder captures, annual wild-caught brooder collection from 2009 to 2022, as well as regulations and plans related to brooder capture and aquaculture. Primary data was collected by face-to-face interviews using a semi-structured questionnaire.
Fifteen owners of BTS fishing boats (out of 16 fishing boats in total), of which five fishing boats and one brooder collecting boat in the fishing ground at sites 1 and 2 (site 1: 8°17’00” N latitude, 104°54’00” E longitude and site 2: 8°24’00” N latitude, 104°30’00” E longitude; Figure 1) were selected to be interviewed on boat and fishing gear characteristics. Samples of caught BTS and fishes on board were recorded based on direct observation (on board), and photo camera records to identify species composition (using guidebooks of Carpenter and Niem, 1998, 1999a, b, 2001a, b). Fishing gear characteristics were recorded, such as the coordinates of the fishing ground; length of boat (m); and net mesh size (cm), width (m), and length (m). The fishing production variables were clarified, such as collected brooders (number of brooders per month, year, and boat), weight of brooders (g. brooder-1), number of brooders per total captured shrimps (%), number of by-catch species and production (kg.year-1.boat-1).
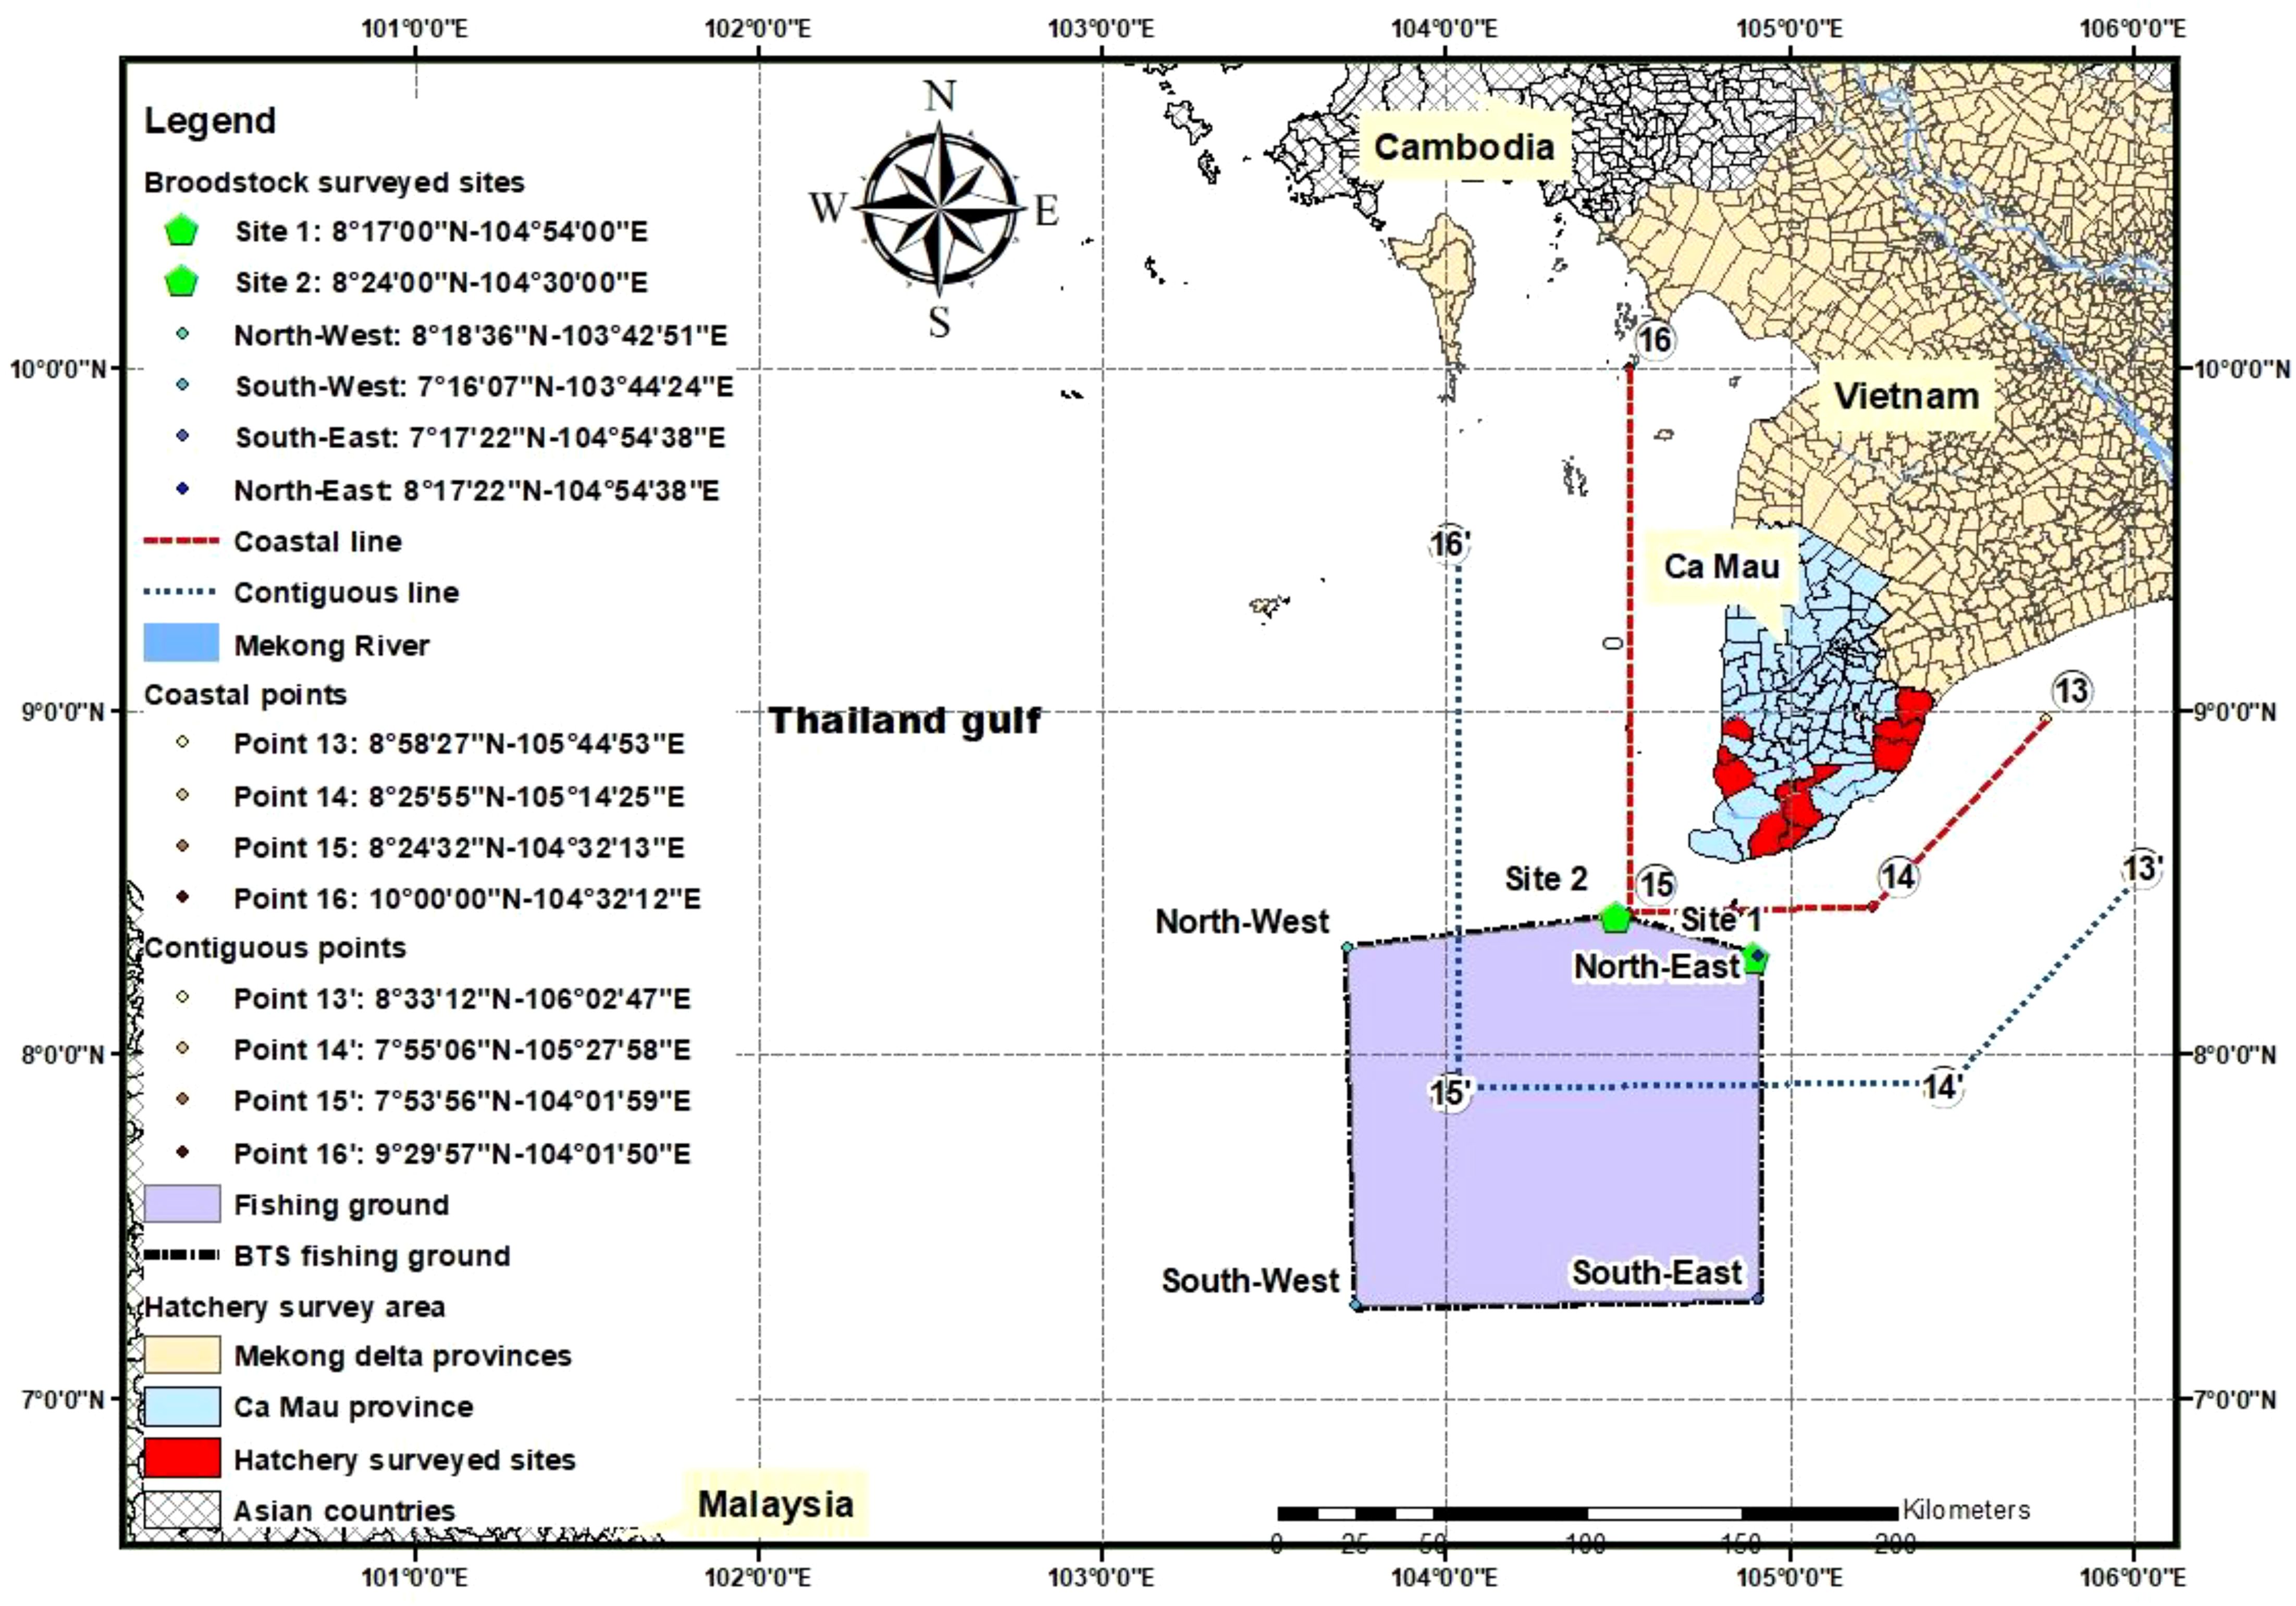
Figure 1. Sites of ground survey and fishing ground of brooder in Ca Mau province.
All six distributors of wild-caught brooders in Ngoc Hien district were selected to identify brooder acclimation and landing methods. Sixty (60) hatcheries (in Dam Doi, Nam Can, Ngoc Hien and Phu Tan districts, Ca Mau province) using wild-caught brooders were randomly selected from a whole capture-based hatcheries (523 hatcheries, Table 1) for interviews to clarify technical characteristics (individual female brooder sizes, g), efficiency of PL15 production (number PL.female brooder-1), rearing densities (nauplius.L-1), and survival rates (%). Cost and benefit variables of fishermen, distributors, and hatchery owners were identified such as total costs, total gross income and net income (net income = total gross income – total cost), production costs of wild-caught brooders, and produced PL from wild-caught brooders. Resource use index (RUI) in capture-based hatchery production of 1,000 wild-caught female brooder was identified in terms of labour, diesel oil, electricity, surface and groundwater, feeds (hermit crab, polychaeta worm, artemia), and other chemical compounds.
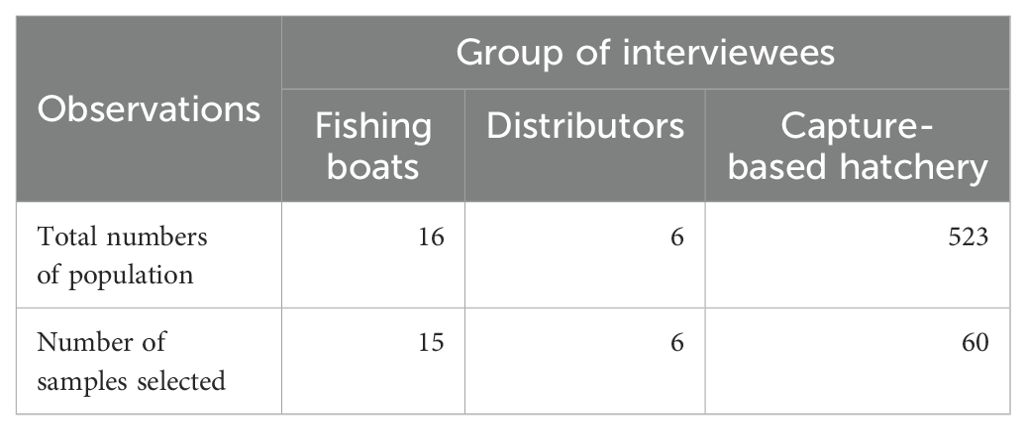
Table 1. Sample size of capture-based hatchery in Ca Mau province.
2.1 Data analysis
Data were analysed by descriptive statistics (mean, standard error of mean (SE), and frequency). Capture-based hatchery efficiency was analysed using material flow analysis (MFA), and the functional unit of input utilisation was calculated based on 1,000 brooders caught in the wild to produce a quantity of 15-day-old PL (PL15) (called ‘production efficiency of PL15’ or PE-PL15).
In the capture stage, the relationship between RUIs, net income and fishing effort parameters of fishing boats were determined using bivariate correlation (Pearson, p < 0.05) and multiple linear regression (Enter method). Multiple linear regression functions had predictors which are deadweight tonnage (DWT), engine power, and total length of net (m) (catching efforts), and dependent parameters are RUIs (p < 0.05). Meanwhile, in the hatchery stage, multiple correlations between RUIs, technical and benefits parameters were subjected to principal component analysis (PCA, eigenvalue exceeding 1 selected for analysis) using a rotation method such as Varimax with Kaiser Normalization (Johnson and Wichern, 1992). The surveyed hatcheries were sorted according to the increasing body weight of the female brooders to account for the fluctuations in the values factor scores of each component along with the fluctuations in the body weight of the brooders. Data were analysed using SPSS software, version 2016.
3 Results
3.1 Brooders’ capture, collection, and distribution
3.1.1 Fishing ground characteristics
The brooder fishing ground, located 30 km or farther from the coastline of Ca Mau province, spans about 15,000 km2 (see the delimited area with the yellow polygon in Figure 1). The fishing grounds of BTS brooder are in the contiguous zone (from coastal line [red] to contiguous line [blue]) and the high sea zone (beyond the orange line, Figure 1) according to the Decree 33/2010/ND-CP. The water is 45–55 m deep, with the bottom being sandy, muddy, and rocky; however, trammel nets can operate only in flat-bottom areas without reefs. Brooders are captured year-round, with a production peak from September to February.
3.1.2 Fishing gear
Fishing boats ranged from 14 to 22 m in length and from 15 to 50 tons in deadweight tonnage (DWT). These boats are equipped with engines of 128 to 460 CV and accommodate 10 to 16 fishermen onboard. Fishing gear is sweeping trammel nets with three overlapping net panels; the average net length is 13.2 km, and the average net height is 5.8 m. The mesh size of two outer nettings ranged from 30 to 40 cm (i.e. 2a = 30–40 cm, a: distance between two adjacent knots). Each mesh of outer netting can create a net frame (as ‘a bag’) when combing inner netting to capture brooder. The inner netting has a smaller mesh size compared to the outer ones, where there were three different mesh sizes, the upper selvage having the biggest mesh size (2a = 11–15 cm), next to the middle one (2a = 8–9 cm), and lower selvage (2a = 5–8 cm). Brooders are usually caught at the lower selvage of the net panel. The headline is raised by floaters such that there is enough force to lift the netting panel open wide vertically, and sinkers keep the footrope sweeping on the seabed to shoo brooders into the nets (Table 2; Figures 2A, B).
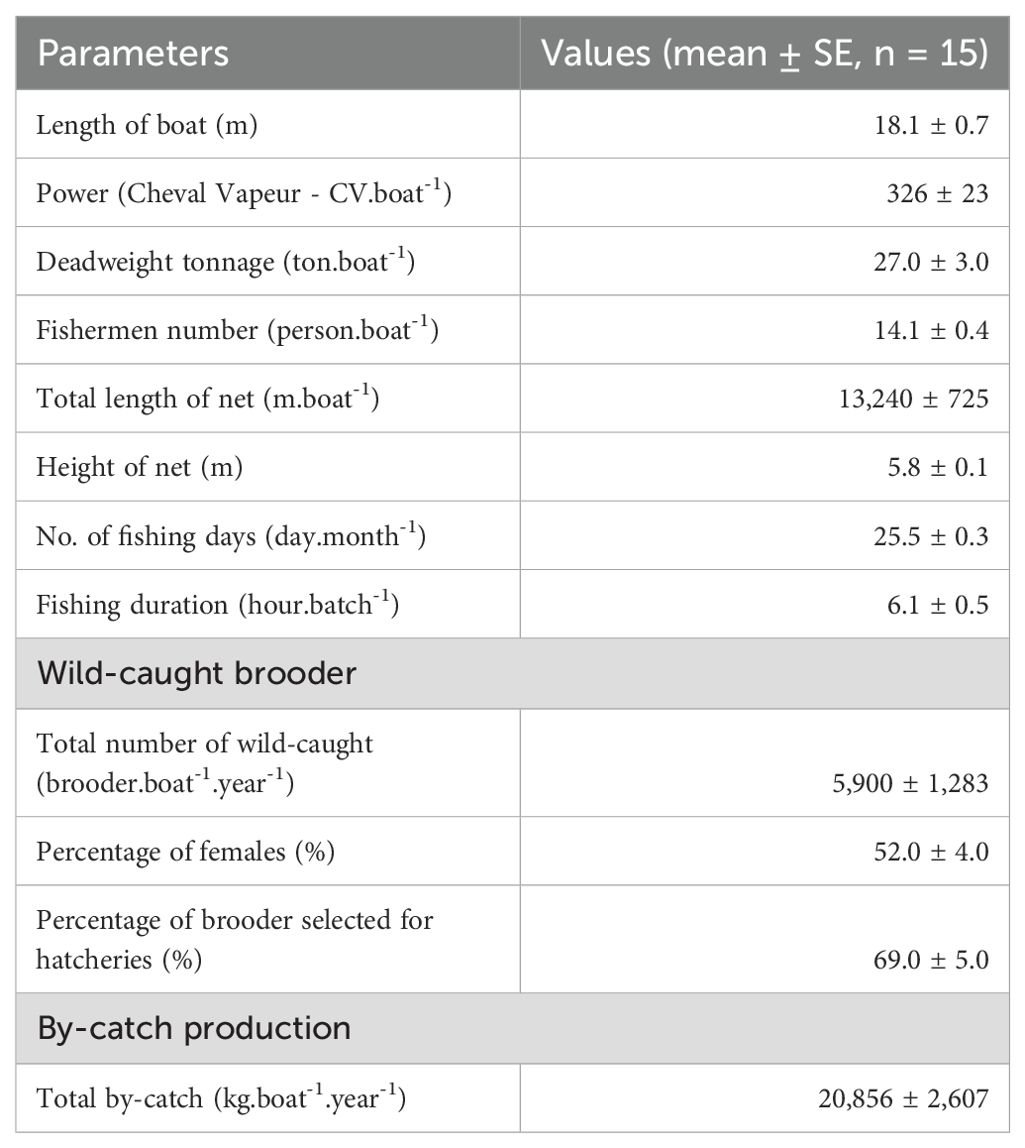
Table 2. Characteristics of the fishing boat.
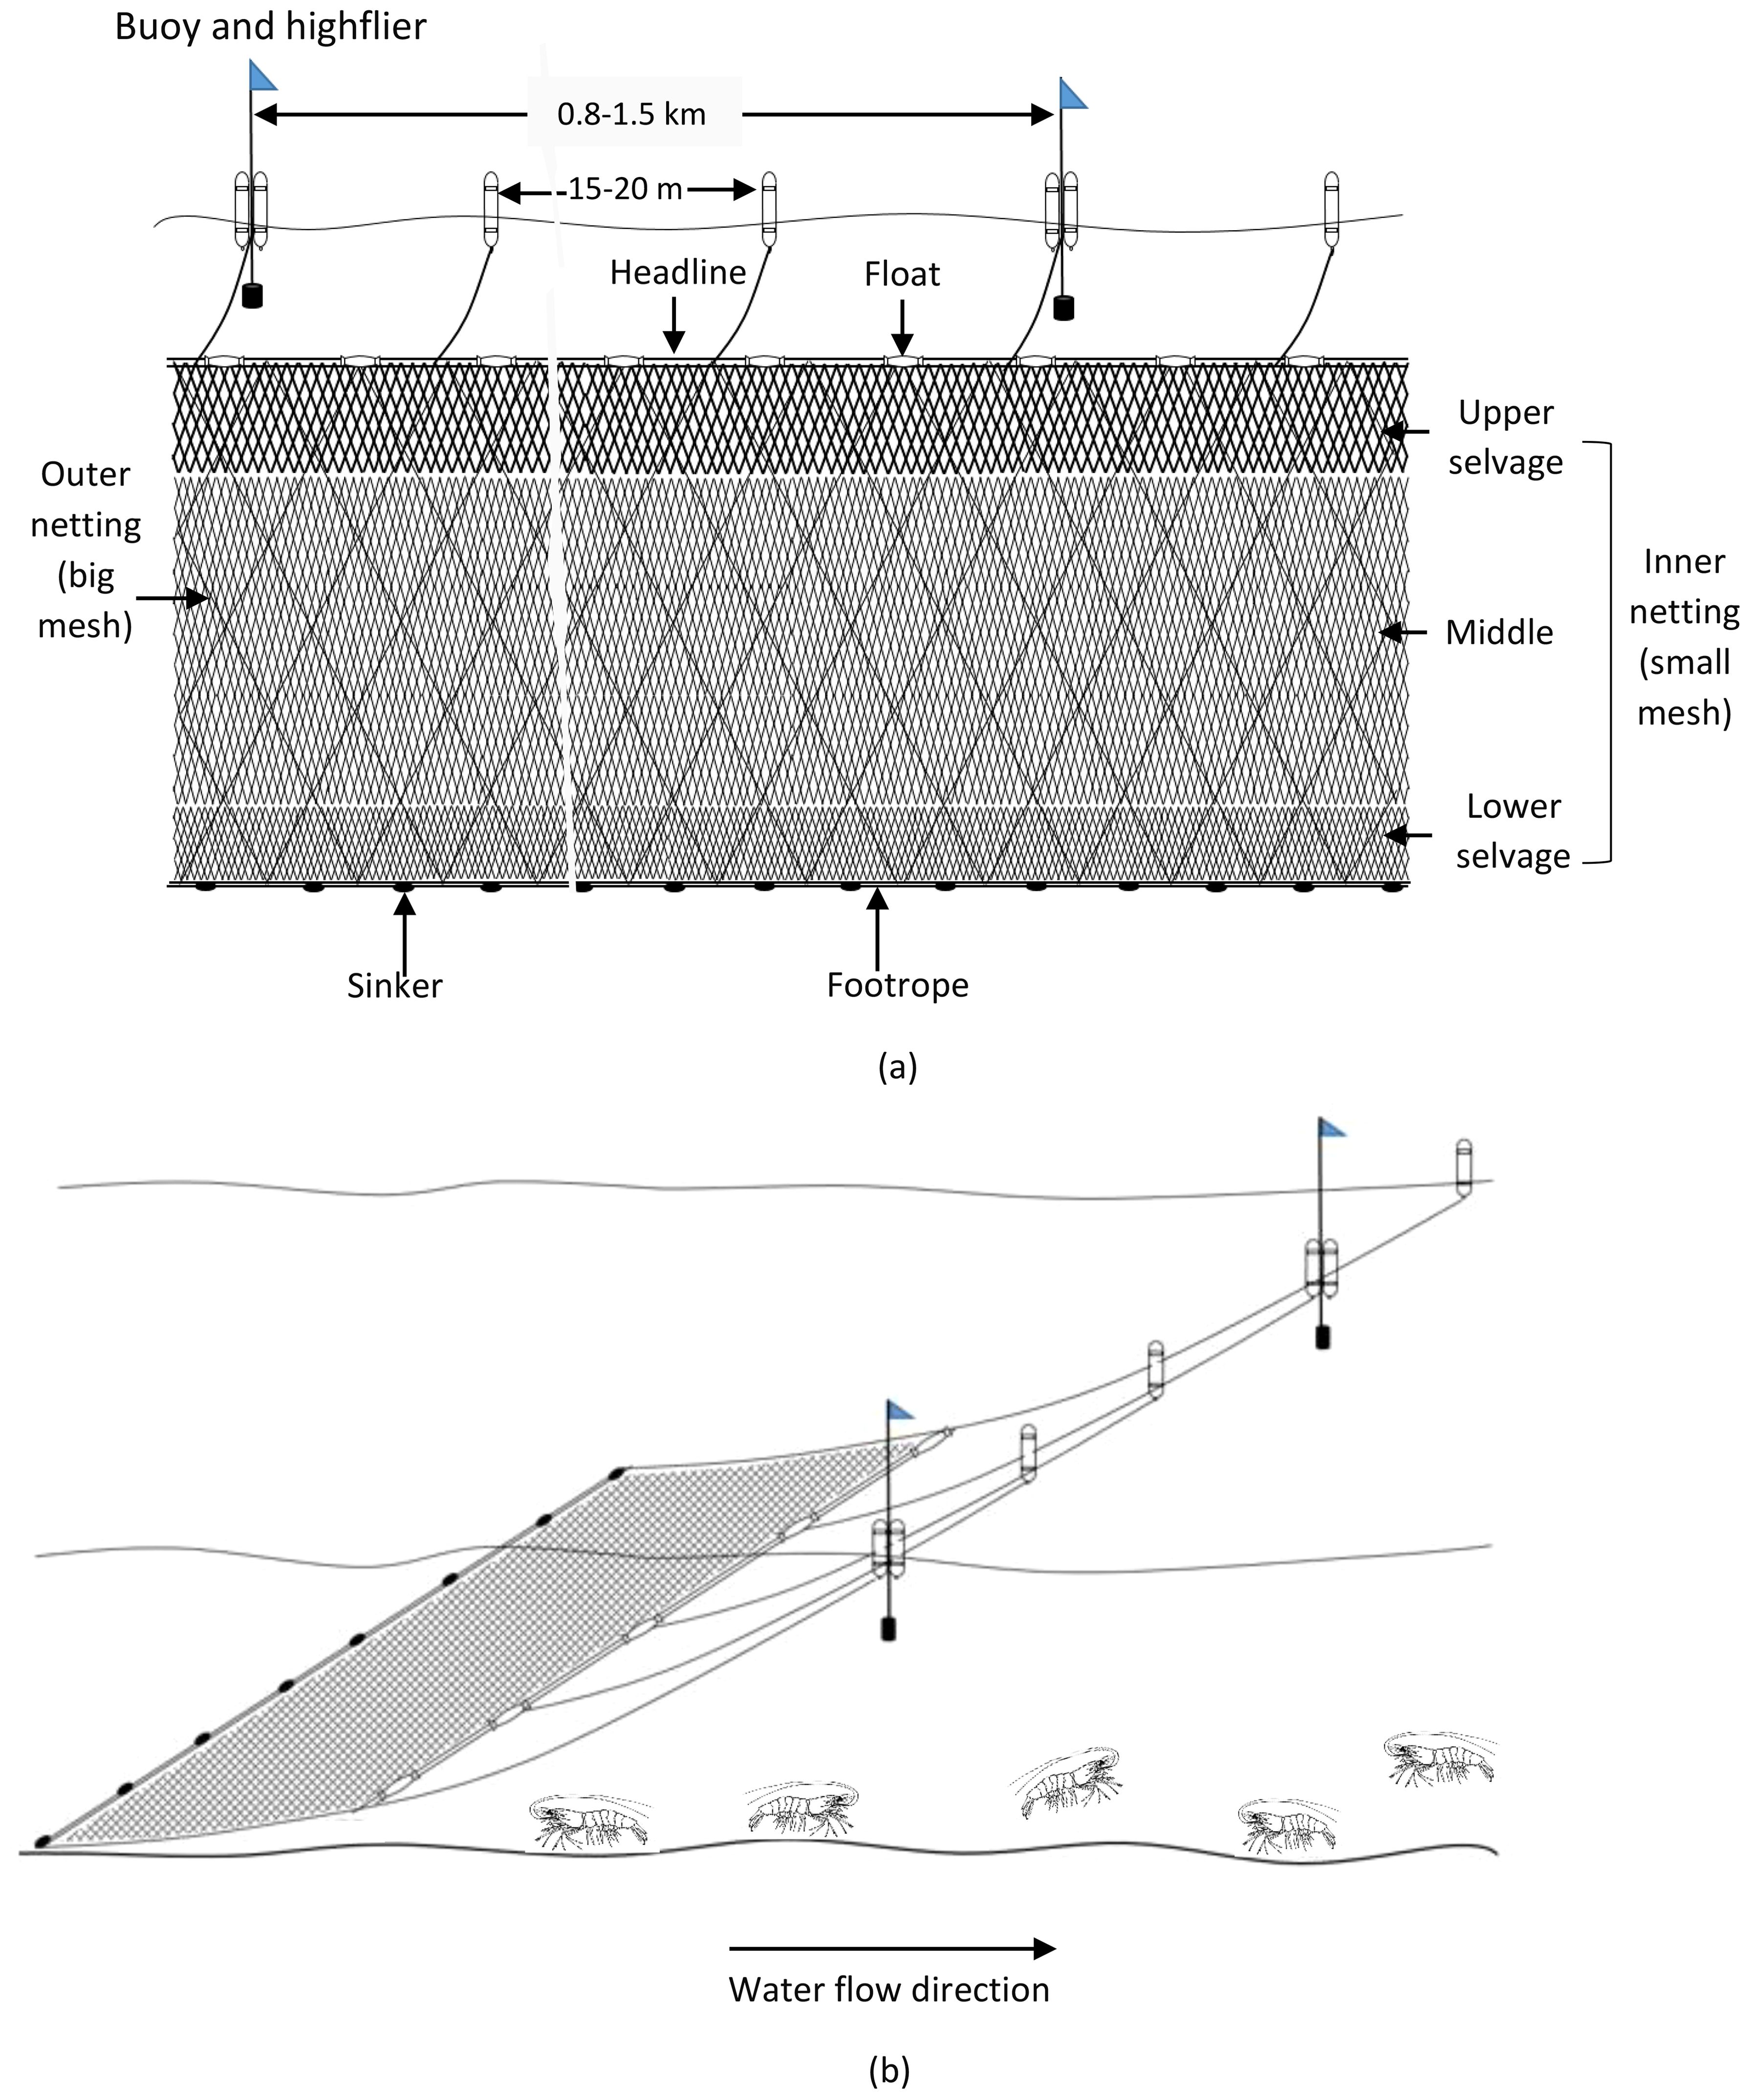
Figure 2. Side view of shrimp brooder trammel net (A) and operation of gill net in the fishing ground (B).
3.1.3 Fishing operation
Sweeping nets are shot crossing the direction of the water current to catch brooders on the seabed. During the fishing time, the net panel drifts due to the water current. The caught brooder production depends on the size of the seabed where the nets swept on; thus, faster water current and longer drifting time will result in higher production. Average fishing time per day (ranging from one to two) varied depending on water currents. Brooder fishing was conducted during the day; the first catching batch lasted from sunrise to noon and the second ended at sunset. After four to six hours of drifting with water currents, fishermen pulled the nets onto the boat using an electrical rotating drum. Fishermen usually worked about 305 days per year.
3.1.4 Wild-caught brooder
Fishing boats had a catch production of 2,400 to 21,840 brooder.boat-1.year-1. Of these, 69% of wild-caught brooders met standard criteria for hatchery production. The female to male ratio was 52.1%, and the average sizes of brooders were 208 g for females and 121 g for males.
3.1.5 Collection and distribution of brooders
Distributors play an essential role in collecting from fishermen (at fishing grounds) and distributing brooders to shrimp hatcheries. The collecting brooder boat had a DWT of 25–30 tons, and one collection boat can collect wild-caught brooders from two to three fishing boats. About five to eight brooders were acclimated in 100-L aerated styrofoam containers without feeding in the landing period of two to three days. After landing, the wild-caught brooders were sold to hatcheries within 24 hours with an average survival rate of 98%. Annually, one distributor collected and distributed an average of 23,000 ± 4,045 wild-caught brooders, of which approximately 48% were females.
3.2 Hatchery production
The hatchery uses wild-caught females that are ready to spawn after being caught from the sea. This analysis did not consider the unqualified female and male brooders (normally used for the re-maturation culture). The survey results showed that hatcheries were established during the period from 1997 to 2014. These hatcheries applied water exchange techniques in combination with the use of beneficial micro-organisms (probiotics). Hatcheries produced between four and five crops per year, for an average of 4.1 annual crops.
3.2.1 Hatchery construction
Hatcheries had an average total tank volume of 460 ± 400 m3, in which the volume of larval rearing tanks accounted for 41%, followed by treatment tanks (40%), wastewater treatment tanks (13%), spawning tanks (3%), and hatching containers (1%). The treatment, larval rearing, and spawning tanks were made of concrete for high-temperature stability. Meanwhile, wastewater treatment tanks or ponds were mainly concrete (93.3% of the surveyed hatcheries), earth ponds (5%), and HDPE (high-density polyethylene)-lined (1.7%). The use of earthen ponds for wastewater treatment can reduce construction costs, but water was not thoroughly sterilised or treated before being discharged to the external environment. The details of technical and cost-benefit parameters are presented in Table 3.
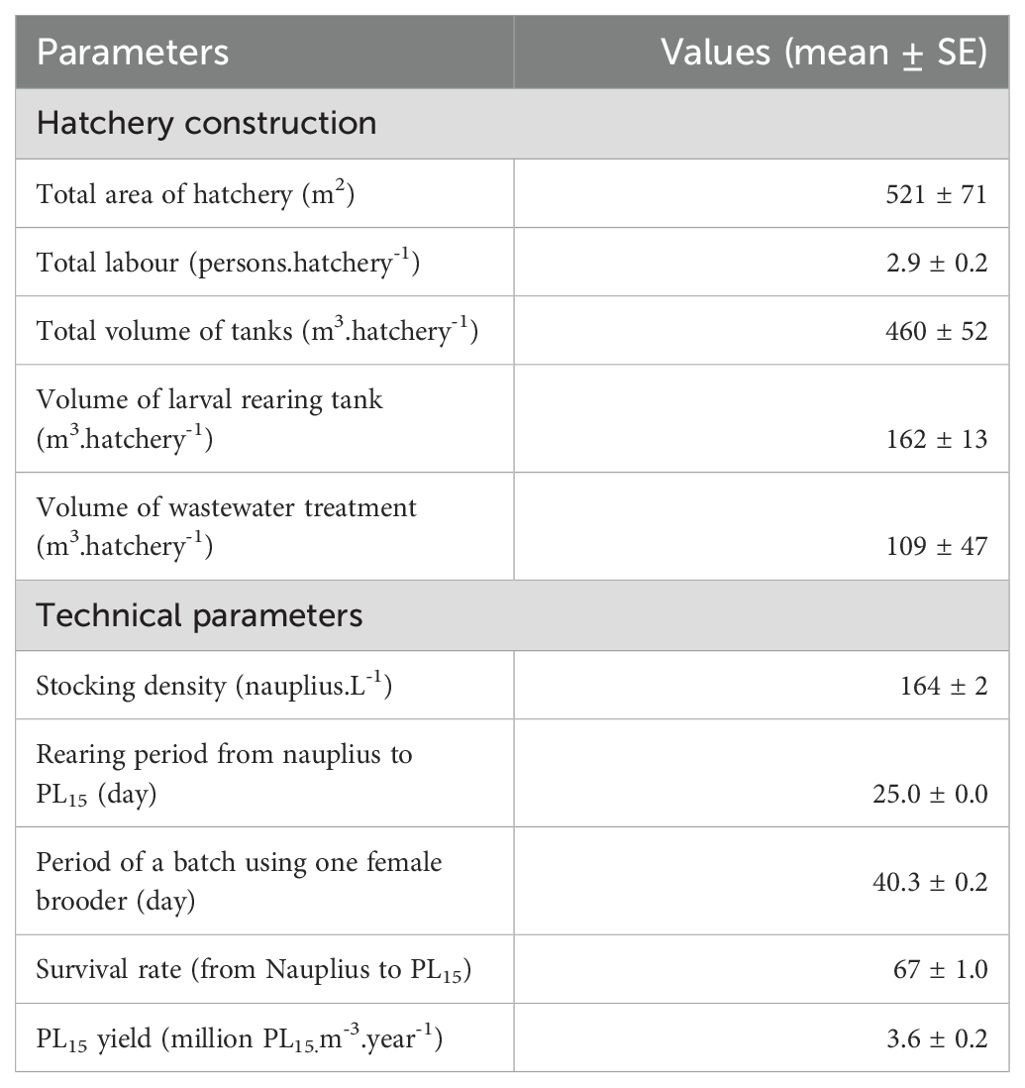
Table 3. Characteristics of technical and cost-benefit of capture-based hatcheries.
3.2.2 Female brooders
Wild-caught female brooders were delivered to hatchery gates by distribution agencies. The surveyed hatcheries used only wild-caught female brooders, averaging 48 individual.hatchery-1.year-1. After eye stalk ablation (eye removal), female survival rates were about 95% and were able to reproduce eggs (spawn) at least three times continuously.
3.2.3 Water sources
Water sources commonly used in hatcheries include surface saline water (from rivers and seawater) and ground freshwater. The survey results showed that surface saline water accounted for 74% the total volume (of which 19% was from river and 55% from the sea), and 26% was ground freshwater. Ground freshwater was used mainly to adjust water salinity for larval rearing and acclimating PL to low salinity before stocking in grow-out farms.
3.2.4 Chemicals and probiotics
Hatchery water was treated by alluvium settlement and sterilised using chlorine (CaOCl2), potassium permanganate (KMnO4), iodine, formal, and copper sulphate (CuSO4). Ethylenediaminetetraacetic acid (EDTA) and sodium thiosulfate (Na2S2O3) were also used to remove heavy metal toxicity and neutralise chlorine, respectively. Additionally, during the rearing stages from larvae to PL15, probiotic products (containing beneficial microorganisms such as Bacillus spp., Lactobacillus spp., and enzymes of protease, amylase, cellulase, and lipase) were also used to maintain water quality in rearing tanks.
3.2.5 Natural food and feeds
Wild-caught female brooders were fed live foods such as wild-caught hermit crabs (Pagurus) and polychaete worms. Live algae (Chaetoceros and Thalassiosira) and dried algae (Spirulina) were used for the zoeal stage, while Artemia nauplii and compound feeds were used for the mysis and PL stages.
3.3 Resource utilisation
3.3.1 Material flows and cost-benefit
3.3.1.1 Material flows
RUIs for the capture, distribution and hatchery stages, based on 1,000 wild-caught brooders, are presented in Figure 3. The RUIs are higher, resulting in poorer resource utilisation efficiency. With the brooder fishing ground of about 15,000 km2, the resources used for the capture of brooders can be divided into various groups including fishing effort (boat capacity and fishing gear), human labour, energy (diesel oil), and by-catch products as a natural resource used (by-catch product sold and considered as an income source to compensate of expenses). The quantity of input materials was calculated based on initially captured wild-caught brooders at fishing sites (with a function unit of 1,000 wild-caught brooder). Because hatcheries used only ready-to-spawn wild-caught female brooders, the material flow analysis focuses mainly on female brooder for capture-based hatcheries. The boundary of material flow spans from the capture of wild female brooders until spawning and rearing to PL15 at hatcheries.
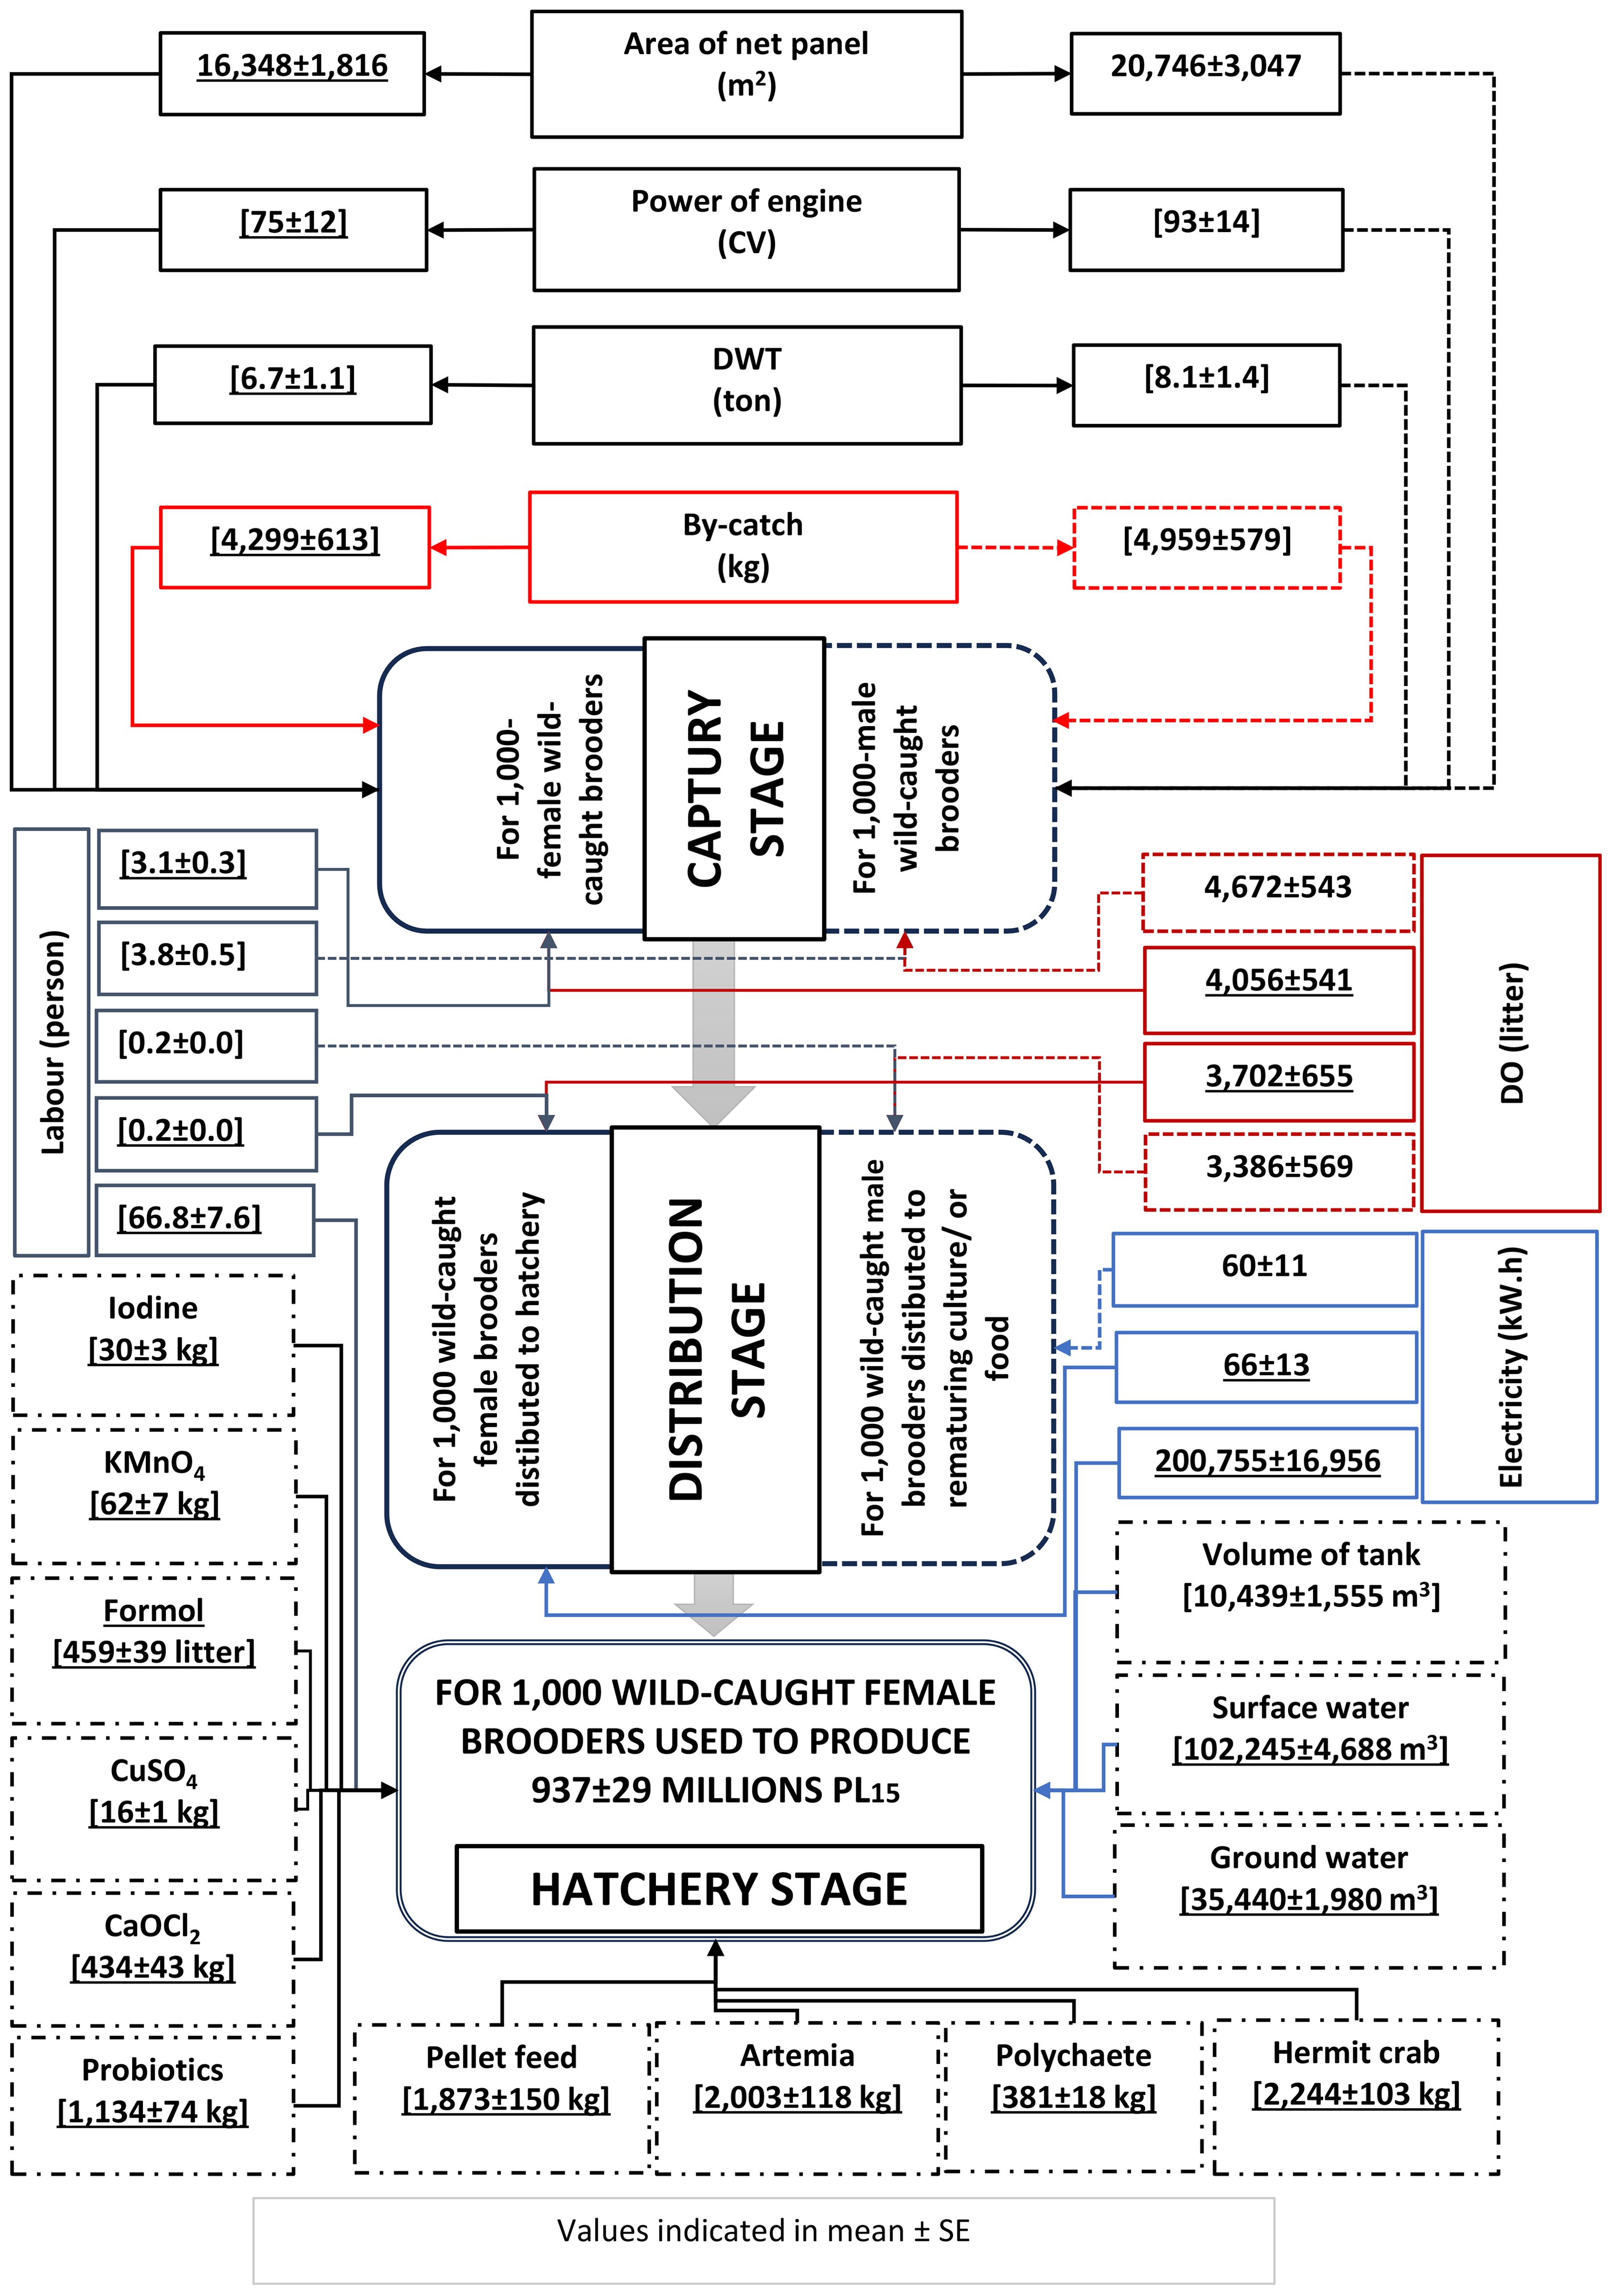
Figure 3. Material follows with RUIs of capture-based hatcheries in Vietnam.
The use of 1,000 wild-caught female brooders produced an average of 937 ± 29 million PL15. The production of PL15 consumed various resources such as boat capacity, net panels, energy (diesel oil/or DO and electricity), labour, and other inputs. Based on 1,000 wild-caught female brooders, PL15 production consumed 70.1 labour and is critical for three exploitation, distribution, and hatchery operation. DO consumption for capture and distribution was 7,758 L; electricity consumption was 200,821 kW.h, 99.9% of which was used for hatchery.
In PL15 rearing or nursery, in addition to the wild-caught female brooders, input resources also include concrete tanks, water quantity (surface and groundwater), feeds (natural food and artificial feeds), chemicals, and probiotics. Because the amounts of ethylenediamine tetra-acetic acid (EDTA), sodium bicarbonate, and sodium thiosulfate are small, they are not estimated.
3.3.1.2 Cost-benefit
3.3.1.2.1 Capture stage
The production cost of a wild-caught brooder averaged US$ 14.6 ± 1.45, while the average onboard selling prices of brooders were US$ 32.6 and US$ 6.9 for each female and male, respectively. Meanwhile, the price of by-catch products was low, with an average of US$ 0.9 kg-1, which was simply considered a contribution to cost reduction. Labour and DO costs accounted for a high proportion (68.1% and 21.1%, respectively). Annually, a fishing boat owner earned US$ 36,447 ± 10,785.
3.3.1.2.2 Distribution stage
The net income of the distributor had an average of US$ 750,782 ± 131,615 per year. Females ready to spawn were sold to hatchery operators at an average price of US$ 106 each. The total production costs were only US$ 59.5 ± 8.70 each, of which the cost of brooder was 80.5%.
3.3.1.2.3 PL15 production stage
The production cost averaged US$ 0.87 ± 0.03 for 1,000 PL15, in which the cost share of female brooder was 18.5%. The hatchery gate price of PL15 was about US$ 1.14 for 1,000 PL15, resulting in an average net income of US$ 89.3 ± 10.7 per m3 of rearing tank (Figure 4).
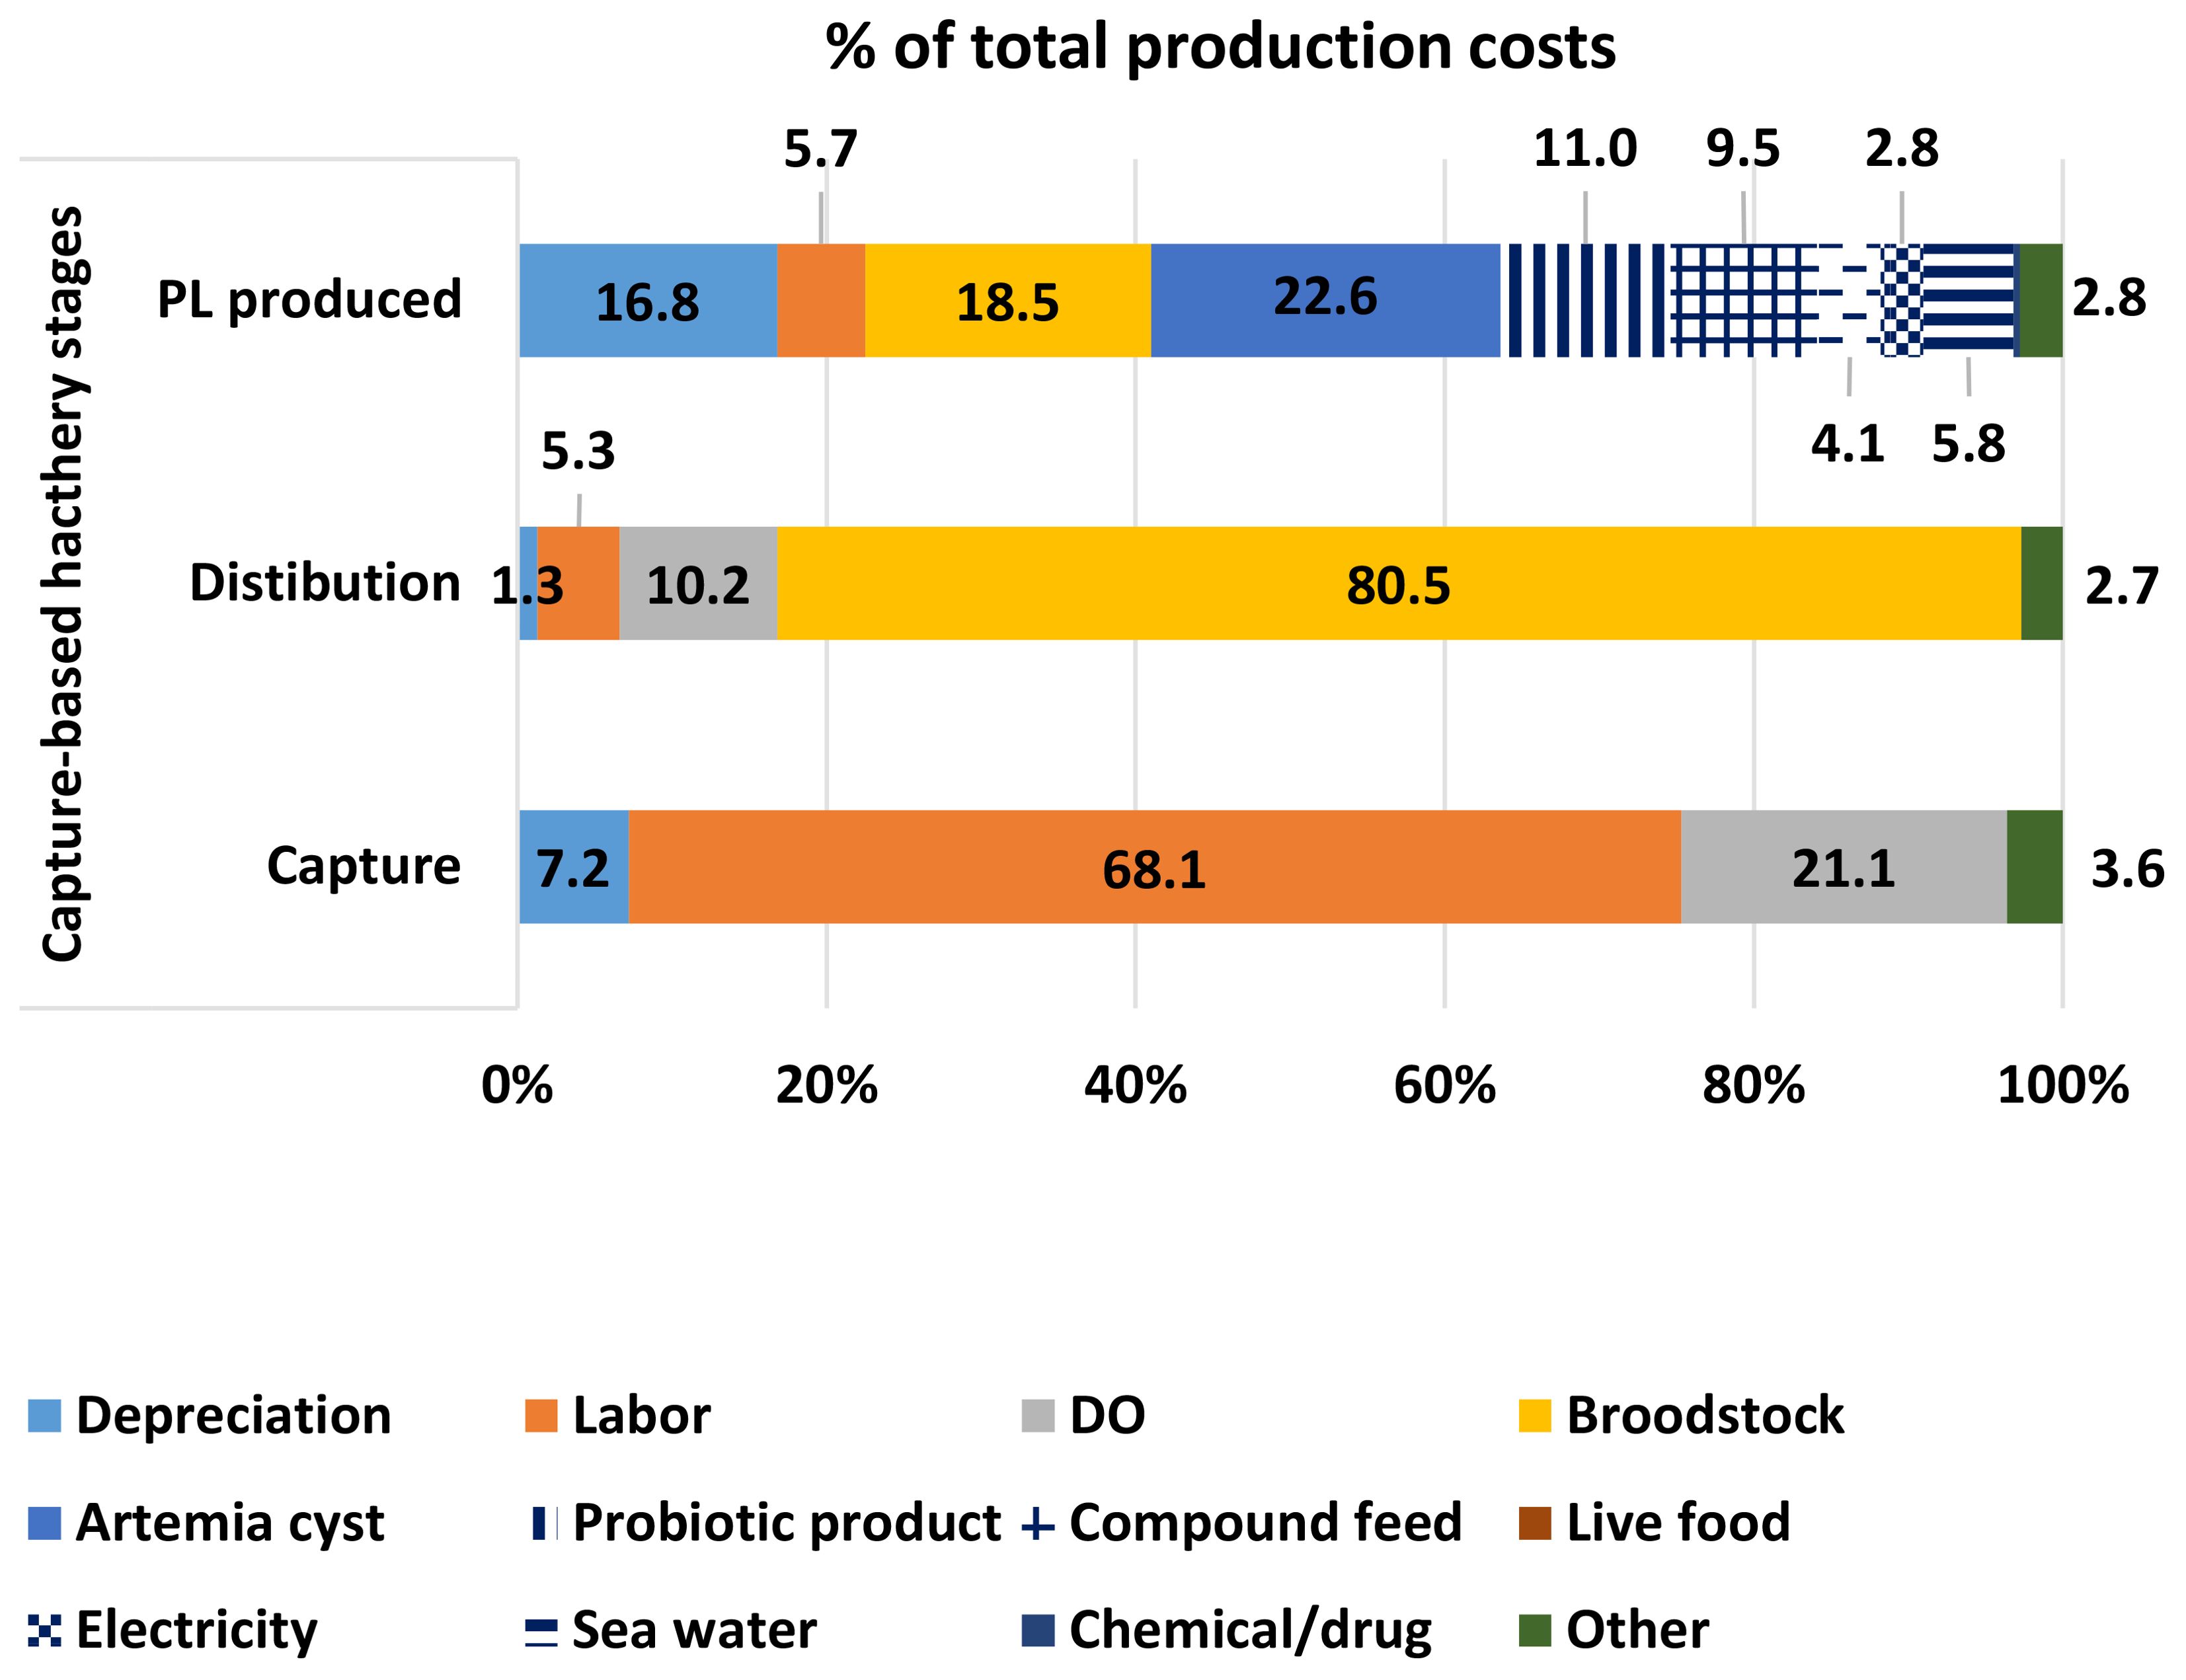
Figure 4. Distribution of production costs in capture-based hatchery.
3.3.2 Resource use index analysis
3.3.2.1 Capture and distribution of brooders
The size and capacity of fishing boats using drift trammel net depend mainly on specific hydro-meteorological conditions. Wild-caught brooders were sold onboard daily to collecting boats. The fishing boats do not have large space for brooder acclimation. In addition, the size of fishing boats also depends on operating time at the sea and living space for workers. The distribution activities did not have any effects on fishing boats’ productivity. The results indicated that there was no significant correlation (p > 0.05) among fishing effort parameters such as DWT, engine power, length of the boat, and length of the net. This implies that there is no regular variation among these factors to enhance brooder catches (e.g. a stronger engine capacity has longer net lengths). The drift trammel net depends greatly on the fishing grounds’ water current velocity and seabed characteristics.
The correlations among RUIs and parameters of fishing effort were evaluated to determine resource expenses in fishing brooders (for 1,000 brooders captured). Excluding the RUI of by-catch, the engine power had a significant positive correlation (p < 0.05) with RUIs such as engine power (0.88), DWT (0.84), area of the net panel (0.78), number of labour (0.73), and DO (0.76). While the RUI of DWT has positively and significantly correlated (p < 0.05) with DWT (0.77) (Table 4).
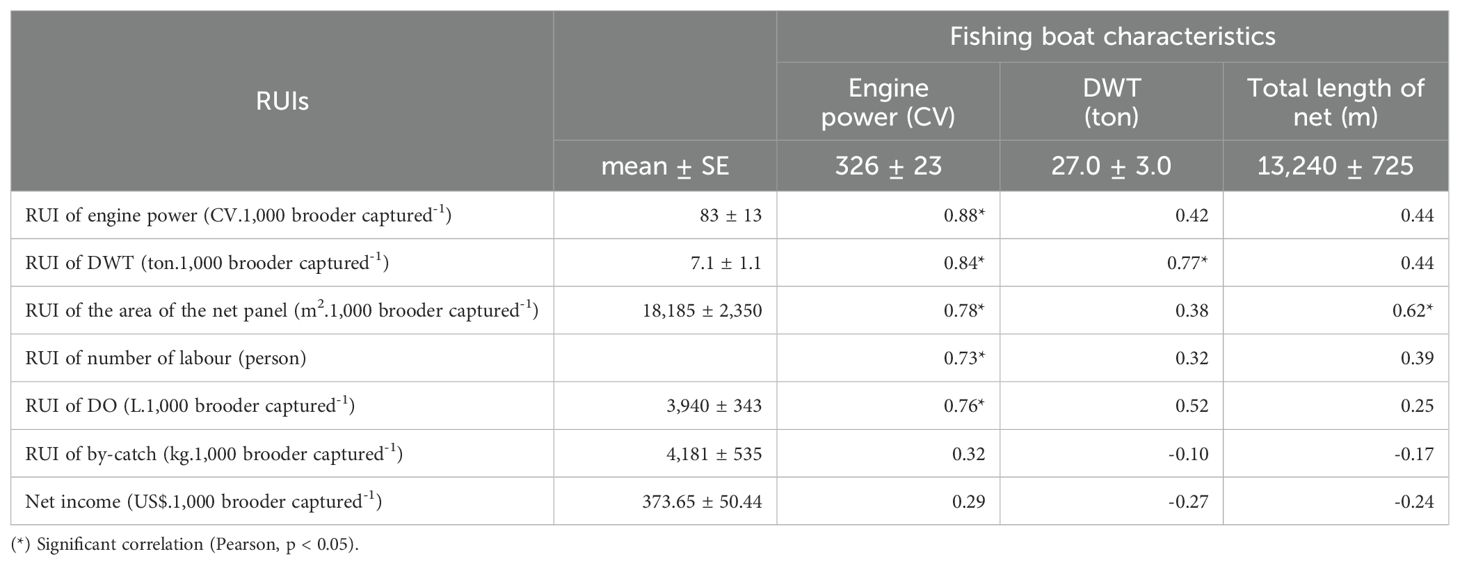
Table 4. Coefficients of correlation between characteristics of the fishing boat and RUIs.
Therefore, the RUIs of engine power, DWT, net panel area, number of labour and DO were predicted by catching efforts parameters such as DWT (ton), engine power (CV) and total length of net (m) through 5 regression functions. Meanwhile, the RUI of by-catch and net income were not regressed because the significant correlation of these catching effort parameters was not found (p > 0.05).
Table 5 indicates that (in bold letters, from function 1 to 5) an increase of 10 CV engine power will increase RUIs of 4.90 CV of engine power, 0.30 tons of DWT, 665 m2 of net panel area, 0.10 person and 106 L of DO. Meanwhile, function 2, if an increase of 10 tons of DWT fishing boat will increase 2.00 tons of DWT’s RUI. These above-mentioned issues indicated that the RUIs would be poorer if fishing efforts, such as engine power, DWT, and total net length increased.
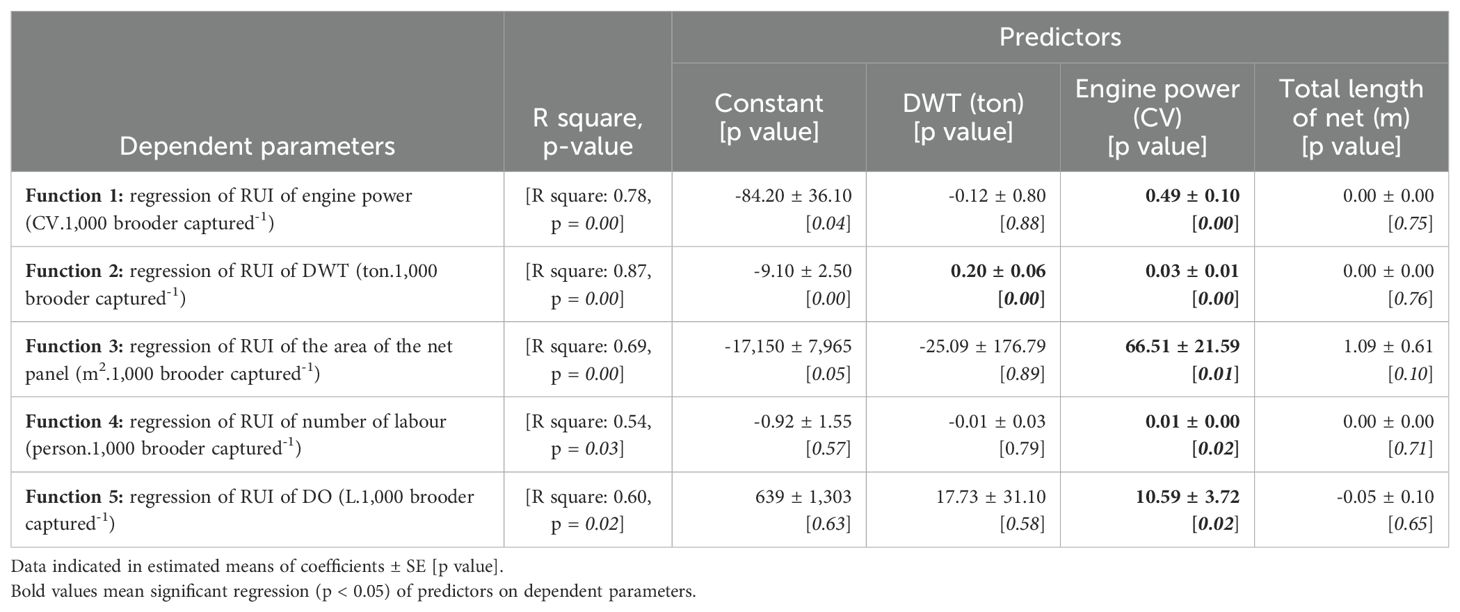
Table 5. Coefficients of prediction parameters in five regression functions of RUIs.
At the distribution stage, DO consumption accounts for 47.7%, electricity 0.03% and labour 0.30% of the total amount of resources used through the hatchery production (from capture to hatchery that only use female brooders). With a frequency of 2-3 days per trip of collecting boats, (the best time for maintaining good health of brooders), and the effectiveness of collecting brooders depends on the fishing productivity and weather conditions. The influence of engine power, DWT of collecting boat on the RUIs was not appropriated for analysis.
3.3.2.2 Hatchery production efficiency
Only wild-catch female brooders are used in the breeding process, RUIs were analysed based on only 1,000 female brooders. For inheritance and related to the exploitation and use of female brooders, the body weight of female brooders is related to both the exploitation results and the hatchery’s method of brooder selection. In addition, rearing density of nauplius and PE-PL15 (millions of PL15 produced using 1,000 female brooders) and net income are also evaluated in this section.
PCA discovered that there are six components having eigenvalues exceeding 1 explains 81.8% of the total variability, and all parameters are loaded into 6 components with coefficients greater than 0.50 (bold numbers, Table 6).
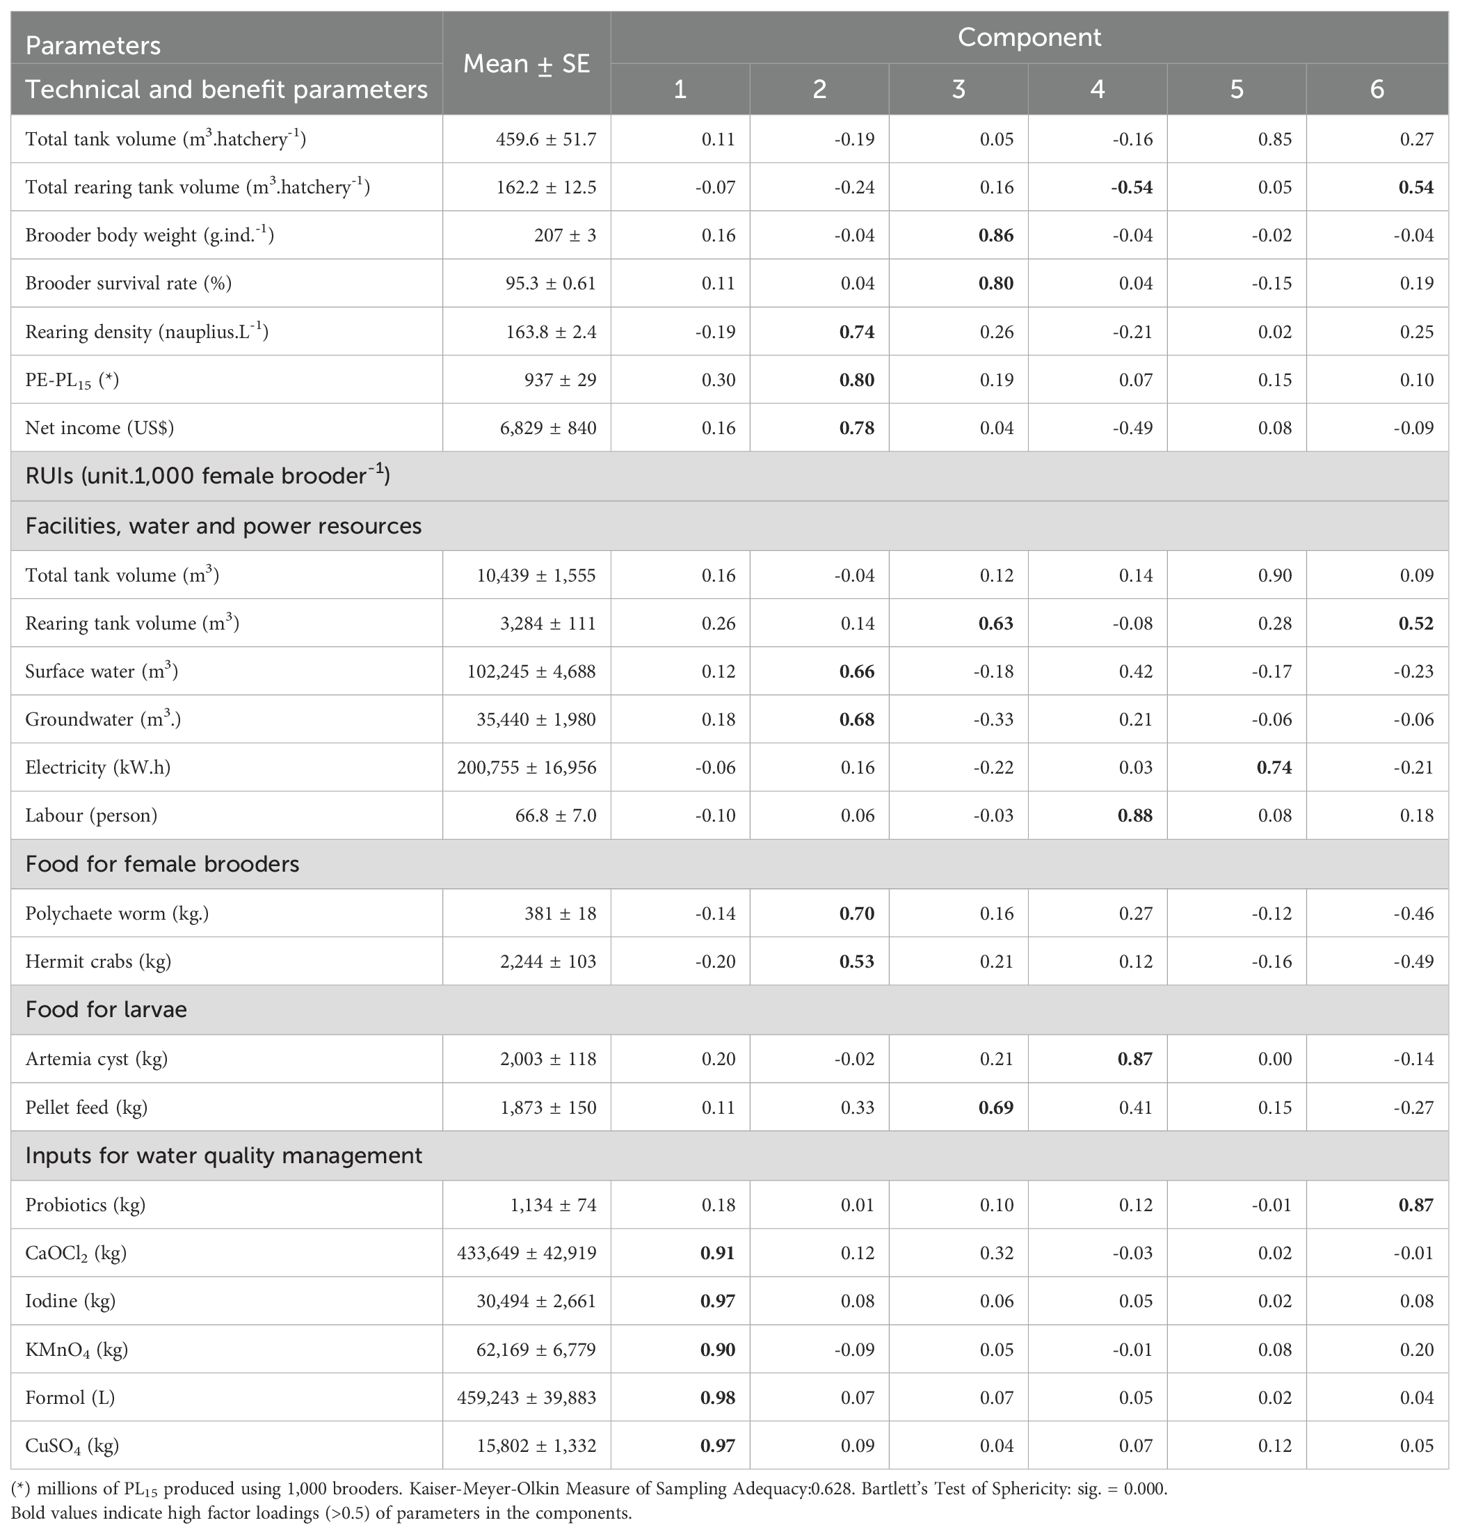
Table 6. Rotated component matrix of technical, PE-PL15, benefit and RUIs parameters in hatchery stages.
The first component (C1) explains 21.7% of the total variance. This component has a high positive coefficient loading of RUI of CaOCl2 (0.91), iodine (0.97), KMnO4 (0.90), formol (0.98) and CuSO4 (0.97), and represents chemical RUI for water quality management. With 55.6% of the frequency of positive values of the factor score of the hatchery group using female brooders from >200-260 g of body weight, it indicates that the group using the greater body weight of female brooders tended to use more amount of chemicals than hatchery groups using smaller female brooder (Figure 5).
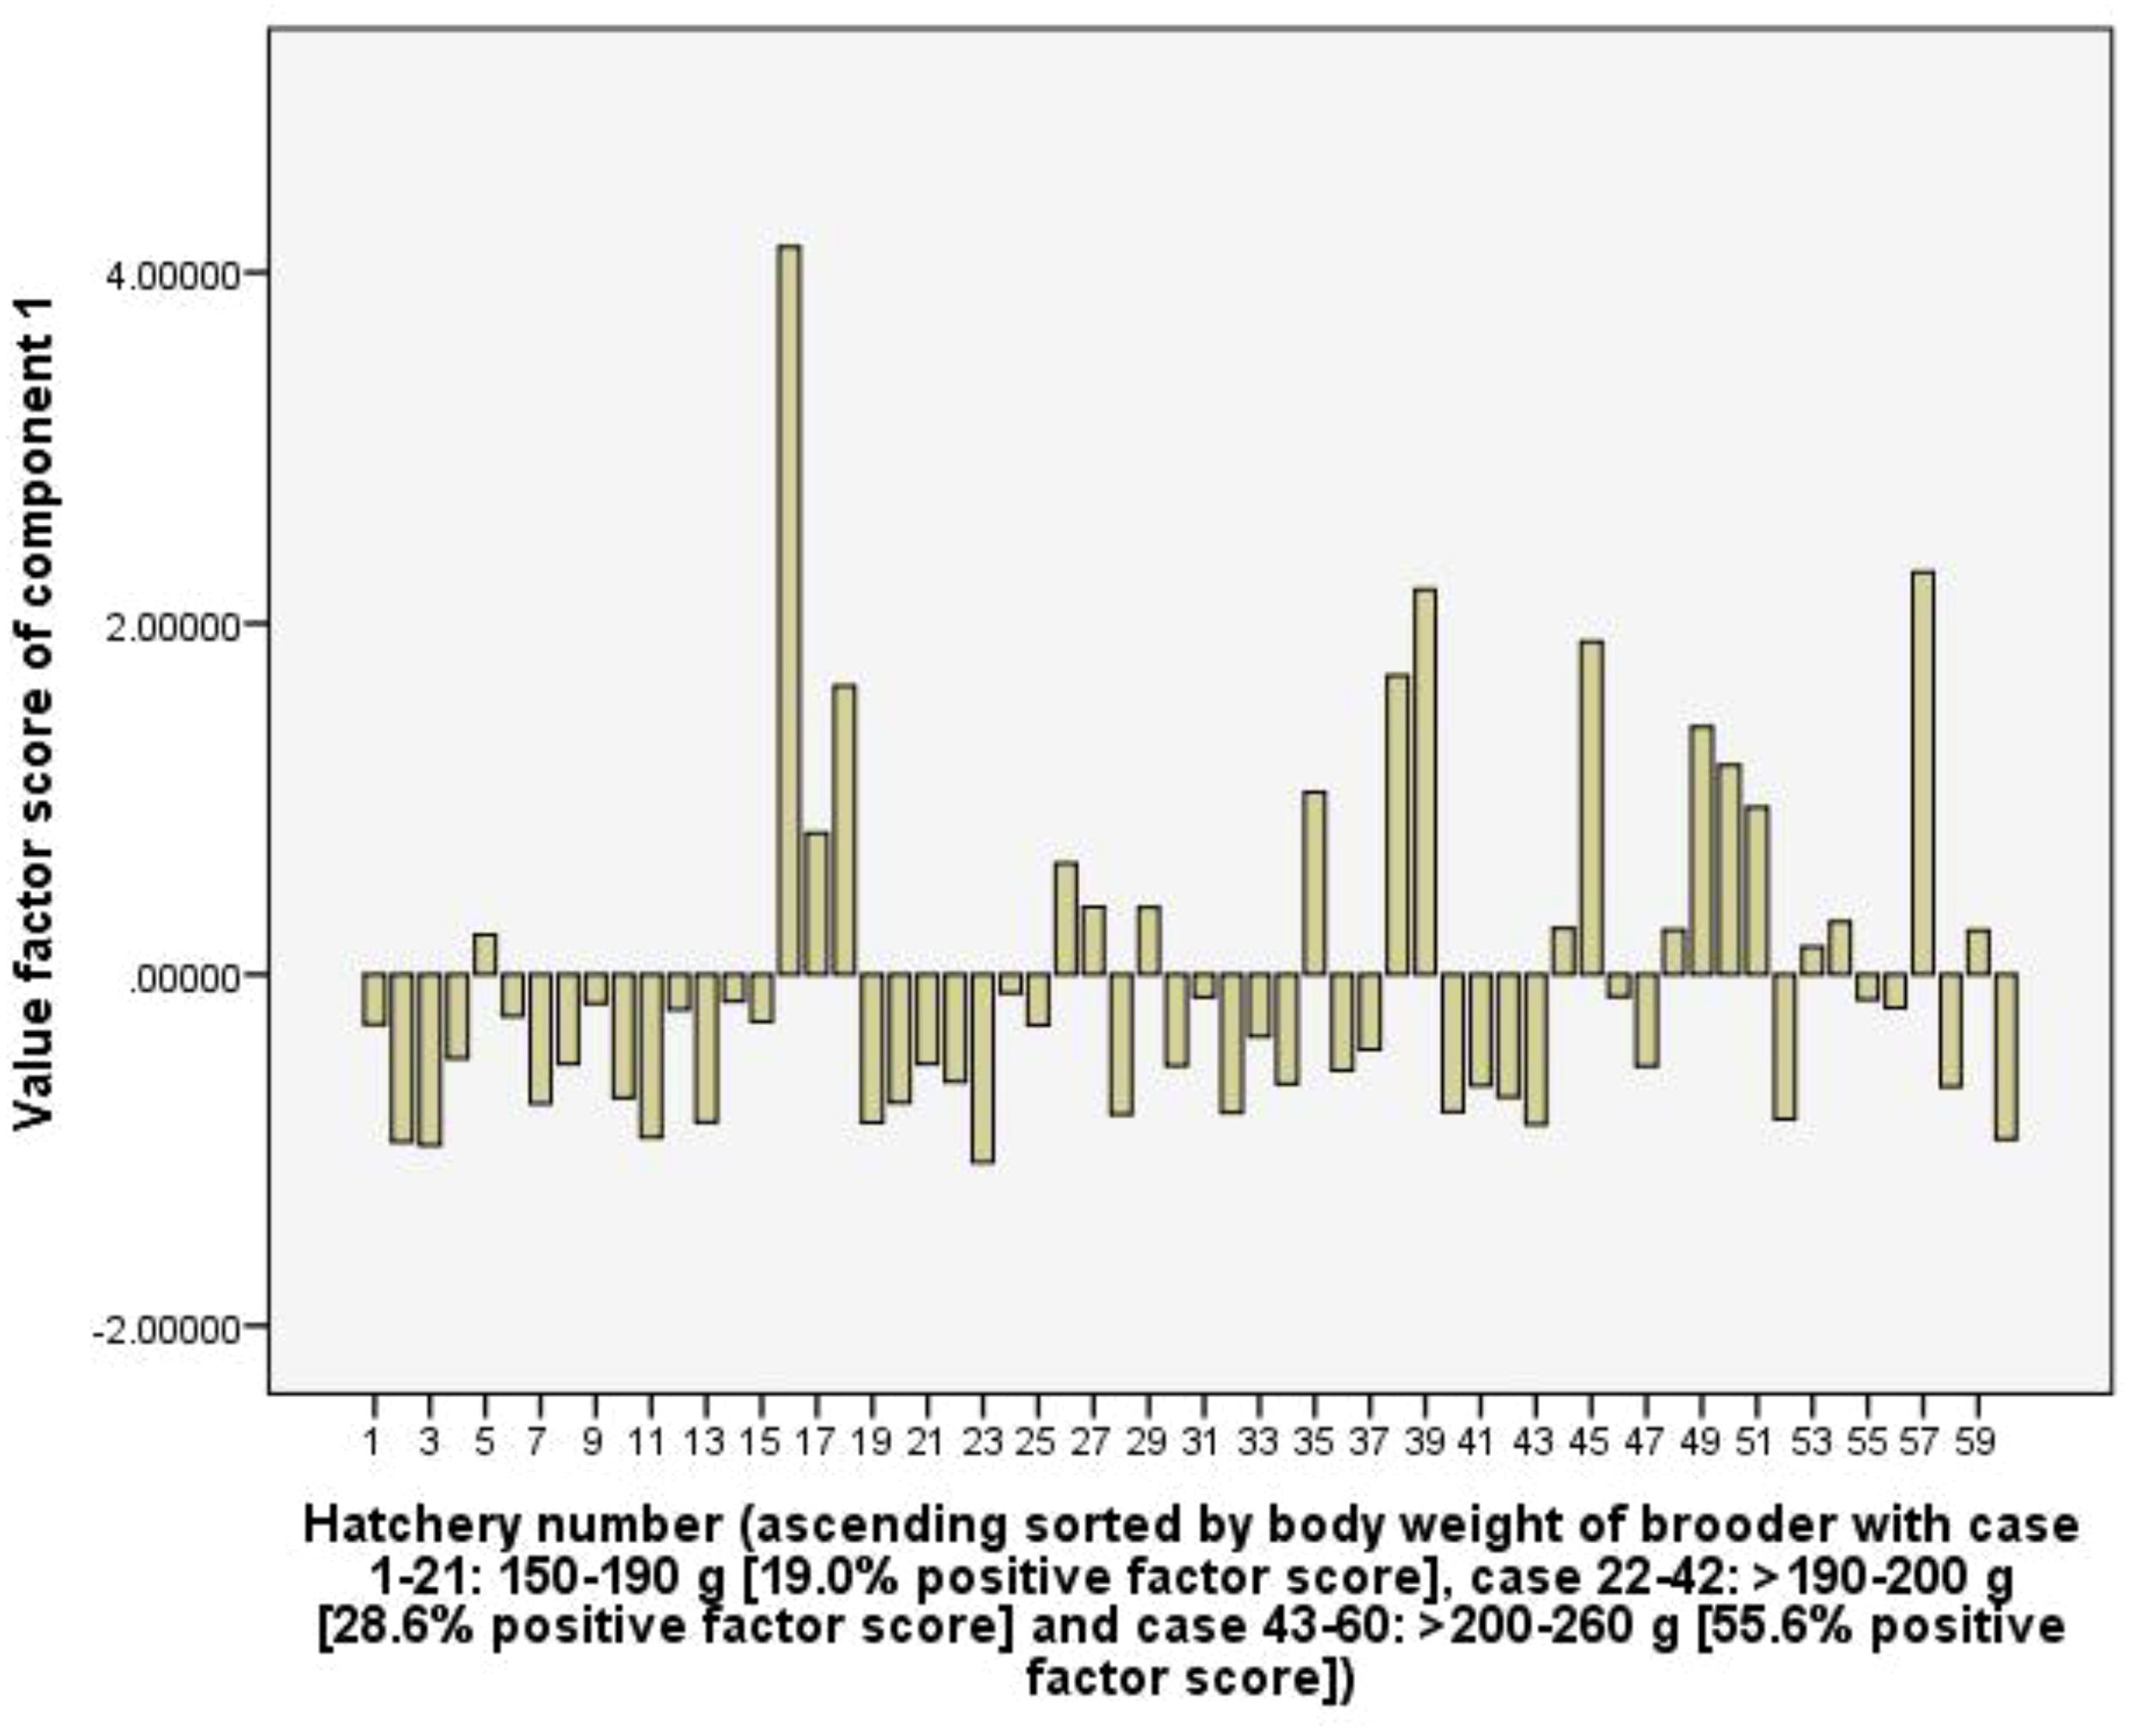
Figure 5. The value scores of chemical RUI component from 60 capture-based hatcheries.
Component 2 (C2) explains 16.3% of the total variance and showed high positive coefficients of PE-PL15 (0.80), net income (0.78), rearing density (0.74), followed by the RUIs of polychaete worm (0.70), groundwater (0.68), surface water (0.66), and hermit crabs (0.53). The C2 represents PL15 production efficiency, profit, and natural resource use efficiency. However, the frequencies of positive value factor score of the C2 are relatively evenly distributed along the horizontal axis at 47.6, 47.6 and 50.0% in female brooder groups with a body weight of 150-190 g, >190-200 g and >200 -260 g, respectively, indicating that the use of female brooders with different body weights does not greatly affect the C2 (Figure 6).
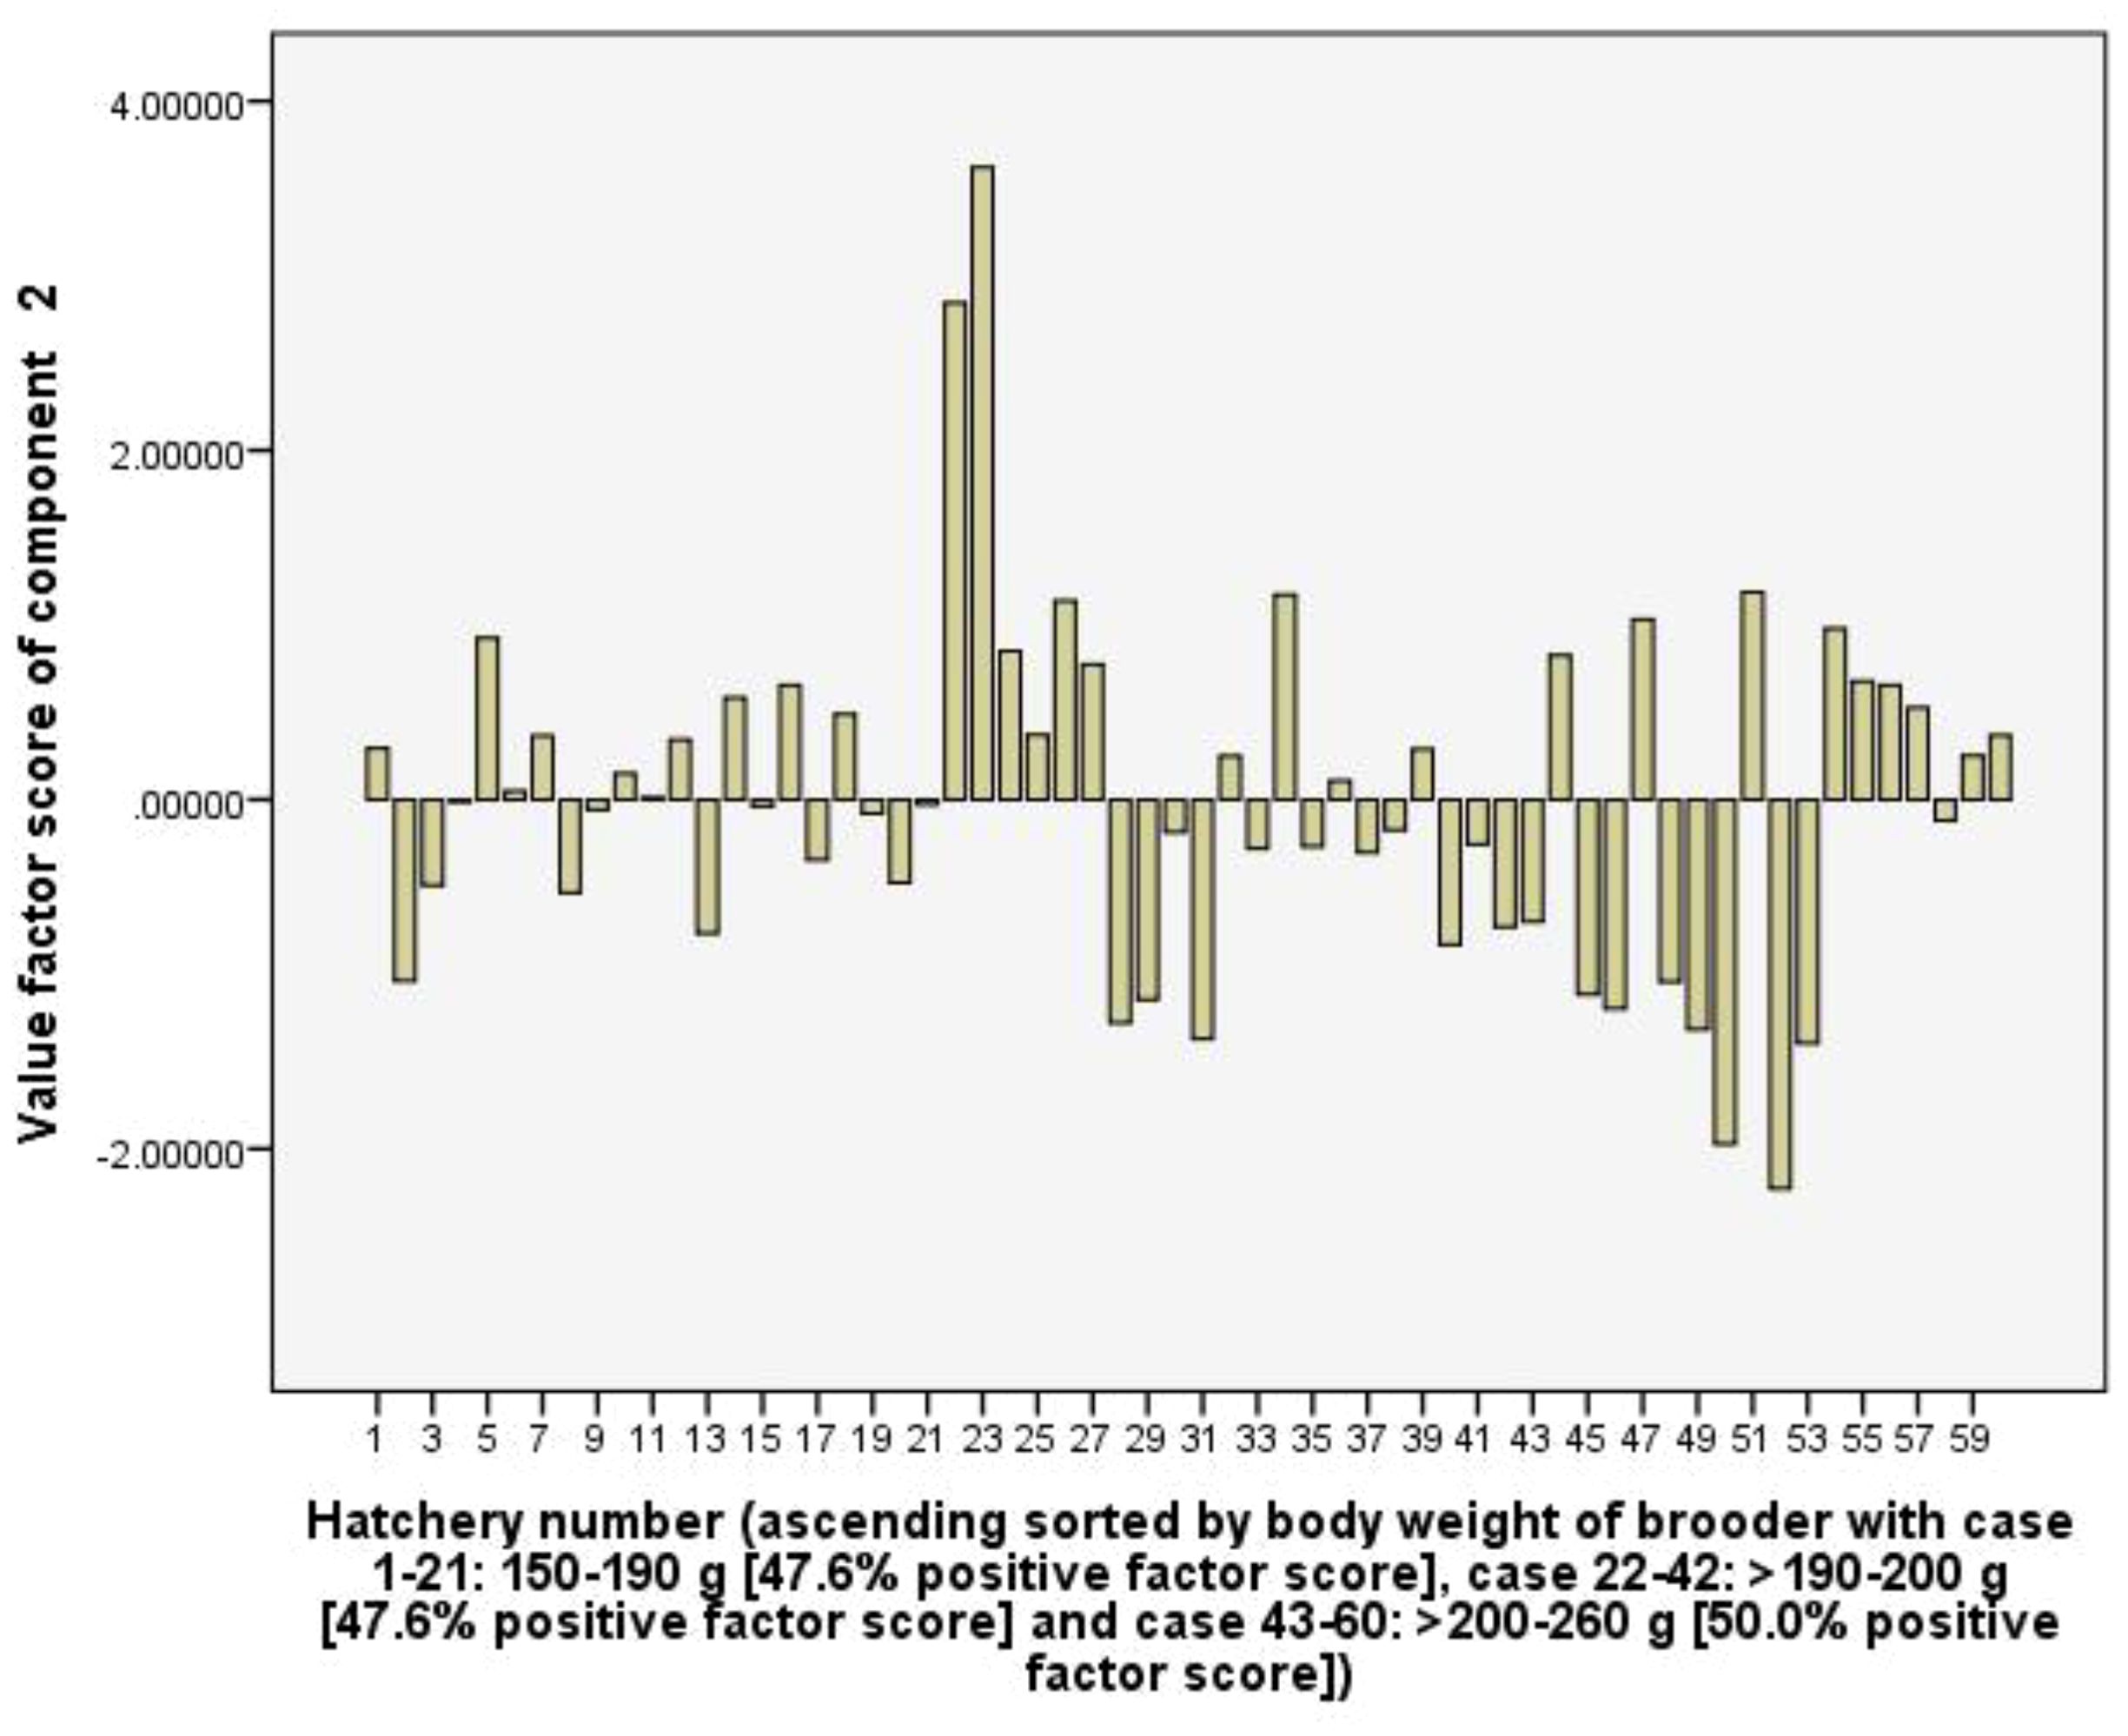
Figure 6. The value scores of PL production efficiency, profit and natural resource use efficiency component from 60 capture-based hatcheries.
Component 3 (C3) explains 12.3% of the total variance and with high positive loading coefficients of female brooder body weight (0.86), female brooder survival rate (0.80), the RUIs of pellet feed (0.69), and total rearing tank volume (0.63). In the group of hatcheries used female brooders with body weight of >200-260 g, positive values factor scores of the C3 accounts for 94.4%, greater than 38.1% and 0.0% in the group of >190-200 g and 150-190 g, respectively. This shows that the C3 represents the body weight and survival rate of female brooders. Large size female brooders have a higher survival rate, but it leads to increasing RUIs of pellet feed and total rearing tank volume (Figure 7).
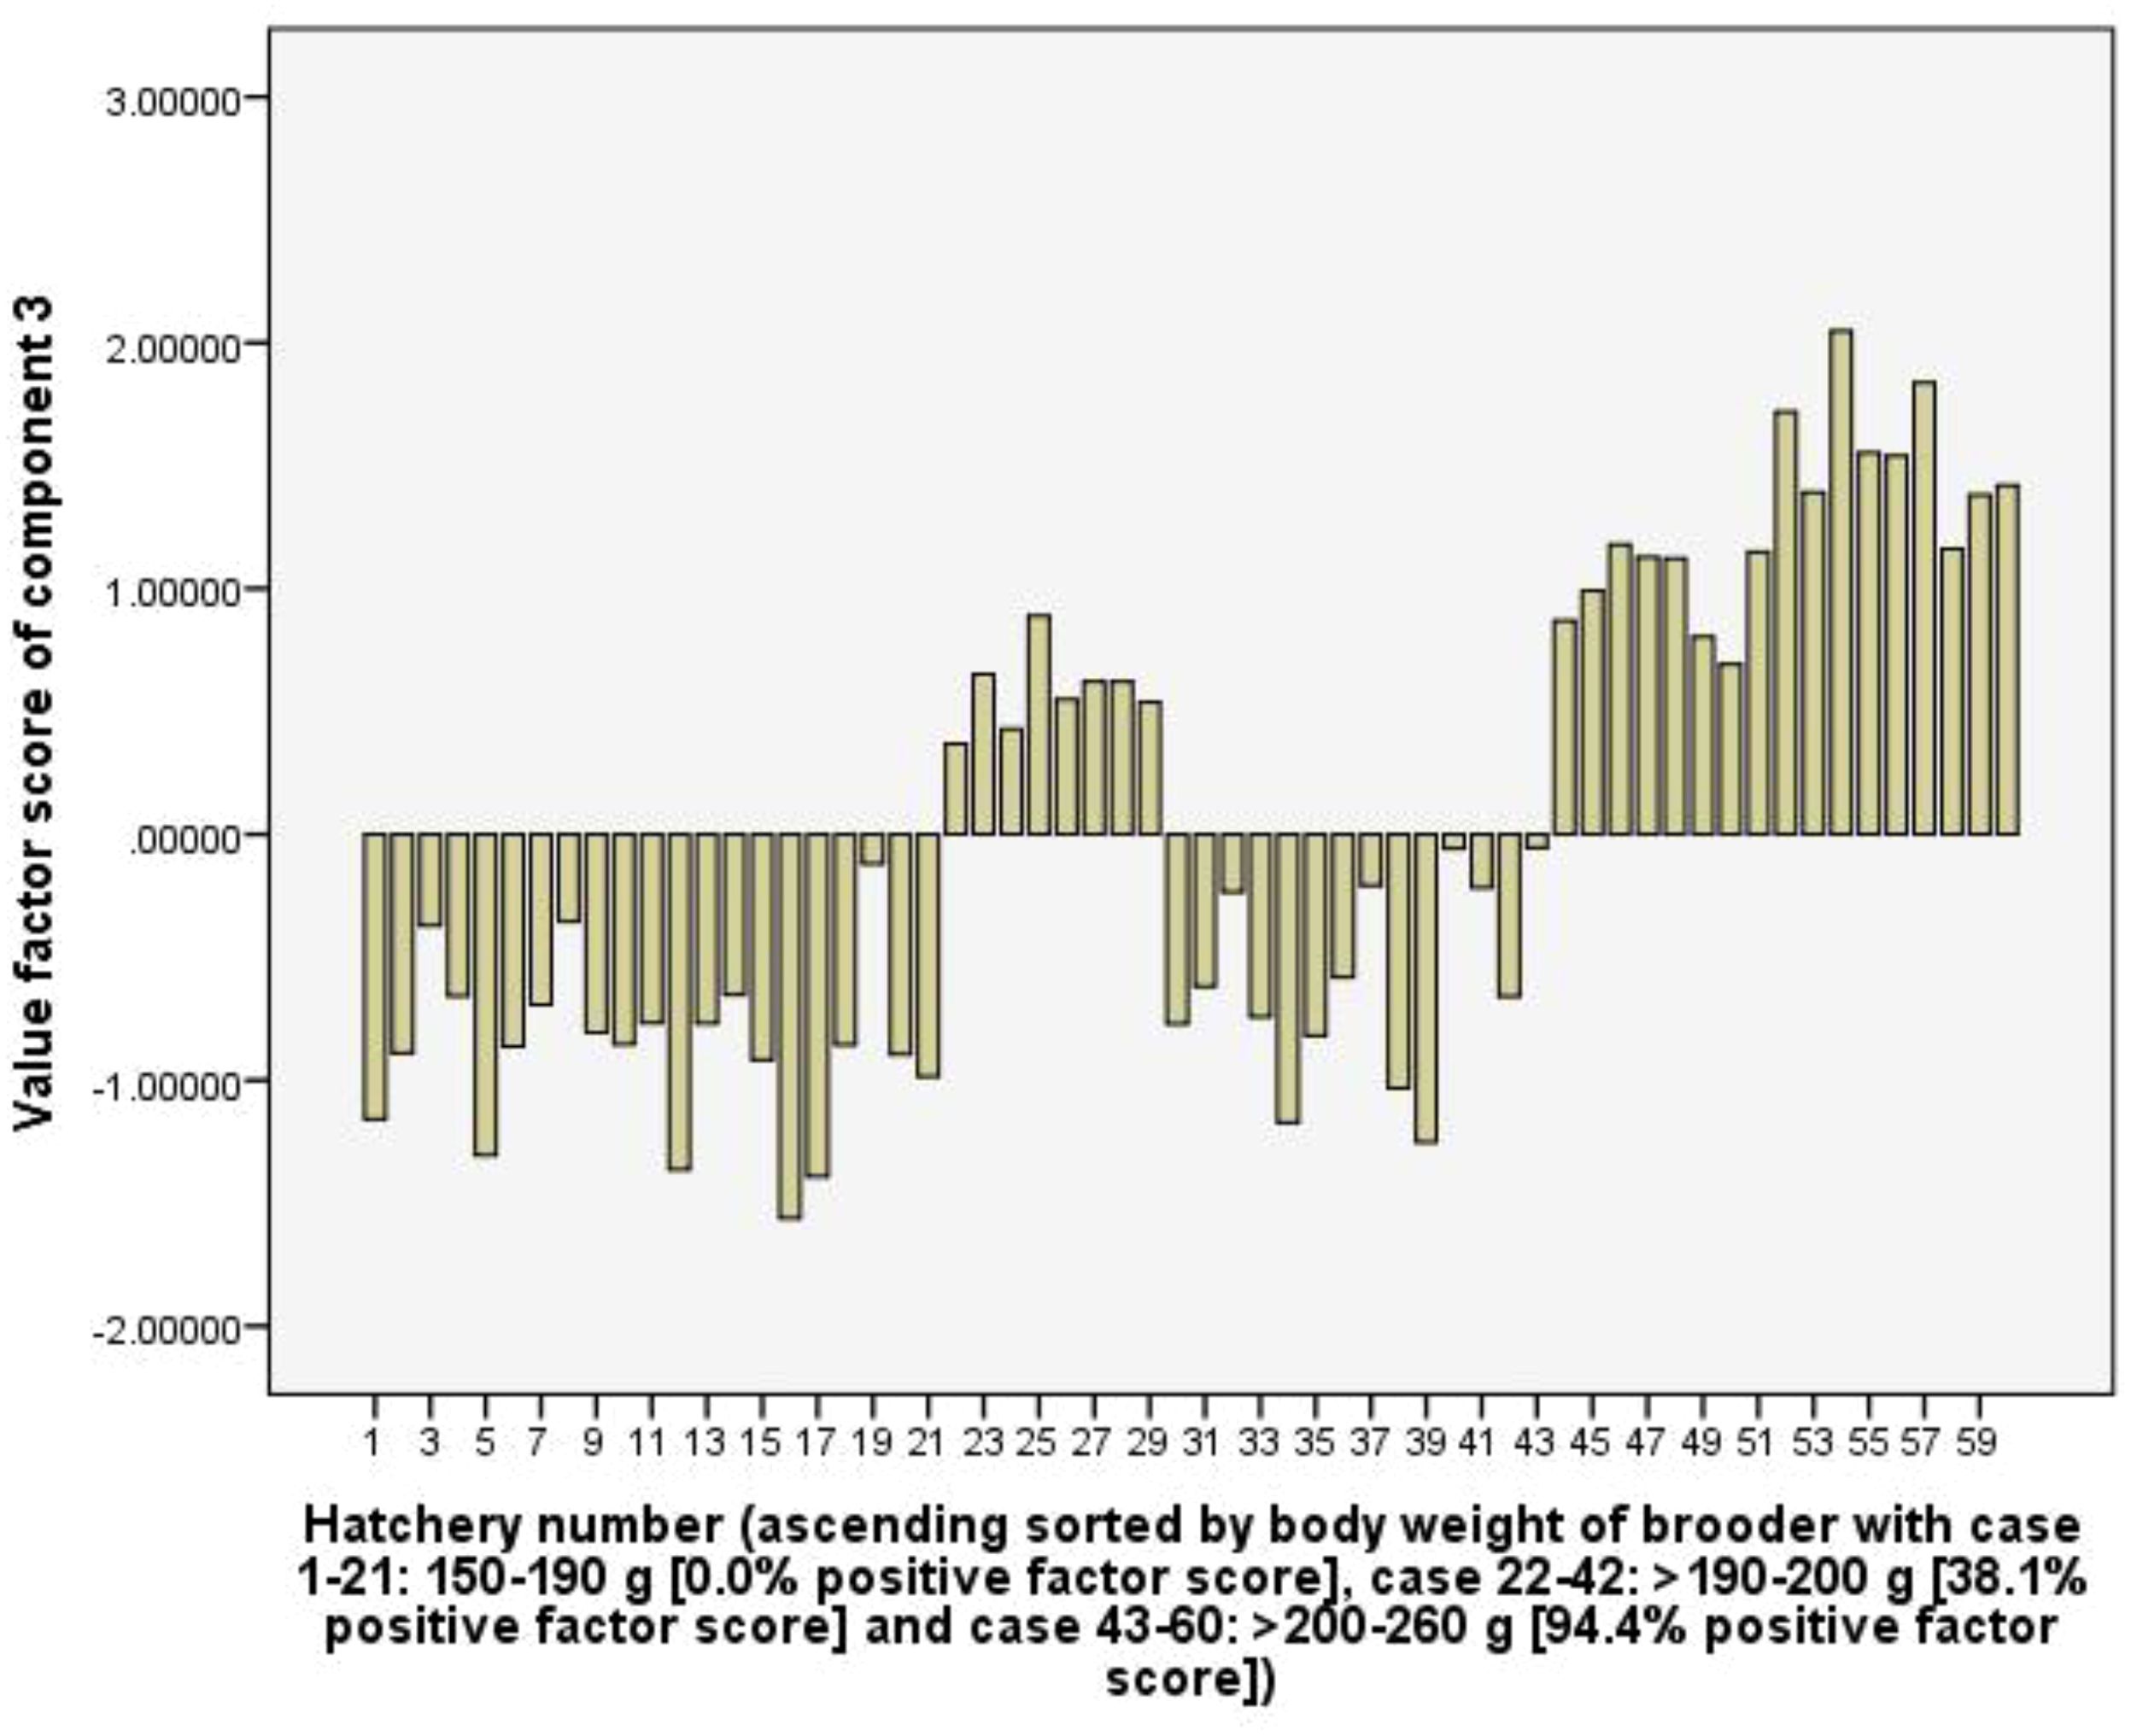
Figure 7. The value scores of body weight and survival rate of female brooders component from 60 capture-based hatcheries.
Component 4 (C4) explains 11.6% of the total variance and shows positive coefficient loadings for RUIs of labour (0.88) and Artemia cyst (0.87), but a negative coefficient loading for total rearing tank volume (-0.54). The C4 is considered to represent the efficiency of using labour and Artemia cyst as well as the hatchery’s larval rearing capacity. In the hatchery group used female brooders >200-260 g of body weight had 33.3% positive factor scores, which is lower than 47.6 and 52.4% of hatchery groups used 150-190 g and >190-200 g female brooders. Therefore, the hatchery groups used larger female brooders (body weight) tend to have lower RUI values of labour and artemia cyst (Figure 8).
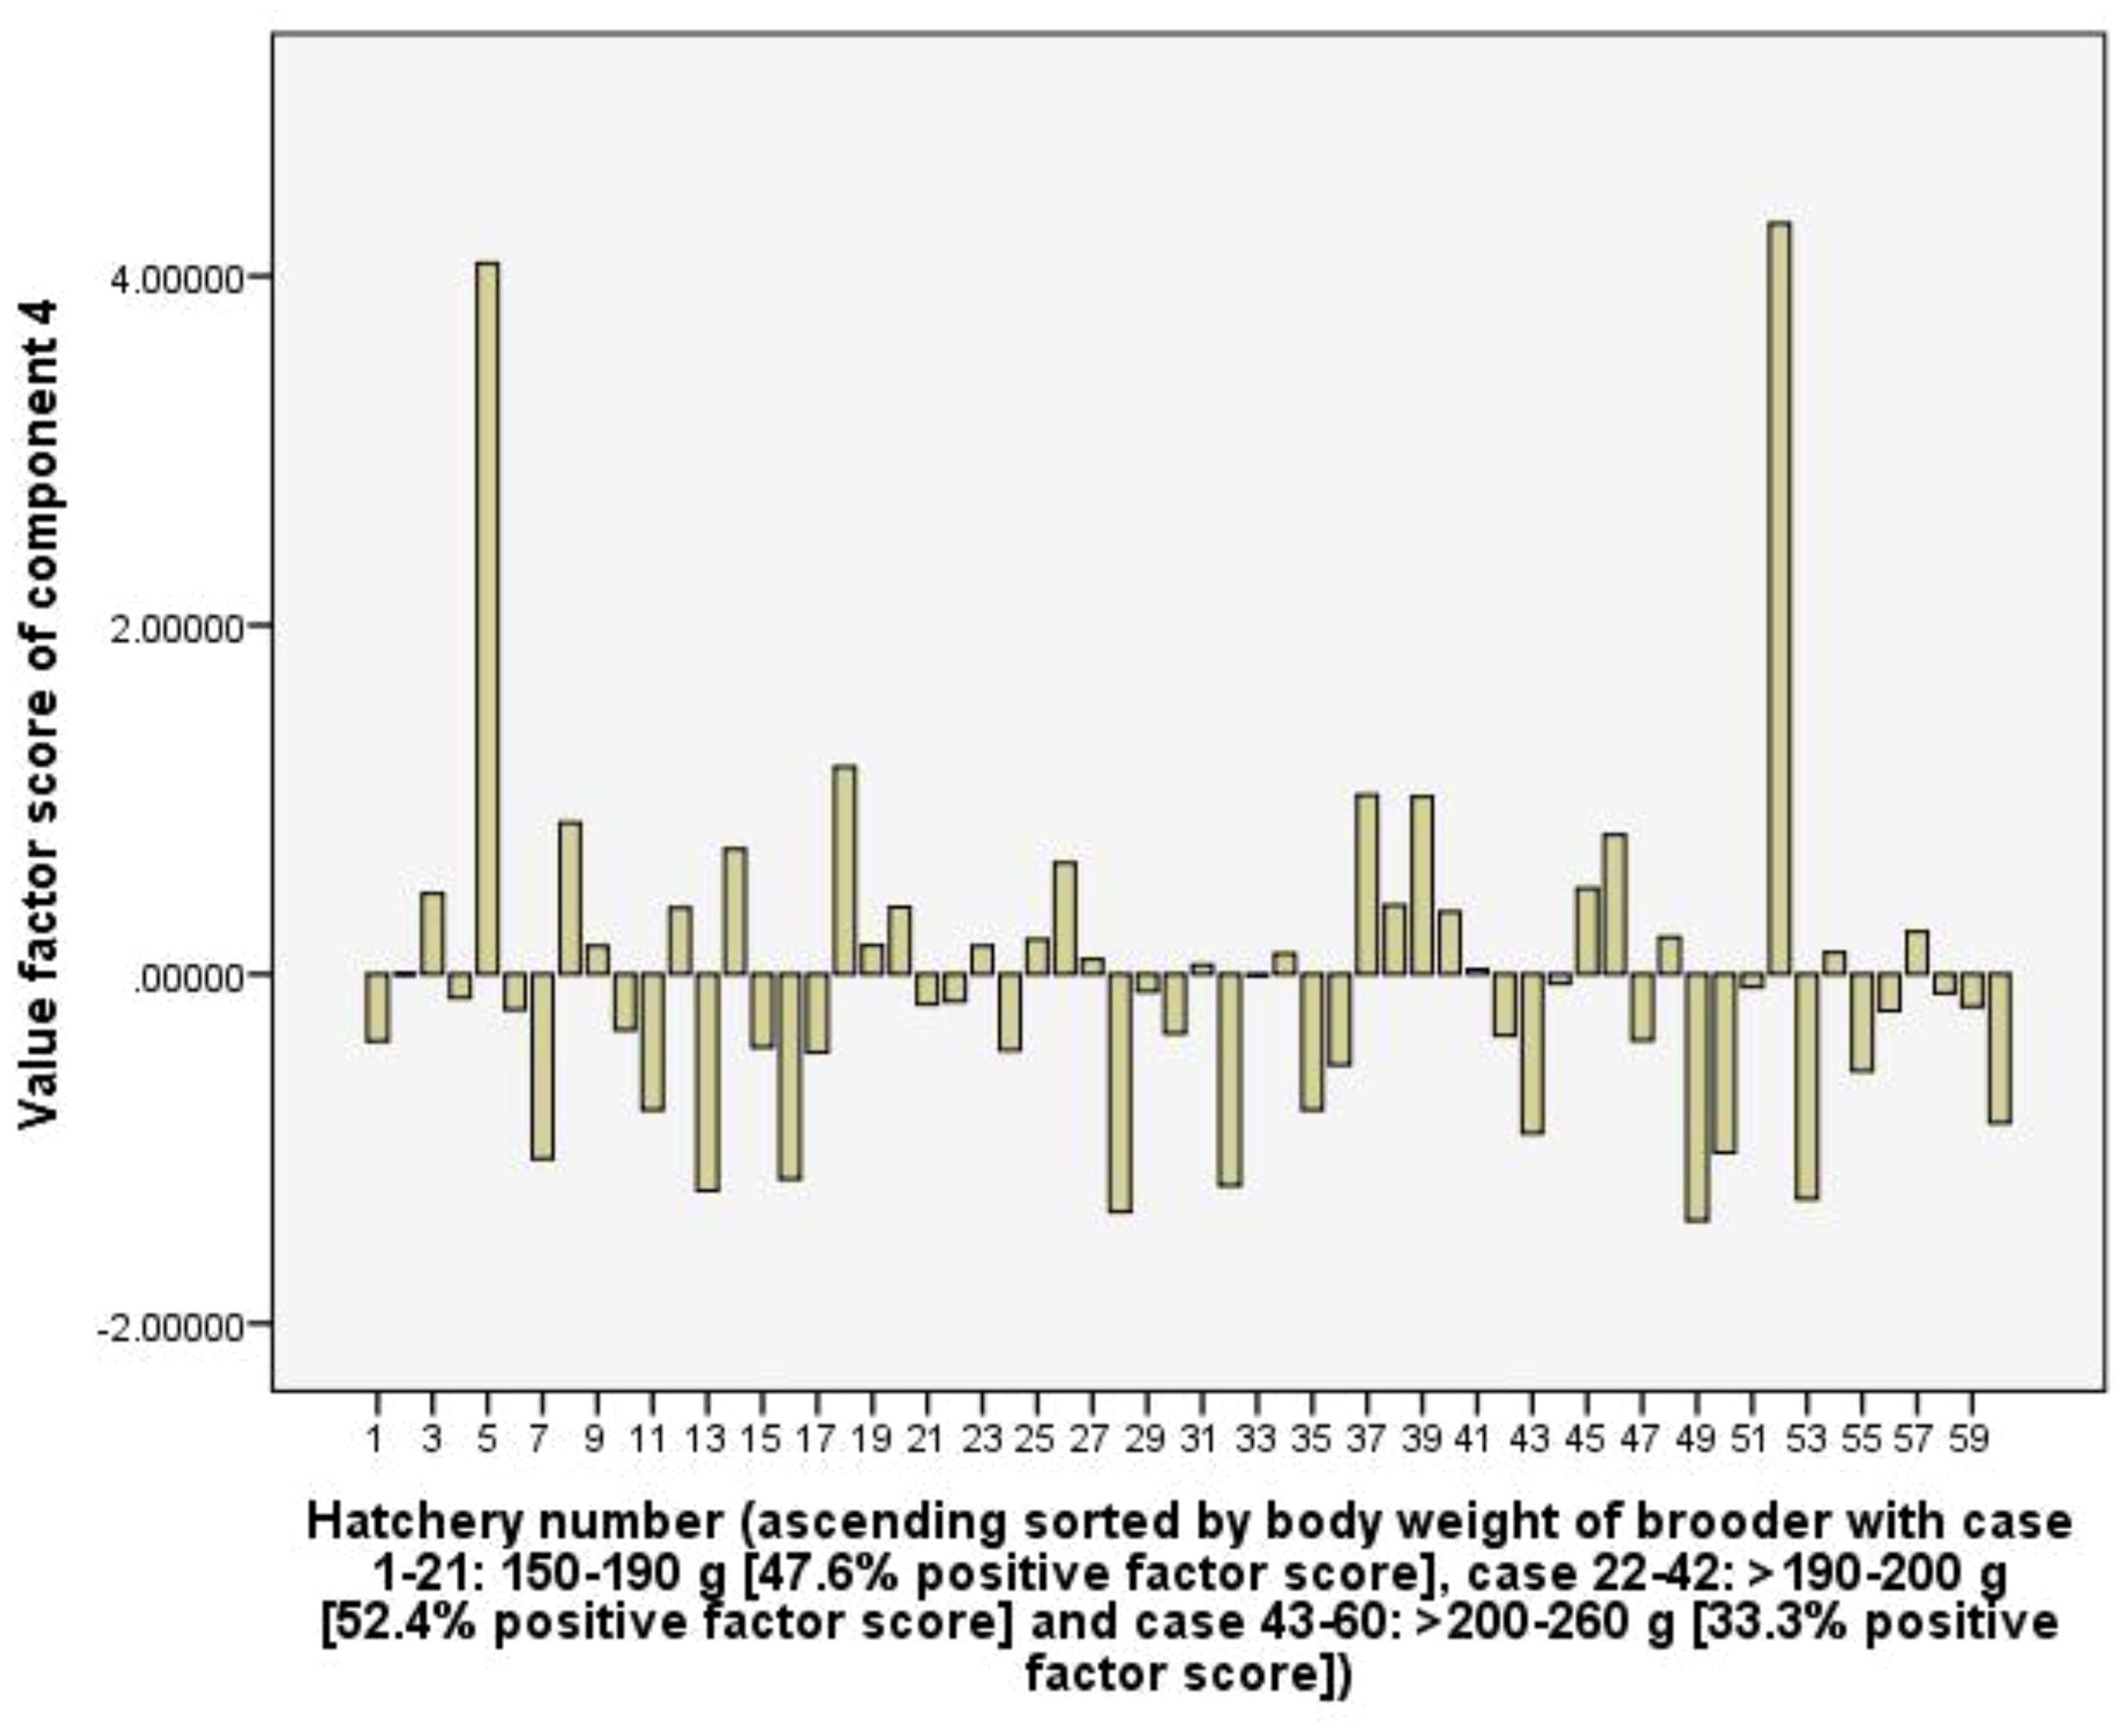
Figure 8. The value scores of efficiency of using labour and artemia cyst component from 60 capture-based hatcheries.
Component 5 (C5) explains 10.2% of the total variance and is positively related to the total tank volume of hatchery via 0.85 loading coefficient, RUIs of total tank volume (0.90), and electricity (0.74). The C5 implies the scale level of the hatchery (in total volume of all tanks in the hatchery), and with positive loading coefficients show that larger scale hatchery leads to larger values of RUIs of total tank volume and electricity. However, Figure 9 indicates that the frequency of positive value factor scores did not differ among three hatchery groups using different body weights of female brooders, indicating the use of female brooders with different body weights did not result in a difference in the RUIs of total tank volume and electricity.
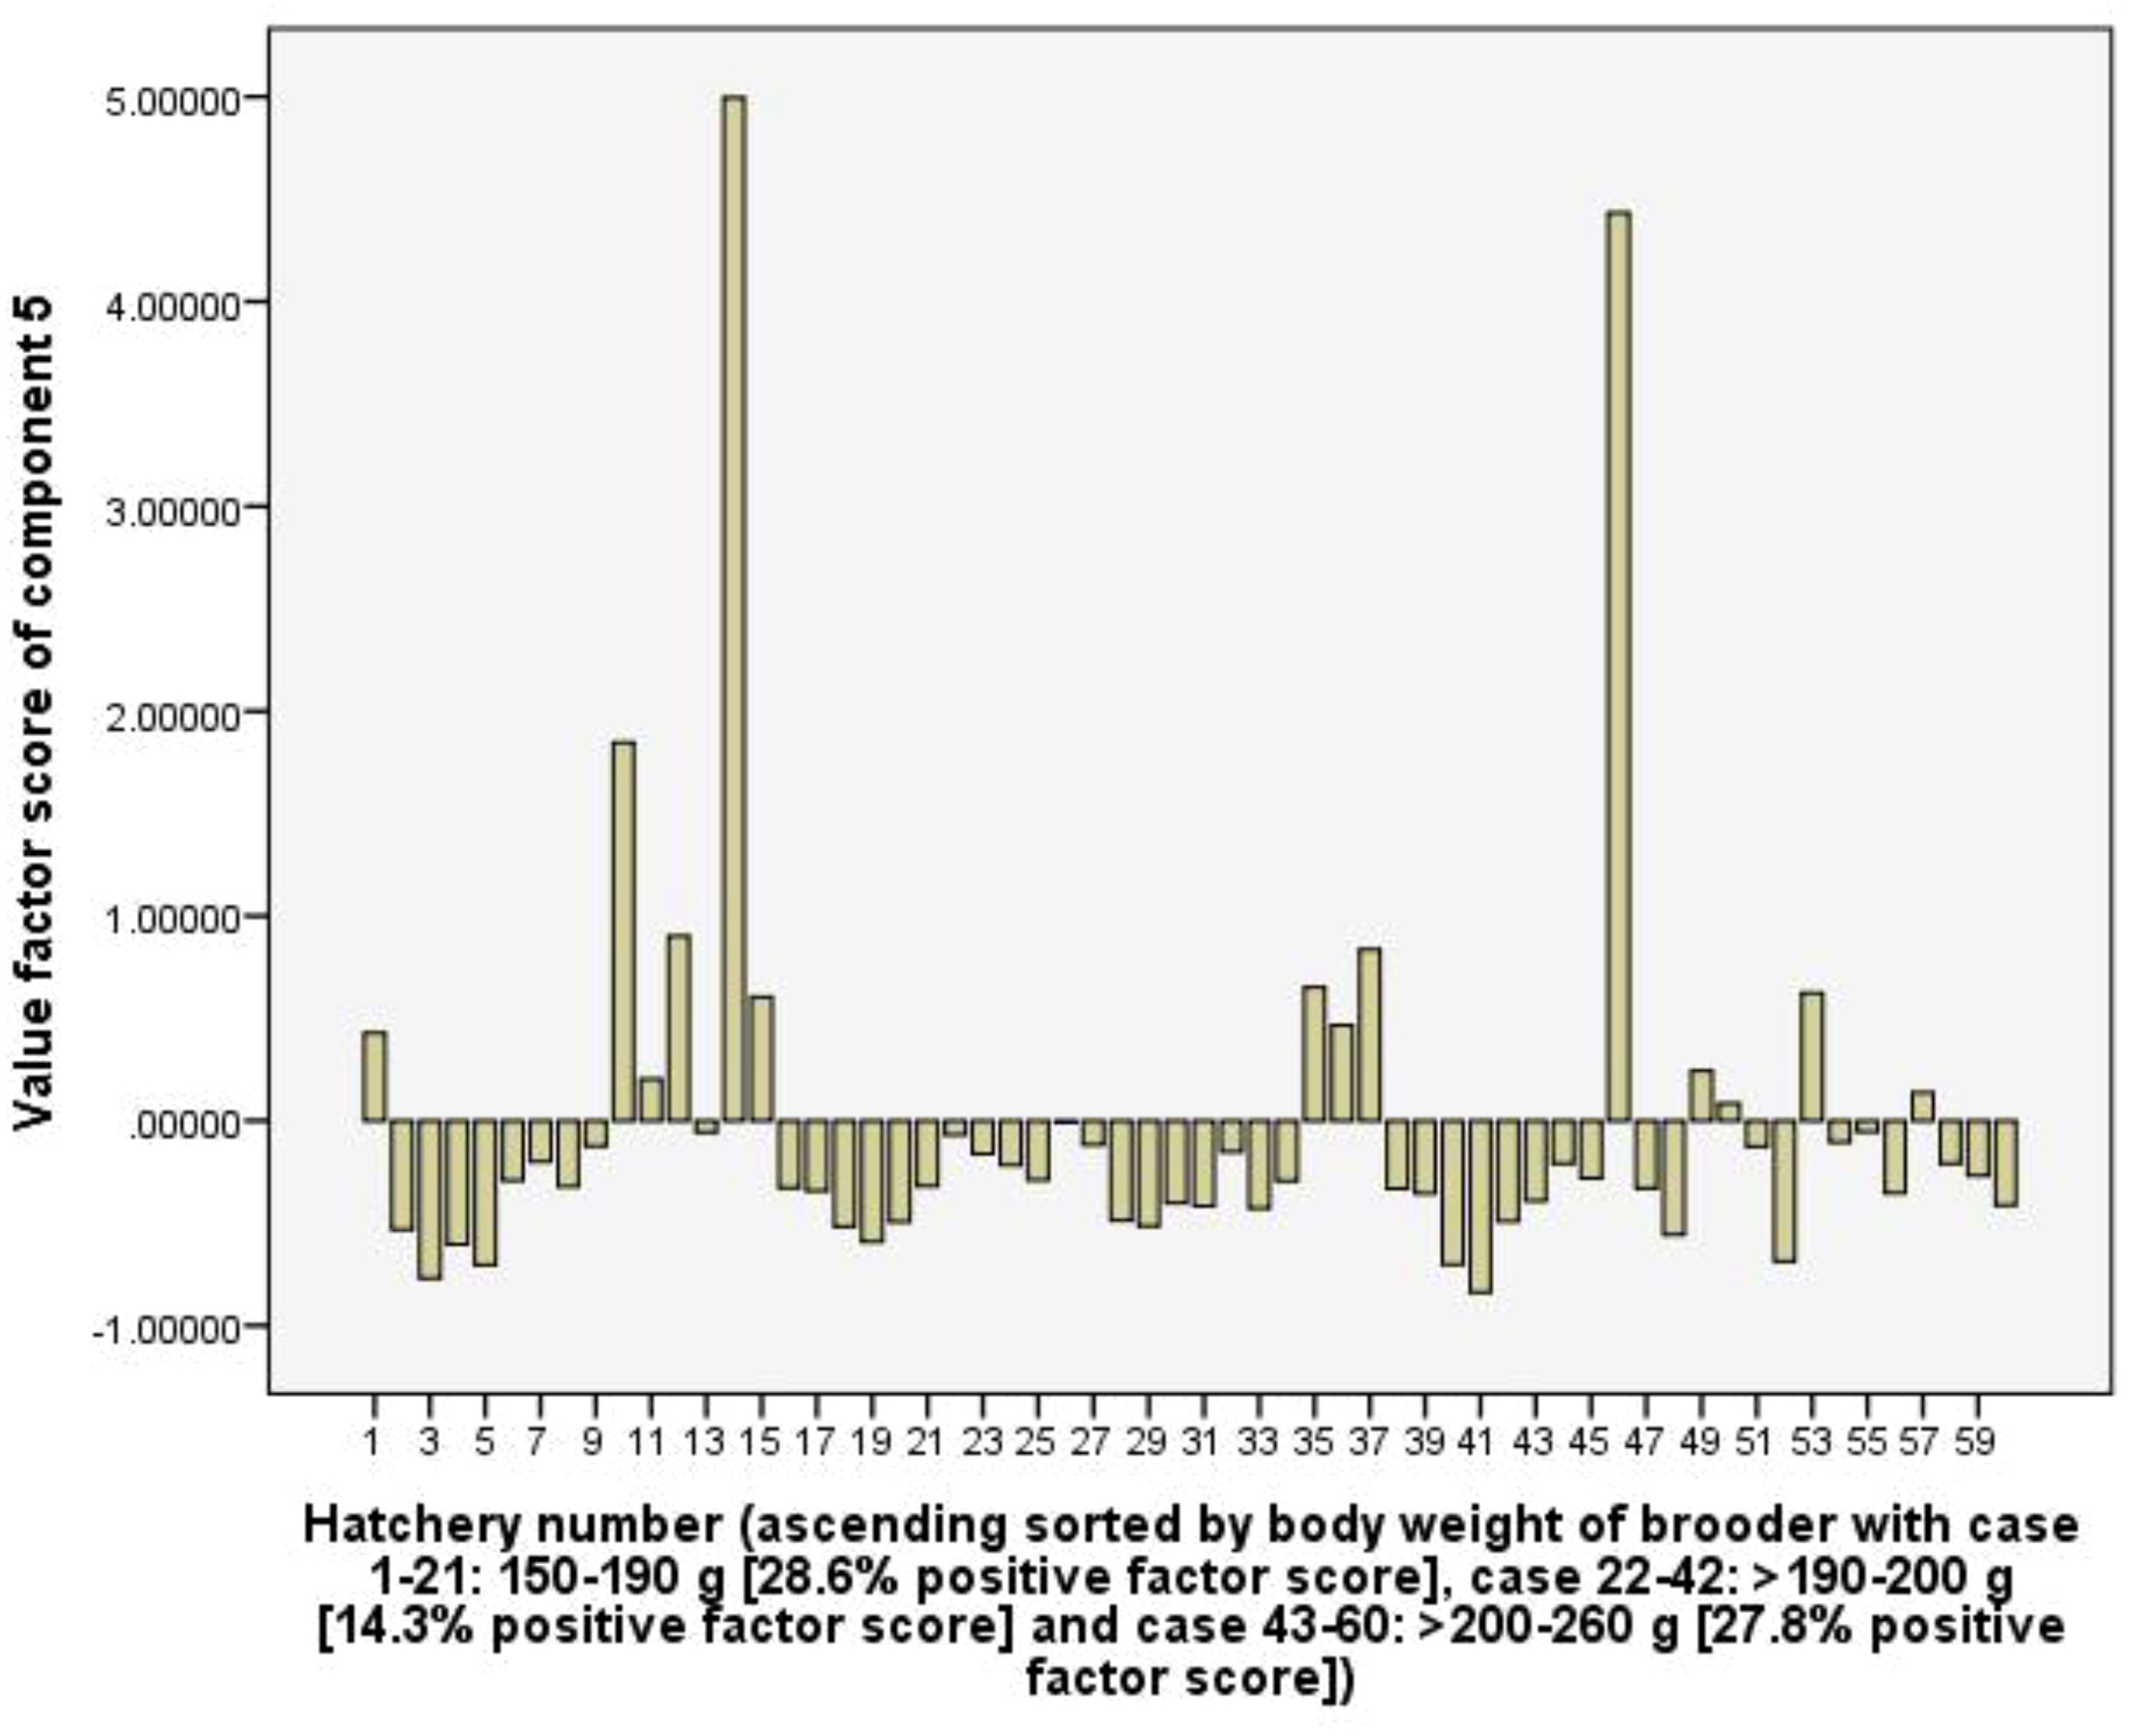
Figure 9. The value scores of scale level of hatchery component from 60 capture-based hatcheries.
Component 6 explains 9.7% of the total variance, is considered as consuming probiotics for larvae rearing activity. The C6 had high positive loading for RUIs of probiotics (0.87), total rearing tank (0.52), and total rearing tank volume of hatchery (0.54). the hatchery group using female brooders with the body weight of 150-190 g, the frequency of positive value factor scores of the C6 was 52.4%, higher than 33.3 and 38.9% of groups >190-200 g and >200-260 g, respectively (Figure 10). This suggests that hatcheries using female brooders with larger body weights had lower total rearing tank volume and spent fewer resources on probiotics than groups using female brooders with smaller body weights.
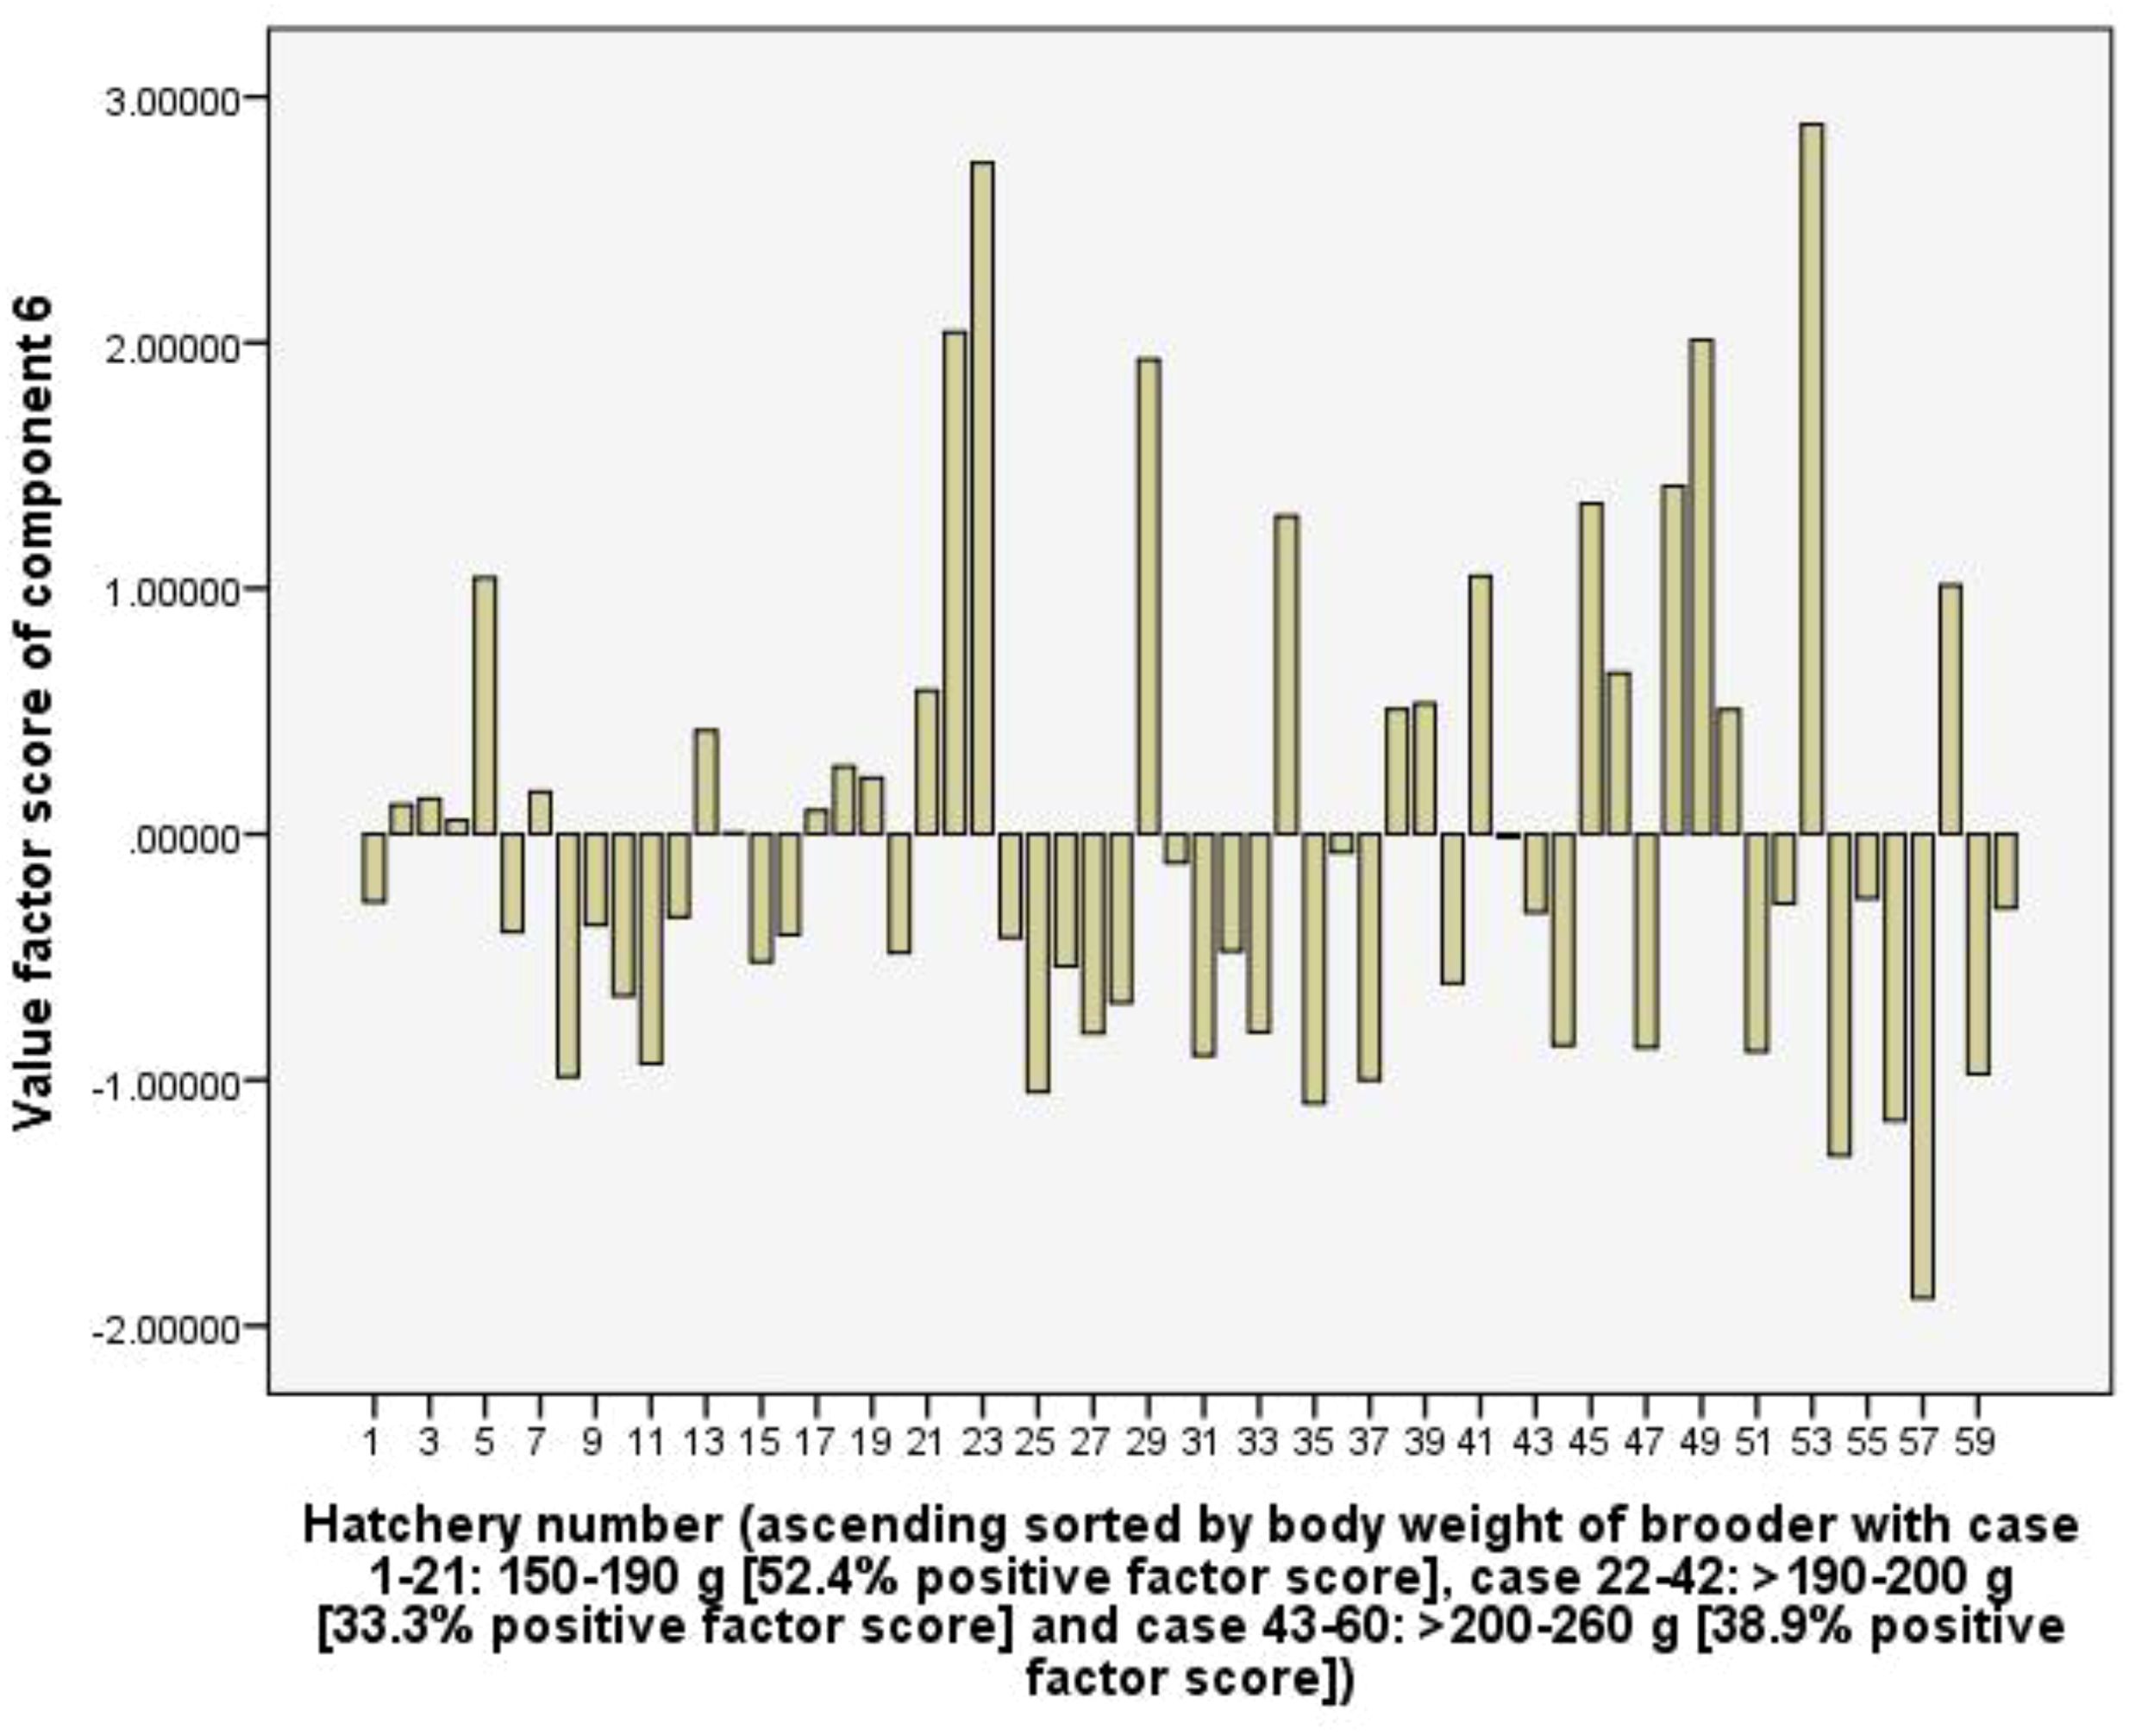
Figure 10. The value scores of consuming probiotics component from 60 capture-based hatcheries.
The results of the PCA analysis have shown that although the use of greater body weight female brooders resulted in higher RUI of chemicals, pellets, and total tank volume (i.e. poorer resource utilization efficiency), it helps improving the survival rate of the female brooders, lower consumption of labour, Artemia cysts and probiotics products to produce a certain amount of PL15. However, using female brooders with different body weights does not cause differences in PE-PL15 and net income of the hatcheries.
3.4 Impacts and challenges of capture-based hatchery
3.4.1 Positive impacts
Brooder fishing directly benefits fishermen and distributors by creating jobs, with an average income for the fishermen of US$ 5,052 per 1,000 wild-caught brooders, while distributors earned an average income of US$ 2,508 per 1,000 wild-caught brooders. In the hatchery stage, a small-scale hatchery used 1,000 female wild-caught brooders to produce an average of 937 million PL15 and earned US$ 304,826 net income. If considering the net incomes of fishermen and distributors, this figure is low, but the benefit of PL15 produced from wild-caught female brooders is very large due to supplying seeds for large areas of traditional shrimp farming models.
3.4.2 Negative impacts
In capture and distribution, the activities of brooder fishing had direct negative impacts on the marine environment. First, the fishing ground of brooders is an open-access area for all kinds of fishing gear. The frequency of net loss averaged 0.09% per boat per year, causing adverse impacts on the living aquatic species by ghost-net. Second, fishing boats were equipped with neither acoustic pingers to keep marine mammal species away from the net nor alarm devices, which may damage protected species. Third, because drift trammel nets have low selectivity, an average of 0.01% sea turtle by-catch per boat per year was reported. However, because the operating period of each fishing batch was 6.1 hours, most of the sea turtles remained alive until they could be released back into the sea.
Fourth and finally, the onboard survey result indicated that no species were recorded in the IUCN red list of threatened species. However, by-catch species were 39 species, 38 genera, and 32 families belonging to 14 orders: Perciformes (13 families and 17 species); Clupeiformes (three families, four species); Decapoda (three families, three species); Siluriformes (two families, four species); Pleuronectiformes (two families, two species); and Orectolobiformes, Myliobatiformes, Anguilliformes, Aulopiformes, Batrachoidiformes, Scorpaeniformes, Tetraodontiformes, Stomatopoda, Sepiida – each comprising one family with one species. Most of these species are bottom-middle (66.7%); surface-middle and surface-bottom species account for 15.4% apiece.
In hatchery production, the use of hermit crabs, polychaete worms, as well as surface and groundwater supplied by nature, may have negative impacts on resource exploitation; meanwhile, the chemicals may cause residues in water discharge.
3.4.3 Challenges
The capture of brooders faces internal challenges due to limited brooder resources as well as external competition from domesticated brooders. According to the surveyed fishermen, 69% of wild-caught BTS met the standard criteria for hatchery production, which has decreased compared to the previous period. The 31% of wild-caught BTS that did not meet standard criteria were sold as food, at lower prices compared to brooder.
In recent years, production costs in capturing and distributing brooders have increased due to the increase in DO cost. Switching to domesticated brooders of large-scale hatcheries also led to lower demand for wild-caught brooder. Therefore, the selling price of wild-caught brooders did not increase, causing 13% of fishing operators to suffer capital losses (US$ 114 to US$ 1,072 per year-1).
Competition from domesticated brooder: In recent years, hatcheries have used both wild-caught and domesticated brooder sources for PL15 production. The PL15 produced from wild-caught brooder (capture-based hatchery PL, CB-PL) and domesticated brooder (domesticated-based hatchery PL, DB-PL) have different advantages and disadvantages in grow-out farming. Potential biosecurity issues remain unknown for CB-PL, which are also impacted by low growth rate (pathogen infection causing high risk of diseases); meanwhile, DB-PL have been quarantined to achieve specific pathogen-free (SPF) status and high growth rate.
In the traditional farming models (extensive, improved extensive, rice-shrimp, and mangrove-shrimp, using hatchery PL, without feeding and chemical use), with large pond sizes and poor pond construction (e.g. erosion, leakage, overflow), farmers could not adequately prepare shrimp ponds to remove pathogens and unwanted animals (e.g. wild shrimp, crabs, snails, insects, fish, bacteria), which cause diseases and predation. Despite having a low growth rate, CB-PL can adapt to poor environmental conditions, leading to a higher survival rate than DB-PL.
In addition, because CB-PL is three to five times cheaper than DB-PL, shrimp farmers of traditional farming models preferred using CB-PL over DB-PL. However, price cuts to compete with BD-PL have caused the net income of CB hatcheries to decline; 11.7% have negative net income, indicating serious challenges.
4 Discussion
4.1 Management of wild brooder source
The survey results showed that the brooder fishing grounds were in the contiguous and high sea zones. These areas are open to other fishing vessels using different gear, including trawl nets and purse seine nets. BTS fishing boats generally operated in the contiguous and high sea zones according to the provisions of the Fisheries Law 2017, Decree 26/2019/ND-CP, and Decree 42/2019/ND-CP (for all kinds of fishing gear). There are no regulations for catch limit requirements or seasonal closures.
Due to the characteristics of the drift trammel net, capture production depends mainly on BTS resources as well as the characteristics of water current flows and seabeds. Thus, regulations on boat length are not effective in managing and protecting this resource; however, increasing the mesh size and reducing the area of the net panel should be considered. From 2009 to 2022, although the number of fishing boats decreased from 28 boats (2009) to 16 boats (2022), the production of wild-caught BTS brooders did not change, with an average of 151,500 ± 13,600 brooders. year-1. Those eligible to be selected as brooders for hatchery decreased from 91.1% (2009) to 83.3% (2022) due to the smaller size of brooders captured. The decrease of fishing boats, despite increasing catching efforts causes increase RUIs in brooder capture indicating that wild brooder source may pass the peak of optimal exploitation productivity. Furthermore, the results also showed that hatcheries used small-sized female brooders resulted in low survival rate of female brooders and consumed more labour, Artemia cysts, and probiotics. These mentioned issues imply that the sustainability in exploitation and use of wild brooders for capture-based hatchery is on the decline.
Due to brooders are captured at the middle and the net panel’s lower selvage, the upper selvage’s mesh size could be increased to reduce by-catch. The lack of protection equipment for endangered animals prevents the capture of brooder from abiding by good fishery practices. Therefore, it is necessary to modify fishing gear to mitigate negative impacts as well as promulgate specific sustainable fishery certification standards for brooder capture.
Because there is an open access area for several types of fishing gear, especially the presence of trawling net, for better brooder conservation, either stricter regulations and enforcement or improvement efforts are needed for habitat restoration (Burt and Bartholomew, 2019; Alghunaim et al., 2020; Erftemeijer et al., 2020). Besides, although it changes the natural seabed environment (Bartholomew et al., 2022), using artificial reefs should be considered as one potential measure to conserve wild BTS resources.
4.2 Role and trade-off of using wild brooder
At the early stage of hatchery employment, there were 3.3 million hatchery-reared BTS post-larvae produced using wild-caught brooders in 1983 (Hai et al., 2015). Currently, BTS farming’s dependence on wild-caught and domesticated brooder sources is changing because the use of PLs from these sources has different advantages and disadvantages (Communist Party of Vietnam, 2024).
First, with an average of 937 million PL15 produced from 1,000 wild-caught female brooders and 119,000 wild-caught female brooders captured in 2022, the production of 111.5 billion PL15 is estimated. The PLs were used for traditional farming models at low stocking density, such as the improved extensive model of 8–10 PL15 per year (Mai et al., 2016; Son et al., 2021), the rice-shrimp model of 5 PL15 per m2 (Mai et al., 2015; Son et al., 2018), the mangrove-shrimp model of 17–18 PL15 per m2 (Viet and Hai, 2016; Tin et al., 2022). In 2022, the demand for domesticated brooders has increased and was estimated about 60,000 animals to produce 30–40 billion PL15 (Vietnam Fisheries Magazine, 2023) used for intensive culture at a higher stocking density of 20 PL15 per m2 (Son et al., 2019).
Second, the productivity of domesticated brooders was from 598,555 - 689,666 egg.brooder-1 and 423,000 - 470,000 nauplius.brooder-1. This brooder source can completely replace wild collected brooders (Huong et al., 2020). Also, Huong et al. (2022) reported intensive shrimp culture in earthen ponds, the ponds using DB-PL had an average body weight and length of 26.1 g and 15.7 cm, respectively, which were greater than that of ponds using CB-PL (15.6 g and 13.2 cm). This study showed the use of DB-PL brings superior efficiency in terms of survival rate and feed conversion ratio (FCR) if compared to those of CB-PL.
Third, the demand for domesticated brooders is predicted to reach 150,000–200,000 individuals in 2030 (Vietnam Fisheries Magazine, 2023), indicating that the use of domesticated brooder will be more popular and will replace a part of wild-caught brooder. Indeed, the area under traditional farming models constituted 97% of the total 629,000 ha under BTS culture; the remaining 3% was used for intensive culture (Compiled from the Annual Reports of the Vietnam Department of Fisheries, 2020–2021). However, according to MARD (2018), the BTS farming areas will be reduced and stabilised to 600,000 ha, with productivity projected to jump up to 400,000 tons in 2025 and 550,000 tons in 2030. This indicates that the level of intensive BTS farming will increase, leading to greater demand for domesticated brooders to produce high-quality PLs for intensive farm production. This situation suggests that demand for wild-caught brooders may decrease in the coming years because of domesticated brooder and the reduction of pressure on wild-caught BTS sources. From another perspective, because these shrimp farming systems have poor captivity conditions, control of escaped animals is ineffective (Dempster et al., 2018); therefore, using CB-PL may eliminate the gene risk for the wild population compared to using DB-PLs.
Fourth, the study on pathogen infection in wild-caught brooders on the same fishing ground (Ca Mau province) (Dung, 2017) showed that the proportion of brooder samples showing positive signs of infection with Monodon baculovirus (MBV), white spot syndrome virus (WSSV) and yellow head virus (YHV) were 100, 41.7, 3.2%, respectively. The high rate of pathogen-infected brooder samples may be caused by pathogens from nature, and poor biosafety conditions during exploitation and transportation. This leads to the use of wild-caught brooders for PL production having a higher risk of disease than domesticated brooders.
Finally, although domestication has many benefits, such as improving productivity and controlling diseases in aquaculture (Ikhwanuddin and Abol-Munafi, 2016), even for species that have reached level-5 domestication, a significant portion of global production is based on wild individuals (Fabrice, 2018). For instance, some cases of farmed Nile tilapia and Indian carp have shown negative effects of domestication, namely reduced performance compared to wild-caught fish. In such cases, the suggestion is to return to wild colonies for future colony growth (Mair, 2002). In the long term, capture-based aquaculture may be limited by regulations (Ottolenghi et al., 2004), but the cultivation of many aquatic species still depends on natural populations.
Based on the concerns identified in this study, the application of good practices in fisheries and aquaculture must be considered (FAO, 2011). Therefore, wild brooders must be considered in managing and exploiting this resource to ensure the diversity of brooder sources in PL production for different shrimp farming models and to achieve the goal of sustainable development of shrimp farming in Vietnam.
5 Conclusion
In the fishing ground of 15,000 km2, there are 16 fishing boats with an average of 5,900 brooder captured.boat-1.year-1. In the captured hatchery, a brooder of 1,000 wild-caught females produces an average of 937 million PL15; the resources used thereafter include labour, DO, electricity, surface and groundwater, hermit crab, polychaete worm, Artemia cyst, benefit bacteria compound, feed, iodine, chlorine, potassium permanganate, formol, and copper sulphate. In the capture stage, an increase in engine power of 10 CV will add more 4.90 CV, 0.30 tons, 665.10 m2, 0.10 person and 105.90 L to RUI of engine power, DWT, the area of the net panel, labour and DO, respectively; and an increase 10 tons in DWT of fishing boat, the RUI of DWT will increase by 2.00 tons. In the hatchery stage, the use of greater body weight female brooders improves its survival rate, reduces RUIs of labour, artemia cysts, probiotics products, but leads to increased RUIs of chemicals, pellets and total tank volume.
The role of wild-caught brooder is decreasing because of competition from domesticated brooder. However, wild-caught brooders still contribute a large output of CB-PLs at low prices for traditional shrimp farming models, contributing to the majority production of farmed BTS. Therefore, the responsible exploitation of wild brooders should be considered in good fishing practices to preserve this resource for producing different types of PLs to suit different shrimp farming modes.
Data availability statement
The datasets presented in this article are not readily available because the data set is restricted to use in this article only. Requests to access the datasets should be directed to NP ntphuong@ctu.edu.vn.
Ethics statement
Ethical approval was not required for the studies involving humans in accordance with the local legislation and institutional requirements. The participants provided their written informed consent to participate in this study.
Author contributions
SV: Data curation, Investigation, Methodology, Project administration, Software, Visualization, Writing – original draft, Writing – review & editing. TCu: Methodology, Software, Visualization, Writing – original draft. TCh: Data curation, Formal analysis, Investigation, Methodology, Writing – original draft. LN: Data curation, Formal analysis, Investigation, Methodology, Writing – original draft. TT: Methodology, Software, Visualization, Writing – original draft. HA: Data curation, Formal analysis, Investigation, Methodology, Writing – original draft. KT: Data curation, Formal analysis, Investigation, Methodology, Writing – original draft. QN: Data curation, Formal analysis, Investigation, Methodology, Writing – original draft. VH: Investigation, Methodology, Writing – original draft. TQT: Formal analysis, Writing – original draft. TP: Writing – original draft, Investigation. WN: Writing – original draft, Methodology, Visualization. PN: Software, Writing – original draft, Writing – review & editing.
Funding
The author(s) declare financial support was received for the research, authorship, and/or publication of this article. This study was co-funded by Monterey Bay Aquarium (California, USA) and Can Tho University 530 (Vietnam).
Conflict of interest
The authors declare that the research was conducted in the absence of any commercial or financial relationships that could be construed as a potential conflict of interest.
Publisher’s note
All claims expressed in this article are solely those of the authors and do not necessarily represent those of their affiliated organizations, or those of the publisher, the editors and the reviewers. Any product that may be evaluated in this article, or claim that may be made by its manufacturer, is not guaranteed or endorsed by the publisher.
References
Alghunaim A., Yamamoto T., Madhusoodhanan R., Polikarpov I., Chen W., Al-Said T., et al. (2020). We are evaluating the potential area and environmental key factors for Sargassum bed restoration in highly turbid waters of the northwestern Arabian Gulf. Mar. pollut. Bull. 153, 110949. doi: 10.1016/j.marpolbul.2020.110949
Bartholomew A., Burt J. A., Firth L. B. (2022). Artificial reefs in the Arabian Gulf: Benefits, challenges and recommendations for policy makers. Regional Stud. Mar. Sci. 56, 102723. doi: 10.1016/j.rsma.2022.102723
Burt J., Bartholomew A. (2019). Towards more sustainable coastal development in the Arabian gulf: Opportunities for ecological engineering in an urbanized seascape. Mar. pollut. Bull. 142, 93–102. doi: 10.1016/j.marpolbul.2019.03.024
Carpenter K. E., Niem V. H. (1998). FAO species identification guide for fishery purposes. The living marine resources of the Western Central Pacific. Volume 2, Cephalopods, crustaceans, holothurians, and sharks (Rome: FAO), 687–1396.
Carpenter K. E., Niem V. H. (1999a). FAO species identification guide for fishery purposes. The living marine resources of the Western Central Pacific. Volume 3, Batoid fishes, chimaeras and bony fishes. Part 1 (Elopidae to Linophrynidae) (Rome: FAO), 1397–2068.
Carpenter K. E., Niem V. H. (1999b). FAO species identification guide for fishery purposes. The living marine resources of the Western Central Pacific. Volume 4, Bony fishes part 2 (Mugilidae to Carangidae) (Rome: FAO), 2069–2790.
Carpenter K. E., Niem V. H. (2001a). FAO species identification guide for fishery purposes. The living marine resources of the Western Central Pacific. Volume 5, Bony fishes part 3 (Menidae to Pomacentridae) (Rome: FAO), 2791–3380.
Carpenter K. E., Niem V. H. (2001b). FAO species identification guide for fishery purposes. The living marine resources of the Western Central Pacific. Volume 6, Bony fishes part 4 (Labridae to Latimeriidae), estuarine crocodiles, sea turtles, sea snakes, and marine mammals (Rome: FAO), 3381–4218.
Communist party of Vietnam. (2024). To improve the quality of shrimp seeds for domestic farming. Available online at: https://dangcongsan.vn/kinh-te-va-hoi-nhap/nang-cao-chat-luong-tom-giong-phuc-vu-cho-viec-tha-nuoi-trong-nuoc-637527.html (Accessed 3 May 2024).
Dempster T., Arechavala-Lopez P., Barrett L. K., Fleming I. A., Sanchez-Jerez P., Uglem I. (2018). Recapturing escaped fish from marine aquaculture is largely unsuccessful: alternatives to reduce the number of escapees in the wild. Rev. Aquacult. 10, 153–167.
Dixon T. J., Coman G. J., Arnold S. J., Sellars M. J., Lyons R. E., Dierens L. E., et al. (2008). Shifts in genetic diversity during domestication of Black Tiger shrimp, Penaeus monodon, monitored using two multiplexed microsatellite systems. Aquaculture 283, 1–6.
Dung T. T. (2017). Data from: Investigation and assessment of quality and quantity of tiger shrimp (Penaeus monodon) broodstock captured from Ca Mau area, proposed a proper capture, use and management. Project report (Ca Mau People's Committee, Vietnam: Department of Science and Technology of Ca Mau).
Erftemeijer P., Agastian T., Yamamoto H., Cambridge M., Hoekstra R., Toms G., et al. (2020). Mangrove planting on dredged material: three decades of nature-based coastal defence along a causeway in the Arabian Gulf. Mar. Freshw. Res. 71, 1062–1072. doi: 10.1071/MF19289
Fabrice T. (2018). Fish domestication: A review, in Animal domestication. Ed. Fabrice T. (London, UK: InTechOpen). doi: 10.5772/intechopen.79628
FAO. (2011). Aquaculture development. 6. Use of wild fishery resources for capture-based aquaculture. FAO Technical Guidelines for Responsible Fisheries. No. 5, Suppl. 6 Vol. 2011 (Rome: FAO), 81.
Hai T. N., Preston N., Brennan D. (2003). Shrimp hatchery production in two coastal provinces of the Mekong Delta. Rice Shrimp Farming Mekong Delta: Biophys. Socioeconomic Issues. ACIAR Tech. Rep. No. 52e (Canberra, Australia: Australian Centre for International Agricultural Research), 44–52. https://www.aciar.gov.au/sites/default/files/legacy/node/467/tr52e.pdf.
Hai T. N., Duc P. M., Son V. N., Minh T. H., Phuong N. T. (2015). Innovation in seed production and farming of marine shrimp in Vietnam. World Aquaculture 46, 32–37. Available at: www.was.org.
Holthuis L. B. (1980). “FAO species catalogue. Vol. 1. Shrimps and prawns of the world. An annotated catalogue of species of interest to fisheries,” in FAO Fishery Symposium. (Rome: FAO), 125–261.
Huong H. K., Truc P. T. T., Nhi N. T. H., Toan D. T., Van Truong D., Van Hoang M., et al. (2020). Evaluation of the reproductive ability of domesticated female black tiger shrimp. J. Vietnam Agric. Sci. Technol. 10, 119–126.
Huong H. K., Truc P. T. T., Nhi N. T. H., Toan D. T., Van Truong D., Van Hoang M., et al. (2022). Growth and survival rates of domesticated and non-domesticated breeding stocks of Penaeus monodon Fabricius 1798 cultured in ponds and tanks. Israeli J. Aquaculture - Bamidgeh 74, 1–12. doi: 10.46989/001c.35587doi.org
Ikhwanuddin M., Abol-Munafi A. B. (2016). Fish and shellfish domestication and stock enhancement: current status and future directions. Asian J. Sci. Res. 9, 167–170. doi: 10.3923/ajsr.2016.167.170
Johnson R. A., Wichern D. W. (1992). Applied multivariate statistical analysis, 3rd ed (USA: Prentice-Hall International Editions).
Khedkar G. D., Reddy A. C., Ron T. B., Haymer D. (2013). High levels of genetic diversity in Penaeus monodon populations from the east coast of India Vol. 2013 (SpringerPlus J) 2, 671. Available at: http://www.springerplus.com/content/2/1/671.
Klinbunga S., Siludjai D., Wuthijinda W., Tassanakajon A., Jarayabhand P., Menasveta P. (2001). Genetic heterogeneity of the giant tiger shrimp (Penaeus monodon) in Thailand revealed by RAPD and mtDNA-RFLP analyses. Mar. Biotechnol. 3, 428–438.
Kumar N., Lakra W. S., Majumdar K. C., Goswami M., Ravinder K. (2007). Genetic diversity in the Indian population of Penaeus monodon (Fabricius 1798) as revealed by mtDNA sequence analysis. Aquac. Res. 38, 862–869.
Liu G., Zhou L., Li X., Lu D. (2013). Population genetic structure of the invasive red swamp crayfish in China revealed by ITS1 variation. Biochem. Genet. 51, 841–852.
Mai L. T. P., Ni D. V., Hai T. N., Son V. N. (2016). Evaluation of impacts and solutions to deal with climate change in the improved extensive culture system in the Mekong Delta. Can. Tho Univ. J. Sci. 4, 28–39. doi: 10.22144/ctu.jvn.2016.079
Mai L. T. P., Ni D. V., Hai T. N., Son V. N. (2015). Evaluation of impacts and solutions to deal with climate change in the rice-shrimp system in the Mekong Delta. Can. Tho Univ. J. Sci. 41, 121–133. Available at: https://ctujsvn.ctu.edu.vn/index.php/ctujsvn/article/view/2197.
Mair G. C. (2002). Domestication and broodstock management (New Hampshire, Portsmouth, USA: Global seafood alliance). Available at: https://www.globalseafood.org/advocate/domestication-and-broodstock-management/.
Mohamed K. H. (1970). Synopsis of the biological data on the jumbo tiger prawn Penaeus monodon Fabricius. 1798. FAO Fisheries Report (Rome: FAO), Vol. 57. 1251–1266.
Ottolenghi F., Silvestri C., Giordano P., Lovatelli A., New M. B. (2004). Capture-based aquaculture. The fattening of eels, groupers, tunas, and yellowtails (Rome: FAO), 308.
Phuong N. T., Chau H. H., Tao C. T. (2006). The status of shrimp (Penaeus monodon) seed production in Ca Mau province and Can Tho city. Sci. J. Can. Tho Univ. 2, 178–186.
Rezaee S., Farahmand H., Nematollahi M. A. (2015). Genetic diversity status of Pacific white shrimp (Litopenaeus vannamei) using SSR markers in Iran. Aquac. Int. 247, 159–167.
Shrimp Farmer Magazine. (2023). Area and output of brackish water shrimps in 2022. Available online at: https://nguoinuoitom.vn/dien-tich-va-san-luong-tom-nuoc-lo-nam-2022/#:~:text=Theo%20B%E1%BB%99%20N%C3%B4ng%20nghi%E1%BB%87p%20v%C3%A0,c%C3%A0ng%20xanh%20v%C3%A0%20t%C3%B4m%20kh%C3%A1c (Accessed 3 May 2024).
Son V. N., Hai D. M., Dien N. T., Thuy V. V., Lap D. X., Quynh N. D., et al. (2019). Production and electricity consuming efficiencies of the intensive, improved extensive of farming systems of black tiger (Penaeus monodon) and white-leg (Litopenaeus vannamei) shrimp in the Mekong delta. Can. Tho Univ. J. Sci. 55, 69–79. doi: 10.22144/ctu.jvn.2019.024
Son V. N., Hai D. M., Quynh N. D., Nghia L. V., Truc. P. T., Anh N. Q., et al. (2021). Climate change-related risk adaptation in striped catfish, tilapia and shrimp farming systems in the Mekong Delta, Vietnam. Can. Tho Univ. J. Innovation Sustain. Dev. 13, 24–38. doi: 10.22144/ctu.jen.2021.004
Son V. N., Nhan B. V., Khanh L. V., Hai T. N., Phuong N. T. (2018). Evaluation of technical and financial efficiency of tiger shrimp culture in improved extensive and shrimp-rice systems in Thoi Binh district - Ca Mau province. Can. Tho Univ. J. Sci. 54, 164–176. doi: 10.22144/ctu.jvn.2018.053
Tao C. T., Suy H. V., Phuong N. T. (2008). Existing situation of exploitation and use of tiger shrimp (Penaeus monodon) broodstock in Ca Mau province. Sci. J. Can. Tho Univ. 2, 188–197.
Tin N. H., Du P. A., Thinh H. C., Duyen C. M., Long H. V., My N. V. (2022). Financial efficiency and stability of shrimp-mangrove forest model in the Mekong Delta. Can. Tho. Univ. J. Sci., 58, 248–259. doi: 10.22144/ctu.jvn.2022.054
Viet L. Q., Hai T. N. (2016). Technical aspects and cost benefits of the model mangroves - shrimp in Nam Can district, Ca Mau province. Vietnam J. Mar. Sci. Technol. 16, 99-105. doi: 10.15625/1859-3097/16/1/6247
Vietnam Fisheries Magazine. (2023). Year 2023, Vietnam needs about 260,000-270,000 shrimp broodstock. Available online at: https://thuysanVietnam.com.vn/nam-2023-viet-nam-can-khoang-260-000-270-000-con-tom-bo-me/. (Accessed September 28, 2023).
Vietnam Ministry of Agriculture and Rural Development (MARD). (2018). Decision No. 3475/QD-BNN-TCTS (Hanoi, August 30, 2018) approving the master project to develop brackish water shrimp industry in Vietnam in 2030 (Hanoi, Vietnam).
Wong L. L., Chun L. C., Deris Z. M., Zainudin A. A., Ikhwanuddin M., Iehata S., et al. (2021). Genetic diversity and population structure of wild and domesticated black tiger shrimp (Penaeus monodon) broodstocks in the Indo-Pacific regions using consolidated mtDNA and microsatellite markers. Gene Rep. 23, 101047. Available at: www.elsevier.com/locate/genrep.
Keywords: black tiger shrimp, wild-caught broodstock, capture-based hatchery, resources use index, challenge
Citation: Vo SN, Cu TTL, Chau TT, Nguyen LT, Tang TT, Au HV, Tran KND, Nguyen QD, Ho VV, Trinh TQ, Phan TB, Norden W and Nguyen PT (2024) Capture-based hatchery of black tiger shrimp (Penaeus monodon) in Vietnam: an analysis of resource utilisation and challenges. Front. Mar. Sci. 11:1434255. doi: 10.3389/fmars.2024.1434255
Received: 17 May 2024; Accepted: 29 July 2024;
Published: 03 September 2024.
Edited by:
Mhd Ikhwanuddin, University of Malaysia Terengganu, MalaysiaReviewed by:
Dharmendra Kumar Meena, Central Inland Fisheries Research Institute (ICAR), IndiaAparna Chaudhari, Central Institute of Fisheries Education (ICAR), India
Copyright © 2024 Vo, Cu, Chau, Nguyen, Tang, Au, Tran, Nguyen, Ho, Trinh, Phan, Norden and Nguyen. This is an open-access article distributed under the terms of the Creative Commons Attribution License (CC BY). The use, distribution or reproduction in other forums is permitted, provided the original author(s) and the copyright owner(s) are credited and that the original publication in this journal is cited, in accordance with accepted academic practice. No use, distribution or reproduction is permitted which does not comply with these terms.
*Correspondence: Phuong Thanh Nguyen, ntphuong@ctu.edu.vn