 Hongyuan Shi1,2,3
 Pengcheng Ma1
 Jiwei Sun1Shengnian Zhao1Ruiqian Ma1Longsheng Li4Chao Zhan1,2Hui Liang1*
- 1School of Hydraulic and Civil Engineering, Ludong University of China, Yantai, China
- 2Institute of Coastal Research, Ludong University of China, Yantai, China
- 3Yantai Kekan Marine Technology Co., Ltd, Yantai, China
- 4Yantai Marine Environment Monitoring and Forecast Center, Yantai City Marine Fisheries Bureau, Yantai, China
Cold waves, as a common natural disaster, have a significant impact on economic development and living environment in coastal areas, especially in estuary regions. This paper utilizes the Delft3D software based on a rectangular grid, driven by the eight major tidal harmonic constituents of M2, S2, N2, K2, K1, O1, P1, and Q1, to construct a hydrodynamics and sediment numerical model. The study focuses on the morphodynamic changes in the Yellow River Delta (YRD) during a severe cold wave and strong wind event. By simulating the intense cold wave from November 28 to 30, 2022, the effects on the sedimentation in the YRD were analyzed. Results show that the cold wave process increases the water levels in the nearshore areas, with a general rise of more than 0.2 m in the YRD waters, particularly severe at the old Yellow River (YR) estuary and the northwest part of Laizhou Bay, reaching 0.25-0.35 m. This increase leads to intensified erosion and sedimentation in different areas near the YR estuary, especially near the old YR estuary and in the northwest part of Laizhou Bay. After a cold wave process, the erosion and sedimentation increase significantly by 0.05-0.1m. Furthermore, by comparing the flow speed differences and tidal-induced Eulerian residual currents with and without cold waves, it was found that around the YRD, from the current river estuary to the old YR estuary, the maximum flow speed increased by more than 0.35 m/s during the cold wave, and the maximum Eulerian residual currents also increased by 0.13 m/s. The direction of the residual currents changed from northwest-southeast to south-north, further confirming the significant impact of cold waves on the morphodynamic evolution of the YRD. This study provides new perspectives and methods for understanding and predicting morphodynamic changes in estuarine regions during cold waves, which is significant for disaster prevention, mitigation, and management of estuarine areas.
1 Introduction
The delta regions rank among the most densely populated areas globally, playing an important role in society and ecology due to their advantageous geographical locations (Kuenzer and Renaud, 2012; Nienhuis et al., 2020; Fu et al., 2021). Hopley and Jones (2022) studied the Macquarie River Bay Delta, located at the entrance of Lake Illawarra in the Shoalhaven River Estuary, identifying it as a prograding bay-head delta. Their findings provide a crucial reference for understanding its geological evolution and impacts. Similarly, Ve et al. (2021) conducted research on the Red River Delta in northern Vietnam, analyzing river water and sediment flow data from 1960 to 2010. Their study tracked human disturbances to the sediment transport process, revealing an increasing impact of human activities on the sediment dispersion system of the Red River Delta. This research offers vital insights into the multi-decadal sediment dispersion in delta regions. The Yellow River Delta (YRD), as the entry of China’s “Mother River” into the sea, has always attracted global attention from scholars due to its significant social and ecological value. The estuary area, a focal point of river-sea interactions, serves both as a confluence for terrestrial rivers and as an origin for marine processes. The hydrodynamics and sediment transport of the area are directly influenced by river inflows and oceanic dynamics. The input of water and sediment from head waters is the primary driver of morphodynamic changes in the estuary, and these changes in turn impact the hydrodynamics and sediment dynamics at the estuary (Chen and Chen, 2002). The Yellow River (YR) is famously known for carrying more sediment than water, transporting a significant amount of silt from the Loess Plateau upstream into the semi-enclosed Bohai Sea every year. High concentrations of suspended sediment in the coastal areas near the estuary lead to sediment deposition, which drives the geomorphological evolution of the Yellow River’s estuary (Ji et al., 2022; Wang et al., 2024).
Typhoons and hurricanes frequently occur in the summer and autumn, lasting for short durations. On a seasonal scale, they synchronize with riverine sediment transport and vegetation growth. In contrast, a cold wave refers to a significant cooling process caused by the large-scale southward invasion of strong cold air masses from high latitudes (Li et al., 2021a; Van Oldenborgh et al., 2019). Cold waves predominantly occur in winter and spring, often accompanied by strong winds, rain, and snow (Ding, 1990; Marengo et al., 1997), and can last for several days. Their impact on the marine dynamic environment and coastal evolution processes differs from that of typhoons in terms of patterns and mechanisms. Additionally, because cold waves primarily affect high-latitude regions, areas like the Red River Delta, which experience typhoon storm surges year-round, rarely encounter cold waves. On the other hand, the YRD, located in northern China, experiences cold wave storm surges every winter and spring. The YR also transports large amounts of sediment to the sea annually, making the lower reaches of the YRD particularly valuable for research. Thus, this study focuses on the YRD to examine cold wave impacts. Understanding the cold wave processes in this context will help in addressing rapid erosion and deposition phenomena caused by cold waves in coastal river port areas.
Currently, numerical simulation methods, constructed from extensive measured data, have become essential tools for investigating the hydrodynamic characteristics, sediment transport, and dynamic mechanisms of the YRD and adjacent seas. Yang et al. (2017) used Large-Eddy Simulation to study sediment suspension and transport under plunging breaking waves. Dong et al. (2020) constructed a hydrodynamic model by using Delft 3D to study the impact of waves on the evolution of the YRD. Hu et al. (2018) developed a numerical model by using the Modified Langmuir Equation to investigate the interactions between phosphorus and sediment. Zhao and Jiang (2011) conducted path analysis of storm surges caused by cold air outbreaks in the Bohai Sea through numerical simulation. They studied the impact of different types of cold air outbreaks on the maximum surge in the Bohai Sea and explored the response mechanisms of the Bohai Sea area to cold waves. Mo et al. (2016) investigated the interaction mechanisms between surface gravity waves and ocean currents in the northern East China Sea by establishing a numerical coupling model, exploring wave-current interactions under the influence of cold waves. Two-dimensional numerical model results can represent the geomorphological evolution process in estuary areas, while three-dimensional numerical model results can simultaneously show hydrodynamics and suspended sediment concentration changes across different layers (surface, middle, and bottom). These models are widely used in dynamic geomorphological research (Luan et al., 2017; Thanh et al., 2019; Fan et al., 2020). In this study, a numerical model was constructed by using Delft 3D to calculate the dynamic geomorphology of the YR estuary and explore the response mechanisms in the YR estuary during cold wave events.
It is evident that most previous studies have focused on storm surge path simulations (Wang et al., 2017; Huang et al., 2022), the impact of typhoon storm surges on deltas, or the geomorphological evolution of deltas under natural conditions (Xie et al., 2021; Wang et al., 2022; Zhang et al., 2023). Few studies have investigated the response of delta regions to cold wave events. Therefore, this paper compiles cold wave data from the past decade and selects the strong cold wave event from November 28-30, 2022, to study its impact on the YRD. By analyzing the effects of the cold wave process on the YRD region, this study aims to provide valuable insights for mitigating the impact of strong cold waves on the YRD in the future.
2 Study area
The modern YRD, as mentioned in this paper, has been forming since 1855, following the river’s breach in Henan at Tongwaxiang, where it captured the Daqing River’s course to the Bohai Sea. Situated between Bohai Bay and Laizhou Bay, the terrestrial delta covers an area of 5,375 square kilometers with a coastline spanning 296 kilometers. Historically, the YR has been characterized by siltation, elongation, and frequent changes in its course, influenced by both natural and anthropogenic factors (Wang and Liang, 2000). Since 1855, the river has changed its path over 50 times, including 11 significant diversions. From 1855 to 1934, it underwent six major natural diversions. Since 1934, more than five changes have occurred, with the last three being man-made: the 1953 diversion to Shenxiangou exacerbated upstream erosion, the 1964 diversion to Diaokou River mitigated the erosive pathway, and the 1976 diversion to Qingshuigou increased the length of the river entering the sea, which lowered the erosional base level at the river estuary. Post-1996, the human-engineered Q8 channel was developed, facilitating oil extraction and further lowering the erosional base level at the river estuary. This paper specifically focuses on the YR estuary area, with the map of the Yellow River basin and the map of the Yellow River estuary area shown in Figure 1.
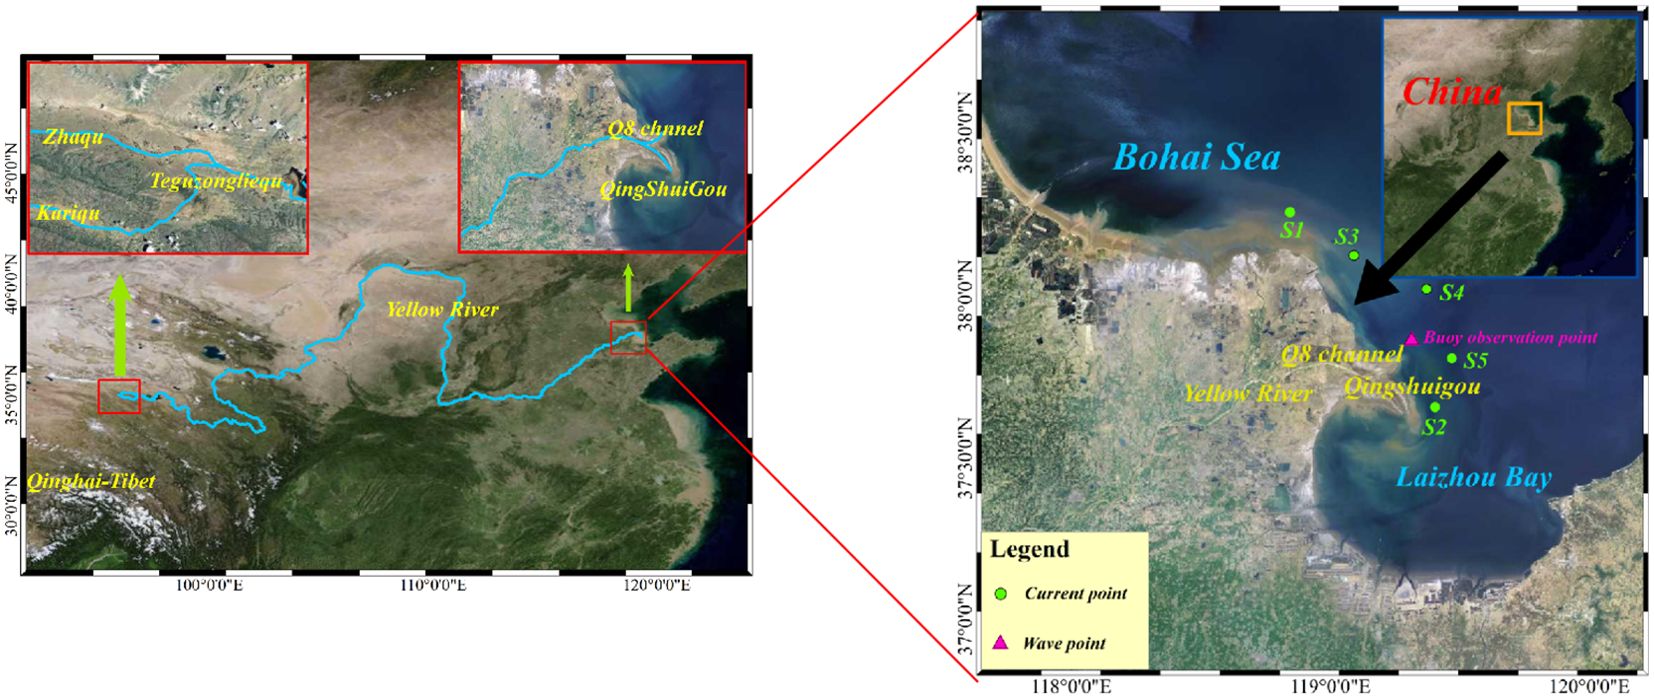
Figure 1. Map of the Yellow River basin (the blue line is Yellow River) and the Yellow River estuary area (Verification point location diagram).
3 Model and data
3.1 Delft3D
Delft3D, developed by WL Delft Hydraulics at Delft University in the Netherlands, is a hydrodynamic software widely used for large-scale computations involving water flow, wave, morphology, water quality, and ecology. Among its components, the Delft3D-FLOW module is a three-dimensional hydrodynamic transport model that employs a structured rectangular grid and uses the Alternating Direction Implicit (ADI) method, a finite difference approach, for solving the hydrostatic Navier-Stokes and transport equations (Guillou et al., 2018). The vertically averaged 2-D equations are used to simulate the hydrodynamics. The Equations 1-6 are as follows:
where denotes the water level (total water depth); ddenotes the current water depth to the reference plane (net water depth); and represent the velocity components in the , directions, respectively; represents the mass source intensity per unit area. is the Coriolis parameter; is the dynamic horizontal eddy current viscosity; is the reference density; is an irregular density; 、 are the wind pressure components acting at sea level; 、 are the bottom shear stress components. In the transport equation, represents salinity or temperature; is the horizontal eddy dissipation; represents a first-order decay process; is the source term per unit area; is the latitude; is the longitude; is the free surface elevation above the reference plane; r is the radius of the Earth; Patm is the atmospheric pressure.
The balance Equation 7 of dynamic spectrum action describes the process of wave spectrum change in Cartesian coordinate system:
The first term on the left side of the equation represents the change in spectral density over time. The second and third terms together describe the spatial propagation of and its variation with wave speed. The fourth term reflects the changes in the relative frequency space , which accounts for the influence of the flow field and water depth. The fifth term represents the propagation within the spectral direction space. Cx and Cy represent velocities in x and y space, respectively; represents velocity in space; represents velocity in space. The right hand side of the equation considers the source and sink terms that balance the change of wave action in temporal, geographical and spectral space. They include growth of the wind waves due to energy input from wind stresses, nonlinear triad (three-wave) and quadruplet (four-wave) interaction between spectral components, and wave dissipation due to white capping, shallow-water depth-induced breaking, and bottom friction.
In the sediment transport module, cohesive and non-cohesive sediments are often considered either separately or jointly, with a critical particle size of 0.063 mm to distinguish them. Particles smaller than 0.063 mm are classified as cohesive sediments, primarily transported as suspended sediment. Particles larger than 0.063 mm are considered non-cohesive sediments and can be transported both as suspended sediment and as bed sediment. In the two-dimensional model, the governing Equation 8 are as follows:
where indicates water depth; represents the concentration of the sediment component; u and v represent the horizontal velocity components; represents the horizontal eddy diffusion coefficient of sediment; represents the vertical eddy diffusion coefficient of sediment; and are the erosion and siltation fluxes of the ith sediment component, respectively, indicates sediment exchange between the water column and the bed.
The change of bed evolution caused by sediment transport is calculated by the following Equation 9:
is the bottom sediment content; is the time step; is the acceleration factor; is the area of the calculation unit; is the sediment transport in the direction of u; is the cell width in the direction of x; is the cell width in the direction of y.
3.2 Cold wave data
According to the “Cold Wave Grade” standards (GB/T 21987—2017) (Fang et al., 2022), cold wave intensity is classified into three levels: cold wave, strong cold wave, and severe cold wave. Of course, although this paper defines the cold wave intensity by temperature, temperature effect is very small in sea level oscillations, thus, it can be omitted in the surge simulations. The specific criteria for each category are detailed in Table 1.
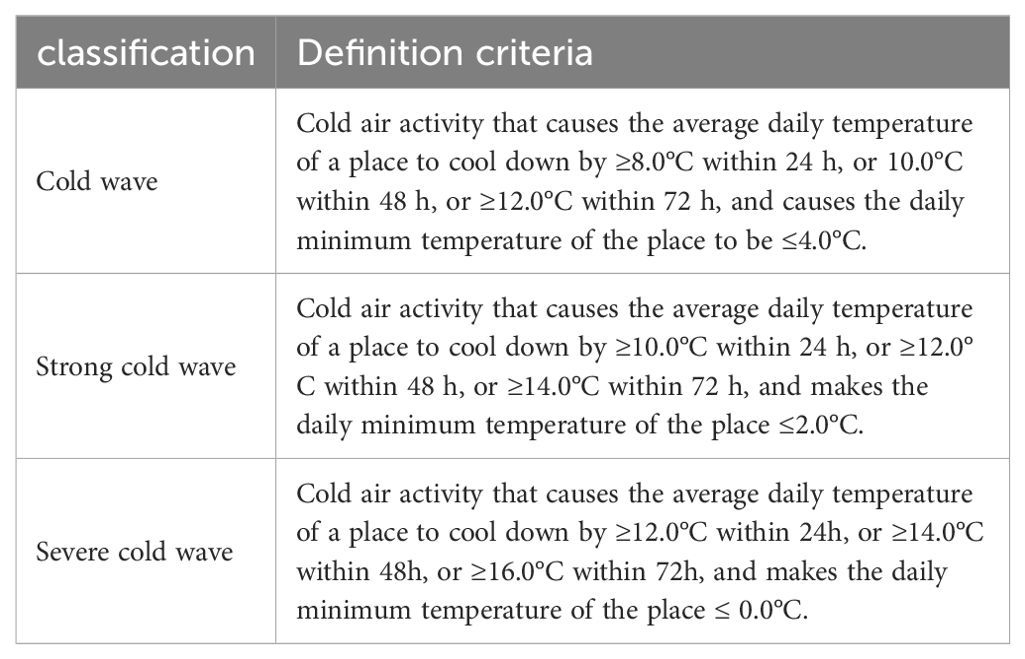
Table 1. Cold wave classification standard table.
The data used in this study are sourced from the ERA5 (https://cds.climate.copernicus.eu) reanalysis datasets, produced by the Copernicus Climate Change Service. ERA5 is the fifth generation ECMWF reanalysis for the global climate and weather for the past 8 decades, including temperature, wind fields, and pressure fields, with data available from 1940 to the present. The datasets offers information on wind speed in the U and V directions at 10m height and air pressure, with a spatial resolution of 0.1° × 0.1° and a time resolution of 1 hour. ERA5 datasets provide a foundation for assessing global sea-level changes, coastal flooding, coastal erosion, and port accessibility. Its importance is particularly significant in regions where observed data are scarce. The applicability of ERA5 data in China has been validated (Shi et al., 2021).
The study utilized the HYSPLIT (Hybrid Single Particle Lagrangian Integrated Trajectory model) (Draxler and Hess, 1998; Stein et al., 2015) to track cold air mass movement associated with a cold wave. The starting points for the trajectories were grid points where the surface 2-meter temperature experienced the maximum 24-hour drop at the end of the cold wave event. Within HYSPLIT, it is assumed that the particle’s trajectory follows the wind field, representing an integration of the particle’s position across both space and time. The vector velocity at the particle’s location is linearly interpolated both spatially and temporally. Assuming that a cold air mass can be represented by such a particle, the movement path of the cold air mass can be substituted by the trajectory of the particle. The particle’s new position is determined by averaging the vector velocity at its previous position and an initial guess at the new position, then multiplying this average by the time step. The specific computational formula is as follows Equations 10, 11:
The first guess location is:
The position of the mass at the next moment is:
where V is the average velocity and is the time step.
Trajectories are terminated if they exit the model (HYSPLIT) top, but advection continues along the surface if trajectories intersect the ground. The integration time step () can vary during the simulation. It is computed from the requirement that the advection distance per time-step should be less than0.75 of the meteorological grid spacing.
The study simulated a strong cold wave event that occurred at the end of November 2022, as illustrated in Figure 2. This cold wave originated in the Kara Sea north of Siberia, Russia. The outbreak of the cold wave steered polar cold air southward, passing through the West Siberian Plain and the Altai Mountains, entering China via Mongolia, and then continuing eastward to affect the Laizhou Bay area, subsequently impacting the estuarine waters of the YRD.
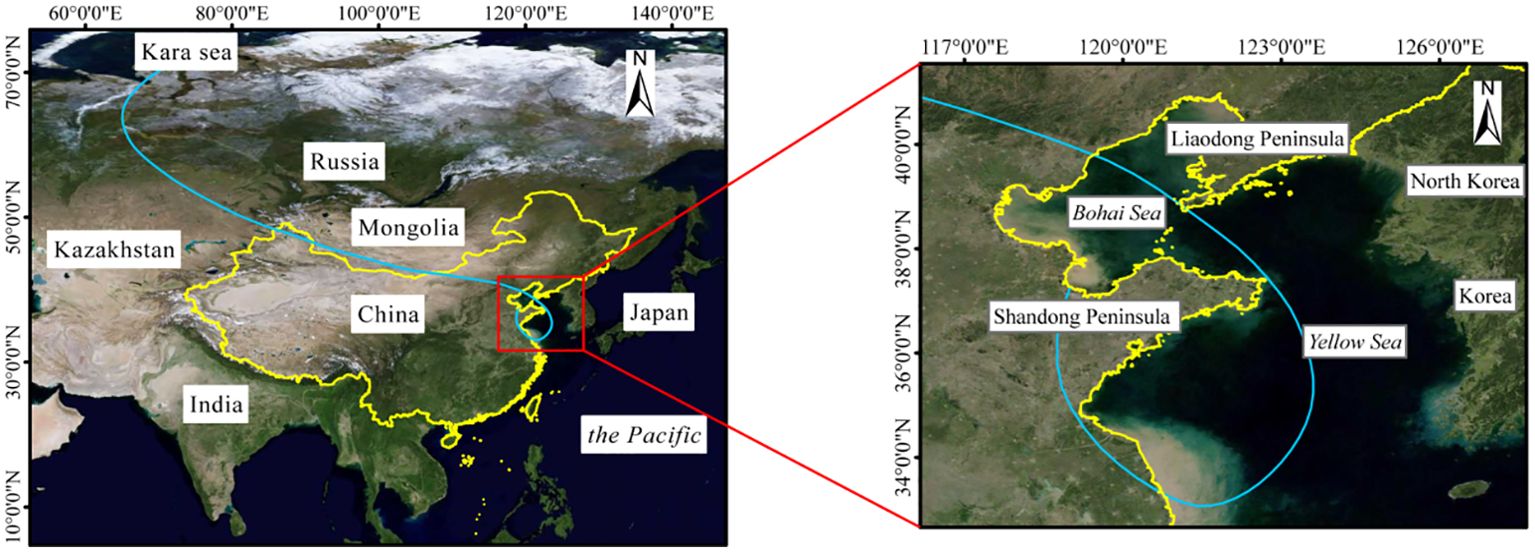
Figure 2. Cold wave track calculated by HYSPLIT model (blue line) of the November 28-30, 2022 event.
Additionally, wind speed and direction graphs were plotted in Figure 3 by using the cold wave data from points S2, S3, S4, and S5 in Figure 1. It can be seen that the wind direction during this cold wave mainly ranged from 240° to 300°, with most directions above 270°, indicating a predominant northwest wind direction. The wind speeds generally ranged from 10 m/s to 15 m/s, with maximum speeds exceeding 14 m/s. From Figure 4, it is evident that the wind speed at position S5 is higher than at the other three points, suggesting that this location may be more significantly affected by the strong winds of the cold wave.
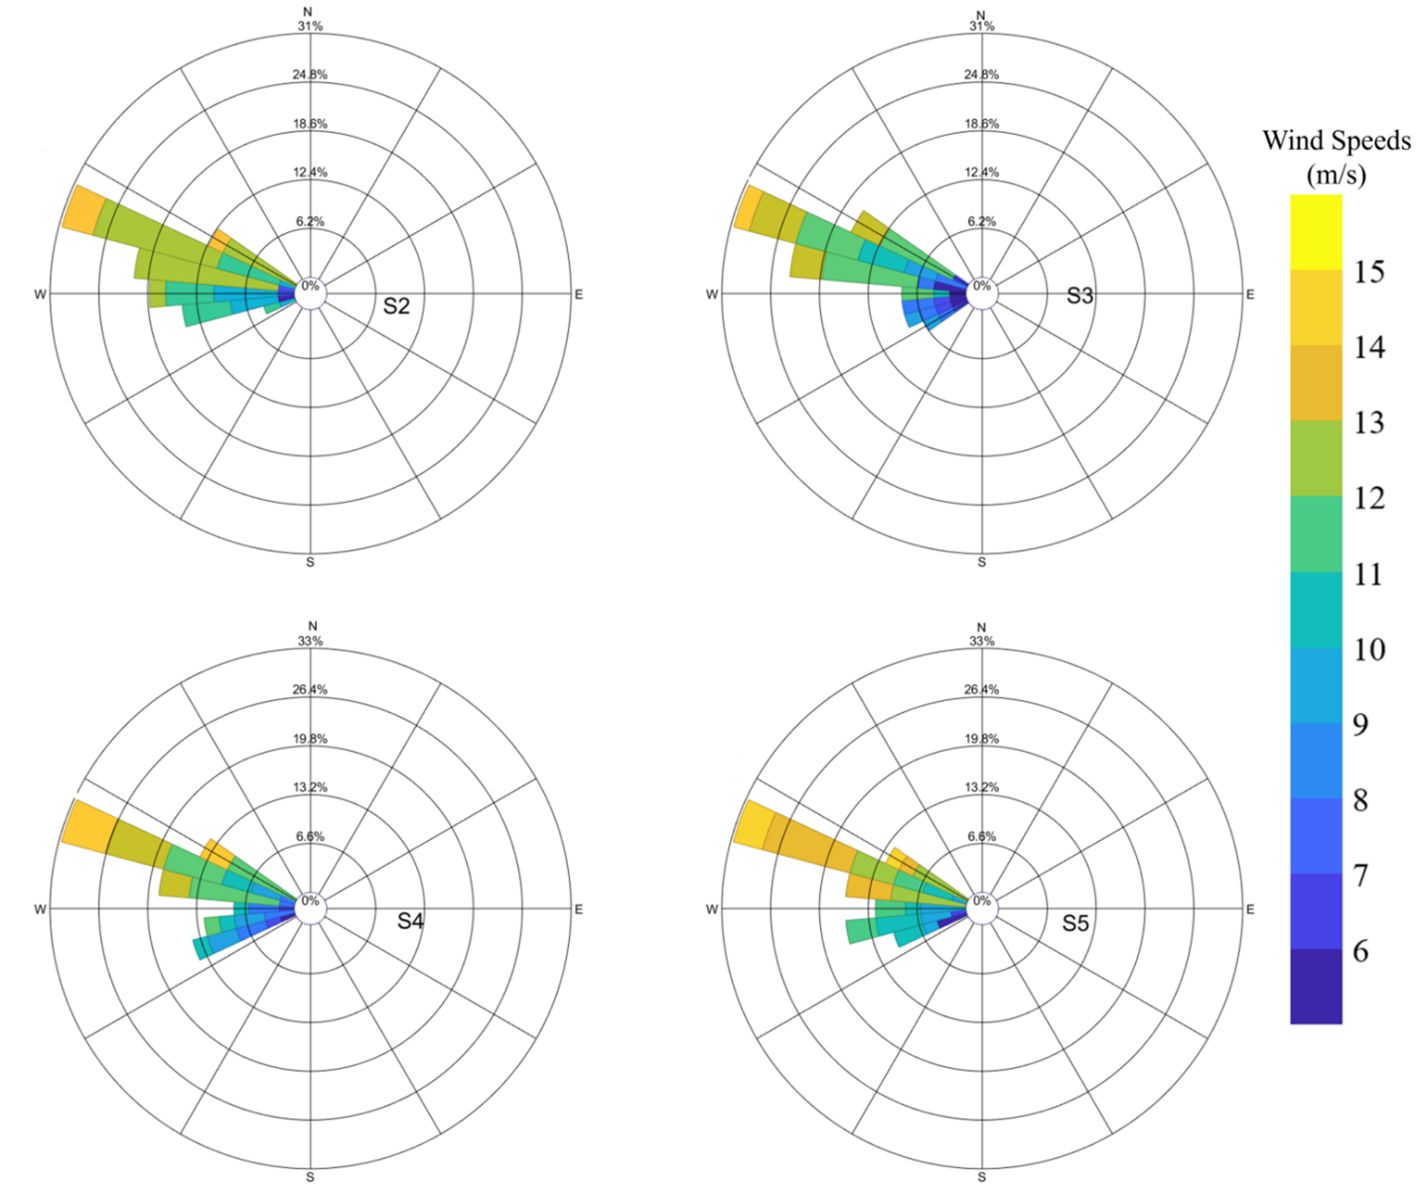
Figure 3. Wind speed and direction map at different locations during cold wave in Yellow River Delta region.
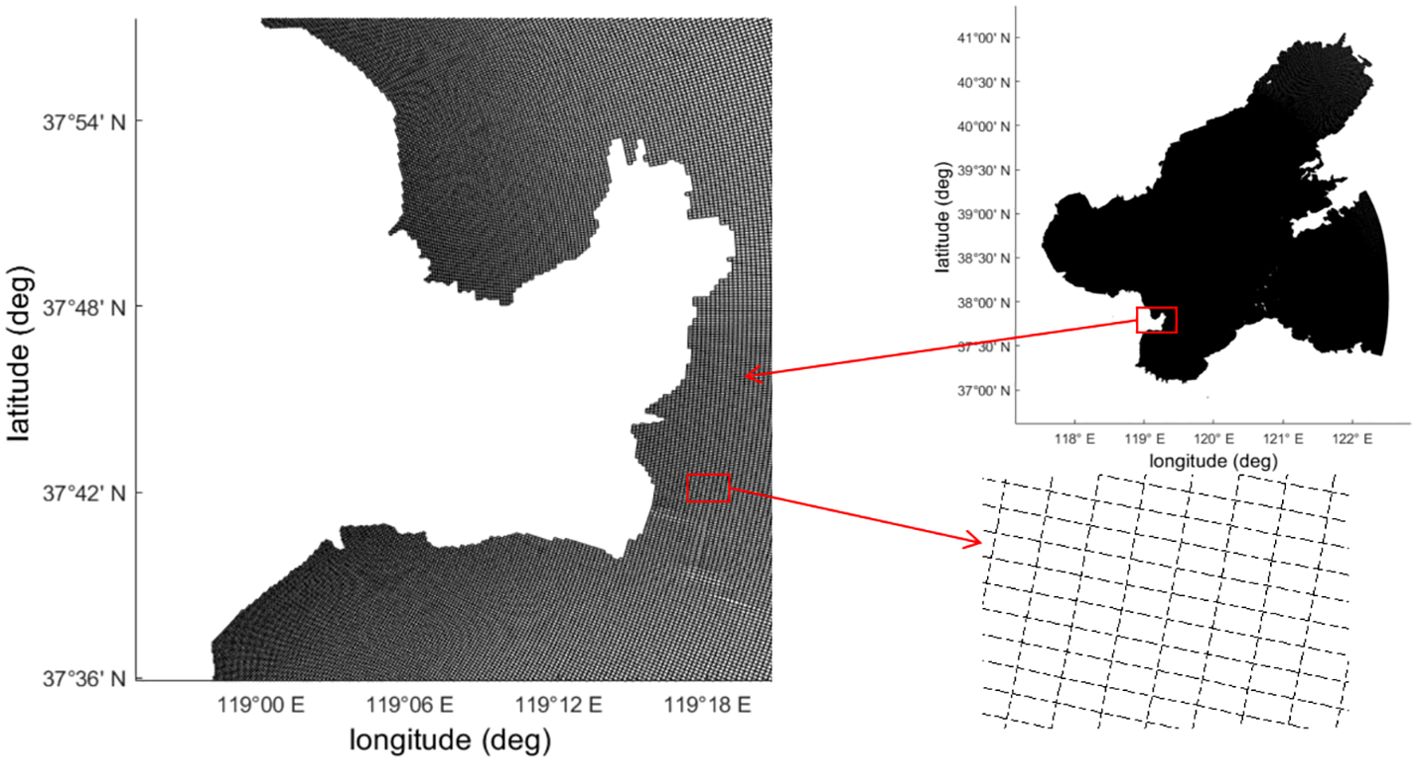
Figure 4. The Delft3D model grid for the study area.
4 Model setting and verification
4.1 Model construction
The study area ranges from 37.1°N to 41.05°N and from 117.49°E to 122.53°E, which includes the Laizhou Bay, Bohai Bay, and Liaodong Bay. The Delft3D’s Grid module was used to generate a structured rectangular mesh, consisting of 722×983 grid points. The layout of the overall grid is shown in Figure 3. The average grid size in the refined areas is 200 m. The model’s Manning coefficient was set to 0.014, with a time step of 2 min. The density of seawater was specified as 1050 kg/m³, and the gravity parameter was set to 9.8 m/s². In the Sediment module, three types of cohesive sediment and a types of Non-viscous sediment components were used, with particle sizes of 7.5 μm, 30 μm, 62.5 μm and 100 μm, respectively. The water depth for the study area is shown in Figure 5. The dry density of cohesive sediment was set to 500 kg/m³, and the dry density of Non-viscous sediment was set to 1600 kg/m³, and the erosion rate was set to 5*10-5 kg/m2/s. The particle density for all three sediment components was uniformly set to 2650 kg/m³ (Fu, 2023).

Figure 5. The Delft3D model water depth for the study area.
The bathymetric data in the model primarily contains the large-area national bathymetry data which is derived from ETOPO the nautical chart data specific to China’s coastal waters. The water depths used in the model represent the depths to average sea level.
The model employs a cold start approach, meaning that at the initial moment of the simulation, the water bodies are static. Consequently, the water levels and flow velocities at all grid points are set to zero, which can be formally described as follows Equations 12-14:
The model’s initialization period spans from November 10, 2022, at 00:00 to November 30, 2022, at 23:00. The process commences two weeks prior to the onset of the cold wave to ensure the model’s stability. For the open boundary of the model, water level conditions are driven by tidal constituents, which are forecasted by using harmonic constants derived from the TMD (Tide Model Driver). Eight principal tidal constituents (M2, S2, N2, K2, K1, O1, P1, and Q1) are adopted (Gao et al., 2012). The hydrodynamic conditions at the river boundary are given in the form of fluxes, using the monthly average runoff data from the Lijin Hydrological Station. The data is sourced from the Yellow River Conservancy Commission.
4.2 Model verification
The validation of flow speed and direction is carried by utilizing measured tidal data from stations S1 -S5 in the Yellow River Delta maritime area. Tidal elevation validation employed actual data from stations S4 and S5, while sediment concentration was validated using data from stations S1 and S2. Wave validation was conducted using buoy observation data during a cold wave passage from 9:00 on March 3, 2023, to 8:00 on March 12, 2023, near the Yellow River Delta. The results of the validation, comparing observed data with simulated data, are displayed in Figure 6. The detailed latitude and longitude are provided in Table 2 and Figure 1. This comprehensive approach ensures that the model accurately represents the physical processes occurring in the study area, enhancing the reliability of the simulation outputs for further analysis and applications. The formula is shown in Equations 15, 16.
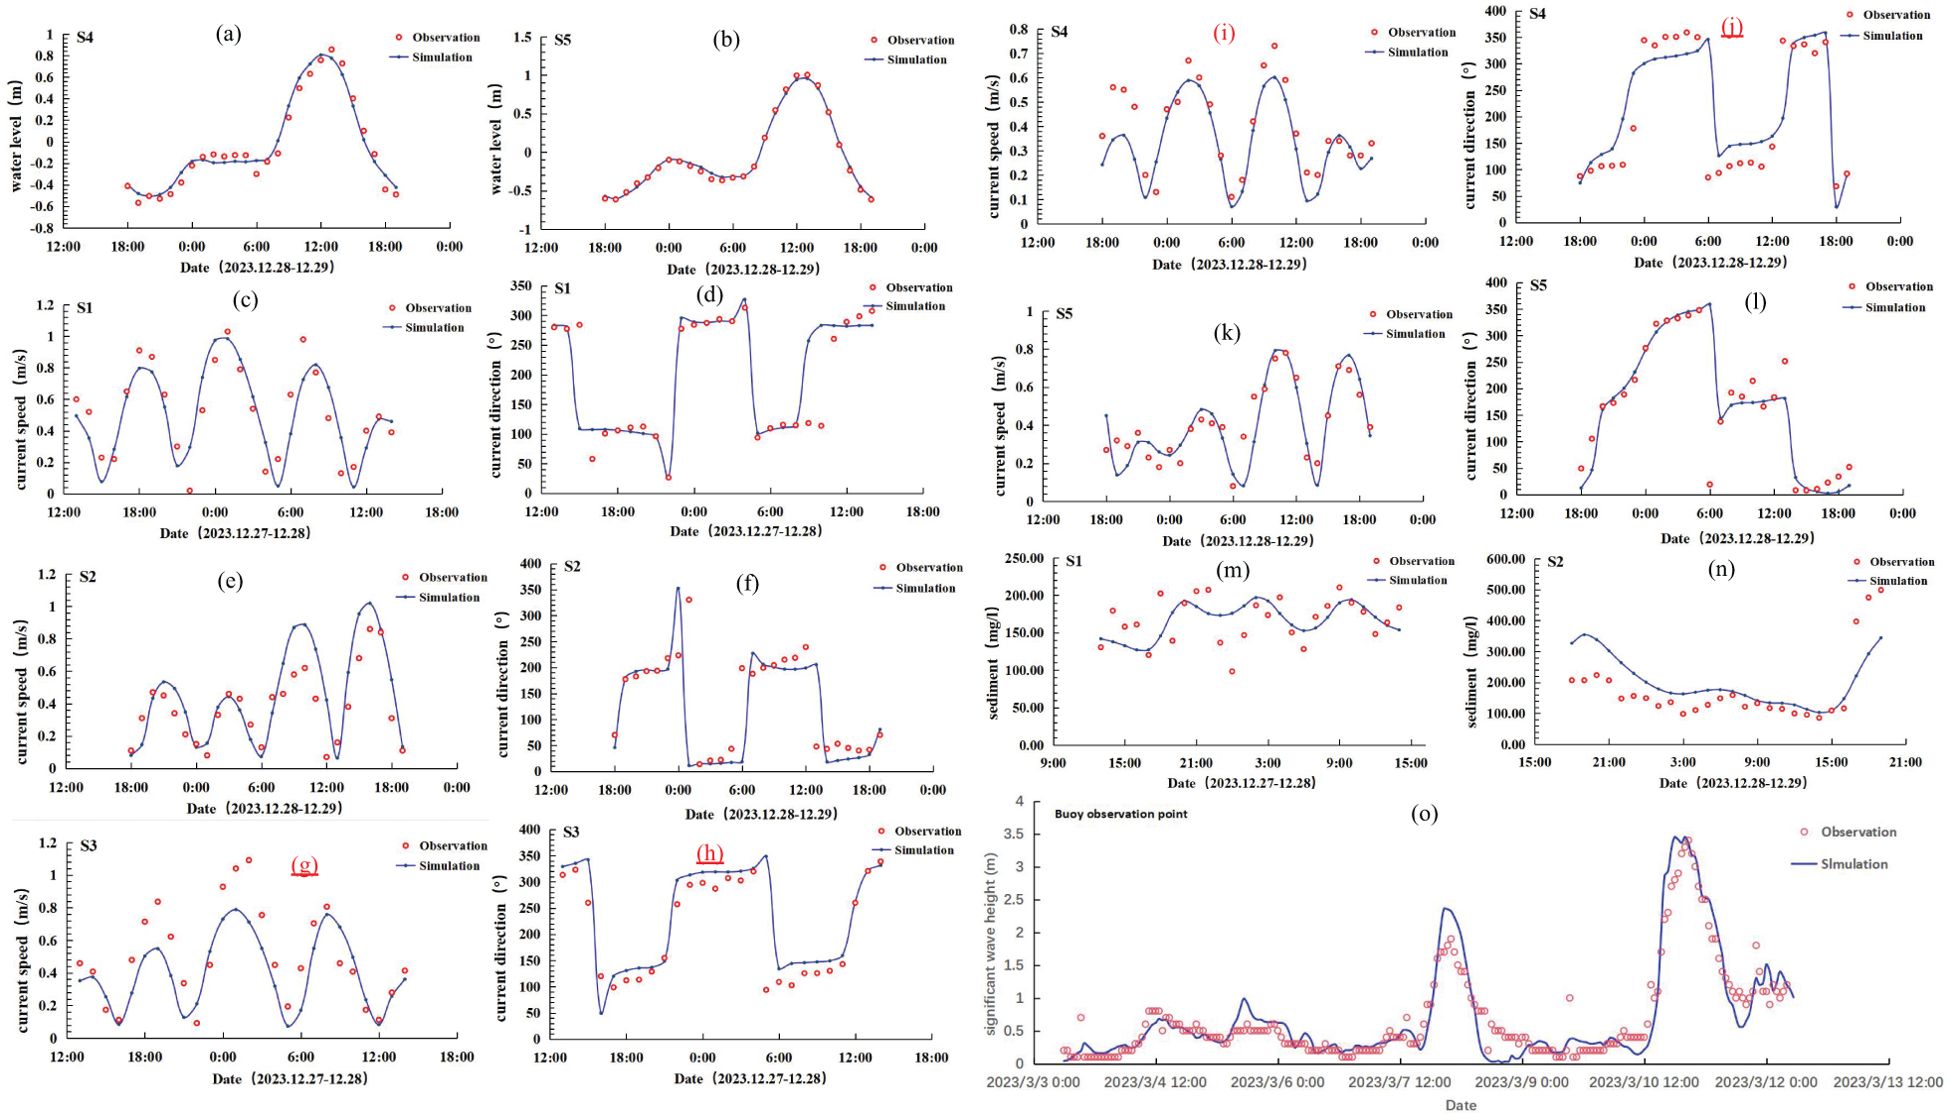
Figure 6. Comparison between measured values and simulated values [(A, B) water level (C-L) current speed and current direction (M, N) sediment (O) wave].
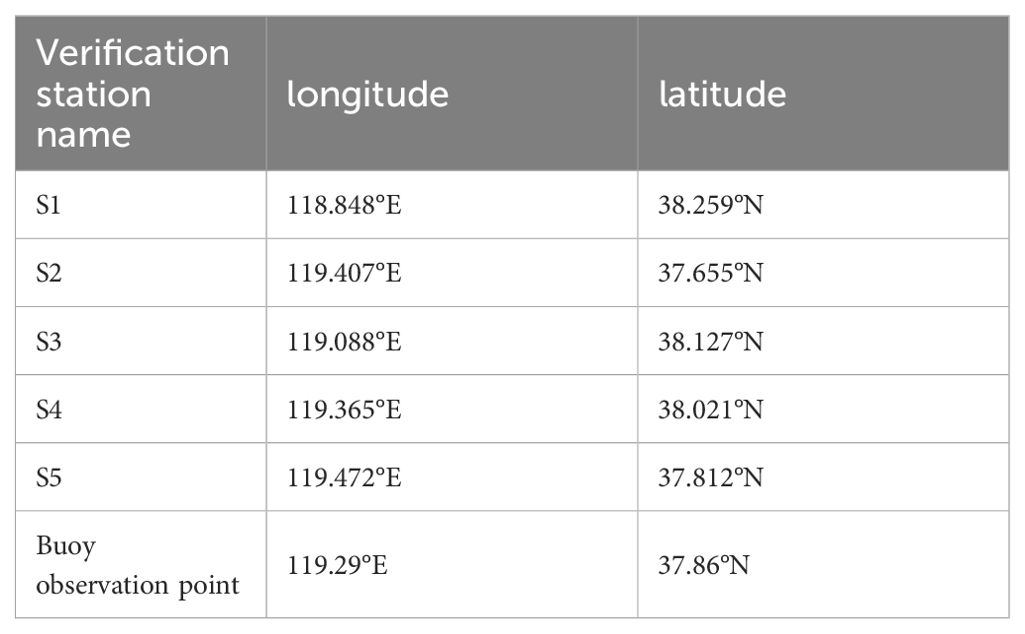
Table 2. The specific longitude and latitude of verification point.
To confirm the precision of the simulation, two statistical metrics are used: the Skill score method and the Root Mean Square Error (RMSE). These metrics provide a quantitative basis for assessing how well the model simulations match the observed data. Here are the formulas used for each metric (Willmott, 1981):
Where: is the calculated value of the model, is the measured value, is the measured mean value, and N is the number of statistical variables. The Skill score quantifies the degree of correlation between the deviations of model simulations from the observed mean and the deviations of observed values from the observed mean. The value of the Skill score ranges from 0 to 1. A value of 1 signifies a complete agreement between model simulations and observed data. A Skill score above 0.65 is considered to reflect excellent simulation results; a score between 0.65 and 0.5 indicates very good results; a score from 0.5 to 0.2 suggests good results; and a score below 0.2 is considered poor. The smaller the RMSE, the better, as a lower value indicates a smaller error between the observed values and the simulations, suggesting a model that more accurately reflects reality.
As shown in Table 3, through validation comparisons, except sediment, all observed and simulated Skill scores were greater than 0.85. The RMSE for current were less than 0.17m/s, the RMSE for flow direction were less than 71.1°, the RMSE for water level were less than 0.07 m and the RMSE for significant wave height were less than 0.24 m. These results indicate that the simulated water level and currents agree well with the observed data, demonstrating that the parameters used in the model are fundamentally reasonable. The model is capable of effectively simulating the tidal flow characteristics of the project marine area and can be utilized for further prediction and research.
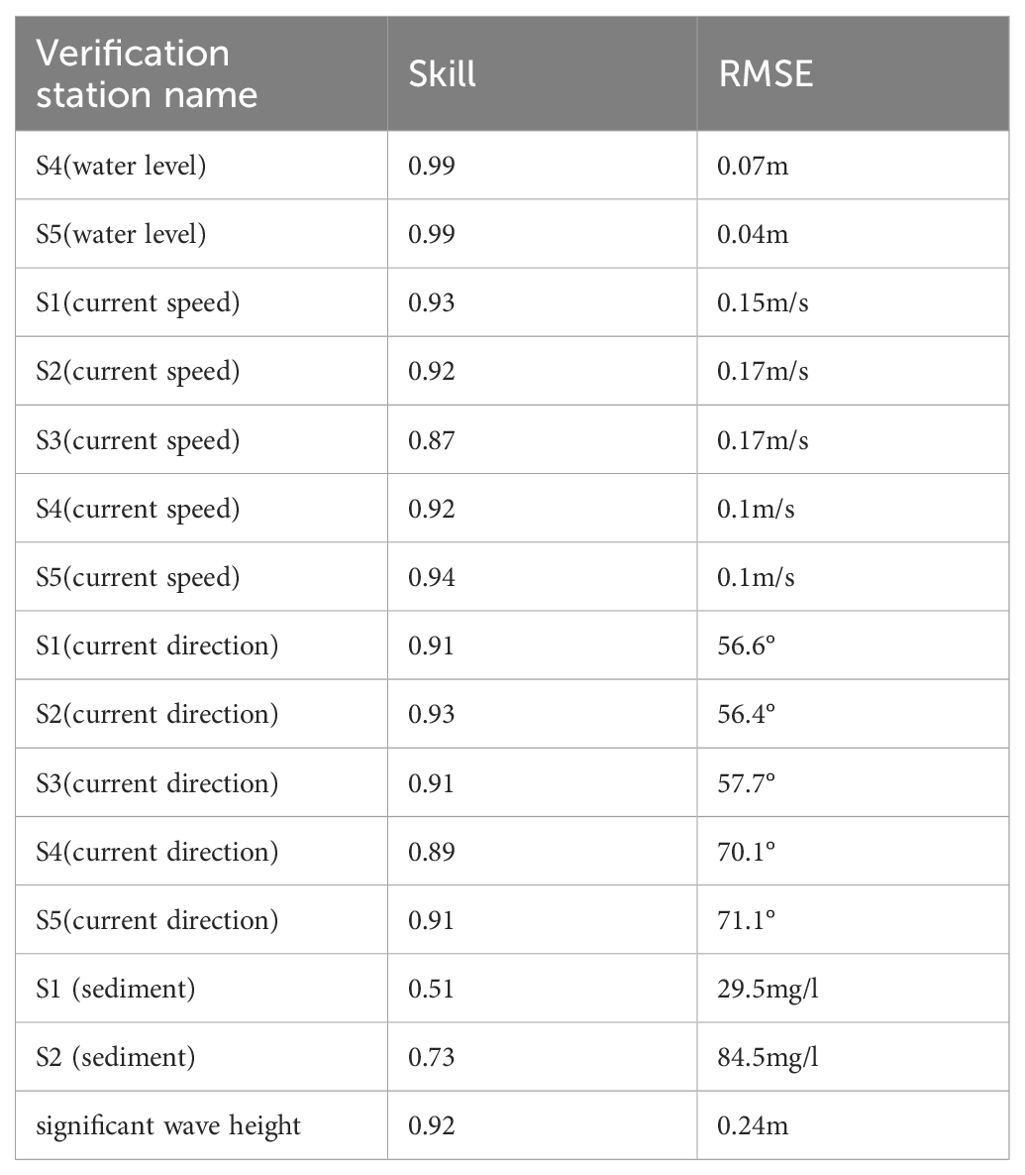
Table 3. Model accuracy parameter verification table.
5 Result
5.1 Flow analysis result
By subtracting the maximum water levels under conditions with and without a cold wave, the results, as shown in Figure 7, indicate noticeable differences in tidal changes between the two scenarios. Water levels generally increased by approximately 0.18-0.28 m during the cold wave compared to non-cold wave conditions. Specifically, near the new YR estuary, the water level during the cold wave was about 0.18 m higher than during non-cold wave periods. In the areas near the old YR estuary and west of the new YR estuary, the increase was generally around 0.28 m. The greatest increase, reaching 0.35-0.4 m, occurred in the coastal area west of the old YR estuary. This location requires particular attention during cold wave periods due to the significant rise in water levels. In Mo (2018)’s study, it was found that water levels should decrease due to the influence of cold high pressure. However, Figure 7 shows that the nearshore sea area of the YRD exhibits an increase in water level. This increase is due to the combined effects of waves and atmospheric pressure, where the wave-induced rise in water level exceeds the decrease caused by atmospheric pressure. Therefore, it is evident that the influence of waves on the nearshore water level increase is greater than that of atmospheric pressure.
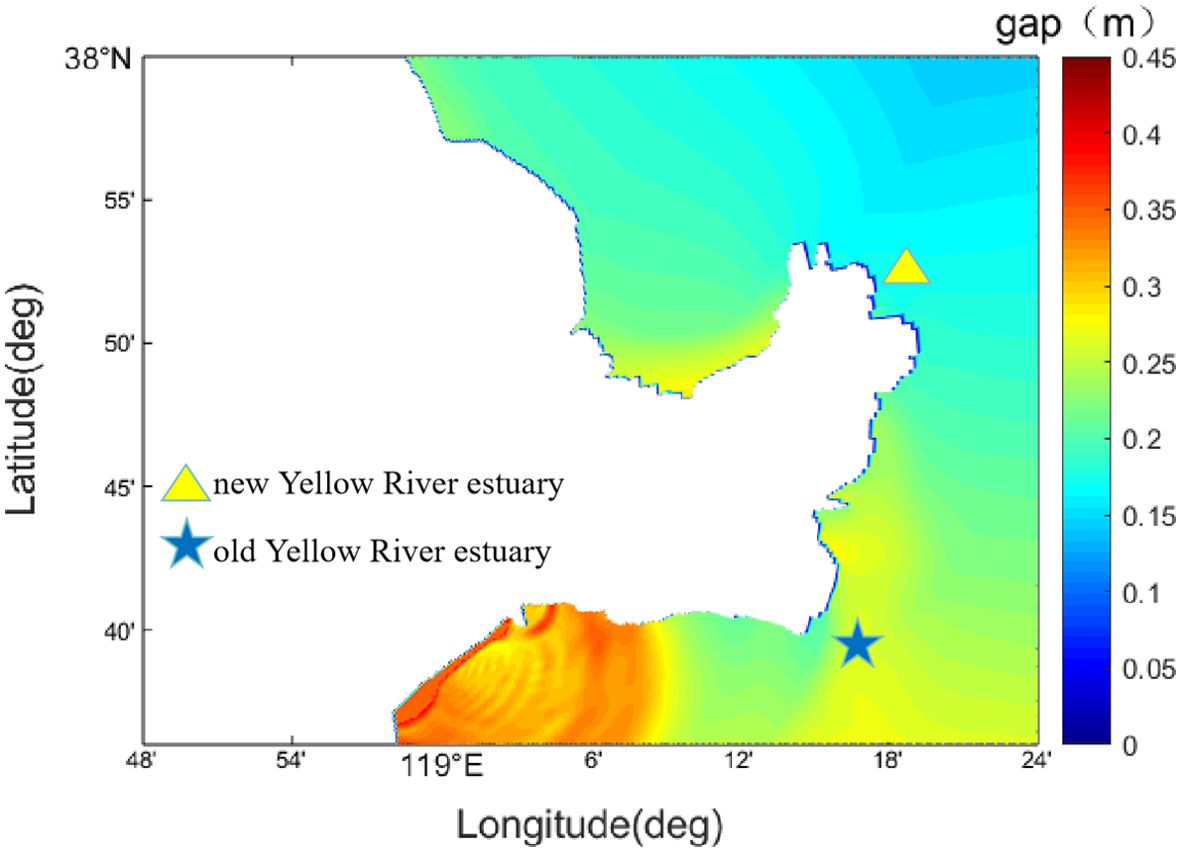
Figure 7. Maximum difference of water level with and without cold tide.
According to the numerical simulation results, flow field maps illustrating the ebb and flow tides during periods with and without a cold wave were created, as shown in Figure 8. From the flow direction arrows depicted in the figure, it is evident that the cold wave process has little impact on the direction of flow; in the YRD region, the flow near the old YR estuary is predominantly northeast-southwest, while near the new YR estuary, it is east-west. The tidal flow exhibits strict reciprocating characteristics, closely following the shoreline. However, the cold wave process significantly affects the flow speed. From Figures 8A and 8B, it can be seen that during flood tide, the area around the old YR estuary experiences an increase in the flow speed range above 0.8 m/s due to the cold wave, with maximum speeds reaching over 0.9 m/s. Additionally, Figures 8C and 8D show that during low tide, the influence of the cold wave winds causes an overall increase in flow speed of about 0.1 m/s in Laizhou Bay. The flow speed at the old YR estuary increases by approximately 0.15 m/s, with maximum flow speeds reaching around 1 m/s in the nearby sea area. During the peak ebb and flood tides, the overall flow speed in the region is relatively high, thus the influence of the cold wave winds is relatively small.
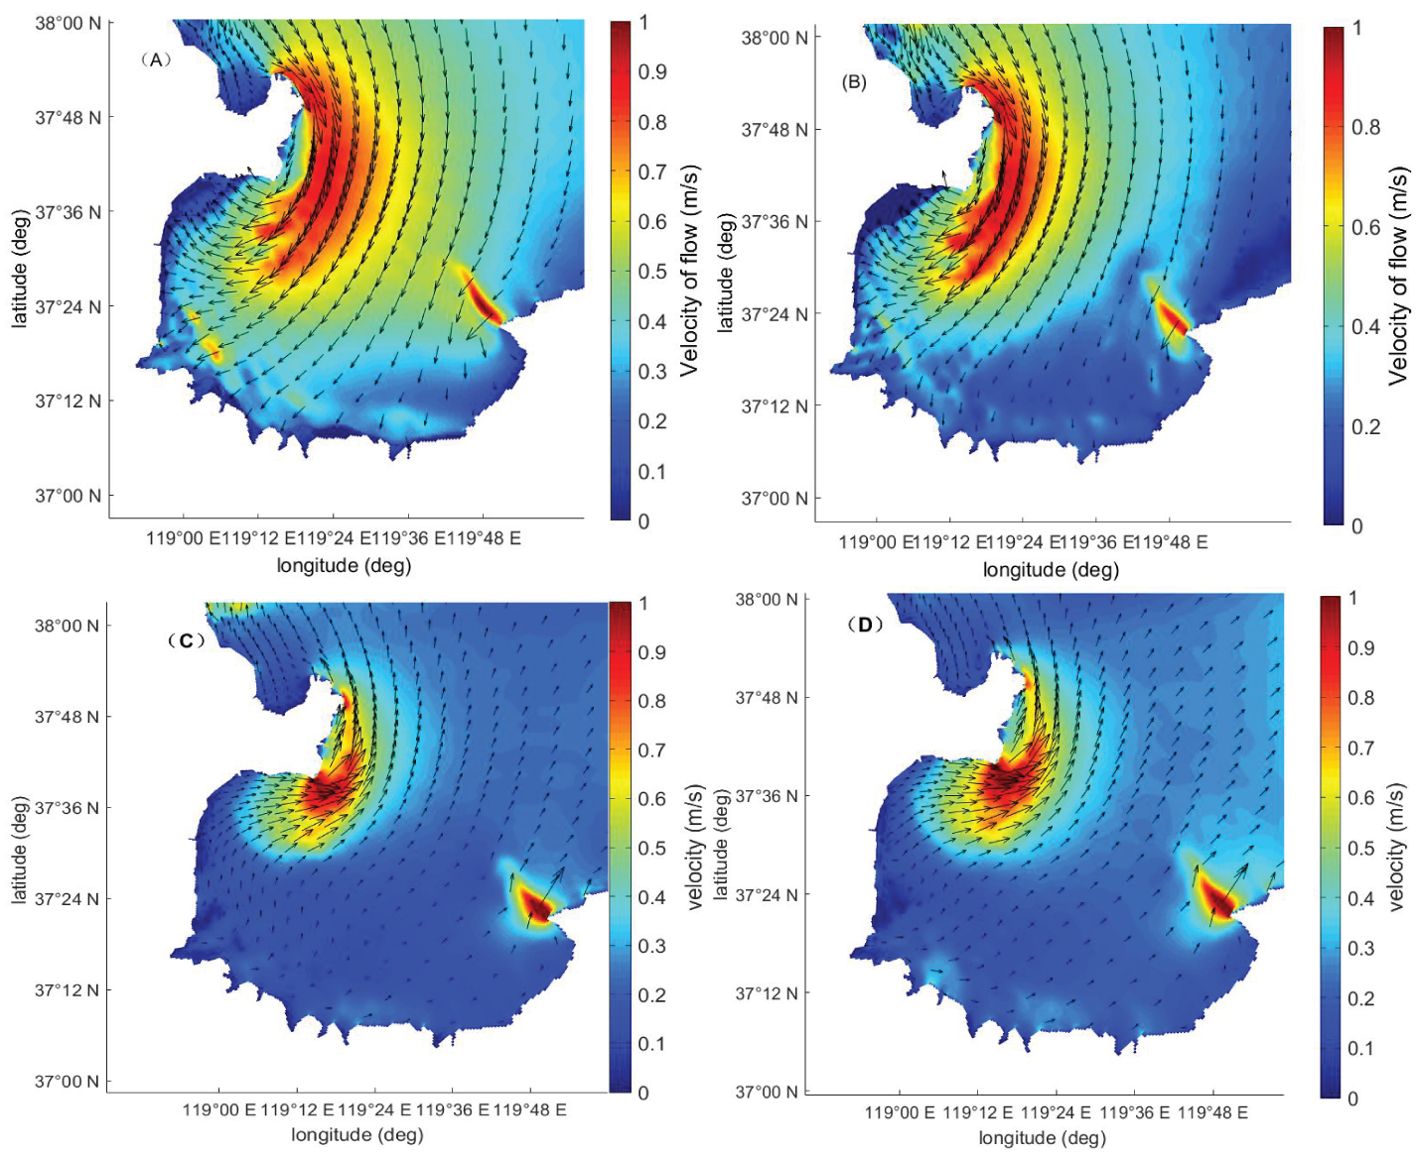
Figure 8. Current velocity and direction diagram at maximum flood tide and maximum ebb tide moment [(A) No cold wave tide at maximum flood tide (B) Cold wave tide at maximum flood tide (C) No cold wave tide at maximum ebb tide (D) Cold wave tide at maximum ebb tide].
As shown in Figure 9, the cold wave has a more obvious influence on the vicinity of the YR estuary, except for the moments when the flow velocity is large, such as the maximum flood tide and maximum ebb tide moment. From the current river estuary to the old YR estuary, the influence of the cold wave results in an increase in coastal flow speed of more than 0.35 m/s. The effect of the cold wave diminishes gradually from the coast towards the open sea, with flow speed changes reducing to around 0.1 m/s by the time the water reaches Laizhou Bay. Overall, due to the unique geographical location of the YRD, the phenomena of erosion and deposition near the river estuary are quite pronounced. Under the adverse conditions of a cold wave, the sudden increase in flow speed exacerbates the erosion and deposition at the YR estuary, particularly near the old YR estuary where the change in flow speed is more significant. This area requires special attention, particularly during cold wave events, to manage and mitigate the increased sediment dynamics effectively.
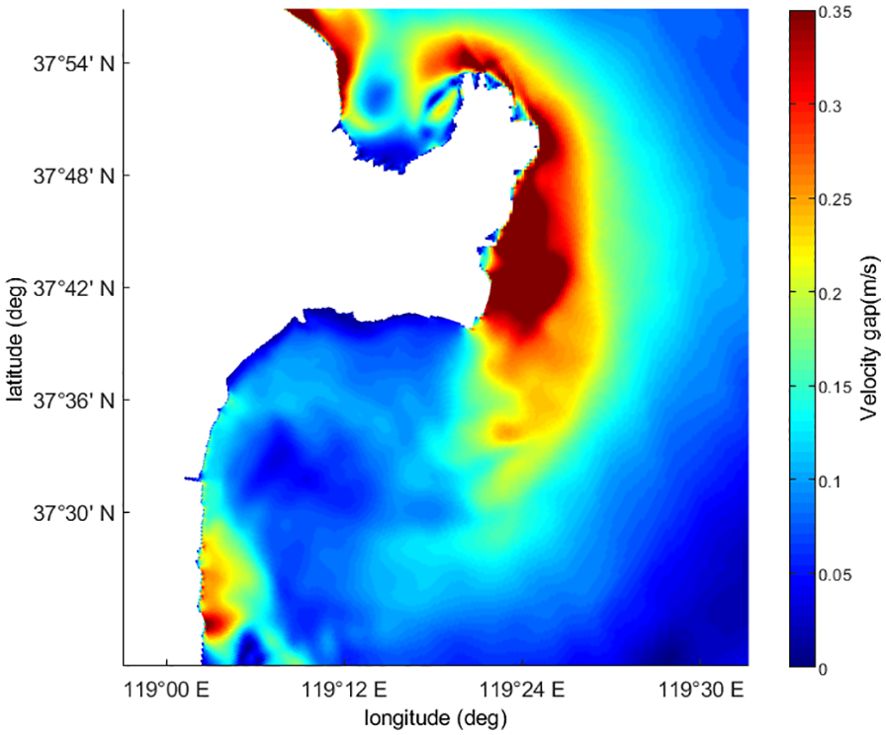
Figure 9. Maximum difference of velocity with and without cold tide.
5.2 Residual current and shear stress changes analysis results
In coastal and estuarine areas, after undergoing a tidal cycle, water parcels, influenced by steady currents, turbulence, and the nonlinear effects of the tide itself, typically do not return to their original positions (Liu et al., 2012). The effects generated by these nonlinear interactions are known as residual currents. This paper employs the Eulerian method to study residual currents, where Eulerian residual current refers to the residual current at a fixed location in space. This represents the average migration tendency of the fluid at a fixed location over the cycle. The expression for this is as follows (Lu et al., 2008):
where is the east component of the current and is the north component of the current.
Using Equation 17, residual currents for both cold wave and non-cold wave scenarios were calculated, and the resultant Eulerian residual current vectors are illustrated in Figure 10. From these vector maps, it is evident that the cold wave process significantly influences both the strength and orientation of the residual currents close to the YR estuary. Under conditions without a cold wave, the residual current near the old YR estuary typically flows offshore, from northwest to southeast, with a magnitude of about 20 cm/s. However, under the influence of a cold wave, the direction of the residual currents aligns with the wind direction, shifting to a north-to-south orientation. Additionally, due to the influence of waves, the residual current also increases significantly, with the maximum residual current near the old YR estuary exceeding an increase of 10 cm/s from the non-cold wave condition, reaching up to 33 cm/s. This demonstrates the substantial impact of cold waves on the hydrodynamic conditions in the estuary area. Additionally, we can observe that regardless of the impact of cold waves, the residual flow at the old YR estuary is greater than at the current estuary. This is because the current estuary, influenced by runoff, has a stagnation point where a relatively stable water environment exists, with minor fluctuations in water flow, resulting in a smaller residual flow. In contrast, at the abandoned estuary, practical evidence shows that after the protrusion of the YR spit, the tidal current field is significantly enhanced, forming a strong flow center. Furthermore, this location is not influenced by runoff, leading to a larger residual flow (Li and Li, 2015).
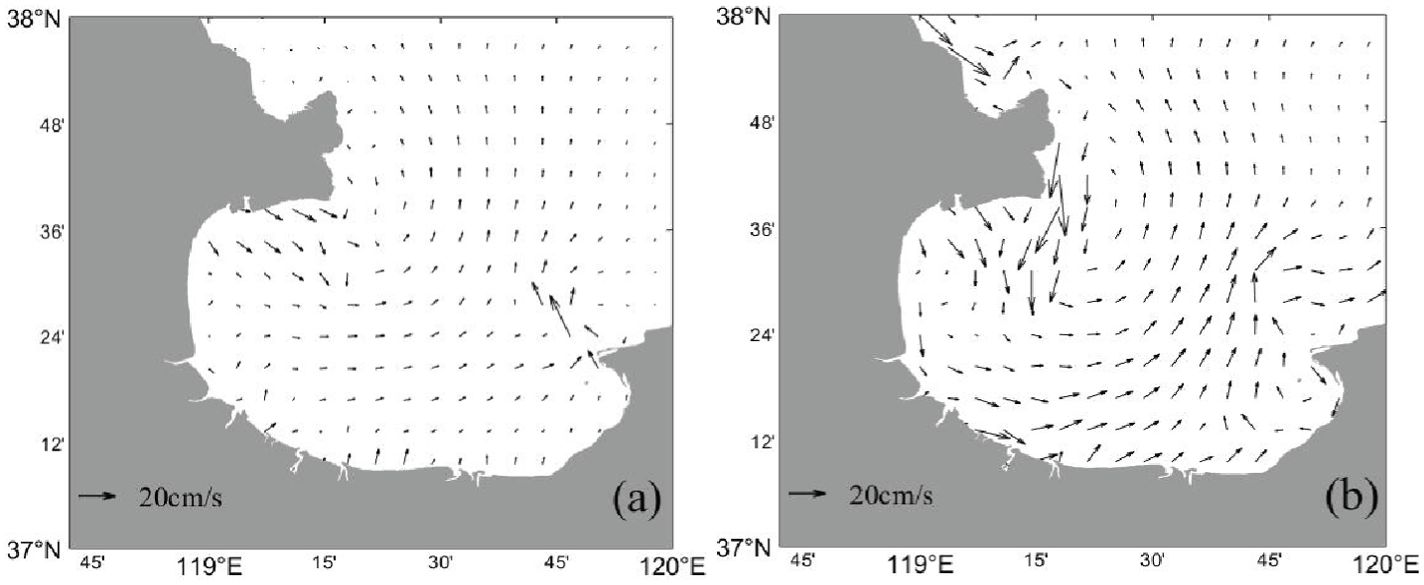
Figure 10. Euler residual current vector diagram [(A) No cold wave (B) Cold waves].
Additionally, we know that the erosion and deposition of riverbed sediments are closely related to bottom shear stress. Therefore, Figure 11 illustrates the bed shear stress near the YRD under conditions with and without cold waves. From the figure, we can observe that in the absence of cold waves, the shear stress in the nearshore area of the YRD is generally around 0.2 N/m², with only the current river mouth and a few other places reaching up to 0.4 N/m². In contrast, under cold wave conditions, the shear stress in the nearshore area of the YRD and northern Laizhou Bay is generally around 0.5 N/m². Areas with high shear stress are more prone to erosion and deposition. As seen in Figure 12, the regions where erosion and deposition increase during cold waves correspond to areas with high shear stress. Therefore, monitoring changes in shear stress in the nearshore areas of the Yellow River Delta is an important measure for addressing erosion and deposition in this region.
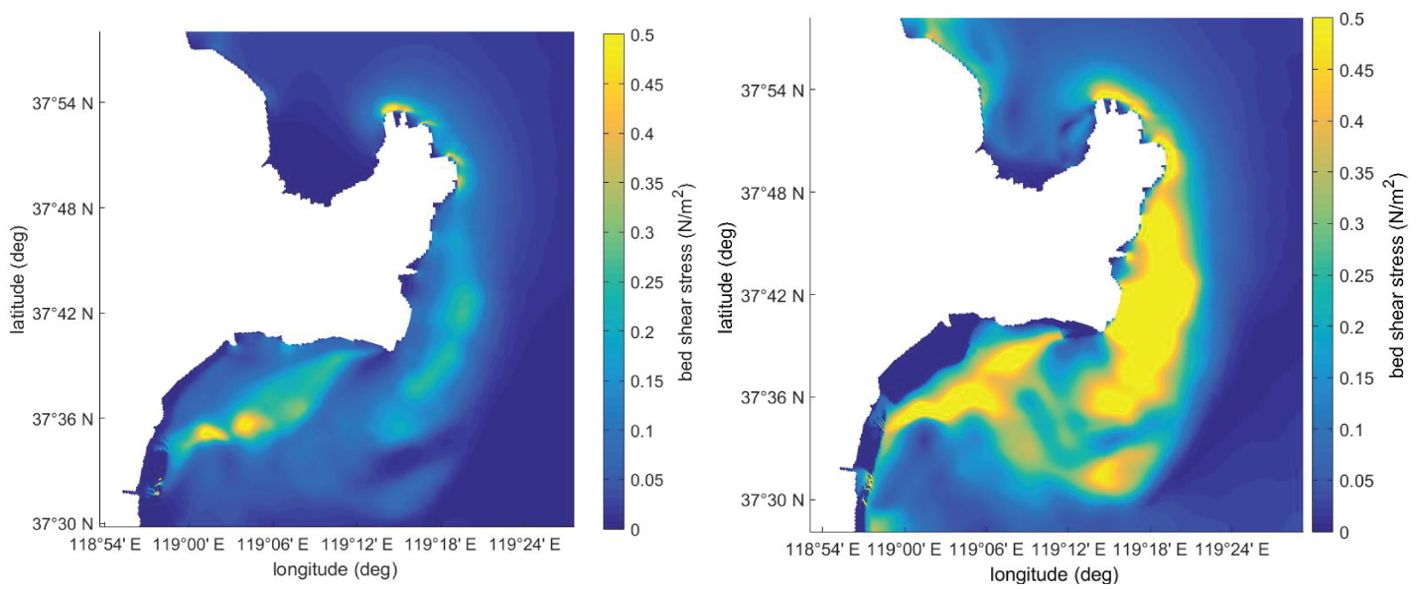
Figure 11. Shear stress maps near the Yellow River delta with or without cold wave ((left)No cold wave (right) Cold waves).
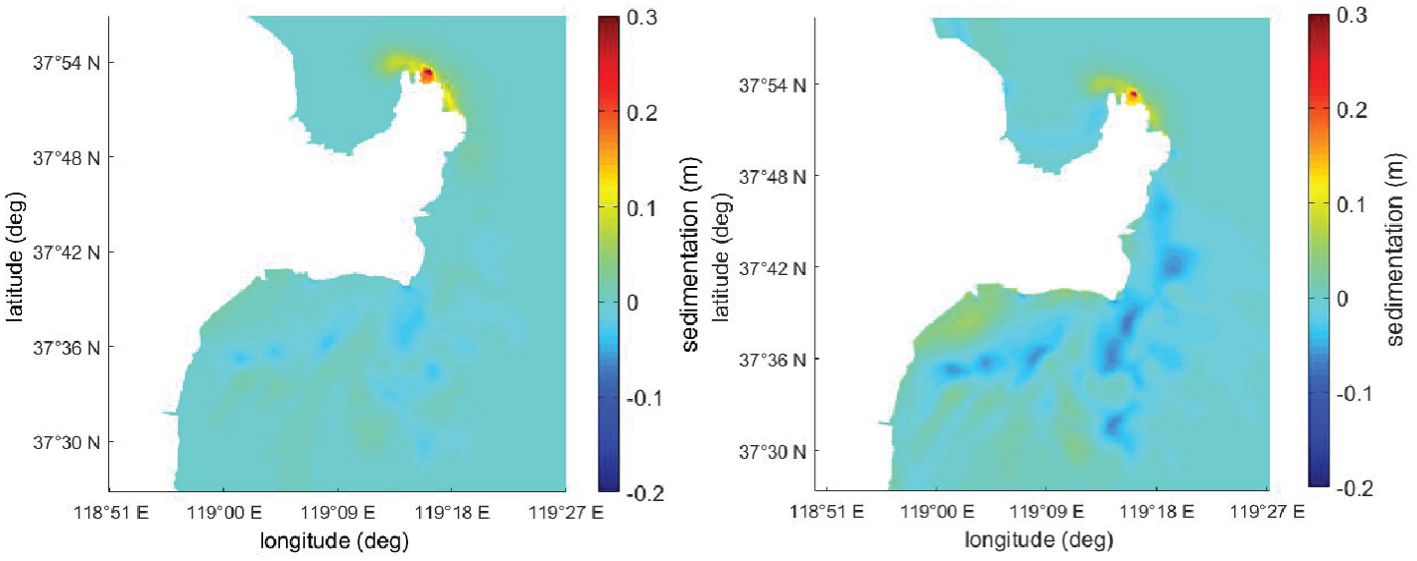
Figure 12. Map of sediment erosion and deposition in Yellow River delta region [No cold wave (left) Cold wave (right)].
5.3 Erosion and deposition analysis results
During the numerical simulation of the cold wave at the end of November 2022, sediment deposition and erosion in the YRD region are depicted in Figure 12. The area around the current YR estuary generally exhibits a state of deposition, with the severity of deposition increasing closer to the estuary, where maximum sediment accumulation can exceed 0.2 m. In contrast, near the old YR estuary, the area shows a state of erosion, which becomes more severe closer to the shore, with maximum erosion reaching up to 0.1 m. Residual currents near the north of the current YR estuary rotate counterclockwise, causing sediments carried by the YR to deposit in the north, leading to a gradual northern expansion of the YRD. Near the old YR estuary, where there is no sediment input, the residual current direction is clockwise, resulting in erosion around this area, while slight deposition occurs in the northwest part of Laizhou Bay. Additionally, due to the influence of strong winds and waves during the cold wave period, the flow velocity in the Yellow River Delta region undergoes changes. Consequently, the shear stress in this area also experiences corresponding variations. In regions where the shear stress is high, sediments are more likely to become suspended. Under the influence of the water flow in this sea area, erosion occurs in the region of the old Yellow River mouth, while slight siltation is observed at the current estuary. During the cold wave, overall deposition near the north of the current YR estuary is similar to that during periods without a cold wave, with maximum deposition around 0.2 m. However, the southeast part of the old YR estuary, influenced by increased flow speeds, experiences significantly more extensive and intense erosion compared to non-cold wave conditions—erosion measures about 0.05 m without a cold wave and about 0.1 m with one. Additionally, the degree of deposition in the northwest part of Laizhou Bay also increases, exceeding levels observed without a cold wave. Therefore, during cold waves, rapid scouring may occur to the east and southeast of the old YR estuary, increasing the depth of erosion. Furthermore, besides potential rapid deposition near the northwest of the current river estuary, the coastal areas in the northwest part of Laizhou Bay should also be closely monitored, as rapid deposition events may also occur there.
We also simulated different wind speeds under a northwesterly direction. Figure 13A illustrates the scouring and silting conditions under natural conditions without wind. Figure 13B shows the scouring and silting conditions under wind conditions at level 6. Figure 13C represents the scouring and silting conditions under wind conditions at level 7. Figure 13D depicts the scouring and silting conditions under wind conditions at level 8. The results show that the greater the wind speed, the more severe the erosion and deposition, especially at the old YR estuary. Compared to conditions without wind and waves, not only did the erosion area expand, but the erosion depth also increased, with the most severe erosion reaching up to 0.2 meters. Additionally, we observed a slight increase in deposition on the northern side of the current estuary, which is not very significant. However, on the western side of the current estuary, the impact of northwesterly wind waves led to a noticeable increase in erosion. Both the erosion area and depth increased, with the most severe erosion reaching around 0.15 meters. Additionally, Figure 13C shows the geomorphological changes in the YRD under a northwesterly wind of force 7, which is similar to the wind strength during the cold wave, except without the influence of cold high pressure. It can be observed that compared to the changes during the cold wave, the erosion in the northern region of the old Yellow River mouth is reduced, while there is a slight increase in erosion in the southern region.
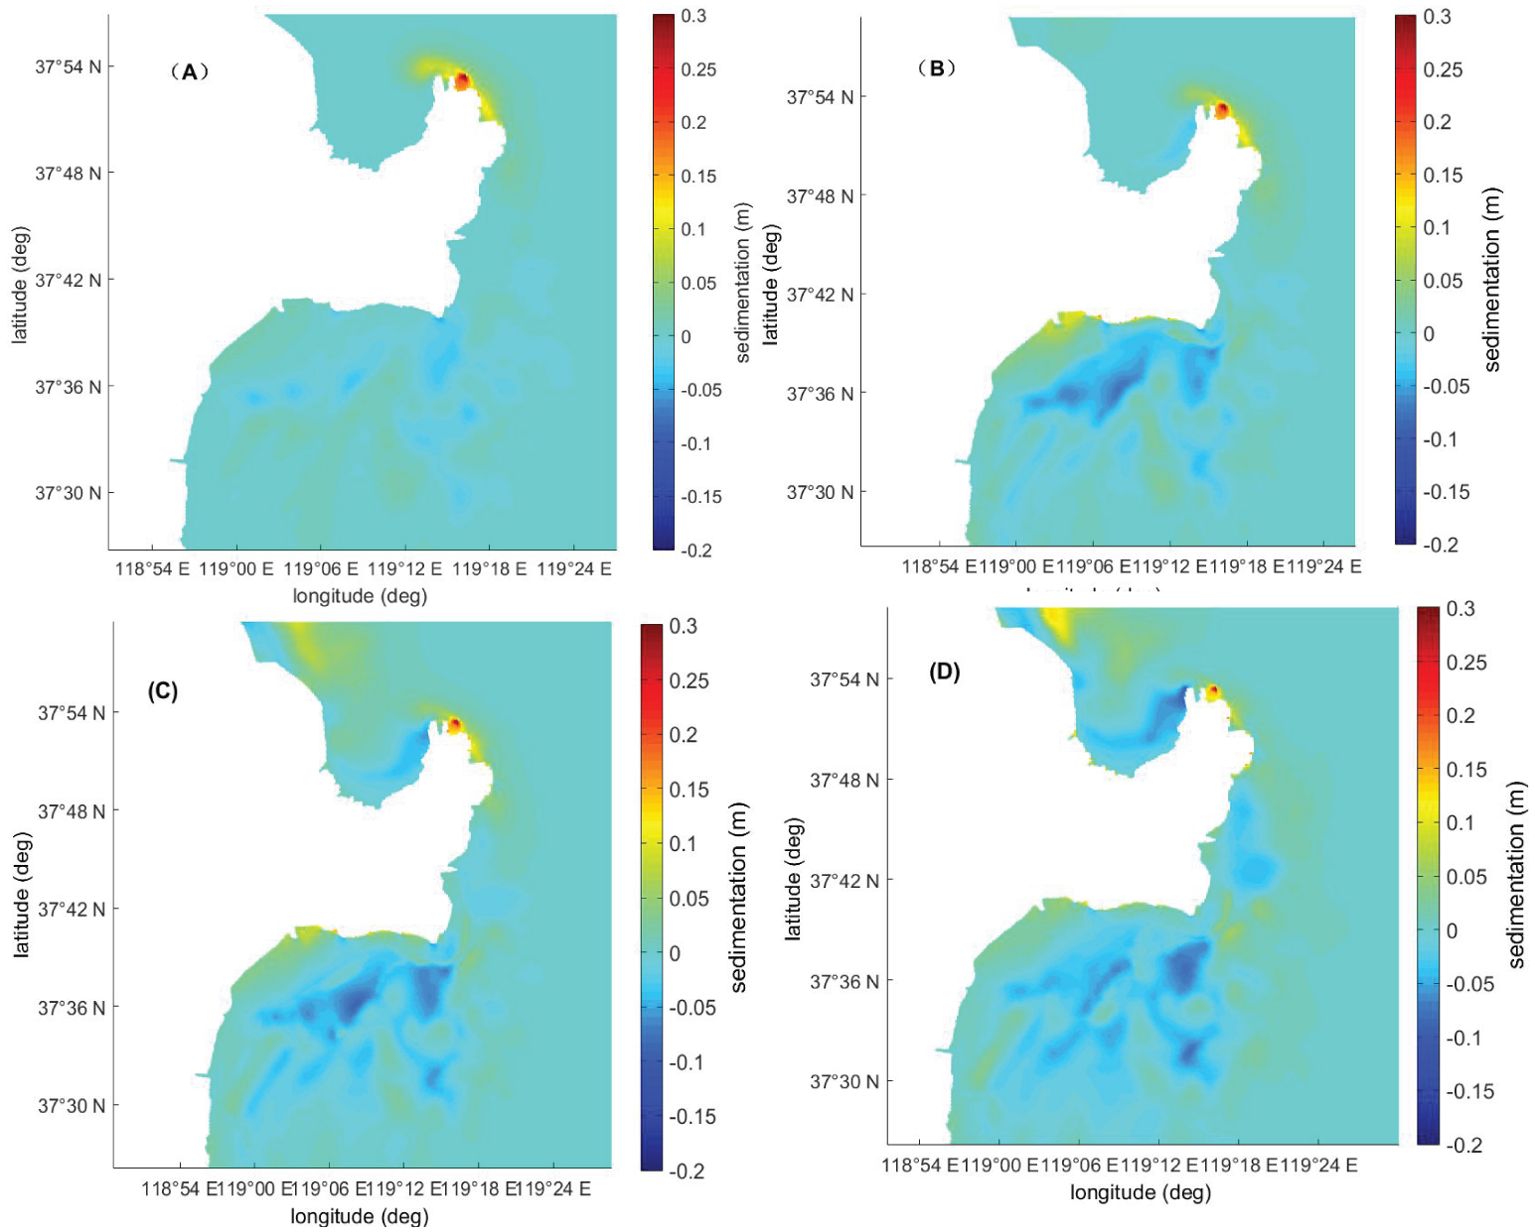
Figure 13. Sediment erosion and deposition map of Yellow River delta under different wind levels [(A) No wind (B) Wind at level 6 situation (C) Wind at level 7 situation (D) Wind at level 8 situation].
6 Discussions and conclusions
6.1 Discussions
This study focuses on the strong cold wave that passed through the YRD region at the end of November 2022, investigating its impact on the hydrodynamics and sediment transport in the area. The current river estuary of the YRD is in a state of deposition, while the old YR estuary is undergoing erosion. These findings align with the results of research by Li et al. (2021b), Fu et al. (2023) and Ji et al. (2024) Moreover, Figure 10 illustrates that the degree of scouring at the old YR estuary during the cold wave was indeed more severe than during periods without a cold wave, highlighting a critical area of concern during cold wave events. Unlike low-pressure cyclones of typhoons, cold waves are formed by strong winds coupled with high-pressure anticyclones. This study simulates cold waves by coupling wind data and atmospheric pressure data. During cold waves, the dramatic changes in atmospheric pressure impact hydrodynamics and the marine environment. Cold waves are typically accompanied by intense high-pressure systems, where a sudden rise in pressure triggers a series of hydrodynamic responses. The increase in atmospheric pressure compresses seawater, causing sea levels to drop. This pressure effect, opposite to the sea level rise caused by decreased atmospheric pressure. This effect is particularly evident during cold waves when the high-pressure system causes a short-term drop in sea level in coastal and offshore areas, resulting in negative sea level anomalies (Mo et al., 2016). The rise in water level observed in Figure 9 is due to the combined effects of atmospheric pressure and wind waves. Without the influence of atmospheric pressure, the increase in water level at the shore would be even more pronounced. Additionally, the geomorphology changes in the Yellow River Delta from Figure 13C compared to the cold wave condition, it can be seen that the impact of atmospheric pressure on this region is relatively weak. Typically, atmospheric pressure affects sediment transport in conjunction with waves. The influence of atmospheric pressure alone on sediment transport is limited. Therefore, this study examines the sediment erosion and deposition changes in the YR estuary during cold wave weather, driven by the combined effects of cold wave winds, atmospheric pressure, and waves. Unlike previous studies that solely investigated the impact of constant waves or directional winds on estuary deltas, this study provides a more comprehensive analysis. It offers important references for addressing sudden erosion and deposition changes under cold wave conditions in the future.
Previously, Zhang et al. (2016), observed that sediments at the old YR estuary serve as a source of sand transported to other areas. This study corroborates this finding, identifying the old YR estuary as the site of the most severe scouring, with limited sand replenishment and significant residual currents. Consequently, sands at this location are easily transported elsewhere, exacerbating erosion in the area. Moreover, Zhang et al. (2023) used Delft3D to study the changes in sedimentation and erosion in the YRD from 2009 to 2019. However, their research focused solely on sediment transport under tidal influences, without considering the impact of specific conditions such as cold waves and strong winds. In contrast, this paper takes into account the effects of cold wave weather, qualitatively studying its impacts on the sediment dynamics of the YRD. It was found that cold waves intensify the erosion at the old YR estuary, complementing the temporal scale studies and indicating a persistent state of erosion at this site.
Dong et al. (2020) used numerical models to simulate the changes in surface suspended sediment concentrations in the YRD region, illustrating the shaping effects of tides and waves on the geomorphological evolution of the YRD during different periods. Wang et al. (2019) studied the impact of northward, southward, and eastward waves on the erosion and deposition of the YRD, finding that northward and eastward waves caused the most severe erosion at the old YR estuary, while southward waves had the least impact. In this study, the simulated cold wave process features a northwesterly wind direction. Additionally, we simulated the erosion and deposition conditions in the YRD region under northwesterly winds of Beaufort scale 6, 7, and 8. The results show varying degrees of erosion at both the old and current estuaries, with the extent of erosion increasing with wind force. The northwesterly wind and waves cause significant erosion, with stronger winds leading to more severe erosion in the YRD region. Due to the northwesterly wind direction during this cold wave, the old YR estuary experienced substantial erosion. After the cold wave, there was extensive erosion at the old YR estuary, with the most severely eroded areas exceeding 0.1 meters. Additionally, there was deposition of approximately 0.05-0.1 meters near the eroded areas. As the wind force increased, the nearshore area from the current estuary to the old estuary showed more significant deposition. These findings align with the results of Dong et al. and Wang et al., effectively revealing the role of wind and waves in the evolution of the YRD region. Therefore, it is crucial to focus on the old YR estuary area and the nearshore area south of the current estuary during cold waves to prevent sudden erosion and deposition phenomena.
It is important to note that the YR experiences two low-water seasons annually. The first extends from December to February, when entering winter, both the reduced inflow from the head waters reaches and the increased water storage in upstream reservoirs contribute to a decreased flow in the river. The second low-water season occurs from May to July, during which drought and limited rainfall in the upstream regions further reduce the river’s flow. The cold wave process studied in this article took place at the end of November. The sediment input data used were average values from the “Yellow River Sediment Bulletin,” lacking more precise data on sediment transport. Consequently, the levels of sediment input during different periods may vary. If a cold wave were to occur during the low-water months of January and February, the extent of erosion and sedimentation in the YRD might differ from what was observed in this study. At the same time, the study by Mo et al. (2018) shows that cold wave paths can be categorized into the west path, northwest path, and north path. The main wind directions for these three paths can be divided into two types: northwesterly winds and northeasterly gales. This paper takes northwesterly gales under the northwest path cold wave as an example to simulate and analyze the sediment erosion and deposition in the YRD region, providing a reference for the YRD to cope with the disastrous weather of northwest path cold waves. I believe that these results can also offer significant reference value for cold waves under the influence of northeasterly gales, as the sediment erosion and deposition in the delta will be more severe, although the impact range of the cold wave process under northeasterly gales may differ. Therefore, future research will need to explore a broader range of cold wave scenarios to enhance the Yellow River Delta’s resilience against cold waves occurring at different times and different paths, providing more informed recommendations for the preservation of the delta’s stability.
6.2 Conclusions
This research offers an in-depth examination of the influence of cold waves on the morphodynamic alterations in the YRD, revealing the significant role that cold wave weather processes play in the erosion and deposition phenomena in estuarine regions. Cold waves, characterized by typical cold air activity, often bring about sharp temperature decreases and strong wind events, profoundly affecting the sensitive estuarine area of the YRD. Utilizing the Delft3D numerical simulation software, this paper developed a numerical model of the morphodynamic changes at the YR estuary. The model simulated a strong cold wave event in November 2022 to explore its impact on the deposition and erosion dynamics within the YRD region.
The research results indicate that during the cold wave process, the combined effects of strong winds and waves significantly raised the water levels in the nearshore areas of the YRD. This increase in water levels, along with higher flow speeds, led to a marked intensification of erosion and deposition phenomena. Particularly near the old YR estuary, the intense changes in flow velocity brought by the cold wave cause severe scouring. Additionally, this study conducted a comparative analysis of tidal characteristics and residual current fields under conditions with and without a cold wave. This analysis revealed that changes in the direction and intensity of residual currents during the cold wave process have a direct impact on the erosion and deposition changes at the estuary, further confirming the significant influence of cold waves on the morphodynamic evolution of the YRD.
Moreover, this study not only provides a scientific basis for understanding the mechanisms behind the morphodynamic changes in the YRD during cold wave processes but also offers important theoretical support for disaster prevention, mitigation, and sustainable growth in estuarine regions. Considering the continual effects of climate change and human actions, there is a need to further strengthen research on the morphodynamic responses of sensitive regions like the YRD to extreme weather events. This is crucial for the scientific management and protection of estuarine ecological environments, ensuring the socio-economic security of estuarine regions, and offering a more extensive scientific foundation for ecological conservation and sustainable development in the region.
Data availability statement
The raw data supporting the conclusions of this article will be made available by the authors, without undue reservation.
Author contributions
HS: Conceptualization, Funding acquisition, Supervision, Writing – original draft, Writing – review & editing. PM: Software, Writing – original draft, Writing – review & editing. JS: Data curation, Formal analysis, Writing – review & editing. SZ: Formal analysis, Methodology, Writing – review & editing. RM: Data curation, Writing – review & editing. LL: Data curation, Formal analysis, Writing – review & editing. CZ: Conceptualization, Formal analysis, Funding acquisition, Writing – review & editing. HL: Data curation, Writing – review & editing.
Funding
The author(s) declare financial support was received for the research, authorship, and/or publication of this article. This research was funded by National key research and development plan project (2023YFC3007900, 2023YFC3007905) and the Major Research Grant (42330406) from the Natural Science Foundation of China (NSFC) and Yantai Science and Technology Innovation Project (2023JCYJ097,2023JCYJ094) and Supported by the Innovation Project for graduate students of Ludong University (119-810201).
Conflict of interest
Author HS was employed by Yantai Kekan Marine Technology Co., Ltd. The remaining authors declare that the research was conducted in the absence of any commercial or financial relationships that could be construed as a potential conflict of interest.
Publisher’s note
All claims expressed in this article are solely those of the authors and do not necessarily represent those of their affiliated organizations, or those of the publisher, the editors and the reviewers. Any product that may be evaluated in this article, or claim that may be made by its manufacturer, is not guaranteed or endorsed by the publisher.
References
Chen J., Chen S. (2002). Estuarine and coastal challenges in China. Chin. J. Oceanol. Limnol. 20, 174–181. doi: 10.1007/BF02849656
Ding Y. (1990). Build-up, air mass transformation and propagation of Siberian high and its relations to cold surge in East Asia. Meteorol. Atmos. Phys. 44, 281–292. doi: 10.1007/BF01026822
Dong C., Zhan C., Lin Z., Yi F., Zhu J., Shi H., et al. (2020). Numerical study on the difference in geomorphic dynamics between current and abandoned estuarine coasts of the yellow river delta. J. Coast. Res. 99, 227–235. doi: 10.2112/SI99-033.1
Draxler R. R., Hess G. D. (1998). An overview of the HYSPLIT_4 modelling system for trajectories. Aust. meteorol. magazine 47, 295–308. doi: 239061109
Fan Y., Chen S., Pan S., Dou S. (2020). Storm-induced hydrodynamic changes and seabed erosion in the littoral area of Yellow River Delta: A model-guided mechanism study. Continent. Shelf Res. 205, 104171. doi: 10.1016/j.csr.2020.104171
Fang Y., Lin Y., Zhao C., Xu S., Lin Y., Yu Y. (2022). Two types of cold waves affecting northeast China and the corresponding different key regions of precedent sea ice and sea surface temperature. Int. J. Climatol. 42, 10451–10463. doi: 10.1002/joc.7917
Fu Y. (2023). Morphodynamics and its dynamic mechanism in the Yellow River Delta. Shanghai, China: East China Normal University.
Fu Y., Bellerby R. G.J., Ji H., Chen S., Fan Y., Li. P. (2023). Impacts of riverine floods on morphodynamics in the Yellow River Delta. Water 15, 1568. doi: 10.3390/w15081568
Fu Y., Chen S., Ji H., Fan Y., Li P. (2021). The modern Yellow River Delta in transition: Causes and implications. Mar. Geol. 436, 106476. doi: 10.1016/j.margeo.2021.106476
Gao F., Li G. X., Qiao L. L. (2012). Resource assessment of the tidal energy around the Shandong Peninsula. Period. Ocean Univ. China 42, 91–96. doi: 10.1007/s11783-011-0280-z
Guillou N., Neill S. P., Robins P. E. (2018). Characterising the tidal stream power resource around France using a high-resolution harmonic database. Renewable Energy 123, 706–718. doi: 10.1016/j.renene.2017.12.033
Hopley C. A., Jones B. G. (2022). Holocene evolution and depositional model of a bayhead delta, Lake Illawarra, Australia. Sedimentology 69, 1927–1952. doi: 10.1111/sed.12980
Hu P., Wang L., Li Z., Zhu H., Tang H. (2018). Numerical simulation of the interaction between phosphorus and sediment based on the modified langmuir equation. Water 10, 840. doi: 10.3390/w10070840
Huang L., Chen S., Pan S., Li P., Ji H. (2022). Impact of storm surge on the yellow river delta: simulation and analysis. Water 14, 3439. doi: 10.3390/w14213439
Ji H., Chen S., Li P., Pan S., Gong X., Jiang C. (2024). Spatiotemporal variability of suspended sediment concentration in the coastal waters of Yellow River Delta: Driving mechanism and geomorphic implications. Mar. Geol. 470, 107266. doi: 10.1016/j.margeo.2024.107266
Ji H., Chen S., Pan S., Xu C., Tian Y., Li P., et al. (2022). Fluvial sediment source to sink transfer at the Yellow River Delta: Quantifications, causes, and environmental impacts. J. Hydrol. 608, 127622. doi: 10.1016/j.jhydrol.2022.127622
Kuenzer C., Renaud F. G. (2012). “Climate and environmental change in river deltas globally: expected impacts, resilience, and adaptation,” in The Mekong delta system: Interdisciplinary analyses of a river delta (Springer Netherlands, Dordrecht), 7–46.
Li Z. G., Li C. X. (2015). Basic strategies of estuary harness of the Yellow River.YELLOW RIVER. 3, 4–7. doi: 10.3969/j.issn.1000-1379.2015.03.002
Li L., Ni W., Li Y., Guo D., Gao H. (2021a). Impacts of sea surface temperature and atmospheric teleconnection patterns in the northern mid-latitudes on winter extremely cold events in North China. Adv. Meteorol. 2021, 1–15. doi: 10.1155/2021/8853457
Li C., Zhu L., Dai Z., Wu Z. (2021b). Study on spatiotemporal evolution of the Yellow River Delta coastline from 1976 to 2020. Remote Sens. 13, 4789. doi: 10.3390/rs13234789
Liu H. X., Li D. J., Gao L., Wang W. W., Chen W. Q. (2012). Study on main influencing factors of formation and deterioration of summer hypoxia off the Yangtze River Estuary. Adv. Mar. Sci. 30, 186–197. doi: 10.3969/j.issn.1671-6647.2012.02.004
Lu Y., Hua F., Wei Z., Fan B. (2008). Preliminary analysis on residual current along the section across the Jiaozhou Bay mouth. Adv. Mar. Sci. 26, 305–316. doi: 10.3969/j.issn.1671-6647.2008.03.005
Luan H. L., Ding P. X., Wang Z. B., Ge J. Z. (2017). Process-based morphodynamic modeling of the Yangtze Estuary at a decadal timescale: Controls on estuarine evolution and future trends. Geomorphology 290, 347–364. doi: 10.1016/j.geomorph.2017.04.016
Marengo J., Cornejo A., Satyamurty P., Nobre C., Sea W. (1997). Cold surges in tropical and extratropical South America: The strong event in June 1994. Month. Weather Rev. 125, 2759–2786. doi: 10.1175/1520-0493(1997)125<2759:CSITAE>2.0.CO;2
Mo D., Hou Y., Li J., Liu Y. (2016). Study on the storm surges induced by cold waves in the Northern East China Sea. J. Mar. Syst. 160, 26–39. doi: 10.1016/j.jmarsys.2016.04.002
Nienhuis J. H., Ashton A. D., Edmonds D. A., Hoitink A. J. F., Kettner A. J., Rowland J. C., et al. (2020). Global-scale human impact on delta morphology has led to net land area gain. Nature 577, 514–518. doi: 10.1038/s41586-019-1905-9
Shi H., Cao X., Li Q., Li D., Sun J., You Z., et al. (2021). Evaluating the accuracy of ERA5 wave reanalysis in the water around China. J. Ocean Univ. China 20, 1–9. doi: 10.1007/s11802-021-4496-7
Stein A. F., Draxler R. R., Rolph G. D., Stunder B. J., Cohen M. D., Ngan F. (2015). NOAA’s HYSPLIT atmospheric transport and dispersion modeling system. Bull. Am. Meteorol. Soc. 96, 2059–2077. doi: 10.1175/BAMS-D-14-00110.1
Thanh V. Q., Reyns J., Van S. P., Anh D. T., Dang T. D., Roelvink D. (2019). Sediment transport and morphodynamical modeling on the estuaries and coastal zone of the Vietnamese Mekong Delta. Continent. Shelf Res. 186, 64–76. doi: 10.1016/j.csr.2019.07.015
Van Oldenborgh G. J., Mitchell-Larson E., Vecchi G. A., De Vries H., Vautard R., Otto F. (2019). Cold waves are getting milder in the northern midlatitudes. Environ. Res. Lett. 14, 114004. doi: 10.1088/1748-9326/ab4867
Ve N. D., Fan D., Van Vuong B., Lan T. D. (2021). Sediment budget and morphological change in the Red River Delta under increasing human interferences. Mar. Geol. 431, 106379. doi: 10.1016/j.margeo.2020.106379
Wang Z. F., Cao X. D., Li Q. J., Liu Y. L. (2019). The impact of surface wave on the sediment erosion and deposition near the yellow river mouth, China. Appl. Ecol. Environ. Res. 17, 6–22. doi: 10.15666/AEER/1706_1491114926
Wang N., Li K., Song D., Bi N., Bao X., Liang S., et al. (2024). Impact of tidal shear fronts on terrigenous sediment transport in the Yellow River Mouth: Observations and a synthesis. Mar. Geol. 469, 107222. doi: 10.1016/j.margeo.2024.107222
Wang Z. Y., Liang Z. Y. (2000). Dynamic characteristics of the Yellow River mouth. Earth Surf. Process. Landforms: J. Br. Geomorphol. Res. Group 25, 765–782. doi: 10.1002/1096-9837(200007)25:73.0.CO;2-K
Wang Q., Zeng L., Zhan C., Liu X., Wang L., Cheng S., et al. (2022). Geomorphologic evolution of the shallow-buried abandoned Yellow River delta during the last 2000 years. Front. Mar. Sci. 9, 1073961. doi: 10.3389/fmars.2022.1073961
Wang Z., Zhou L., Li Q., Sun X. (2017). Storm surge along the Yellow River Delta under directional extreme wind conditions. J. Coast. Res. 80), 86–91. doi: 10.2112/SI80-012.1
Willmott C. (1981). On the validation of models. Phys. Geogr. 2, 184–194. doi: 10.1080/02723646.1981.10642213
Xie W., Wang X., Guo L., He Q., Dou S., Yu X. (2021). Impacts of a storm on the erosion process of a tidal wetland in the Yellow River Delta. Catena 205, 105461. doi: 10.1016/j.catena.2021.105461
Yang Z., Lu X. H., Guo X., Liu Y., Shen L. (2017). Numerical simulation of sediment suspension and transport under plunging breaking waves. Comput. Fluids 158, 57–71. doi: 10.1016/j.compfluid.2017.03.014
Zhang L., Chen S., Yi L. (2016). The sediment source and transport trends around the abandoned YellowRiver delta, China. Mar. Geores. Geotechnol. 34, 5–19. doi: 10.1080/1064119X.2015.1025928
Zhang L., Shi H., Xing H., Li P., Ma P. (2023). Analysis of the evolution of the Yellow River Delta coastline and the response of the tidal current field. Front. Mar. Sci. 10, 1232060. doi: 10.3389/fmars.2023.1232060
Keywords: Yellow River delta, cold wave process, dynamic landform, numerical simulation, disaster prevention and mitigation
Citation: Shi H, Ma P, Sun J, Zhao S, Ma R, Li L, Zhan C and Liang H (2024) Study on the response mechanism of the Yellow River delta region to the cold wave process. Front. Mar. Sci. 11:1430823. doi: 10.3389/fmars.2024.1430823
Received: 10 May 2024; Accepted: 05 August 2024;
Published: 30 August 2024.
Edited by:
Haosheng Huang, Louisiana State University, United StatesReviewed by:
Shenliang Chen, East China Normal University, ChinaWei Huang, Florida International University, United States
Copyright © 2024 Shi, Ma, Sun, Zhao, Ma, Li, Zhan and Liang. This is an open-access article distributed under the terms of the Creative Commons Attribution License (CC BY). The use, distribution or reproduction in other forums is permitted, provided the original author(s) and the copyright owner(s) are credited and that the original publication in this journal is cited, in accordance with accepted academic practice. No use, distribution or reproduction is permitted which does not comply with these terms.
*Correspondence: Hui Liang, bGh6eS4xOTg3QDE2My5jb20=