 Xiaolong Chen
 Qianbin Di1,2,3*
 Wenhan Jia
94% of researchers rate our articles as excellent or good
Learn more about the work of our research integrity team to safeguard the quality of each article we publish.
Find out more
ORIGINAL RESEARCH article
Front. Mar. Sci., 05 July 2024
Sec. Marine Conservation and Sustainability
Volume 11 - 2024 | https://doi.org/10.3389/fmars.2024.1430243
Research on the marine science and technology innovation efficiency (MSTE) from the perspective of innovation value chain is not only an inevitable requirement for in-depth exploration of Marine science and technology innovation activities, but also an important guidance for the sustainable development and optimization of marine economy. Based on the innovation value chain perspective, the marine science and technology innovation process is divided into three phases: basic innovation, applied research and development, and gainful transformation, and the chain network DEA model is used to measure the MSTE of 11 provinces and municipalities along the coast of China from 2007 to 2021; the modified gravity model and social network analysis are used to examine the spatial correlation network characteristics of the marine MSTE at different phases and their influencing factors. The results show that the spatial correlation of China marine MSTE gradually develops from a sparse and dispersed state to a close trend, and the three phases gradually show a development pattern from unicentre, polycentre and networked. There is no strict hierarchical structure in the spatial correlation network of marine MSTE, the applied research and development and revenue transformation phases are more relevant than the basic innovation phase, and the cross-regional collaborative innovation needs to be improved. The high-efficiency provinces have a strong ability to radiate the MSTE to other provinces, and can absorb a large amount of innovation resources. The spatial correlation network of MSTE development has formed four plates of two-way spillover, broker, net spillover and net benefit in all three phases, and the transmission of kinetic energy of regional MSTE development has obvious gradient characteristics. The strength of government support, marine industry structure, and marine management services are conducive to enhancing the spatial correlation of the three phases of innovation development. Through this study, we can not only grasp the overall pattern and development dynamics of China Marine science and technology innovation, but also deeply analyze the internal logic and formation mechanism of its spatial correlation network structure, so as to provide scientific basis for optimizing resource allocation and improving innovation efficiency.
The development of marine science and technology innovation is the most active and revolutionary factor to lead the new direction and new issues of global ocean governance and to promote the construction of a new order of the oceans (Wang et al., 2021a). In the 21st century, mankind has entered a period of large-scale exploitation and utilization of the oceans. Under the leadership of the Party Central Committee and the State Council, China’s marine science and technology is accelerating the transformation to innovation-led. The 18th CPC National Congress put forward the strategy of building a “strong marine country”, which guides and promotes the accelerated development of MSTE; the 19th CPC National Congress report put forward the idea of “adhering to the integration of land and sea, and accelerating the construction of a strong marine country”, which conforms to the development trend of our country and the world; the 20th CPC National Congress The report puts forward: “promote the modernization of the national security system and capacity, and resolutely safeguard national security and social stability”, a series of major decisions and deployments of the CPC Central Committee have reflected the importance of marine science and technology innovation and development, and marine science and technology innovation is becoming more and more prominent in the national science and technology pattern (Li et al., 2021). Although the national development of marine science and technology has achieved relatively rapid development, but facing scientific and technological innovation consciousness and ability is not strong, the shortage of senior skilled personnel in the marine field, the supply of marine scientific and technological achievements of poor quality and efficiency, marine scientific and technological achievements of the transformation of the institutional mechanism needs to be improved and other issues (Chen and Ma, 2020). MSTE affects the speed and quality of marine economic development, the construction of marine science and technology innovation system should not only focus on the input and supply quality of innovation resources, but also pay attention to the marine science and technology outputs and results transformation, especially in the case of a relatively scarce element of innovation resources, the efficiency problem is more important. Rational allocation of marine innovation resources, improving MSTE, identifying regional differences, and increasing the level of transformation of results are of great practical significance in alleviating the imbalance and inadequacy of regional economic development.
Traditional marine science and technology research involves multiple departments and disciplines, leading to the dispersion of scientific and technological resources, duplication of research activities and disorderly competition (Yu and Zou, 2020). With the rapid development and popularization of computers and transport facilities, the regional layout of China’s marine science and technology innovation field is undergoing profound changes. This change is gradually weakening the limitations of geographic space on innovation, accelerating the flow of innovative resource elements such as talents, funds, information, resources, etc., which has profoundly affected and changed the traditional way of marine science and technology innovation development (Wang et al., 2021b). With the continuous promotion of the regional coordinated development strategy, the marine science and technology innovation links between coastal areas have become increasingly close, and innovation cooperation and exchange have become more frequent. The spatial association of regional MSTE breaks the “influence of spatial proximity on the distribution of geographical phenomenon attributes”, and gradually forms a complex spatial association network relationship [6]. The traditional way of information and data exchange and sharing will, to some extent, inhibit the linkage development of MSTE (Chen et al., 2023a). Therefore, it is of great theoretical significance and practical value to accurately characterize the network structure and its evolution trend of the spatial correlation of MSTE, to reveal the status and role of each province in the network, and to analyze the influencing factors of the spatial correlation of the MSTE in order to strengthen the inter-regional scientific and technological innovation cooperation network, to promote the optimal allocation and flow of innovation resources, and to facilitate the linkage development of MSTE.
The strategic goal of building an ocean power has been incorporated into China’s national strategy, and the construction of an ocean power has risen to an unprecedented strategic height. Marine science and technology innovation is the key and key to the construction of ocean power, the rise of ocean power cannot be separated from the research and development of science and technology and the use of science and technology, to enhance the strength of MSTE, strengthen the regional synergy and linkage, and to promote the interaction and collaboration of different regions has become the world’s major coastal developed countries economic dominance and participation in the global ocean governance of the key initiatives (Liu and Wang, 2022), for this reason, it is necessary to China’s coastal MSTE of spatial correlation network for systematic research. Based on the perspective of innovation value chain, this paper divides the marine science and technology innovation process into basic innovation phase, applied research and development phase, and gainful transformation phase, and applies the chain DEA model to scientifically and accurately measure the MSTE in coastal provinces and cities; at the same time, it conducts a systematic research on the spatial correlation network of the MSTE. How are the characteristics and evolution trend of the spatial correlation network of the MSTE? What are the characteristics and evolution trend of the spatial correlation network of MSTE in China? What is the position and role of each region in the spatial correlation network of MSTE? What are the factors affecting the formation of the spatial network? The study of the above questions will help to identify the problems existing in the process of China’s MSTE development in the process of building a strong marine power strategy, and provide policy references for optimizing the spatial correlation network of MSTE, constructing a cross-regional mechanism for improving MSTE, and implementing the innovation-driven strategy.
Innovation value chain theory is a comprehensive theory, which not only covers the research content of technological innovation, but also combines the value chain theory, organically combines the two together, emphasizes the importance of value creation and transfer in the process of technological innovation, and highlights the value attributes that technological innovation has (Zhang and Wang, 2021). Technological innovation is not only a technical process, but also a value creation process, involving the entire process from the initial idea to the final product or service, and every link in this process is closely linked to value creation and transfer; at the same time, the innovation value chain theory also emphasizes the interactions and influences between different links, as well as their impact on the final value creation (Liu et al., 2022). By combining technological innovation with value chain theory, innovation value chain theory provides us with a more comprehensive and in-depth understanding of the process and mechanism of technological innovation (Hu et al., 2022). In practice, the innovation value chain theory can help enterprises better manage and optimize their own value chains, and improve their productivity and profitability; at the same time, it can also help policy makers formulate scientific and effective policies to promote the sustainable development of enterprises and society (Ganotakis and Love, 2012).
Currently, when many scholars use the innovation value chain theory to assess the efficiency of science and technology innovation, they focus on the division of the phases of the innovation value chain. It mainly includes two-phase and three-phase innovation value chains. In terms of the two-phase innovation value chain, Roper et al. (2008) believe that the recursive process of knowledge sourcing, transformation and utilization constitutes the innovation value chain, divide the innovation process into two phases of knowledge collection and exploitation, and emphasize the role of skills, capital investment and other resources of the firm in the value creation process. Carayannis et al. (2015) break down the innovation process in into two key phases, the first phase is knowledge production, which involves the creation and exploration of new ideas, concepts, technologies or solutions; and the second phase is knowledge transformation, which involves transforming the knowledge that has been produced into actual products, services or practices. Based on the innovation value chain perspective, Liu et al. (2020) divided the innovation process into the knowledge condensation phase and the market transformation phase, and used the network DEA-SBM model to analyze China’s inter-provincial total innovation efficiency and two-phase efficiency. In terms of three-phase innovation value chain, Hansen and Birkinshaw (2007) were the first to put forward the concept of innovation value chain, which divides the innovation process into the generation of ideas, the transformation of ideas and the dissemination of ideas, providing a new way of thinking for the study of the value of innovation. Taghizadeh et al. (2014) believe that the innovation value chain has three important phases, namely, the creation, transformation and dissemination of knowledge and ideas, and empirically analyze the total efficiency of inter-provincial innovation and the two-phase efficiency in China using the network DEA-SBM model and ideas in three important phases, and empirically explore the impact of innovation strategy of innovation value chain on technological innovation. Based on the framework of innovation value chain analysis, Liu and Kan (2011) explored the chain relationship between knowledge source, knowledge output and scientific and technological achievements transformation performance. In addition, there are also scholars put forward the concept of “open innovation”, which believes that enterprises should pay more attention to the use of external resources to carry out innovation, and classify the process of technological innovation (Chen et al., 2024a; Haschka and Herwartz, 2020).
In summary, the criteria for dividing and articulating the phases of the innovation value chain theory vary from time to time and from need to need. Scholars have proposed different division methods based on different theoretical frameworks and practical needs. However, regardless of the division method, the core idea of the innovation value chain theory is the same: to achieve the organic combination of technological innovation and business value by breaking down the process of technological innovation into a number of interconnected phases and implementing systematic analysis. This paper makes a collation of the relevant literature as shown in Table 1.
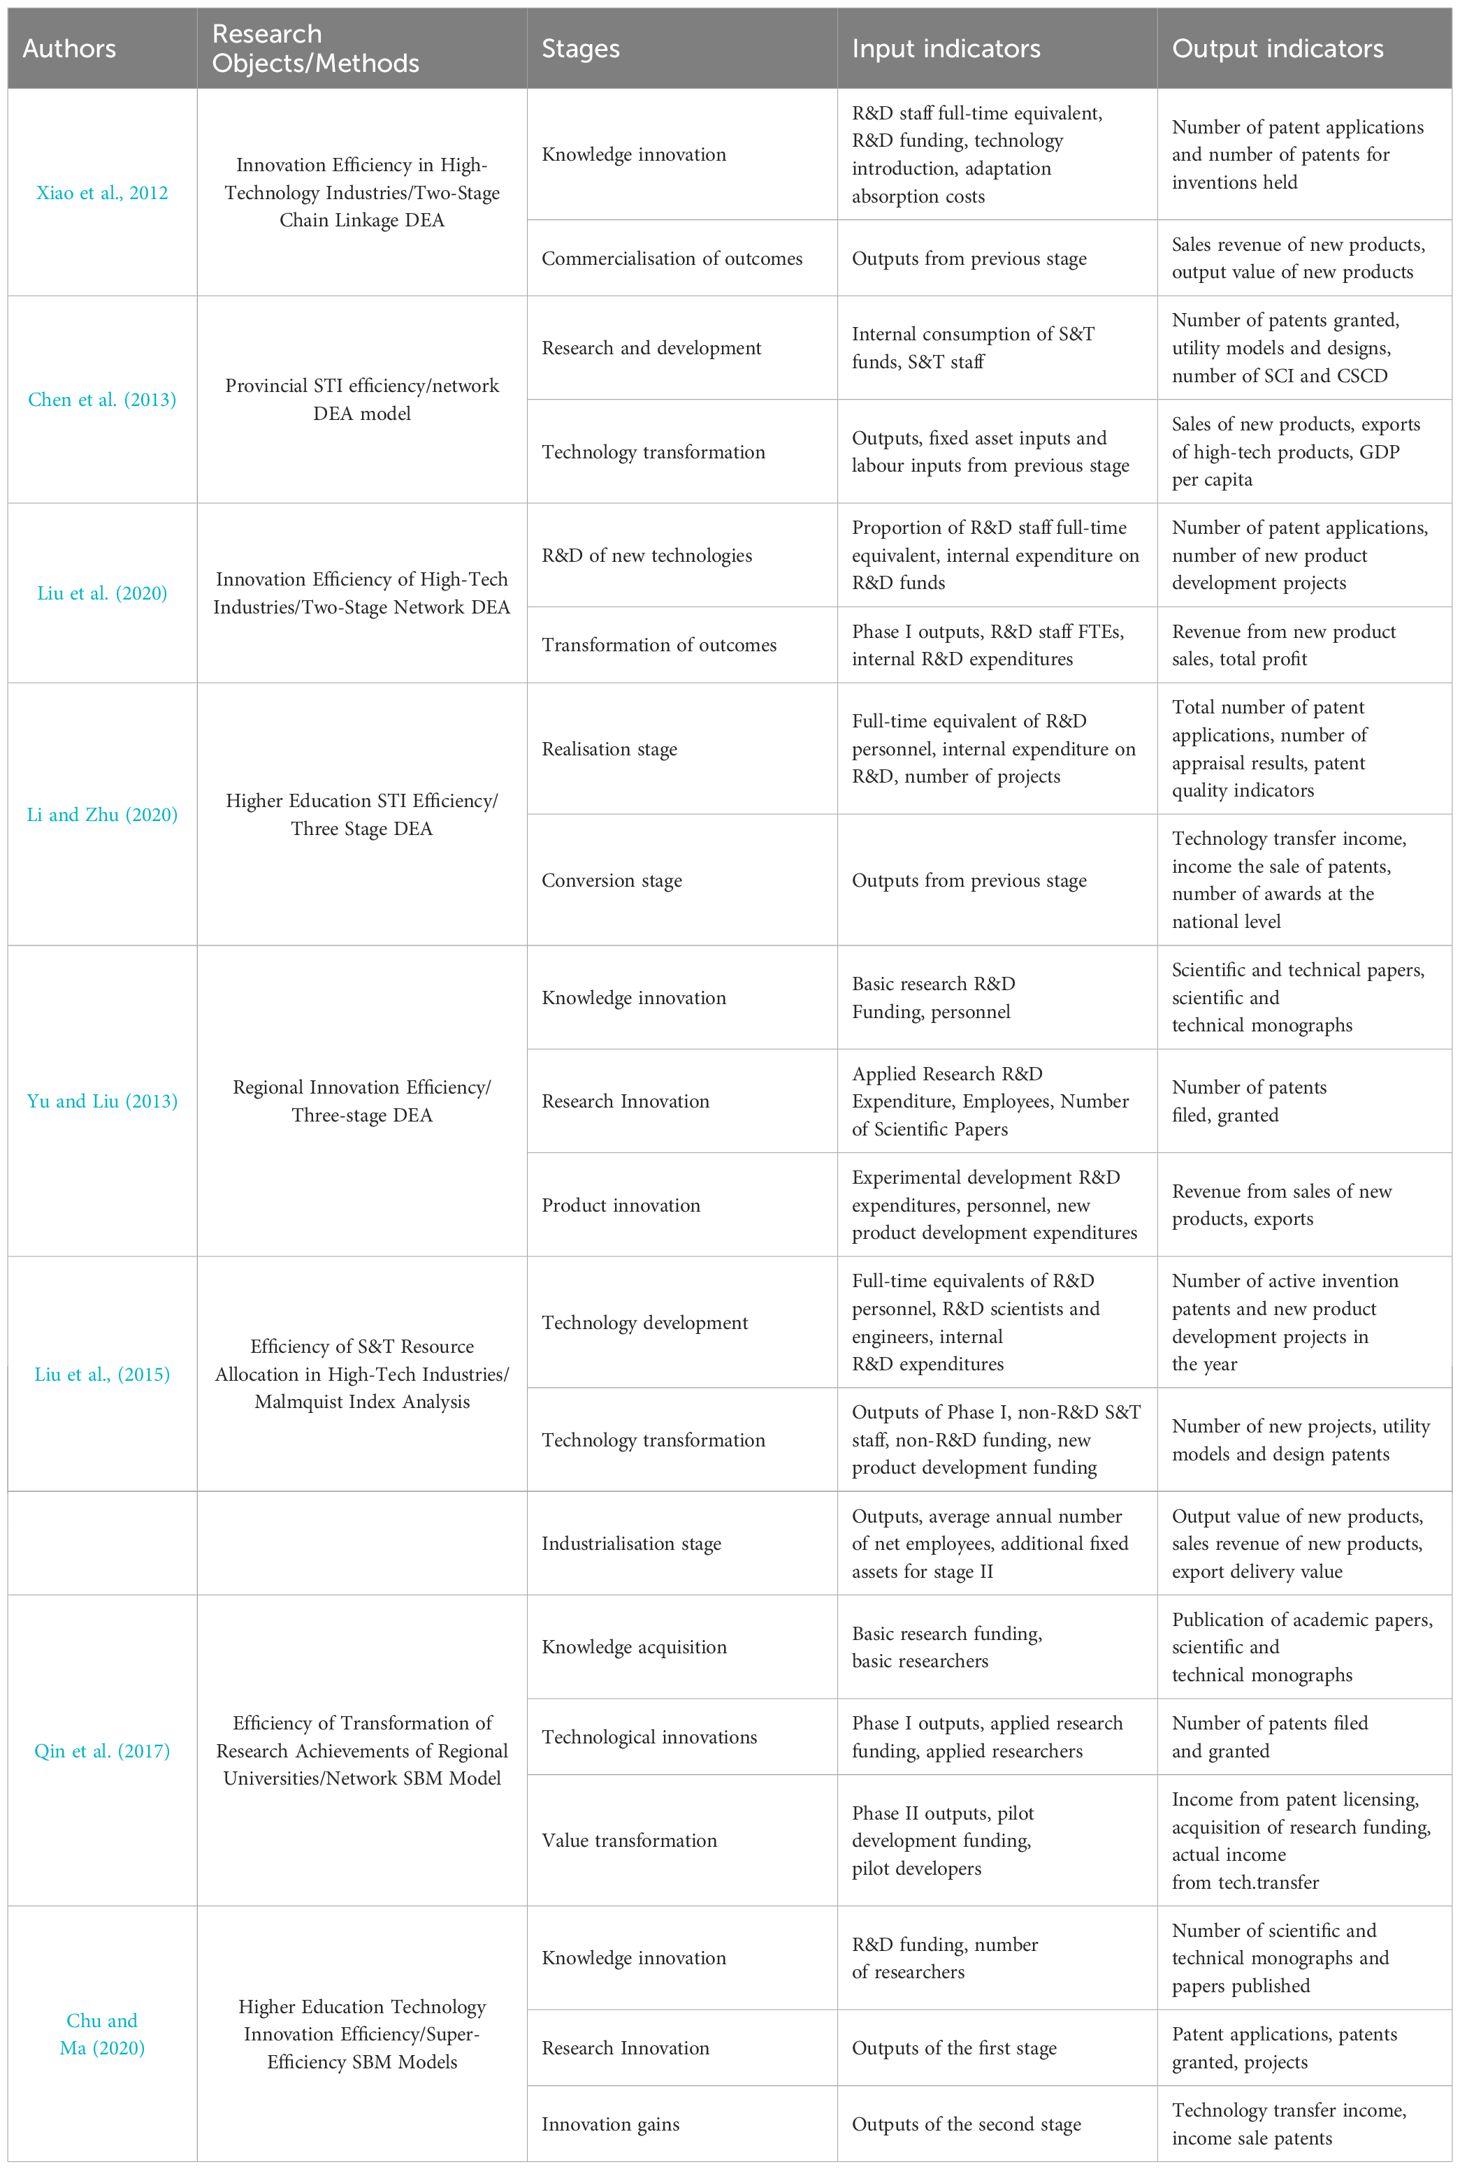
Table 1 Summary of measurement and methodological literature on China’s innovation value Chain research.
Enhancing the MSTE can further promote the development of marine science and technology, enhance the competitiveness of marine industry, and provide a new power source for the development of marine economy. In foreign countries, the measurement and evaluation of MSTE is mainly carried out from a micro point of view, for example, Odeck and Brathen (2012) measured the average technical efficiency of seaports using data envelopment analysis and stochastic frontier analysis, and in-depth analysis of the regional differences in efficiency and the difference between the two efficiency measurement models; Chen et al. (2013) constructed a data envelopment analysis model for the MSTE evaluation of Zhejiang Province. The improvement of MSTE can not only promote the development of marine science and technology, but also have a far-reaching impact on the marine industry. For example, Tingley et al. (2005) used DEA and SFA models to analyze the technical efficiency and influencing factors of the English Channel fishery respectively; Yang and Lou (2016) used stochastic frontier analysis (SFA) and data envelopment analysis (DEA) methods to analyze the technical efficiency of Japan’s marine fishery. Meanwhile, enhancing the MSTE can also promote the development of marine economy, improve the efficiency of resource utilization, and reduce waste and pollution. Some scholars (Xie and Ju, 2012) analyze the regional differences and convergence of MSTE in China. In analyzing the influencing factors of MSTE, foreign scholars have conducted extensive research.
It can be seen that these literatures mainly adopt the traditional single-phase model to measure the MSTE. Gradually, some scholars have begun to focus on analyses based on innovation process decomposition and innovation value chain perspectives, which better reflect the actual situation of marine science and technology innovation. Li et al., 2016 constructed a complex network DEA model to measure the overall MSTE, scientific research efficiency, transformation efficiency and education efficiency in 11 coastal provinces and cities in China. Xu and Li (2018) measured the overall efficiency and sub-phase efficiency of marine innovation in 11 coastal regions of China with the help of a two-phase DEA model. In addition, Garcia-Soto et al. (2021) measured the comprehensive MSTE by dividing the marine science and technology innovation process into the innovation research and development phase and the results transformation phase under the perspective of the innovation value chain, and provided an in-depth analysis of the current situation of marine science and technology innovation in China.
In summary, the research on the MSTE has become a hot field. Through in-depth exploration of the influencing factors, measurement and evaluation methods, and promotion strategies of MSTE, we can better understand the internal mechanism of marine science and technology innovation, and provide useful insights for promoting marine science and technology innovation and industrial development in practice. In China, the measurement and evaluation of the MSTE has also begun to receive attention gradually, and data envelopment analysis models are constructed to evaluate and study the MSTE (Table 2).
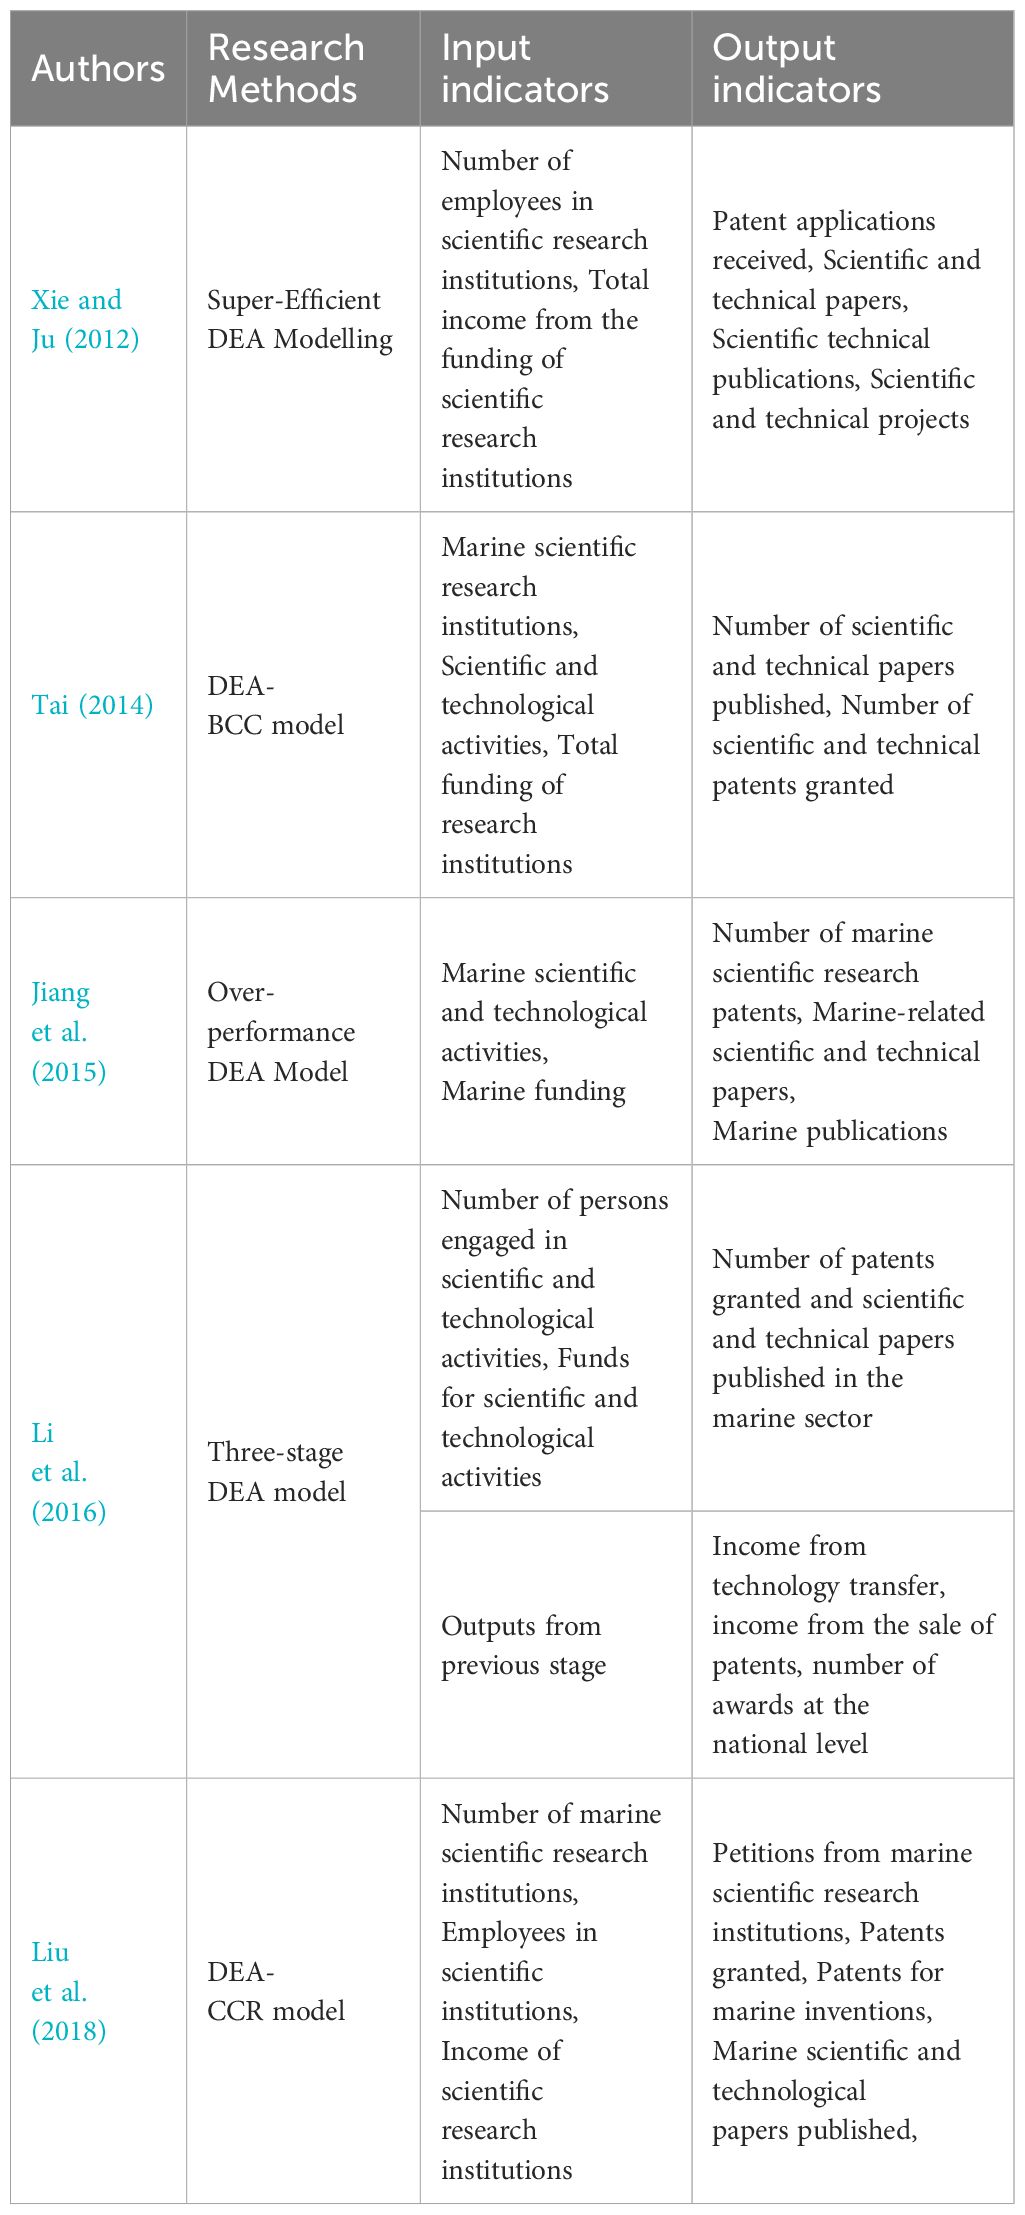
Table 2 Summary of the literature of marine science and technology innovation efficiency research in China.
Regional innovation networks mainly focus on the interaction and cooperation between different organizations, enterprises and institutions in geographic space to promote innovation and scientific and technological progress (Cheng et al., 2023). Through network analysis, the spatial structure of China’s MSTE network as well as the inter-regional linkage relationship can be explored, and the spatial linkage network influencing factors can be analyzed from a relational perspective (Xue et al., 2022). Scholars have begun to construct regional innovation network from the perspective of efficiency, and make preliminary analyses of the overall characteristics of the network, individual characteristics and influencing factors. For example, Sun et al. (2022) constructed a spatial correlation network based on the gravity model, and then analyzed the structural characteristics of China’s green science and technology innovation efficiency network and the network influencing factors. Yao et al. (2023) used the modified gravity model and social network analysis to explore the spatial correlation network characteristics of the efficiency of industrial green technological innovation. Zhang and Wu (2021) used the modified gravity model and social network analysis to analyze the evolution law and spatial spillover effect of green innovation network structure, and adopted the secondary distribution process to identify its driving factors. However, still lacks the exploration of the spatial correlation network of MSTE.
A large number of studies have shown that network structure and network relationships can have a significant impact on the innovation performance or innovation efficiency of participating subjects. Complex network structure and high degree of network relationship can effectively promote the flow of information and knowledge, improve the possibility of innovative subjects to obtain new ideas, new technologies and new opportunities, and thus enhance their innovative performance and efficiency (Chen et al., 2023b). In the field of innovation, regions with high innovation efficiency can often occupy the center of the network, obtaining a large number of innovation resources by virtue of their location advantages, and promoting the improvement of their own innovation efficiency; while regions with lower innovation efficiency are often in the periphery, with smaller network beneficiary effects, increasing the gap of inter-regional innovation efficiency, and exacerbating the imbalance of the development of innovation efficiency (Wang et al., 2022). In addition, with the increasing degree of inter-regional correlation, the innovation efficiency of the region is more and more closely related to the innovation activities of the neighboring regions, indicating that the innovation development of the region is no longer an isolated process, but a process of mutual influence and mutual promotion with the surrounding environment and the development status of other regions.
To sum up, the research on the MSTE is a hot topic in the field of marine economic research at home and abroad, but there are still the following aspects worthy of further research and exploration. At present, there are many researches on the MSTE, but most of the literature considers marine science and technology innovation as a single input-output activity and treats the process of science and technology innovation as a “black box”, which ignores the heterogeneity of different phases of marine science and technology innovation; this is not conducive to the search for the root causes of regional inefficiency in science and technology innovation. Fewer scholars have included the transformation phase of innovation results into the analysis framework, and divided the marine science and technology innovation process into the basic innovation phase, the applied research and development phase, and the gainful transformation phase, focusing on the internal structure of the marine science and technology innovation system, which can help to evaluate the innovation process in a more comprehensive way, and make clear the performance of the differences in the MSTE. ②Existing research results show that China’s MSTE has spatial spillover effects, but although the traditional spatial measurement model can reflect spatial relationships, it is unable to identify the chain of correlation relationships among regions from the complex network structure, and it is difficult to reveal the inner role and operation mechanism generated by spatial correlation. The modified gravity model and social network analysis method can study the structural data and its correlation relationship, which can overcome the limitation of the traditional “attribute data” and can effectively solve the above problems. Some studies have paid more attention to the overall structure of the spatial correlation network of MSTE and the characteristics of individual networks, and less attention to the causative factors and mechanisms of the formation of the network structure (Tian et al., 2024).
According to the theory of spatial linkage and interaction, and with reference to the existing research on MSTE, this paper argues that MSTE, as an important indicator for measuring the high-quality development of the marine economy, and the spatial correlation network of MSTE is an important part of the marine economic growth network (Wu et al., 2023; Zhang et al., 2023). Existing research shows that the MSTE of China’s coastal regions affect each other, constituting the spatial correlation path of MSTE within the region, which is manifested as the link between nodes in each region; and, along with the deepening of the link between the input and output processes of marine science and technology innovation in each region, the link between nodes within the region has gradually evolved into the ponderous spatial correlation network of MSTE (Liu et al., 2020; Shang et al., 2023) The rapid flow of population, industry and other types of spatial factors across the region, as well as the basic regulatory role of the market mechanism have become the key factors to promote the spatial network of MSTE. At the same time, in order to make up for the “market defects” and “market chaos” and other failures in the whole process of marine science and technology innovation development, the government needs to intervene and regulate the market, which is an important factor to promote the spatial interactions of the MSTE in the coastal areas. The spatial correlation and network formation mechanism of China’s MSTE are shown in Figure 1.
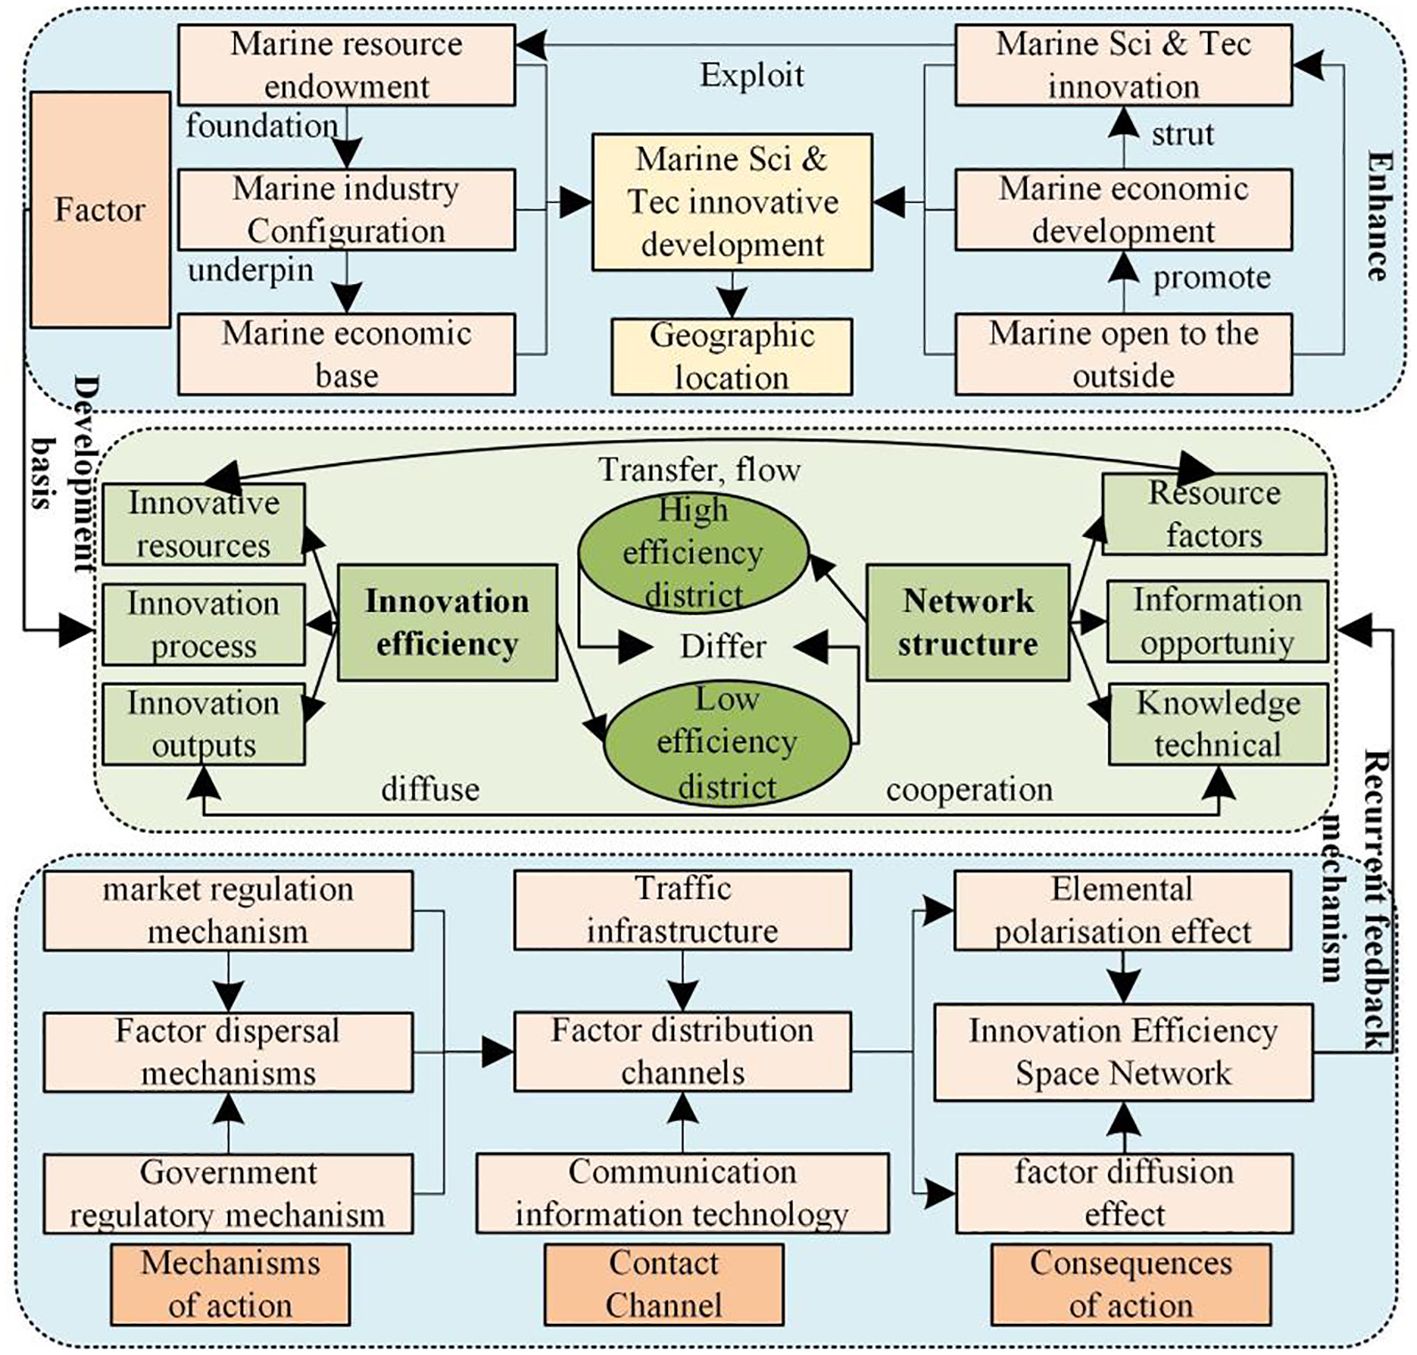
Figure 1 Formation mechanism of the evolution of the spatial correlation network structure of China’s MSTE.
Firstly, due to the spatial heterogeneity of historical development foundation, geographical location, natural resource endowment and macroeconomic policy, MSTE in different regions presents an imbalance in the spatial dimension, that is, the level of development of marine science and technology innovation in the space there is a certain “potential energy difference”. The existence of “potential difference” can promote the free and orderly flow of production factors across regions, and the formation of a reasonable division of labor and interactive cooperation between regions. At the same time, MSTE between the neighboring regions, neighboring regions, there is a natural geographic connection, closer economic ties and scientific and technological collaboration, the development of efficiency is also higher (Huang and Wang, 2020). Once the relevant new marine technology emerges, all regions, in order to strengthen the support of marine science and technology innovation, will compete to adopt the latest technology in the marine production process, thus promoting the spatial spillover effect of marine production technology between regions, enhancing the vitality of the regional factor flow, and continuously transmitting and radiating to the neighboring regions and other regions.
Secondly, in the light of the world’s scientific and technological frontiers and the major strategic needs of the country in building an ocean powerhouse, it is necessary to insist on the continuous improvement of MSTE, so as to promote the sustainable development of the marine economy through marine science and technology innovation. MSTE is essentially the result of the interaction of various types of fluid resource elements, such as resources, capital, labor and information, etc. Under the impetus of emerging technologies and transportation modernization, inter-regional factors of production achieve efficient and convenient flow, which leads to spatial linkage of regional MSTE, which is mainly characterized by the connecting lines or edges between various spatial nodes (Li et al., 2023). Marine science and technology innovation involves marine aquaculture, seafood processing, ecological and environmental management, comprehensive use of marine resources and marine biomedicine and other aspects, different factors will continue to flow into their own conditions in good regions, and ultimately the formation of innovation breakthroughs, leading the development of the core region, in the spatial network of MSTE of the high efficiency of the region and nodes. When MSTE in the core area reaches a certain standard, it will arrive at the place of radiation acceptance through the radiation channel under the action of radiation power, cultivate the new motive power of marine emerging industry, leading to the change of MSTE in the area, and through the transfer of elements, finally build the development pattern of complementary advantages and high-quality development.
Thirdly, in the context of the high-quality development of the marine economy, the flow of elements of marine science and technology innovation still needs to follow the market adjustment mechanism. The mechanism of marine science and technology innovation is imperfect, the lack of effective marine science and technology achievements transformation mechanism, marine science and technology achievements industrialization is low, etc. The improvement of the market mechanism can effectively allocate the limited resources associated information to the different demand and supply areas, and constantly strengthen the spatial correlation relationship of regional MSTE (Chen et al., 2022). Marine science and technology innovation capacity is not strong, the effective supply of scientific and technological knowledge is insufficient, and marine science and technology investment channels are single, it is urgent to make full use of market-based means to promote the industrialization of marine ecology and industrial ecology, to innovate trans-regional marine ecological resources rights and interests trading mechanism, to realize the trans-regional flow of all elements of the ocean, and to promote the coordinated development of the coastal areas with higher quality. In addition, with the construction of a unified national market, guiding the regions and the internal balance of supply and demand, price regulation and technology management and other mobile elements, constantly breaking through MSTE breakthroughs in spatial distance limitations, and gradually formed a cross-regional spatial dynamic interaction and correlation network.
Finally, if China is to achieve the transformation from a major maritime power to a maritime power, it must insist on continuous innovation in China’s marine science and technology management system, and government intervention has become an important part of the formation of the spatial correlation network for MSTE. There are unfair competition and market failure in market development, appropriate government intervention and support can guarantee fair competition, maintain market order, and realize resource integration and flow of technological elements through the complementarity of advantages between different regions. At the same time, the irrationality of marine science and technology resource allocation and input also seriously affects the stimulation of the innovation potential of the marine science and technology talent team, it is necessary to strengthen China’s marine science and technology innovation input and top-level design, to guide the policy, technology, funding, talent, management and public services and other key elements of the water input across the region, and ultimately promote the formation of a spatial correlation network of MSTE of multi-region connectivity (Li and Cui, 2023).
Currently, stochastic frontier analysis (Liu et al., 2018), data envelopment analysis (Dai et al., 2015), SBM super-efficiency model (Wang et al., 2020) and other methods are used to calculate MSTE. Based on this, this paper draws on the existing research on MSTE, divides the marine science and technology innovation process into three phases (Chen et al., 2024b). Basic innovation, applied R&D, and gainful transformation, and constructs the chain network DEA model (Figure 2).
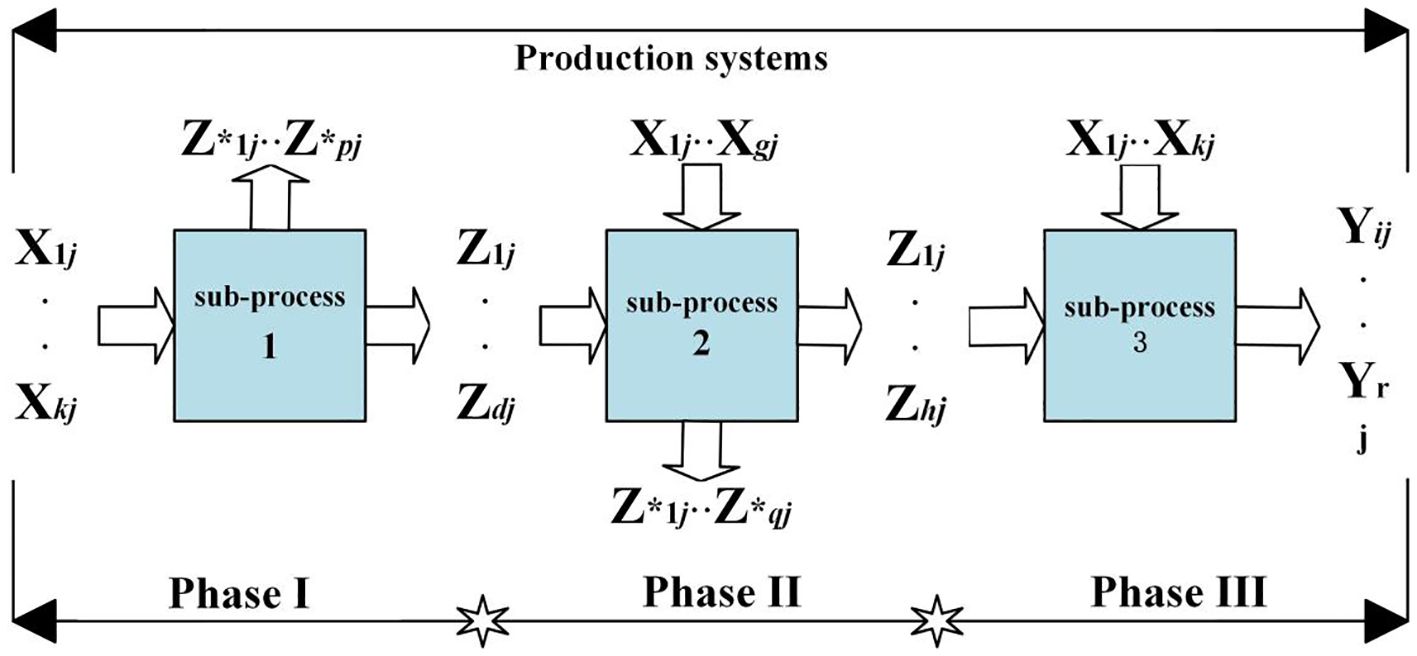
Figure 2 Three-phase chained network DEA model based on shared inputs.
Assuming that there are n decision-making units, each DMUj (j=1, 2,…, n) production system includes two subsystems that are closely connected before and after. As shown in Figure 2, the first phase consists of having m items of initial inputs (i = 1, 2,…, m) to get D items of intermediate outputs (d = 1, 2,…, D) to P items of other outputs (p = 1, 2,…, P). The second phase consists of G-item supplementary inputs (g=1, 2,…, G) and intermediate outputs (p=1, 2,…, P) to get H-item intermediate outputs (h=1, 2,…, H) to Q-item other outputs (q=1, 2,…, Q). In the third phase the output of item S, (r=1, 2,…, S) is obtained from the supplementary inputs of item K, (k=1, 2,…, K) and intermediate outputs (h=1, 2,…, H).
Based on the assumption of variable returns to scale, efficiency in the basic innovation phase (Equation 1); efficiency in the applied R&D phase (Equation 2); efficiency in the revenue transformation phase (Equation 3); and overall efficiency (Equation 4) (Chen et al., 2024b).
Where: are unconstrained real variable reflecting the state of returns to scale of DMUj. The chain network DEA model constructed in this paper has 11 decision variables (11 provinces): three shared input variables and two intermediate output variables in the first phase; two supplementary input variables and one intermediate output variable in the second phase; and two additional input variables and three final output variables in the third phase. DEA P2.1 was applied to solve the above model to obtain the efficiency values of for the first, second and third phases of the 0th decision unit, and the overall efficiency was found by geometric averaging the efficiency values of the three phases (Tian et al., 2023).
The modified gravity model (Equation 5) is as follows with reference to the research results of Chen et al (2023a):
Where, denotes the strength of spatial correlation of MSTE between provinces and regions i and j; denotes the contribution of province i in the linkage of MSTE between provinces and regions i and j; 、 are the MSTE of provinces and regions i and j; 、 、 、 、 are the annual number of resident population, GDP; GDP per capita of provinces and regions i and j, respectively; and is the economic distance between provinces and regions i and j.
In this paper, we use Ucinet and Gephi software to analyze the overall network characteristics, network centrality and block model of MSTE in 11 provinces and cities along the coast of China, and the formula of each indicator, analysis method and definition of each block are shown in Table 3.
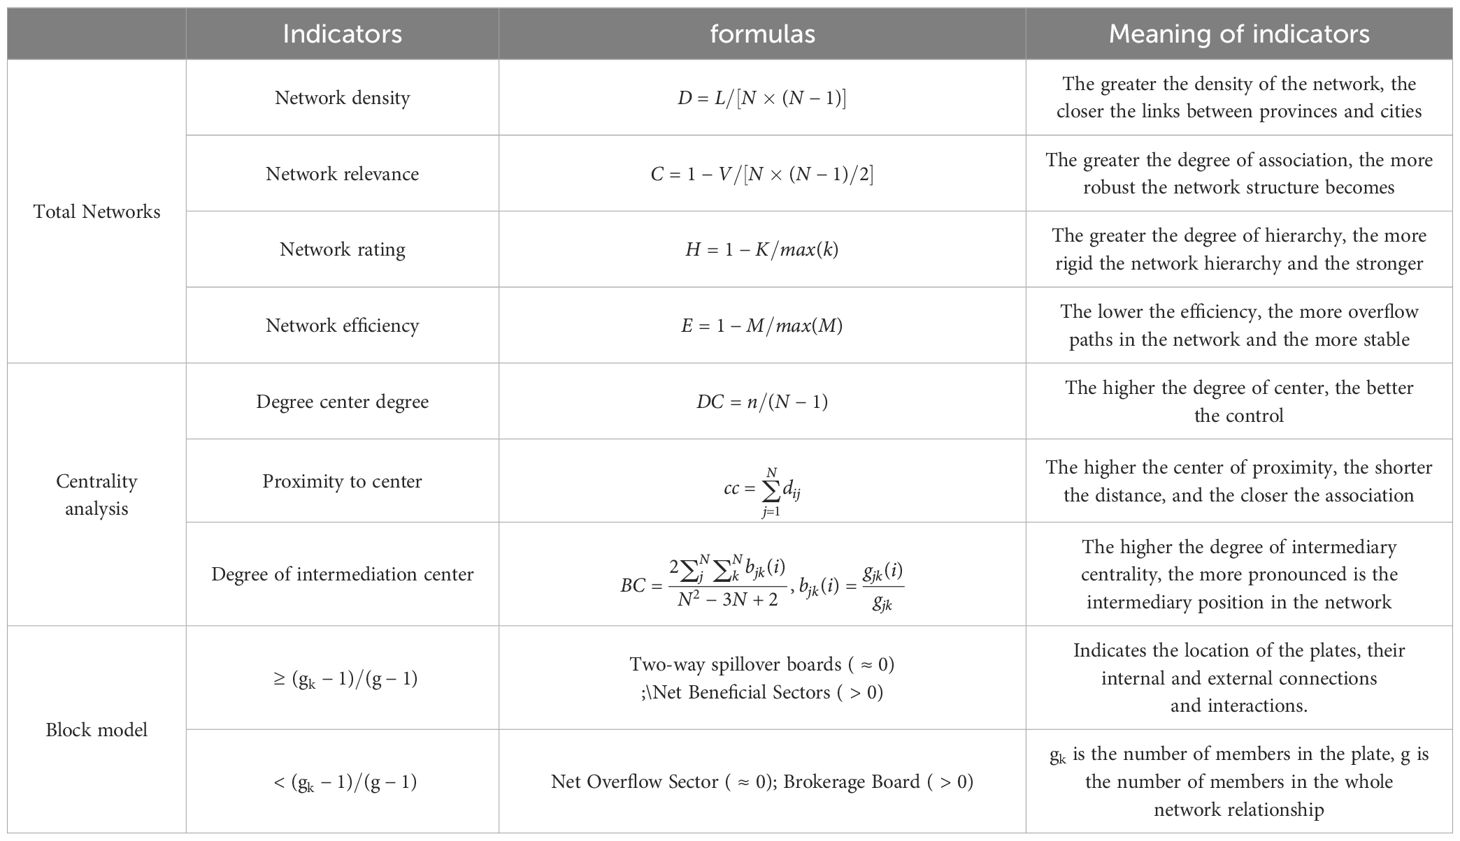
Table 3 Description of social network analysis indicators.
The QAP model (Equation 6) is used to explore the formation and influence mechanism of network structure. The constructed econometric model is
Where: denotes the spatial network relationship matrix of the study object and Xm(m=1,2,…,n) denotes the matrix of influencing factors.
This paper draws on the evaluation system given by existing research results and constructs a MSTE evaluation index system including initial inputs, intermediate outputs, other outputs, supplementary inputs and final outputs according to the theory of the innovation value chain, and breaks down the process of marine science and technology innovation into the basic innovation phase, the applied research and development phase, and the gainful transformation phase (Figure 3).
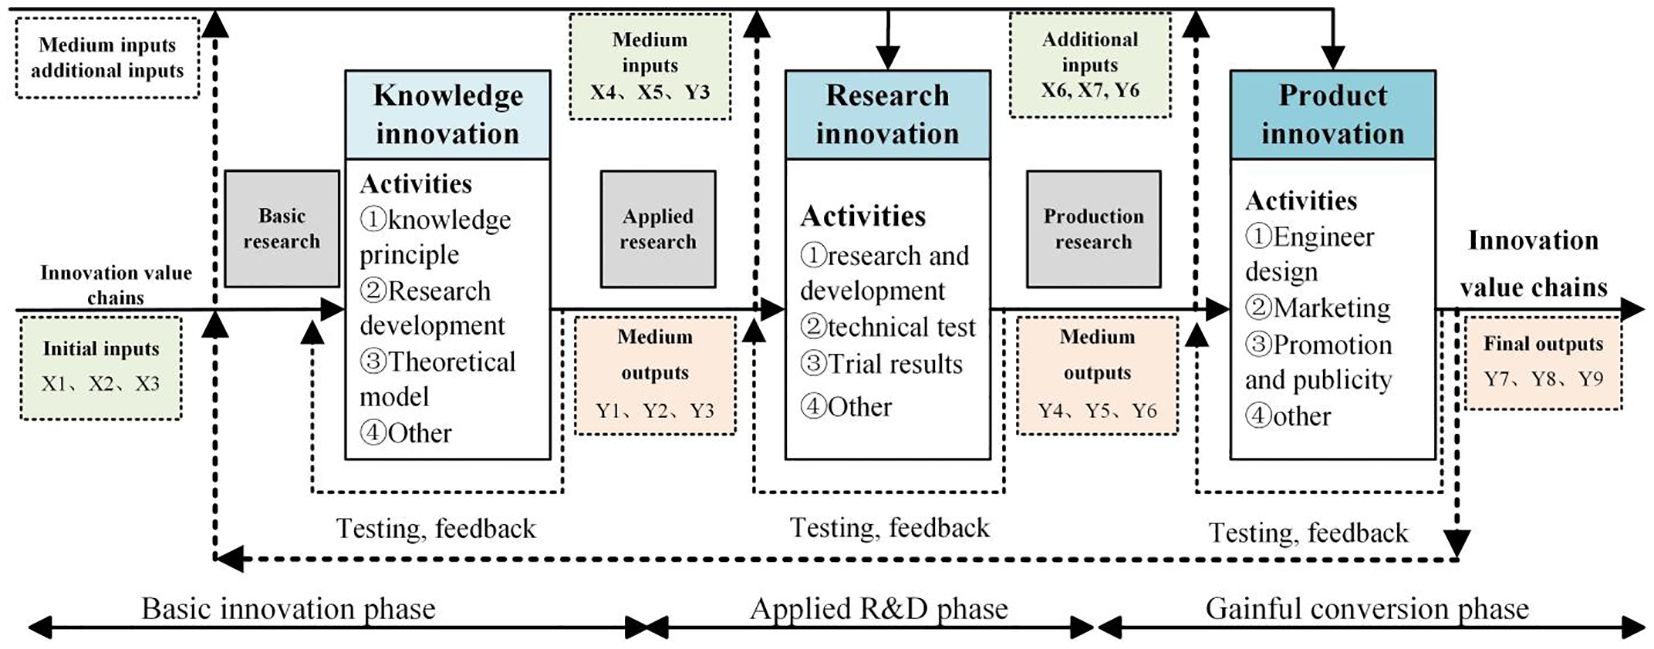
Figure 3 Marine science and technology innovation system.
Based on the existing research results, this paper selects 11 provincial-level administrative units in China ‘s coastal areas as research samples. Considering the impact of national policies and the scientificity and accessibility of data, the research period is set to 2007-2021. In addition, the data involved in the measurement of MSTE and the gravity model of this paper come from the China Marine Statistical Yearbook, China Marine Economy Statistical Bulletin, National Maritime Domain Use Management Bulletin, as well as the statistical yearbooks of each province, the website system of the National Bureau of Statistics and other data. The distance between provinces and cities is calculated by using the distance function of ArcGIS software; the capital stock of the marine economy is corrected by using the comparable data of GDP of the oceans and GDP of coastal areas to eliminate the influence of price and other factors.
In order to identify the evolution trend of the spatial linkage strength of MSTE in an all-round way, after obtaining the gravitational relationship between regions according to the modified gravitational model, we then establish the binary spatial correlation matrix between regions, and use the UCINET to draw the spatial correlation network topology map of MSTE. Due to space limitation, this paper selects the cross sections in 2007, 2015 and 2021 at the basic innovation phase, applied R&D phase, and transformation phase for comparative analysis (Figures 4A–I).
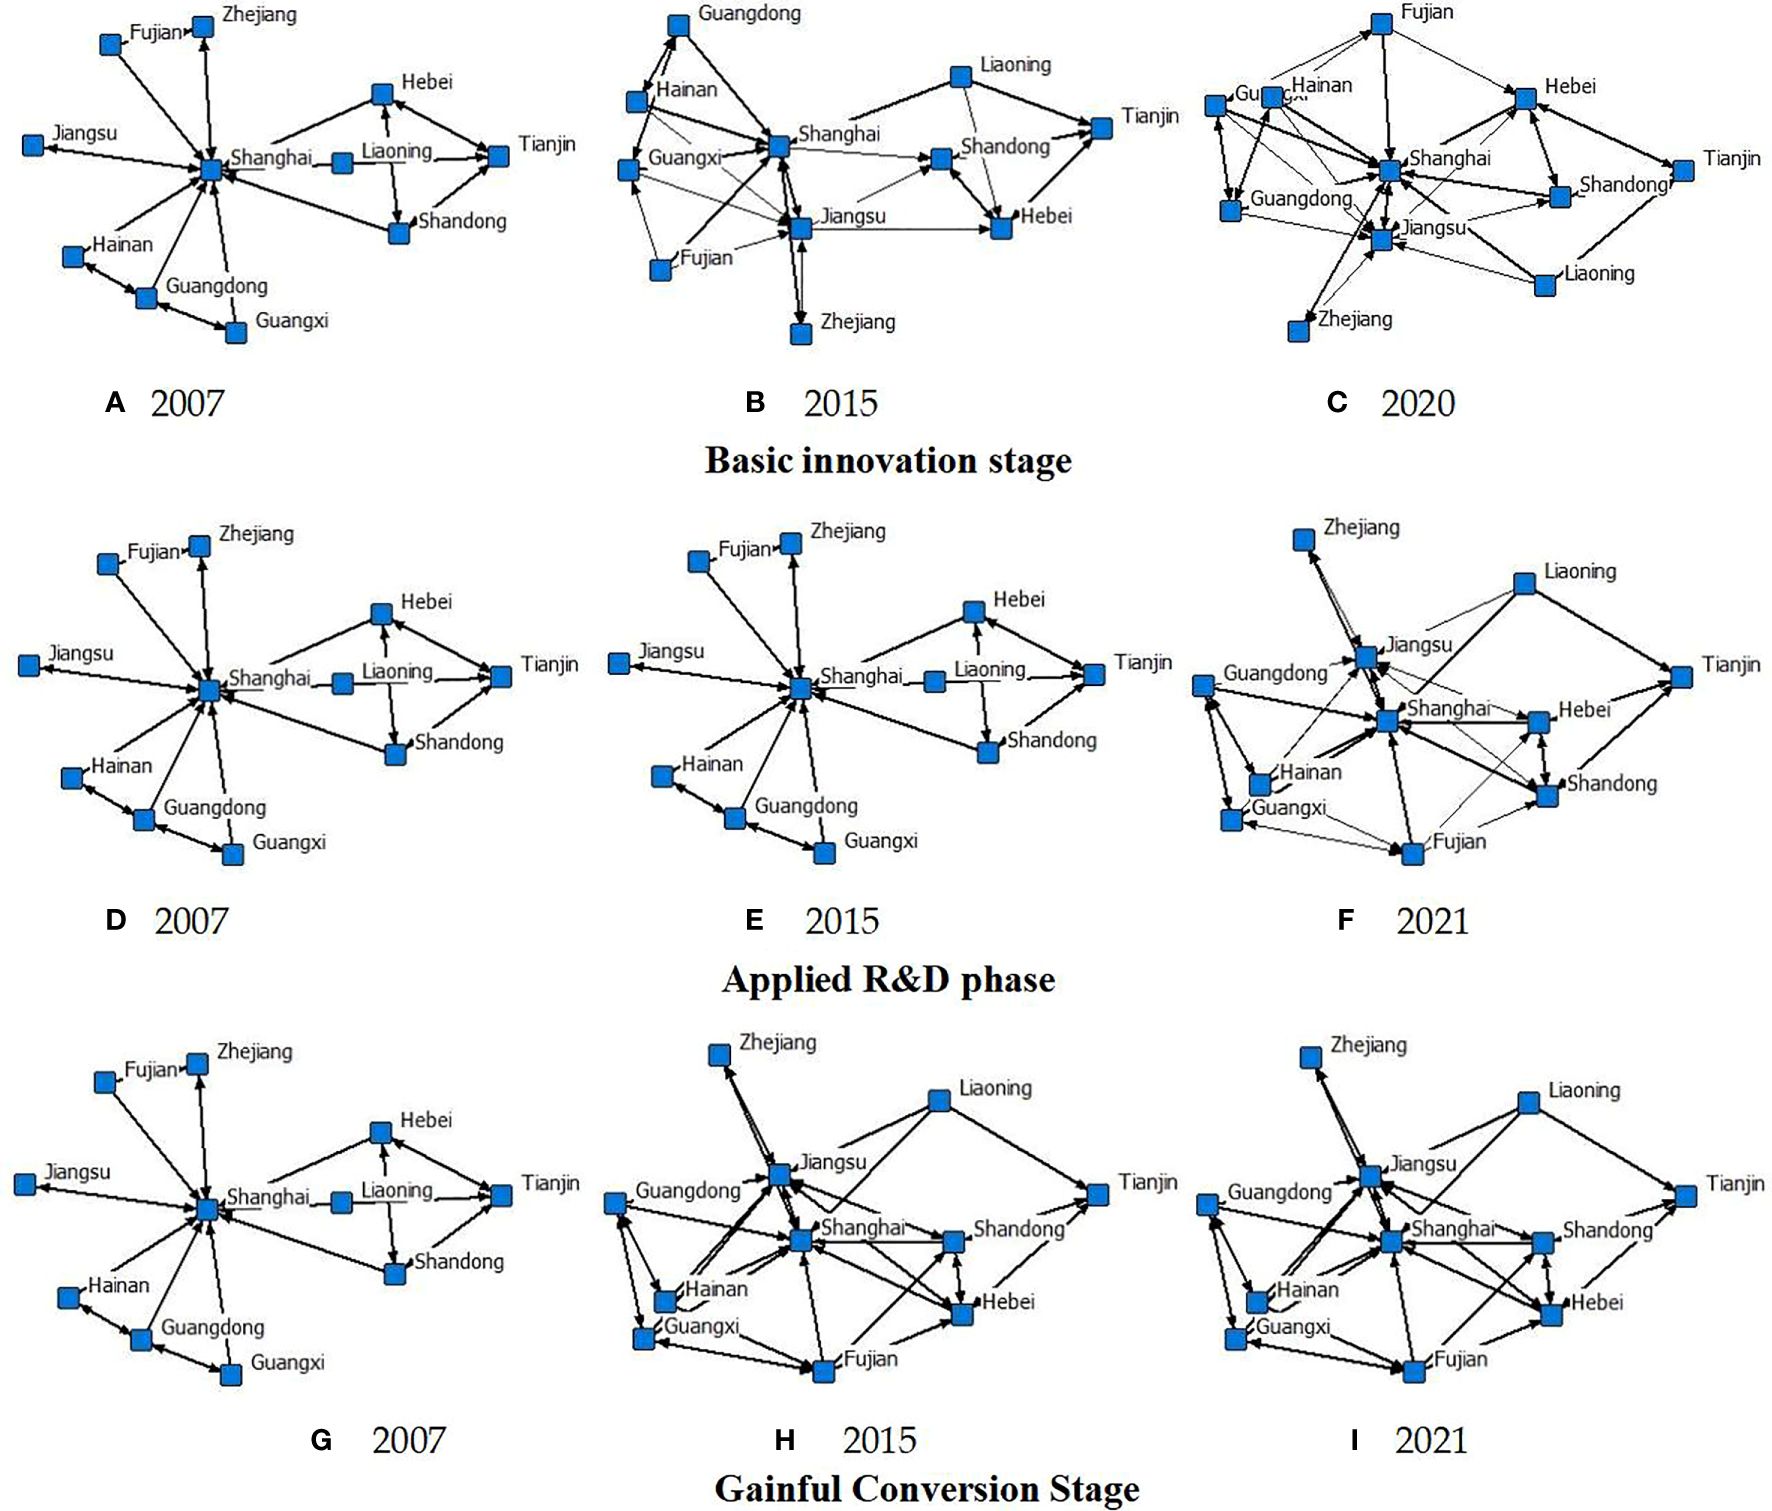
Figure 4 (A–I) Strength of three-phase spatial network linkages of MSTE.
The nodes in the figure represent the 11 coastal provinces in China, the lines between the nodes represent the correlation between the provinces, and the direction of the arrows represents the direction of the spillover of MSTE. Overall, the number of lines between the nodes of the three phases of innovation efficiency increases over time, and the spatial correlation gradually develops from a sparse and dispersed state to a close and balanced trend, and the spatial correlation of MSTE between different regions is increasingly strengthened. MSTE of each province not only affects the neighboring provinces, but also breaks the geographical limitation, and also forms an inseparable spatial correlation network among the relatively distant provinces. For example, in 2015, Shanghai, in the applied R&D phase, not only establishes correlations with neighboring Jiangsu and Zhejiang, but also generates spillovers of MSTE to Hainan, Hebei, Guangxi, etc. In 2007-2021, the basic innovation phase gradually transforms into a dual-core development pattern of Shanghai and Jiangsu with Shanghai as the core, and the applied R&D phase transforms into a multi-core development pattern of Shanghai, Jiangsu, Hebei and Shandong with Shanghai as the core; and the gain of the applied R&D phase transforms into a multi-core development pattern of Shanghai, Jiangsu, Hebei and Shandong. Shandong multi-core development pattern; revenue transformation phase from Shanghai as the core gradually transform Shanghai, Jiangsu, Hebei, Shandong, Tianjin, Guangdong and other networked development pattern. In addition, the network structure of MSTE is similar in each year and each phase, indicating that the spatial association network structure of provinces in China’s coastal areas is highly robust, and there is no significant change in the relative network status of each city.
To further analyze the overall structural characteristics of the spatial correlation network of MSTE, the correlation degree, network density, network hierarchy, network efficiency, and nearest upper limit of the three-phase network were calculated with the help of Ucinet software (Table 4).
(1) From the network correlation degree, the network correlation degree of the three phases of MSTE in China’s coastal regions from 2007 to 2021 is 1, indicating that there are more obvious spatial correlation and spillover effects in the overall network structure, the accessibility between nodes of each region is at a high level, and the spatial correlation network of MSTE is more stable, while it has a high degree of reciprocity.
(2) From the network rank degree, the network rank degree of the three phases during the study period shows a fluctuating upward trend, but all of them are maintained at a low level, with the network rank degree ranging from 0.209 to 0.336, which is much smaller than the maximum value of the rank degree1, reflecting the fact that the network of spatial correlation of the efficiency of marine scientific and technological innovations does not exist in the strict hierarchical structure, and that marine scientific and technological innovations between regions develop in a mutually influencing manner with a clear tendency of trans-regional synergistic innovations. The network rank degree of the basic innovation phase rises from 0.209 in 2007 to 0.336 in 2021, and the network rank degree of the applied R&D phase and gainful transformation phase rises from 0.209 in 2007 to 0.336 in 2021, which indicates that the correlation of MSTE is stronger in the applied R&D phase and gainful transformation phase, and that inter-region exhibits obvious This indicates that the MSTE is more relevant in the applied R&D phase and the revenue transformation phase, and the regions show obvious trends of technological synergistic innovation, with better interconnection and cooperation.
(3) From the perspective of network efficiency, the network efficiency of the three phases in the study period generally shows a fluctuating downward trend, indicating that with the increase of connectivity between nodes, the redundant channels of MSTE between provinces are increasing, which in turn leads to the improvement of network connectivity. However, the network efficiency but still maintains at a high level, between 0.6444-0.8667, indicating that the path of MSTE linkage network is relatively single and lacks diversity, and the overall network stability among provinces needs to be strengthened.
(4) In terms of network density, the network density of the three phases during the study period shows a fluctuating upward trend, with the network density increasing from 0.209 in 2007 to 0.336 in 2021, indicating that the spatial connection of the efficiency of marine science and technology innovation among the provinces is getting closer and closer, and that marine science and technology innovation is playing a more important role in the pattern of the country’s economic development and opening up to the outside world, and is safeguarding the interests of the country in terms of national sovereignty, security and development. position is more prominent, and its role in the construction of national ecological civilization is more significant. However, the overall network density value is at a low level compared with the maximum network density value1, and there is still a need to further strengthen the spatial linkage of marine S&T innovation efficiency among provinces. The recent upper limit values of the three phases of marine S&T innovation efficiency in China’s coastal areas increased significantly from 2007 to 2021, which indicates the increasing stability of its spatial network.
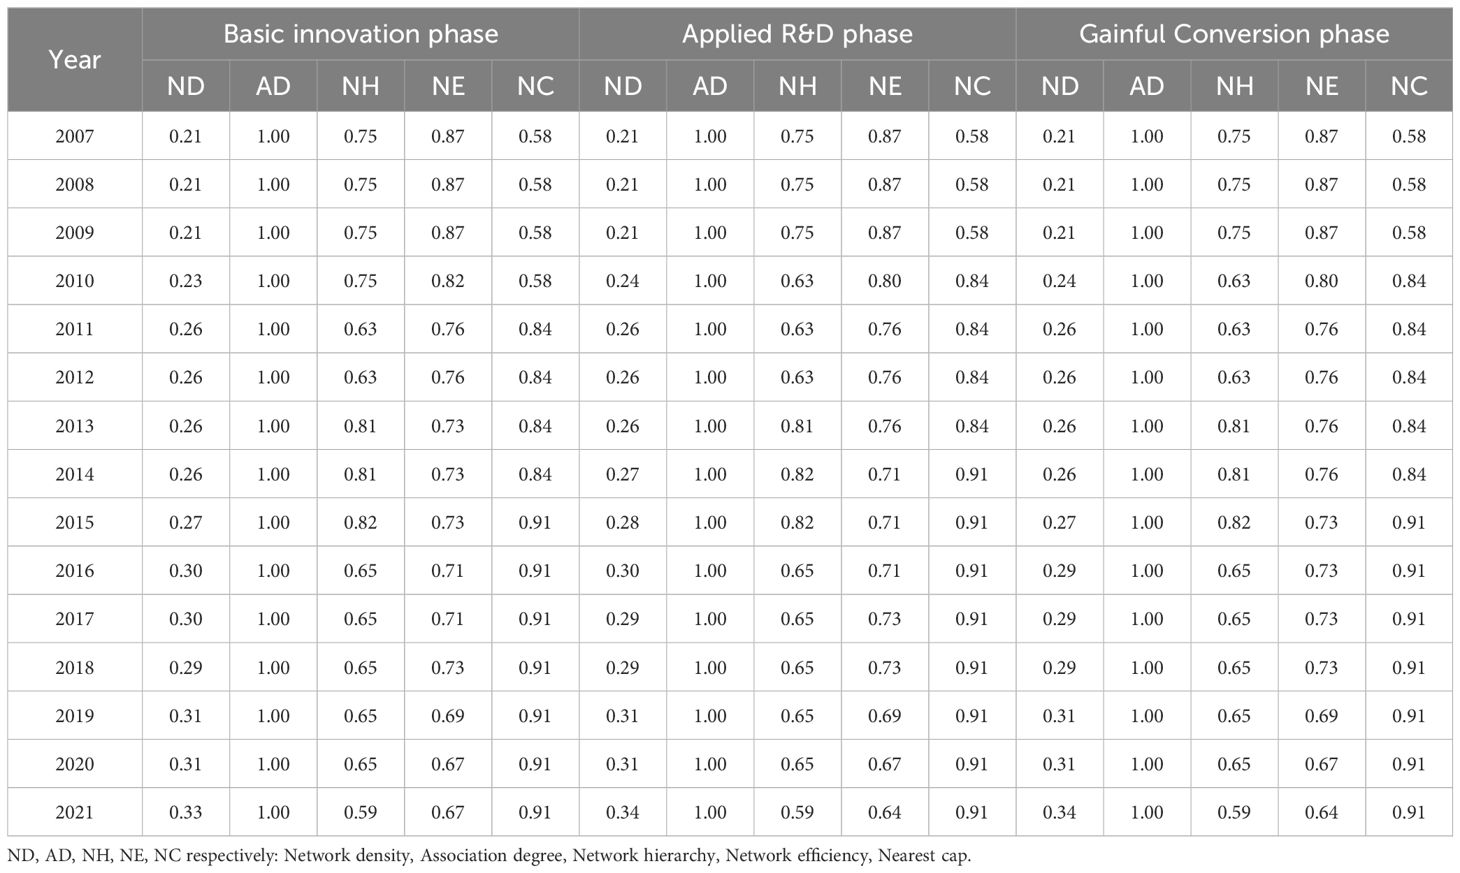
Table 4 Overall network characteristics of MSTE, 2007-2021.
The above analysis of the overall network structure only reflects the overall picture of the MSTE network, and it is not possible to explore the node centrality in depth. Therefore, this paper analyzes the individual network characteristics of the spatial network of MSTE from 2007 to 2021 through the indicators of degree centrality, proximity centrality, and intermediate centrality measured by the Ucinet software, so as to determine the status and role of each province and city in the spatial network of marine science and technology innovation. In order to determine the position and role of each province and city in the spatial network of marine science and technology innovation, as well as the differences between the three phases of the innovation value chain. Due to space limitation, only the results of 2007, 2015 and 2021 are shown (Figure 5).
(1) Degree centrality. According to the measurement results of the centrality of the point degree of the basic innovation phase, compared with 2007, the change of the centrality of the degree of the MSTE of China’s coastal marine science and technology in 2021 is small, and the high value areas are mainly concentrated in the areas of Shanghai, Tianjin and Guangdong, which indicates that they are more connected with other areas, and they have an advantage in the spatial network of MSTE and are in the central position of the network. The provinces of Guangxi, Fujian and Hebei are in the lower value area, indicating that they are less connected with other regions and less influential. Meanwhile the measurement results of point-degree centrality in the applied R&D phase and the gainful transformation phase are basically the same as those of the basic innovation phase. Point in degree is the degree of influence of a node by other nodes, i.e., node generates benefit effect, and point out degree is the degree of influence of a node on other nodes, i.e., node spillover effect. The overall increase of point out degree and point in degree from 2007 to 2021 is relatively slow, indicating that the change of receiving relationship and spillover relationship among provinces changes is also small. Most of the provinces and cities at the center of the spatial correlation network of MSTE have lower out-degree and higher in-degree, indicating that the region has obvious “siphon effect” and can absorb a large amount of innovation resources, which is a significant benefit effect.
(2) Degree of proximity to the center. The value of the proximity centrality degree of most provinces and regions during the study period shows an upward trend, indicating that MSTE in all provinces and regions is more closely linked, and that with the construction of a strong marine country, the construction of marine science and technology innovation platforms has been strengthened to further enhance the capability of independent innovation in marine science and technology. Hebei, Shanghai, Guangdong and Zhejiang are close to a higher degree of centrality, ranking at a higher level, and are able to quickly establish communication channels with other provinces in the spatial association network, and act as central actors in the network, playing a good driving role. Fujian, Guangxi, Hebei and other provinces have a lower degree of proximity to the center, play a small role in driving other provinces, and are in a dominated position in the network. In the basic innovation phase, Zhejiang, Shanghai and Jiangsu provinces and cities have a higher mean value of proximity to the center, and these provinces are all located in the eastern ocean economic circle, which has a strong foundation of the marine economy, a superior business environment for the marine industry, and leads the world in marine scientific and technological innovations, attracting science and technology, capital and talents from all over the world, and dominating the global marine factor agglomeration. The opposite is true for provinces such as Guangxi, Hebei, Liaoning and Fujian, which, due to their geographic location, are hardly able to benefit from other provinces in the spatial correlation network of innovation efficiency, and likewise, they do not have an obvious influence and driving effect on other provinces. The overall level of proximity centrality in the revenue transformation phase is lower than that in the applied R&D phase, indicating that with specialized technology transfer agencies, the independent intellectual property rights innovation system and the system of distributing revenues from scientific research results can be further improved and standardized to promote and safeguard the transformation of scientific and technological innovations into the new driving force of the marine economy.
(3) Intermediate centrality. The intermediate centrality degree is a measure of the control ability of provinces and cities over innovation resources in the spatial correlation network of MSTE. During the study period, the mean value of the intermediate centrality degree of MSTE showed an upward trend, indicating that the influence of some core nodes in the network structure has increased, while the network as a whole shows obvious unbalanced characteristics. In the basic innovation phase, Shanghai, Jiangsu, Shandong and other provinces and cities have the highest degree of intermediary centrality; in the applied R&D phase, Shanghai, Jiangsu, Shandong, Hebei and Guangdong have the highest degree of intermediary centrality, and the network control ability is significantly ahead of the network, and they become the important hubs and bridges for the occurrence of innovation linkages in other regions. In the gainful transformation phase, the addition of Fujian, Tianjin and other provinces and municipalities by 2021 indicates that these provinces and municipalities control the development of marine science and technology innovation and innovation efficiency linkages in other provinces and municipalities in the spatial linkage network, and most regions hold a certain degree of discourse in the MSTE network. Guangxi and Hebei are not on the shortest path connecting any two regions in the innovation efficiency network, and they lack control over innovation resources, which may be caused by a variety of reasons, such as relative backwardness in economic development, serious loss of high-quality talents, and lack of motivation due to the lack of innovation culture.
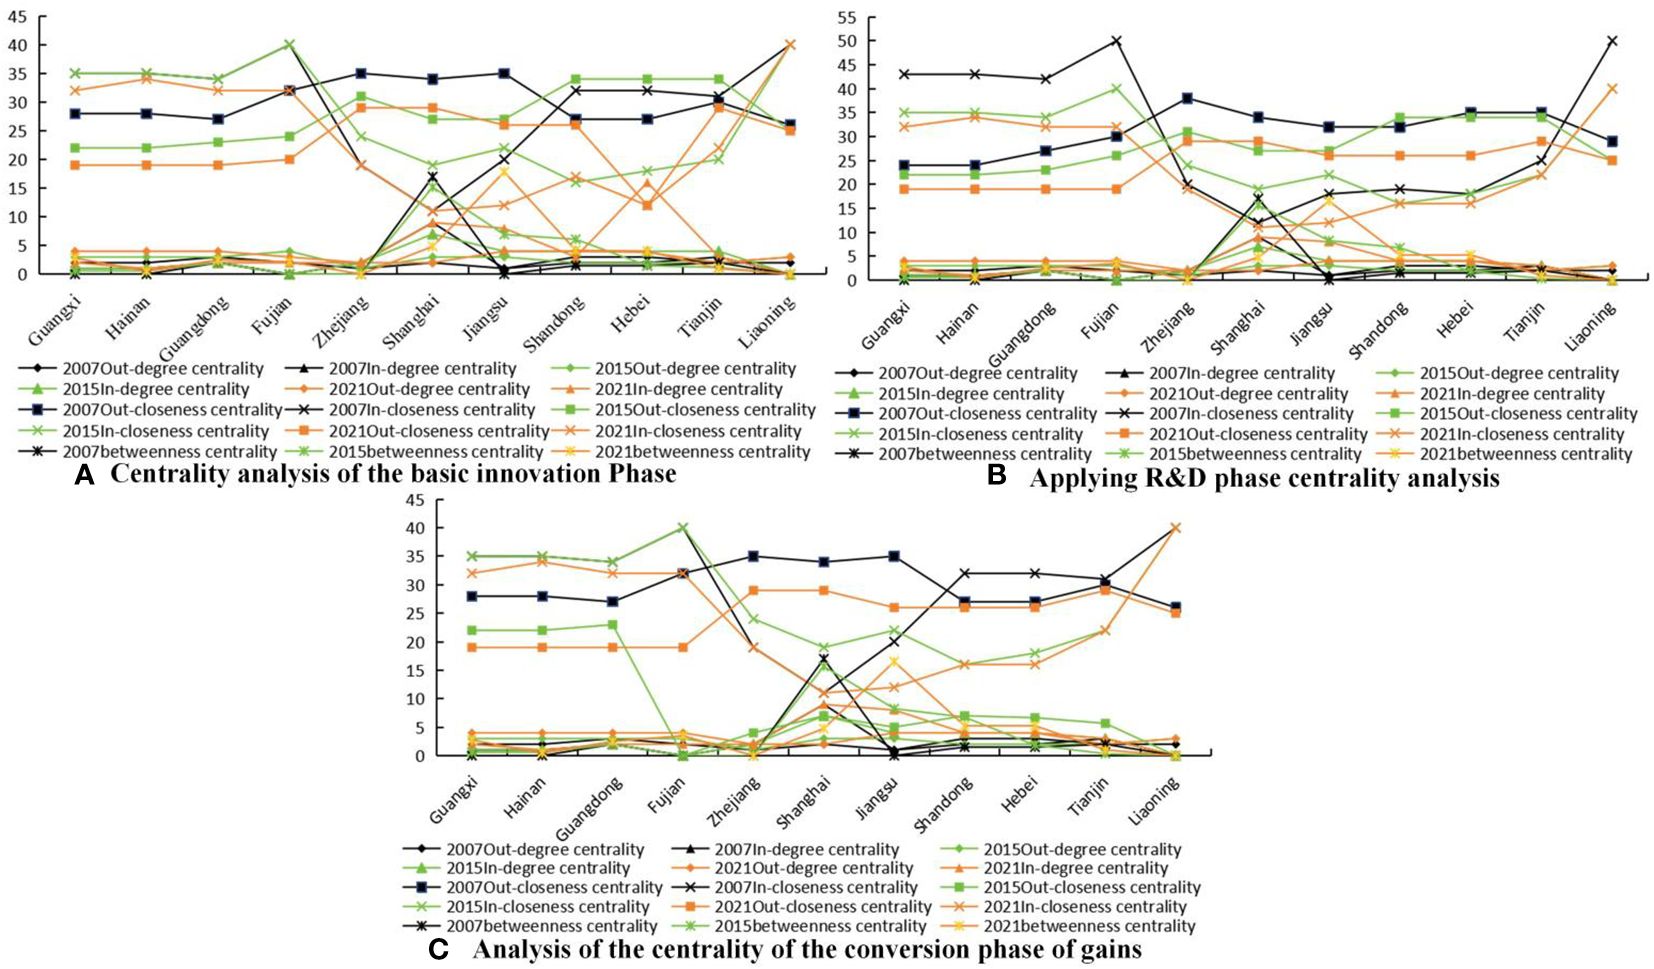
Figure 5 (A–C) Network centrality analysis of spatial correlation of MSTE in China.
In order to further reveal the spatial clustering and relationships and spillover paths in the spatial correlation network of MSTE, this paper adopts the CONCOR algorithm to analyze the block model of the spatial network of MSTE along the coasts of China, and sets the maximum segmentation depth to 2 and the convergence criterion to 0.2, which results in the plate division and spatial correlation relationship of the empty correlation network of the innovation efficiency of the high-tech industry (Table 5).

Table 5 Block model analysis.
At the phase of basic innovation, in 2007, the “net spillover” segment was mainly Guangxi, which had more spillover relationships than receiving relationships, had a high degree of external dependence, and was in a disadvantageous position in the spatial correlation network of MSTE.2021, the number of provinces in the “net spillover” segment increased, indicating that the disadvantageous position of these transformed provinces in MSTE has increased. In 2021, the number of provinces in the “net spillover” block increases, indicating that the disadvantageous position of MSTE of these transformed provinces has increased, which is mainly due to the insufficient authority of the national marine science and technology development planning programme at this phase, and the unresolved institutional and institutional factors restricting the innovation of marine science and technology, in addition to the irrationality of the allocation of marine science and technology resources and inputs that seriously affect the stimulation of the innovation potential of the basic phase of the marine industry. In 2007-2021, the “net benefit” plate is mainly composed of Jiangsu, Shanghai and Zhejiang; the “two-way overflow” plate is mainly composed of Guangdong, Tianjin and Fujian, which mainly involves state-level and provincial-level high-tech zones, which gather innovative resources, superimpose supportive policies, and have remarkable effect on the development of industrial agglomeration and strong attraction to factors in other provinces and cities. The attraction of factors from other provinces and cities is strong. Both the applied R&D phase and the revenue transformation phase form four segments, and most of the segments are composed of several neighboring provinces, except for some segments, which indicates that geographically neighboring provinces have more associative relationships with each other. From the distribution of each plate, the distribution of the plates in the 2 phases is similar, and the net gain plate is mainly located in economically developed regions with strong marine science and technology innovation capacity; the broker plate is located in Guangxi, Hebei, Liaoning and other provinces, mainly because the region actively implements the guidance for the transformation of marine scientific and technological achievements, and fully combines the particularities and difficulties of the marine field, and makes an overall consideration and systematic deployment, and plays an important role as a link in marine science and technology innovation.
On this basis, to further demonstrate the spillover relationship among the plates of the spatial network of MSTE, a map of the interactions among the four major plates was drawn, with space limitations showing only the correlation between the plates in 2007 and 2021. According to the data in Figure 6, in 2007, the first plate consisted of Jiangsu, Shandong and Hebei; the second plate consisted of Guangxi; the third plate consisted of Hainan, Guangdong and Tianjin; and the fourth plate consisted of Fujian, Shanghai, Liaoning and Zhejiang. The second plate has a spillover effect on the third and fourth plates in addition to its internal relations. At the same time, the first plate produces spillover effects to this fourth plate, which strengthens the spillover relationship between them and plays an intermediary role in the network. In addition, the fourth plate receives spillovers from the other three plates, which may be influenced by geographic location, economic linkages and resource allocation between the plates. According to the data in 2021, the second plate received a significantly stronger spillover effect from the third and fourth plates, which indicates that the linkages between the plates tend to be more complete. At the same time, the spillover effect of the second plate on the fourth plate is strengthened, and the spillover effect of the fourth plate on the first and second plates is significantly enhanced, which indicates that the fourth plate is beginning to show an exemplary leading role in the linkage network. This change may reflect the differences in the level of marine S&T innovation and the allocation of innovation resources among different sectors, as well as the mutual influence in interregional linkages. Overall, the spatial correlation of MSTE mostly occurs between the plates, and the linkage within the plates is relatively loose; although each plate has obvious clustering characteristics, its internal spatial relationship is not close, and the linkage between provinces within the plate needs to be enhanced; the role of each plate in the network is heterogeneous, with plate 2 and 3 being the main spillover plates, with a greater number of external spillover relationships, and plate 4 being the main beneficiary plate, and plate 1 being the broker. plate, and plate 1 is the broker plate, which plays an important intermediary role in the network.
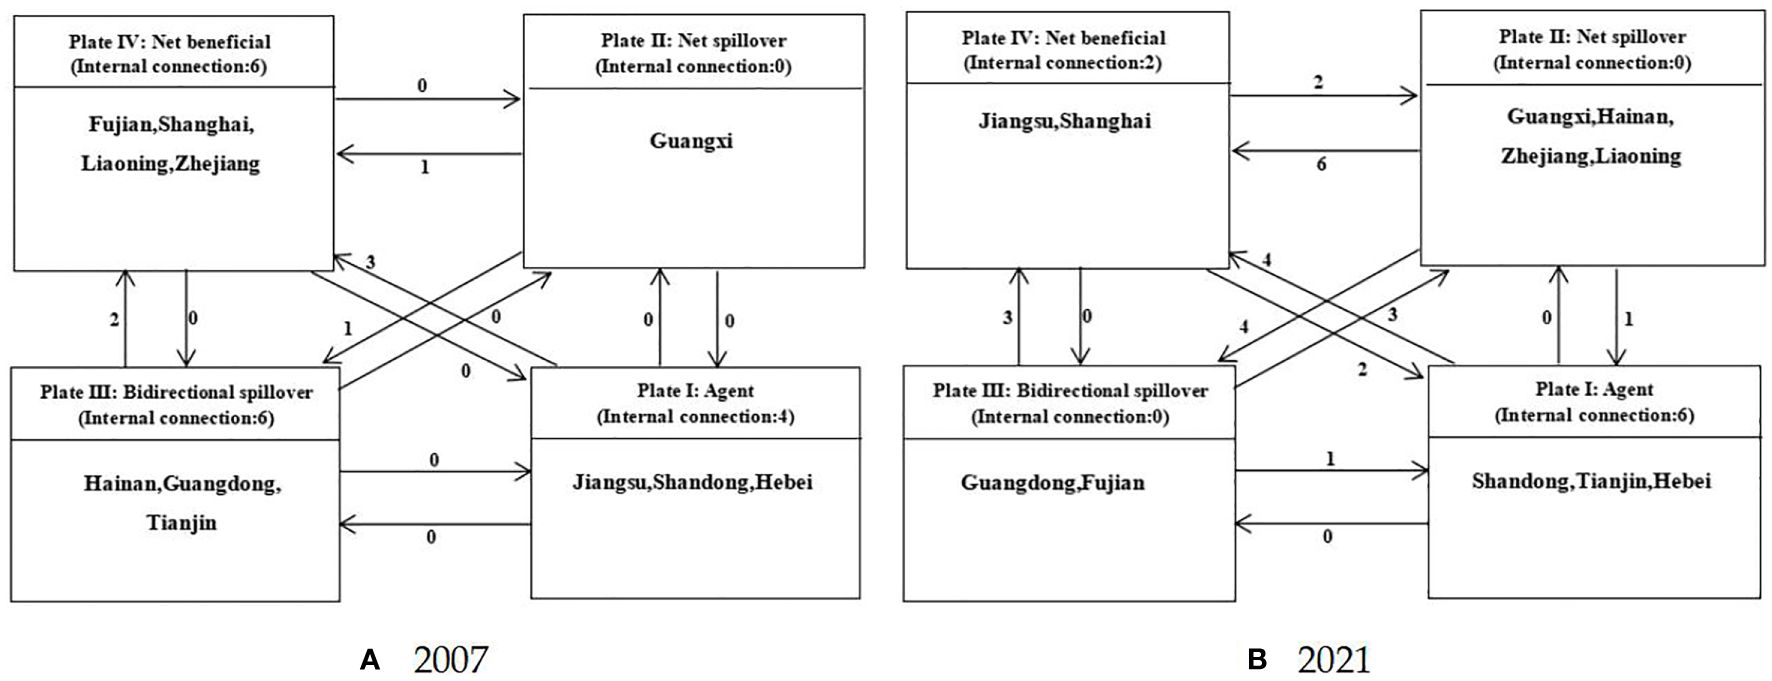
Figure 6 (A, B) Correlation between the efficiency segments of China’s marine science and technology innovation.
According to the statistical results in Table 6, it is found that the correlation coefficients of the three factors, namely the optimization of the marine industrial structure, the improvement of the marine management services and the increase in the degree of openness to the outside world, have passed the test of significance at the level of 1%, which indicates that these three factors play an important role in promoting the formation of the spatial correlation network structure of MSTE. The richness of marine resource endowment means that there are more resources for S&T innovation, thus increasing the potential of S&T innovation. Increased openness to the outside world means more opportunities for international cooperation and exchange, which promotes the development of domestic S&T innovation. However, the correlation coefficient for the size of the marine economy is negative, which may imply that as the size of the marine economy expands, the needs and requirements for S&T innovation will increase accordingly, leading to an increase in S&T innovation pressure. Although the importance of government support for marine S&T innovation is self-evident, the differences between provinces do not have a significant impact on the efficiency of marine S&T innovation.
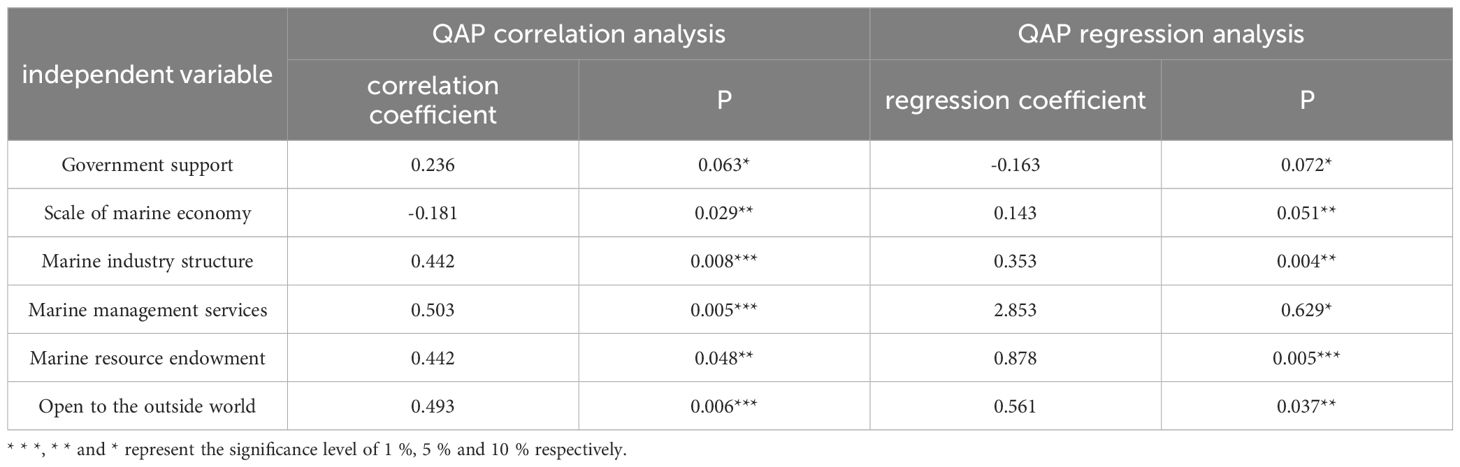
Table 6 Analysis of results of impact factors.
In order to control the influence of multicollinearity on the regression results, this study conducted a QAP regression analysis on the model of factors influencing the spatial correlation of MSTE in China with the help of Ucinet 6.0 software. According to Table 5, the regression coefficient of marine resource endowment passed the 1% significance test and was positive, indicating that marine resource endowment has a significant positive effect on the spatial association of MSTE. In addition, the three factors of marine industry structure, degree of openness to the outside world and scale of marine economy have a significant effect at the 5% level and their regression coefficients are positive, which indicates that these factors also have a positive effect on the spatial correlation of MSTE. The regression coefficient of freshwater aquaculture technology is significantly positive at the 1% level, indicating that the greater the difference in energy-saving technologies, the more likely the spatial correlation of MSTE occurs between provinces. In terms of marine management services, their degree of perfection provides strong support and guarantee for science and technology innovation and promotes the process of marine science and technology innovation. However, the regression coefficient of government support shows a significant negative association at a statistical significance level of 10%. This may be related to the blind investment behavior of local governments in the process of developing marine economy, resulting in the insignificant impact of government support on input-output MSTE.
Based on the perspective of innovation value chain, the marine science and technology innovation system is studied, the internal structure and operation process of the system are analyzed in depth, the sharing of the initial marine innovation R&D inputs in the sub-phases of marine science and technology innovation is taken into consideration, and the characteristics of the networked flow of innovation R&D inputs in multiple paths and hierarchical levels are revealed. The marine science and technology innovation process is divided into three sub-phases: basic innovation, applied R&D, and gainful transformation, and a perfect indicator system containing initial innovation R&D inputs, intermediate scientific and technological fruit outputs, non-innovation R&D inputs, and final economic outputs is constructed, and considering that the scientific and technological fruit inputs can’t be transformed into economic outputs spontaneously, additional non-innovation R&D inputs are added. The index system constructed in this paper can better fit the input and output status of marine science and technology innovation and scientifically measure MSTE.
Through literature combing, it is known that most of the existing MSTE studies ignore the potential impact of inter-regional geospatial links, and regard the study area as a homogeneous closed system. Therefore, this paper amends the gravity model to consider the innovation capacity of marine science and technology innovation, marine economic and social situation, take the geometric mean of MSTE, GDP, and the number of resident population as the regional quality, set the distance attenuation coefficient to 1 to adapt to the study of China’s coastal region scope, and measure the strength of the three-phase MSTE among the coastal provinces. Starting from the social network perspective, quantifying the marine science and technology innovation and innovation linkages between regions to portray MSTE network, and analyzing the network evolution characteristics based on the spatial and temporal perspectives can effectively grasp the evolution trend of the development of the linkages of MSTE and facilitate the provision of a reference basis for the high-quality development of China’s marine economy.
Improvement of the traditional gravity model based on the three phases of MSTE in China’s coastal regions and the economic distance between regions can improve the science, accuracy and comprehensiveness of the quantitative measurement of marine science and technology innovation linkages; in the study of influencing factors, the use of the QAP analysis method, which is able to deal with the correlation between relational data as well as the role of driving, to explore the impact of the differences in the various types of elements of the development of MSTE on the linkage of marine science and technology innovation can better put forward the countermeasures to promote the synergistic development of regional marine science and technology innovation from the point of view of the disparity in the basis of development between regions.
This paper still has the following shortcomings. The spatial correlation network constructed in this paper can only reveal the marine science and technology innovation correlation between provinces, and it is difficult to judge the strength of the correlation, and in the future, we can explore the dynamic correlation relationship and spillover effect of MSTE at different spatial scales by refining the research scale. This paper only analyses the factors affecting the spatial correlation of MSTE, but due to the vastness of China’s sea area and the large differences in the natural, economic and social development between regions, the personality traits can be further analyzed to further analyze the mechanism affecting the regional marine innovation efficiency. This study did not simulate and predict the evolution trend of the spatial correlation network structure of MSTE, which can be investigated by scenario analysis in the future. In future research, these issues will be further explored, and the related issues of the spatial correlation network of MSTE will be investigated in greater depth.
(1) The spatial correlation of MSTE has gradually developed from a sparse and scattered state to a close and balanced trend, and the spatial correlation of MSTE between different regions has been increasingly strengthened. The three stages gradually show a development pattern of single center, multi center and network. The network structure characteristics of MSTE in each stage are similar, indicating that the spatial correlation network structure of China ‘s coastal provinces has strong robustness. This provides new opportunities and challenges for the development of marine science and technology innovation in China ‘s coastal provinces. In the future, all regions need to continue to strengthen cooperation and exchanges to jointly promote the prosperity and development of marine science and technology innovation.
(2) Through the overall network characteristics, it is found that the network correlation degree of MSTE in the three stages from 2007 to 2021 is 1, and the robustness of the network is strong. The network relationship number and network density show a fluctuating growth trend, the network grade and network efficiency are declining, and the redundant channels of MSTE among provinces are increasing. There is no strict hierarchical structure in the spatial correlation network, and the spatial correlation of innovation and development between regions is increasing year by year. The correlation between applied R&D and profitability transformation stage is stronger than that of basic innovation stage, and cross-regional collaborative innovation needs to be improved. We should strengthen exchanges and cooperation among regions, share innovative resources and experience, and jointly promote the development of marine science and technology innovation.
(3) Through the characteristics of individual networks, it is found that in the basic innovation stage, Shanghai, Tianjin, Guangdong and other regions occupy the central position in the spatial correlation network, occupy the advantage in the spatial network of MSTE, and form a significant spillover effect on other regions; Guangxi, Fujian, Hebei and other regions have weak control over the spatial correlation network, and many of them are at the edge of the correlation network; the measurement results of the applied R&D stage and the profitability transformation stage are basically consistent with the basic innovation stage. In the three stages showed a clear center-edge distribution. In the future marine science and technology innovation work, we should pay more attention to the efficiency improvement of applied R&D and achievement transformation, so as to promote the coordinated development of the whole innovation system.
(4) The spatial correlation network for the development of MSTE has formed four segments, namely, two-way spillover, brokers, net spillover and net benefit, at all three phases, and the transmission of kinetic energy for the development of regional science and technology innovation has a clear gradient characteristic. In the basic innovation phase, the “net benefit” segment is mainly composed of Jiangsu, Shanghai and Zhejiang; the “two-way spillover” segment is mainly composed of Guangdong, Tianjin and Fujian, which is highly attractive to factors from other provinces and cities. Most of the plates in the applied R&D phase and gainful transformation phase are composed of several neighboring provinces, and the net gain plate is mainly located in economically developed regions with strong marine science and technology innovation capacity; the broker plate is located in Guangxi, Hebei, Liaoning and other provinces, which plays an important role in marine science and technology innovation as a link.
(5) The government’s support for the marine industry, the structural adjustment and optimization of the marine industry, and the improvement of marine management services all help to enhance the spatial relevance of the development of MSTE, which is manifested in various aspects, such as the close coordination between policies and industrial development, the optimization of resource allocation, and the improvement of market mechanisms. The positive effect of the abundance and utilization value of marine resources on the development of MSTE tends to diminish, i.e. the advantages of marine resources are gradually diminishing. The degree of marketisation and the degree of opening up to the outside world, on the other hand, have a negative effect, probably because excessive marketisation may lead to unfair distribution of resources, hindering the smooth development of innovation; while the increase in the degree of opening up to the outside world may make the domestic marine industry face fiercer competition, and may also bring about a certain impact on the local industry.
(1) Deepen cooperation and exchanges between regions, break geographical boundaries, and form a closer and more balanced marine science and technology innovation network. Build a marine science and technology innovation cooperation platform, strengthen information sharing, resource integration and complementary advantages, and form a closer innovation network. At the same time, it encourages cross-regional and cross-industry collaborative innovation and promotes cross-border integration of marine science and technology innovation. In particular, it is necessary to strengthen the radiation and driving role of central areas such as Shanghai, Tianjin and Guangdong, promote the sharing of innovative resources and experience through technology transfer and personnel training, and promote the coordinated development of marine science and technology innovation.
(2) According to the different characteristics of the basic innovation stage, the applied R & D stage and the profitable transformation stage, it is suggested that each region should formulate targeted innovation policies and development strategies according to its own development stage and advantageous areas. In the stage of basic innovation, we should pay attention to strengthening basic research and personnel training; in the stage of applied research and development, pay attention to technological innovation and product upgrading; in the stage of profitability transformation, pay attention to market expansion and brand building. Through the coordinated development of different stages, promote the all-round development of marine science and technology innovation.
(3) In view of the robustness of the network structure of marine science and technology innovation efficiency, it is suggested that each region should further optimize the network layout and improve the network efficiency and stability on the basis of maintaining the existing network structure. It can strengthen the construction of key nodes and improve the overall connectivity and transmission efficiency of the network. At the same time, we should pay attention to cultivating new innovation growth points, expanding network coverage, and improving the overall level of marine science and technology innovation.
(4) In view of the influence of the government ‘s support for the marine industry, the adjustment and optimization of the marine industrial structure, and the improvement of marine management services, it is suggested that the government should increase its support for marine science and technology innovation, formulate more preferential policy measures, and attract more innovative resources and talent investment. At the same time, it will promote the structural adjustment and optimization of the marine industry and enhance the added value and market competitiveness of the industry. Strengthen the improvement of marine management services and provide better protection and support for marine science and technology innovation.
The datasets presented in this study can be found in online repositories. The names of the repository/repositories and accession number(s) can be found in the article/supplementary material.
XC: Conceptualization, Data curation, Formal analysis, Investigation, Writing – original draft, Writing – review & editing. QD: Formal analysis, Funding acquisition, Investigation, Resources, Writing – review & editing. WJ: Funding acquisition, Investigation, Methodology, Project administration, Resources, Writing – original draft. JZ: Investigation, Methodology, Project administration, Resources, Software, Writing – original draft. CL: Resources, Software, Supervision, Validation, Visualization, Writing – original draft.
The author(s) declare financial support was received for the research, authorship, and/or publication of this article. This work was supported by the funding for the key research base of humanities and Social Sciences of Universities in Hebei Province (HYZD202301).This work was supported by the National Natural Science Fund Project of China (No.42076222).
We acknowledge the use of data support from “Ministry of Ecology and Environment of the People’s republic of China, Ministry of Natural Resources of the People’s Republic of China, China marineic Information Network(http://www.nmdis.org.cn) and National Science & Technology Infrastructure(http://mds.nmdis.org.cn)”. In addition, Editage (http://www.editage.cn/) has corrected this article for English language errors. Constructive suggestions.
The authors declare that the research was conducted in the absence of any commercial or financial relationships that could be construed as a potential conflict of interest.
All claims expressed in this article are solely those of the authors and do not necessarily represent those of their affiliated organizations, or those of the publisher, the editors and the reviewers. Any product that may be evaluated in this article, or claim that may be made by its manufacturer, is not guaranteed or endorsed by the publisher.
Carayannis E. G., Goletsis Y., Grigoroudis E. (2015). Multi-level multi-phase efficiency measurement: the case of innovation systems. Oper. Res. 15, 253–274. doi: 10.1007/s12351-015-0176-y
Chen K. H., Guan J. C., Kou M. T., Kang X. M. (2013). An applied study of network DEA model to the efficiency measurement of scientific and technologic innovation investment. Manage. Rev. 25, 3–14 + 68. doi: 10.14120/j.cnki.cn11-5057/f.2013.12.008
Chen X., Di Q., Hou Z., Yu Z. (2022). Measurement of carbon emissions from marine fisheries and system dynamics simulation analysis: China’s northern marine economic zone case. Mar. Policy 145, 105279. doi: 10.1016/j.marpol.2022.105279
Chen X., Di Q., Jia W., Hou Z. (2023a). Spatial correlation network of pollution and carbon emission reductions coupled with high-quality economic development in three Chinese urban agglomerations. Sustain. Cities. Soc 94, 104552. doi: 10.1016/j.scs.2023.104552
Chen X., Yu Z., Di Q. (2023b). Assessing the marine ecological welfare performance of coastal regions in China and analyzing its determining factors. Ecol. Indic. 147, 109942. doi: 10.1016/j.ecolind.2023.109942
Chen X., Liang C., Di Q. (2024a). Coordination mechanism and empirical research on marine science technology innovation and marine eco-civilization: A case study of coastal areas of China. Chinese. Geogr. Sci. 34, 468–486. doi: 10.1007/s11769-024-1418-9
Chen X., Sun Z., Di Q., Liang C. (2024b). Marine fishery carbon emission reduction and changing factors behind marine fishery eco-efficiency growth in China. Ecol. Inform. 80, 102478. doi: 10.1016/j.ecoinf.2024.102478
Chen Z., Ma L. (2020). Research on spatial pattern and spatial effect of marine science and technology innovation efficiency in China’s coastal provinces. J. Coastal. Res. 115, 42–45. doi: 10.2112/JCR-SI115-013.1
Cheng M., Li Q., Wen Z. (2023). Coupling coordination degree analysis and driving factors of innovation network and eco-efficiency in China. Environ. Impact. Asses. 99, 107008. doi: 10.1016/j.eiar.2022.107008
Chu X. X., Ma Y. (2020). Evaluation on the efficiency of scientific and technological innovation in Chinese universities from the perspective of innovation value chain. Sci. Technol. Manage. Res. 40, 119–123. doi: 10.3969/j.issn.1000-7695.2020.22.016
Dai B., King K., Han M. F. (2015). Analysis on temporal and spatial evolution of marine science and technology total factor productivity and its influencing factors in Chinese coastal areas. Geogra. Res. 34, 328–340. doi: 10.11821/dlyj201502012
Ganotakis P., Love J. H. (2012). The innovation value chain in new technology-based firms: Evidence from the UK. J. Prod. Innovat. Manage. 29, 839–860. doi: 10.1111/j.1540-5885.2012.00938.x
Garcia-Soto C., Seys J. J., Zielinski O., Busch J. A., Luna S. I., Baez J. C., et al. (2021). Marine citizen science: Current state in Europe and new technological developments. Front. Mar. Sci. 8. doi: 10.3389/fmars.2021.621472
Haschka R. E., Herwartz H. (2020). Innovation efficiency in European high-tech industries: Evidence from a Bayesian stochastic frontier approach. Res. Policy 49, 104054. doi: 10.1016/j.respol.2020.104054
Hu D., Jiao J., Chen C., Xiao R., Tang Y. (2022). Does global value chain embeddednessmatter for the green innovation value chain? Front. Environ. Sc. 10. doi: 10.3389/fenvs.2022.779617
Huang Y., Wang Y. (2020). How does high-speed railway affect green innovation efficiency? A perspective of innovation factor mobility. J. Clean. Prod. 265, 121623. doi: 10.1186/s12302-023-00803-7
Jiang B., Zhou X. M., Li J. (2015). Research on regional differences in input-output efficiency of marine science and technology in China-Based on super-efficiency DEA window-Malmquist index. Scie. technol. Manage. Res. 35 (10), 49. –53. doi: 10.3969/j.issn.1000-7695.2015.10.011
Li Z., Cui L. (2023). Establishment of the diversified cultivation system of practical innovation ability for marine science and technology talents. Adult. High. Educ. 5, 56–62. doi: 10.23977/aduhe.2023.050909
Li S. H., Zhu S. T. (2020). From realization to transformation : the evolution and efficiency of scientific and technological innovation in universities. Tsinghua. J.Educ. 41 (06), 53–62. doi: 10.14138/j.1001-4519.2020.06.005310
Li R., Wang Q., Ge Y. (2023). Does trade protection undercut the green efficiency of the marine economy? A case study. Mar. Policy. 157, 105864. doi: 10.1016/j.marpol.2023.105864
Li B., Yang M., Dai G. L., Yang J., Wang J. (2016). An analysis of the efficiency of regional marine science and technology innovation in China based on the three-phase DEA model Mar. Econom. 6 (2), 47–53. doi: 10.3969/j.issn.2095-1647.2016.02.007
Li G., Zhou Y., Liu F., Tian A. (2021). Regional difference and convergence analysis of marine science and technology innovation efficiency in China. Ocean. Coast. Manage. 205, 105581. doi: 10.1016/j.ocecoaman.2021.105581
Liu J. S., Kan L. R. (2011). Knowledge source, output and transforming performance of scientific achievements: A study based on Innovation value Chain. Sci. Sci. Manage. S.& T. 32, 33–40.
Liu S. L., Jiang X. P., Yu Q. (2015). Three-stage characteristics and evolution of technological innovation in China 's high-tech industry. J. Quant. Technical. Economic. 32 (7), 104–116. doi: 10.13653/j.cnki.jqte.2015.07.008
Liu D. H., Li S., Li X. X., Xu M. (2018). China ‘s marine science and technology input-output efficiency analysis and 13th Five-Year trend prediction. Sci. Technol. Manage. Res. 38 (9), 110–117. doi: 10.3969/j.issn.1000-7695.2018.09.016
Liu S., Wang J. (2022). Coupling coordination between marine S&T innovation and the high-quality development of the marine economy: A case study of China’s coastal provinces. Sustain 14, 7373. doi: 10.3390/su14127373
Liu P., Zhang L., Tarbert H., Yan Z. (2022). Analysis on spatio-temporal characteristics and influencing factors of industrial green innovation efficiency—From the perspective of innovation value chain. Sustain 14, 342. doi: 10.3390/su14010342
Liu F. C., Zhang N., Zhao L. S. (2020). Research on innovation efficiency evaluation of three provinces in northeast China in high-tech manufacturing industry: based on two-phase network DEA model. Manage. Rev. 32, 90–103. doi: 10.14120/j.cnki.cn11-5057/f.2020.04.008
Odeck J., Brathen S. (2012). A meta-analysis of DEA and SFA studies of the technical efficiency of seaports: a comparison of fixed and random effects regression models. Transport. Res. Part A: Policy. Pract. 46, 1574–1585. doi: 10.1016/j.tra.2012.08.006
Qin X. H., Du D. B., Liu S. F., Fan F. (2017). Spatial-temporal pattern and influencing factors in transforming efficiency of scientific research achievements of universities on a provincial scale in China based on the network SBM method. Geogr. Res. 36 (9), 1641–1652. doi: 10.11821/dlyj201709004
Roper S., Du J., Love J. H. (2008). Modelling the innovation value chain. Res. Policy. 37, 961–977. doi: 10.1016/j.respol.2008.04.005
Shang K., Zhang Y., Li X., Li W., Zhou G. (2023). Spatial characteristics and influencing factors of night cultural and tourism consumption agglomeration areas in China. IEEE J. Select. Topics Appl. Earth Observ. Remote Sens 17 (99), 261–273. doi: 10.1109/JSTARS.2023.3328398
Sun Z. R., Fan J., Sun Y., Liu H. C. (2022). Structural characteristics and influencing factors of spatial correlation network of freen science and technology innovation efficiency in China. Econ. Geogr. 42, 33–43. doi: 10.15957/j.cnki.jjdl.2022.03.004
Taghizadeh S. K., Jayaraman K. S., Ismail I., Rahman S. A. (2014). Innovation value chain as predictors for innovation strategy in Malaysian telecommunication industry. Prob. Perspect. Manage. 12, 533–539.
Tai W. (2014). Efficiency analysis of marine science and technology innovation in coastal provinces and cities based on DEA. J.Jiangsu Ocean Univer.(Nat. Scie. Edit.). 23 (4), 68–71. doi: 10.3969/j.issn.1672-6685.2014.04.016
Tian P., Liu Y., Li J., Pu R., Cao L., Zhang H. (2023). Spatiotemporal patterns of urban expansion and trade-offs and synergies among ecosystem services in urban agglomerations of China. Ecol. Indic. 148, 110057. doi: 10.1016/j.ecolind.2023.110057
Tian P., Liu Y., Li J., Wang H., Zhang H., Ai S., et al. (2024). Tracking annual changes of coastal aquaculture ponds in China during 1986–2021. Aquaculture 589, 740965. doi: 10.1016/j.aquaculture.2024.740965
Tingley D., Pascoe S., Coglan L. (2005). Factors affecting technical efficiency in fisheries: stochastic production frontier versus data envelopment analysis approaches. Fish. Res. 73, 363–376. doi: 10.1016/j.fishres.2005.01.008
Wang K. L., Bian Y. J., Cheng Y. H. (2022). Exploring the spatial correlation network structure of green innovation efficiency in the Yangtze river delta, China. Sustain 14, 3903. doi: 10.3390/su14073903
Wang X. C., Han Z. L., Peng F., Cai X. Z. (2020). Development pattern and typical zone of marine scientific and technological innovation efficiency in China. Scientia. Geographica. Sinica. 40, 890–899. doi: 10.13249/j.cnki.sgs.2020.06.004
Wang J., Shi X., Du Y. (2021a). Exploring the relationship among marine science and technology innovation, marine finance, and marine higher education using a coupling analysis: A case study of China’s coastal areas. Mar. Policy. 132, 104706. doi: 10.1016/j.marpol.2021.104706
Wang L., Su M., Kong H., Ma Y. (2021b). The impact of marine technological innovation on the upgrade of China’s marine industrial structure. Ocean. Coast. Manage. 211, 105792. doi: 10.1016/j.ocecoaman.2021.105792
Wu F., Cui F., Liu T. (2023). Empirical study on green development of marine economy driven by marine scientific and technological innovation and its influencing factors. Front. Env. Sci. 11. doi: 10.3389/fenvs.2023.1092712
Xiao R. Q., Qian L., Chen Z. W. (2012). Research on the innovation efficiency and its affecting factors in China's high-tech industries. J. Manage. Sci. 25 (5), 85–98. https://kns.cnki.net/kcms2/article/abstract?v=m22VhQxdXyfoJZsY9I6_hClTtoYjh3NLx50cl6QraWz0JMtfs2_8Rvl_dFCTgbf4mV4o8o_9smzuB79EMhgBCiSocVnIn290W3tQxCMrhRhstHDqKfZy1LQBp6NcxvN1&uniplatform=NZKPT&flag=copy.
Xie Z. Y., Ju F. H. (2012). Study on influencing factors of marine S&T innovation efficiency in China based on ultra-efficiency model. Sci. Manage. Res. 30, 13–16. doi: 10.19445/j.cnki.15-1103/g3.2012.06.004
Xu S., Li X. G. (2018). Comparative study on the efficiency of regional marine science and technology innovation from the perspective of innovation value chain. J. Ocean Univer. China (Soc. Sci.). 6), 19–26. doi: 10.16497/j.cnki.1672-335x.2018.06.003
Xue C., Wang X. H., Fu X. M. (2022). Study on spatial correlation and relevant factors of green total factor productivity of marine economy in China. Environ. Sustain. Dev. 47, 28–36. doi: 10.19758/j.cnki.issn1673-288x.202204028
Yang C., Lou X. (2016). Technical efficiency study on Japanese marine fisheries applying stochastic frontier analysis and data envelopment analysis approaches. Int. J. Fish. Aquat. Stud. 4, 135–141.
Yao M., Li Z., Wang Y. (2023). Features of industrial green technology innovation in the Yangtze River economic belt of China based on spatial correlation network. Sustain 15, 6033. doi: 10.3390/su15076033
Yu D., Zou Z. (2020). Empirical research on the interaction between marine scientific and technological innovation and marine economic development. J. Coastal. Res. 108, 7–11. doi: 10.2112/JCR-SI108-002.1
Yu Y. Z., Liu D. Y. (2013). The spatial spillover effect and value chain spillover effect of regional innovation efficiency in China-Research on multidimensional spatial panel model from the perspective of innovation value chain. J. Manag. World. (07), 6-20+70+187. doi: 10.19744/j.cnki.11-1235/f.2013.07.002
Zhang F. X., He Y. X., Xie S. M., Shi W. T., Zhang M. X., Wang Y. W., et al. (2023). Research on the game of fishermen’s cooperative behavior in developing marine carbon sink fisheries from a complex network perspective. Ocean. Coast. Manage. 244, 1–11. doi: 10.1016/j.ocecoaman.2023.106832
Zhang Y., Wang S. (2021). Influence of marine industrial agglomeration and environmental regulation on marine innovation efficiency—From an innovation value chain perspective. Mar. Policy. 134, 104807. doi: 10.1016/j.marpol.2021.104807
Keywords: innovation value chains, marine science and technology, innovation efficiency, spatially connected networks, social network analysis, formation mechanisms
Citation: Chen X, Di Q, Jia W, Zhang J and Liang C (2024) Spatial network structure and formation mechanism of China’s marine science and technology innovation efficiency from the perspective of innovation value chain. Front. Mar. Sci. 11:1430243. doi: 10.3389/fmars.2024.1430243
Received: 09 May 2024; Accepted: 18 June 2024;
Published: 05 July 2024.
Edited by:
Yuan-Wei Du, Yunnan University, ChinaReviewed by:
Jialin Li, Ningbo University, ChinaCopyright © 2024 Chen, Di, Jia, Zhang and Liang. This is an open-access article distributed under the terms of the Creative Commons Attribution License (CC BY). The use, distribution or reproduction in other forums is permitted, provided the original author(s) and the copyright owner(s) are credited and that the original publication in this journal is cited, in accordance with accepted academic practice. No use, distribution or reproduction is permitted which does not comply with these terms.
*Correspondence: Xiaolong Chen, Y2hlbnhsMDMxM0AxNjMuY29t; Qianbin Di, ZHFid21uQDE2My5jb20=
Disclaimer: All claims expressed in this article are solely those of the authors and do not necessarily represent those of their affiliated organizations, or those of the publisher, the editors and the reviewers. Any product that may be evaluated in this article or claim that may be made by its manufacturer is not guaranteed or endorsed by the publisher.
Research integrity at Frontiers
Learn more about the work of our research integrity team to safeguard the quality of each article we publish.