 Li Zheng
 Zenkai Zhang3
 Ye Yao
 Huibin Du
- 1College of Management and Economics, Tianjin University, Tianjin, China
- 2Division of Marine Economy, National Marine Data & Information Service, Tianjin, China
- 3College of the Environment and Ecology, Xiamen University, Xiamen, China
- 4National Industry-Education Integration Platform of Energy Storage, Tianjin University, Tianjin, China
The ocean industries are characterized by being export-driven. The exports of ocean industries (hereafter termed ocean exports) caused environmental pollution with amounts of CO2 emissions and thereby affected climate change. There is a need, therefore, for accurate assessments of CO2 emissions embodied in ocean exports—which can help policymakers adopt targeted emission-reduction measures to formulate sustainable ocean policies. However, few studies of ocean-industry emissions considered impacts in sectoral and trade pattern heterogeneity, especially from export perspective. To fill this gap, we measured and evaluated the export-embodied CO2 emissions from China’s ocean industries, based on our newly developed high-resolution and comparable time-series environmentally extended input–output database, called EE-DPN-OEIOT. The results showed that China’s ocean exports generated 94.3 Mt of embodied CO2 emissions in 2017, with nearly 40% originating from processing ocean exports. Regarding the evolution from 2007 to 2017, the total export-embodied CO2 emissions from ocean industries decreased by 7.3%, while the embodied CO2 emissions in processing ocean exports increased by 50.1%. From 2007 to 2017, the decrease in carbon emission intensity was the major driving factor of the downturn in export-embodied CO2 emissions across the total ocean economy and for seven ocean subsectors (60%), while the export-scale effect primarily drove the increases in CO2 emissions. Moreover, there were disparities in the driving factors behind changes in embodied CO2 emissions between processing and non-processing ocean exports. Based on our findings, we proposed three recommendations from a trade perspective to facilitate low-carbon sustainable transition of China’s ocean economy, thus better fulfilling Sustainable Development Goal 14.
1 Introduction
Since the beginning of the twenty-first century, the sustainable development of the ocean economy has attracted widespread attention (Wenhai et al., 2019; Lee et al., 2020; Hossain et al., 2024). With the vigorous exploitation of ocean resources and the use of large amounts of fossil energy, the ocean-economy activity inevitability generated environmental pollution of greenhouse gas emissions (Ziegler et al., 2019; Byrne et al., 2021). In particular, the carbon dioxide (hereafter termed CO2) emissions from various ocean-economy activities strengthened the environmental pollution and affects climate change (Li et al., 2021). Today’s ocean economy is largely export-driven, and the low-carbon transformation of the export of industry (hereafter termed ocean exports) is an important way to achieve the United Nations’ (UN) Sustainable Development Goal (SDG) 14 (UNCTAD, 2023). Exports of ocean-based goods and services reached $1.3 trillion in 2020, accounting for 6% of the global trade value (UNCTAD, 2023). The growth of ocean exports indeed stimulated ocean-economy growth (Zheng and Tian, 2021), but it also led to large-scale energy use and higher emissions (Yamano and Guilhoto, 2020; Wang et al., 2023). The demand for ocean-based goods and services and their associated CO2 emissions will grow as a result of increased international trade and economic growth. International maritime exports can transfer CO2 emissions from import-consuming countries to export-producing countries through the flow of goods and services (Long et al., 2018; Li et al., 2020). The UN’s International Maritime Organization (IMO) estimated that, from 2012 to 2018, nearly 71% of total shipping emissions originated from voyage-based international maritime transportation (IMO, 2021). Therefore, formulating the carbon-reduction policies for ocean industries from a trade perspective is critical for low-carbon sustainable transitions of the global ocean economy, especially for exporting countries. However, the status, evolution, and driving factors of embodied CO2 emission pollution from ocean exports throughout the industrial chain remain unclear. This has raised doubts about the fairness, effectiveness, and reliability of carbon reduction policies for ocean industries.
As the world’s second-largest exporter in ocean industries, China accounted for 12.3% of global ocean exports, with $160 billion of exports in 2020 (UNCTAD, 2023). Such a large volume of ocean exports inevitably caused high CO2 emissions in China. Thus, in order to facilitate low-carbon transition in ocean exports and achieve a sustainable ocean economy (Choudhary et al., 2021), it is necessary to formulate fair, effective trade policies that will help reduce CO2 emissions from China’s ocean exports. However, the CO2 emissions embodied (direct and indirect) in the entire industrial chain of China’s ocean exports remained poorly understood. Therefore, in this study, we took China as an example to accurately assess the embodied CO2 emissions in ocean industries from the export perspective. Then, to more deeply explore the causes, we identified the driving factors affecting the increases in CO2 emissions. By discussing the evolution and drivers of export-embodied CO2 emissions from China’s ocean industry, we intend to propose target policy recommendations from trade perspective to facilitate low-carbon transition of ocean industries in China. These initiatives to reduce export-embodied CO2 emissions from ocean industries can support marine biodiversity conservation by reducing pressure on marine environment, including slowing the rate of sea level rise, reducing ocean acidification, and reducing the intensity of extreme weather events caused by climate change. In a sum, these trade policies with environmental sustainability will support ocean economic growth while ensuring the health and resilience of marine ecosystems, thus contributing to the realization of SDG 14 (conserve and sustainably use the oceans, seas and marine resources for sustainable development).
When assessing CO2 emissions from ocean industries, limited previous studies focused on different ocean industries separately, such as specific sectors of marine fisheries (Ghosh et al., 2014; Wang and Wang, 2022; Li et al., 2022b), marine transportation (Nunes et al., 2019; Bagoulla and Guillotreau, 2020; Li et al., 2022a; Xu et al., 2024), and marine energy (Raadal et al., 2014). Input–output (IO) analysis, life cycle analysis, and Intergovernmental Panel on Climate Change methods were frequently applied to measure ocean-industry CO2 emissions at national level (Li et al., 2021) and provincial level (Wu and Li, 2022). Some scholars explored embodied CO2 emissions in a diverse range of ocean industries. Li et al. (2021) used an environmental IO method to calculate embodied CO2 emissions from China’s 13 major ocean industries; they found that the direct and indirect CO2 emissions from ocean industries accounted for over 10% of national CO2 emissions and their volumes increased from 2002 to 2017. For trade-linked CO2 emissions studies, a few scholars assessed trade-linked CO2 emissions from specific ocean sectors, especially marine transport sector (Fitzgerald et al., 2011; Yang et al., 2017). Fitzgerald et al. (2011) measured CO2 emissions from the imports and exports of New Zealand’s international maritime transport by using a cargo-based method. Yang et al. (2017) applied a bottom-up approach to measure CO2 emissions from sector of China’s international seaborne trade. As we known, the CO2 emissions embodied in international trade have been considered from life-cycle perspective, including direct emissions and indirect emissions. Despite such above work, few studies comprehensively considered embodied CO2 emissions in all ocean industries from an export perspective. Thus, there was uncertainty about the status and evolution of export-embodied CO2 emissions from all ocean industries and from each ocean subsector. This gap may result in an inaccurate understanding of the impact of sectoral heterogeneity on the export-embodied CO2 emissions from ocean industries.
Moreover, no study so far has comprehensively quantified the export-embodied CO2 emissions from all ocean industries across different trade patterns. The main reason is that there is a lack of publicly available statistical data on exports and imports for all ocean industries. Further, it is difficult to obtain comprehensive datasets on the processing export, non-processing export, and import data of ocean industries, both simply and directly. This increased the difficulty of identifying the impact of the trade pattern heterogeneity on export-embodied CO2 emissions from ocean industries. Studies emphasized that processing exports must be separated out from input–output tables when accounting for the environmental impact of international trade (Su et al., 2013; Jiang et al., 2017). On that basis, we recognized that processing exports depend heavily on the inputs of imported intermediate products, but generated fewer embodied emissions than that of non-processing trade. The traditional IO model—or the uniform export assumption—yielded heavily biased results that overestimated emissions in China’s exports, which could lead to inaccurate carbon-reduction policy design (Dietzenbacher et al., 2012; Jiang et al., 2016). To distinguish impact of trade heterogeneity and more accurately measure emissions from China’s processing and non-processing exports, studies used a DPN-IO table, which distinguished production for domestic demand (D), processing exports (P), and non-processing exports (N) (Chen et al., 2012; Xia et al., 2015; Jiang et al., 2016; Chen et al., 2019). However, since no authoritative DPN-IO table for the ocean economy had been developed, DPN-IO tables had not been used to accurately measure embodied CO2 emissions from processing ocean exports and non-processing ocean exports.
Clarifying the current status and evolution of embodied CO2 emissions from ocean industries alone is not sufficient to promote carbon reduction. While previous studies had explored the driving factors of carbon emissions from ocean industries, they mostly focused on specific industries, such as marine fisheries and marine transportation (Wang and Wang, 2022; Li et al., 2022a, Li et al., 2022b). Index decomposition analysis (IDA) and structural decomposition analysis (SDA) (Li et al., 2022a) were frequently used method to explore the driving factors of affecting ocean-industry emissions. SDA was mainly an analytical method based on input–output data. In contrast to IDA method, SDA was less applied owing to data limitations in the difficulty of obtaining IO data, but SDA had an important advantage of being used for comparative analysis that reflects the changes in certain indicators (Zheng et al., 2023). Different driving factors had been found to play distinct roles in driving specific ocean-industry carbon emissions; such factors mainly included carbon intensity, energy intensity, industrial structure, trade structure, and industrial scale. However, constrained by the availability of trade data for ocean industries, studies had been less likely to use SDA model to decompose the driving factors affecting export-embodied CO2 emission changes in all ocean industries. This hindered policymakers to formulate fair and effective policies from export perspective to reduce carbon emissions in the ocean economy. We aimed to enrich the application of SDA approaches by expanding new data sources such as non-competitive ocean-economy input–output database. On the basis of our newly developed database, we creatively employed SDA to evaluate each driver’s contributing rate for the changes in ocean export-embodied CO2 emissions and identified the key drivers. The results allowed us to identify the critical driving factors of CO2 emission increments by sector and export pattern. Thus, helping relevant management departments to formulate more effective carbon reduction strategies.
In summary, few studies discussed the evolution and drivers of embodied CO2 emissions from ocean industries from export perspective. We aimed to fill the abovementioned gaps by taking China as an example and combining two previously separate streams of research. The first dealt with the volume of ocean export-embodied CO2 emissions by sector and by trade mode; the other dealt with drivers affecting the evolution of CO2 emissions. On the basis of previous research, we intended to make the following three contributions in terms of data and modeling (Table 1): First, we filled the gap regarding the non-competitive input–output database of China’s ocean economy. By collecting economic and trade data for various ocean subsectors, we were the first to build high-resolution and comparable time-series database, which called environmentally extended ocean-economy input–output tables that distinguish processing exports (hereafter termed EE-DPN-OEIOTs). Second, we proposed a consumer-based accounting framework to accurately estimate export-embodied CO2 emissions from China’s ocean industries. By using our newly developed EE-DPN-OEIOTs, we provided accurate multiyear (2007, 2012, 2017) estimations of CO2 emissions embodied in China’s processing and non-processing ocean exports at the level of 82 sectors. Third, we innovatively explored how drivers influenced the evolution of export-embodied CO2 emissions from ocean industries across different sectors under different export patterns. This offered new insights for the policymaking related to the low-carbon transition of ocean industries from an export perspective. This study improved our understanding of sector and trade heterogeneity in the volume and evolution of export-embodied CO2 emissions from ocean industries. This is equally applicable to other coastal countries, especially those with a high proportion of processing ocean exports.
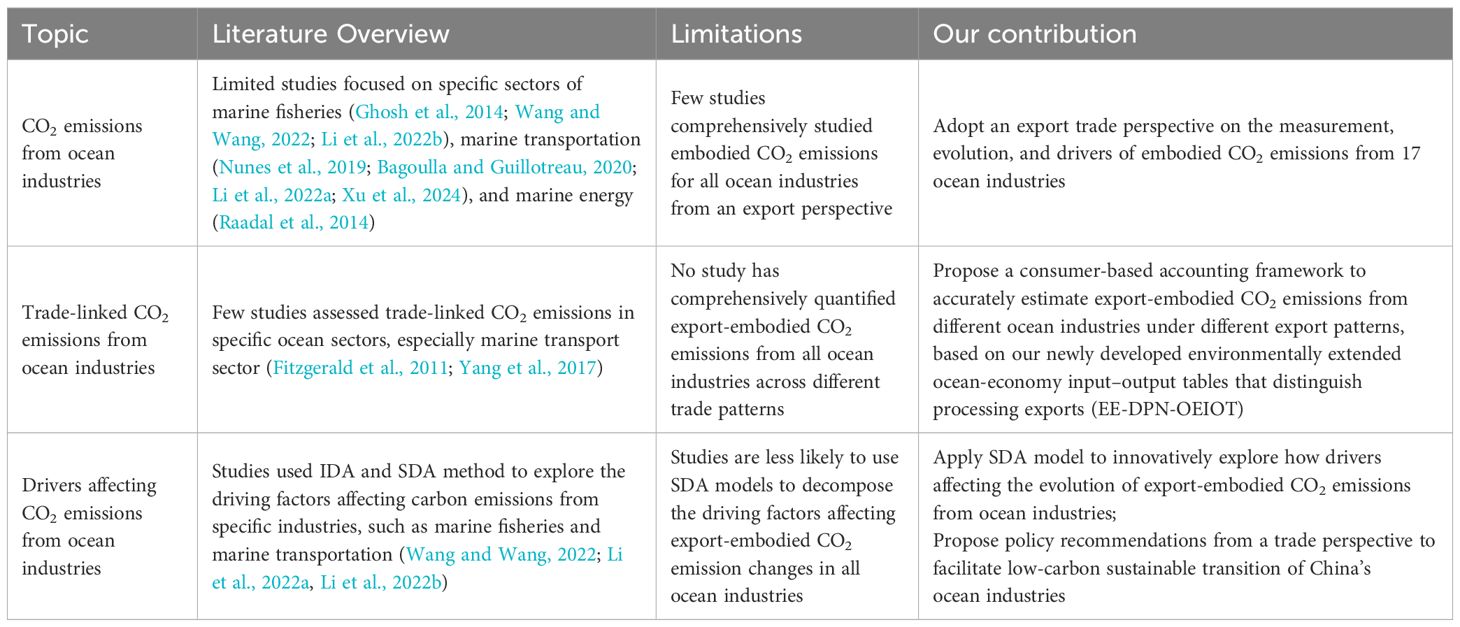
Table 1 Summary of existing studies and the present study’s contributions.
2 Methods and data sources
In this study, we assessed the export-embodied CO2 emissions from China’s ocean industries by using statistical methods. First, based on related statistical data, we creatively stripped ocean industries from DPN-IOTs to build China’s EE-DPN-OEIOTs. Second, by using EE-DPN-OEIOTs, we calculated the CO2 emission intensity and complete consumption coefficient, then constructed a consumer-based accounting model to estimate the export-embodied CO2 emissions from ocean industries with different types of subsectors and trade patterns. Finally, the additive SDA model was employed to explore the critical driving factors affecting the changes of embodied CO2 emissions. The schematic diagram of the methodologies used in this study was shown in Figure 1.
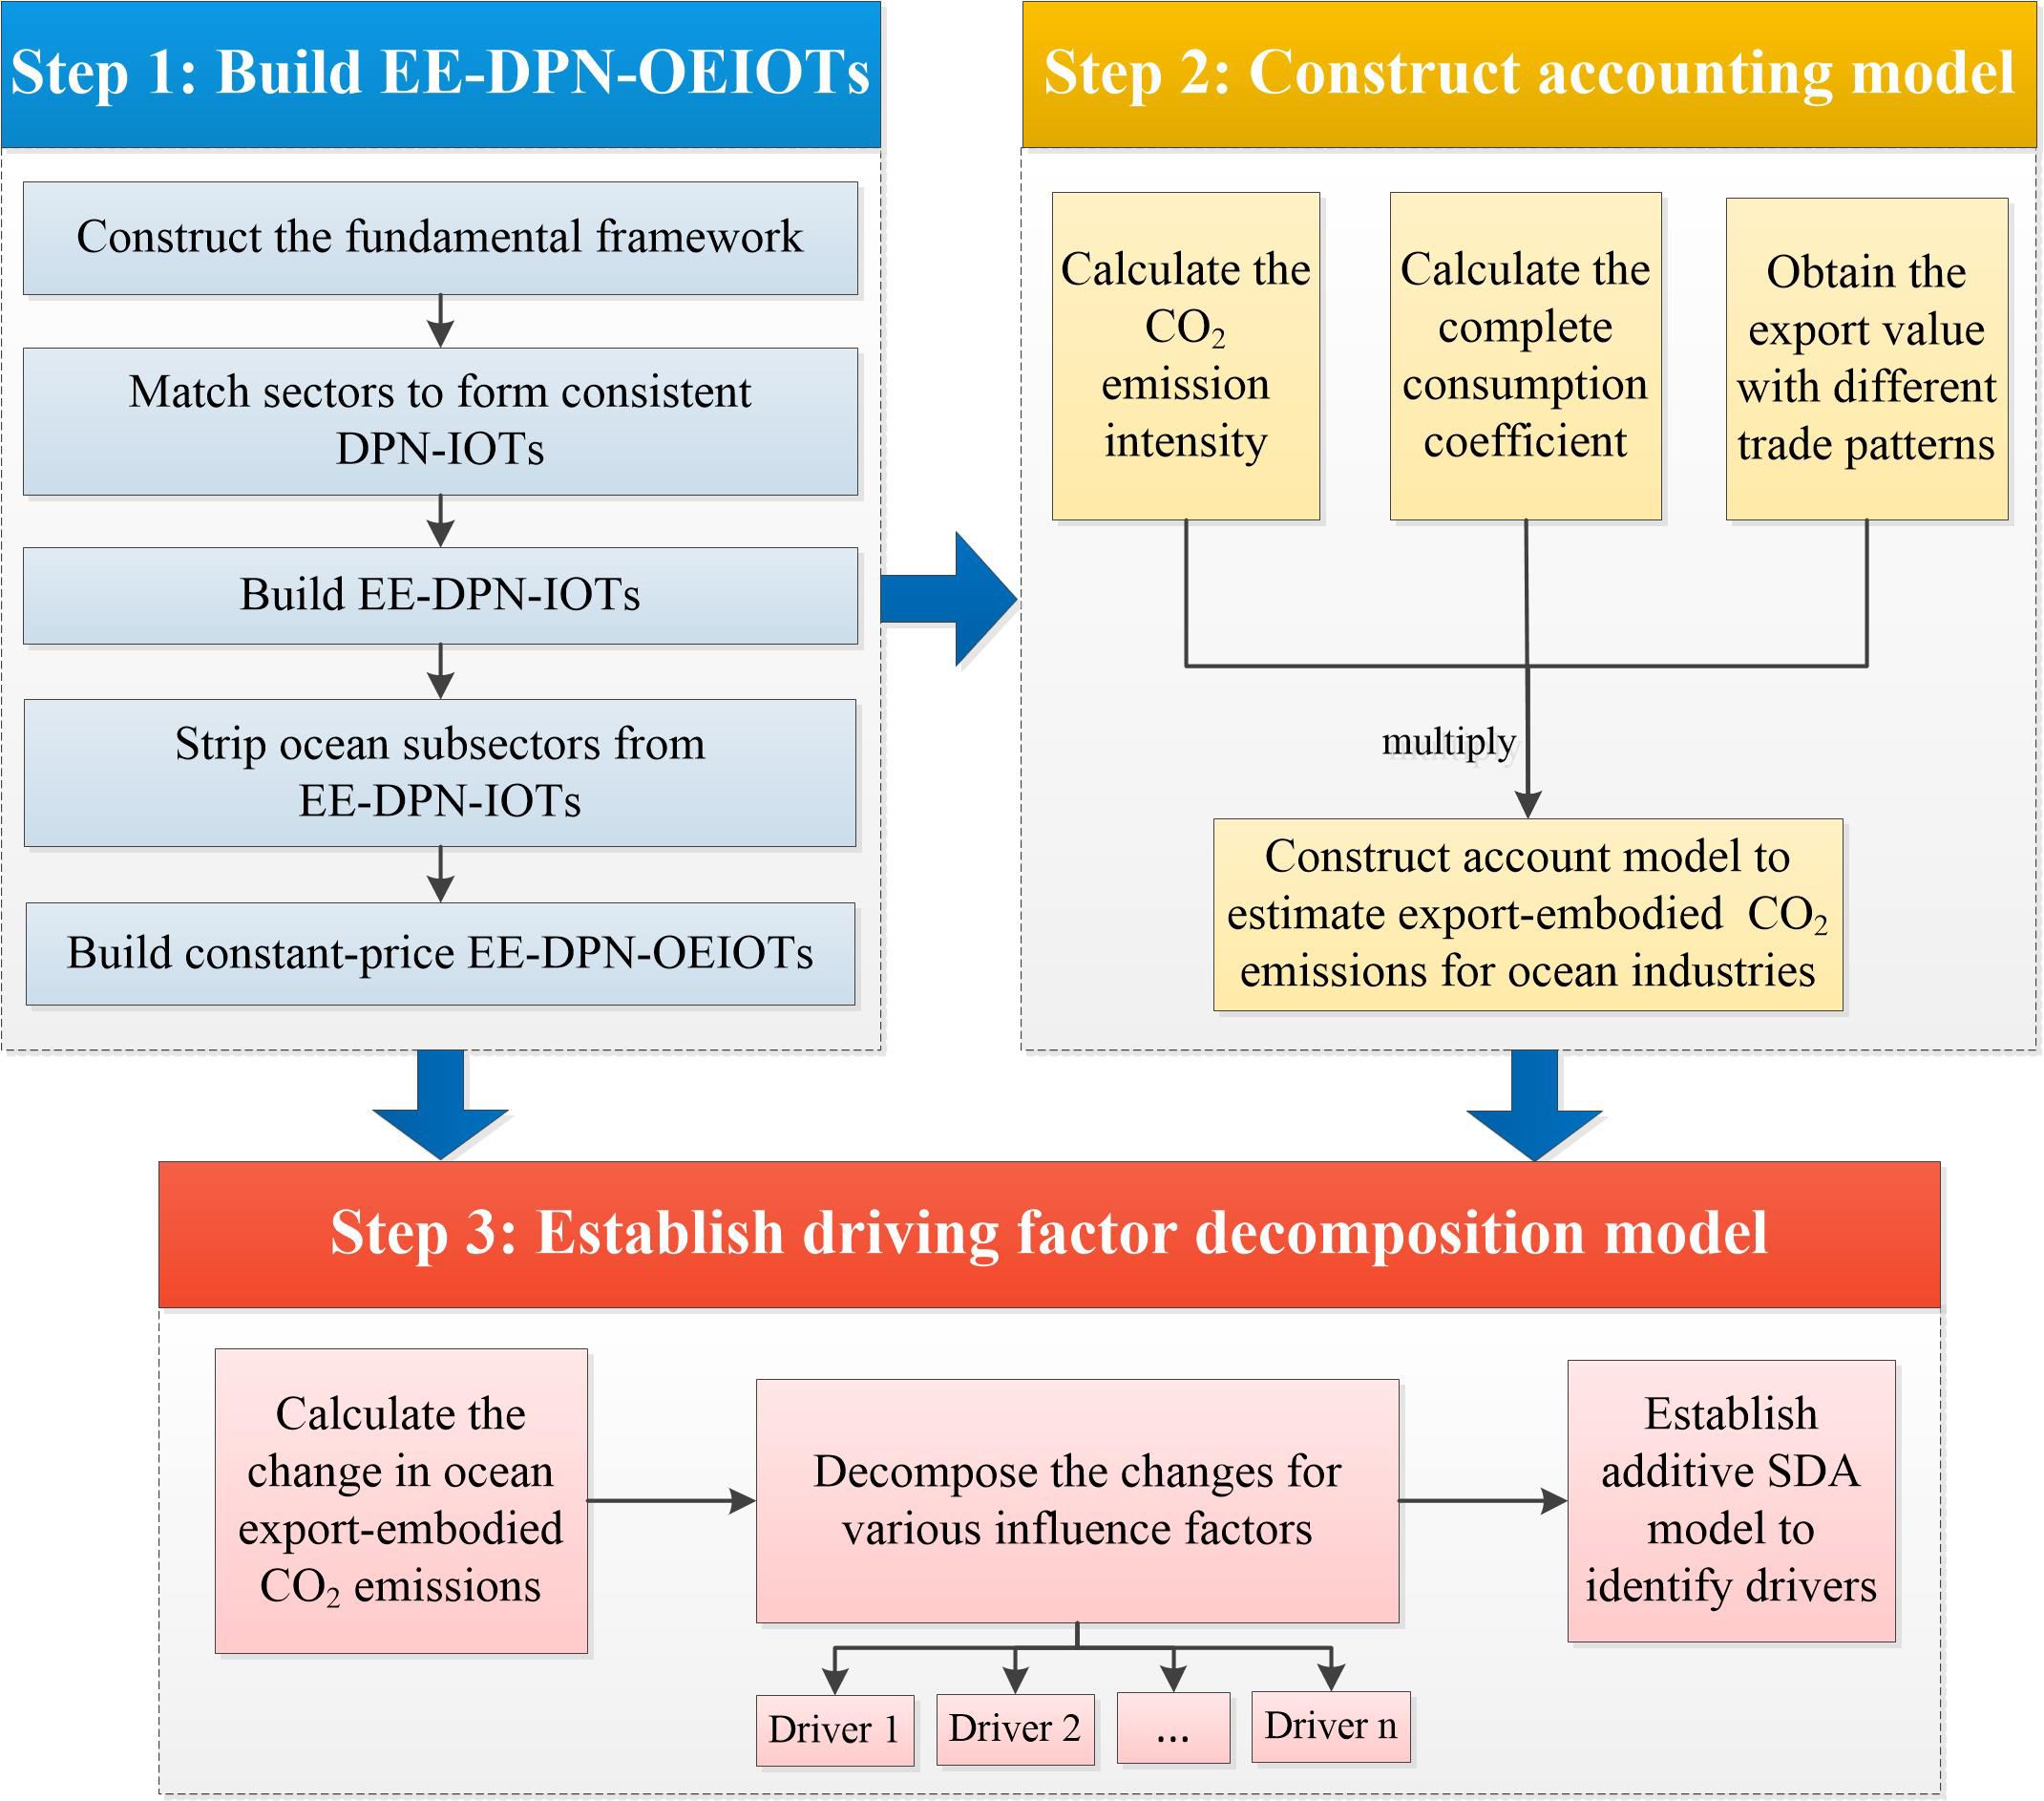
Figure 1 The schematic diagram of methodologies used in this study.
2.1 Compilation of EE-DPN-OEIOTs for China
Referring to the compiling China’s OEIOTs in Zheng et al. (2023), we stripped 17 ocean subsectors from national IO tables that explicitly distinguish processing trade (DPN-IOT) and added an environmentally extended account of sectoral CO2 emissions to obtain China’s EE-DPN-OEIOT. Figure 2 showed the detailed procedure. Our proposed high-resolution and comparable time-series database (EE-DPN-OEIOT) presented the economic–environmental linkages across different subsectors under different trade patterns in various years. It included the dimensions of 82 subsectors, at a yearly frequency, for 2007, 2012, and 2017. As the procedure for compiling China’s EE-DPN-OEIOTs were cumbersome, we briefly described the methodology in the main text. The detailed procedures for the compilation were given in Supplementary Material Appendix.
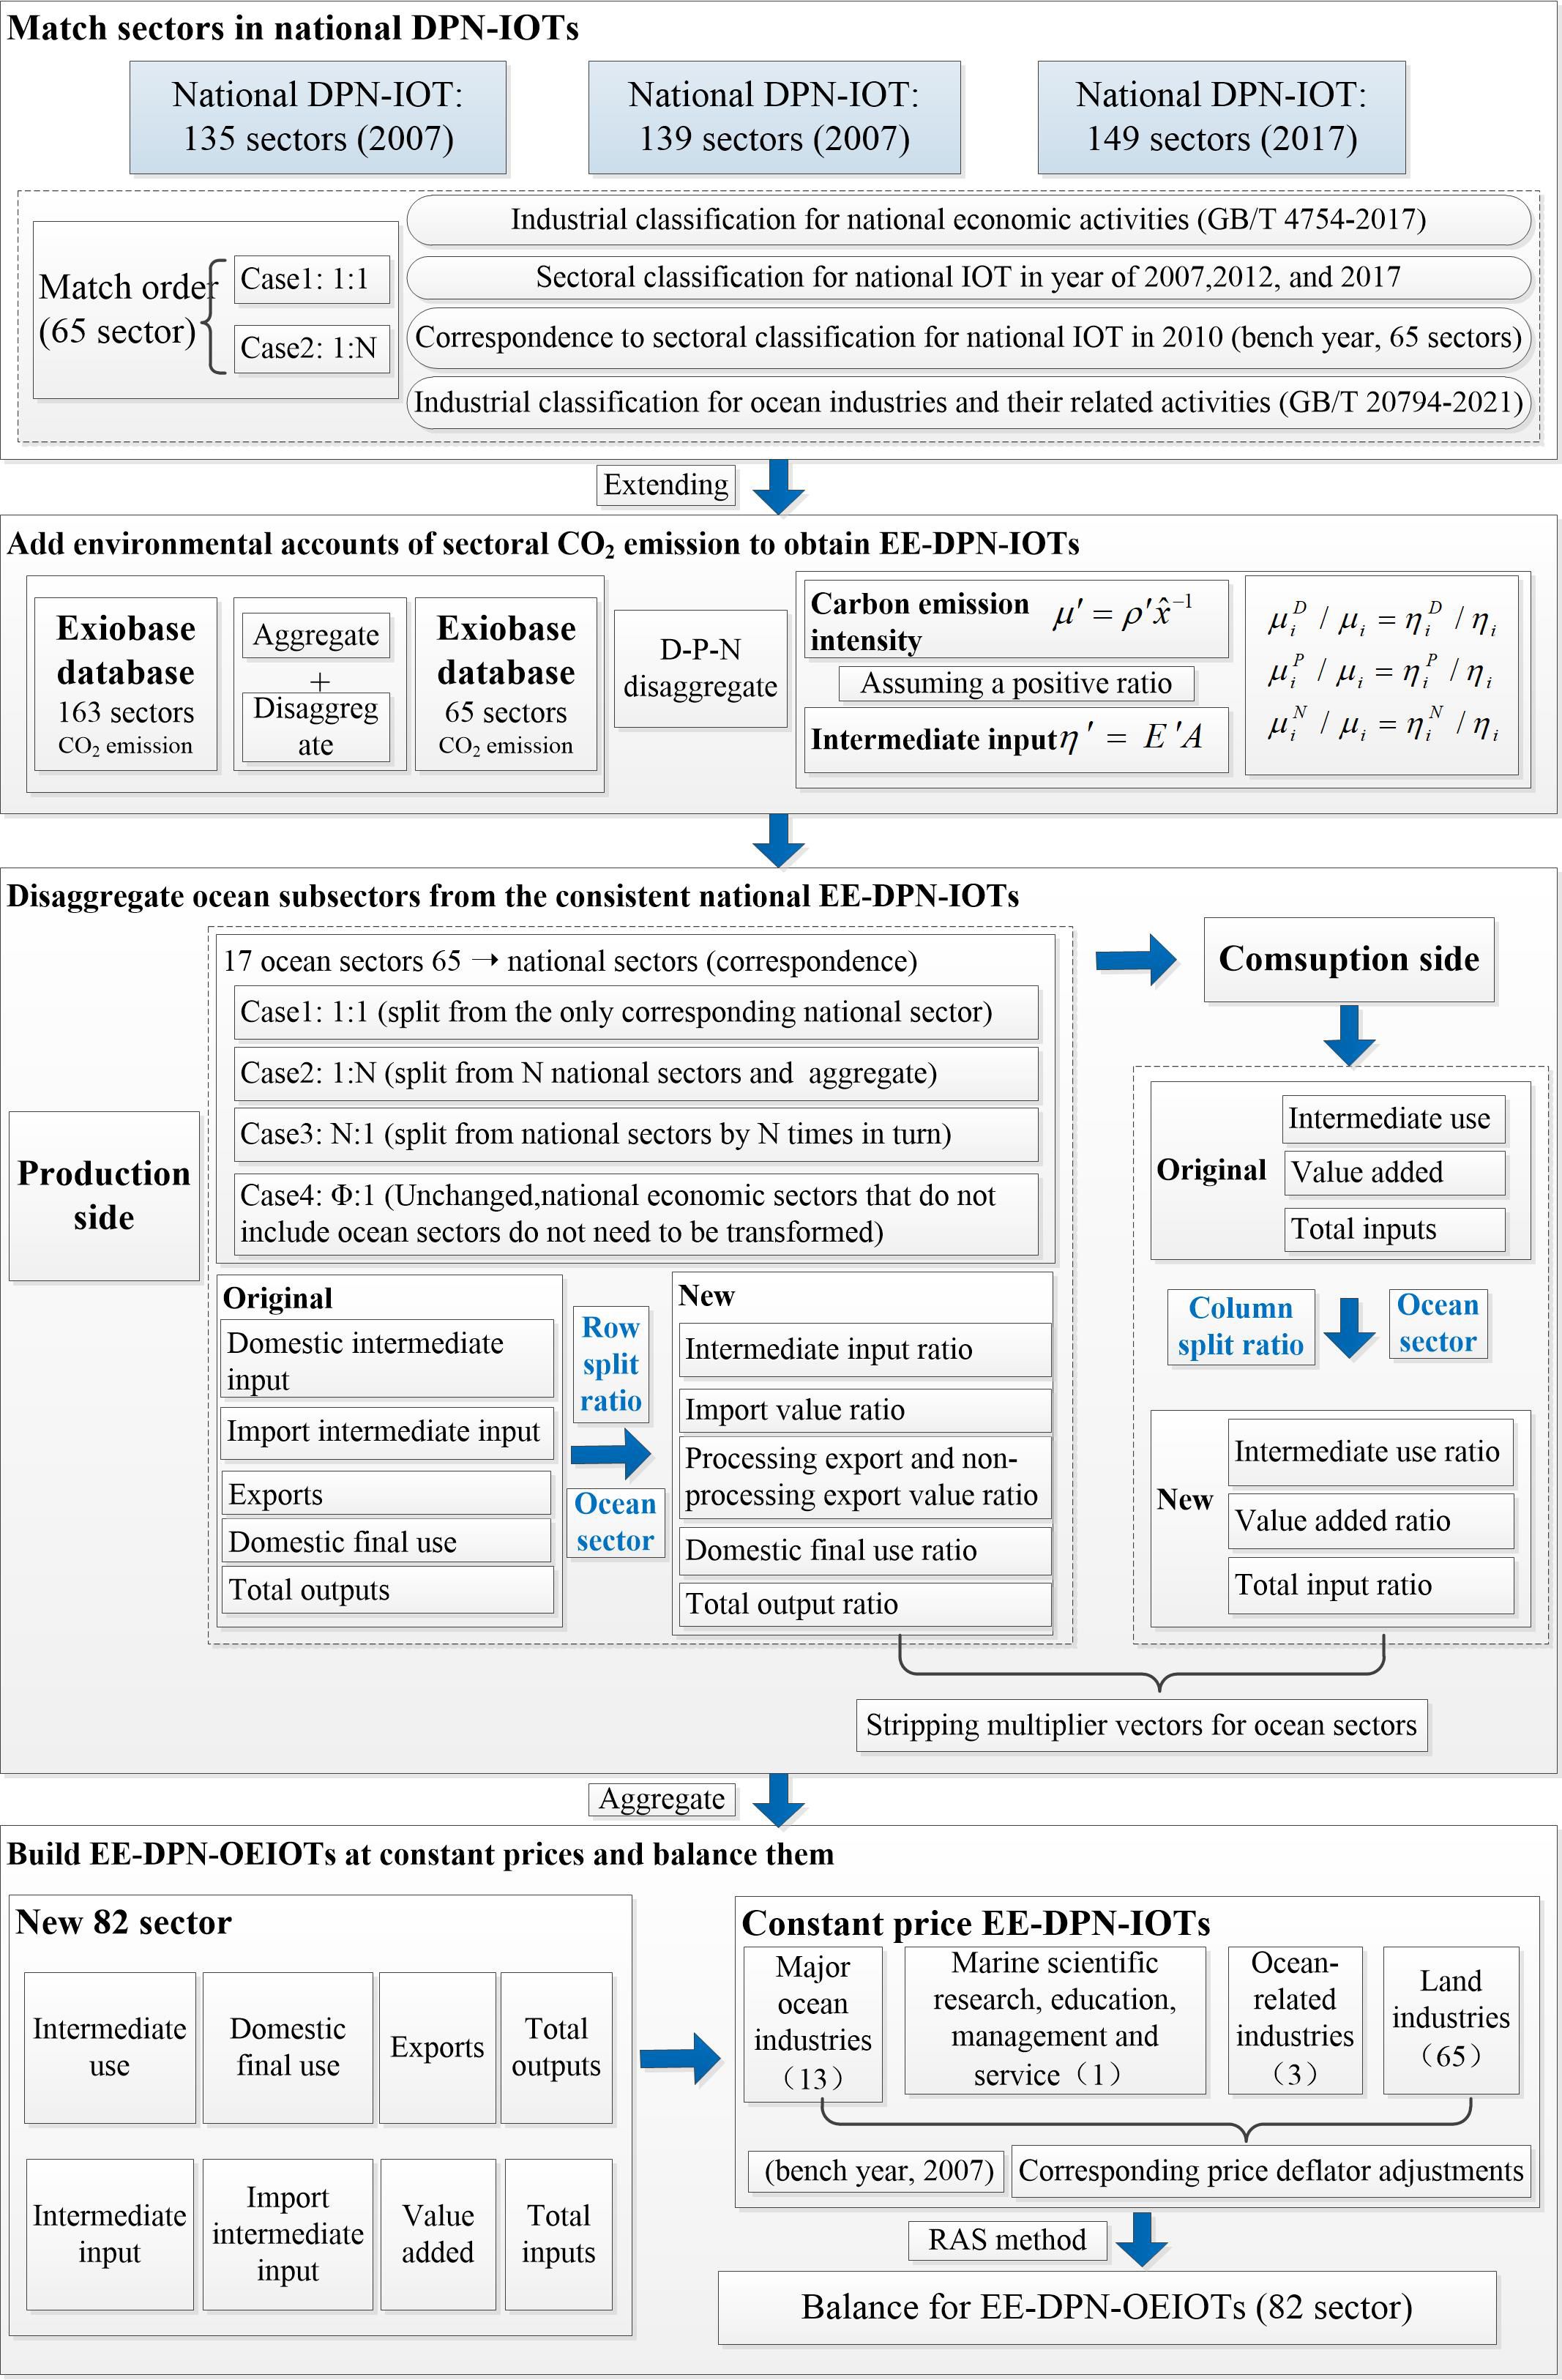
Figure 2 Technical roadmap for developing China’s EE-DPN-OEIOTs.
2.1.1 Construct the fundamental framework
Based on the framework of China’s national DPN-IOT, as well as the availability of economic and trade data for the ocean industries, we constructed fundamental theoretical framework of EE-DPN-OEIOT in China (see Table 2). The proposed EE-DPN-OEIOT consisted of two types of industries: ocean industry versus land industry. Here, in our study, the ocean industry comprised 17 sectors, while land industry comprised 65 sectors. The intermediate use of each sector was divided into three parts of D-P-N. Our rationale was that, first, the ocean industry was closely linked with the land industry, and the production and consumption structure for each ocean subsector showed clear differences. Second, the production fragmentation of processing exports in each sector differed significantly from those of non-processing exports; this feature was also reflected in ocean subsectors. Unlike the national DPN-IOT, our EE-DPN-OEIOT stripped the ocean subsectors and added an environmentally extended account of ocean-sector CO2 emissions. EE-DPN-OEIOT helped to clarify the relationship between production, consumption, and trade, thus accurately evaluating CO2 emissions originating from various types of sectors and trade patterns. Our compilied ocean-economy non-competitive IOT was a major breakthrough in input–output theory of ocean economy. Combining ocean-economy accounts with environmental accounts enabled better analysis of pollution caused by industrial development, thereby serving decision-making.
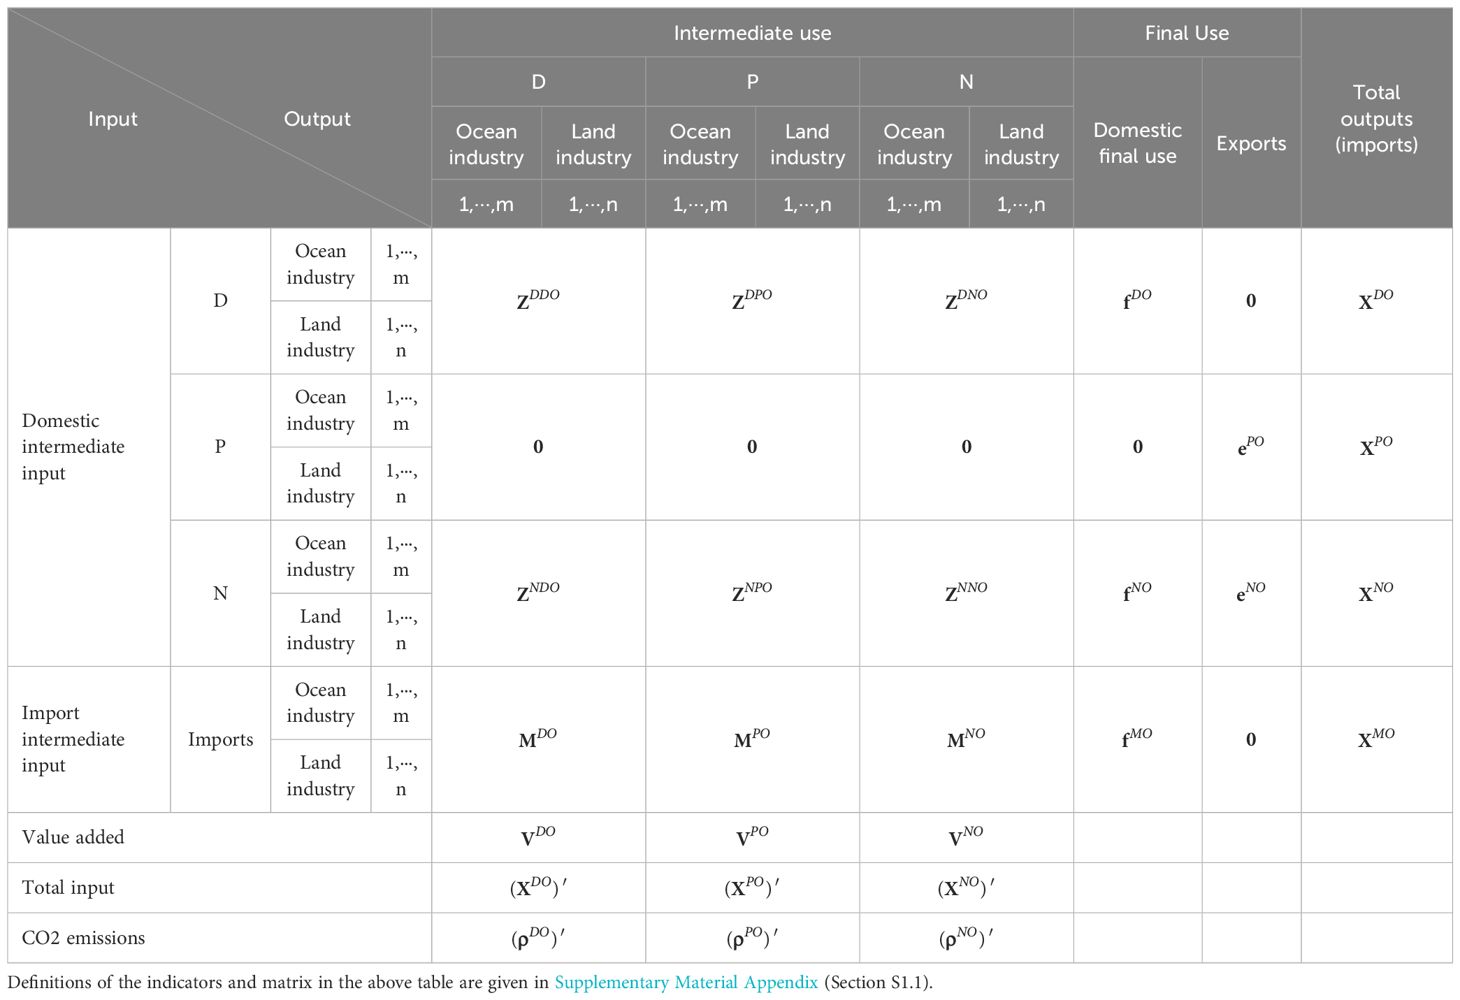
Table 2 Fundamental framework of China’s EE-DPN-OEIOT.
2.1.2 Match sectors to form consistent national DPN-IOTs
To facilitate dynamic comparative analysis, we need to consistently match the sectors in national DPN-IOT across years of 2007 (135-sector), 2012 (139-sector), and 2017 (149-sector). Since the number of sectors contained in each year’s DPN-IOT were different, we aggregated their sectors into the same consistent 65 sectors. Here we referred to the sectoral correspondences given in Table S3 in the Supporting Information Appendix of paper published by Zheng et al. (2023).
2.1.3 Build EE-DPN-IOTs by adding environmental accounts of sectoral CO2 emissions
We obtained CO2 emissions for 163 sectors from the Exiobase database. Then, based on the correspondences between the 163 sectors and 65 sectors in China’s national economy, we calculated the CO2 emissions of 65 national sectors. Referring to the disassembly method proposed by Dietzenbacher et al. (2012) for the sectoral CO2 emissions of three production categories (i.e., domestic demand, processing export, and non-processing export), we decomposed the CO2 emissions of each sector into three parts: D, P and N [see Supplementary Material Appendix, Equations (B1)–(B3)]. By linking the extended CO2 emissions of 65 sectors in the three forms of D-P-N with the consistent 65-sector national DPN-IOTs, we finally obtained the 65-sector environmentally extended DPN-IOTs (hereafter abbreviated as EE-DPN-IOTs) for 2007, 2012, and 2017.
2.1.4 Strip the ocean subsectors from national EE-DPN-IOTs
Tables S4, S5 in the Supporting Information Appendix of paper published by Zheng et al. (2023) provided the correspondence between ocean sector and its affiliated economic sector, as well as proportions of ocean sector’s value added, output, and intermediate input. On that basis, we can get the stripping multiplier vectors of value added, output, and intermediate input for the 17 ocean subsectors.
Based on Zheng and Tian’s (2021) data for the export value of various ocean industries, we collected and supplemented data on the value of processing export and non-processing export for each ocean industry. Then, we calculated the proportional coefficients of each ocean subsector’s processing export, non-processing export, as well as import in its affiliated national economic sector (Supplementary Material Appendix, Table S4), and constructed the stripping multiplier vectors of these three aspects [Supplementary Material Appendix, Equations (B4)–(B6)]. Based on ocean subsectors’ six aspects of stripping multiplier vectors, we stripped their input and output data from the consistent national EE-DPN-IOTs (Supplementary Material Appendix, Table S6). After disaggregating, we obtained the EE-DPN-OEIOTs at current prices for 2007, 2012, and 2017.
2.1.5 Build constant-price EE-DPN-OEIOTs and balance them
We took 2007 as the price base year. Referring to the price deflators of 17 ocean subsectors and 65 land subsectors given in Table S5 of Supporting Information Appendix in paper published by Zheng et al. (2023), we converted the 82-sector current-price EE-DPN-OEIOTs to 82-sector constant-price EE-DPN-OEIOTs. Finally, we used RAS method to revise and balance EE-DPN-OEIOTs [51]. We illustrated our methodological limitations in Supplementary Material Appendix.
2.2 Accounting model of the embodied CO2 emissions in ocean exports
Previous studies estimating embodied CO2 emissions had been based on the perspectives of producers, consumers, and beneficiaries; the focus on consumers was especially popular (Wang et al., 2022). Constrained by data availability, we estimated embodied CO2 emissions in ocean exports from the consumer perspective. Based on our compiled 82-sector EE-DPN-OEIOT at constant price, we first calculated the direct consumption coefficient matrix. Then, we calculated the unit CO2 emission intensity of each ocean subsector. Finally, we evaluated export-embodied CO2 emissions in each ocean subsector (Yagi et al., 2020; Li et al., 2022a). The specific formulas were as follows.
In Equation (1), represents the matrix of direct consumption coefficient, represents the matrix of intermediate input, and is a diagonal matrix representing the output value. In Equation (2), represents the transposed matrix of sectoral CO2 emission intensity—namely, the transposed matrix of sectoral CO2 emissions by output per unit. represents the transposed matrix of sectoral CO2 emissions. In Equation (3), g(e) represents the row vector of embodied CO2 emissions in exports of various sectors, and the th element represents the export-embodied CO2 emissions in sector . is called inverse Leontief matrix, which represents the sum of each sector’s direct output versus indirect output, caused by final demand per unit. represents the diagonal matrix of export value with different trade patterns for all sectors. , , and represent CO2 emissions caused by per unit of sectoral domestic demand, sectoral processing exports, and sectoral non-processing exports, respectively. and represent the diagonal matrix of sectoral processing exports and sectoral non-processing exports, respectively. Based on our compiled constant-price of China’s EE-DPN-OEIOTs (2007, 2012, 2017), we can estimate the export-embodied CO2 emissions from 17 ocean subsectors.
2.3 Driving factor decomposition model of changes in ocean export-embodied CO2 emissions
Studies applying SDA had used either multiplicative or additive decomposition, depending on specific purpose (Su and Ang, 2012). Additive decomposition was commonly used for its ease of manipulation (Tian et al., 2020). SDA can be applied to conduct multisectoral comparative analyses of changes in certain variables, requiring the use of IO tables over different periods for estimation. In this study, we applied the additive SDA model to decompose changes in export-embodied CO2 emissions for each ocean subsector, and then investigated the major driving factors behind the changes. Specifically, based on the above calculation model for embodied CO2 emissions in ocean exports, we estimated the export-embodied CO2 emissions of 17 ocean subsectors in 2007, 2012, and 2017 (Xu et al., 2017). We then decomposed the changes in export-embodied CO2 emissions into four effects: a carbon-emission intensity effect, a production technology effect, a sectoral export structure effect, and an export scale effect. The decomposition form was as follows.
In Equation (4), where the bottom angle indicates the baseline period, and bottom angle indicates the target period. represents the change in embodied CO2 emissions for all ocean exports from period to period . Suppose , where is the export vector for each sector, and is vector of the total export value; then, represents the export structure vector of all sectors. Using the two-pole decomposition method (Miller and Blair, 2022), we obtain the increment of export-embodied CO2 emissions for each ocean subsector from period to period , which are shown in Equations (5. 6).
Where represents the row vector for the change in export-embodied CO2 emissions of each ocean subsector from period to period . represents vector of diagonal matrix; represents the vector of diagonal matrix. , , , and represent the change matrices of sectoral carbon-emission intensity, sectoral production technology, sectoral export structure, and sectoral export scale from period to period , respectively. In Equation (6), the first item is carbon-emission intensity effect, denoted as , which reflects changes in CO2 emissions caused by changes in direct emission intensity with other factors held constant. The second is production technology effect, denoted as , reflecting changes in CO2 emissions caused by changes in the technology level with all factors held constant. The third item is export structure effect, denoted as , reflecting changes in CO2 emission caused by changes in the industrial structure of exports with other factors held constant. The fourth item is the export scale effect, denoted as , reflecting changes in CO2 emission caused by the changes in volume of exports with all other factors held constant. By using SDA model, we can estimate each driving factor’s contribution rate to changes in export-embodied CO2 emissions from ocean industries by types of subsectors and trade patterns during the period 2007–2017.
2.4 Data sources
We built the EE-DPN-OEIOTs by using five categories of datasets. The first category was China’s national DPN-IOTs. As China’s official input–output tables are publicly released every five years, and the 2017 input–output table is the latest national release. In this study, we adopted China’s national DPN-IOTs (2007, 2012, 2017) co-compiled by the Chinese Academy of Sciences and National Bureau of Statistics as our starting point. DPN-IOTs clearly presented the economic linkages across different subsectors under different trade patterns in various years, which laid the database foundation for our complied EE-DPN-OEIOTs.
The second category contained basic economic data for ocean subsectors (e.g., value added, output, and intermediate input). These data are derived from the China Marine Economic Statistics Bulletin and China Marine Economic Statistical Yearbook, as well as marine economic statistical data reported by coastal areas. The economic data for ocean subsectors can be used to calculate the stripping coefficients and construct the stripping multiplier vectors of value added, output, and intermediate input for 17 ocean subsectors.
The third category contained data of the export and import values for ocean-based products, which come from the website of China’s General Administration of Customs as well as the Ministry of Commerce. Since there are no authoritative data on ocean exports and imports, we used the trade data for export and import value for each ocean subsector provided by Zheng and Tian (2021). The export and import values for ocean subsectors can be used to calculate the stripping coefficients and construct the stripping multiplier vectors of processing export, non-processing exports and import for 17 ocean subsectors.
The fourth category contained data of the price deflation index, which are obtained from the China Statistical Yearbook. The price deflation index data can be used to convert the 82-sector current-price EE-DPN-OEIOTs to 82-sector constant-price EE-DPN-OEIOTs.
The fifth category contained the CO2 emission data for national industrial sectors, which are obtained from the Exiobase database (https://www.exiobase.eu/). As Exiobase database stands out for its most detailed sectoral data on CO2 emissions of 163 sectors, we calculated and added detailed sectoral CO2 emission accounts in building EE-DPN-IOTs.
3 Results and analysis
3.1 Embodied CO2 emissions in China’s ocean exports and their evolution
Based on our complied EE-DPN-OEIOTs (2017, 2012 and 2017) and accounting model of the embodied CO2 emissions in ocean exports in Equation (3), we calculated the volumes of China’s export-embodied CO2 emissions from different ocean industries. Here, we first described China’s total export-embodied CO2 emissions from ocean industries and their evolution over 2007–2017. Then, from the perspective of sectoral heterogeneity and trade pattern heterogeneity, we analyzed their export-embodied CO2 emissions and evolution.
3.1.1 Overall characteristics
Based on the complied EE-DPN-OEIOT for 2017, we estimated that the value of China’s ocean exports reached 1.4 trillion-yuan in 2017, accounting for 8.4% of total export value and 1.7% of its GDP. In 2017, at the national scale, embodied CO2 emissions in the ocean export supply chain reached 94.3 million tons (Mt), accounting for 5.4% of national export-embodied CO2 emissions (See Figure 3). This proportion showed a tread of first increasing and then decreasing, with an increase of 1.3 percentage points in 2012 and a decrease of 2.4 percentage points in 2017. We also observed that the volume of indirect CO2 emissions in ocean exports was far larger than that of direct CO2 emissions, by a proportion of more than 90%. The share proportion of indirect carbon emissions remained over 90% of the total export-embodied CO2 emissions from 2007 to 2017. This was mainly attributable to the relatively close linkages between upstream and downstream ocean industries, resulting in higher export-embodied CO2 emissions.
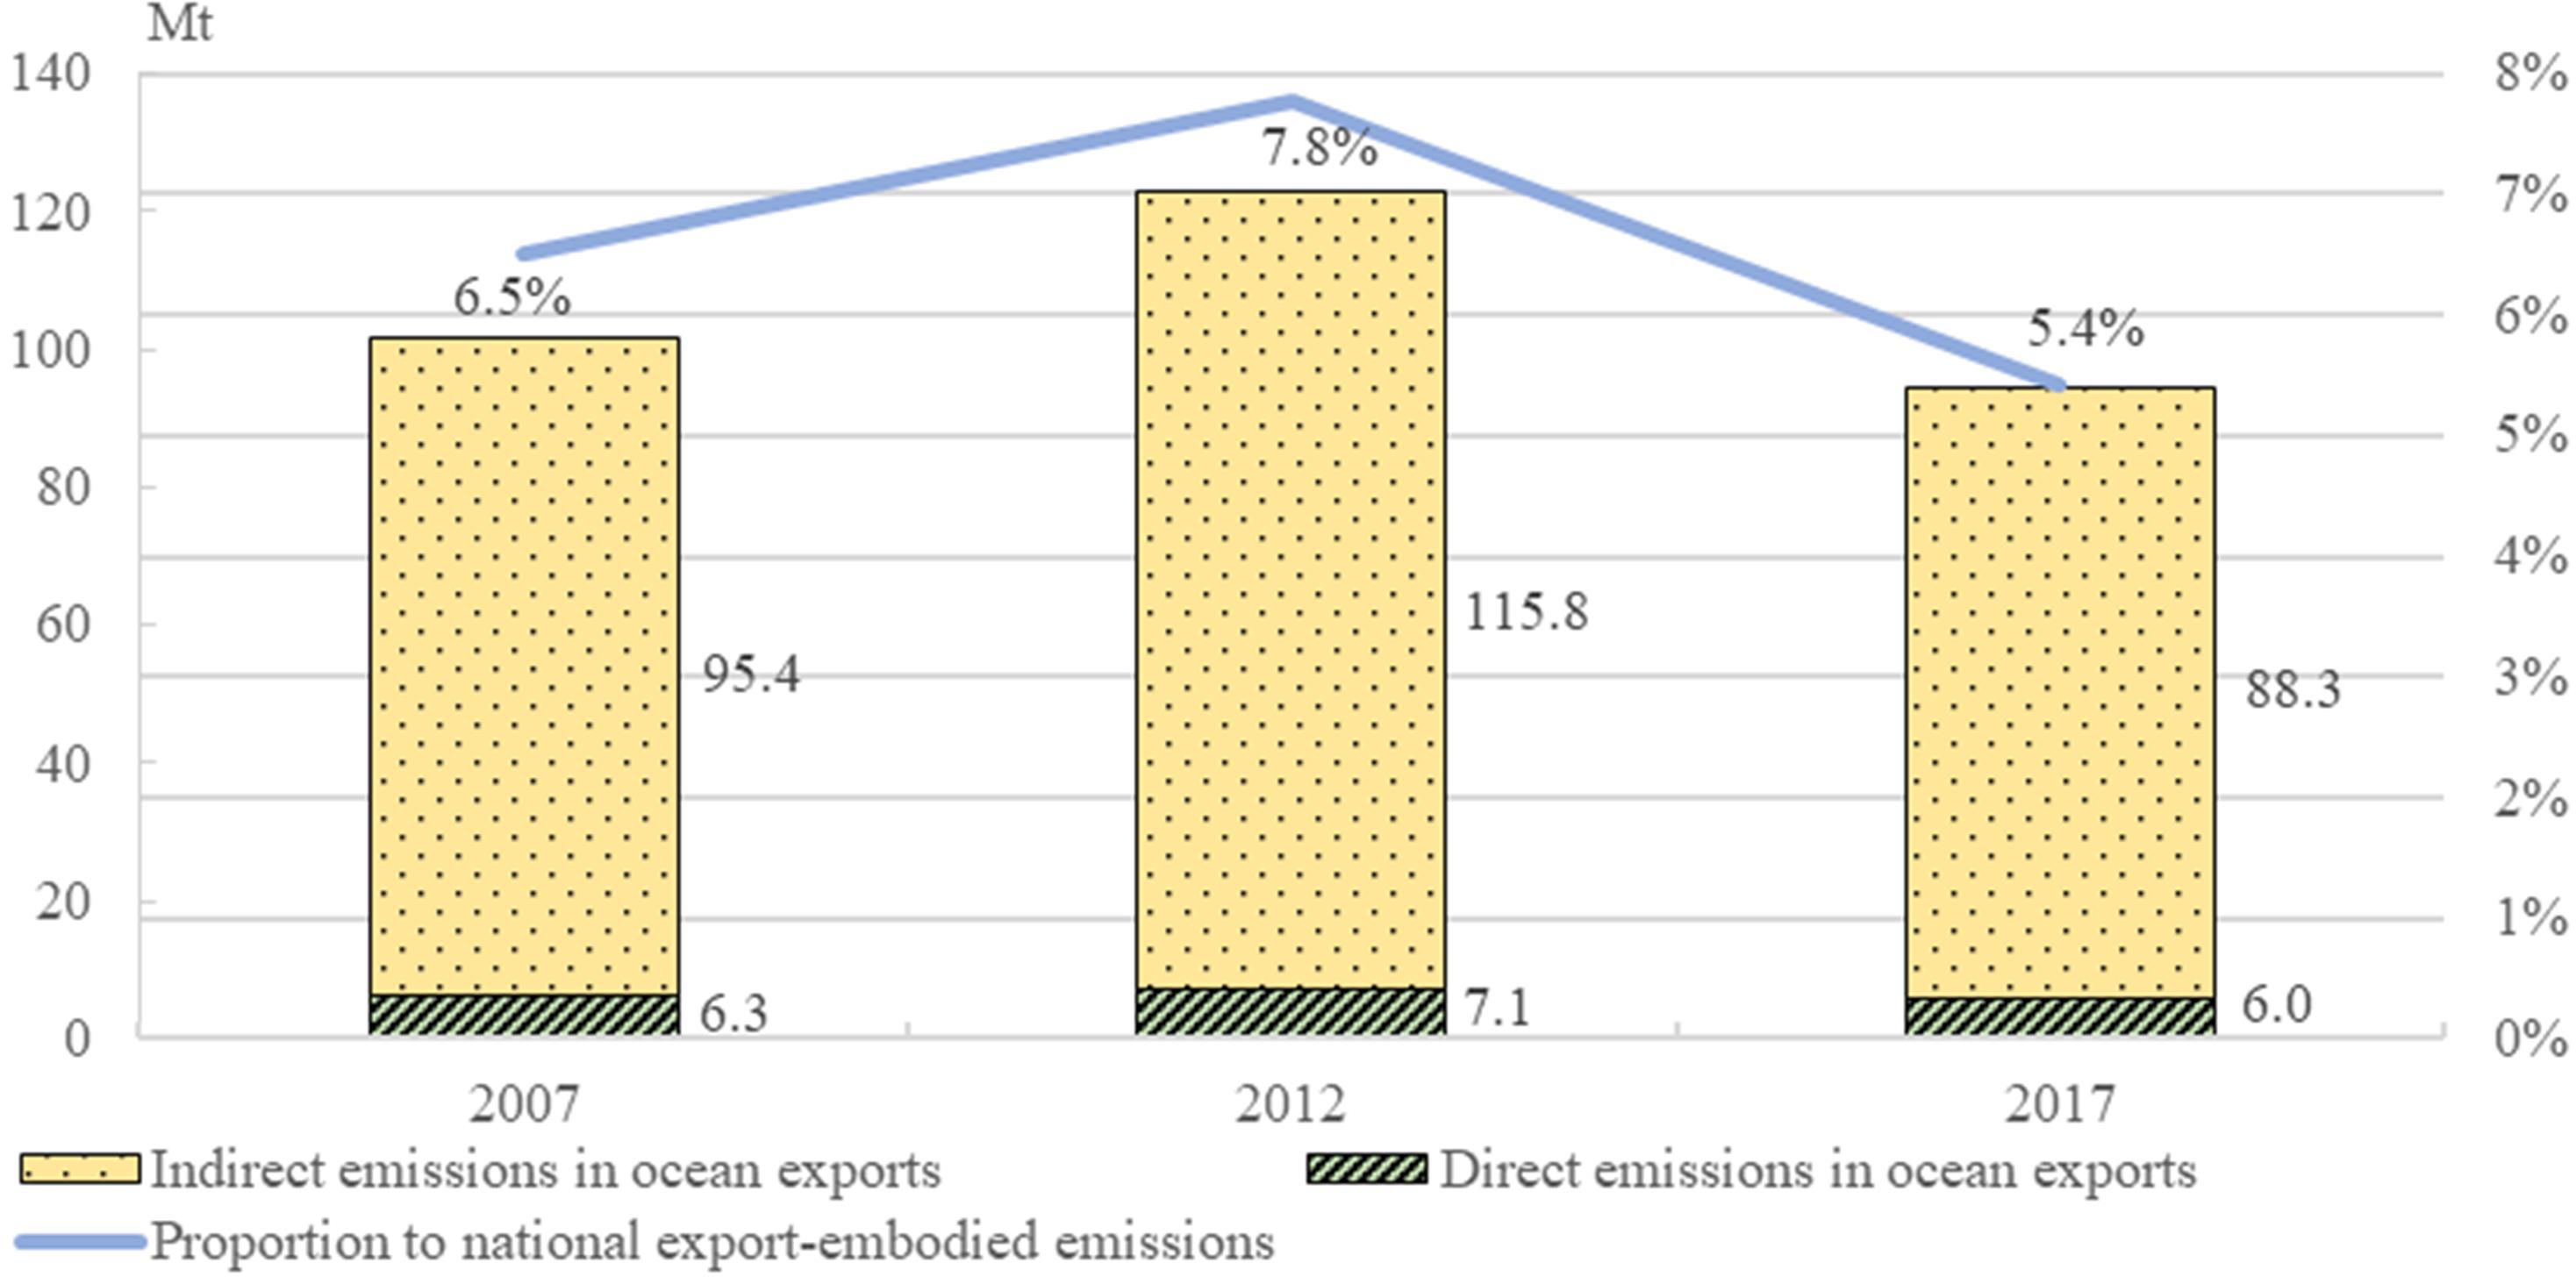
Figure 3 Evolution of direct and indirect CO2 emissions from China’s ocean exports and their total proportions to national export-embodied emissions. The left axis represents CO2 emissions from ocean exports; the right axis represents percentage of national export-embodied emissions. The direct CO2 emissions came from the Exiobase database.
Regarding the annual change trend, since 2007, the export-embodied CO2 emissions in the ocean export supply chain showed a trend of an initial increase and then a decrease, with a growth rate of 20.8% in 2012 and −23.2% in 2017. The decrease in ocean export emissions during 2012–2017 was mainly driven by the exports of offshore oil and gas, marine shipbuilding, and coastal tourism. This was consistent with the results for total CO2 emissions in China’s 13 key ocean industries estimated by Li et al. (2021). It was also generally in line with the emission results for affiliated sectors found in datasets such as the CEADs and the Multiresolution Emission Inventory for China (Shan et al., 2020). Despite the inverted U-shaped curve of changes in export-embodied CO2 emissions from ocean industries, we observed an interesting phenomenon of a continuously declining trend in the ratio of CO2 emissions to export value. Measured in tons/10 000 yuan, the ratios in 2007, 2012, and 2017 were 1.1, 0.9, and 0.7, respectively. This means that the negative effect of trade-linked CO2 emissions from China’s ocean industries on the environment had been reduced, but there was still room for improvement.
3.1.2 Sectoral heterogeneity characteristics
Owing to the significant heterogeneity in production activities across various ocean subsectors, we further investigated the status of and changes in CO2 emissions from ocean exports within the three ocean-industry structures and subsectors. The detailed sectoral compositions of the three ocean-industry structures can be found in Supplementary Material Appendix, Table S4.
We observed that there were large industrial structure disparities and sectoral disparities in CO2 emission volumes. Regarding the three ocean-industry structures, the secondary ocean industry ranked first in the total export-embodied CO2 emissions at 78.5 Mt in 2017, followed by the tertiary ocean industry and primary ocean industry, accounting for 83.2%, 16.6%, and 0.2% of total CO2 emissions, respectively. Regarding ocean subsectors, given the large value of exports as well as the strong linkages between upstream and downstream industries, the secondary ocean-related industry had the largest export-embodied CO2 emissions (64.9 Mt), followed by marine shipbuilding (9.2 Mt), marine communications and transport (8.3 Mt), coastal tourism (3.9 Mt), as well as marine scientific research, education, management and service (3.3 Mt), accounting for 68.8%, 9.8%, 8.9%, 4.1%, and 3.6% of total emissions, respectively.
Regarding the annual change trend, the volume of the export-embodied CO2 emissions from secondary ocean industry increased from 68.4 Mt in 2007 to 78.5 Mt in 2017. Meanwhile, the tertiary ocean industry decreased its emissions from 33.1 Mt in 2007 to 15.6 Mt in 2017. This clearly suggested that there was room for carbon-emission reduction in secondary ocean-industry sectors. Figure 4 showed the evolution of China’s export-embodied CO2 emissions from ocean industries by subsector. The top five ocean subsectors according to CO2 emissions remained unchanged from 2007 to 2017. Except for the secondary ocean-related industry, the subsectors of marine shipbuilding, marine communications and transport, coastal tourism, as well as marine scientific research, education, management and service all experienced a decrease trend of emissions from 2007 to 2017. Thus, the secondary ocean-related industry was the most significant source sector of CO2 emissions and required targeted emission reduction measures. Thus, accelerating the greening and intelligent transformation of the secondary ocean-related industry, such as the subsectors of marine equipment manufacturing, and marine instrument manufacturing, will help to facilitate low-carbon transition and sustainable advancement of China’s ocean economy.
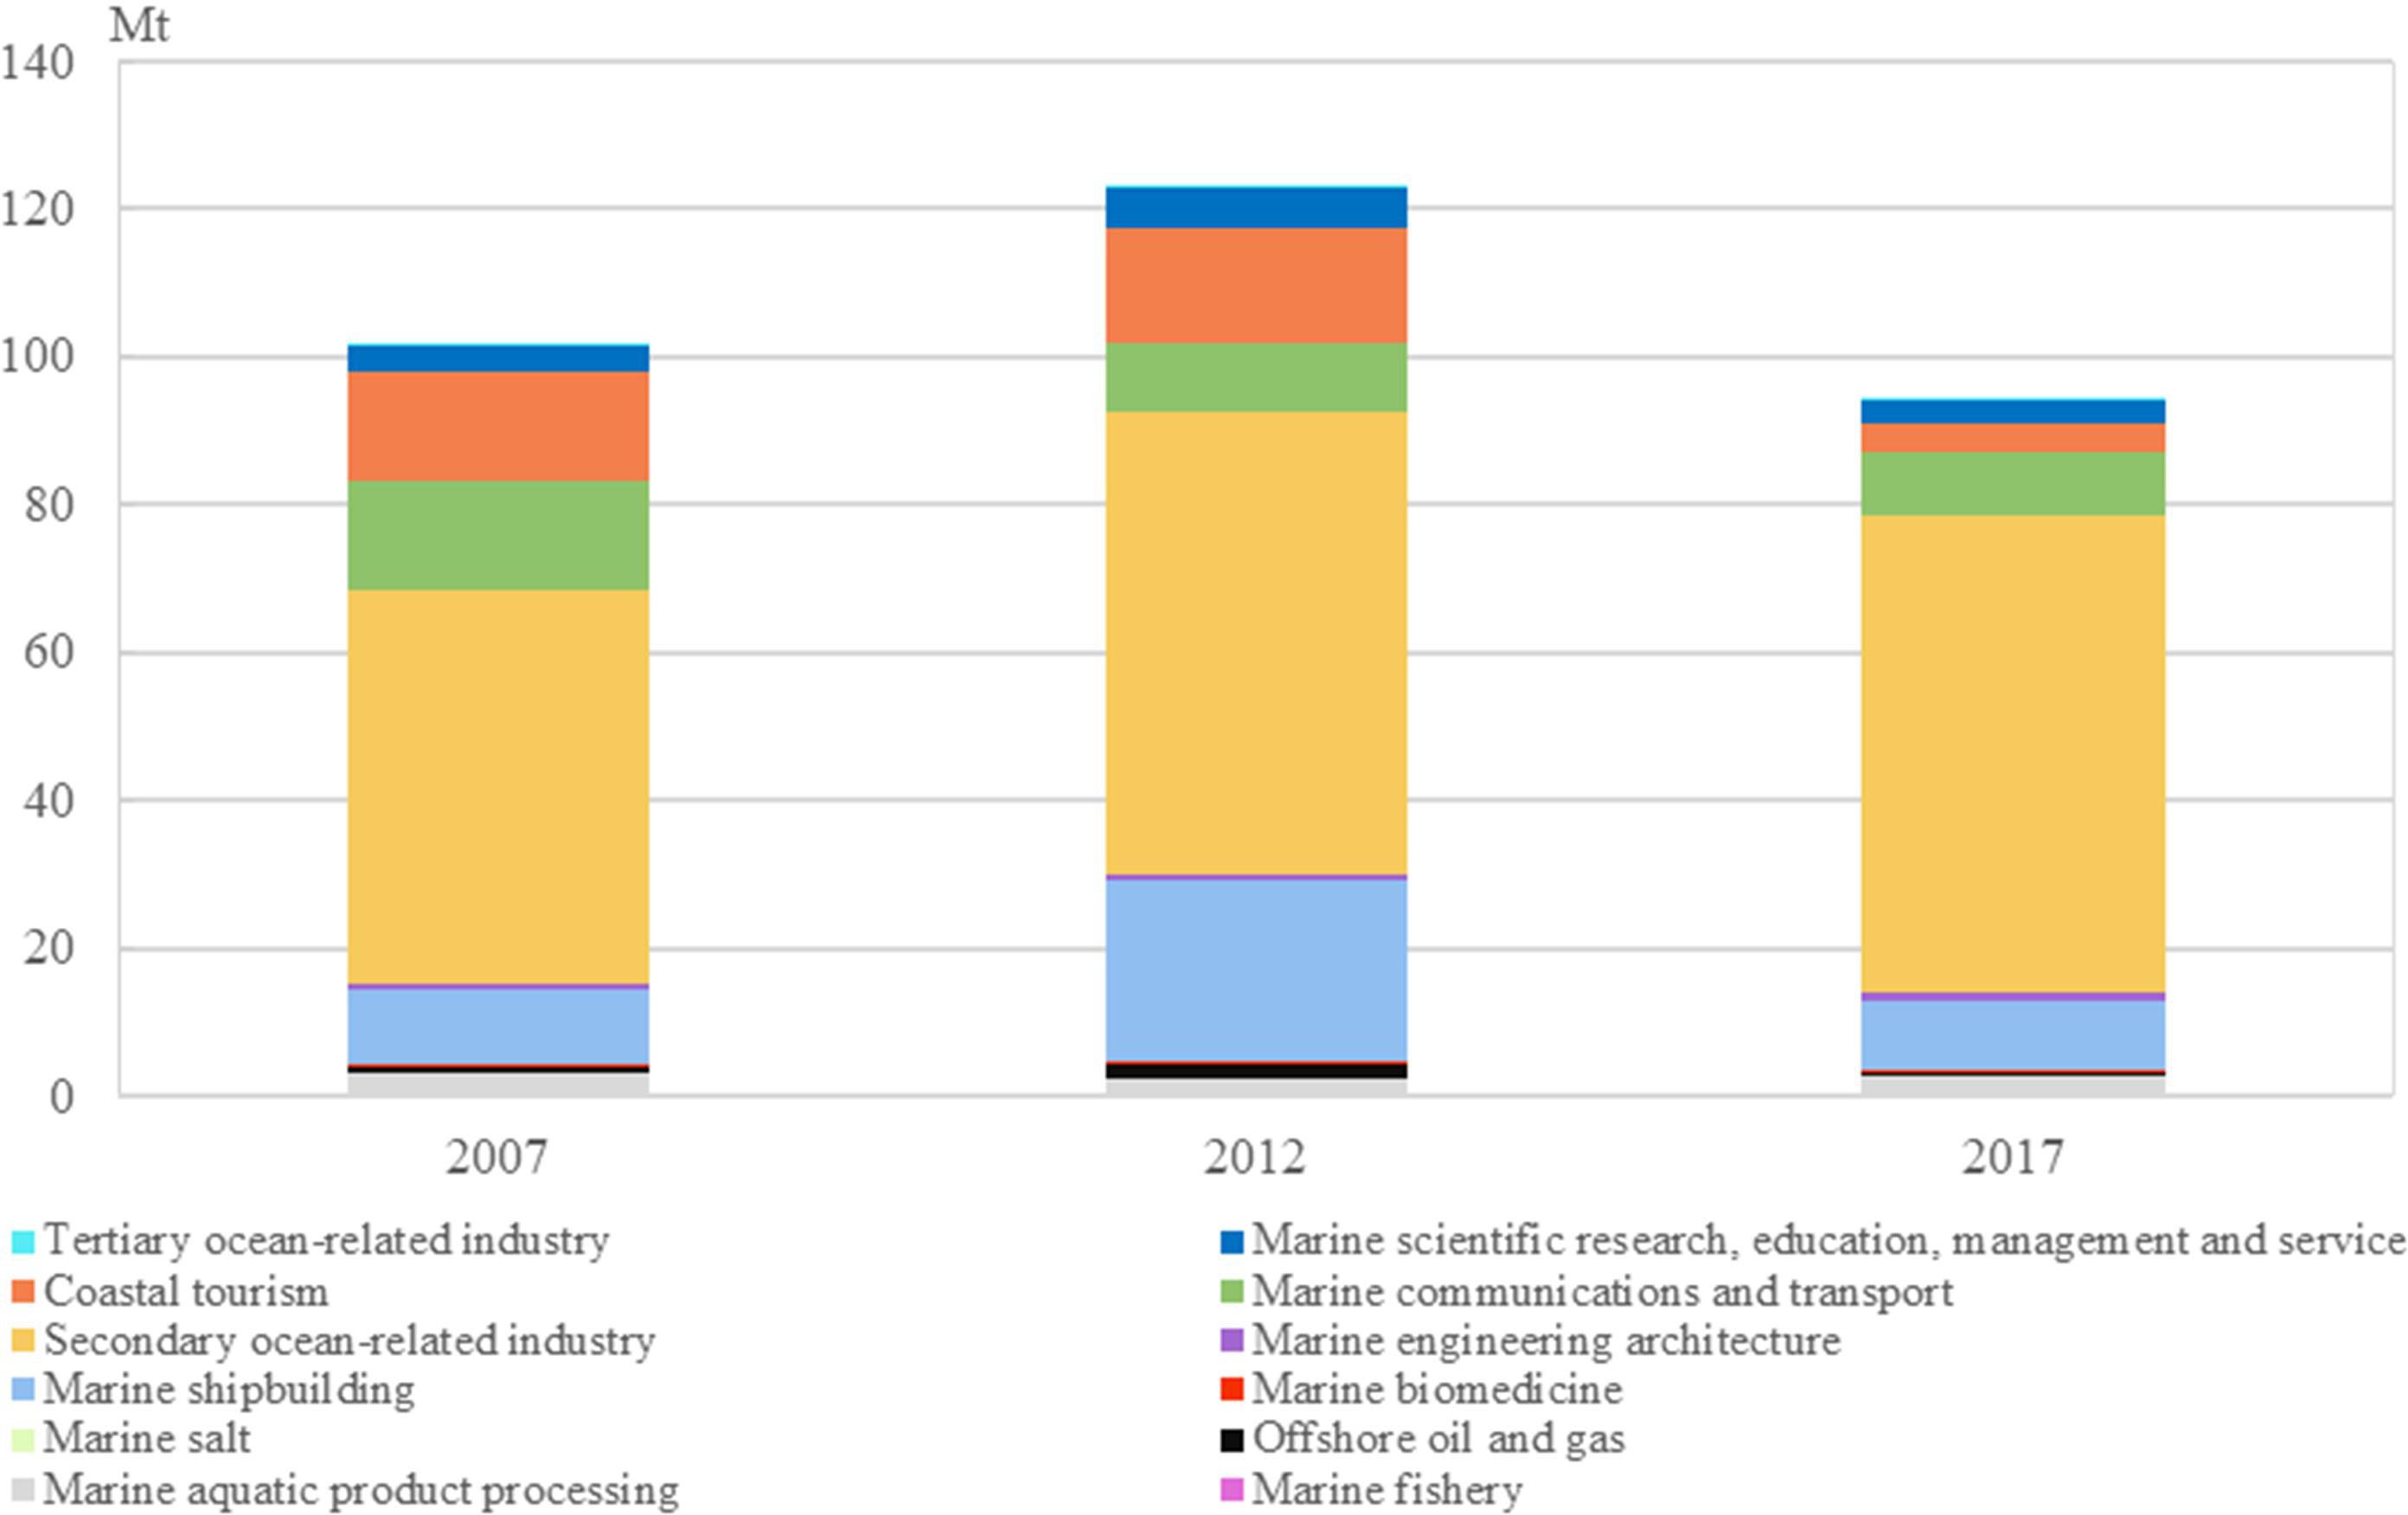
Figure 4 Evolution of China’s export-embodied CO2 emissions from ocean industries by subsector.
3.1.3 Trade pattern heterogeneity characteristics
Our findings confirmed that IO methods that failed to consider trade heterogeneity can bias the estimated results for export-embodied emissions. Specifically, we converted the EE-DPN-OEIOT to EE-OEIOT by aggregating data for intermediate inputs and use for 82 sectors, consisting of three parts: D, P, and N. Results showed that the estimated export-embodied CO2 emissions based on the ordinary EE-OEIOT (134 Mt) in 2017 significantly overestimated (by more than 40%) the results compared with EE-DPN-OEIOT (94 Mt). This was in line with overestimation (by more than 60%) of emissions from China’s national processing exports estimated using ordinary IO table-based analyses (Dietzenbacher et al., 2012).
We also observed that the estimated embodied CO2 emissions of ocean exports were sensitive to trade patterns. In 2017, the processing ocean exports accounted for 38.3% (537.6 billion-yuan) of total of ocean exports, generating 24.1% (22.8 Mt) of the total ocean export-embodied CO2 emissions. This implied that processing ocean exports were relatively cleaner with generating less value and less CO2 emissions, compared with that of non-processing ocean exports. Meanwhile, for processing ocean exports, the ratio of its CO2 emissions per unit export value (0.4 tons/10000 yuan) was only half of the ratio for non-processing ocean exports (0.8 tons/10000 yuan) in 2017. Regarding ocean subsectors, we found that the secondary ocean-related industry generated largest embodied CO2 emissions in non-processing ocean exports (50.9 Mt, 69.8%) in 2017, whereas the secondary ocean-related industry (14.9 Mt, 65.5%) and marine shipbuilding (7.6 Mt, 33.6%) ranked the top two in generating embodied CO2 emissions from processing ocean exports. Thus, promoting the low-carbon transformation of processing exports was critical for the green development of marine shipbuilding.
Regarding the annual change trend, Figure 5 presented the evolution of China’s embodied CO2 emissions in processing and non-processing exports by ocean subsector. Since 2007, the embodied CO2 emissions in processing ocean exports showed a change trend of first increasing (by 136.4%) and then decreasing (by −36.5%). Meanwhile, the embodied CO2 emissions in non-processing ocean exports increased by 0.6% in 2012 and decreased by 17.8% in 2017. Among them, the change behind embodied CO2 emissions in processing ocean exports was more obvious. The likely reason was that from 2007 to 2012, processing ocean exports were dominated by rough processing and low value added, and the CO2 emissions continued to increase. From 2012 to 2017, the processing trade of ocean industries gradually changed to deep processing and high value-added, and CO2 emissions were lowered. The proportion of CO2 emissions from processing ocean exports in total export-embodied CO2 emissions from ocean industries decreased by 5.0 percentage points, indicating that processing ocean exports were cleaner. We concluded, therefore, that two export patterns played heterogeneous roles in driving growth of export-embodied CO2 emissions during different periods.

Figure 5 Evolution of embodied CO2 emissions in processing and non-processing exports by ocean subsector in China, 2007–2017.
3.2 Driving factors to the evolution of China’s export-embodied CO2 emissions from ocean industries
Based on the accounting results for embodied CO2 emissions in ocean exports, we employed SDA model in Equation (6) to calculate the contribution rate of each driving factor to the evolution of China’s export-embodied CO2 emissions from ocean industries. Here, we first identified how each driving factor contribute to the evolution of China’s total export-embodied CO2 emissions from ocean industries over 2007–2017. Then, considering sectoral heterogeneity and trade pattern heterogeneity, we analyzed the driving factors to the evolution of export-embodied CO2 emissions from different ocean industries under different export patterns.
3.2.1 Drivers to total emission changes
We decomposed the driving factors affecting changes of embodied CO2 emissions in China’s ocean exports into four components: △μ, △L, △S, and △E (Figure 6).
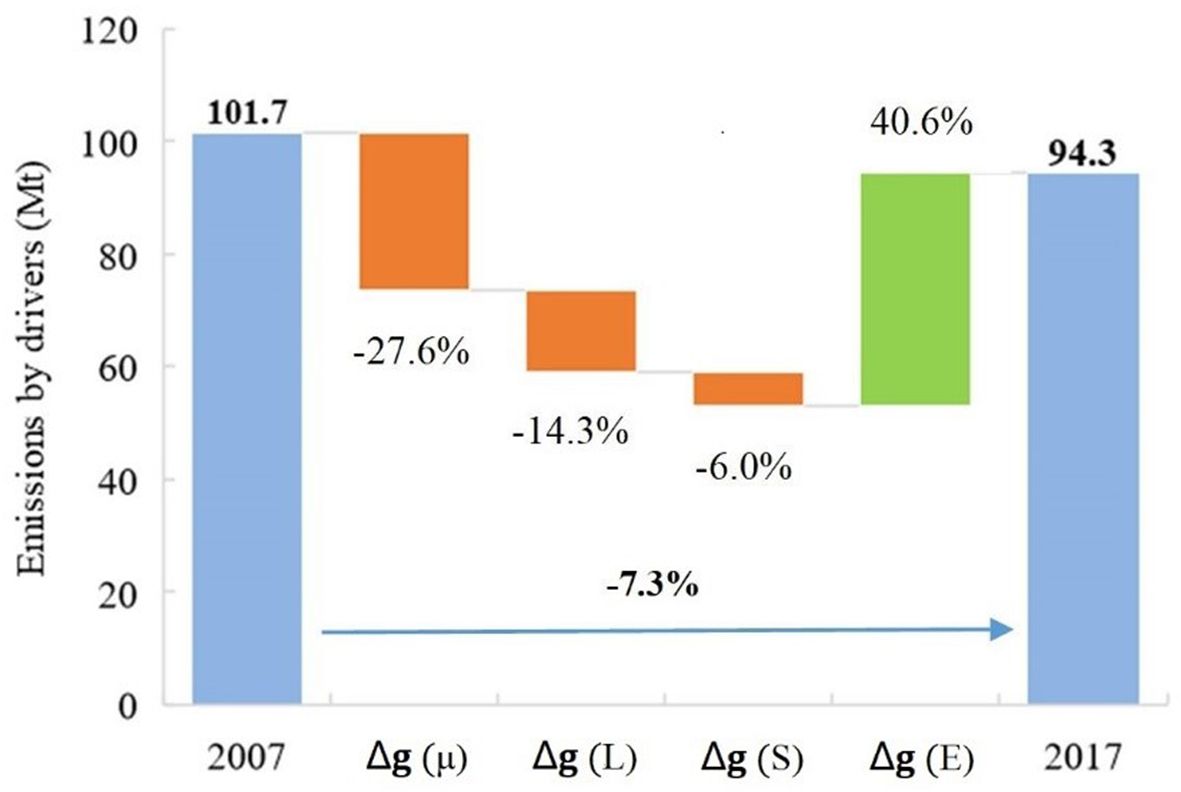
Figure 6 Contributions of four driving factors to changes of embodied CO2 emissions in China’s ocean exports over the entire period of 2007–2017. Δg (μ) represents the carbon-emission intensity effect, Δg (L) represents the production technology effect, Δg (S) represents the export structure effect, and Δg (E) represents the export scale effect.
In general, the ocean export-embodied CO2 emissions grew from 101.7 Mt in 2007 to a preliminary peak of 122.9 Mt in 2012. After 2012, there was a general declining pattern in CO2 emissions, which were reduced to 94.3 Mt in 2017. For the period of 2007–2017, the embodied CO2 emissions in ocean exports decreased by 7.3%. The major contributing factor to this decrement was the decline in the carbon-emission intensity effect, which had caused CO2 emissions to decrease by 27.6% in absence of other factors. The production technology effect (−14.3%) and export structure effect (−6.0%) also played important roles in driving downturn of CO2 emissions. The increase in exports offset the decrease of CO2 emissions by 40.6% (export scale effect).
3.2.2 Drivers to sectoral emission changes
From 2007 to 2017, changes in export-embodied CO2 emissions (−7.4 Mt) originated from the primary (0.01 Mt), secondary (10.1 Mt), and tertiary (−17.5 Mt) ocean industries. This indicated that there was a notable growth trend for CO2 emissions from ocean manufacturing sectors, whereas CO2 emissions from the ocean service sectors showed a declining trend. We observed that sectoral heterogeneity affected the drivers to changes in ocean export-embodied CO2 emissions over 2007–2017 (shown in Figure 7). In general, the drivers of export-embodied CO2 emissions varied across ocean subsectors. However, the export scale effect was the major driver to the increases in export-embodied CO2 emissions for nine (75%) ocean subsectors, whereas the carbon-emission intensity effect was the major driver curbing increases in CO2 emissions for seven (60%) ocean subsectors.
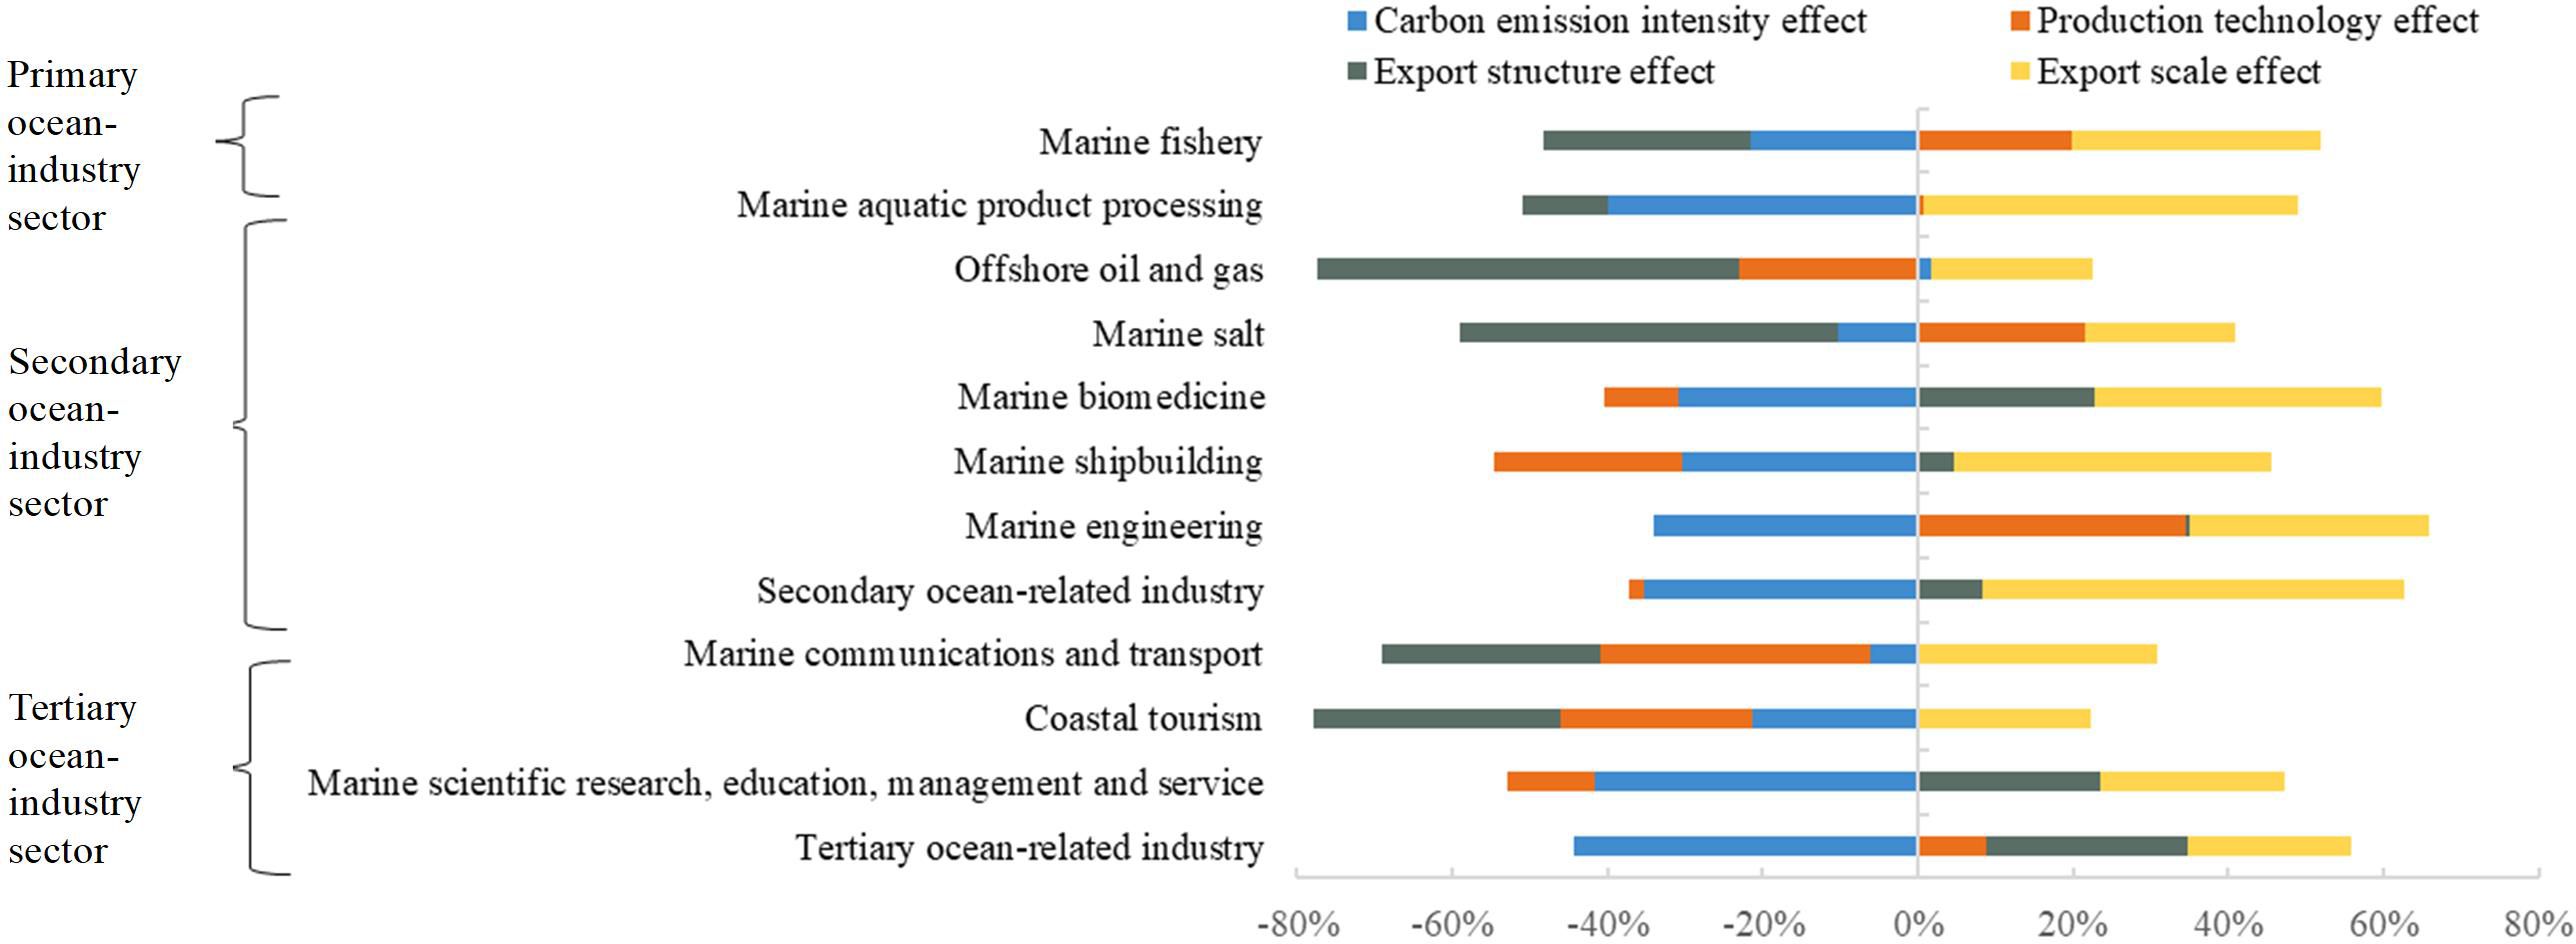
Figure 7 Contributions of four driving factors to changes of embodied CO2 emissions in exports of ocean subsectors, 2007–2017.
In the primary ocean-industry sector, the embodied CO2 emissions in marine fishery exports increased by 4.8%. The major factor contributing to this increase was the growth of marine fishery exports (export scale effect, 42.6%). The production technology effect played a significant role in driving CO2 emissions by 26.4%. The export structure effect whereas carbon-emission intensity effect decreased the CO2 emissions by 35.6% and 28.6%, respectively.
In the secondary ocean-industry sector, the top three ocean subsectors with the largest changes in export-embodied CO2 emissions were the secondary ocean-related industry (11.3 Mt), marine shipbuilding (−0.9 Mt), and offshore oil and gas (−0.7 Mt). Here, we focused on the drivers to changes behind export-embodied CO2 emissions from these three sectors. Regarding the secondary ocean-related industry, its embodied CO2 emissions from exports increased by 21.2%. The major factor contributing to this increase was the export scale effect (45.3%). The decrease in carbon-emission intensity offset CO2 emissions by −29.4%. The export structure effect played a significant important role in driving CO2 emissions by 7.0%. The production technology effect decreased CO2 emissions by 1.8%. Regarding marine shipbuilding, its embodied CO2 emissions in exports decreased by 8.9%. The carbon-emission intensity effect (−30.1%) and production technology effect (−23.8%) both played important roles in driving the downturn of CO2 emissions. Marine shipbuilding was a high-pollution industry that had been the focus of various pollution control policies, which likely contributed to the decreases in carbon-emission intensity. The export scale effect increased the CO2 emissions by 40.3%; the export structure effect played relatively modest role (4.7%). Regarding offshore oil and gas, its export-embodied CO2 emissions decreased by 76.2%. The export structure effect was the major driver of this downturn in the CO2 emissions (−75.7%). The production technology effect decreased CO2 emissions by 31.8%. The export scale effect whereas carbon-emission intensity effect offset CO2 emissions by 29.1% and 2.3%, respectively.
In the tertiary ocean-industry sector, the top three ocean subsectors with the largest changes in export-embodied CO2 emissions were coastal tourism (−10.9 Mt), marine communications and transport (−6.2 Mt), and marine scientific research, education, management and service (−0.4 Mt). Their embodied CO2 emissions in exports decreased by 73.8%, 42.7%, and 9.5%, respectively. Regarding coastal tourism, changes in the export structure effect, production technology, and carbon-emission intensity contributed to declines in CO2 emissions of 42.0%, 33.0%, and 28.2%, respectively. The export scale effect offset the downturn in CO2 emissions by 29.5%. Regarding marine communications and transport, the production technology effect (−38.9%) and export structure effect (−31.7%) both played important roles in driving the downturn of CO2 emissions. The carbon-emission intensity effect played a relatively modest role (−6.8%). Regarding marine scientific research, education, management and service, carbon-emission intensity effect become the major driver for the downturn of CO2 emissions (−71.0%). The production technology effect lowered CO2 emissions by 18.9%. The export scale effect (40.2%) and export structure effect (40.1%) both played important roles in driving CO2 emissions.
3.2.3 Drivers to processing and non-processing emission changes
We decomposed the driving factors to changes of embodied CO2 emissions in China’s processing exports and non-processing exports into four components: △μ, △L, △S, and △E. Figure 8 shows their contributions.
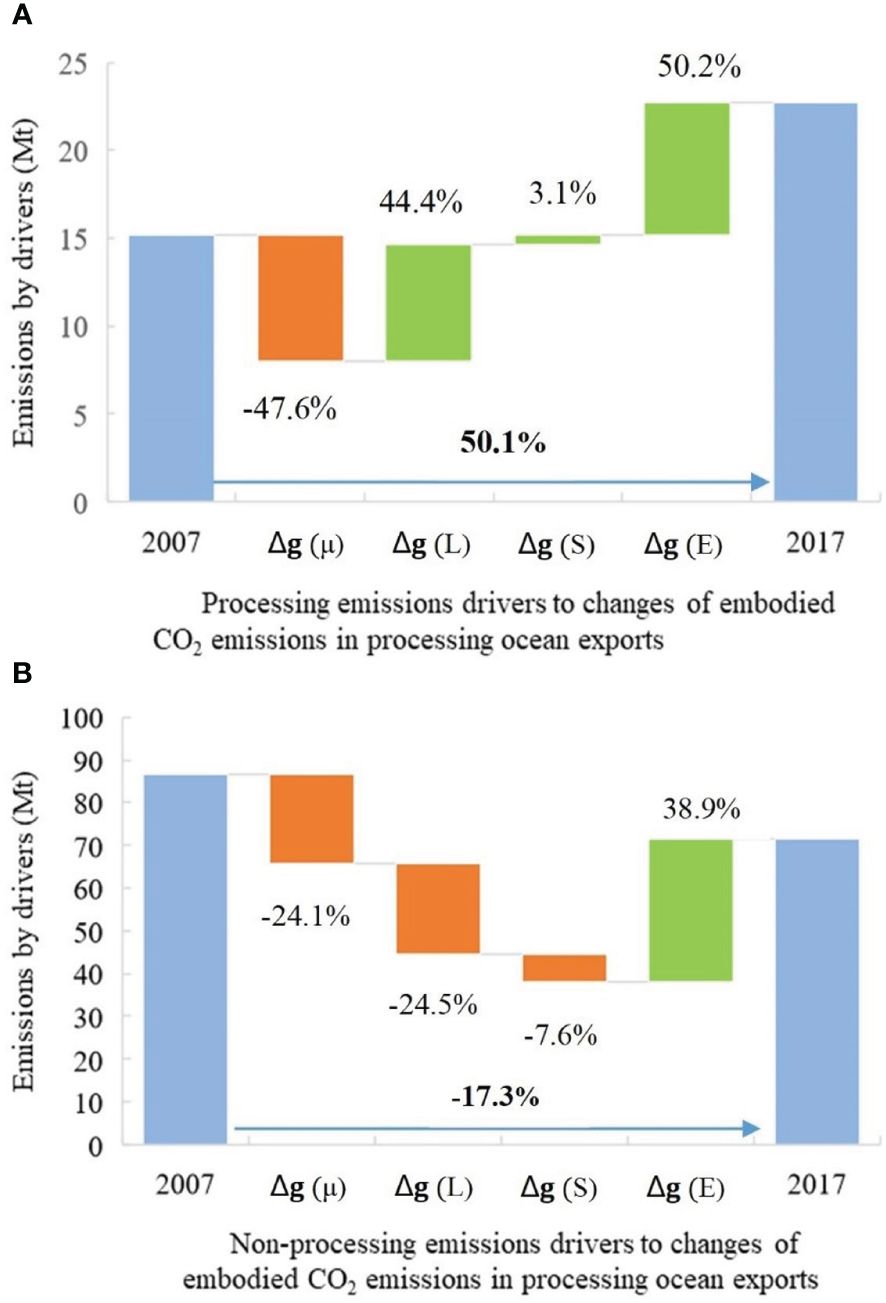
Figure 8 Contributions of four driving factors to changes of embodied CO2 emissions in processing ocean exports (A) and non-processing exports (B), 2007–2017. Δg (µ) represents the carbon-emission intensity effect, Δg (L) represents the production technology effect, Δg (S) represents the export structure effect, and Δg (E) represents the export scale effect.
We found that trade pattern heterogeneity affected the drivers of changes in export-embodied CO2 emissions from ocean industries during the entire period of 2007–2017. Regarding processing ocean exports, their embodied CO2 emissions increased by 50.1%. The export scale effect (50.2%) and production technology effect (44.4%) both played important roles in driving CO2 emissions. The decrease in carbon-emission intensity offset CO2 emissions by −47.6%. The export structure effect played a relatively modest role (3.1%). Regarding non-processing ocean exports, embodied CO2 emissions decreased by 17.3%. Changes in production technology, carbon emission intensity, and export structure contributed to the declines in CO2 emissions of 24.5%, 24.1%, and 7.6%, respectively. Meanwhile, export scale effect offset the decrease of CO2 emissions by 38.9%.
4 Conclusions and recommendations
4.1 Conclusions
Clarifying the evolution and drivers of CO2 emissions in ocean industries from an export perspective is crucial for the formulating fair, and effective carbon emission-reduction policies. As a such, by using our newly developed high-resolution, comparable time-series database called EE-DPN-OEIOTs, in this study, we proposed a consumer-based accounting framework to explore the evolution and drivers of the export-embodied CO2 emissions across different sectors in China’s ocean industries under different export patterns. The main findings were summarized below.
First, ocean exports were associated with environmental costs, though signs of improvement were observed in the later stages of our study period. The results showed that ocean exports accounted for 8.4% of total exports, but their embodied CO2 emissions accounted 5.4% of China’s total export-embodied CO2 emissions. A significant portion of these CO2 emissions originated from indirect ocean exports, comprising over 90% of the total CO2 emissions attributed to ocean exports. Generally, embodied CO2 emissions in the ocean-export supply chain exhibited an initial increase followed by a subsequent decrease from 2007 to 2017. Notably, we observed a consistent decline in the ratio of export-embodied CO2 emissions to export value during this period, suggesting a potential reduction in adverse environmental impact of embodied CO2 emissions in ocean exports.
Second, sectoral and trade pattern heterogeneity significantly influenced the embodied CO2 emissions associated with ocean exports. Specifically, the secondary ocean industries, especially marine shipbuilding and secondary ocean-related industry, emerged as the primary contributors to CO2 emissions. Conversely, the tertiary ocean industry exports showed a decreasing trend in emissions over time. Furthermore, trade patterns heterogeneity exhibited distinct impacts on CO2 emissions, with processing ocean exports proving to be relatively cleaner, yielding less value and lower CO2 emissions than non-processing ocean exports. The changes in CO2 emissions related to ocean exports also showed disparities in accordance with trade pattern.
Third, a reduction in carbon-emission intensity was the primary driving factor behind the decline in export-embodied CO2 emissions across the total ocean economy and within seven of its subsectors (60%), whereas export scale effects were the main drivers of increased emissions from 2007 to 2017. In general, from 2007 to 2017, the major contributing factor to the decrease of total export-embodied CO2 emissions was the decline in the carbon-emission intensity effect (−27.5%), the increase in the volume of exports offset the decrease of CO2 emissions by 40.6%. We also observed that drivers of export-embodied CO2 emissions varied across ocean subsectors. However, the export scale effect was the major contributing factor to the increases in export-embodied CO2 emissions for nine (75%) ocean subsectors, whereas the carbon-emission intensity effect was the major driver curbing increases in CO2 emissions for seven (60%) ocean subsectors.
Fourth, heterogeneity in export pattern significantly affected the driving factors of changes in export-embodied CO2 emissions from ocean industries. Generally, from 2007 to 2017, the export scale effect and production technology effect played important roles in influencing CO2 emissions from processing ocean exports. Conversely, production technology and carbon-emission intensity emerged as the primary drivers in mitigating emission growth from non-processing ocean exports.
4.2 Policy recommendations
Countries around the world had promoted the green, low-carbon and sustainable development of the ocean industry by using a variety of policy tools. For example, in 2011, Singapore launched the Maritime Green Initiative (MSGI) to promote the decarbonization of the shipping industry; European Union took the lead in advancing the MRV mechanism, announcing that it would include the maritime industry in the carbon emissions trading system from 2022 onwards, and that it would levy allowances on all ships entering and exiting the EU’s ports; In 2021, the U.S. proposed commitments and measures to achieve the decarbonization target for the shipping industry, and cooperated with Norway, Denmark and other countries to develop zero-carbon emission clean fuels. The Chinese government had also formulated policies to actively promote the green, low-carbon development of trade and ocean economy. Documents such as “Guiding Opinions of the Central Committee of the Communist Party of China and the State Council on Promoting the High-quality Development of Trade”, “The High-quality Development Plan for Foreign Trade in the 14th Five-Year Plan”, and “Marine Economic Development Plan in the 14th Five-Year Plan” were successively issued. Based on these existing related policies, combined with our findings in the above main text, we proposed three sustainable ocean policy recommendations from the trade perspective. These measures can facilitate the fair allocation of responsibility for reducing carbon emissions, thus promoting the environmentally friendly, low-carbon transition and sustainable advancement of China’s ocean economy, aligning with the objectives of SDG 14.
First, oceanic administrative bodies should adopt targeted strategies addressing to the sectoral characteristics of export-embodied CO2 emissions from ocean industries. The government should collaborate with customs institutions to refine and optimize the export structure of ocean industries, thereby reducing CO2 emissions. The adoption of classification guidelines for ocean exports can expedite the transition toward a low-carbon paradigm. Targeted incentives, such as tax benefits, may be implemented to promote ocean exports characterized by low energy consumption and high value-added attributes. To curtail CO2 emissions, policymakers can implement policies limiting carbon emissions and enforce them with ocean manufacturers.
Second, policymakers should pay attention to the CO2 emissions of the whole industrial chain of ocean exports, especially their indirect carbon emissions. The government should financially support ocean-related enterprises incorporate more sustainable supply chain management practices into their ocean export operations. Since those enterprises have the potential to substitute less carbon-incentive suppliers for upstream providers of ocean products, special attention should be directed toward upstream suppliers of ocean sectors that generate a high proportion of indirect carbon emissions. Furthermore, administrative bodies should guide ocean-related enterprises in applying low-carbon principles throughout the entire production process, encompassing product design, material procurement, manufacturing, transportation and logistics, recycling and disposal, and other business activities.
Third, oceanic regulatory authorities should persist in reducing the carbon intensity of ocean exports under different trade patterns to achieve their low-carbon development. Related departments should increase the share of clean energy in the export production processes of ocean industries. Given that the carbon-emission intensity effect significantly contributes to CO2 emissions in processing ocean exports and non-processing ocean exports, these authorities should steer ocean-related enterprises toward enhancing their energy utilization technologies and exploring clean energy alternatives. While enhancing the carbon sinks of blue carbon ecosystems, such as mangroves, salt marshes and seagrass beds (Bay et al., 2023), these regulatory bodies should also proactively promote the integration of blue carbon sink projects with the ocean subsectors of mariculture, ocean energy, and coastal tourism.
Data availability statement
The raw data supporting the conclusions of this article will be made available by the authors, without undue reservation.
Author contributions
LZ: Writing – original draft, Data curation, Formal Analysis, Methodology, Validation. ZKZ: Methodology, Writing – review & editing. YY: Methodology, Supervision, Writing – review & editing. XD: Methodology, Supervision, Writing – review & editing. ML: Validation, Writing – original draft. ZZ: Methodology, Validation, Writing – review & editing. HD: Methodology, Supervision, Writing – review & editing.
Funding
The author(s) declare financial support was received for the research, authorship, and/or publication of this article. This study is supported by the National Natural Science Foundation of China (Nos. 71834004, 72225013, 72004159 and 71904141), the General Program of National Natural Science Foundation of China (No. 71974141) and the General Program of National Fund of Philosophy and Social Science of China (No. 18BJY178).
Acknowledgments
The authors are very grateful to Prof. Xikang Chen and the research team for providing the detailed version of China’s national DPN-IOTs. We thank LetPub (www.letpub.com) for linguistic assistance and pre-submission expert review.
Conflict of interest
The authors declare that the research was conducted in the absence of any commercial or financial relationships that could be construed as a potential conflict of interest.
The reviewer QZ declared a shared affiliation with the authors LZ, YY, XD, ML, ZZ, HD to the handling editor at the time of review.
Publisher’s note
All claims expressed in this article are solely those of the authors and do not necessarily represent those of their affiliated organizations, or those of the publisher, the editors and the reviewers. Any product that may be evaluated in this article, or claim that may be made by its manufacturer, is not guaranteed or endorsed by the publisher.
Supplementary material
The Supplementary Material for this article can be found online at: https://www.frontiersin.org/articles/10.3389/fmars.2024.1429841/full#supplementary-material
References
Bagoulla C., Guillotreau P. (2020). Maritime transport in the French economy and its impact on air pollution: An input-output analysis. Mar. Pol. 116, 103818. doi: 10.1016/j.marpol.2020.103818
Bay L. K., Gilmour J., Muir B., Hardisty P. E. (2023). Management approaches to conserve Australia’s marine ecosystem under climate change. Science 381, 631–636. doi: 10.1126/science.adi3023
Byrne C., Agnarsson S., Davidsdottir B. (2021). Fuel Intensity in Icelandic fisheries and opportunities to reduce emissions. Mar. Pol. 127, 104448. doi: 10.1016/j.marpol.2021.104448
Chen X., Cheng L. K., Fung K. C., Lau L. J., Sung Y. W., Zhu K., et al. (2012). Domestic value added and employment generated by Chinese exports: A quantitative estimation. China Econ. Rev. 23, 850–864. doi: 10.1016/j.chieco.2012.04.003
Chen Q., Löschel A., Pei J., Peters G. P., Xue J., Zhao Z. (2019). Processing trade, foreign outsourcing and carbon emissions in China. Struct. Change Econ. D. 49, 1–12. doi: 10.1016/j.strueco.2019.03.004
Choudhary P., G V. S., Khade M., Savant S., Musale A., G R. K. K., et al. (2021). Empowering blue economy: From underrated ecosystem to sustainable industry. J. Environ. Manage. 291, 112697. doi: 10.1016/j.jenvman.2021.112697
Dietzenbacher E., Pei J., Yang C. (2012). Trade, production fragmentation, and China’s carbon dioxide emissions. J. Environ. Econ. Manage. 64, 88–101. doi: 10.1016/j.jeem.2011.12.003
Fitzgerald W. B., Howitt O. J. A., Smith I. J. (2011). Greenhouse gas emissions from the international maritime transport of New Zealand’s imports and exports. Energ. Policy 39, 1521–1531. doi: 10.1016/j.enpol.2010.12.026
Ghosh S., Rao M. V. H., Kumar M. S., Mahesh V. U., Muktha M., Zacharia P. U. (2014). Carbon footprint of marine fisheries: life cycle analysis from Visakhapatnam. Curr. Sci. India 107 (3), 515–521. Available at: http://www.jstor.org/stable/24103506
Hossain M. A., Islam M. N., Fatima S., Kibria M. G., Ullah E., Hossain M. E. (2024). Pathway toward sustainable blue economy: Consideration of greenhouse gas emissions, trade, and economic growth in 25 nations bordering the Indian ocean. J. Clean. Prod. 437, 140708. doi: 10.1016/j.jclepro.2024.140708
IMO (2021). Fourth IMO GHG Study 2020-Full report and annexes (London, UK: International Maritime Organization).
Jiang X., Chen Q., Guan D., Zhu K., Yang C. (2016). Revisiting the global net carbon dioxide emission transfers by international trade: the impact of trade heterogeneity of China. J. Ind. Ecol. 20, 506–514. doi: 10.1111/jiec.12404
Jiang X., Duan Y., Green C. (2017). Regional disparity in energy intensity of China and the role of industrial and export structure. Resour. Conserv. Recycl. 120, 209–218. doi: 10.1016/j.resconrec.2016.12.013
Lee K. H., Noh J., Khim J. S. (2020). The Blue Economy and the United Nations’ sustainable development goals: Challenges and opportunities. Environ. Int. 137, 105528. doi: 10.1016/j.envint.2020.105528
Li Y. L., Chen B., Chen G. Q. (2020). Carbon network embodied in international trade: Global structural evolution and its policy implications. Energ. Policy 139, 111316. doi: 10.1016/j.enpol.2020.111316
Li M., Feng K., Zheng H., Pan C., Meng J., Li J., et al. (2021). Supply chain effects of China’s fast growing marine economy on greenhouse gas emissions. Environ. Res. Lett. 16, 054061. doi: 10.1088/1748-9326/abf192
Li R., Liu Y., Wang Q. (2022a). Emissions in maritime transport: A decomposition analysis from the perspective of production-based and consumption-based emissions. Mar. Pol. 143, 105125. doi: 10.1016/j.marpol.2022.105125
Li Z., Zhang L., Wang W., Ma W. (2022b). Assessment of carbon emission and carbon sink capacity of China’s marine fishery under carbon neutrality target. J. Mar. Sci. Eng. 10, 1179. doi: 10.3390/jmse10091179
Long R., Li J., Chen H., Zhang L., Li Q. (2018). Embodied carbon dioxide flow in international trade: A comparative analysis based on China and Japan. J. Environ. Manage. 209, 371–381. doi: 10.1016/j.jenvman.2017.12.067
Miller R. E., Blair P. D. (2022). Input -Output Analysis: Foundations and Extensions. 3rd ed. (England: Cambridge University Press).
Nunes R. A. O., Alvim-Ferraz M. C. M., Martins F. G., Sousa S. I. V. (2019). Environmental and social valuation of shipping emissions on four ports of Portugal. J. Environ. Manage. 235, 62–69. doi: 10.1016/j.jenvman.2019.01.039
Raadal H. L., Vold B. I., Myhr A., Nygaard T. A. (2014). GHG emissions and energy performance of offshore wind power. Renew. Energ. 66, 314–324. doi: 10.1016/j.renene.2013.11.075
Shan Y., Huang Q., Guan D., Hubacek K. (2020). China CO2 emission accounts 2016-2017. Sci. Data 7, 54. doi: 10.1038/s41597-020-0393-y
Su B., Ang B. W. (2012). Structural decomposition analysis applied to energy and emissions: Some methodological developments. Energ. Econ. 34, 177–188. doi: 10.1016/j.eneco.2011.10.009
Su B., Ang B. W., Low M. (2013). Input–output analysis of CO2 emissions embodied in trade and the driving forces: Processing and normal exports. Ecol. Econ. 88, 119–125. doi: 10.1016/j.ecolecon.2013.01.017
Tian K., Dietzenbacher E., Yan B., Duan Y. (2020). Upgrading or downgrading: China’s regional carbon emission intensity evolution and its determinants. Energ. Econ. 91, 104891. doi: 10.1016/j.eneco.2020.104891
Wang Q., Ge Y., Li R. (2023). Evolution and driving factors of ocean carbon emission efficiency: A novel perspective on regional differences. Mar. pollut. Bull. 194, 115219. doi: 10.1016/j.marpolbul.2023.115219
Wang Q., Wang S. (2022). Carbon emission and economic output of China’s marine fishery – A decoupling efforts analysis. Mar. Pol. 135, 104831. doi: 10.1016/j.marpol.2021.104831
Wang Y., Xiong S., Ma X. (2022). Carbon inequality in global trade: Evidence from the mismatch between embodied carbon emissions and value added. Ecol. Econ. 195, 107398. doi: 10.1016/j.ecolecon.2022.107398
Wenhai L., Cusack C., Baker M., Tao W., Mingbao C., Paige K., et al. (2019). Successful blue economy examples with an emphasis on international perspectives. Front. Mar. Sci. 6. doi: 10.3389/fmars.2019.00261
Wu J., Li B. (2022). Spatio-temporal evolutionary characteristics of carbon emissions and carbon sinks of marine industry in China and their time-dependent models. Mar. Pol. 135, 104879. doi: 10.1016/j.marpol.2021.104879
Xia Y., Fan Y., Yang C. (2015). Assessing the impact of foreign content in China’s exports on the carbon outsourcing hypothesis. Appl. Energy 150, 296–307. doi: 10.1016/j.apenergy.2015.04.028
Xu L., Yang Z., Chen J., Zou Z., Wang Y. (2024). Spatial-temporal evolution characteristics and spillover effects of carbon emissions from shipping trade in EU coastal countries. Ocean Coast. Manage. 250, 107029. doi: 10.1016/j.ocecoaman.2024.107029
Xu S. C., Zhang L., Liu Y. T., Zhang W. W., He Z. X., Long R. Y., et al. (2017). Determination of the factors that influence increments in CO2 emissions in Jiangsu, China using the SDA method. J. Clean. Prod. 142, 3061–3074. doi: 10.1016/j.jclepro.2016.10.161
Yagi M., Kagawa S., Managi S., Fujii H., Guan D. (2020). Supply constraint from earthquakes in Japan in input-output analysis. Risk Anal. 40, 1811–1830. doi: 10.1111/risa.13525
Yamano N., Guilhoto J. (2020). CO2 emissions embodied in international trade and domestic final demand: methodology and results using the OECD Inter-Country Input-Output Database (Paris: OECD Publishing). OECD, Science, Technology and Innovation Working Papers.
Yang H., Ma X., Xing Y. (2017). Trends in CO2 emissions from China-oriented international marine transportation activities and policy implications. Energies 10, 980. doi: 10.3390/en10070980
Zheng L., Tian K. (2021). The contribution of ocean trade to national economic growth: A non-competitive input-output analysis in China. Mar. Pol. 130, 104559. doi: 10.1016/j.marpol.2021.104559
Zheng L., Zou H., Duan X., Lin Z., Du H. (2023). Potential determinants affecting the growth of China’s ocean economy: An input-output structural decomposition analysis. Mar. Pol. 150, 105520. doi: 10.1016/j.marpol.2023.105520
Keywords: ocean industry, export-embodied CO2 emissions, processing exports, environmentally extended input-output, driving factor, sustainable ocean policies
Citation: Zheng L, Zhang Z, Yao Y, Duan X, Li M, Zeng Z and Du H (2024) Assessment of export-embodied CO2 emissions from China’s ocean industries: implications for formulating sustainable ocean policies. Front. Mar. Sci. 11:1429841. doi: 10.3389/fmars.2024.1429841
Received: 08 May 2024; Accepted: 16 July 2024;
Published: 08 August 2024.
Edited by:
Casper Boongaling Agaton, University of the Philippines Los Baños, PhilippinesReviewed by:
Ruobin Gao, Nanyang Technological University, SingaporeQingji Zhou, Tianjin University, China
Angelie Collera, University of Science and Technology of Southern Philippines, Philippines
Copyright © 2024 Zheng, Zhang, Yao, Duan, Li, Zeng and Du. This is an open-access article distributed under the terms of the Creative Commons Attribution License (CC BY). The use, distribution or reproduction in other forums is permitted, provided the original author(s) and the copyright owner(s) are credited and that the original publication in this journal is cited, in accordance with accepted academic practice. No use, distribution or reproduction is permitted which does not comply with these terms.
*Correspondence: Ye Yao, eWV5YW9AdGp1LmVkdS5jbg==; Xiaofeng Duan, ZHVhbl8xOTk3QDE2My5jb20=