
95% of researchers rate our articles as excellent or good
Learn more about the work of our research integrity team to safeguard the quality of each article we publish.
Find out more
BRIEF RESEARCH REPORT article
Front. Mar. Sci. , 23 July 2024
Sec. Marine Fisheries, Aquaculture and Living Resources
Volume 11 - 2024 | https://doi.org/10.3389/fmars.2024.1429634
 Giorgia Riuzzi1*†
 Federica Sbettega2†
 Saraya Tavornpanich3
 Paulette Posen4
 Barbara Contiero1
 Matteo Mazzucato2
 Severino Segato1*
 Nicola Ferrè2
Since the 1980s, Geographical Information Systems (GIS) have been integrated into animal farming technologies for purposes such as enhancing production performances and veterinary epidemiology. In aquaculture, however, there seems to be limited application of GIS, and its potential is widely overlooked, especially for aquatic animal health management. This study describes the results of a world expert opinion elicitation on the current implementation of GIS for surveillance and disease response in the aquatic animal health domain. An online survey was submitted in autumn 2023, including both closed and open questions. With a response rate of 41.2% (21 out of 51), the answer analysis highlighted that, especially when knowledge and practical skills in geomatics, information technology and remote sensing are required, a group of advanced GIS technologies is underutilized (web-based solutions, SDI, citizen science). An artificial intelligence-based inductive text analysis was performed confirming a limited exploitation of GIS mainly due to management (financial support, training, collaboration) and methodology (data suitability, modelling analyses and integration) constraints. Furthermore, despite acknowledging the importance of planning in GIS project development, most experts did not follow any written or unwritten procedures that, according to their answers, should in fact encompass sustainable principles (integration of GIS solutions into other applications or processes), and reuse of resources (guidelines and best practices, data, methods, layouts). Shared guidelines for developing GIS projects, identifying available data sources, and long-term-maintenance planning of GIS and related geospatial data, should be pursued for using GIS technologies more effectively in the aquatic animal health domain.
Geographical Information Systems (GIS) are computer systems used for capturing, storing, checking, and displaying georeferenced data on the Earth’s surface. The field of GIS evolved rapidly in the late 1980s, providing useful tools to any discipline handling and exploiting georeferenced data, as well as in surveillance and monitoring of animal diseases (Norstrøm, 2001). As it has become more sophisticated, permitting more efficient processes and analyses, it has been deployed on a progressively larger scale in many different contexts and by many stakeholders (Maguire et al., 2008; Aguilar-Manjarrez et al., 2017), including in the animal health domain, for purposes such as epidemiological investigations (e.g., recording and reporting disease information, epidemiological data analyses and modelling) and disease monitoring and surveillance (e.g., planning disease control strategies, early warning) (Mengistu and Haile, 2017; Jijón et al., 2022). Similarly, spatiotemporal data analysis, visualization, and mapping have become essential tools in the domains of epidemiology and public health also for tackling future pandemics (Alam et al., 2022).
Despite their proven reliability in integrating surveillance systems for early detection and reduction of exposure of farmed aquatic species to various diseases (Tavornpanich et al., 2012; Muniesa et al., 2018; Bang Jensen et al., 2021; Romero et al., 2022a), the development of GIS-based epidemiological models to prevent or promptly respond to disease outbreaks is still a challenging task (Dorotea et al., 2023). The current application of GIS technologies and solutions in decision support systems for controlling infectious diseases, both in environmentally restricted aquaculture sites and in the wide and interconnected ecological domain of farmed and wild aquatic populations, appears to be limited, and is seldom considered for risk model design and implementation. Apart from a few advanced applications designed to support information systems in highly intensive aquaculture systems, and for highly valued food product areas (Karras et al., 2023; Roh and Kannimuthu, 2023), GIS capabilities are widely overlooked, especially in terms of novel technologies, such as remote sensing marine data services, web-based spatial data infrastructures, and webGIS platforms (McDaid Kapetsky and Aguilar-Manjarrez, 2007; Dorotea et al., 2023). In aquaculture, GIS application appears to be dominated by the production of choropleth maps to show fisheries distribution for spatiotemporal monitoring of disease outbreaks and spread, while the associated infrastructure, technology and training resources are rarely intended for modelling disease spread and tracking interactions between fisheries and biota or other environmental parameters (Falconer et al., 2018; Romero et al., 2022b). Furthermore, only few examples of geographical services provided to merge and harmonize heterogeneous data sources seem to exist, improving the quality and reliability of the available georeferenced information and having control of the entire data integration systems (Cipolloni et al., 2023). Furthermore, when implemented in the aquatic domain for animal health management, the design of GIS applications is hardly in line with the evolution of the aquaculture industry, and often takes place within small groups of researchers in single-purpose projects with specific project-related outputs, such as maps or exploratory spatial data analyses (Tomlinson, 2005; Urban and Regional Information Systems Association, 2013; Falconer et al., 2020). Additionally, while there is a plethora of bibliography on the use of GIS for productive and economic interests of national and private aquaculture enterprises, such as site selection, control of production key factors (Morro et al., 2022), or environmental protection measures (Kershaw et al., 2019; Katselis et al., 2022; Bergh et al., 2023; Chentouf et al., 2023) or within wider environmental planning systems (Gimpel et al., 2015), research investigations involving GIS for aquatic animal health management are rare. When compared with its more static terrestrial counterpart, despite GIS application to aquaculture management being more challenging due to the highly variable hydrodynamic environments of offshore and inland fisheries, across vast and sometimes remote areas of interest (Meaden and Aguilar-Manjarrez, 2013; Adams et al., 2016), with a delay of 35 to 40 years it is now also functional for the aquatic environment (Kimothi et al., 2023).
A gap exists between the large and rapid development of industrialized aquaculture and the early detection and rigorous control of outbreaks of several emerging diseases, resulting in economic losses and creating a bottleneck of aquaculture species diversification, especially in marine farming (Muniesa et al., 2018). Indeed, the specificity and challenges of this research area and field of application, which require substantial expertise in both geomatics and veterinary epidemiology, make it difficult to find supporting evidence for identifying obstacles to the complete and effective exploitation of GIS in aquaculture.
Therefore, the present study aims to describe the results of an elicitation that was conducted to gather international experts’ opinions and suggestions on the current use of GIS technologies to support surveillance and disease response in the aquatic animal health domain. The consultation investigated the experts’ applications and routines in the use of GIS technologies and approaches to GIS project planning. It was hoped that the responses would allow us to pinpoint current gaps in the use of GIS technologies, with a particular focus on the latest generation solutions, and in the approaches to GIS planning. The experts’ answers were used to identify key planning concepts that could be turned into the best practice for the GIS project and its application development, and to collect suggestions on the availability of GIS technologies and their solutions for application in the aquatic animal health management.
A survey was conducted by means of a questionnaire to gather international experts’ opinions on GIS technologies to support surveillance and disease response in the aquatic animal health domain. The questionnaire was developed through two pilot testing phases. A first draft of the questionnaire was assessed and improved for: (i) meaning and relevance of the content; (ii) reformulating and rewording questions; and (iii) feasibility of its application (e.g., software, time) (Green and Thorogood, 2018). The first pilot involved three international experts from the Aquae Strength research team1, who were consulted through two online meetings. The second pilot involved another two Italian GIS and veterinary experts, to whom the modified questionnaire was submitted by email, requesting further feedback and suggestions for improvement. The experts involved in both pilots had been briefed with pre-elicitation material, including background information and objectives of the survey. The final questionnaire used both closed and open questions to obtain quantitative and qualitative data. It comprised four sections addressing a total of 19 questions. Respectively, the questions included in the first three sections referred to:
● Demographics.
● Current use of GIS in the aquatic domain as a whole and, specifically, for surveillance and disease response purposes.
● Approaches for developing GIS projects and planning GIS applications in the aquatic animal health domain.
A fourth section was dedicated to collecting examples of relevant (i) GIS applications or projects, (ii) geospatial data repositories or spatial data infrastructures (SDI), and (iii) functions, libraries or scripts, which could be used as references for the application of GIS in aquatic animal health. To ensure that instructions were clear, questions were easily interpreted, and biases were minimized, the following strategies were applied:
● The questionnaire had an introductory page clearly describing the context of the survey and the specific aims of the different sections, including main differences between them and instructions for completion: numerous reminders were distributed throughout the questionnaire.
● Respondents were provided with briefing material as described above.
● Pilot experts had been specifically asked to highlight any possible sources of misinterpretation and bias.
● Participants were allowed to add suggestions or comments if they felt the questionnaire failed to solicit all the necessary questions and information.
The complete questionnaire is available as Supplementary Material (GIS survey dataset.xls) through the following DOI: 10.25430/researchdata.cab.unipd.it.00001277. The study design and the data collection and analysis were approved by the ethics committee of the Istituto Zooprofilattico Sperimentale delle Venezie (protocol n. CE_IZSVE 2/2024). After receiving written information within the questionnaire, all experts gave their consent for participation and use of the study outcomes for scientific dissemination activities.
All participants, including the pilot experts, were required to have knowledge and understanding of both aquatic animal health management and GIS technologies. A first line of experts was identified by relevance screening among the project members’ professional network, and among authors of the most relevant literature from recently published reviews on the use of GIS in aquaculture for surveillance and disease response (Dorotea et al., 2023). Furthermore, the questionnaire call was launched at some international events concerning the use of GIS for aquatic animal epidemiology, during late summer and autumn 2023. The inclusion criteria for experts’ selection were verified on existing citation databases (e.g., SCOPUS, Web of Science) and through literature and other Internet searches (e.g., ResearchGate, LinkedIn); these criteria included factors such as length (years) and type of experience, publications, academic qualifications and activities. The selection aimed to create a representative panel in terms of geographical areas and working sector (i.e., public vs. private) (Green and Thorogood, 2018). We asked first-line experts to share survey and briefing material with other suitable colleagues through snowball recruitment in accordance with the defined criteria. This method for selecting panel members was especially useful because it allowed increased sample heterogeneity, and because experts in a specific research field usually know each other well, allowing more experts to be found within our specific niche area of research (Green and Thorogood, 2018). Furthermore, experts seemed to accept participation more readily if invited by colleagues with whom they were familiar.
Questionnaires were implemented using Google Forms, available between 30th October and 22nd December 2023. The questionnaires were shared via two separate links. The first link provided access to the first three sections, which were estimated to take about 20 to 30 minutes to fill and had to be completed in one sitting. The second link allowed access to the fourth section, which could be accessed multiple times to keep adding examples. To encourage experts to participate in the survey, three general reminders were sent, together with one specific reminder for the experts coming from those geographical areas currently lacking participants. Once the questionnaires were closed, the responding experts were emailed to advise them that they could be contacted for further clarification of their answers.
Demographics, dichotomous (i.e., yes/no) answers across sections 2 and 3, and examples provided in section 4 were analyzed through descriptive statistics, such as frequencies and percentages. The open questions on the current use of GIS in aquatic animal health and the reasons for the related constraints in section 2 were analyzed following a conventional content analysis approach using ATLAS.ti Web (Trial Desktop & Web; ATLAS.ti Scientific Software Development GmbH; https://atlasti.com). The analysis proceeded according to the following steps: (i) open coding through artificial intelligence (AI) by inductive strategy (i.e., coding without predefined codes); (ii) editing of AI coding (e.g., misinterpretation, duplicates); (iii) sorting open codes into code groups; and (iv) organizing code groups into meaningful themes and sub-themes (Hsieh and Shannon, 2005; Boeije and Bleijenbergh, 2019). The graphic output of the analysis was generated on SankeyMATIC.com. In section 3, two 5-point Likert scales were used to gather information on the experts’ frequency of use of specific GIS items and on their level of agreement on statements related to the development of GIS projects. Median and interquartile range (IQR) were calculated for the frequency of use of the GIS items, and percentages were used to describe the experts’ opinions on their potential use in the aquatic animal health domain. Meanwhile, the level of agreement among experts on the development of GIS projects was analyzed by calculating frequencies and percentages of their answers. From section 1, demographics (i.e., declared education subject, current role and field of specialization) was used to divide the experts into two categories on the basis of their prevalent area of expertise: aquatic animal health (AAH; i.e., epidemiology, veterinary, biology, aquaculture manager) vs. GIS technologies (GT; i.e., mapping, geospatial data analysis, geomatics). A non-parametric Mann-Whitney test (p < 0.05) was conducted to determine whether the expert category (AAH vs. GT) significantly affected the 5-point Likert scale answers on both frequency of use of GIS items (question Q_15 of section 3; DOI: 10.25430/researchdata.cab.unipd.it.00001277).
The main steps followed during this expert opinion elicitation are illustrated in Figure 1. A total of 51 questionnaires were sent to 34 and 17 experts enrolled as first line and snowball, respectively. From the first line, 4 experts declined the invitation. The reasons for declining were: (i) not considering themselves as an expert on both the requested domains (n = 2); (ii) being on long leave (n = 1); (iii) being in a remote place without a stable internet connection (n = 1). A total of 21 experts answered to the first part of the questionnaire (i.e., sections 1 to 3), 10 from the first line and 11 from the snowball group, representing a response rate of 41.2% (21 out of 51). Among these participants, there were 16 males and 5 females, responding from 8 (the UK, n = 6; Italy, n = 4; Norway, n = 3; France, n = 3; Greece, n = 2; Portugal, n = 1; Chile, n = 1; India, n = 1) of the 18 involved countries spread worldwide (the UK, n = 11; Italy, n = 8; Norway, n = 5; the USA, n = 5; France, n = 4; Australia, n = 3; Canada, n = 2; Chile, n = 2; Greece, n = 2; China, n = 1; Denmark, n = 1; Ethiopia, n = 1; India, n = 1; Indonesia, n = 1; Portugal, n = 1; Saudi Arabia, n = 1; Spain, n = 1; Thailand, n = 1). According to their prevalent area of expertise, the AAH and GT categories were assigned 14 and 7 participants, respectively. Section 4 received 15 responses from 12 participants, 8 belonging to the first line and 4 to the snowball group, for a total response rate of 23.5% (12 out of 51); 9 of them were males and 3 were females, responding from 6 countries (Italy, n = 4; the UK, n = 2; France, n = 2; Greece, n = 2; Norway, n = 1; Portugal, n = 1). All details on the participants’ answers and examples provided are available through the following DOI: 10.25430/researchdata.cab.unipd.it.00001277.
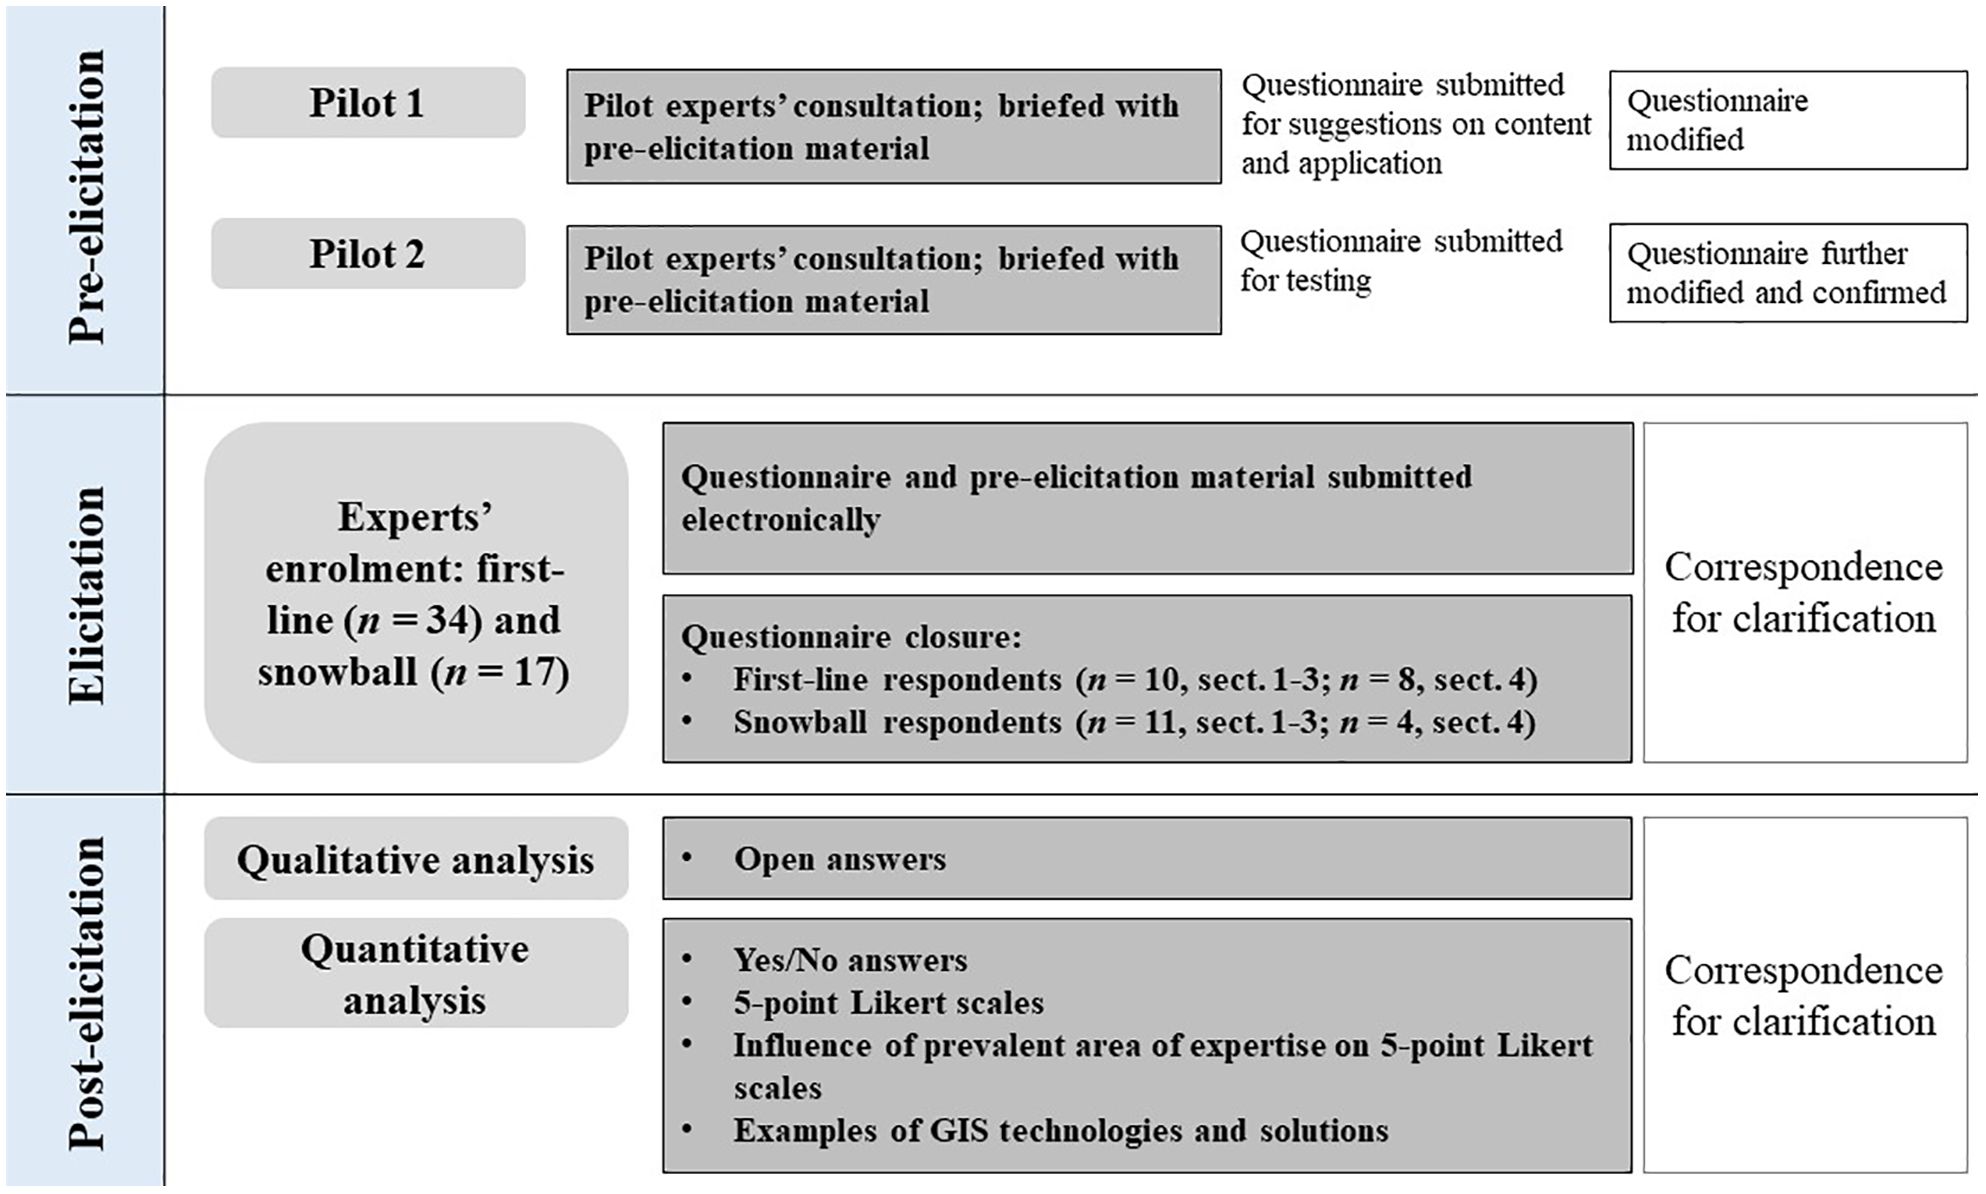
Figure 1 Flow diagram of the experts’ recruitment and data collection. The complete questionnaire is available through the following DOI: 10.25430/researchdata.cab.unipd.it.00001277.
The content analysis of the open answers on the current use of GIS produced fifty codes organized into five subthemes, as shown in Figure 2. 90% of participants thought GIS was not exploited to its full potential both in the aquatic domain as a whole and for disease surveillance and disease response, specifically. The analysis of the open answers on the constraints to the use of GIS produced thirty-five codes organized into two node columns of subthemes of six and two elements, respectively, as shown in Figure 3. The results of the analysis of the experts’ frequency of use of GIS technologies, effect of the expert category (AAH vs. GT) on their frequency of use, and experts’ opinions on the potential usefulness of GIS technologies in the aquatic animal health domain are reported in Table 1. The expert category had a significant (p < 0.05) effect on the use of enterprise databases, remote sensing raw data and related services, integration with SDI data, web GIS solutions and dashboards integrated with them. For the development of GIS projects associated with the aquatic animal health domain in which they had been involved, 38% of the participants had not relied on any GIS managers or analysts, 29% had not relied on any computer and information systems administrators, 67% had not followed any written or unwritten procedures for the GIS development life cycle. Furthermore, the experts’ level of agreement on sentences regarding the development of GIS projects was classified as displayed in Figure 4.
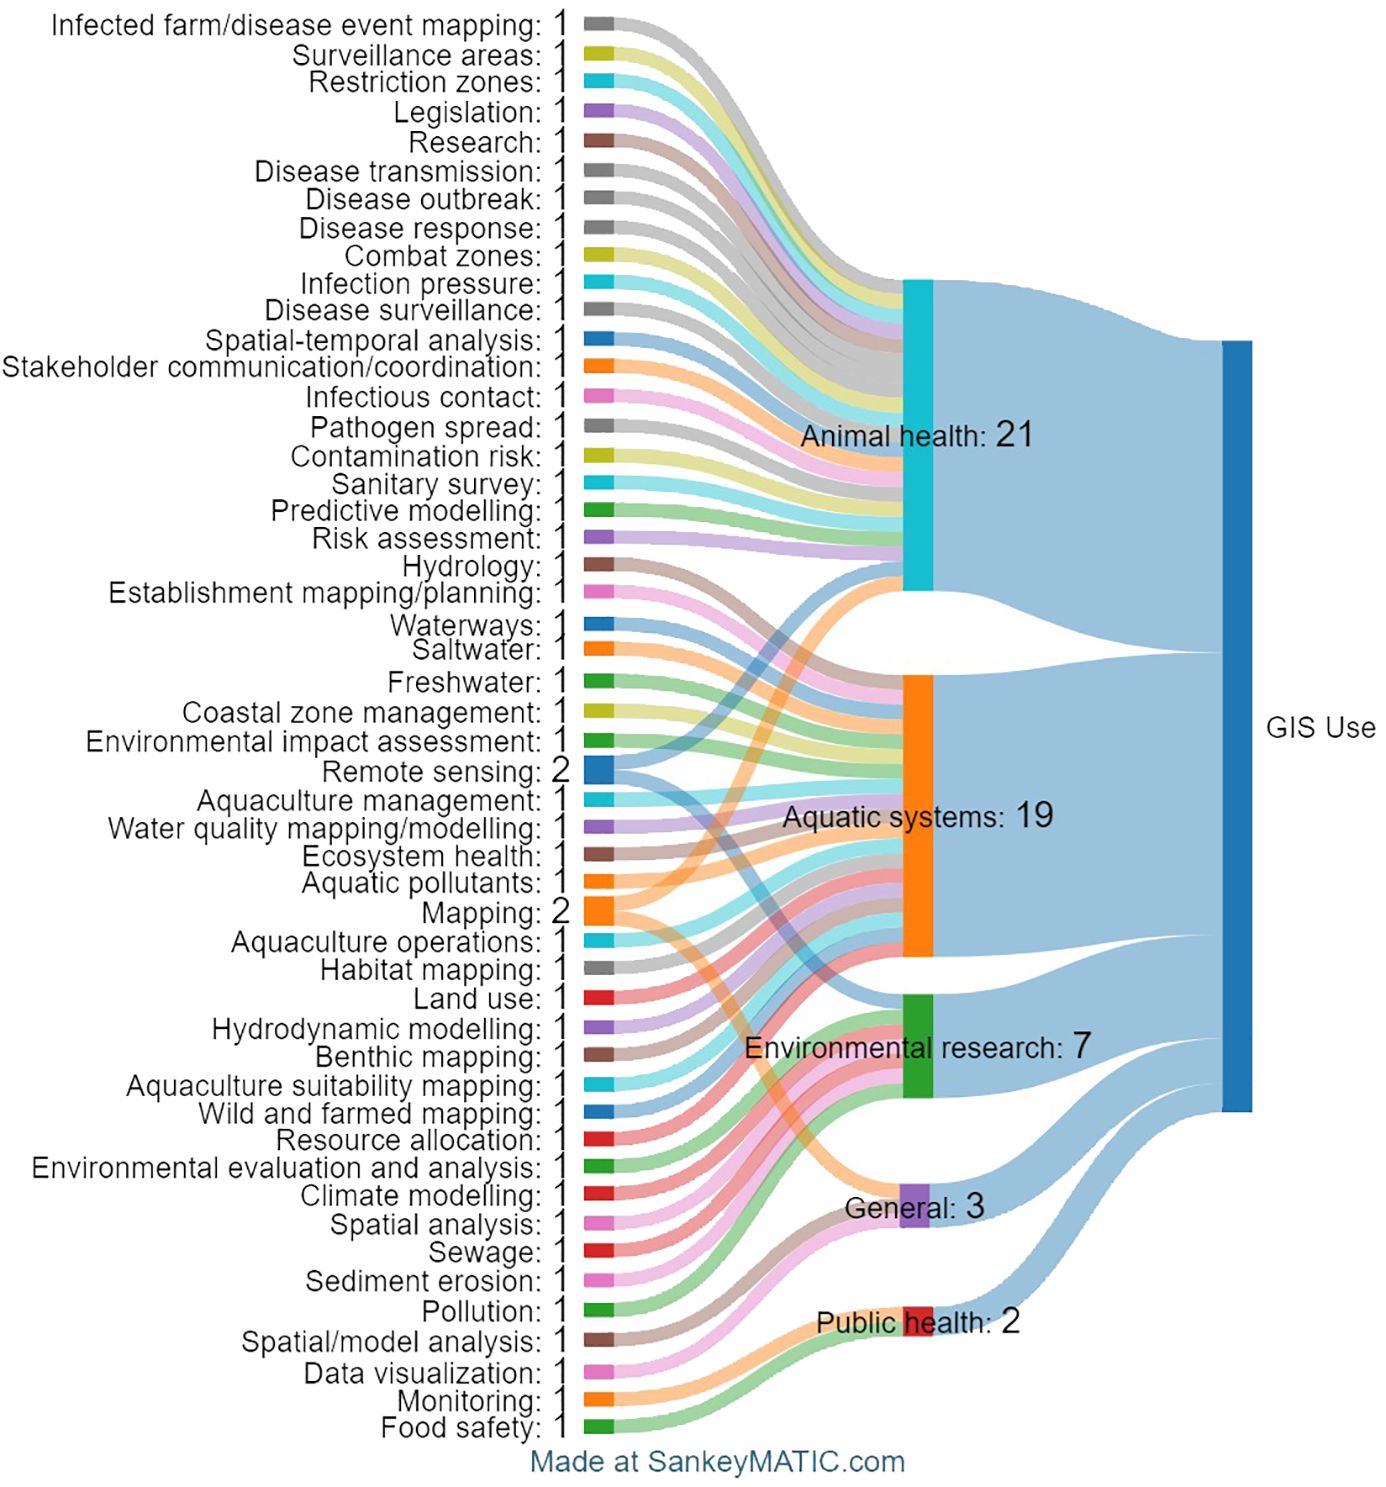
Figure 2 Sankey diagram of codes (node column on the left), subthemes (middle node column), and themes (node column on the right) extrapolated from the experts’ open answers on the current use of GIS in the aquatic domain for disease surveillance and response. The numbers on the right of code and sub-theme names are the number of times a code was assigned, and the number of codes categorized under a sub-theme, respectively. They also represent the intensity of the flow, which is reflected in the width of the links among node columns.
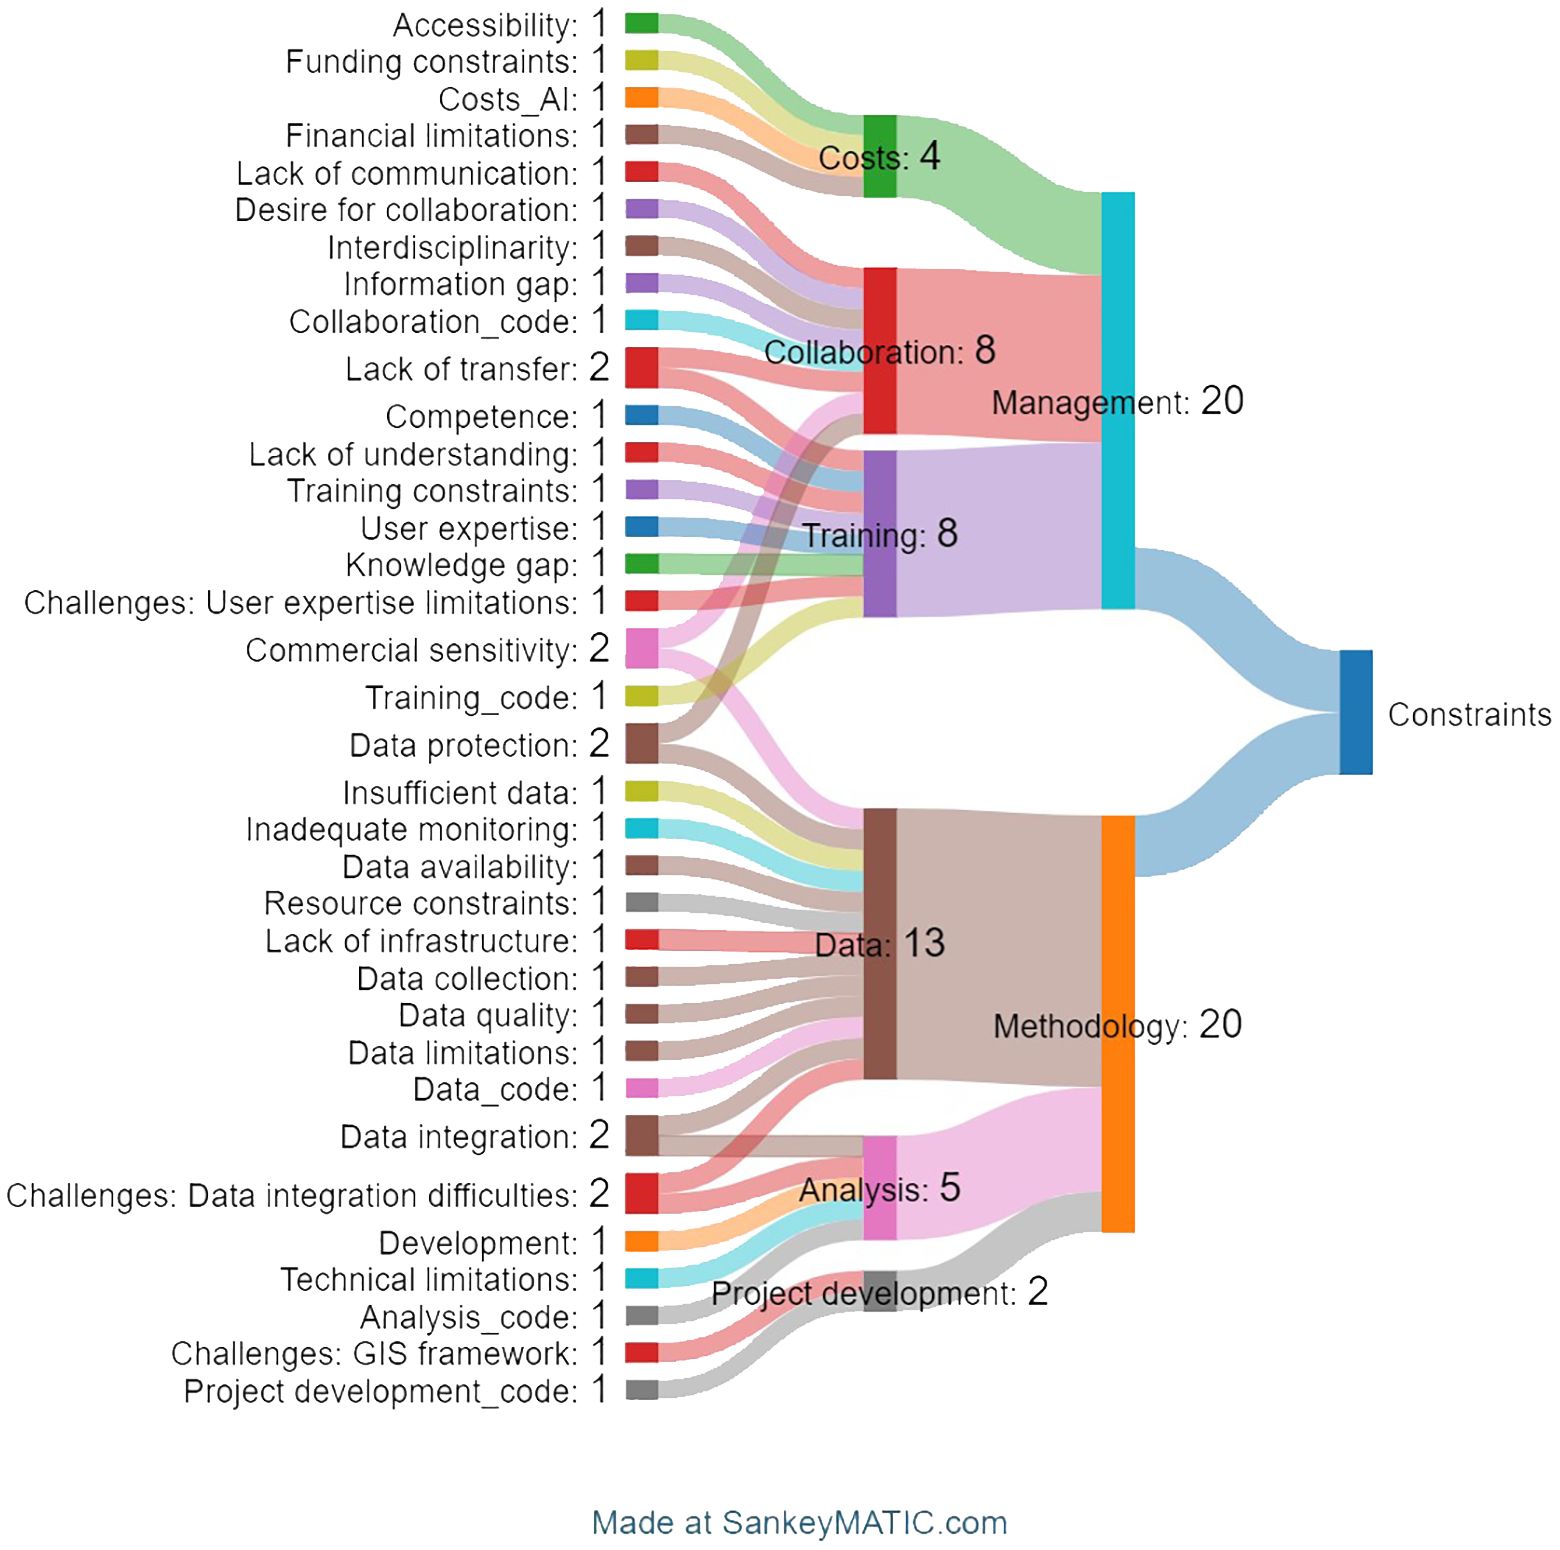
Figure 3 Sankey diagram of codes (node column on the left), subthemes (two middle node columns), and themes (node column on the right) extrapolated from the experts’ open answers on the constraints limiting the full exploitation of GIS in the aquatic domain for disease surveillance and disease response. The numbers on the right of code and sub-themes names are the number of times a code was assigned, and the number of codes or sub-theme categorized under the following sub-theme, respectively. They also represent the intensity of the flow, which is reflected in the width of the links among node columns. The underscores applied to some of the code names (e.g., _AI, _code) were used to differentiate them from the sub-themes to make the diagram.
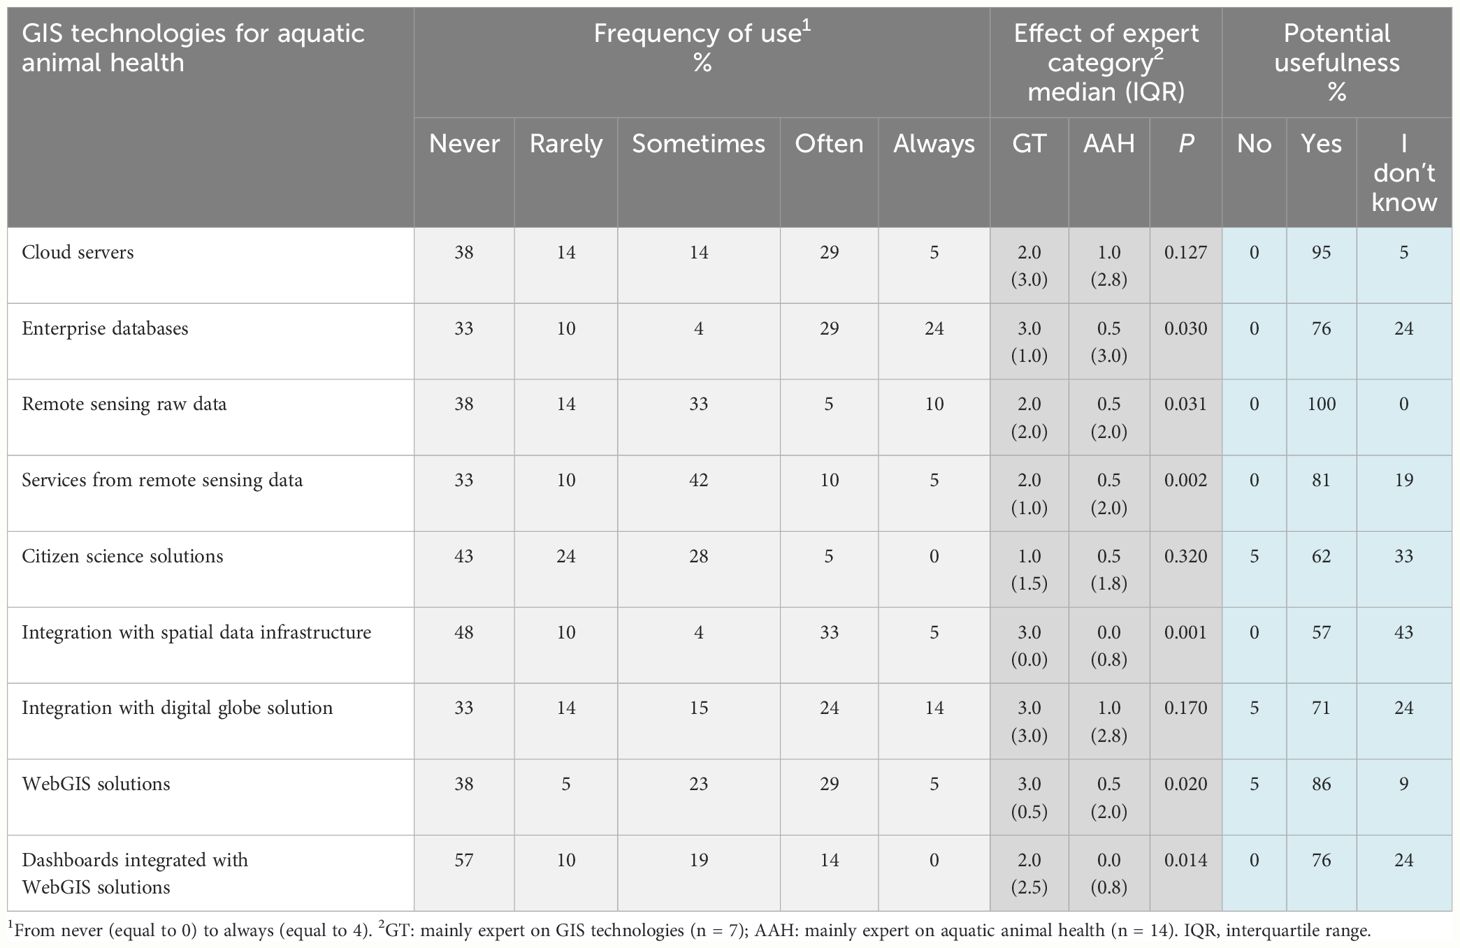
Table 1 Experts’ frequency of use of GIS technologies (lighter grey columns); effect of the expert category on the frequency of use (darker grey columns); and experts’ opinions on the potential usefulness of GIS technologies (light blue columns).
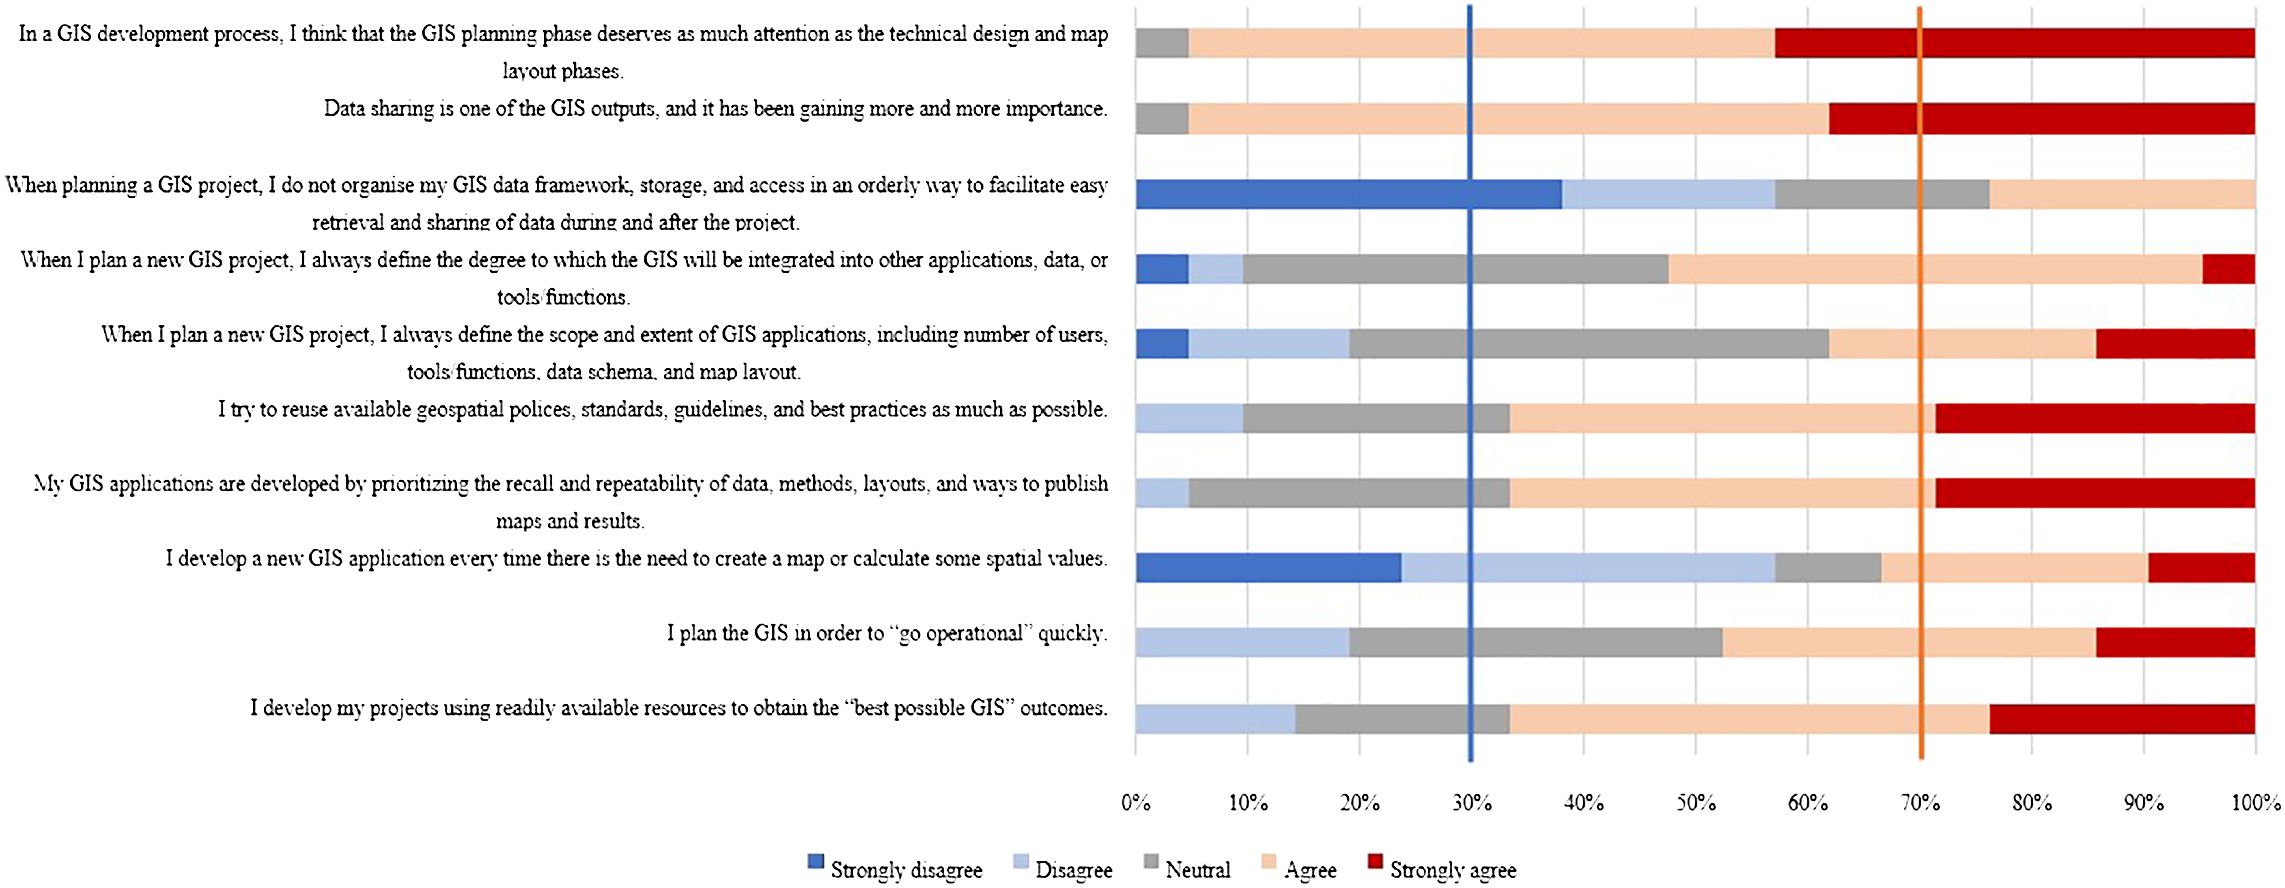
Figure 4 Classification of the experts’ level of agreement on sentences regarding the development of GIS projects. The blue and orange vertical lines indicate the 30% and 70% of response frequency.
The participants responding to section 4 provided a total of 12 different examples of GIS technologies and solutions, three of which were provided twice, respectively. However, one of the examples provided was not pertinent to the objectives of the question; therefore, it was not considered and was identified as not applicable (N.A.; DOI: 10.25430/researchdata.cab.unipd.it.00001277). The remaining (n = 11) relevant examples were categorized as applications or projects (n = 7), repositories or SDI (n = 3), and functions, libraries or scripts (n = 1).
The outcomes of the present expert opinion elicitation shed light on the current actual implementation of GIS technologies and solutions for disease surveillance and disease response in aquaculture, and gathered suggestions on their use and project development approaches.
As demonstrated by the experts’ answers, GIS serves as an extremely versatile technological platform to promote real-time (or near real-time) database collection and interpretation, enabling various farming measures for animal productive performance and health management, as well as protection of aquatic systems, with no specific GIS application prevailing over the others (Table 1; Figure 2). As reported in recent investigations (Gimpel et al., 2018; Falconer et al., 2020), the results of our explorative survey confirmed that most experts feel that GIS technologies and solutions are not fully exploited, either in the whole aquatic/aquaculture domain, or for disease surveillance and response across the range of aquatic pathogen species. An inductive text analysis based on open AI coding generation (Figure 3) suggests that this limited exploitation of GIS would be due to (a) management, and (b) methodological, constraints: the first encompasses a lack of financial support, suitable training, and collaboration; the second includes a lack of suitable data, valuable analyses (modelling, integration, validation), and project development approaches. Improvements in all of these constraints would lead to a more effective and widely shared body of knowledge on GIS technologies. Indeed, as already stated in previous literature (Khashoggi and Murad, 2020), analytical statistics processes for GIS-based healthcare planning require high quality and accuracy of data to facilitate scientific collaboration for building scenarios and outputs of the analysis.
Among the GIS technologies listed in Table 1 (referring to Q_15 in the DOI: 10.25430/researchdata.cab.unipd.it.00001277), considering enterprise databases, and WebGIS and digital globe solutions, responses ‘often’ or ‘always’ for frequency of use indicated that these technologies were the most used by the experts, likely for geospatial data management and information visualization purposes, respectively. Considering those technologies seldom used (responses ‘never’ or ‘rarely’ for frequency of use) the less popular were cloud servers, remote sensing raw data, dashboard integrated with WebGIS solutions, and citizen science solutions. Interestingly, many recent findings demonstrate that the complexity of these partially unknown technologies, concerns on data protection, and lack of familiarity and specific professional knowledge and technological skills discourage the use of such participatory web-, remote sensing-, and earth observation-based GIS tools in aquaculture (Falconer et al., 2020; Georgopoulos et al., 2023). This is despite literature highlighting the increased output quality and value of citizen participation in these tools (Palmer et al., 2015; Aschbacher, 2017; Brewin et al., 2017; Støttrup et al., 2018), or the valuable and prompt source of data provided by the Internet of Things-enabled devices (Bates et al., 2021), which should encourage their application in both inland and marine aquatic environments. In fact, in our study, when aquatic animal health (AAH) was the prevalent area of expertise, respondents were significantly less attracted to those GIS technologies, likely because of the higher proficiency required in geomatics and information technologies. Interestingly, the analysis on use of SDI showed polarized frequencies, also suffering the biggest impact from the expert categorization (GT, 3.0 vs. AAH, 0.0; p < 0.01). Integration with SDI as a source of background geospatial data was more likely to be employed by GT experts, while it was almost unknown to AAH experts, among whom this was the least used technology. Indeed, outside the circle of geomatics experts, there is a limited awareness of the available GIS-based tools for aquaculture planning and management (Kane et al., 2017), especially when based on regional or national SDI. As shown in Table 1, these results are mirrored by the fact that experts are unaware of the potential usefulness of some GIS technologies, especially SDI (43% of “I don’t know”) and citizen science solutions (33% of “I don’t know”). Furthermore, in the section dedicated to collecting experts’ suggestions of GIS technologies and solutions to be applied for disease surveillance and response (section 4), research projects and experimental applications were most frequently advised. Meanwhile, only three SDIs or repositories were reported (Copernicus Marine Service, DIVA-GIS, Marine Regions), which appeared to be extensive and effective GIS tools to enhance disease surveillance and response in aquatic animal health (DOI: 10.25430/researchdata.cab.unipd.it.00001277). On the project management side, most of the experts claimed that GIS managers or analysts, and computer or information systems administrators, had been involved in the development of their GIS projects. However, the scarce adoption of both written and unwritten frameworks of best practices suggests room for improvement in professional GIS implementation processes. Through the 5-point Likert scale asking about their GIS project development approach (Figure 4), experts acknowledged the importance of the planning phase and the sharing of project outputs. On the basis of their answers, we could identify the following principles to be turned into good practice for GIS planning: (i) integration of GIS solutions into other applications or processes, (ii) reuse of available resources, with particular emphasis on policies, standards, guidelines and best practice, and geospatial data, methods, layouts, and ways to make maps and results openly available. This is in line with the claims of other authors, and is a planning approach based on a forward-thinking vision encompassing the reuse of resources, and the accessibility and longevity of GIS tools and data (Longley et al., 2015; Goodspeed et al., 2016; Pfenninger et al., 2017). Also, the analysis of research and technical literature confirms that GIS data and technologies are still exploited and adapted by scientists to quickly address specific needs, with attitudes that were defined as one-time efforts or ad hoc approaches (Tomlinson, 2005; Urban and Regional Information Systems Association, 2013; Falconer et al., 2020). Once again, lower professional knowledge and skill standards lead to GIS implementations that do not maximize environmental readiness (i.e., infrastructures, base data, and resources to support project development and implementation) and exploitation (i.e., organization of GIS infrastructure to boost operations, decision making and customer service) (Jayanthi et al., 2022).
Overall, two potential limitations to our survey outcomes seemed to be the level of experts’ engagement and their geographical working origins. However, the recorded response rate of 41.2% for sections one to three appeared in line with other similar web-based expert surveys (Chandra et al., 2019; Hogg et al., 2023; van der Veer et al., 2024) and, likely, mirrored both the niche topic of the questionnaire and the very specific double-faceted knowledge (AAH and GT) requested of the experts. The lower response rate to section 4 (23.5%) is likely due to the fact that it could be accessed multiple times to allow experts to keep adding examples over time, should new technologies and solutions come to mind. In fact, this also led to many experts forgetting or neglecting to complete the second part of the questionnaire. Even if the localized working areas of the respondents, representing mainly Western Europe, might be a potential bias, the aquaculture practiced in this geographical area is representative of the wider global scenario in terms of reared species and productive farming systems and environments. Moreover, this potential bias was probably mitigated by the diverse background of the experts in terms of professional roles and sectors, and by the recruitment methodology adopted. In fact, most of the final participants were recruited through the snowball method, which is known to reduce researcher bias in recruitment (Butler et al., 2015). Finally, the comprehensive and clear briefing material and instructions provided offered guidance that helped minimize the bias coming from uncertainty and misinterpretation (Kynn, 2008).
In summary, the outcomes of the survey suggest that, especially when both knowledge and practical skills in geomatics, information technology and remote sensing are required, there is a group of GIS technologies that appear to be largely underutilized in the aquatic animal health domain. Provided that final GIS users are made aware of their existence and potential benefits, and trained in their use, there is room for expansion in the application of advanced GIS technologies and solutions for aquatic animal health management, such as participatory web-, remote sensing-, and earth observation-based tools in aquaculture. The expert panel highlighted the importance of establishing GIS as a foundation for project planning and good practice, and its implementation as a highly desirable objective to support surveillance and disease response in aquaculture and the aquatic animal health domain. This could be achieved through a forward-thinking planning approach based on reuse and integration principles that would optimize the exploitation of available resources in the planning, implementation and operational phases.
The main recommendation lies in further investigations to produce a shared set of guidelines describing procedures and methods for developing GIS projects, identifying available data sources, and planning long-term maintenance of the GIS system and the related geospatial data, which would be highly beneficial for the scientific community and for a more effective use of GIS technologies in the aquatic animal health domain. Furthermore, the exploration of critical issues challenging large-scale fisheries and aquatic farms should be embedded in future research investigating and exploiting the use of GIS for surveillance and disease response, as well as enhancing the productive performance and economic interests of these enterprises.
The dataset presented in this study can be found at the online repository of the University of Padova and it is accessible through the following DOI: 10.25430/researchdata.cab.unipd.it.00001277.
The study design and the data collection and analysis were approved by the ethics committee of the Istituto Zooprofilattico Sperimentale delle Venezie (protocol n. CE_IZSVE 2/2024). Written informed consent was obtained from the individual(s) for the publication of any potentially identifiable images or data included in this article.
GR: Conceptualization, Data curation, Formal analysis, Investigation, Methodology, Writing – original draft, Writing – review & editing. FS: Conceptualization, Data curation, Investigation, Methodology, Writing – original draft, Writing – review & editing. ST: Investigation, Methodology, Writing – original draft, Writing – review & editing. PP: Investigation, Methodology, Writing – original draft, Writing – review & editing. BC: Formal analysis, Methodology, Writing – review & editing. MM: Data curation, Methodology, Software, Writing – review & editing. SS: Conceptualization, Formal analysis, Investigation, Methodology, Resources, Supervision, Writing – original draft, Writing – review & editing. NF: Conceptualization, Funding acquisition, Investigation, Methodology, Resources, Supervision, Writing – original draft, Writing – review & editing.
The author(s) declare financial support was received for the research, authorship, and/or publication of this article. This study was made possible thanks to the funding support provided by the Italian Ministry of Health and the World Organisation for Animal Health (WOAH) for the international cooperation project entitled “Strengthening capacity on aquatic animal health and epidemiological surveillance” led by the Istituto Zooprofilattico Sperimentale delle Venezie. Open Access funding provided by Università degli Studi di Padova | University of Padua, Open Science Committee.
The authors declare that the research was conducted in the absence of any commercial or financial relationships that could be construed as a potential conflict of interest.
All claims expressed in this article are solely those of the authors and do not necessarily represent those of their affiliated organizations, or those of the publisher, the editors and the reviewers. Any product that may be evaluated in this article, or claim that may be made by its manufacturer, is not guaranteed or endorsed by the publisher.
The Supplementary Material for this article can be found online at: 10.25430/researchdata.cab.unipd.it.00001277.
Adams T. P., Aleynik D., Black K. D. (2016). Temporal variability in sea lice population connectivity and implications for regional management protocols. Aquacult. Environ. Interact. 8, 585–596. doi: 10.3354/aei00203
Aguilar-Manjarrez J., Soto D., Brummett R. (2017). Aquaculture zoning, site selection and area management under the ecosystem approach to aquaculture: A handbook (Rome: FAO and the World Bank).
Alam M. M., Torgo L., Bifet A. (2022). A survey on spatio-temporal data analytics systems. ACM Comput. Surv. 54. doi: 10.1145/3507904
Aschbacher J. (2017). “ESA’s Earth Observation Strategy and Copernicus,” in Satellite Earth Observations and Their Impact on Society and Policy. Eds. Onoda M., Young O. R. (Springer Nature, Singapore), 81–86.
Bang Jensen B., Dean K. R., Huseby R. B., Aldrin M., Qviller L. (2021). Realtime case study simulations of transmission of Pancreas Disease (PD) in Norwegian salmonid farming for disease control purposes. Epidemics 37. doi: 10.1016/j.epidem.2021.100502
Bates H., Pierce M., Benter A. (2021). Real-Time environmental monitoring for aquaculture using a loRaWAN-Based ioT sensor network. Sensors (Basel) 21, 7963. doi: 10.3390/s21237963
Bergh Ø., Beck A. C., Tassetti A. N., Olsen E., Thangstad T. H., Gonzalez-Mirelis G., et al. (2023). Analysis of spatial conflicts of large scale salmonid aquaculture with coastal fisheries and other interests in a Norwegian fjord environment, using the novel GIS-tool SEAGRID and stakeholder surveys. Aquaculture 574. doi: 10.1016/j.aquaculture.2023.739643
Boeije H. R., Bleijenbergh I. (2019). Analyseren in kwalitatief onderzoek: denken en doen (Amsterdam: BOOM).
Brewin R. J. W., Hyder K., Andersson A. J., Billson O., Bresnahan P. J., Brewin T. G., et al. (2017). Expanding aquatic observations through recreation. Front. Mar. Sci. 4. doi: 10.3389/fmars.2017.00351
Butler A. J., Thomas M. K., Pintar K. D. M. (2015). Systematic review of expert elicitation methods as a tool for source attribution of enteric illness. Foodborne Pathog. Dis. 12, 367–382. doi: 10.1089/fpd.2014.1844
Chandra P. S., Saraf G., Bajaj A., Satyanarayana V. A. (2019). The current status of gender-sensitive mental health services for women—findings from a global survey of experts. Arch. Womens Ment. Health 22, 759–770. doi: 10.1007/s00737-019-01001-2
Chentouf S., Sebbah B., Bahousse E. H., Wahbi M., Maâtouk M. (2023). GIS-based multi-criteria evaluation (MCE) methods for aquaculture site selection: A systematic review and meta-analysis. ISPRS Int. J. Geoinf. 12. doi: 10.3390/ijgi12100439
Cipolloni C., De Corso S., Giulianelli E., Minelli A. (2023). SINACLOUD knowledge platform to provide geographical services for the environment. Rendiconti Online Societa Geol. Italiana. 61, 58–62. doi: 10.3301/ROL.2023.47
Dorotea T., Riuzzi G., Franzago E., Posen P., Tavornpanich S., Di Lorenzo A., et al. (2023). A scoping review on GIS technologies applied to farmed fish health management. Animals 13. doi: 10.3390/ani13223525
Falconer L., Middelboe A. L., Kaas H., Ross L. G., Telfer T. C. (2020). Use of geographic information systems for aquaculture and recommendations for development of spatial tools. Rev. Aquac. 12, 664–677. doi: 10.1111/raq.12345
Falconer L., Telfer T., Pham K. L., Ross L. (2018). “GIS Technologies for Sustainable Aquaculture,” in Comprehensive Geographic Information Systems. Ed. Huang B. (Elsevier Inc, Oxford), 290–314. doi: 10.1016/B978-0-12-409548-9.10459-2
Georgopoulos V. P., Gkikas D. C., Theodorou J. A. (2023). Factors influencing the adoption of artificial intelligence technologies in agriculture, livestock farming and aquaculture: A systematic literature review using PRISMA 2020. Sustain. (Switzerland) 15. doi: 10.3390/su152316385
Gimpel A., Stelzenmüller V., Grote B., Buck B. H., Floeterc J., Núñez-Ribonia I., et al. (2015). A GIS modelling framework to evaluate marine spatial planning scenarios: Co-location of offshore wind farms and aquaculture in the German EEZ. Mar. Policy 55, 102–115. doi: 10.1016/j.marpol.2015.01.012
Gimpel A., Stelzenmüller V., Töpsch S., Galparsoro I., Gubbins M., Miller D., et al. (2018). A GIS-based tool for an integrated assessment of spatial planning trade-offs with aquaculture. Sci. Total Environ. 627, 1644–1655. doi: 10.1016/j.scitotenv.2018.01.133
Goodspeed R., Riseng C., Wehrly K., Yin W., Mason L., Schoenfeldt B. (2016). Applying design thinking methods to ecosystem management tools: Creating the Great Lakes Aquatic Habitat Explorer. Mar. Policy 69, 134–145. doi: 10.1016/j.marpol.2016.04.017
Green J., Thorogood N. (2018). Qualitative Methods for Health Research (Thousand Oaks: SAGE Publications Inc).
Hogg B., Moreno-Alcázar A., Tóth M. D., Serbanescu I., Aust B., Leduc C., et al. (2023). Supporting employees with mental illness and reducing mental illness-related stigma in the workplace: an expert survey. Eur. Arch. Psychiatry Clin. Neurosci. 273, 739–753. doi: 10.1007/s00406-022-01443-3
Hsieh H. F., Shannon S. E. (2005). Three approaches to qualitative content analysis. Qual. Health Res. 15, 1277–1288. doi: 10.1177/1049732305276687
Jayanthi M., Kumaran M., Vijayakumar S., Duraisamy M., Anand P. R., Samynathan M., et al. (2022). Integration of land and water resources, environmental characteristics, and aquaculture policy regulations into site selection using GIS based spatial decision support system. Mar. Policy 136. doi: 10.1016/j.marpol.2021.104946
Jijón A. F., Costa R., Nicova K., Furnari G. (2022). Review of the use of GIS in public health and food safety. EFSA Support. Public. 19. doi: 10.2903/sp.efsa.2022.EN-7639
Kane F., Jackson D., Casserly J. (2017). A critical review of the existing aquaculture licensing and regulatory frameworks in the EU. Paper presented at Aquaculture Europe 2017 (Dubrovnik, Croatia), 17–20.
Karras A., Karras C., Sioutas S., Makris C., Katselis G., Hatzilygeroudis I., et al. (2023). An integrated GIS-based reinforcement learning approach for efficient prediction of disease transmission in aquaculture. Inf. (Switzerland) 14. doi: 10.3390/info14110583
Katselis G., Tsolakos K., Theodorou J. A. (2022). Mapping of Greek marine finfish farms and their potential impact on the marine environment. J. Mar. Sci. Eng. 10, 286. doi: 10.3390/jmse10020286
Kershaw S., Beraud C., Heal R., Posen P., Tew I., Jeffery K. (2019). Mapping of Areas of Potential Aquaculture within the Dorset and East Devon Fisheries Local Action Group (FLAG) area (Cefas Contract C7731, European Maritime and Fisheries Fund (EMFF), 187. grant number ENG3016.
Khashoggi B. F., Murad A. (2020). Issues of healthcare planning and GIS: A review. ISPRS Int. J. Geoinf. 9. doi: 10.3390/ijgi9060352
Kimothi S., Thapliyal A., Singh R., Rashid M., Gehlot A., Akram S. V., et al. (2023). Comprehensive database creation for potential fish zones using ioT and ML with assimilation of geospatial techniques. Sustain. (Switzerland) 15. doi: 10.3390/su15021062
Kynn M. (2008). The ‘heuristics and biases’ bias in expert elicitation. J. R. Stat. Soc A. Sta. 171, 239–264. doi: 10.1111/j.1467-985X.2007.00499.x
Longley P. A., Goodchild M. F., Maguire D. J., Rhind D. W. (2015). Geographic Information Science and Systems (New Jersey: John Wiley & Sons Inc).
Maguire D. J., Smith R., Kouyoumjian V. (2008). The business benefits of GIS: an ROI approach (Redlands: ESRI Press).
McDaid Kapetsky J., Aguilar-Manjarrez J. (2007). Geographic information systems, remote sensing and mapping for the development and management of marine aquaculture. FAO Fisheries Technical Paper No 458 (Rome: Food and Agriculture Organization of the United Nations). doi: 10.13140/RG.2.1.4046.9842
Meaden G. J., Aguilar-Manjarrez J. (2013). Advances in geographic information systems and remote sensing for fisheries and aquaculture. FAO Fisheries and Aquaculture Technical Paper No 552 (Rome: Food and Agriculture Organization of the United Nations). doi: 10.13140/RG.2.1.4037.7682
Mengistu T. S., Haile A. W. (2017). Review on the application of geographical information systems (GIS) in veterinary medicine. Int. J. Vet. Health Sci. Res. 5, 176–182. doi: 10.19070/2332–2748-1700036
Morro B., Davidson K., Adams T. P., Falconer L., Holloway M., Dale A., et al. (2022). Offshore aquaculture of finfish: Big expectations at sea. Rev. Aquac. 14, 791–815. doi: 10.1111/raq.12625
Muniesa A., Ruiz-Zarzuela I., de Blas I. (2018). Design and implementation of a collaborative epidemiological surveillance system for aquaculture (VECA). Rev. Aquac. 10, 370–375. doi: 10.1111/raq.12165
Norstrøm M. (2001). Geographical information system (GIS) as a tool in surveillance and monitoring of animal diseases. Acta Vet. Scand. Suppl. 94, 79–85. doi: 10.1186/1751-0147-42-S1-S79
Palmer S. C. J., Kutser T., Hunter P. D. (2015). Remote sensing of inland waters: Challenges, progress and future directions. Remote Sens. Environ. 157, 1–8. doi: 10.1016/j.rse.2014.09.021
Pfenninger S., DeCarolis J., Hirth L., Quoilin S., Staffell I. (2017). The importance of open data and software: Is energy research lagging behind? Energy Policy 101, 211–215. doi: 10.1016/j.enpol.2016.11.046
Roh H. J., Kannimuthu D. (2023). Assessments of epidemic spread in aquaculture: comparing different scenarios of infectious bacteria incursion through spatiotemporal hybrid modeling. Front. Vet. Sci. 10. doi: 10.3389/fvets.2023.1205506
Romero J. F., Gardner I., Price D., Halasa T., Thakur K. (2022b). DTU-DADS-Aqua: A simulation framework for modelling waterborne spread of highly infectious pathogens in marine aquaculture. Transbound Emerg. Dis. 69, 2029–2044. doi: 10.1111/tbed.14195
Romero J. F., Gardner I. A., Saksida S., McKenzie P., Garver K., Price D., et al. (2022a). Simulated waterborne transmission of infectious hematopoietic necrosis virus among farmed salmon populations in British Columbia, Canada following a hypothetical virus incursion. Aquaculture 548. doi: 10.1016/j.aquaculture.2021.737658
Støttrup J. G., Kokkalis A., Brown E. J., Olsen J., Kærulf Andersen S., Pedersen E. M. (2018). Harvesting geo-spatial data on coastal fish assemblages through coordinated citizen science. Fish. Res. 208, 86–96. doi: 10.1016/j.fishres.2018.07.015
Tavornpanich S., Paul M., Viljugrein H., Abrial D., Jimenez D., Brun E. (2012). Risk map and spatial determinants of pancreas disease in the marine phase of Norwegian Atlantic salmon farming sites. BMC Vet. Res. 8, 172. doi: 10.1186/1746-6148-8-172
Tomlinson R. (2005). Thinking About GIS: Geographic Information System Planning for Managers (Redlands: ESRI Press).
Urban and Regional Information Systems Association, GIS Management Institute (2013). GIS Capability Maturity Model. (De Plaines, Illinois: GIS Management Institute).
Keywords: expert opinion elicitation, expert survey, GIS, aquatic animal health, veterinary surveillance, disease response
Citation: Riuzzi G, Sbettega F, Tavornpanich S, Posen P, Contiero B, Mazzucato M, Segato S and Ferrè N (2024) Eliciting expert opinion on GIS use for surveillance and disease response in the aquatic animal health domain. Front. Mar. Sci. 11:1429634. doi: 10.3389/fmars.2024.1429634
Received: 08 May 2024; Accepted: 24 June 2024;
Published: 23 July 2024.
Edited by:
Mohamed Abdelsalam, Cairo University, EgyptReviewed by:
Amir Homainejad, IRGG, IranCopyright © 2024 Riuzzi, Sbettega, Tavornpanich, Posen, Contiero, Mazzucato, Segato and Ferrè. This is an open-access article distributed under the terms of the Creative Commons Attribution License (CC BY). The use, distribution or reproduction in other forums is permitted, provided the original author(s) and the copyright owner(s) are credited and that the original publication in this journal is cited, in accordance with accepted academic practice. No use, distribution or reproduction is permitted which does not comply with these terms.
*Correspondence: Giorgia Riuzzi, Z2lvcmdpYS5yaXV6emlAc3R1ZGVudGkudW5pcGQuaXQ=; Severino Segato, c2V2ZXJpbm8uc2VnYXRvQHVuaXBkLml0
†These authors have contributed equally to this work and share first authorship
Disclaimer: All claims expressed in this article are solely those of the authors and do not necessarily represent those of their affiliated organizations, or those of the publisher, the editors and the reviewers. Any product that may be evaluated in this article or claim that may be made by its manufacturer is not guaranteed or endorsed by the publisher.
Research integrity at Frontiers
Learn more about the work of our research integrity team to safeguard the quality of each article we publish.